Submitted:
14 March 2025
Posted:
18 March 2025
You are already at the latest version
Abstract
Tobacco smoking remains the leading cause of preventable death globally. This study examines the effects of cigarette smoke (1R6F) and heated tobacco product (HTP) aerosols on microglial activation, cell proliferation, and proteomic changes under hypox-ia-reoxygenation (H/R) conditions, focusing on nicotine's role in oxidative stress, in-flammation, and Nrf2 pathway activation. H/R conditions significantly activated micro-glia, consistent with prior evidence linking hypoxic stress to neuroinflammatory re-sponses. Cigarette smoke exposure reduced microglial activation, while HTP aerosol and nicotine maintained cellular function, suggesting potentially lower cytotoxicity of HTPs. This supports findings that HTPs may produce fewer toxicants than traditional cigarettes, though long-term brain health impacts remain uncertain. Proteomic analysis indicated that H/R altered microglial protein expression, with 97 proteins related to RNA metab-olism, oxidative phosphorylation, and cellular stress responses. The increased expression of RNA-binding proteins suggests an adaptive response to oxidative damage. Both cigarette smoke and HTP aerosols influence oxidative stress-related proteins differently. Confocal microscopy showed that HTP and nicotine maintained Nrf2 nuclear transloca-tion, an antioxidant response, while cigarette smoke impaired Nrf2 activation, indicating higher oxidative stress and potential cellular damage. The differential activation of the Nrf2 antioxidant pathway suggests that HTPs may be less harmful than traditional cig-arettes, though their long-term effects on cerebrovascular health warrants further as-sessment.
Keywords:
microglia activation
; cigarette smoking
; nicotine
; Heated Tobacco Product
; toxicity
; oxidative stress
; inflammation
1. Introduction
Smoking is a well-known risk factor for all types of stroke [1] and remains the leading preventable cause of death globally, profoundly impacting public health. Smokers have been shown to face a two- to four-fold higher risk of stroke compared to non-smokers [1] with a strong correlation to increased stroke severity, greater disability, and extended hospital stays [1]. Despite decades of public health campaigns promoting smoking cessation, these efforts have achieved only limited success [2].
Ischemic stroke, resulting from a blood vessel obstruction that restricts blood flow to the brain, affects over 700.000 individuals annually in the United States alone and is a major cause of mortality and long-term disability across Western countries. In Italy, it stands as the second leading cause of death and the primary cause of disability, responsible for 9-10% of all fatalities. Key contributors to secondary brain damage include neuroinflammation and oxidative stress, underscoring the socioeconomic and health burden of stroke-related disability and mortality [3]. Smoking is linked to nearly 25% of all stroke cases, with a consistent association across various populations, showing a relative risk increase of approximately 1.5. Notably, the elevated risk decreases substantially within five years of smoking cessation [4], emphasizing the benefits of quitting. Mechanistically, smoking contributes to stroke risk through multiple pathways, including carboxyhemoglobinemia, increased platelet aggregation, elevated fibrinogen levels, and reduced HDL cholesterol, among others. In addition, environmental tobacco smoke introduces compounds like 1,3-butadiene, which accelerates atherosclerosis, highlighting the impact of primary and second-hand smoke [1]. The exact mechanisms through which smoking influences stroke risk remain partially understood, particularly regarding nicotine’s role. While nicotine, especially when administered via transdermal or oral routes, appears to present fewer risks than cigarettes, it nonetheless has vasoactive effects that could impair endothelial cell function and blood-brain barrier integrity. Although certain nicotinic acetylcholine receptor antagonists may mitigate these effects, nicotine is also thought to interact with intracellular signaling pathways independent of acetylcholine receptors, indicating a complex role in cerebrovascular pathology [4].
Our previous findings, however, suggest that nicotine does not adversely affect the viability of microglia, nor does it influence inflammation or oxidative stress under the conditions studied [5]. Therefore, the current in vitro study seeks to explore and compare the effects of cigarette smoke versus heated tobacco product (HTP) aerosols on microglial function under conditions of hypoxia/reoxygenation (H/R), to provide further insights into their potential impacts on cerebrovascular health.
2. Materials and Methods
Cell Culture
The transformed human microglial cells (HMC3) (ATCC CRL-3304) were established through SV40-dependent immortalization of a human fetal brain-derived primary microglia culture. They retain the properties of primary microglial cells and represent homogeneous cell populations which can be grown indefinitely and might represent a convenient system for the biochemical analysis of microglial cells functions. The HMC3 cells were cultured with EMEM medium (SIGMA® M4655™) added with 10% FBS (ATCC® 30-2020™), Sodium pyruvate 1% (Sigma® S8636), 1% MEM Non-Essential Amino Acids (GIBCO® 11140-50), and 1% Antibiotic-Antimycotic (15240062, Invitrogen™ Thermo Fisher Scientific).
Test Products and Exposure of Cells to Smoke/Aerosol
For the exposure of microglial cells to smoke or aerosol were used a standardized tobacco reference cigarette, 1R6F (Center of Tobacco Reference Products, University of Kentucky), and an HTP commercially available, IQOS 3 DUO (referred subsequently as IQOS; Philip Morris International, Neuchâtel, Switzerland), respectively. The tobacco consumables used with IQOS were the HeatSticks (or Heets) “Sienna selection” (Red). All IQOS devices and consumables were purchased from authorized dealers in Italy.
Preparation of Smoke and Aerosol Aqueous Extracts (AqE)
For the 1R6F cigarette smoke exposure was used the Borgwaldt LM1 smoking machine (Borgwaldt KC GmbH). The LM1 is a linear one-port mechanical syringe-based smoking machine that performs a whole smoke exposure [6].
The 1R6F reference cigarettes were conditioned before use for a minimum of 48 h at 22 ± 1 °C and 60 ± 3% relative humidity in a climatic chamber (Memmert, HCP105), in accordance with ISO 3402:1999 ISO 3402:2023 - Tobacco and tobacco products — Atmosphere for conditioning and testing [7]. Then, 1R6F were smoked following the Health Canada Intense (HCI) regimen (55 mL puff volume, 2 seconds puff duration, 30 seconds puff frequency, with bell shaped profile and the hole vents blocked), accredited under ISO/TR 19478-2:2015 [8].
IQOS devices were used according to the manufacturer’s instructions. They were fully charged, cleaned, and loaded with fresh tobacco consumables before each exposure. For the IQOS aerosol exposure was used the Borgwaldt LM4E vaping machine (Borgwaldt KC GmbH). The LM4E is a linear 4-port machine with one piston pump that delivers undiluted aerosol [9]. IQOS system was vaped following a modified Health Canada Intense (mHCI) regimen (55 mL puff volume, 2 seconds puff duration, 30 seconds puff frequency, with bell shaped profile, but with filter vents unblocked to avoid device overheating). The IQOS system was manually button-activated 30 s before each puffing session to initiate device heating prior to syringe activation.
HMC3 cells were exposed to aqueous extract (AqE) generated by bubbling 1R6F smoke (6 cigarettes with 9 puffs/cigarette; total 54 puffs in 30 ml PBS) or IQOS aerosol (10 sticks with 12 puffs/stick; total 120 puffs in 40 ml PBS) in ice-cold impinger.
Quantification of Nicotine in HPLC
Nicotine identification and quantification in AqE was conducted using reversed phase chromatographic technique. The apparatus consisted in a SpectraSystem P4000 pump connected to a highly sensitive UV6000LP diode array detector (ThermoQuest Italia, Rodano, Milan, Italy), equipped with a 5-cm-light-path flow cell and set up between 190 and 300 nm wavelength. Puffs from different sources of nicotine (1.8 puffs for 1R6F or 3 puffs for IQOS, respectively) were bubbled in 1 ml PBS which was then loaded onto a 150 × 4.6 mm, 3 µm particle size Hypersil Gold RP C18 column provided with its own guard column (Thermo Fisher Scientific, Milan, Italy). A binary gradient was built up using buffers A (10% methanol + 90% 10mM KH2PO4 pH 7.4) and B (50% methanol + 50% 10mM KH2PO4 pH 7.4) mixed in the following linear steps: 0-5 minutes 100% A, 5-30 minutes 100% B. Flow rate was 1 ml/min and column temperature was kept at 30°C. The nicotine peak was eluted with a k’ = 13 (where k’ = V - V0/V0, with V = the elution volume of the compound of interest and V0 = the void volume of the system) and its quantification was performed at its maximum of absorbance (λ= 268 nm) [10].
Nicotine Solution Preparation
Nicotine (SIGMA® N3876™) was used as a reference standard for our experiments. The nicotine standard was diluted in the culture medium to a concentration of 340 nM established after calculating the IC50 of HMC3 cells [5].
Assessment of Cytotoxicity by Real-Time Cell Analysis (RTCA)
Real-time cell proliferation analysis was performed using the xCELLigence RTCA DPsystem (Agilent). The background impedance was measured in E-plate 16 with 100 μl medium (without cells) after a 30 min incubation period at room temperature. HMC3 cells were detached, counted and seeded in E-16 xCELLigence plate at a density of 5x10³ cells/well. Plates were subsequently incubated at 37 °C, 5% CO2 for 30 min to allow cell settling to the bottom of the well. After incubation, cells were treated respectively with nicotine, IQOS AqE and 1R6F AqE at the same concentration of 340 nM. Hypoxia was then induced by challenging the cell cultures with a gas mixture containing 1.0% O2, 5% CO2, and 37 ◦C for 3 h to initiate hypoxia, followed by 12 h of reoxygenation at 37 ◦C using a gas mixture containing 5% CO2 and 18.0% O2. We used gas-controlled incubators to control the O2 levels of the cell cultures. In hypoxia, the O2 levels were 1%, and the CO2 levels were 5%. Under the reoxygenation conditions, the O2 levels were 18%, and the CO2 levels were 5%. Nitrogen was added to the incubator in order until the set O2% was achieved.
Sample Preparation for Proteomic Analysis
Samples were sonicated on ice in RIPA buffer for 40 seconds using a microtip probe sonicator. The protein content was precipitated with pre-chilled acetone (-20°C) for 30 minutes. After centrifugation (10,000 G), the pellet was resuspended in 8M urea, and the protein content was quantified using the BCA assay. The protein sulfhydryl groups were reduced to 1.6 mM Dithiothreitol (DTT) and alkylated with 7 mM Iodoacetamide (IAA). The samples were diluted with 50 mM NH4HCO3 to a final urea concentration of 0.8 M; the protein content was digested with trypsin at 37 °C for 16 hours (enzyme ratio 1:50 w/w). The resulting samples were analyzed by Liquid Chromatography-Mass spectrometry (LC-MS).
Analysis of Tryptic Digests by LC-MS
Hydrolytic peptides were analyzed using a UHPLC system (ThermoFisher Scientific Dionex UltiMate 3000 RSLCnano, Sunnyvale, CA, USA) coupled with an Orbitrap Fusion Tribrid mass spectrometer (Q-OT-qIT) (ThermoFisher Scientific, Bremen, Germany). The samples obtained by in-solution tryptic digestion were diluted with a 5% aqueous FA solution. Peptides were eluted on a PepMap® RSLC C18 column (EASYSpray, 75 μm × 50 cm, 2 μm, 100 Å) and separated by elution at a flow rate of 0.250 μL/min, at 40 °C, with a linear gradient of solvent B (CH3CN + 0.1% FA) in solvent A (H2O + 0.1% FA). The eluted peptides were ionized by nanospray (Easy-spray ion source, Thermo Scientific) using a capillary temperature and voltage set to 275 °C and 1.7 kV, respectively. Peptide precursor scans in the m/z range of 400-1600 were performed with a resolution of 120,000 (200 m/z) with an AGC target for Orbitrap detection of 4.0 × 10⁵ and a maximum injection time of 50 ms. MS/MS spectra were acquired using a normalized collision energy (HCD) of 35. The dynamic exclusion duration was set to 60 s with a tolerance of 10 ppm around the selected precursor and its isotopes. The AGC target values and maximum injection time (ms) for MS/MS spectra were 1.0 × 10⁴ and 100, respectively. The mass spectrometer was calibrated using the Pierce® LTQ Velos ESI positive ion calibration solution (Thermo Fisher Scientific). MS data acquisition was performed using Xcalibur software v. 3.0.63 (Thermo Fisher Scientific). Mass spectra were analyzed using MaxQuant software (version 2.5.1.0). The initial maximum allowed mass deviation was set to 6 ppm for monoisotopic precursor ions and 0.5 Da for MS/MS peaks. The enzyme specificity was set to trypsin, defined as C-terminal to arginine and lysine, excluding proline, with a maximum of two missed cleavages allowed. Carbamidomethylcysteine was set as a fixed modification, while N-terminal acetylation and methionine oxidation were set as variable modifications. Spectra were analyzed using the Andromeda search engine against the Homo Sapiens Uniprot sequence database. Quantification in MaxQuant was performed using the integrated Label-Free Quantification (LFQ) algorithm based on extracted ion chromatograms (XIC) and employing fast LFQ. The false discovery rate was set to 1% at the peptide level and 1% at the protein level, with a minimum peptide length of seven amino acids required. Statistical analyses were performed using Perseus software (version 2.1.3). Only proteins that were present and quantified in at least two out of three technical replicates were considered positively identified in a sample and used for statistical analyses. The protein-protein interaction network was performed using the STRING (https://string-db.org).
Confocal Microscopy for the Evaluation of Nrf2
Briefly, HMC3 cells were detached and seeded in a Chamber SlideTM (Nunc) at a density of 20x103 cells/well. After 24 hours, cells were treated with nicotine or IQOS AqE or 1R6F AqE at the same concentration of 340 nM for 24 hours. Hypoxia was then induced by challenging the cell cultures with a gas mixture containing 1.0% O2, 5% CO2, and 37 ◦C for 3 h to initiate hypoxia, followed by 12 h of reoxygenation at 37 ◦C using a gas mixture containing 5% CO2 and 18.0% O2. We used gas-controlled incubators to control the O2 levels of the cell cultures. In hypoxia, the O2 levels were 1%, and the CO2 levels were 5%. Under the reoxygenation conditions, the O2 levels were 18%, and the CO2 levels were 5%. Nitrogen was added to the incubator in order until the set O2% was achieved. Immunofluorescence was performed as previously described [11,12]. Briefly, after washing twice in PBS, cells were fixed in 4% paraformaldehyde for 20 min at room temperature. After fixation, cells were washed three times in PBS for 5 min and treated with a blocking solution (5% FBS and 95% PBS) for 30 min. Subsequently, the cells were washed twice in PBS and incubated with the primary antibody directed against human anti-rabbit Nrf2 at the dilution 1:800 (NRF2 (D1Z9C) XP® Rabbit mAb) overnight at 4 °C. Then, cells were washed three times in PBS for 5 min and incubated for 1h with a conjugated secondary antibody: Anti-Rabbit IgG (whole molecule)–TRITC antibody (T6778) Sigma-Aldrich at dilution 1:500. Nuclei were stained with Hoechst Stain Solution (1:1000, Hoechst 33258, Sigma-Aldrich). The images were captured using a Leica Confocal Microscope TCSSP8 (Leica Microsystems). Ten random visual fields were examined for each condition.
Statistical Analysis
All experiments were conducted in triplicate. Cell proliferation and area under curve (AUC) were processed by Prism 9.0 software (GraphPad Software, San Diego, CA, USA). AUC was computed using the area under a Receiver Operator Characteristic (ROC) curve. Differences in cell proliferation and AUC were assessed via one-way ANOVA followed by Tukey’s post hoc multiple comparison test. Proteomic analysis was performed using Perseus software (version 2.1.3). Only proteins that were present and quantified in at least two out of three technical replicates were considered positively identified in a sample and used for statistical analyses. The protein-protein interaction network was performed using the STRING (https://string-db.org). All analyses were considered significant with a p value < 0.05.
3. Results
3.1. Hypoxia/Reoxygenation Induces Microglial Activation
In the first series of preliminary experiments, it was calculated, using real-time cell analysis (RTCA), whether subjecting HMC3 cells to H/R conditions would induce microglial activation. The results showed that the stress induced by the H/R condition caused a significant increase in normalized cell index (Figure 1A) and area under the curve (AUC) (Figure 1B) compared to normoxia cells indicating microglial activation. To characterize the proteomic profile of the cell culture under normoxic conditions (Normoxia) and that reported after H/R we used a proteomic approach based on Mass Spectrometry (MS). As many as 518 proteins were identified in normoxic cultured HMC3. Most of them (418) were also detected when the cells were kept under hypoxia followed by reoxygenation. Interestingly, 97 proteins were uniquely expressed in H/R conditions, whereas 19.3% of the total protein content were only identified in normoxic samples. (Figure 1C) The effect of H/R on the proteomic dataset is also evident by Principal Component Analysis (PCA): all the biological replicates of the normoxic and H/R conditions clearly clustered in very well separated regions. (Figure 1D) Moreover, all the unique proteins under H/R conditions plainly show a specific network cluster. (Figure 1E) The functional enrichment we have carried out on this protein group revealed the cellular pathways involved and their correlation to the H/R treatment.
3.2. Functional Enrichment Visualization (Gene Ontology, Biological Process)
The most significant biological activity these proteins belong to is the general Cellular Process. (Figure 2A) This might be due to the intense proliferation process affecting HMC3 cells under H/R conditions. Among the reactome pathways, (Figure 2B) the RNA metabolism is significantly involved in the H/R process. The activation of RNA metabolism during reoxygenation in HMC3 cells might account for the removal of dysfunctional transcripts and the regulation of protein production. The latter is very important to counteract the oxidative stress and inflammation induced by H/R. As a natural consequence, RNA binding proteins are also particularly expressed upon H/R because they are fundamental for controlling RNA stability, localization, and translation. (Figure 2C) The proliferation activity of HMC3 cells after H/R is higher than that reported by the same cell line under normoxic conditions. The activation of the oxidative phosphorylation (Figure 2D) after reoxygenation could mean that HMC3 cells try to restore normal energy metabolism after hypoxia. Such an important pathway for cellular survival and function may also contribute to increasing oxidative stress.
3.3. Real-Time Cell Proliferation and Heatmap of HMC3
The effects of Nicotine, HTP AqE and 1R6F AqE at the same nicotine concentration of 340 nM were evaluated on HMC3 cell viability in H/R conditions. The results showed that 1R6F AqE treatment caused a significant decrease in normalized cell index (Figure 3A) and area under the curve (AUC) (Figure 3B) compared to H/R cells, indicating a reduction in cell proliferation. Then was evaluated the effect on HMC3 cells of nicotine and HTP AqE. Both induced a significant increase in cell proliferation (Figure 1D-E) as indicated by the normalized cell index and AUC compared to cigarette smoke treated cells (p<0.001). The proteomic characterization of the H/R cellular model was prodromic to investigate the effect (if any) of the vapor/smoke coming from heated tobacco products (HTPs) or conventional cigarettes (1R6F). The treatment with samples containing only nicotine was also investigated. Heatmap and hierarchical clustering (Figure 3C, D) show significant proteins of the multi-sample ANOVA among all the samples treated with hypoxia and reoxygenation alone (H/R), with Nicotine (H/R Nicotine), 1R6F (H/R 1R6F) or HTP (H/R HTP). All these proteins clusterize based on the trend they follow across the biological samples. Two of these groups (cluster #1 and #3) contain as low as 5-6 proteins, whereas the other clusters (#2 and #4) group most of these significantly expressed proteins. Proteins in cluster #2 were down-regulated when HMC3 are treated with HTP or 1R6F; on the contrary, up-regulation interested all the proteins grouped in cluster #4.
The number of each protein cluster is written on both the right and left side of the graph.
3.4. Functional Network of Proteins Expressed in the Cell Cultures Under Hypoxia e Reoxygenation
Both the down- and up-regulated proteins show a specific network cluster (Figure 4A and Figure 4C). Some of the up-regulated proteins have an impaired homodimerization activity (Figure 4B), that might account for an injury of their own physiological activity. The up-regulated proteins are significantly involved in the RNA binding (Figure 4D), thus confirming the important role of the RNA metabolism on the cellular attempt to play against the adverse effects caused by both Hypoxia and vapor/smoke.
3.5. Cigarette Smoke Impairs NRF2 Translocation
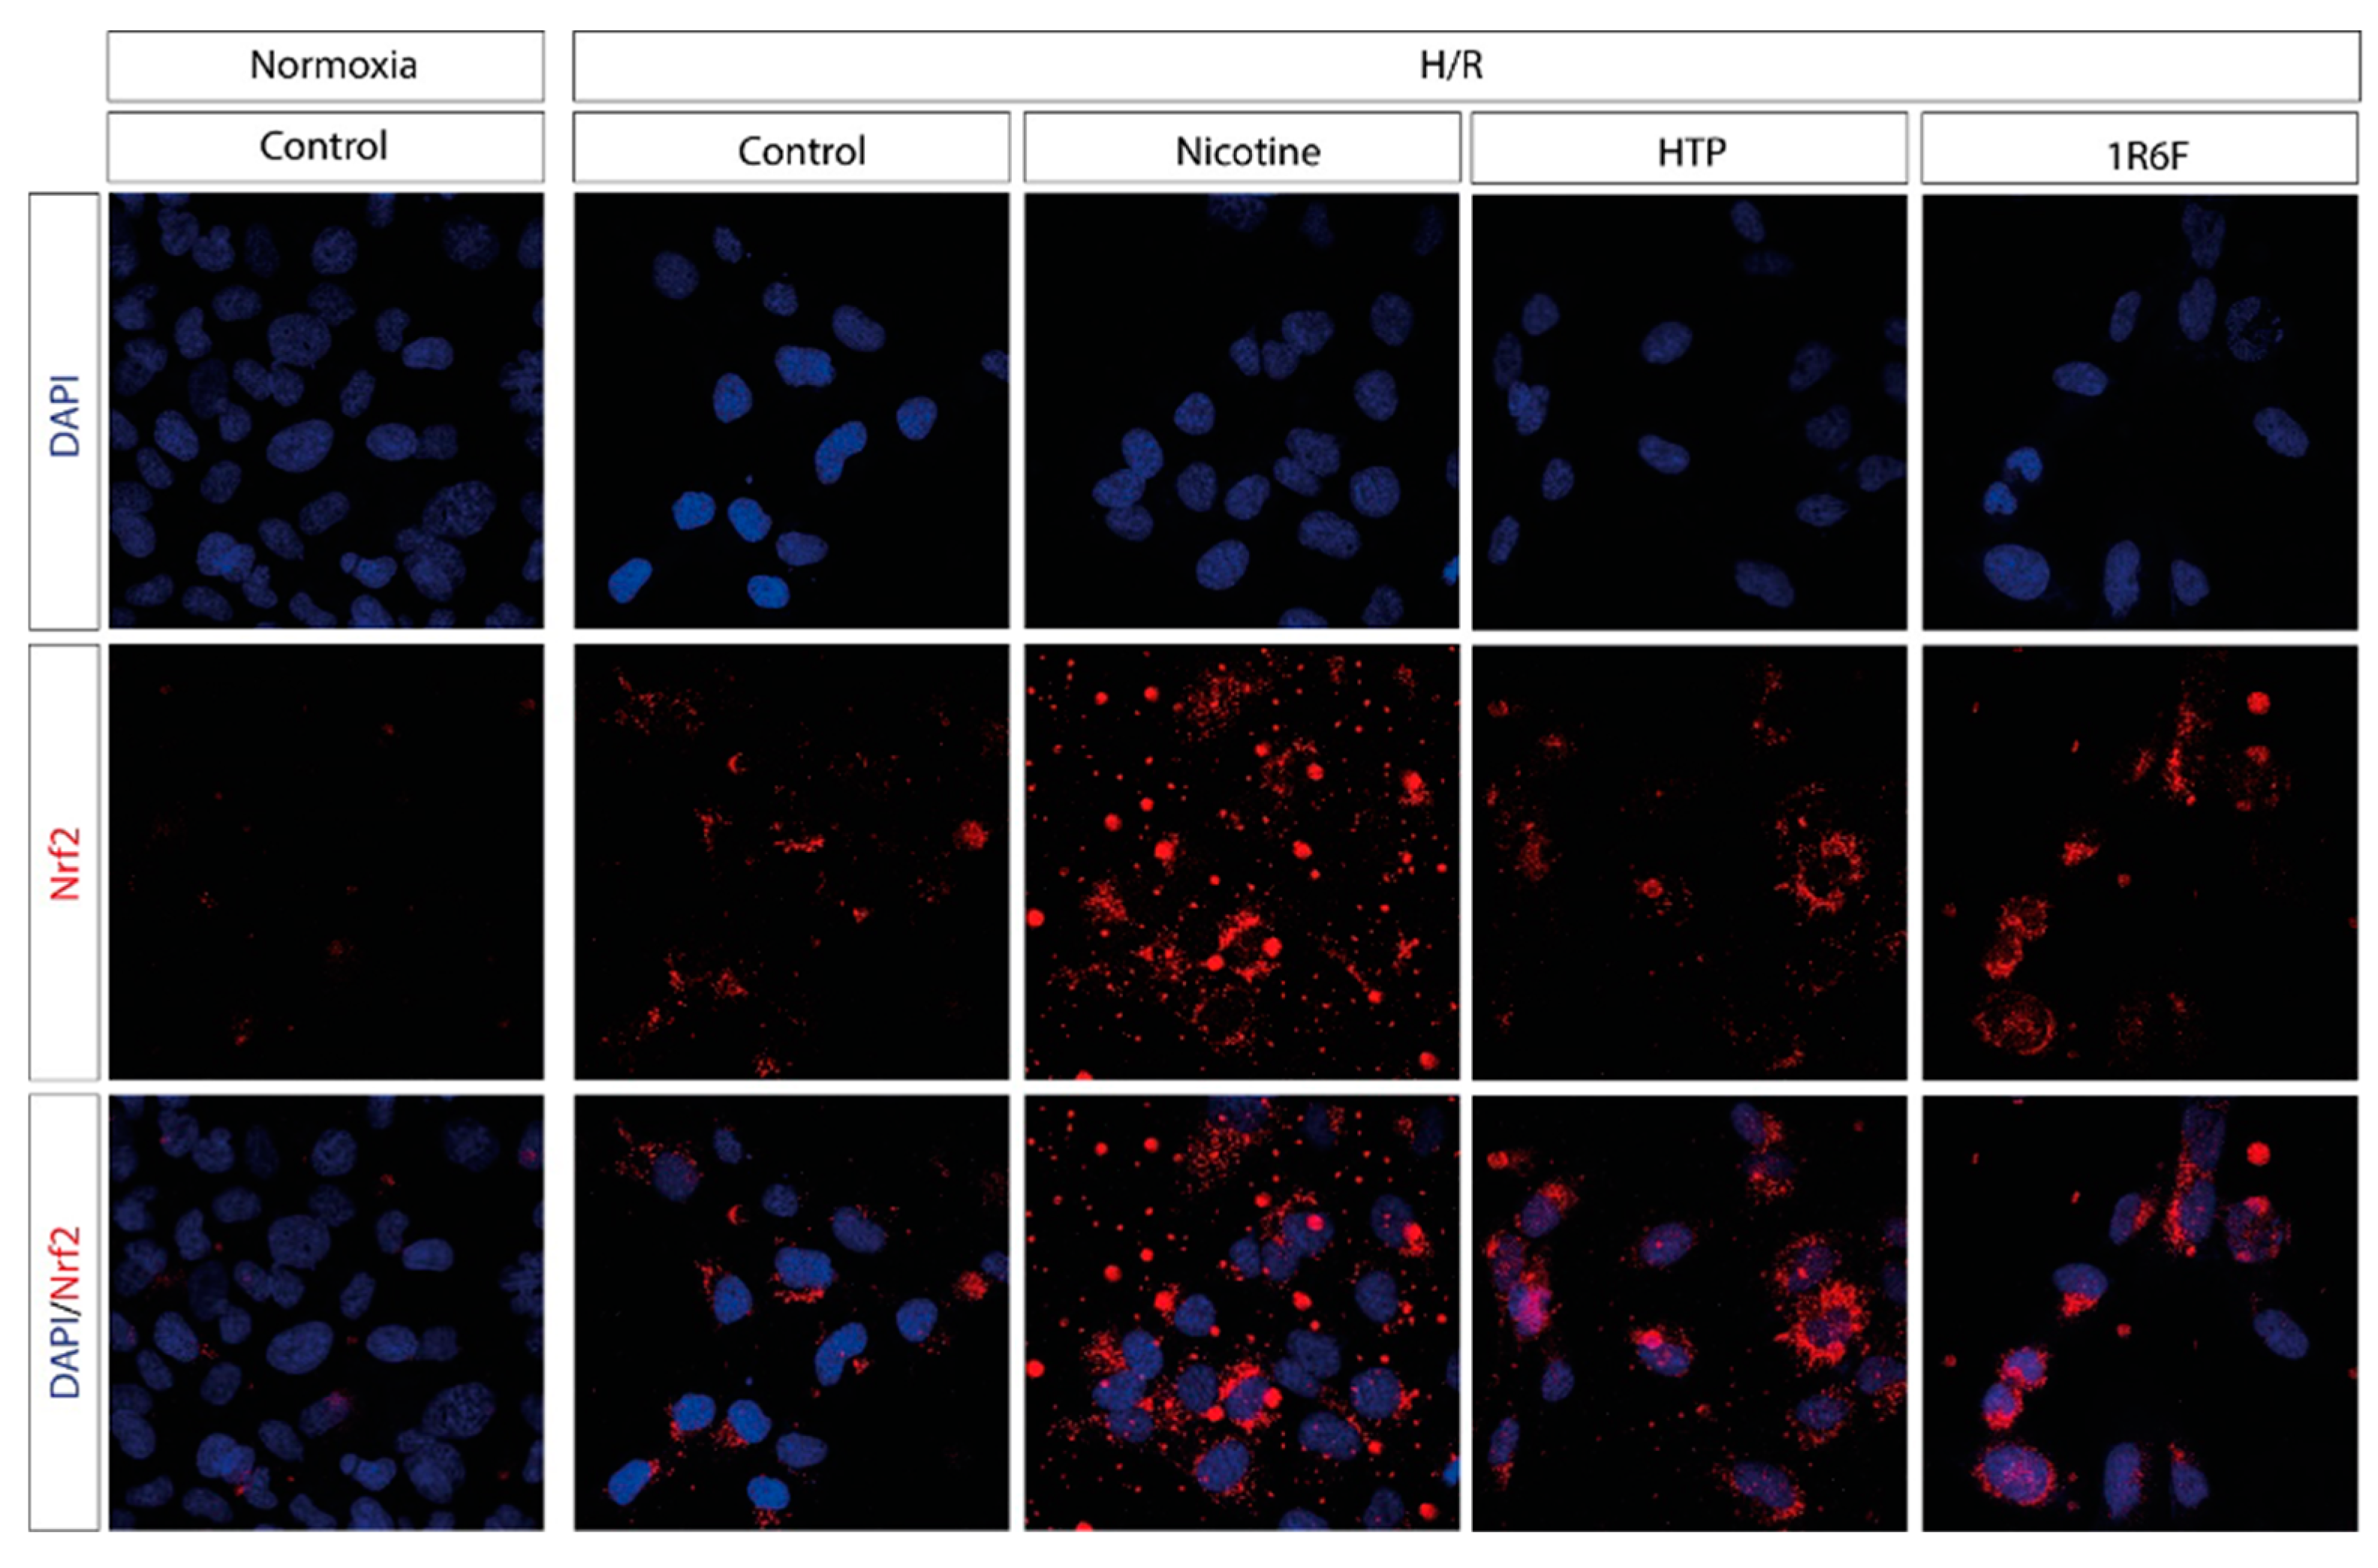
Under normoxic conditions, Nrf2 expression (marked in red) is minimal and mainly distributed in the cytoplasm, with no obvious translocation to the nucleus. (Figure 5) After H/R, the control shows a slight increase in Nrf2 expression, but translocation to the nucleus remains limited. In cells exposed to nicotine, there is a clear nuclear translocation of Nrf2 (colocalization of red spots in the nucleus, visualized with DAPI/Nrf2 overlap). This indicates that nicotine activated the Nrf2 pathway in response to H/R, leading to translocation of the transcription factor into the nucleus. Cells exposed to 1R6F cigarette smoke show a strong increase in Nrf2 expression, with a clearly visible nuclear translocation, similar to that observed with nicotine, but with a more intense and diffuse distribution. This indicates that exposure to conventional cigarette smoke has a significant impact on the Nrf2 pathway. Exposure to aerosol (HTP) also induces an increase in Nrf2 expression and nuclear translocation, albeit less pronounced than with conventional cigarette smoke. Colocalization in the nucleus is visible, but less widespread than with exposure to 1R6F.
4. Discussion
This study aimed to investigate the effects of nicotine, cigarette smoke (1R6F) and heated tobacco product (HTP) aerosol on microglial activation, cell proliferation, and proteomic profiles under H/R conditions. Our findings confirm that H/R conditions significantly activated microglia, as indicated by increased cell index values and area under the curve (AUC). This activation aligns with previous reports highlighting that hypoxic stress induces microglial activation, an essential step in the neuroinflammatory response to brain injury [13]. Interestingly, the exposure to cigarette smoke (1R6F) under H/R conditions resulted in a significant reduction in microglia activation when compared to HTP and nicotine. This suggests that while both cigarette smoke and HTP aerosol significantly impact on various microglial biochemical pathways, their effects on microglial activation diverge, with HTP and nicotine maintaining such important cellular function under the studied conditions. These findings may support previous research indicating that heated tobacco products and nicotine produce fewer toxicants than conventional cigarettes, though their long-term impacts on brain health remain unclear. Furthermore, these results are consistent with our previous recent results showing that 1R6F resulted in a significant impairment of microglial phagocytic activity when compared to THP or nicotine [5].
Proteomic analysis further revealed that H/R significantly altered the protein expression profile of microglia. In particular 97 proteins were uniquely expressed under H/R conditions. These proteins were primarily involved in RNA metabolism, oxidative phosphorylation, and cellular stress responses. This is consistent with the hypothesis that reoxygenation triggers cellular pathways aimed at counteracting oxidative damage and inflammation [14]. The increased expression of RNA-binding proteins may indicate an adaptive response to regulate protein production and repair mechanisms, mitigating the damage caused by hypoxia. Proteins downregulated in response to cigarette smoke and HTP exposure were involved in essential cellular processes, while the upregulated proteins in both cases were associated with oxidative stress responses, including homodimerization activity. These proteomic shifts suggest that both cigarette smoke and HTP aerosols may induce oxidative stress but through different mechanisms or to varying degrees.
Finally, our results showed that cigarette smoke results in a significant impairment of the antioxidant response as measured by NrF2 nuclear translocation. To this regard, confocal microscopy analysis demonstrated that both nicotine and HTP maintained Nrf2 nuclear translocation following H/R, indicating a physiological activation of the antioxidant response pathway. However, the Nrf2 translocation was impaired with conventional cigarette smoke compared to HTP aerosol and nicotine. The less intense Nrf2 activation observed with 1R6F aerosol may reflect its effect on the antioxidant impairment in response to a second hit such as H/R. These results are consistent with our previous results showing that Nrf2 translocation is impaired along with NF-kb activation in a similar model [5]. These results are also of great clinical interest since cigarette smoke is associated with increased risk of ischemic stroke as well as to a more severe prognosis [15,16,17].
Taken all together our results suggest that cigarette smoke appears to exert a stronger cytotoxic effect compared to HTP, reducing cell activation and inducing more pronounced oxidative stress, as indicated by impairment of Nrf2 activation and proteomic changes associated with cellular damage. Conversely, HTP aerosol and nicotine alone seem to support microglial activation, possibly reflecting reduced toxicity under acute exposure conditions. This is consistent with previous report, suggests that heated tobacco products may represent a less harmful alternative to conventional smoking, though the risk of long-term cerebrovascular effects cannot be ruled out. [15] While our study provides valuable insights into the differential effects of cigarette smoke and HTP aerosols on microglial function, several limitations must be acknowledged. First, the in vitro nature of the study may not fully capture the complexities of in vivo brain microenvironments, where interactions with other cell types and systemic factors could modulate microglial responses. Second, the long-term effects of chronic exposure to cigarette smoke or HTP aerosols were not assessed in this study. Future research should explore prolonged exposures and include in vivo models to better understand the cerebrovascular risks associated with heated tobacco products. Additionally, the exact molecular mechanisms by which nicotine influence microglial proliferation and Nrf2 activation warrant further investigation.
5. Conclusions
In conclusion, our findings highlight distinct effects of cigarette smoke and HTP aerosols on microglial function under hypoxic conditions. While cigarette smoke induces greater oxidative stress and cytotoxicity, HTP aerosols, and nicotine alone, appear to have a lesser but still significant impact. These results emphasize the need for caution when considering HTPs as a safer alternative to smoking, particularly regarding their long-term effects on cerebrovascular health.
Author Contributions
Conceptualization: A.D., L.O., Massimo Caruso, K.P., R.E., A.M.A., A.S.A., G.L.V., A.N., V.B. Methodology: A.D., G.L.V., L.O., F.B., V.B. and A.S.A. Software: L.L., R. E., F. B., and N.V.; Validation: G.L.V., L.L, R.E. Formal analysis: A.D., L.L., L.O., F.B., A.M.A, A.N., V.B., A.S.A., K.P., R.E.. Investigation: G.L.V., M.C. Funding. G.L.V, A.S.A. Data curation: A.D., G.L.V, R.E. and L.O. Writing-original draft preparation: A.D., L.O., K.P., A.N., V.B., G.L.V., M.C. and A.M.A.
Funding
Researchers Supporting Project number (RSPD2025R750), King Saud University, Riyadh, Saudi Arabia. This research was funded by Researchers Supporting Project number (RSPD2025R750), King Saud University, Riyadh, Saudi Arabia. This research was also supported by the University of Catania by PIACERI program (IMYTRA).
Data Availability Statement
All research data are available upon request to the corresponding author.
Acknowledgments
This work has been conducted thanks to tools and high-end equipment property of and kindly provided free of charge by ECLAT Srl, a spin-off of the University of Catania that delivers solutions to global health problems with particular emphasis on harm minimization and technological innovation. Authors extend their sincere appreciation to Researchers Supporting Project number (RSPD2025R750), King Saud University, Riyadh, Saudi Arabia.
Conflicts of Interest
The authors declare no conflicts of interest.
Abbreviations
The following abbreviations are used in this manuscript:
AqE: Aqueous Extract; ENDS: electronic nicotine delivery systems; HTPs: heating tobacco products; E-cigs - Electronic Cigarettes; HCS - High Content Screening; ISO - International Organization for Standardization; HCI - Health Canada Intensive; CRM81 - CORESTA Recommended Method n. 81; Nrf2 - Nuclear factor erythroid-derived 2-like 2; H/R - hypoxia/reoxygenation.
References
- Shah, R.S.; Cole, J.W. Smoking and stroke: the more you smoke the more you stroke. Expert Rev Cardiovasc Ther 2010, 8, 917–932. [Google Scholar] [CrossRef] [PubMed]
- Edjoc, R.K.; Reid, R.D.; Sharma, M.; Fang, J.; Registry of the Canadian Stroke, N. The prognostic effect of cigarette smoking on stroke severity, disability, length of stay in hospital, and mortality in a cohort with cerebrovascular disease. J Stroke Cerebrovasc Dis 2013, 22, e446–454. [Google Scholar] [CrossRef] [PubMed]
- Voelz, C.; Habib, P.; Koberlein, S.; Beyer, C.; Slowik, A. Alteration of miRNA Biogenesis Regulating Proteins in the Human Microglial Cell Line HMC-3 After Ischemic Stress. Mol Neurobiol 2021, 58, 1535–1549. [Google Scholar] [CrossRef] [PubMed]
- Hawkins, B.T.; Brown, R.C.; Davis, T.P. Smoking and ischemic stroke: a role for nicotine? Trends Pharmacol Sci 2002, 23, 78–82. [Google Scholar] [CrossRef] [PubMed]
- Distefano, A.; Orlando, L.; Partsinevelos, K.; Longhitano, L.; Emma, R.; Caruso, M.; Vicario, N.; Denaro, S.; Sun, A.; Giordano, A.; et al. Comparative evaluation of cigarette smoke and a heated tobacco product on microglial toxicity, oxidative stress and inflammatory response. J Transl Med 2024, 22, 876. [Google Scholar] [CrossRef] [PubMed]
- Cigarette smoking machine - HAUNI LM series. Available online: https://www.directindustry.com/prod/koerber-technologies-gmbh/product-116079-2468335.html (accessed on.
- ISO 3402:2023 - Tobacco and tobacco products — Atmosphere for conditioning and testing. Available online: https://www.iso.org/standard/83089.html (accessed on.
- ISO/TR 19478-2:2015(en) ISO and Health Canada intense smoking parameters. Available online: https://www.iso.org/obp/ui/#iso:std:iso:tr:19478:-2:ed-1:v1:en (accessed on.
- Adamson, J.; Jaunky, T.; Thorne, D.; Gaca, M.D. Characterisation of the borgwaldt LM4E system for in vitro exposures to undiluted aerosols from next generation tobacco and nicotine products (NGPs). Food Chem Toxicol 2018, 113, 337–344. [Google Scholar] [CrossRef] [PubMed]
- Panda A, S.P.K. , Shivakumar H.N., Repka M.A., Murthy S.N. Nicotine loaded dissolving microneedles for nicotine replacement therapy. Journal of Drug Delivery Science and Technology 2021, 61. [Google Scholar] [CrossRef]
- Barone, R.; Macaluso, F.; Sangiorgi, C.; Campanella, C.; Marino Gammazza, A.; Moresi, V.; Coletti, D.; Conway de Macario, E.; Macario, A.J.; Cappello, F.; et al. Skeletal muscle Heat shock protein 60 increases after endurance training and induces peroxisome proliferator-activated receptor gamma coactivator 1 alpha1 expression. Sci Rep 2016, 6, 19781. [Google Scholar] [CrossRef] [PubMed]
- Marino Gammazza, A.; Campanella, C.; Barone, R.; Caruso Bavisotto, C.; Gorska, M.; Wozniak, M.; Carini, F.; Cappello, F.; D'Anneo, A.; Lauricella, M.; et al. Doxorubicin anti-tumor mechanisms include Hsp60 post-translational modifications leading to the Hsp60/p53 complex dissociation and instauration of replicative senescence. Cancer Lett 2017, 385, 75–86. [Google Scholar] [CrossRef] [PubMed]
- Cipriani, R.; Domerq, M.; Martin, A.; Matute, C. Role of Microglia in Stroke. Adv Neurobiol 2024, 37, 405–422. [Google Scholar] [CrossRef] [PubMed]
- Granger, D.N.; Kvietys, P.R. Reperfusion injury and reactive oxygen species: The evolution of a concept. Redox Biol 2015, 6, 524–551. [Google Scholar] [CrossRef] [PubMed]
- Mahlich, J.; Kamae, I. Switching from Cigarettes to Heated Tobacco Products in Japan-Potential Impact on Health Outcomes and Associated Health Care Costs. Healthcare (Basel) 2024, 12, 1937. [Google Scholar] [CrossRef]
- Wang, X.; Liu, X.; O'Donnell, M.J.; McQueen, M.; Sniderman, A.; Pare, G.; Hankey, G.J.; Rangarajan, S.; Chin, S.L.; Rao-Melacini, P.; et al. Tobacco use and risk of acute stroke in 32 countries in the INTERSTROKE study: a case-control study. EClinicalMedicine 2024, 70, 102515. [Google Scholar] [CrossRef] [PubMed]
- Schupper, A.J.; Khorasanizadeh, M.; Rossitto, C.P.; Foster, L.D.; Kellner, C.P.; Suarez, J.I.; Qureshi, A.I.; Majidi, S.; *, A.-t.i. Cigarette Smoking as a Risk Factor for Hematoma Expansion in Primary Intracerebral Hemorrhage: Analysis From a Randomized Clinical Trial. J Am Heart Assoc 2023, 12, e030431. [Google Scholar] [CrossRef] [PubMed]
Figure 1.
(A) Real-time cell proliferation of microglia HMC3 cells following H/R and (B) corresponding Area under the curve (AUC). (C) Venn Diagram showing all the identified proteins in normoxic culturing conditions (Normoxia), compared to those identified in cells under H/R. (D) Principal component analysis (PCA) showing the individual sample distribution of proteins in normoxic culturing conditions (blue dots), compared to those in cells under H/R (red dots), n=3. (E) Functional network of proteins singly expressed in the cell cultures under H/R.
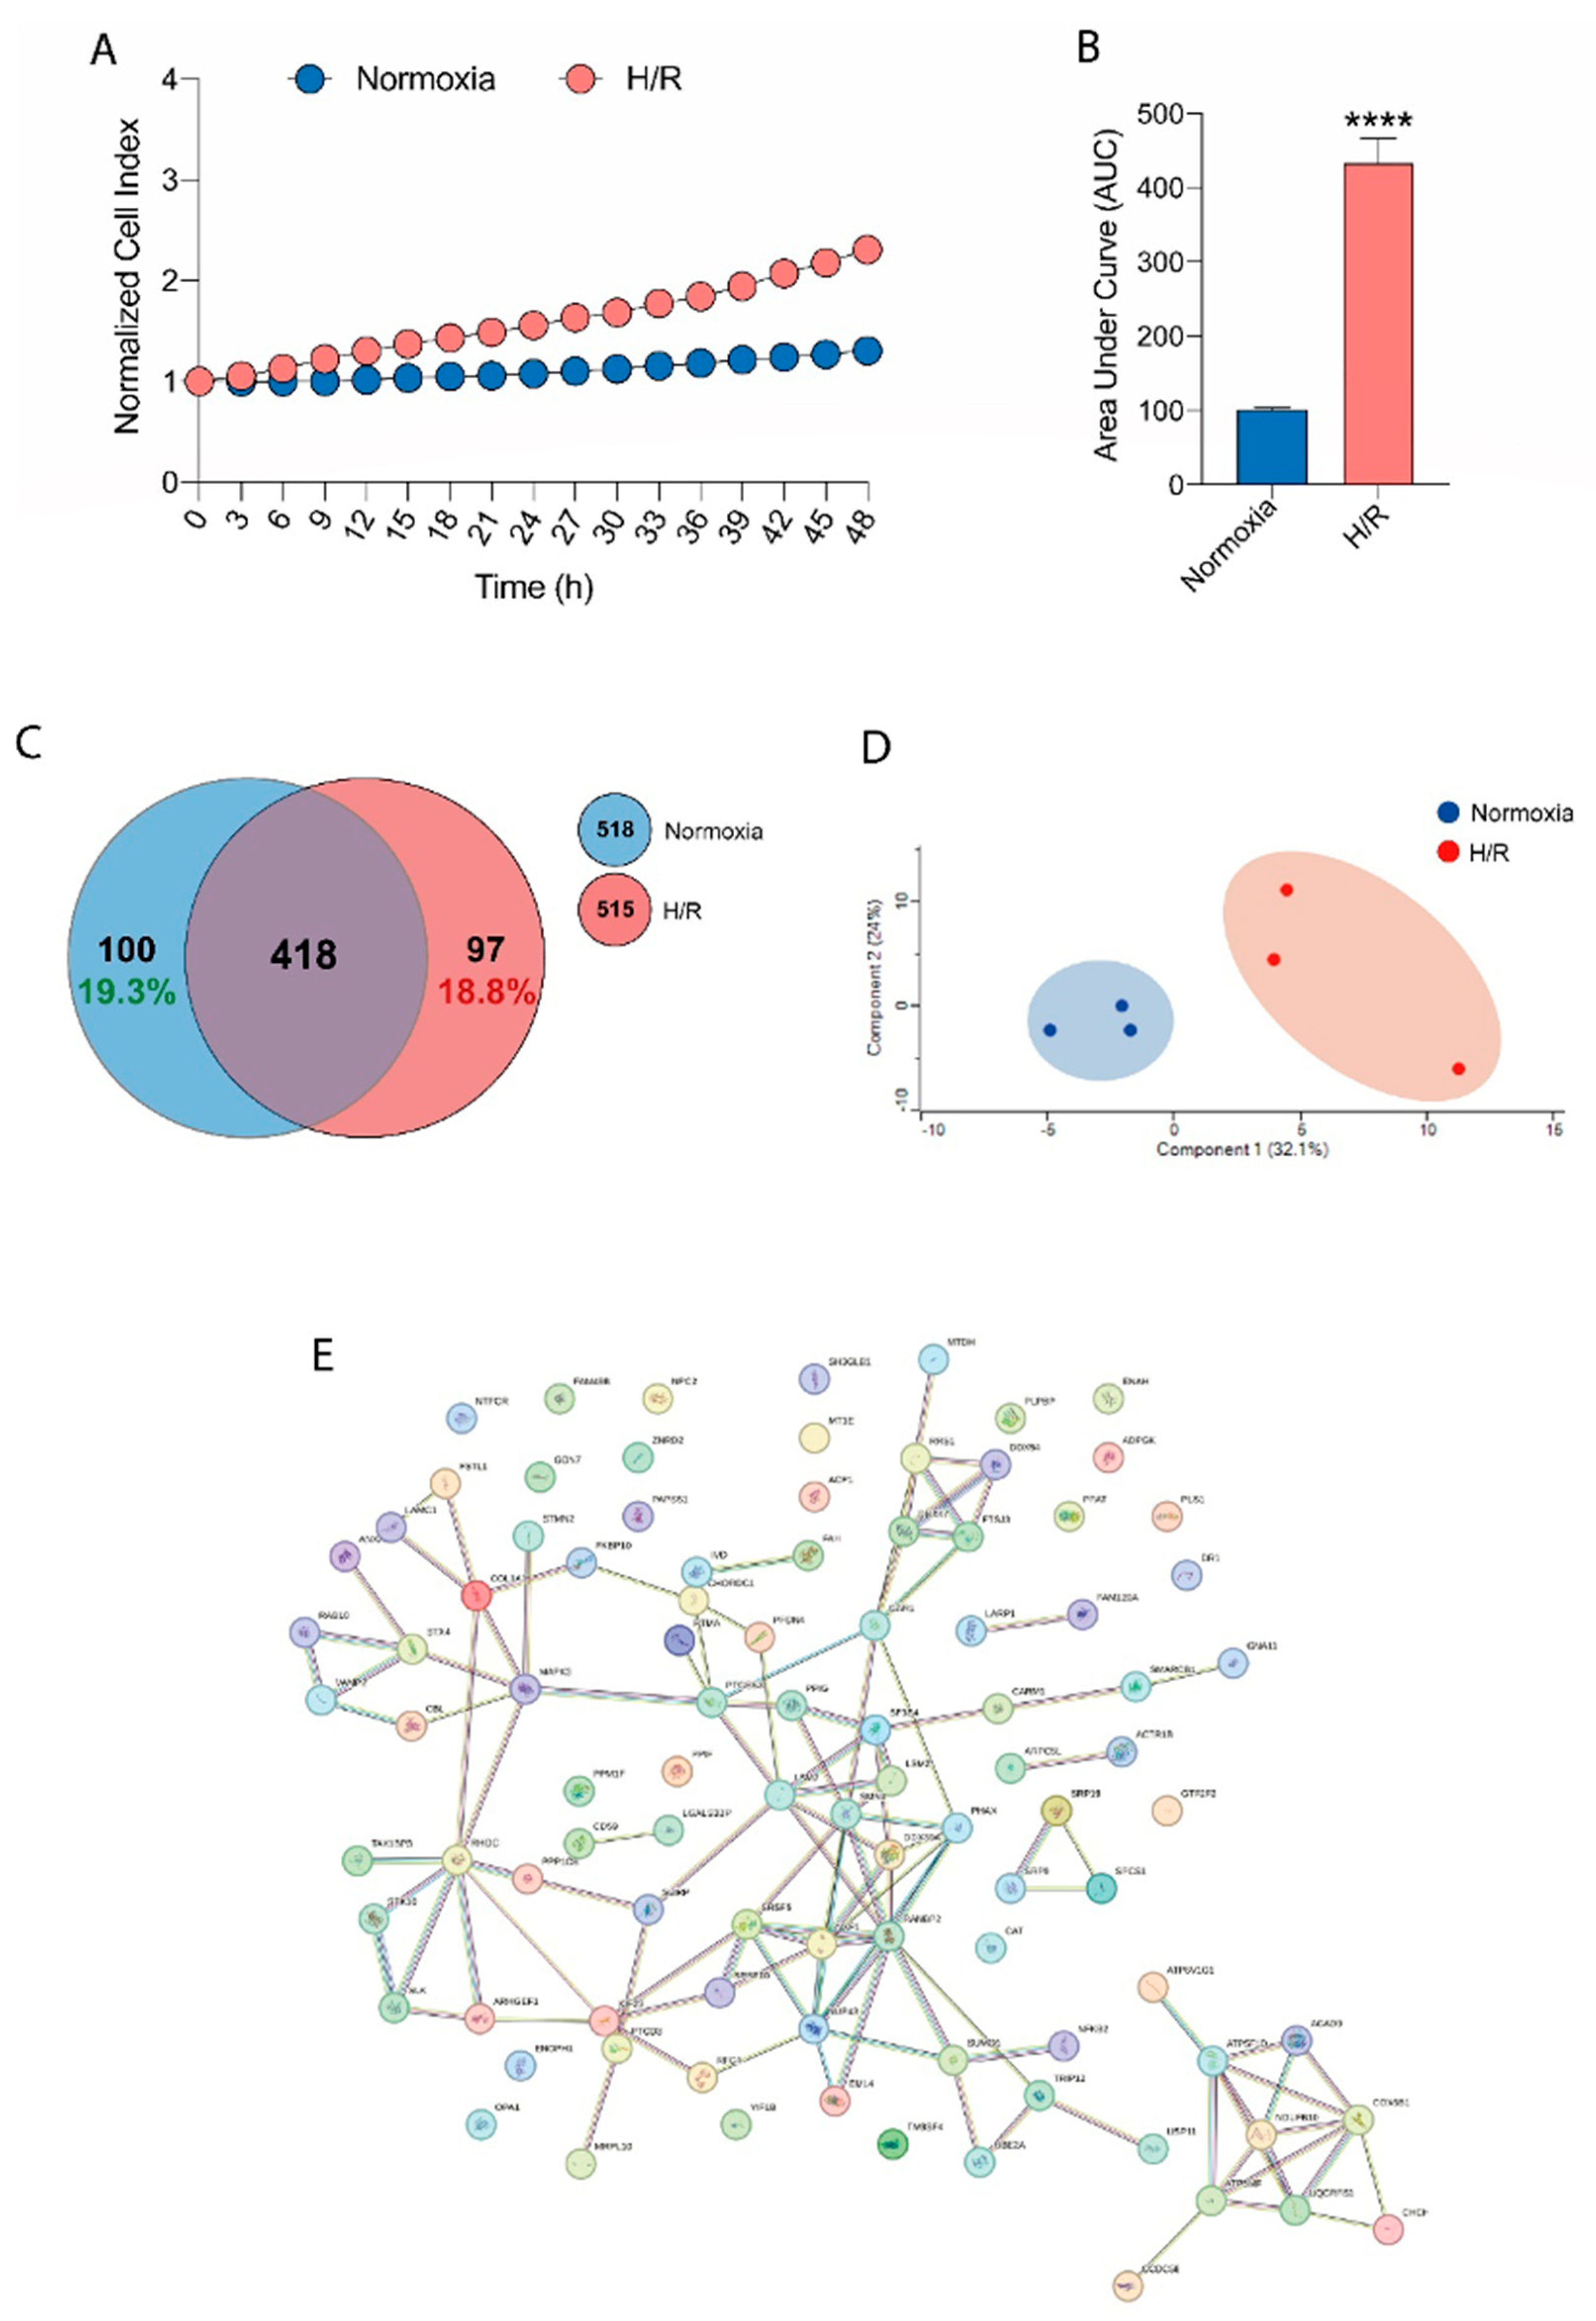
Figure 2.
(A) Functional enrichment visualization (Gene Ontology, Biological Process) of the proteins singly expressed in the cell cultures under H/R. (B) Functional enrichment visualization (Reactome Pathways) of the proteins singly expressed in the cell cultures under H/R. (C) Functional enrichment visualization (Gene Ontology, Molecular Function) of the proteins singly expressed in the cell cultures under H/R. (D) Functional enrichment visualization (KEGG pathways) of the proteins singly expressed in the cell cultures under H/R.

Figure 3.
(A) Real-time cell proliferation of microglia HMC3 cells pre-treated with Nicotine or HTP or 1R6F and followed by H/R and (B) corresponding Area under the curve (AUC). (C-D) Heatmap and hierarchical clustering of significant proteins of the multi-sample ANOVA (uncorrected p-value<0.05) among all the samples treated with hypoxia and reoxygenation alone (H/R), with Nicotine (H/R Nicotine), 1R6F (H/R 1R6F) or HTP (H/R HTP). Each sample name clusters three biological samples. The color scale at the bottom of the Figure represents the abundance of proteins after normalization with Z-scoring across rows for the heatmap.
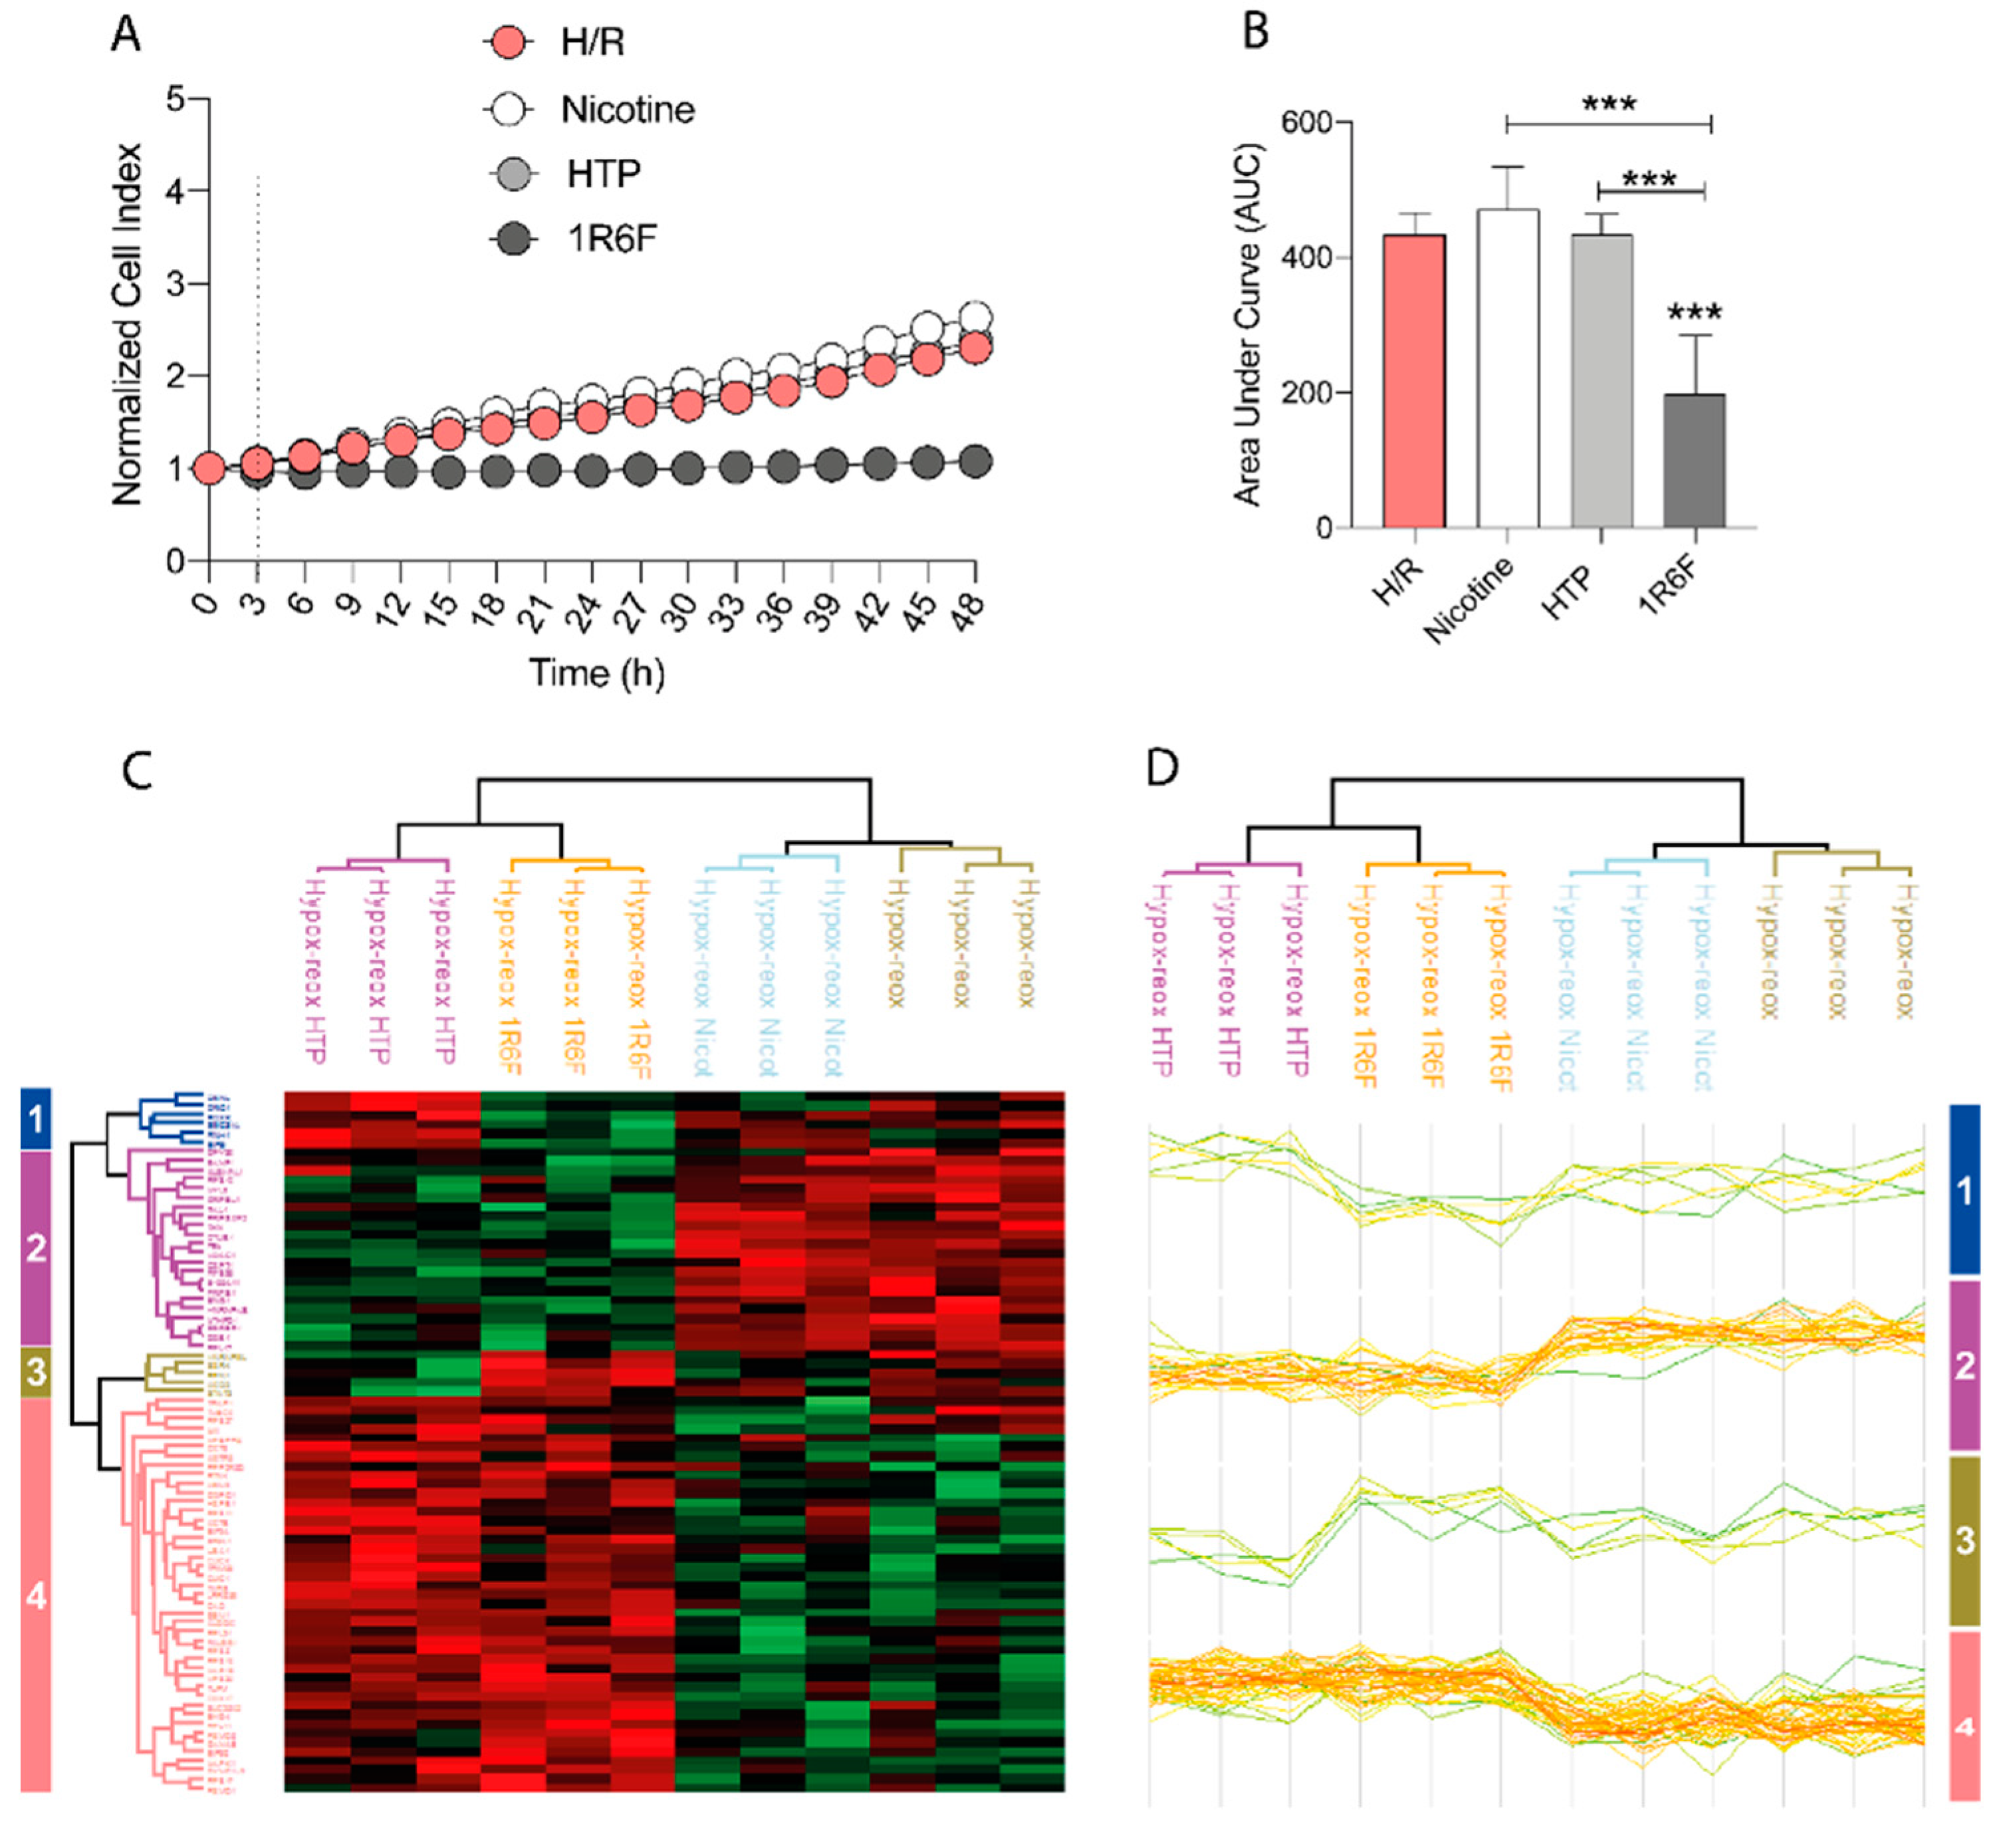
Figure 4.
(A) Functional network of the proteins expressed in the cell cultures under H/R, coming from cluster #2 in the heatmap and hierarchical clustering. (B) Functional enrichment visualization (Gene Ontology, Molecular Function) of the proteins expressed in the cell cultures under H/R, coming from cluster #2 in the heatmap and hierarchical clustering. (C) Functional network of the proteins expressed in the cell cultures under H/R, coming from cluster #4 in the heatmap and hierarchical clustering. (D) Functional enrichment visualization (Gene Ontology, Molecular Function) of the proteins expressed in the cell cultures under H/R, coming from cluster #4 in the heatmap and hierarchical clustering.
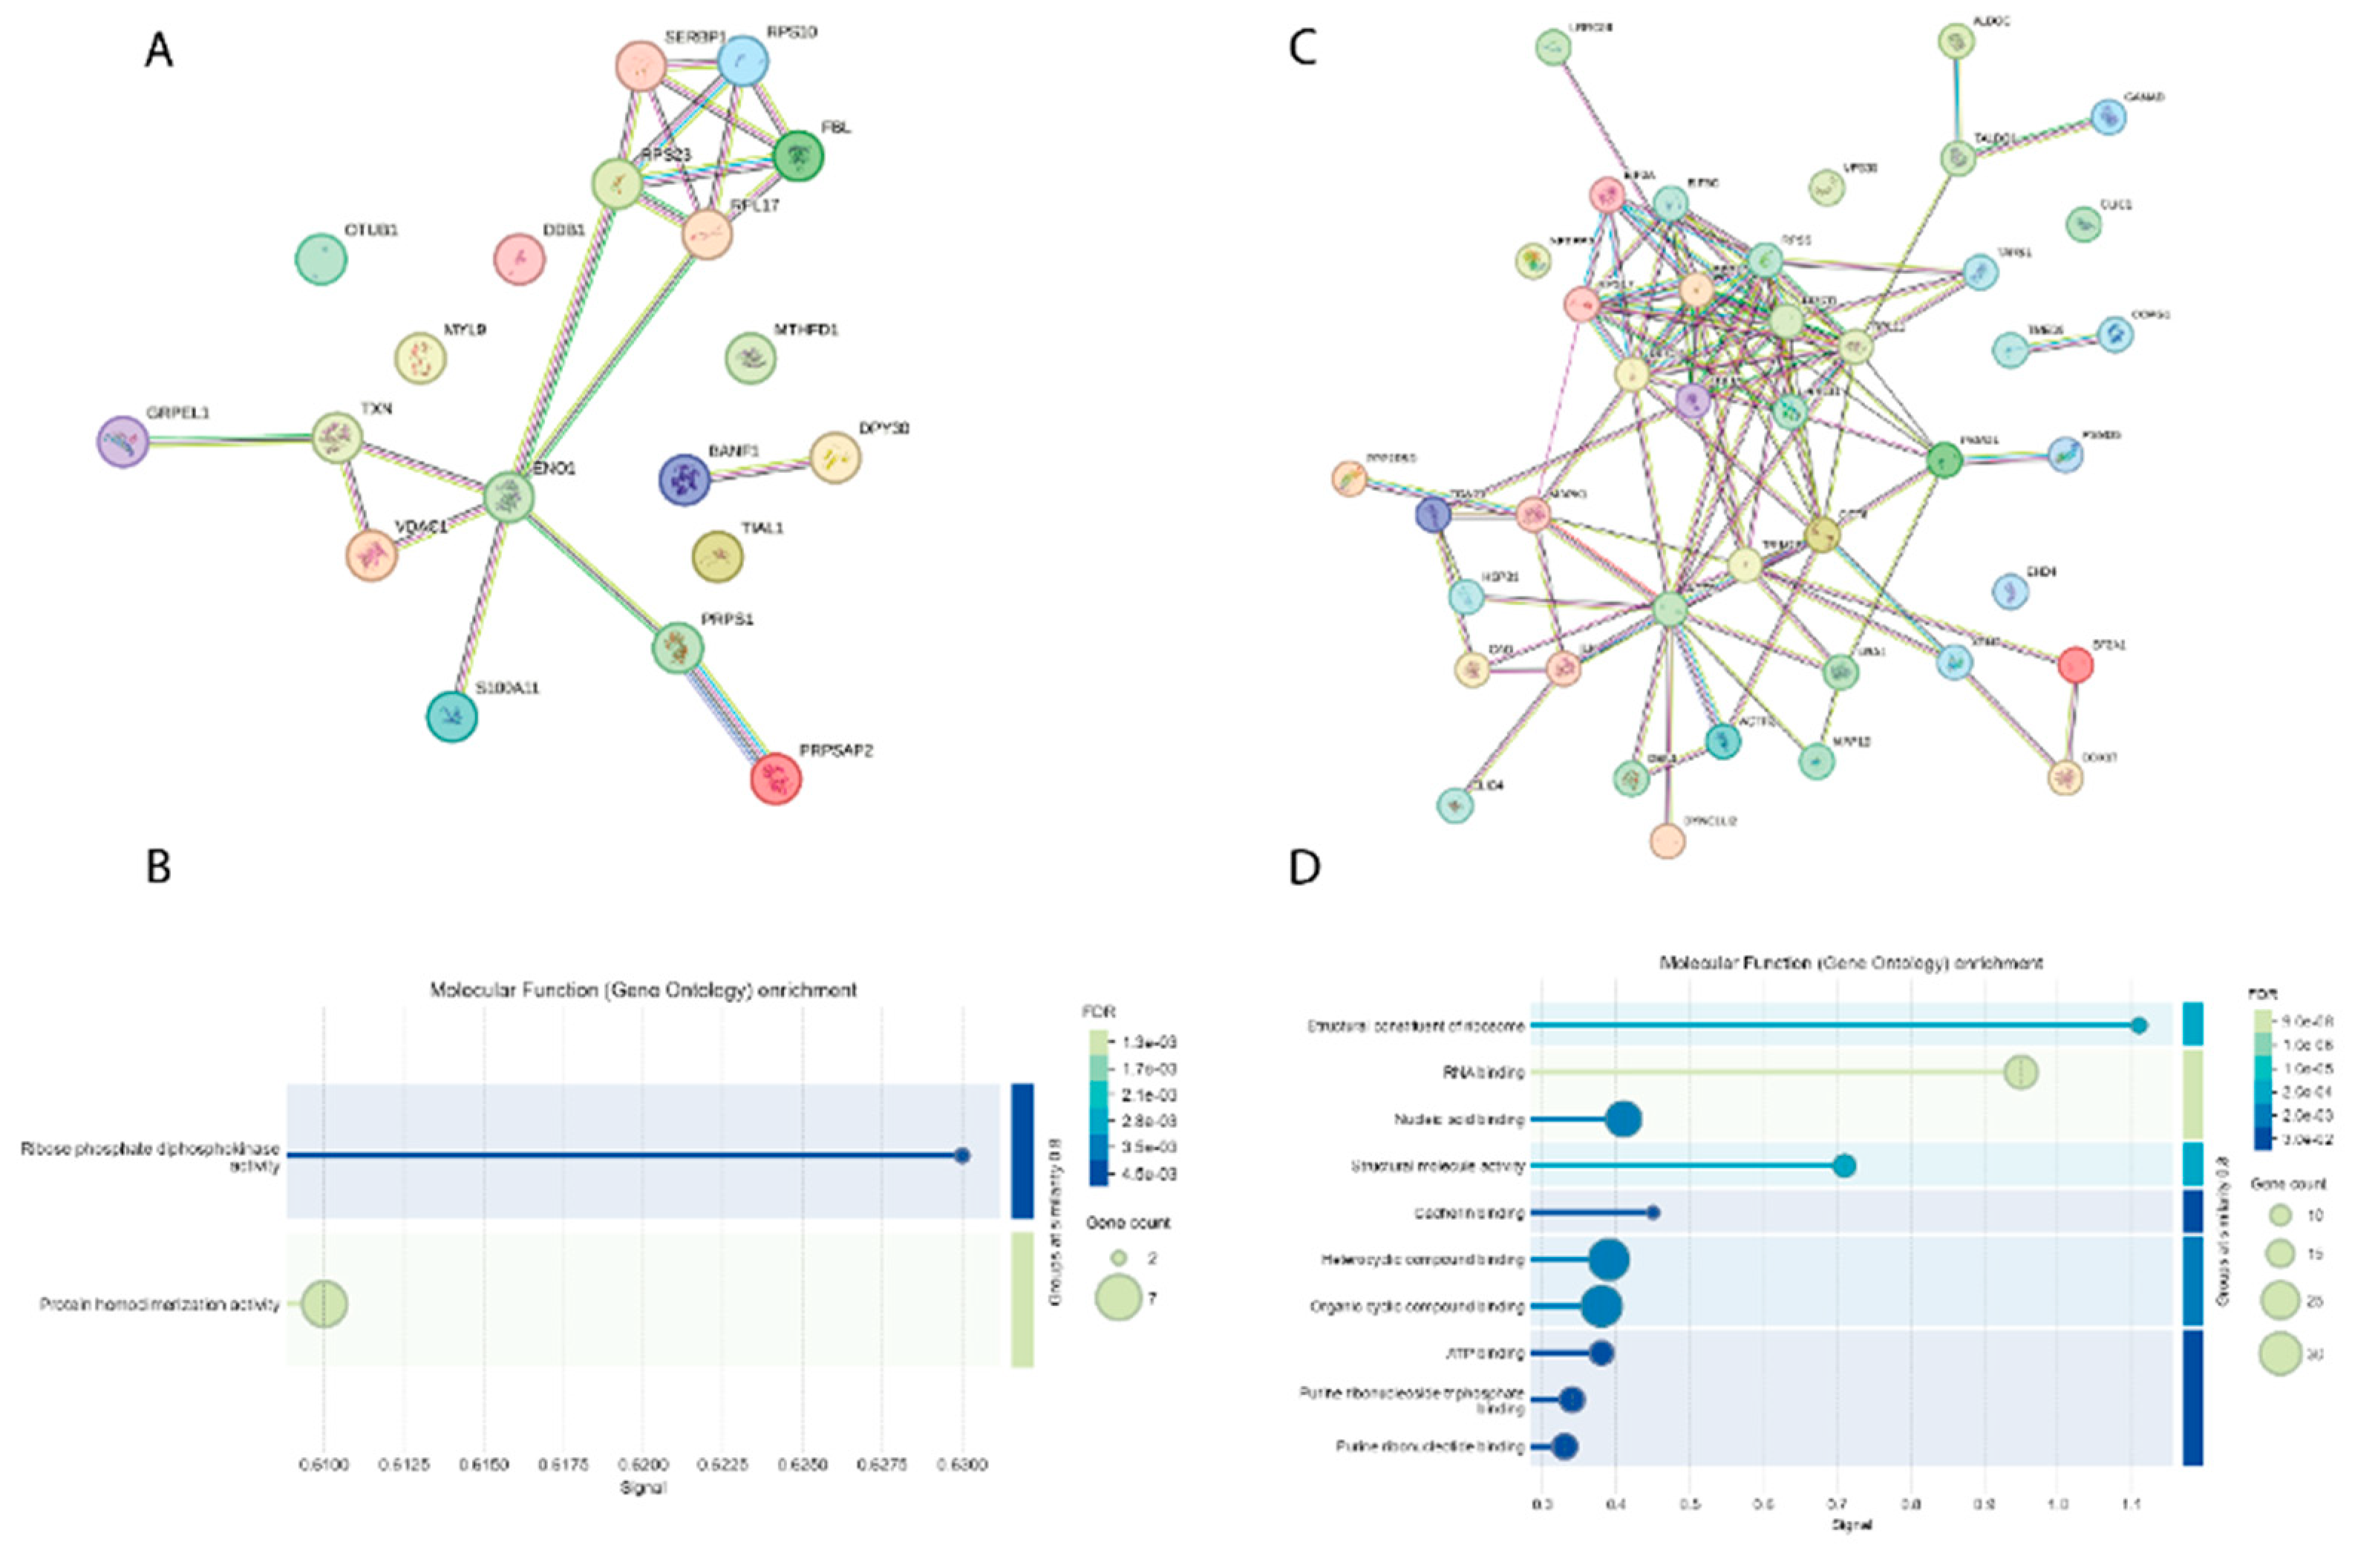
Figure 5.
Nrf2 staining of microglia HMC3 cells pre-treated with Nicotine or HTP or 1R6F and followed by H/R.
Figure 5.
Nrf2 staining of microglia HMC3 cells pre-treated with Nicotine or HTP or 1R6F and followed by H/R.
Disclaimer/Publisher’s Note: The statements, opinions and data contained in all publications are solely those of the individual author(s) and contributor(s) and not of MDPI and/or the editor(s). MDPI and/or the editor(s) disclaim responsibility for any injury to people or property resulting from any ideas, methods, instructions or products referred to in the content. |
© 2025 by the authors. Licensee MDPI, Basel, Switzerland. This article is an open access article distributed under the terms and conditions of the Creative Commons Attribution (CC BY) license (http://creativecommons.org/licenses/by/4.0/).
Copyright: This open access article is published under a Creative Commons CC BY 4.0 license, which permit the free download, distribution, and reuse, provided that the author and preprint are cited in any reuse.


