
Submitted:
14 March 2025
Posted:
17 March 2025
You are already at the latest version
Abstract
In the recent past, vehicular networks (VANETs) have emerged as promising technology for enabling communication between vehicles and infrastructures to improve road safety and driving experience. However, the dynamic nature of VANETs, characterised by rapid changing traffic conditions and varying network load, poses significant challenges for reliable communication. Congestion control is a critical aspect in VANETs to prevent network saturation, reduce packet loss, and enhance overall system performance. In this context, the application of fuzzy-logic-based approaches offers a flexible and adaptive solution to dynamically adjust the network performance. This research introduced a fuzzy-logic-based congestion control mechanism for VANEts. The approach focused on dynamically adjusting the beacon busy ratio, road segment, and vehicle speed to address the fluctuating traffic condition, thereby mitigating congestion and enhancing vehicular network efficiency. Leveraging fuzzy logic, the proposed system can make route suggestions through the communication between roadside units based on input variables such as beacon busy ratio, road segment, and vehicle speed. On the result and analysis, the performance analysis of the system-based implemented Network Simulator-3 (NS3) and Simulation for Urban Mobility (SUMO) network simulation tool is used. Through simulation, the efficacy of the approach is demonstrated, showing its ability to adapt to evolving traffic dynamics and alleviate congestion on VANETs for enhancing network performance and reliability. The simulation result shows that our proposed system achieves a packet delivery ratio of 95%, throughput of 110 Kbps, and end-to-end delay of 1.93 seconds. This result shows that our scheme is feasible and effective.
Keywords:
Load
; fuzzy logic
; roadside unit
; vehicle
; road segment
Introduction
Vehicular ad hoc networks (VANETs) are a subset of mobile ad hoc networks (MANETs) that used to communicate between vehicles to vehicles and vehicles to infrastructure. Vehicles act as nodes in a VANET, sending and receiving data without the need for a physical link. VANET support vehicles to communicate through Vehicle-to-Vehicle (V2V) and Vehicle-to-Infrastructure (V2I) communications) to control critical situations. VANETs used the IEEE 802.11p standard and Dedicated Short Range Communication (DSRC) for communication. For specialized shortrange communication, the US Federal Communication Commission (FFC) has set aside 75 MHz of bandwidth at 5.9 GHz (DSRC)[1,2,3].
In urban areas, a significant increment of vehicles often leads to challenges like traffic congestions. The congested network result on lack of eco-friendly, safe and reliable transportations. The effective congestion management method reduces the possibilities of accidents. Congestion is currently widely regarded as one of the world's most serious issues. Because of the growing number of modes of transportation and the current low-quality road infrastructure, traffic problems predicted to become substantially more widespread. Congestion is caused by a variety of circumstances, including rush hour, road construction, accidents, and even adverse weather. All of these causes, as well as a slew of others, can contribute to traffic congestion. Drivers who are unaware of the problem eventually join it, exacerbating the problem. The more severe the congestion, the longer it will take to clear once the source of the blockage removed. Knowing the traffic conditions on the road ahead of time will allow a driver to seek alternate routes, saving time and money. When a large number of drivers have this capability, traffic congestion will be less severe, with only the vehicles in the congestion region affected.
In computing, fuzzy – logic is a form of many – valued logic that deals with reasoning that is approximate. Unlike binary logic, fuzzy logic allows various degree of truth. This makes the fuzzy based system to deal with uncertainty. In fuzzy systems, a set of linguistic rules are used to express the input-output relationship. Designing fuzzy rules for congestion control using fuzzy logic involves establishing the relationship between the inputs (load metrics) and outputs (control actions). Fuzzy logic is a popular approach for congestion control in VANETs due to its ability to handle the uncertainty and imprecision inherent in VANET environments. Fuzzy logic-based solutions can make intelligent decisions about channel access, transmission rates, and other congestion control parameters without requiring precise mathematical models[4,5,6,7]. Thus, this research focuses on proposing a load-aware congestion control mechanism for VANETs using fuzzy logic. The mechanism aims to dynamically adapt the network's congestion control parameters based on the current traffic load and network conditions, thus improving the overall network performance.
Contribution of the Research
- ▪
- Design an algorithm based on the load on the network using fuzzy logics and determine non congested road segments.
- ▪
- Improve the traffic congestion through route suggestions between neighbors RSU.
- ▪
- The proposed scheme requires the neighbor RSU to reply with congestion route index to gain the road segment status.
2. Related Works
The increasing quantity of cars on the streets is leading to issues with traffic. To enable a seamless traffic movement, vehicles were under constant surveillance. Smart traffic solutions will be implemented to identify vehicular accidents and mitigate traffic congestions. Numerous technologies are employed to avert traffic accidents. The authors on[7]proposed fuzzy approach on congestion control on VANET. Their approach in general used fuzzy sets based on metaheuristics optimization-based routing (MOR) communication for VANET. As fuzzy input traveling speed, link quality, trust factor, inter-vehicle distance to get fuzzy output. To test validity of their work, they use MATLAB tool. Based on simulation they improved the performance of the Internet of vehicle. However, the system selects a cluster head vehicle as a forwarder node, these creates a communication overhead on the vehicle itself.
The authors on[8] introduce a V2V routing protocol by incorporating fuzzy logic and reinforcement learning mainly the use Q-Learning method. The fuzzy logic applied to choose cluster heads and Q-Learning to select the effective route. The fuzzy input derived from node centrality, node mobility and bandwidth efficiency as variable. The authors used NS2 network simulation tool to test their algorithm in terms of end-to-end delay, routing overhead, packet delivery. However, the algorithm does not consider further traffic conditions as its computation method based on the current travel time at road segments and the number of queue length on the road.
The authors on [4] proposed secured routing using fuzzy logic in VANET against sinkhole attack and Sybil attack. Their goal is to forward large data by using TDMA and multi trading. The use of TDMA channel used to divide original data in to frames. For route selection, fuzzy logic is used. To secure the routing cypher text encryption used. For simulation, OMNet++ and SUMO tool used based on end-to-end delay, throughput, and traffic collusion performance metrics. However, forwarding large volume of data and authentication scheme increase the computational overhead on the network.
The authors on [9] proposed a fuzzy logic based congestion estimation monitoring system for VANET. The author used image processing based on KNN classifier to identify the congestion of the vehicular network. Using fuzzy logic and KNN classifier the vehicle grouped according to light, moderate, and heavy congestion to make congestion. Their algorithm tested using MATLAB tool to check the validity of the work. They show clearly the integration of image processing with fuzzy logic on VANET. However, other network performance indicators are remaining unconsidered on the paper.
The authors on[10] proposed a fuzzy logic based routing protocol for vehicular network. This study focused on route selection, the source node gathers information as fuzzy input sets from lifespan, range, orientation and selects the finest vehicle along the routing path. The authors on[11] proposed Greedy Traffic Routing Protocol (GTARP) for VANETs is designed to enhance routing efficiency by considering traffic conditions and the dynamics nature of vehicular environment. The protocol uses greedy approach, where each vehicles forward packets to the neighbor that is closest to the destination. However, the dynamic nature of vehicle makes difficult to maintain stable routes. There is also a data overhead increases results to manage routing effectively.
A Traffic Density - Based Congestion Control (TDCCA) Method for VANETs [12] method presents a vehicle ID-based congestion aware message (CAM) for beacon signals on the vehicle environment. However, the algorithm does not consider further traffic conditions as its computation method is based on the current travel time at road segments and the number of queue length on the road. The impacted car, which is involved in the traffic accident, sends the warning message to the other forwarder vehicle and RSU to alert them of the current situation of the lane in Vehicle to Infrastructure (V2I) communication. As a result, the next car on the road makes a different decision to prevent traffic congestion and accidents.
The authors [13] presents a route suggestion protocol to suggest an optimal congestion aware route in the network, taking into account both equipped and non-equipped vehicles. Simulation results showed greater performance and reduced travel time when working with internet of Vehicle (IoV) compared to traditional route suggestions protocols. With the passage of time, a surge in congestion occurs and the application of optimum throughput proves to be a more efficacious strategy in comparison to an abrupt reduction. The observed throughput exhibits constancy during non-congested time periods, but manifests variability in response to traffic volume on congested roads.
In general, the reviewed works demonstrate the effectiveness of fuzzy logic-based approaches for congestion control in VANETs. By leveraging the ability of fuzzy logic to handle uncertainty and make intelligent decisions, these solutions can adaptively manage network congestion and improve the overall performance of VANET applications.
3. Research Methodology
3.1. Load Aware Congestion Control Mechanism Using Fuzzy Logic
In this study, we propose load aware congestion control mechanism using fuzzy logic algorithm to improve traffic congestion on the VANET. We define the VANET network as a set of N= {V, R, I), where V is the set of vehicles, R is the setoff road segments, and I is a set of road intersections. We suppose that each road intersection areas deploys the Road Side Unit (RSU). Each road segment has its own length L. Thus, to get the traffic congestion condition all the components i.e., vehicles and RSU need to share all the current road conditions. This situation can improve highly degrade the network performance by balancing the load among the vehicles. For this purpose, each vehicle forward road segment information and the RSU calculates some values for itself that referred to as congestion route index. In the proposed work, we divide the overall process in to three main stages as shown on Figure 1.
The first stage is initialization for network model representation of the VANET network. We start by choosing the vehicle to Infrastructure(V2I) communication. The second stage is for congestion state representation, on the VANET not all the network is congested. Thus, to identify the network is congested or not we use the beacon busy ratio the information exchange between the vehicle and the V2I. Some information is level of service based on the speed of the vehicle, the road segment or the capacity of the road. The final stage is path determination, based on the fuzzy output the information with neighbor RSU, latter it used to suggest the road segment that have better index in the network.
3.1.1. Stage 1: Initialization
A Nearest Neighbors
In VANET communication, the vehicles direction, speed and location are unpredictable. On the road segment, the presence of high number of neighboring vehicles results to a higher congestion on the road. In our work, each RSU in the network keeps a list of all possible neighbor vehicles with in the transmission range. To compute the distance between vehicles we use a Euclidean distance to identify the neighboring vehicles. Let us suppose that if there are two vehicles V1 and V2 with in the transmission range r of the RSU as illustrated on Figure 2. These vehicles are traveling with the speed of V1 and V2 at a time t. Thus, to calculate the distance D between vehicles D (V1, V2) at location X and Y we use Eq. (1).
B Communication Model
On VANET neighboring vehicles, some vehicles are relatively placed closer than other neighbors. Such nodes can be considered as nearest neighbors (NN). Therefore, to get the physical distance we consider the received signal strength indicator (RSSI) mechanism. This RSSI mechanism uses Pathloss model Frii's free space propagation model. Because, on VANET environment, there are several causes to occur pathloss such as reflection, absorption, and deflection on the transmission medium. It has significant advantage to measure the transmission from transmitter to receiver. An RSSI-based[14] is computed to determine the neighbor nodes. The RSSI based distance computed using on Eq. (2)
Where ρidenotes the transmission power, and Giand Gj denote the antenna gains of nodes i and j, respectively. Nodes j and i are the transmitter and receiver, respectively. λ Indicates the wavelength (meter) of the transmission signal.
Each node keeps a separate set of nearest neighbors (NNs) with their estimated location and speed information. If a node has a frequent number of NNs, then it means that the node has less opportunity to become a forwarder of other nodes. Nodes with a fewer number of NNs are vital and can perform more than others can.
Every node maintains an individual collection of nearby nodes that have been marked as nearest neighbors along with their approximate positions. If a node consistently has a significant number of connectivity neighbors, this implies that other nodes have fewer chances of selecting the mentioned node as a forwarder.
3.1.2. Stage 2: Congestion State Representation
A Beacon Busy Ratio (BBR)
Since, the nature of vehicular network channel is dynamically which affected by the temporal arrival time of the vehicles on the road segment. To identify the congestion state, we used a Load Beacon Busy Ratio (BBR) scheme for detection of congestion level on the network extracted from vehicles. In VANET, vehicles communicate with in the area they use beaconing. The authors on [15]described beaconing as “the process of periodically and locally broadcasting status information is a key communication pattern in vehicular ad hoc networks. The authors on[16]noted, “Beaconing is one of the most important communication modes, which is used to advertise the presence of a car to its neighbor cars. The authors on [15] investigate the impact of send messages to vehicle to keep them aware and found that sending directly with single-hop to each other works better and faster than sending through multiple vehicle i.e. multi-hop. The BBR defined by the following Eq. (3):
Where M(V) is the message received from neighbor vehicles arrived at the RSU and Channel Capacity is the total link capacity for the queue in the congested network. The RSU computes the BBR of the congested queue value derived from available vehicles that have in communication with the RSU. Once the value of the current state of the road segment extracted from BBR we then can define the minimum and maximum congestion threshold. This help as later as an input for fuzzification step.
Since our work focus in vehicular communication, for maximum channel capacity we use a data rate range between 3 to 12 Mbps. The VANET commonly confront congestion due to road traffic over-burden on links beyond their capacity. On VANET, the acceptable maximum data rate as stated on [6] for a vehicle can move with a speed of up to 80km/h. By using these values, the BBR value lies in between 0.2 and 0.6. The BBR value as it become in between 0.2-0.43 it means the road segment has “Good” congestion state, if it is between 0.43-0.6 the road segment as “acceptable” congestion state and if it is greater than 0.6 the road segment has “Poor” congestion state.
B Vehicle Speed
The VSratio used to identify the ratio of the total delay on a vehicle on the congested road and the total time of the vehicle, that derived from Eq. (4).
Where DT is total travel distance of vehicle i on the road segment and TS is total time spent by vehicle i on the road segment. Based on the result obtain from VSratio we can identify the level of the serve of the road segment on the current time.
C Road Segment Capacity
The RSratio used to calculate the traffic link or capacity during maximum flow condition at peak hour of the road by using Eq. (5).
For RSU to suggest the most non-congested path towards the destination based on the CRI value through the control packet by broadcasting the CRI value to RSU. This process done when the suggestion level path the capacity of the road, then the RSU calculates the CR value later it used to share or exchange in between neighbor RSU.
3.1.3. Stage 3: Fuzzy Logic Based Congestion Controller
In the fuzzy logic-based algorithm, during the RSU receive a message from vehicles, it proceeds to analyze the state of network congestion using fuzzy input load metrics. In our context, a fixed threshold value used, to detect that the network is experiencing congestion beyond the defined threshold. We utilize the fuzzy inference mechanism to evaluate the real-time performance of road status whether it is congested or not. This fuzzy inference system consists of three steps: Fuzzification, Fuzzy inference and Defuzzification. In the First step, each RSU converts its own input value in to a membership degree of fuzzy set in this work; we use a triangular membership function to convert the input in to fuzzy value. In the second step, each RSU performs fuzzy inference based on a set of If-Then rule using the membership degree obtained in the fuzzification step. The last step is defuzzification, in which the result of fuzzy inference is converted into crisp value we employ a Congestion Threshold (CT) method for all fuzzy logic controllers in this work. This module called on every encounter between each pair of vehicles and RSU to learn best route for the vehicle.
Figure 3.
Fuzzy logic-based controller.
A Fuzzification
On this fuzzification process, choosing fuzzy rules for congestion control involves establishing good relationship between the inputs (load metrics) and outputs (control actions). As an input relevant load metrics that will serve as inputs to the fuzzy logic controller is Beacon Busy Ratio (BBR), Level of Service (LOS), and Road Segment Capacity (RSc). The selection of fuzzy sets highly dependent on the specific context and requirements of the congestion control problem in vehicular ad hoc networks. It is essential to strike a balance between simplicity and expressiveness to ensure that the fuzzy logic controller can effectively capture the nuances of congestion control. Based on the load metrics, traffic density described by terms such as "Good," "Acceptable," and "Poor."
B Base Rule
After fuzzification, we need to determine the method for combining the fuzzy rules to make a control decision. These methods use fuzzy reasoning to aggregate the rule outputs and produce a crisp control action. Thus, we implement the fuzzy rules in a rule base within the fuzzy logic controller. The rule base consists of the defined linguistic terms, antecedents, consequents, and weights. During runtime, the input values evaluated against the fuzzy rules to determine the appropriate control action. For each fuzzy input sets, we mapped total 9 rules in IF THEN conditional statement. Table 1. emphasis the complete set of base rules that used the three input fuzzy variables and one out numerical variable. That numerical variable represents the congestion Threshold (CT) of the road at time t.
C Defuzzification
Defuzzification process converts the aggregated fuzzy outputs into crisp control actions. This process involves summarizing the fuzzy outputs and selecting a representative value that corresponds to the desired control action. During defuzzification, it is better to specify the control actions that the fuzzy logic controller will take based on the inputs. On these actions by using crisp output congestion notification triggered. As crisp output, we use congestion threshold (CT).
D Congestion Threshold (CT)
The CT value derived from the BBR, Los and RSc mapped input variable by using maximum value of the state. For example, on Rule 1 there is “Good”, “Good”, “Good” it represents the value 0.3, 0.1, and 0.5 respectively, then the CT value lies in between 0.1 and 0.63 thus the result indicates the road shows good congestion threshold value. Similarly, if we then take Rule 5 by sum up the numerical value again, we dividend by 3 we get the CT value between 0.63 and 1.5 it indicates the road congestion has acceptable congestion rate. Finally, by Rule 9 the result of CT value lies in between 1.5 and 2.4, which has poor congestion state. For CT value, as demonstrated on Eq. (7)
Figure 4.
Proposed congestion control using fuzzy logic Flowchart.
Algorithm 1: Proposed Method Algorithm
Input: Beacon Busy Ratio (BBR), Level of Service (Los), Road Segment (RSc)
Output: Congestion Threshold
1. procedure void proposed Method (BBR, Los, RSc)
2. Vehicle forward current status of the road
3. RSU receive computing parameter from vehicle
4. while (Vehicle in RSid)
5. RSU calculates BBR, Los, RSc based on Eq. (3), (4), (5)
6. [CT, Status] =fuzzy_logic_method (BBR, LOS, RSc) //Apply Fuzzy Logic Controller
7. if CT≥0.1 and CT≤0.63 then //Maximum threshold based on Eq. (7)
8. Road is not Congested
9. RSU periodically update road status
10. else if CT>0.63 and CT<1 then
11. Road has Acceptable Congestion Status
12. RSU periodically update road status
13. else
14. Road is Congested
15. Update (Route ← RSUid, status, CT)
16. end if
17. end while
18. end procedure
3.1.4. Stage 4: Path Determination
Once on the congestion level, the CRI is initiated using the vehicle traffic data, route suggestion step began s to calculate an optimal route. Ideal route suggestion is refreshed at each intersection, taking into account the data provided by the RSU. We also consider how busy the roads are and try to choose routes with less traffic to avoid being stuck. RSU and receive new information from a central location and can share their own information with other RSU nearby. The congestion in the VANET identified by utilizing the communication channel condition. The traffic load in the channel estimated, and if the level reached based on the threshold, the traffic congestion identified; consequently, the congestion condition is forward to the nearby vehicles to alert them about the traffic congestion. If traffic congestion threshold state is detected using the fuzzy set, then the RSU forward the path determination packets to the vehicles.
Figure 5.
Path determination flowchart.
Each vehicle on the road periodically sends a message to their nearby RSU and updates the road segment information at time t. Each RSU keeps its associated road segments information in route suggestion table. The RSU exchanges the CT information with other RSUs and sends the road segment information to the data center as well. Congestion Suggestion Table (CST) includes the optimal route from an origin to destination considering the travel time and route congestion. The congestion information exchanging between RSU has the following steps.
- RSU gather road information from the vehicles on the road segment. Based on our assumption each road intersection deployed with special RSU to gather information and based on the information RSU calculates the CT value.
- RSU send request to neighbor RSU. The RSU forward its CT value with additional information. The RSU ID, Road Segment ID (RSid), and CT.
〈𝑅𝑆𝑈𝑖𝑑, 𝑅𝑆𝑖𝑑, 𝐶𝑇〉
- 3.
- RSU receive an information from neighbors RSU and suggest route path discovery. After the RSU received reply from neighbor RSU about road segment information, it suggests the vehicle that have less congested road segment towards to vehicle destination.
- 4.
- Then the RSU Update current congestion status of the road segment
Algorithm 2: Path Determination Method Algorithm
Input: CT, Road Segment (RSid), RSUid
Output: Route Path
1. RSU broadcast < RSUid, RSid, CT>
2. for each neighbor RSUid compare CRI value do
3. if the CT has “Good” OR “Acceptable” state then
4. if road segment is destination, then
5. break; //vehicle reach destination
6. else
7. Road Segment with good CT value is suggested for the route
8. UPDATE current_status(CT, RSid)
9. end if
10. else
11. Road Segment with good CT value is Not suggested for the route
12. UPDATE RSU information
13. end if
14. end for
15. end procedure
3.2. Experimental Setup
3.2.1. Simulation Tool
For conducting the simulation, choose the popular simulator Network Simulator-3 (NS-3) is used, as the simulator of the proposed protocols and a Simulation of Urban MObility (SUMO) simulator[17].
Figure 6.
General procedures applied during simulation using SUMO and NS3.
The proposed protocol performance is compared with the existing routing algorithms based on the simulation parameters listed in Table 2.
4. Result Analysis and Discussion
In this section, we discussed the result of the load-aware congestion control for VANETs using fuzzy logics analyzed and discussed in terms of packet delivery ratio, throughput and end-to-end delay. To compare the proposed method effectiveness based on performance evaluation metrics, we us T2FSC-MOR[7] and GTARP[11] protocols. The first T2FSC-MOR is fuzzy based approach on congestion control on VANET. Their approach in general used fuzzy sets based on metaheuristics optimization-based routing (MOR) communication for VANET. Moreover, GTARP is a non-fuzzy based approach designed for VANETs to enhance routing efficiency by considering traffic conditions and the dynamics nature of vehicular environment. The reason of selecting these two different protocols is it makes as to compare our work in broad.
A Packet Delivery Ratio
In our experimental result, the packet delivery ratio performance of the system as shown on as shown on Figure 7. The plot shows the proposed method demonstrated a significant improvement in PDR compared to T2FSC-MOR mechanisms in VANETs. The numerical value for the proposed scheme has 95% PDR value when density is lower congested area. Whereas the T2FSC-MOR shows 92% PDR and GTARP shows 85% value. Therefore, our proposed method has achieved better performance in terms of PDR under the congested network. The dynamics adjustment of transmission rates our approach effective optimized network resources leading to higher proportion of successfully deliver packets.
B Throughput
From the simulation result, the average throughput results of our scheme result 110 Kbps. Whereas in T2FSC-MOR, 98 Kbps throughput and GTARP, 64 Kbps reached as depicted in Figure 8. The simulation result shows that the more the number of nodes increases, the more the data delivery rate also increased on each scheme. Here, each scheme shows less significant difference, under low density of nodes. However, when the number of vehicles increases, the proposed scheme has good performance. The throughput analysis revealed that the proposed method results more efficient utilization of network resources and improved data delivery rates.
C Average Latency
In the simulation scenario, we compare and analyze the end-to-end delay of each fuzzy based algorithm in different node density environments. Figure 9., represents the latency of each scheme; the simulation result shows each scheme shows less significant difference. Meanwhile, if we get the end-to-end delay in terms 100 vehicles, proposed method outperforms better average latency of 1930 ms than T2FSC-MOR (2570 ms) and GTARP (2600 ms) protocol. The end-to-end analysis indicate that our method efficiently minimized packet travel time from the source to destination.
5. Conclusion
In conclusion, this work offers a traffic load aware congestion control mechanism based fuzzy logic approach on VANETs. It uses fuzzy logic to looks at how to put information together to control traffic congestion. Based on fuzzy input, it suggested a method that uses a beacon busy ratio to improving the congestion on the road. The result of our method demonstrated an effectiveness of the proposed approach in improving PDR, throughput and end-to-end delay. By considering traffic load dynamically adjust network parameters, the fuzzy logic-based scheme successfully addressed the congestion issue in VANETs. It showed that our algorithm has a good fit with the way data collected and arranged. To validate the proposed algorithm, a set of experiments were conducted to determine effectiveness of proposed routing algorithm based up on three simulation scenarios using NS-3 simulator and SUMO network. The proposed work load aware congestion control mechanism based fuzzy logic approach on VANETs compared to T2FSC-MOR and GTARP algorithms based on packet delivery ratio, Throughput, and end-to-end. The simulation result shows that our proposed system improves the Packet Delivery Ratio to 95%, Throughput to 110 kbps, and end-to-end delay to 1930 ms. Therefore, based on the simulation result we observe that, the proposed method shows better performance.
References
- Ragab, A.R. “A new classification for ad-hoc network,” Int. J. Interact. Mob. Technol., vol. 14, no. 14, pp. 214–223, 2020. [CrossRef]
- Barskar, R. “Vehicular Ad hoc Networks and its Applications in Diversified Fields,” vol. 123, no. 10, pp. 7–11, 2015.
- Lingala, T.; Galipelli, A.; Thanneru, M. “Traffic Congestion Control through Vehicle-to-Vehicle and Vehicle to Infrastructure Communication,” vol. 5, no. 4, pp. 5081–5084, 2014.
- Stalin, J.; Rajesh, R.S. “Fuzzy Logic Based Secured Routing In Vanets Fuzzy Logic Based Secured Routing In Vanets,” vol. 12, no. 11, pp. 335–348, 2021.
- Singh, B.; Mishra, A.K. “Fuzzy Logic Control System and its Applications,” no. December, 2023.
- Series, C. “Fuzzy logic controller based priority model for VANET scheduling Fuzzy logic controller based priority model for VANET scheduling,” 2020. [CrossRef]
- Balaji, T.S.; Srinivasan, S.; Bharathi, S.P.; Ramesh, B. “Fuzzy-Based Secure Clustering with Routing Technique for VANETs,” 2022. [CrossRef]
- Zhang, W.L.; Yang, X.Y.; Song, Q.X.; Zhao, L. “V2V Routing in VANET Based on Fuzzy Logic and Reinforcement Learning,” 2021.
- Edve, K.; Rabe, N.T.; Arboleda, E.R.; Andilab, A.A.; Dellosa, R.M. “Fuzzy Logic Based Vehicular Congestion Estimation Monitoring System Using Image Processing and KNN Classifier,” no. August, 2019.
- B. S. Siddhartha, S. K. B. R, K. Arpitha, and S. N. Shwetha, “Routing Protocol using Fuzzy Logic for Vehicular Ad-Hoc Networks,” no. 2, pp. 4789–4794, 2019. [CrossRef]
- Mohamed, B. “An Efficient Greedy Traffic Aware Routing Scheme for Internet of Vehicles,” no. January, 2019. [CrossRef]
- Subramaniam, M.; Rambabu, C.; Chandrasekaran, G.; Kumar, N.S. “A Traffic Density-Based Congestion Control Method for VANETs,” Wirel. Commun. Mob. Comput., vol. 2022, 2022. [CrossRef]
- Ahmed, M.J.; Iqbal, S.; Awan, K.M.; Sattar, K.; Khan, Z.A.; Sherazi, H.H.R. A Congestion Aware Route Suggestion Protocol for Traffic Management in Internet of Vehicles. Arab. J. Sci. Eng. 2020, 45, 2501–2511. [Google Scholar] [CrossRef]
- Ahmad, W.; Husnain, G.; Ahmed, S.; Aadil, F.; Lim, S. Received Signal Strength-Based Localization for Vehicle Distance Estimation in Vehicular Ad Hoc Networks (VANETs). J. Sensors 2023, 2023. [Google Scholar] [CrossRef]
- Mittag, J.; Thomas, F. “HopsComparison.pdf,” no. formerly VII, pp. 69–78.
- Vinel, A.; Staehle, D.; Turlikov, A. “Study of beaconing for car-to-car communication in vehicular ad-hoc networks,” 2009.
- C. Science and S. Engineering, “Simulation of VANET Using NS-3 and SUMO,” vol. 4, no. 4, pp. 563–569, 2014.
Figure 1.
Load Aware Priority Adaptive Congestion Control using Fuzzy-Logic.
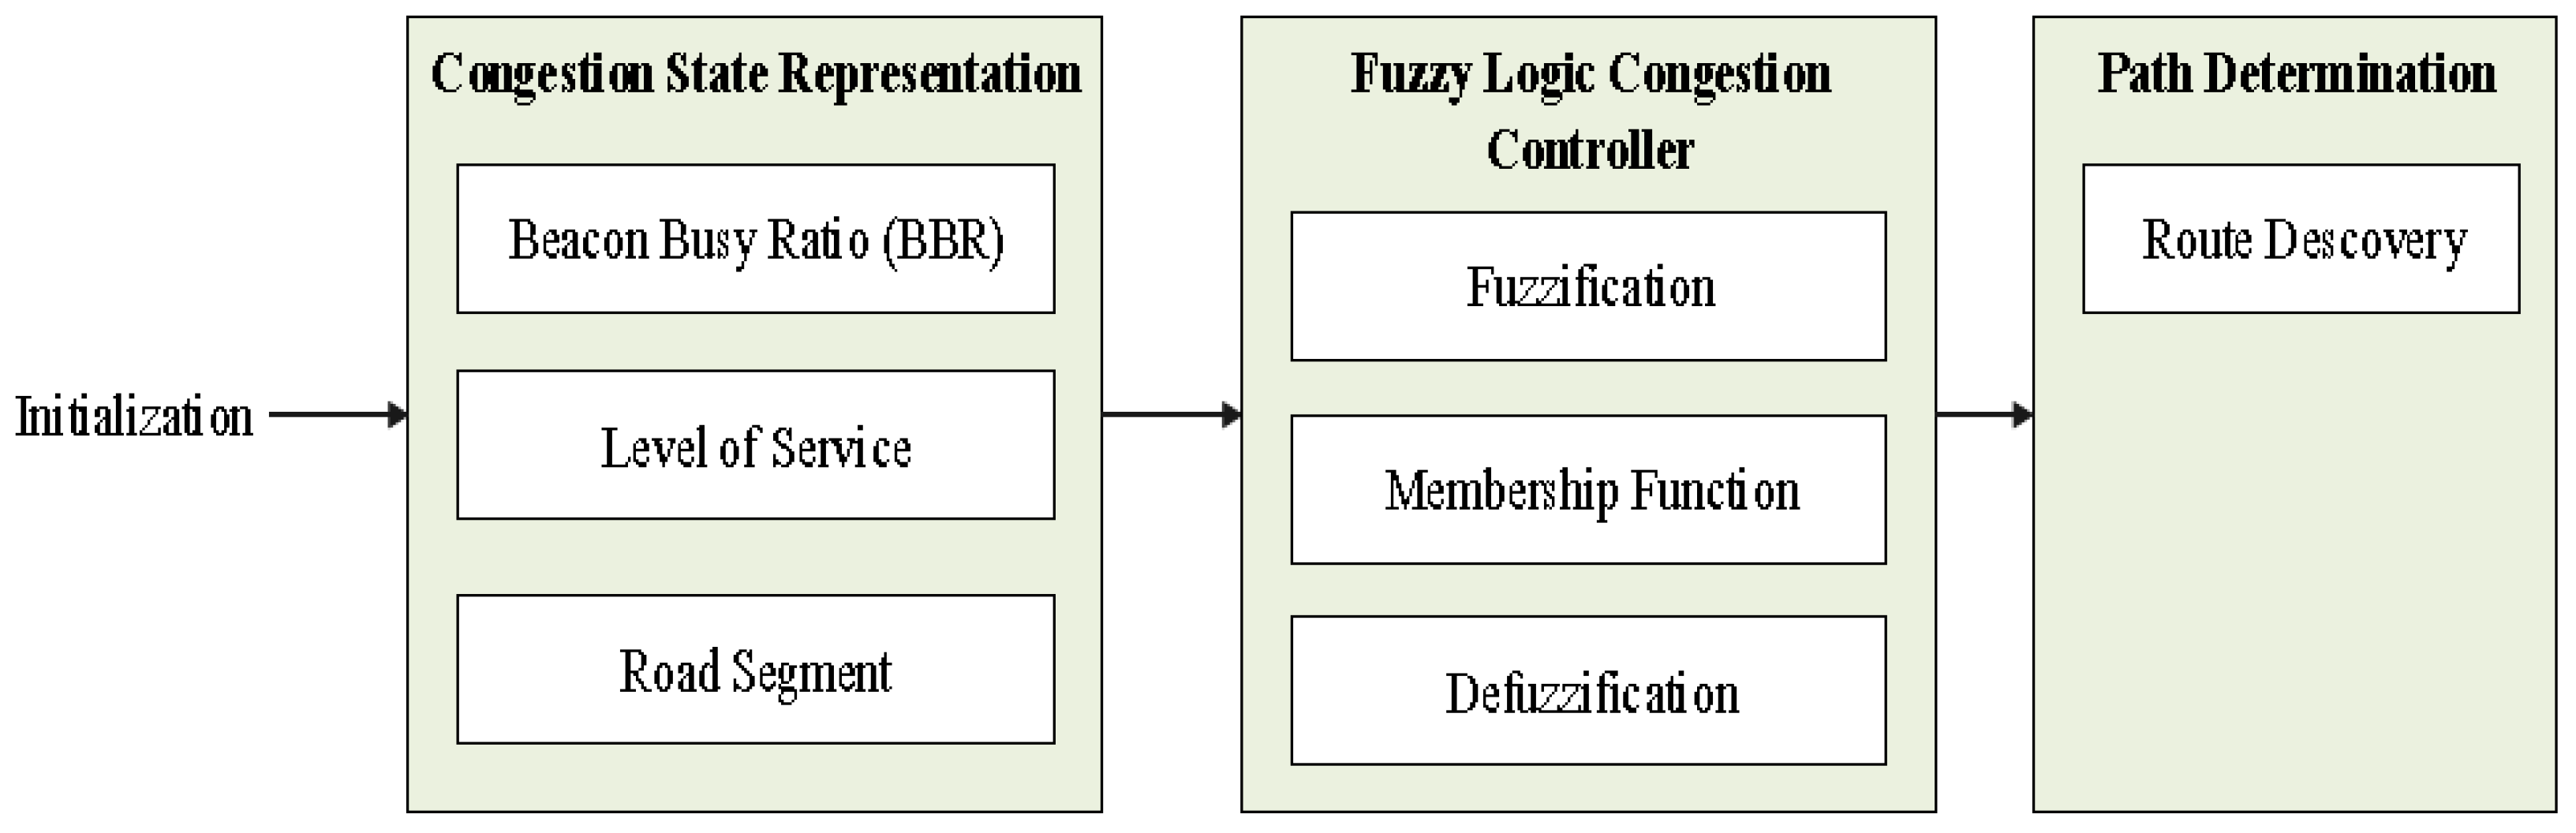
Figure 2.
Distance estimation between vehicles.
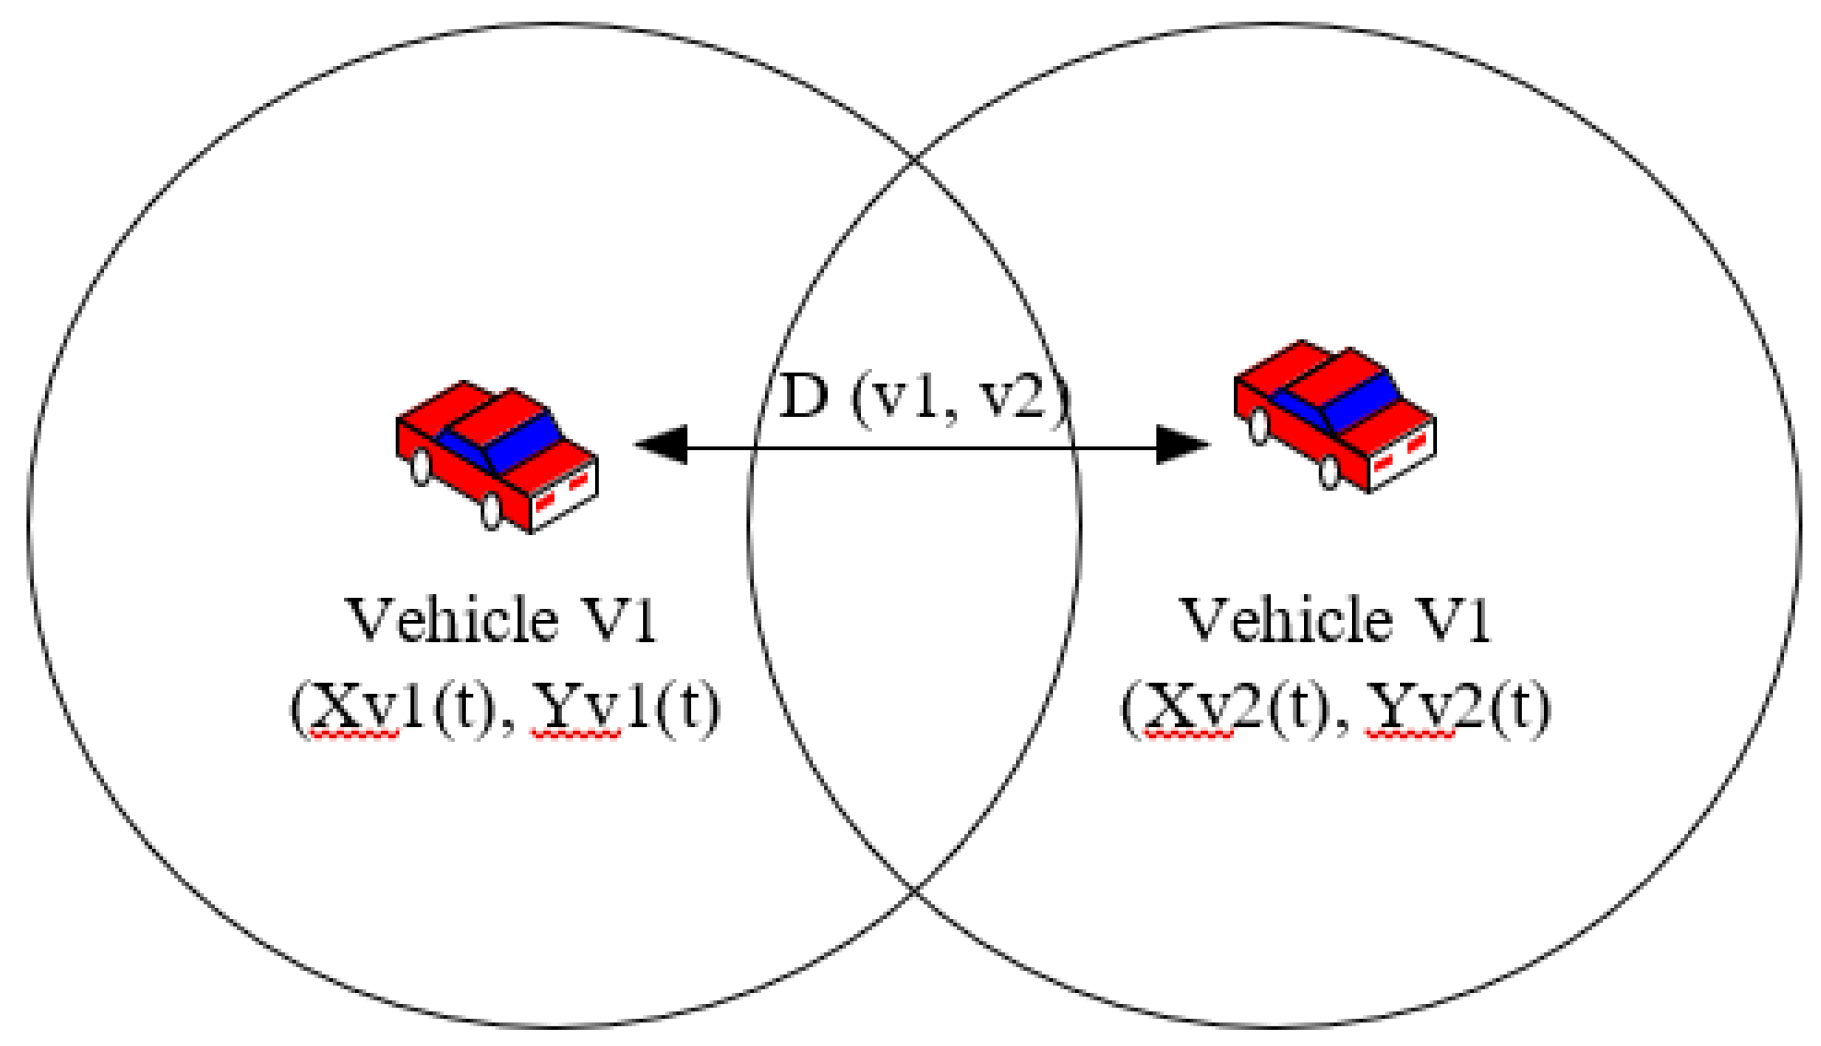
Figure 7.
Packet Delivery Ratio Vs Number of Nodes.
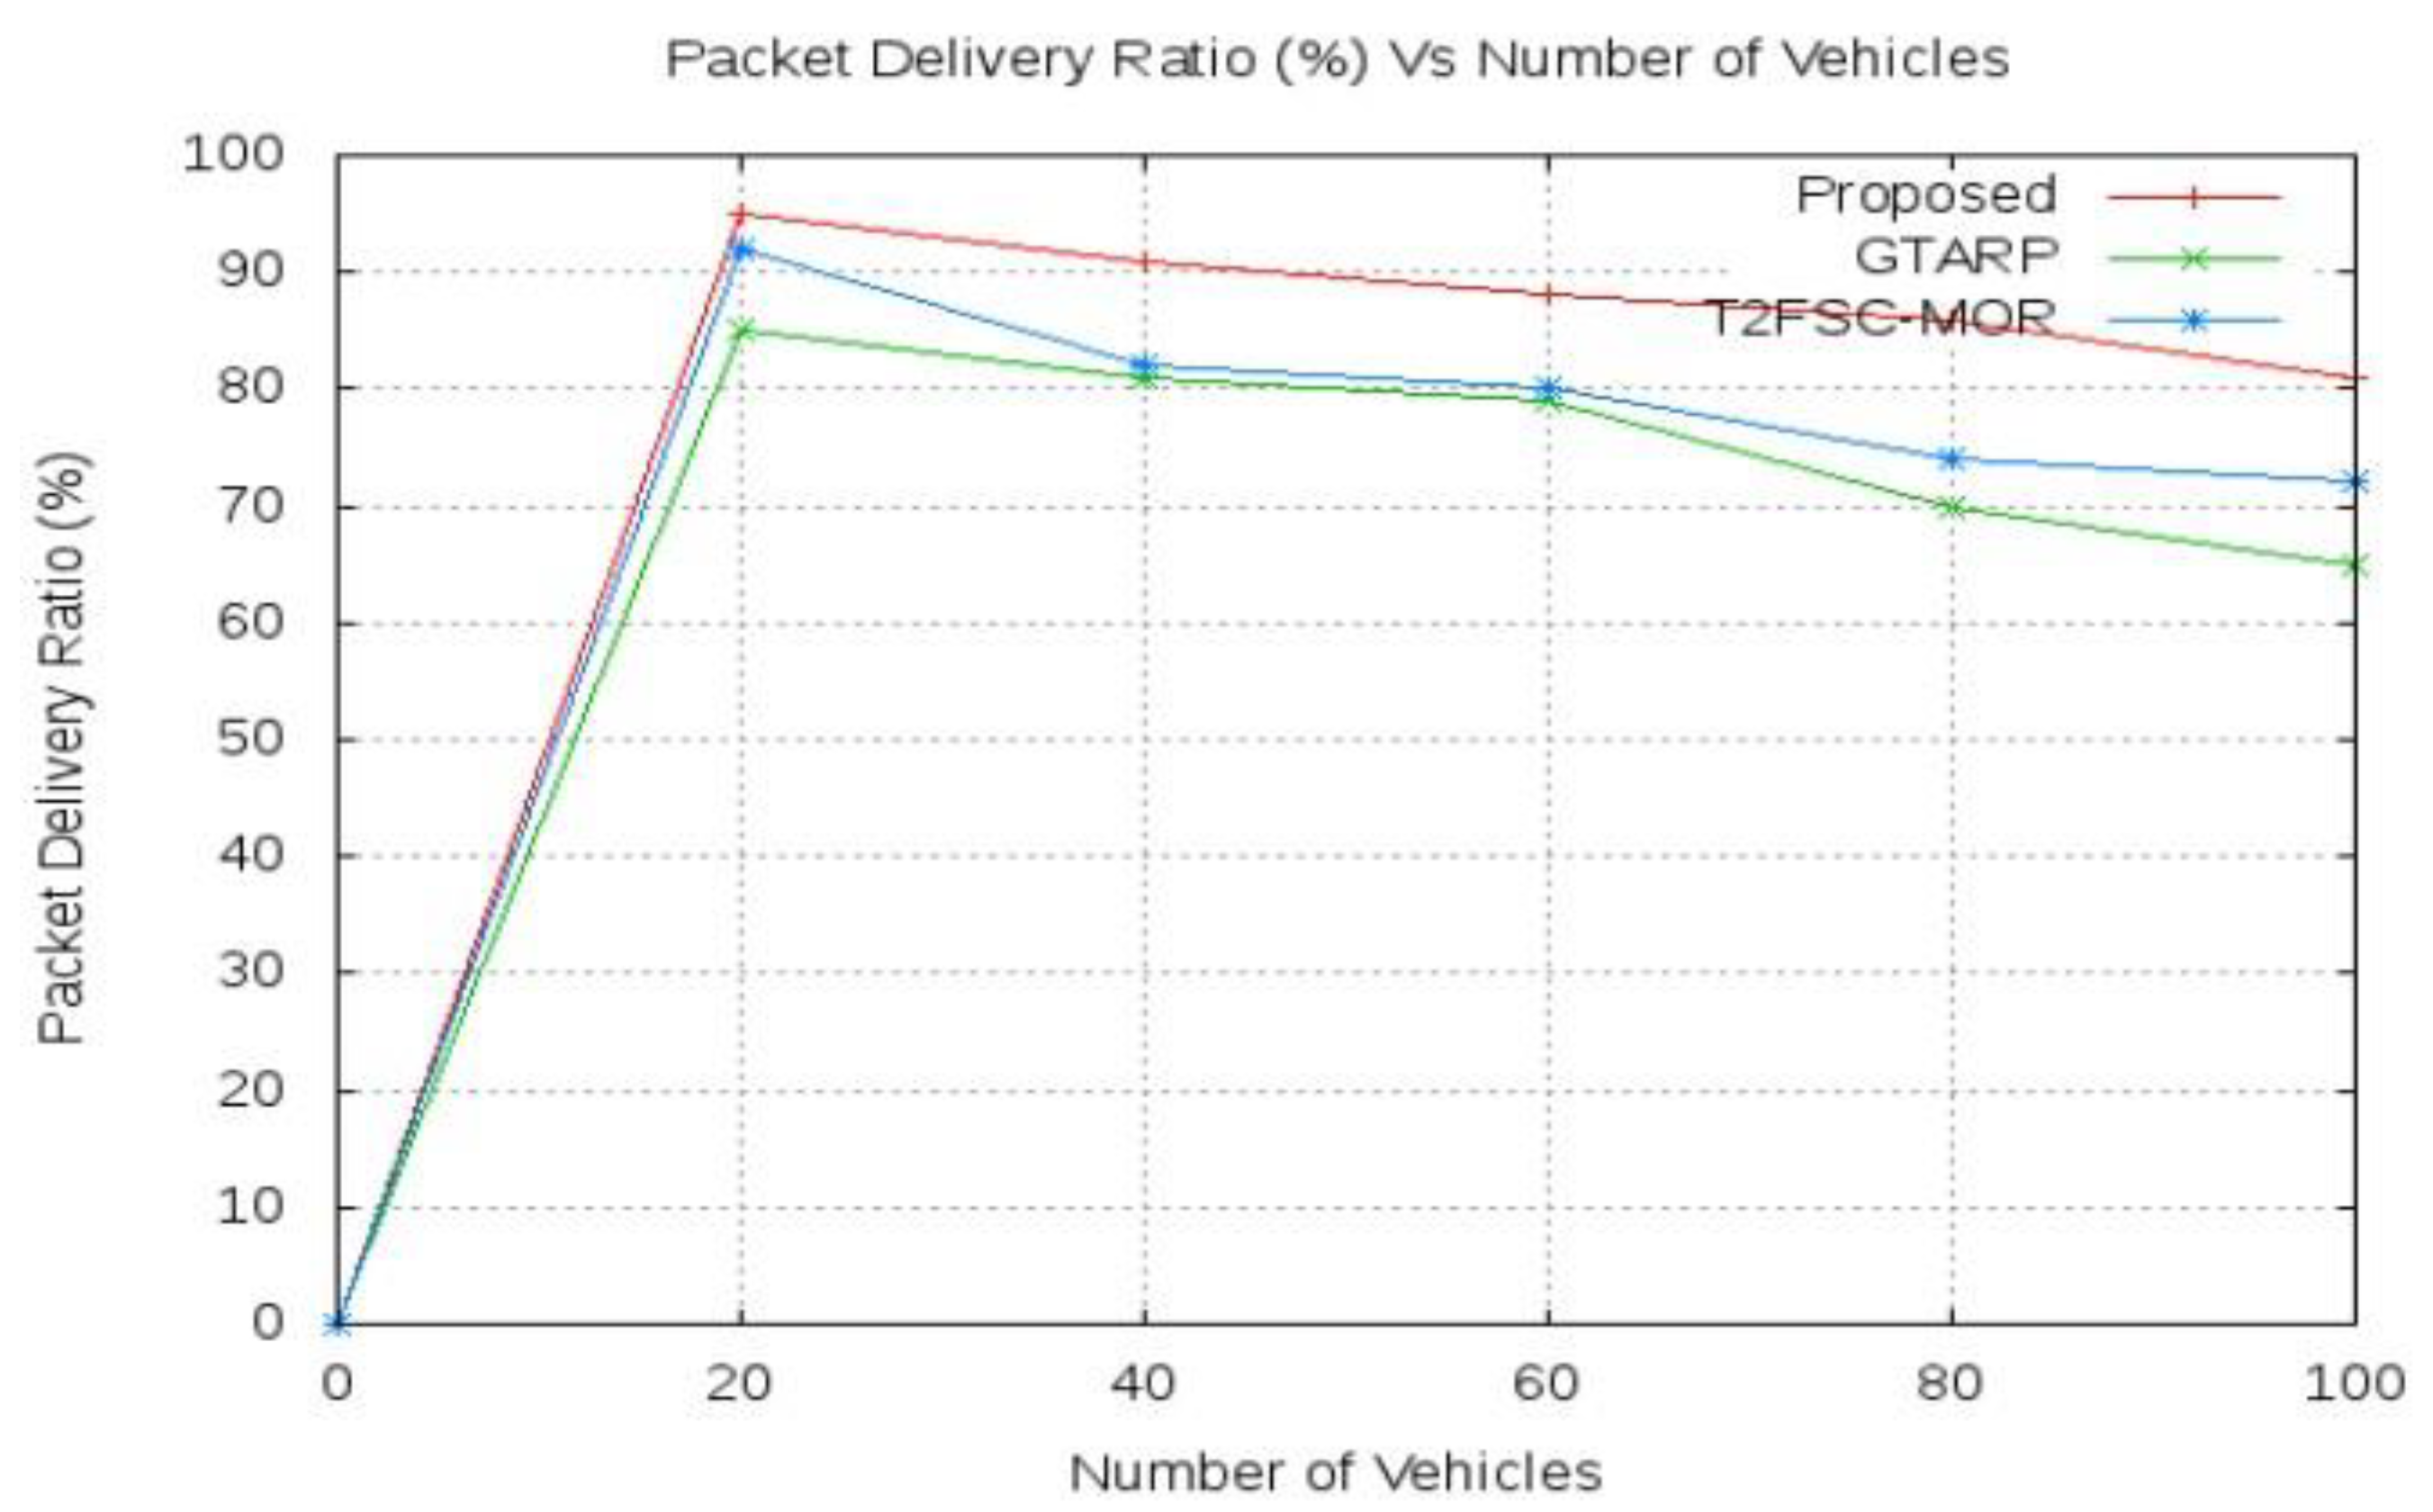
Figure 8.
Throughput Vs Number of Nodes.
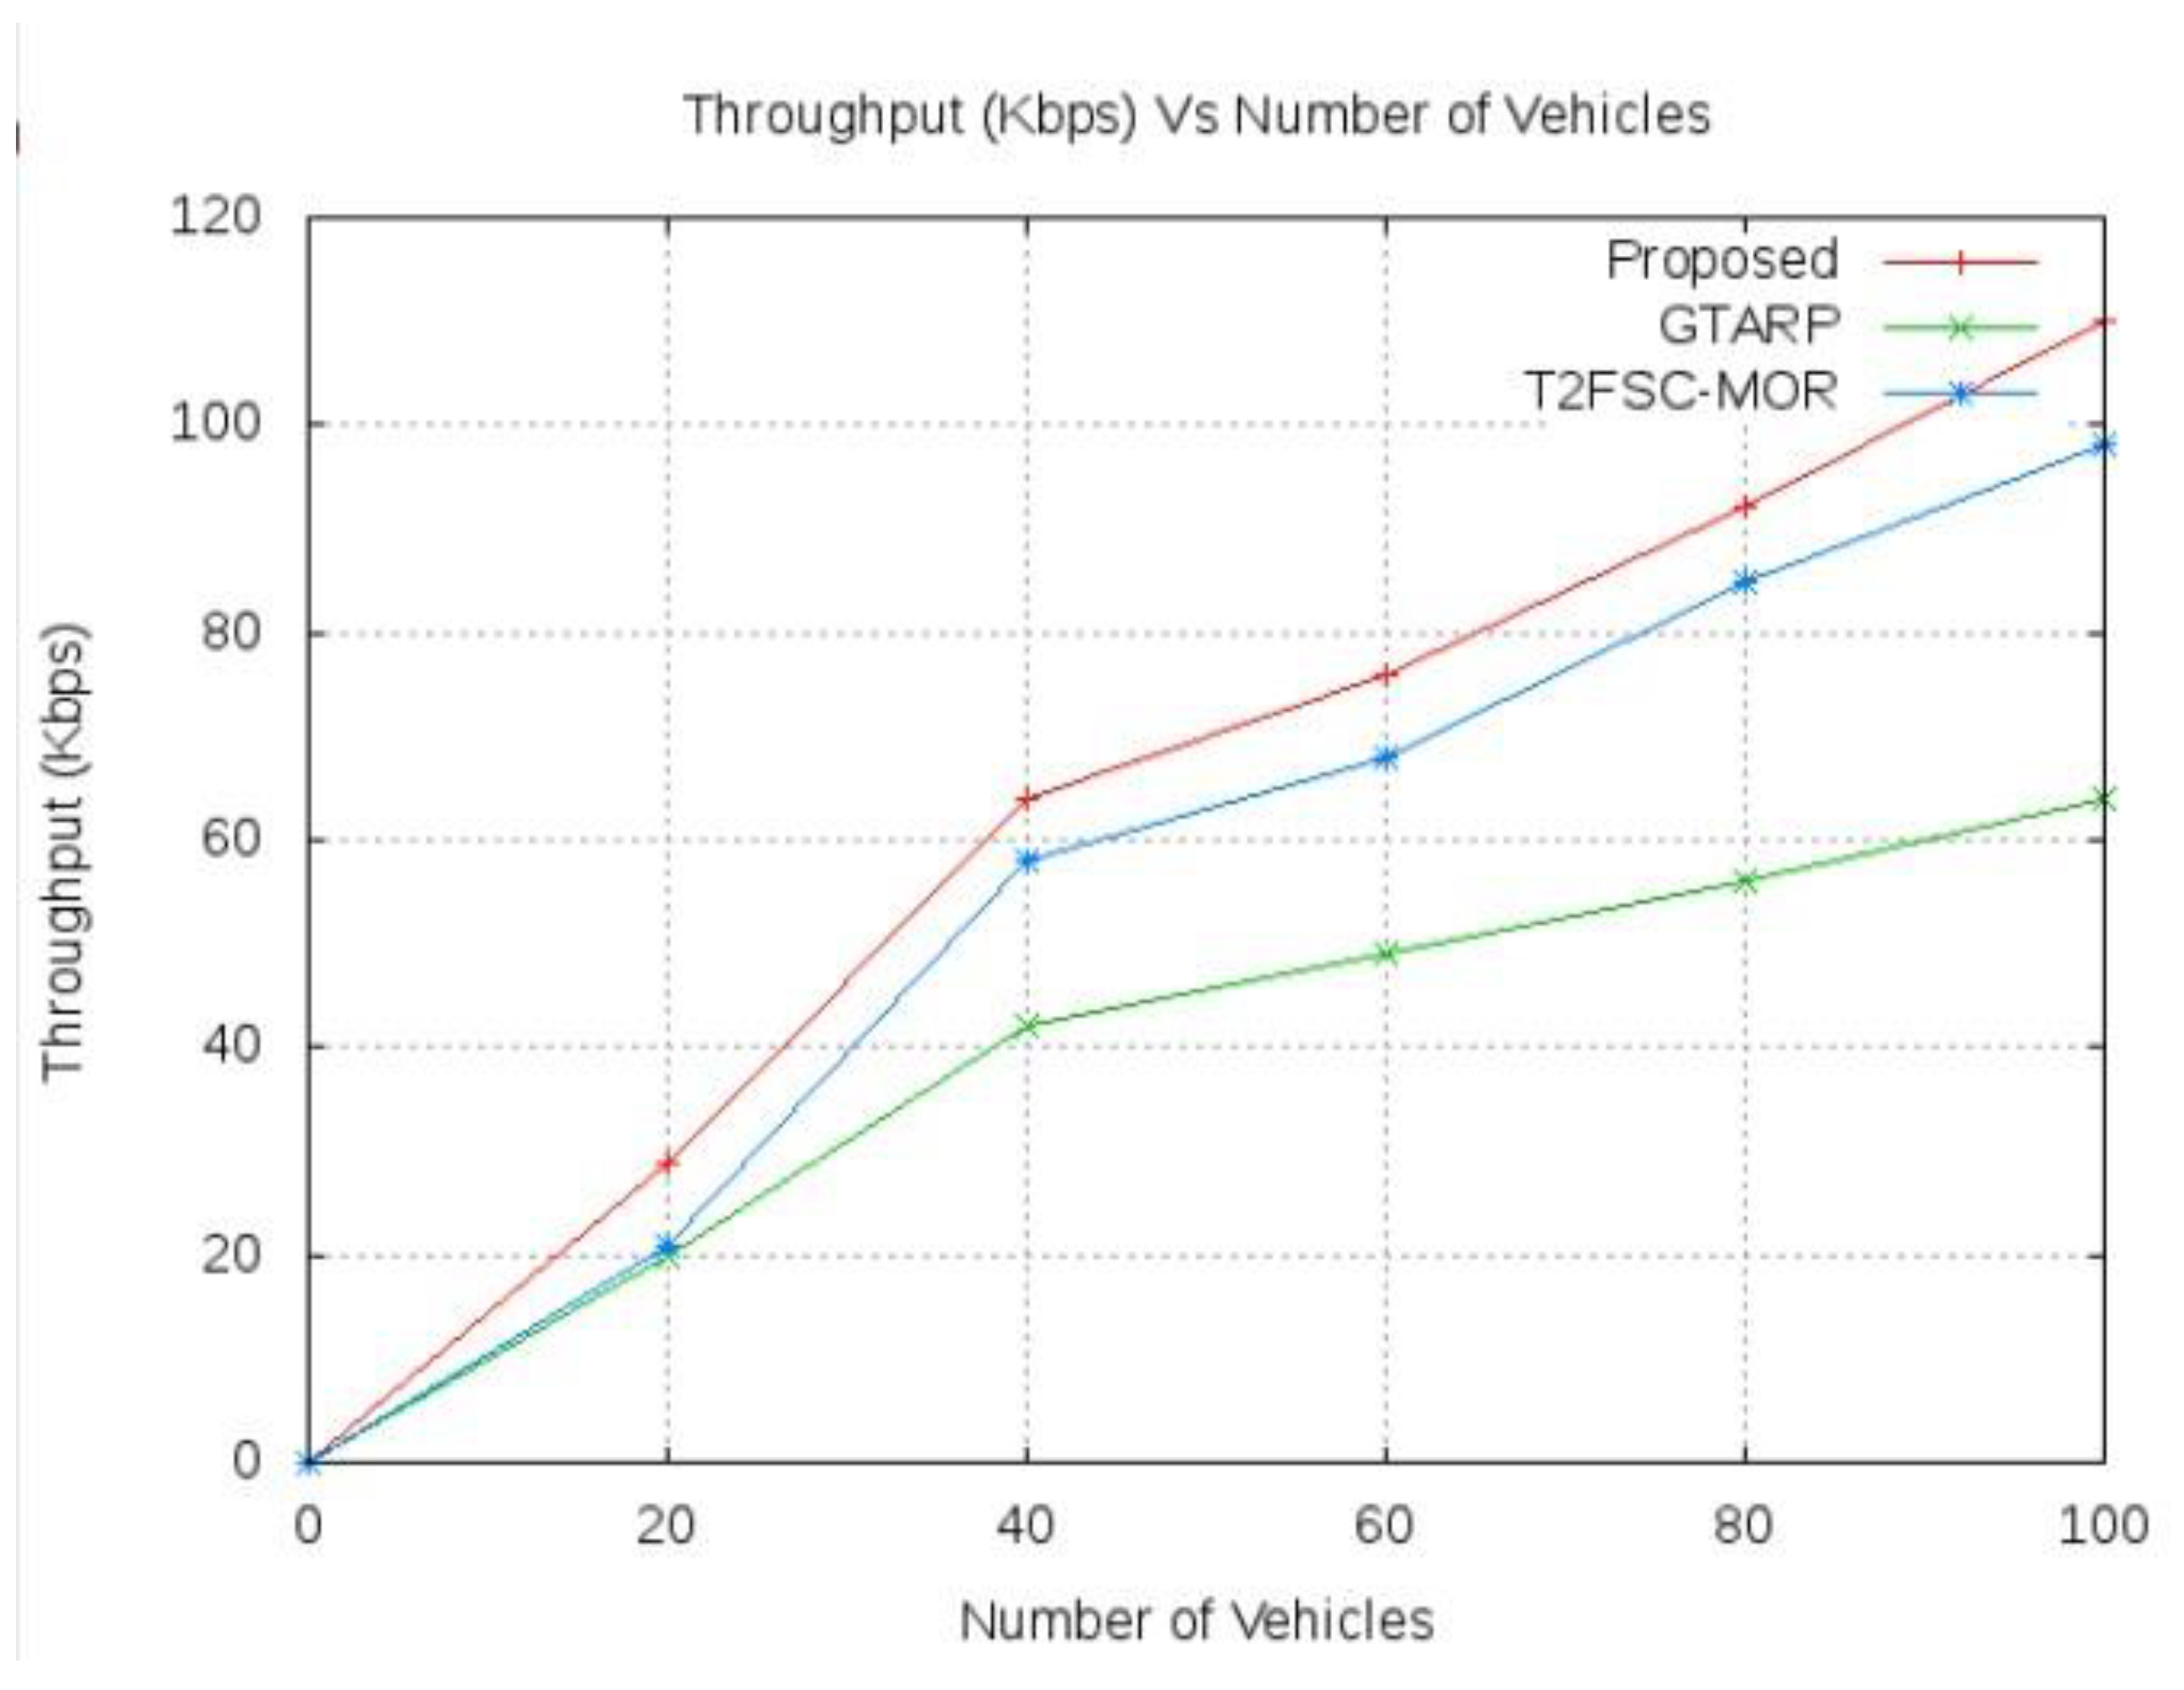
Figure 9.
Average Latency Vs Number of Nodes.
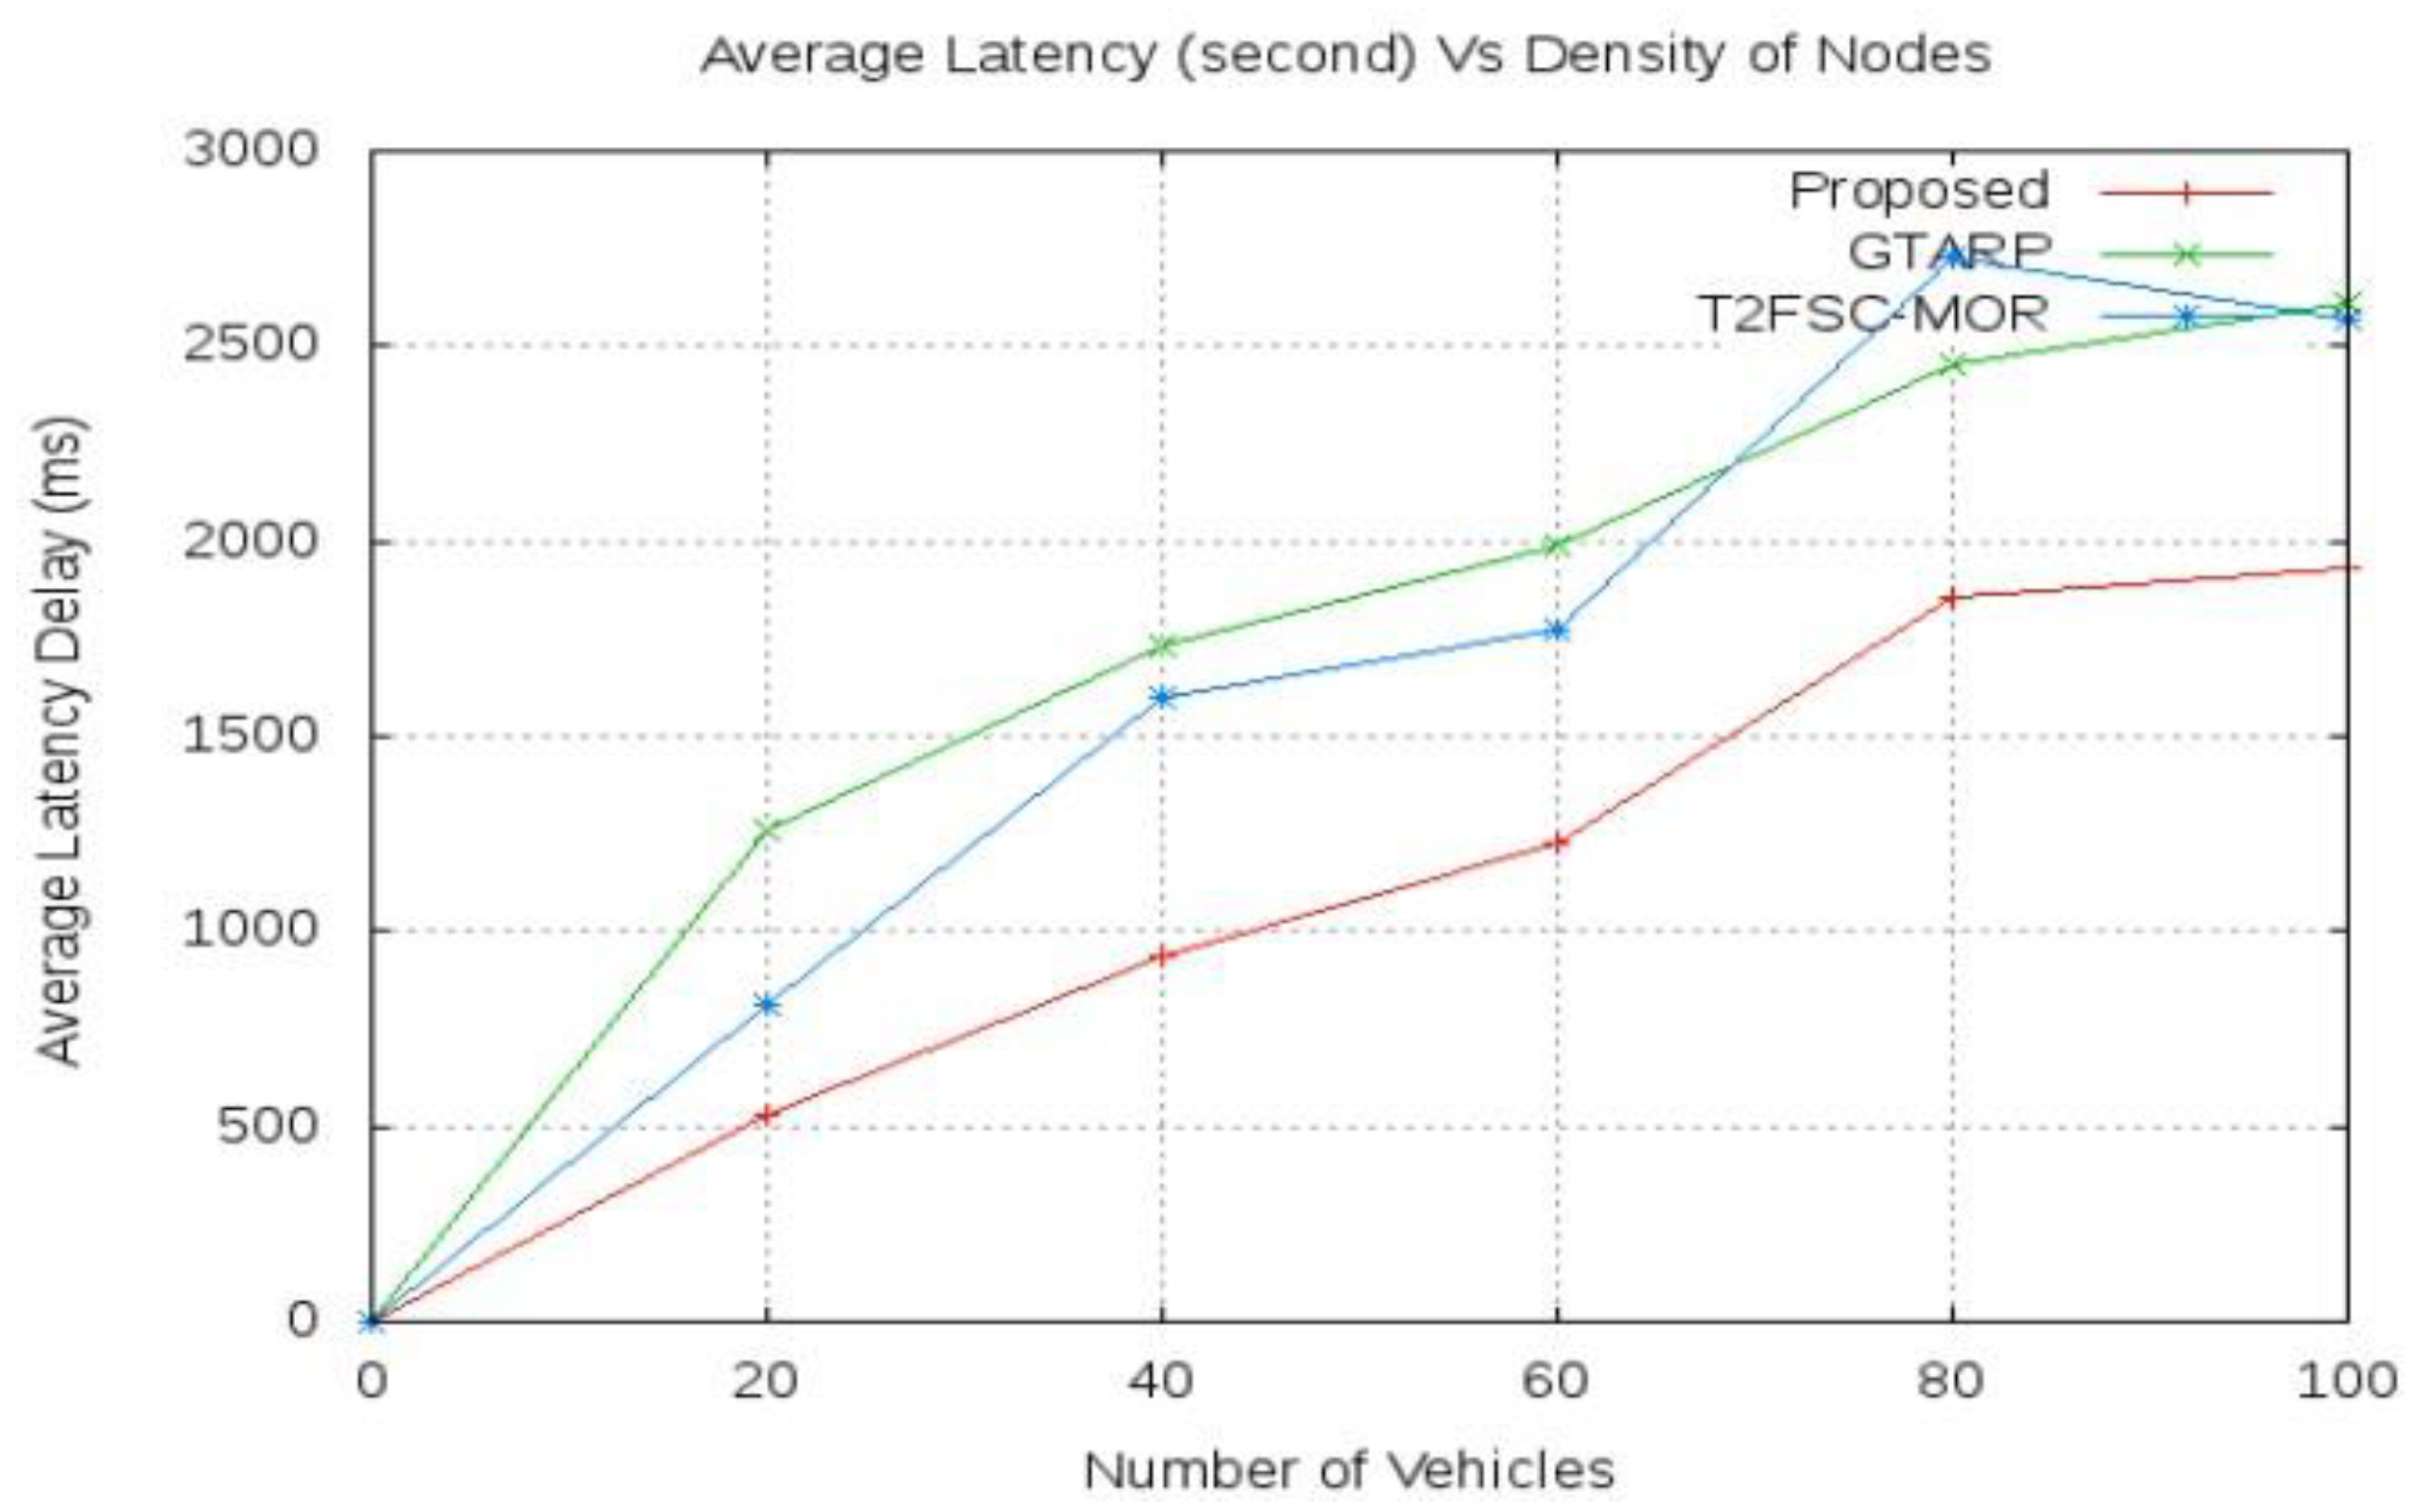

Table 1.
Fuzzy rules.
| Rule No | BBR | Los | RSc | CT |
|---|---|---|---|---|
| 1 | “Good” | “Good” | “Good” | CT ≥ 0.1 AND CT≤ 0.63 |
| 2 | “Good” | “Acceptable” | “Good” | CT > 0.63 AND CT≤ 2.4 |
| 3 | “Good” | “Poor” | “Acceptable” | CT ≥ 1.2 AND CT ≤ 2.06 |
| 4 | “Acceptable” | “Good” | “Acceptable” | CT ≥ 0.3 AND CT ≤ 0.83 |
| 5 | “Acceptable” | “Acceptable” | “Acceptable” | CT ≥ 0.63 AND CT < 1.5 |
| 6 | “Acceptable” | “Poor” | “Poor” | CT > 1.4 AND CT ≤ 2.26 |
| 7 | “Poor” | “Good” | “Good” | CT ≥ 0.3 AND CT ≤ 0.86 |
| 8 | “Poor” | “Acceptable” | “Acceptable” | CT ≥ 0.73 AND CT ≤ 1.63 |
| 9 | “Poor” | “Poor” | “Poor” | CT ≥ 1.5 AND CT ≤ 2.4 |
Table 2.
Experimental Parameters.
| Parameters | Value | Unit |
|---|---|---|
| Operating System | Ubuntu 16.04 LTS | - |
| Simulation Tool | NS3, SUMO | - |
| Area | 1 x 1 | Km2 |
| Speed of Vehicle | 50-150 | Km/h |
| Number of Lane | 2 | - |
| Number of Vehicles | 100 | - |
| Bandwidth | 75 | MHz |
| Message Size | Beaconing 3-12 | Mega byte |
| Mac Type | 802.11p | - |
| Transmission Rate | 5.850 – 5.925 | GHz |
| Routing Protocol | AODV | - |
Disclaimer/Publisher’s Note: The statements, opinions and data contained in all publications are solely those of the individual author(s) and contributor(s) and not of MDPI and/or the editor(s). MDPI and/or the editor(s) disclaim responsibility for any injury to people or property resulting from any ideas, methods, instructions or products referred to in the content. |
© 2025 by the authors. Licensee MDPI, Basel, Switzerland. This article is an open access article distributed under the terms and conditions of the Creative Commons Attribution (CC BY) license (http://creativecommons.org/licenses/by/4.0/).
Copyright: This open access article is published under a Creative Commons CC BY 4.0 license, which permit the free download, distribution, and reuse, provided that the author and preprint are cited in any reuse.


