Submitted:
14 March 2025
Posted:
17 March 2025
You are already at the latest version
Abstract
This study presents an advanced adaptive trading framework that integrates Deep Reinforcement Learning (DRL) with the Iterative Model Combining Algorithm (IMCA) to overcome the critical limitations of static ensemble methods in global portfolio optimization. Using a diverse cross-market dataset of 39 stocks from the US, Australia, Europe, Thailand, and one cryptocurrency (BTC-USD), the research rigorously evaluates models’ adaptability under volatile market conditions. This cross-asset integration is particularly critical, as it captures the complex dynamics and correlations between traditional financial markets and emerging digital assets. Although DRL models like PPO and TD3 outperform traditional strategies, they remain vulnerable to market drawdowns and high volatility. IMCA significantly surpasses these models, achieving the highest cumulative return of 29.52% and a superior Sharpe ratio of 0.8293 by dynamically recalibrating model weights in response to real-time market dynamics. This study addresses a substantial research gap, highlighting the failure of traditional ensemble models—reliant on static weightings—to adapt to evolving financial conditions, resulting in suboptimal risk-adjusted returns. IMCA offers a dynamic, data-driven approach that continuously optimizes portfolio strategies across fluctuating market regimes, demonstrating its scalability and robustness across diverse asset classes and regional markets, and providing an empirical framework for adaptive portfolio management. Policy recommendations underscore the need for financial institutions to adopt AI-driven adaptive models like IMCA to enhance portfolio resilience, profitability, and responsiveness in uncertain markets.
Keywords:
Deep Reinforcement Learning
; Portfolio Optimization
; IMCA
; Cross Market
; Bitcoin
MSC: 91G70; 91B84
1. Introduction
Automated trading systems have revolutionized financial markets by enabling rapid, data-driven decision-making with unparalleled speed, accuracy, and consistency. However, the volatile and dynamic nature of modern markets poses significant challenges, demanding adaptive, intelligent strategies that surpass traditional rule-based models. Deep reinforcement learning (DRL) has emerged as a promising paradigm for algorithmic trading, enabling systems to autonomously learn optimal trading strategies through direct market interactions, thereby eliminating reliance on fixed market assumptions [1]. DRL models, such as advantage actor-critic (A2C), proximal policy optimization (PPO), deep deterministic policy gradient (DDPG), twin delayed deep deterministic policy gradient (TD3), and soft actor-critic (SAC), have demonstrated superior performance in optimizing trading decisions, portfolio allocation, and risk management [2,3,4].
Despite these advancements, DRL applications in financial markets face persistent challenges, including sample inefficiency, hyperparameter sensitivity, market non-stationarity, and overfitting to historical data [5]. These limitations diminish the generalizability of DRL models, rendering them vulnerable to abrupt market shifts and extreme events. To mitigate these issues, ensemble learning techniques have been introduced, combining multiple models to enhance prediction stability and robustness [6,7]. However, traditional ensemble methods often rely on static weighting mechanisms, simplistic averaging, or rigid rule-based selection, limiting their responsiveness to dynamic market conditions. This static nature restricts adaptability, failing to fully leverage the adaptive potential of DRL.
To address these limitations, this study introduces the Iterative Model Combining Algorithm (IMCA)—a novel, adaptive ensemble approach that recalibrates model weights in real-time based on recent performance metrics. Unlike conventional ensemble strategies that depend on static model selection, IMCA continuously optimizes the contribution of each DRL model, ensuring that the system remains responsive to fluctuating market conditions.
Furthermore, while explicit sentiment analysis has been employed to enhance trading strategies [8], this approach can be computationally intensive and sensitive to data inconsistencies. Recent research suggests that stock price dynamics inherently reflect collective market sentiment and behavioral trends, providing an implicit and efficient proxy for investor sentiment [9,10]. This perspective aligns with technical analysis theory, which posits that all available information and investor sentiment are inherently reflected in market prices, making price action a fundamental indicator for trend analysis and sentiment measurement. To enhance sentiment capture, we incorporate technical indicators such as Moving Average Convergence Divergence (MACD), Relative Strength Index (RSI), and Simple Moving Average (SMA), which are widely recognized for their ability to capture market momentum and sentiment shifts [11,12]. Additionally, employing these indicators in a cross-market framework helps quantify sentiment dynamics across varying financial regimes and regional markets [13]. Thus, this study adopts a price-based approach, simplifying the modeling process while preserving predictive effectiveness and reducing computational complexity [14].
Moreover, previous research has predominantly focused on single-market frameworks, with limited attention given to the complexities of cross-market trading, where asset correlations, regulatory environments, and market dynamics vary significantly [15]. This gap highlights the need for adaptive strategies capable of managing the intricacies of multi-market conditions and enhancing portfolio resilience [16]. Our proposed framework inherently reflects cross-market dynamics, including global investor sentiment, regulatory impacts, and regional economic trends—factors that explicit sentiment analysis may struggle to quantify accurately [17]. This enhances the external validity of the research by providing adaptable and globally scalable trading strategies.
To bridge these gaps, this study proposes a novel hybrid trading framework integrating DRL with IMCA—an adaptive ensemble technique that dynamically recalibrates model weights in real-time based on recent performance metrics. By leveraging the complementary strengths of multiple DRL models, the hybrid IMCA-DRL approach enhances risk-adjusted returns, mitigates drawdowns, and improves market adaptability. This aligns with recent advancements in reinforcement learning research, which emphasize the effectiveness of hybrid AI-driven financial models in achieving superior performance across diverse market regimes [18].
Furthermore, this research extends the IMCA-DRL framework to global financial markets, including equities from the United States, Australia, Europe, Thailand, and cryptocurrencies. Previous studies have predominantly focused on single-market DRL applications, limiting insights into the complexities of cross-market dynamics [19,20]. Our multi-market approach offers a comprehensive analysis of how the IMCA-DRL framework adapts to diverse conditions, enhancing portfolio resilience across varying economic contexts.
Finally, while individual DRL models like PPO and A2C offer robustness in noisy financial environments, and algorithms like DDPG, TD3, and SAC excel in continuous action spaces [5], existing research lacks dynamic mechanisms for selecting the optimal model based on evolving conditions. This study introduces IMCA, which continuously recalibrates model contributions in real-time, optimizing trade-offs between exploration, exploitation, robustness, and adaptability [21,22]. By applying this dynamic framework across multiple asset classes and global markets, the research offers a more holistic and resilient approach to portfolio optimization.
1.1. Research Contributions
This study introduces several novel advancements in the field of algorithmic trading and financial AI research:
- A first-of-its-kind hybrid DRL trading framework integrating IMCA, which dynamically adjusts model selection weights in response to real-time market conditions, addressing the rigidity and inefficiencies of static DRL ensemble models.
- Application of IMCA-DRL to multi-market trading across the US, Australia, Europe, Thailand, and cryptocurrency markets, providing new insights into cross-market adaptability—an area underexplored in financial AI research.
- A comparative evaluation of multiple DRL models (A2C, PPO, DDPG, TD3, SAC) within an ensemble structure, demonstrating how dynamically optimizing model combinations enhances performance under different market conditions.
This paper critically examines financial modeling in dynamic markets, focusing on reinforcement learning-based trading strategies. Section 2 reviews ensemble learning limitations and introduces IMCA as an adaptive framework for cross-market trading. Section 3 outlines the methodology, covering DRL algorithms and IMCA’s dynamic model selection. Section 4 presents empirical results, comparing DRL strategies with traditional models under volatile conditions. Section 5 concludes with a critical discussion on AI-driven trading, emphasizing the need for improved risk management, execution efficiency, and macroeconomic integration for more resilient financial decision-making.
2. Literature Review
The integration of ensemble learning and reinforcement learning (RL) has significantly transformed algorithmic trading and portfolio optimization, especially within volatile and multi-asset markets. Traditional models, such as mean-variance optimization and the Capital Asset Pricing Model (CAPM), often struggle to adapt to dynamic financial environments due to their reliance on fixed assumptions and static correlations [23,24]. Although ensemble learning techniques have been introduced to enhance predictive accuracy, many approaches rely on static weighting mechanisms that fail to respond adequately to market fluctuations and structural shifts [25,26]. This creates a critical gap in developing adaptive frameworks capable of dynamically adjusting model contributions based on real-time performance metrics [27,28,29].
To address these limitations, this study proposes the Iterative Model Combining Algorithm (IMCA), which dynamically re-weights models using reinforcement learning. IMCA optimizes portfolio allocation by adapting to evolving market conditions, continuously updating its decision-making based on empirical market performance. This approach enhances adaptability, particularly in high-volatility environments where structural changes—such as monetary policy shifts or financial crises—demand rapid adjustments [30,31]. The following sections critically evaluate the evolution of ensemble learning in finance, highlight key limitations, and demonstrate how IMCA improves risk-adjusted returns, particularly in volatile and multi-asset trading contexts [32].
2.1. Ensemble Learning in Global Multi-Asset Trading
Ensemble learning techniques, such as Bagging [25] and Boosting [26], have historically been employed to enhance model accuracy and robustness in financial applications. Bagging reduces variance by training multiple predictors, while Boosting improves precision by focusing on misclassified instances. These techniques have proven effective in managing non-linear and complex price movements prevalent in financial markets [33,34]. However, their static weighting mechanisms limit adaptability, particularly during periods of macroeconomic shocks or systemic crises.
Advanced ensemble techniques, including Random Forests [35] and Gradient Boosting Machines (GBMs) [27], introduced randomization and gradient-based optimization to improve forecasting accuracy. Yet, these models struggle to dynamically adapt during extreme volatility, limiting effectiveness in cross-market trading where rapid shifts occur [36].
To overcome these challenges, the IMCA framework introduces a dynamic ensemble methodology that continuously recalibrates model weights based on real-time performance. Unlike static ensembles, IMCA adapts to evolving market conditions, aligning with advancements in AI-driven financial modeling [32]. This adaptability enhances risk-adjusted returns in volatile markets, especially when integrated with Deep Reinforcement Learning (DRL) strategies.
IMCA also leverages econometric models such as GARCH [37,38] to capture time-dependent volatility and changing asset correlations. This is particularly relevant in multi-asset trading, where market conditions can rapidly shift. Traditional models often fail to capture such abrupt changes, while adaptive frameworks like IMCA optimize asset allocation in real time, enhancing portfolio resilience during financial crises [39]. Recent research demonstrates that reinforcement learning, when combined with adaptive ensemble methodologies, can significantly enhance decision-making in high-frequency and long-term portfolio management [40,41].
By integrating ensemble learning, econometric forecasting, and DRL-driven optimization, IMCA facilitates dynamic strategy adjustments across multiple asset classes, including equities and cryptocurrencies. Given the increasing interconnectivity of global markets, IMCA presents a scalable and adaptive solution for optimizing multi-asset trading strategies [42].
2.2. Deep Reinforcement Learning for Cross-Market Trading
Deep Reinforcement Learning (DRL) has gained substantial traction across diverse applications, including transportation optimization [43], financial trading [4], and portfolio management. DRL models autonomously learn optimal trading strategies by interacting with dynamic environments, making them particularly suited for volatile financial markets. Popular DRL algorithms include PPO [4], TD3 [44], and SAC [2], each offering unique advantages in managing complex, high-dimensional trading tasks [5,19].
Despite these strengths, DRL models face challenges, including sample inefficiency, hyperparameter sensitivity, and vulnerability to market non-stationarity [45,46]. Moreover, traditional DRL approaches often lack robust risk management mechanisms, making them susceptible to large drawdowns during periods of extreme market stress [47].
IMCA addresses these limitations by dynamically adjusting DRL model contributions based on recent performance metrics, ensuring the ensemble strategy remains responsive to real-time market changes. By continuously optimizing model weights, IMCA enhances risk-adjusted returns and mitigates exposure to extreme drawdowns. The integration of econometric models like GARCH further enhances risk control by providing a nuanced understanding of market volatility [48,49].
2.3. Emerging Paradigms in Algorithmic Trading
IMCA (Integrated Market Contextual Analysis) dynamically integrates sentiment analysis into trading strategies by interpreting implicit information embedded within stock price movements. Unlike conventional sentiment analysis, which relies on external indicators like social media trends or investor surveys, IMCA operates on the premise that price fluctuations inherently mirror collective investor sentiment and market psychology [50,51].
By focusing on price dynamics, IMCA simplifies analysis while capturing essential market sentiment. During periods of heightened uncertainty—such as financial crises or policy shifts—sudden price swings and volatility effectively indicate changes in investor sentiment and risk aversion [52,53]. In stable conditions, IMCA relies on technical indicators (e.g., moving averages, RSI) and fundamental data (e.g., earnings reports) to guide trading strategies [54,55,56,57].
2.4. Innovations and Advancements of IMCA
IMCA advances traditional ensemble and standalone DRL models by dynamically adjusting predictive contributions based on real-time conditions [25,28,32]. Its hybrid structure, integrating DRL with econometric models like GARCH, enhances predictive accuracy and risk sensitivity. While DRL identifies optimal strategies, GARCH captures short-term volatility, providing resilience during market fluctuations [32].
2.5. Risk Management and Portfolio Diversification
Risk management remains critical in algorithmic trading, particularly in volatile markets. Traditional risk models like Value at Risk (VaR) and Conditional Value at Risk (CVaR) are limited by their reliance on historical assumptions [58,59]. IMCA addresses this limitation by continuously adjusting portfolio exposure based on real-time market data, ensuring more responsive risk management [60,61].
In this study, daily portfolio returns are used as the primary proxy for measuring VaR and CVaR. The choice of this proxy is justified by the model’s focus on capturing short-term market dynamics and ensuring real-time adaptability. Daily returns offer a direct and timely reflection of market volatility and potential losses, which aligns with the high-frequency, adaptive nature of the IMCA framework. Given the volatility inherent in global cross-market trading, daily returns provide a robust basis for estimating potential downside risks while minimizing lagging effects commonly seen in models using longer-term historical data.
Furthermore, IMCA integrates DRL trading strategies with risk-sensitive reward functions. Traditional DRL models focus on return maximization but often neglect risk controls [45]. By incorporating GARCH-based volatility modeling, particularly frameworks that enhance forecasting in high-frequency environments [62], IMCA enhances resilience during periods of extreme market conditions. The dynamic adjustment of portfolio weights based on real-time volatility forecasts ensures that the model proactively mitigates potential losses, thereby reducing the tail risk measured by VaR and CVaR.
By combining dynamic risk assessment, adaptive model selection, and strategic portfolio diversification, IMCA optimizes cross-market trading. Its real-time adaptability, combined with efficient asset allocation and advanced risk signaling, positions it as a superior framework for financial decision-making [63].
3. Methodology
3.1. Reinforcement Learning Algorithms and Experimental Setup
This study employs six Deep Reinforcement Learning (DRL) algorithms—A2C, PPO, DDPG, TD3, SAC, and IMCA—selected for their strengths in balancing risk-reward trade-offs, processing high-dimensional data, and adapting to volatile market conditions. A2C and PPO offer stability and robustness in fluctuating environments, DDPG and TD3 excel in continuous action spaces, SAC enhances exploration in uncertain markets, and IMCA dynamically recalibrates model weights for improved adaptability.
The models are trained on historical daily closing prices and technical indicators (MACD, RSI, SMA) to capture market trends and momentum. The dataset spans multiple global exchanges, including 39 stocks from the U.S., Europe, Australia, and Thailand, and 1 cryptocurrency. These countries were chosen for their diverse market characteristics: the U.S. and Europe represent mature and highly liquid markets, Australia offers exposure to commodity-driven economies, and Thailand introduces insights from emerging markets. This diversity ensures the model’s robustness, adaptability, and broader applicability across varying economic conditions and regulatory environments.
- U.S. Market (10 stocks): Apple Inc. (AAPL), Microsoft Corporation (MSFT), Alphabet Inc. (GOOGL), Amazon.com Inc. (AMZN), Berkshire Hathaway Inc. Class B (BRK-B), Tesla Inc. (TSLA), JPMorgan Chase & Co. (JPM), Johnson & Johnson (JNJ), NVIDIA Corporation (NVDA), Visa Inc. (V)
- Australian Market (10 stocks): Commonwealth Bank of Australia (CBA.AX), BHP Group Limited (BHP.AX), Westpac Banking Corporation (WBC.AX), CSL Limited (CSL.AX), Woolworths Group Limited (WOW.AX), Telstra Group Limited (TLS.AX), National Australia Bank Limited (NAB.AX), Fortescue Metals Group Ltd (FMG.AX), Rio Tinto Limited (RIO.AX), Wesfarmers Limited (WES.AX)
- European Market (UK & Germany) (10 stocks): Shell plc (SHEL.L), HSBC Holdings plc (HSBA.L), Unilever plc (ULVR.L), BP plc (BP.L), GSK plc (GSK.L), Diageo plc (DGE.L), AstraZeneca plc (AZN.L), Rio Tinto plc (RIO.L), SAP SE (SAP.DE), Lloyds Banking Group plc (LLOY.L)
- Thai Market (9 stocks): PTT Public Company Limited (PTT.BK), CP All Public Company Limited (CPALL.BK), Advanced Info Service Public Company Limited (ADVANC.BK), Kasikornbank Public Company Limited (KBANK.BK), The Siam Cement Public Company Limited (SCC.BK), Bangkok Dusit Medical Services Public Company Limited (BDMS.BK), Airports of Thailand Public Company Limited (AOT.BK), Charoen Pokphand Foods Public Company Limited (CPF.BK), Electricity Generating Public Company Limited (EGCO.BK)
- Cryptocurrency (1): Bitcoin to US Dollar (BTC-USD)
Given that different exchanges operate in distinct time zones, a standardized approach is implemented to synchronize closing prices across markets. Each stock’s closing price is recorded in its respective local market time and used directly without additional time-zone adjustments [64,65]. To ensure consistency across trading days, missing data due to holidays or market closures is imputed using the last available closing price [66]. This method ensures that the model learns from a continuous dataset while preserving the structural integrity of each market’s trading schedule.
Given that these markets close at different times, a standardized framework is used to integrate closing prices effectively. Each stock’s closing price is recorded based on its local market time and then aligned to a unified global trading day structure [64,67]. This ensures that the model learns from a synchronized dataset while preserving the individual characteristics of each market.
The dataset spans from January 2010 to December 2024, covering financial crises, bull-bear cycles, and high-volatility periods. The training period is from January 2010 to February 2022, with out-of-sample testing from March 2022 to December 2024.
Preprocessing includes addressing inconsistencies, normalizing price movements across currencies, and engineering key technical indicators (e.g., moving averages, momentum oscillators, volatility metrics). A standardized framework aligns closing prices across time zones, with missing data imputed using the last available closing price. This ensures data continuity and enables models to adapt effectively to cross-market trading conditions.
Each model is trained with the following configuration:
- Training Data: Daily adjusted closing prices with derived technical indicators, including Moving Average Convergence Divergence (MACD), Relative Strength Index (RSI), and Simple Moving Averages (SMA), which are widely recognized for capturing momentum, trend strength, and market conditions.
- Training Period: Spans from January 2010 to February 2022, ensuring sufficient exposure to diverse market conditions. The out-of-sample testing period extends from March 2022 to December 2024, enabling robust performance evaluation.
- Learning Rate: Initially set at 0.0003 for most models and fine-tuned based on validation performance to ensure convergence stability without overshooting optimal solutions.
- Episodes: 1000 episodes were used to ensure the models achieve convergence while capturing diverse trading patterns.
- Batch Size: 64 observations per batch, balancing computational efficiency with stable gradient updates.
- Discount Factor (): Set at 0.99 to prioritize long-term rewards while ensuring short-term fluctuations do not overly influence decisions.
- Exploration Rate: Initialized at 1.0 and gradually decayed for epsilon-greedy policies to ensure sufficient exploration in early stages, transitioning to exploitation as learning progresses.
- Optimization Method: Grid search was employed for hyperparameter tuning, including learning rates, discount factors, and batch sizes, ensuring optimal performance across varied trading scenarios.
- Computational Resources: Training was performed on an NVIDIA RTX 3090 GPU with 24 GB memory, enabling efficient parallel processing and accelerated model convergence.
- Framework: TensorFlow and PyTorch were used for algorithm implementation, leveraging their flexibility and scalability for deep learning applications.
- Optimizer: The Adam optimizer was employed across all models due to its adaptive learning rate and efficient handling of sparse gradients, which is critical for achieving faster convergence and improved performance in complex, high-dimensional financial environments.
To enhance model performance and generalization, transfer learning techniques are applied. Pre-trained models, initially trained on global indices such as the S&P 500, are fine-tuned using the combined stock and cryptocurrency dataset. This approach accelerates training convergence and improves model robustness by leveraging market patterns learned from established financial instruments.
3.1.1. Experimental Workflow
The experimental setup is conducted on a high-performance computing system equipped with an NVIDIA GPU to optimize model training. The workflow consists of the following stages:
- Data Acquisition and Preprocessing: Market data is retrieved from multiple sources, including Yahoo Finance and cryptocurrency exchanges, which takes approximately two minutes. Feature engineering follows, including the addition of technical indicators, taking an additional three minutes.
- Training and Hyperparameter Optimization: Each model undergoes extensive training for 100,000 timesteps, with training durations varying by model complexity.
- Evaluation and Performance Assessment: Models are evaluated on the out-of-sample test dataset, measuring key performance metrics such as cumulative returns, Sharpe ratios, and maximum drawdowns.
Table 1 summarizes the training times and hyperparameter configurations for each reinforcement learning model.
3.1.2. Advantage Actor-Critic (A2C)
A2C algorithm is selected for its ability to balance exploration and exploitation in sequential decision-making processes. This property makes it well-suited for financial markets, where optimal trading strategies require adaptive decision-making in response to volatile price movements. A2C utilizes an actor network to determine optimal actions and a critic network to evaluate their effectiveness, improving learning efficiency compared to value-based approaches.
The loss function for A2C, which jointly optimizes the policy and value networks, is defined as:
where N represents the number of training samples, denotes the probability of selecting action given the state under the policy parameterized by , and quantifies the advantage of taking action over the baseline policy. The regularization constant c balances policy optimization with value estimation.
3.1.3. Proximal Policy Optimization (PPO)
PPO is a policy-gradient-based reinforcement learning algorithm known for its ability to improve stability and robustness in financial applications. PPO prevents abrupt policy updates by using a clipping mechanism, ensuring that policy changes remain within a predefined trust region. This design minimizes volatility in model performance, making it well-suited for portfolio optimization.
The PPO loss function is defined as:
where represents the probability ratio between the new and old policies, ensuring that policy updates remain within a stable range. The advantage function guides the policy toward actions that yield superior rewards. The clipping threshold , typically set to 0.2, restricts policy changes to prevent instability.
3.1.4. Deep Deterministic Policy Gradient (DDPG)
DDPG is an actor-critic algorithm designed for continuous action spaces. It is particularly useful for optimizing portfolio allocations, where asset weight adjustments occur on a continuous scale. DDPG employs two neural networks: an actor network for selecting optimal portfolio weights and a critic network for evaluating their effectiveness.
The critic network is optimized using the following loss function:
where is the target Q-value, estimated based on observed outcomes, and represents the critic network’s current Q-value estimate. The target Q-value is computed as:
where is the observed reward, is the discount factor, and denotes the target Q-network.
3.1.5. Soft Actor-Critic (SAC)
SAC enhances reinforcement learning performance by incorporating entropy regularization, encouraging exploration and reducing premature convergence. Unlike DDPG, SAC employs a stochastic policy, making it more robust to market fluctuations.
The critic network in SAC is trained using the loss function:
where represents the Q-value estimate for a given state-action pair. The target Q-value is defined as:
where is an entropy temperature parameter that balances exploration and exploitation.
The actor network in SAC is trained to minimize the following objective:
3.1.6. Twin Delayed Deep Deterministic Policy Gradient (TD3)
TD3 improves upon DDPG by mitigating Q-value overestimation and enhancing stability in policy updates. It introduces twin Q-networks, delayed policy updates, and noise smoothing to improve learning efficiency.
The target Q-value for TD3 is computed as:
where and are twin Q-networks that prevent overestimation bias. The target networks are updated using a soft update mechanism:
where controls the rate of target updates.
The training process includes collecting experience tuples , updating the critic networks with the mean-squared error loss:
and updating the actor network less frequently than the critics, using:
3.1.7. Iterative Model Combining Algorithm (IMCA)
IMCA is an adaptive ensemble technique designed to dynamically adjust the weights of reinforcement learning models based on recent market performance. Unlike traditional ensemble approaches with fixed weighting schemes, IMCA continuously updates model contributions, prioritizing those that perform well in specific market conditions.
Financial markets, particularly emerging markets and cryptocurrency exchanges, exhibit significant inefficiencies and rapid structural changes. Static models often fail to adapt to these shifts, making them suboptimal for real-time trading. IMCA addresses this challenge by redistributing model weights based on market fluctuations, ensuring robust and adaptive portfolio management.
By integrating reinforcement learning models with an iterative ensemble optimization process, IMCA enhances trading performance across diverse financial instruments, enabling more effective multi-asset portfolio strategies.
3.1.8. Steps in IMCA
The IMCA optimizes trading predictions by dynamically adjusting model weights based on performance. This approach enhances adaptability to market fluctuations, ensuring robust portfolio management.
The process begins with selecting an error metric (), such as Root Mean Square Error (RMSE) or Mean Absolute Error (MAE), to quantify prediction accuracy:
where N is the number of observations, represents the predicted value, is the actual value, and p defines the error type ( for RMSE, for MAE).
To prevent overfitting, a regularization term () stabilizes weight updates:
where is the weight of model k at iteration t. The evaluation window length (l) ensures that weight updates reflect recent trends without overreacting to noise.
Each model’s performance score () is calculated as:
where prevents division by zero. Lower-performing models receive higher values, penalizing their influence. The refined weight update formula is:
The final ensemble prediction is computed as:
where represents the forecast from model k, and n is the number of models.
3.1.9. Performance Evaluation Metrics
The effectiveness of IMCA in portfolio management is evaluated using key performance metrics that assess both profitability and risk.
- Cumulative Return: Measures total investment growth over the evaluation period [68].
- Annual Return: Represents the average yearly portfolio growth, enabling comparisons across strategies [68].
- Annualized Volatility: Quantifies the variability of returns on an annual basis, indicating portfolio risk [60].
- Sharpe Ratio: Evaluates risk-adjusted returns by measuring excess returns per unit of risk [24].
- Maximum Drawdown: Captures the largest peak-to-trough decline, assessing downside risk resilience [63].
These metrics provide a balanced framework for analyzing IMCA’s effectiveness in optimizing portfolio performance while managing risk in multi-asset financial markets.
4. Estimation Results
In this section, we present the performance evaluation of various portfolio allocation strategies, comparing DRL-based models with traditional approaches to assess their effectiveness under different market conditions. Figure 1 and Figure 2 illustrate the cumulative returns of each strategy over the study period, providing insights into their growth trends and ability to withstand market volatility. Meanwhile, Table 2 summarizes key performance metrics, which are crucial for evaluating the suitability of each investment strategy.
The results show that DRL-based algorithms are highly adaptable and efficient in managing portfolio allocations, offering competitive returns with optimal risk. The IMCA outperforms other models, excelling in volatile markets. This highlights its potential for enhancing portfolio performance and investment decision-making.
4.1. Cumulative Return Trends
The cumulative return of the portfolio allocation model provides key insights into its performance by using Reinforcement Learning in comparison to traditional strategies. The CAPM model, in this context, serves as a benchmark for risk-adjusted portfolio optimization across multiple asset classes. Unlike conventional studies that often use a single benchmark index such as the S&P 500, this CAPM model is derived from a diversified cross-market portfolio of 40 assets including equities from the US, Australia, Europe, Thailand, and cryptocurrencies. This approach ensures a more comprehensive reflection of global market dynamics and risk factors, making it a robust baseline for evaluating performance under diverse market conditions. By using a cross-market asset composition, the CAPM model captures a broader spectrum of economic influences, regulatory differences, and investor behaviors, providing a more realistic and globally relevant comparison for assessing portfolio optimization strategies under varying levels of market volatility.
Figure 1 illustrates the cumulative returns of the Reinforcement Learning models, including A2C, PPO, DDPG, SAC, and TD3, across various global markets during the testing period from March 2022 to August 2024. The results show a consistent upward trend in cumulative returns, particularly from late 2023 to 2024. While all Reinforcement Learning models outperform traditional approaches, PPO and TD3 achieve the highest cumulative returns at 29.3 percent and 29.4 percent, respectively, followed closely by IMCA with 29.5 percent.
In contrast, the CAPM model, represented by the blue line, experiences a significant decline in early 2022, followed by a slow recovery starting in 2023. Despite posting positive returns toward the end of the period, CAPM underperforms significantly compared to Reinforcement Learning models, reflecting its high volatility of 17.17 percent and the largest maximum drawdown of negative 50.97 percent. These findings suggest that Reinforcement Learning models offer greater stability and resilience, particularly in volatile market conditions. The IMCA framework further enhances adaptability, maintaining the highest Sharpe ratio of 0.8293 while balancing return maximization and risk control.
Among Reinforcement Learning models, PPO and TD3 emerge as the most viable options for active investment strategies, achieving the highest cumulative returns with competitive Sharpe ratios. Their superior performance highlights the effectiveness of Reinforcement Learning models in adapting to dynamic financial environments. Additionally, A2C, DDPG, and SAC demonstrate strong performance, with cumulative returns of 27.6 percent, 25.4 percent, and 24.4 percent, respectively. These models consistently surpass the CAPM and Min-Variance strategies, confirming the superiority of Reinforcement Learning-based portfolio allocation.
4.2. Comparative Performance of IMCA and Traditional Strategies
The IMCA model offers the most balanced and adaptive portfolio allocation strategy by achieving high returns while maintaining controlled volatility and superior risk-adjusted performance. With an annual return of 6.80 percent and a cumulative return of 29.5 percent, IMCA surpasses all individual Reinforcement Learning models. Its Sharpe ratio of 0.8293 further indicates its efficiency in generating returns per unit of risk. These results emphasize the significance of adaptive Reinforcement Learning-based strategies in modern financial markets.
Figure 2 presents a comparative analysis of traditional investment strategies and the IMCA model. The results demonstrate that IMCA, represented by the red line, exhibits a consistent upward trend throughout the observation period, maintaining strong growth and stability, particularly from mid-2023 onward. Unlike the Min-Variance and CAPM models, which show higher volatility and limited adaptability, IMCA provides a more resilient investment strategy.
Among traditional strategies, the Min-Variance model prioritizes risk minimization, resulting in the lowest annual volatility of 5.99 percent and the smallest maximum drawdown of negative 10.96 percent. However, it produces the lowest cumulative return of only 0.75 percent, highlighting its conservative nature. The CAPM model, in contrast, exhibits the highest annual volatility at 17.17 percent and suffers the largest drawdown of negative 50.97 percent, making it the least effective strategy in terms of risk-adjusted performance.
IMCA effectively balances return optimization and risk management by leveraging an adaptive framework that dynamically adjusts portfolio allocations based on market conditions. Its annual volatility of 8.20 percent remains competitive with other Reinforcement Learning models, while its maximum drawdown of negative 13.50 percent is lower than PPO, A2C, and TD3. These findings underscore the robustness and efficiency of IMCA, confirming its ability to generate consistent and increasing cumulative returns over time.
For traditional methods, the Min-Variance strategy exhibits a relatively stable trajectory with minimal fluctuations. It is particularly effective in minimizing risk, as reflected in its low annual volatility of 5.99 percent and the smallest maximum drawdown of negative 10.96 percent. While it does not generate high returns, with a cumulative return of only 0.75 percent and an annual return of 0.17 percent, it remains a suitable choice for highly risk-averse investors. The strategy prioritizes stability over return maximization, making it effective in maintaining portfolio value during periods of high market uncertainty.
Extreme losses characterize the CAPM portfolio allocation strategy, which demonstrates significant volatility and high exposure to market downturns. With an annual volatility of 17.17 percent, CAPM experiences the highest fluctuations among all strategies, resulting in a maximum drawdown of negative 50.97 percent. Although it shows signs of recovery in 2023 and 2024, its cumulative return of 16.1 percent remains significantly lower than that of IMCA and all tested reinforcement learning models. These findings highlight the limitations of the CAPM strategy, as its performance is heavily influenced by market instability, making it less effective in volatile financial environments.
The observed performance trends across portfolio strategies can be directly linked to the macroeconomic and financial events that shaped global markets during the 2022-2024 period. The significant drawdown in CAPM’s performance during early 2022 aligns with the aggressive monetary tightening by the Federal Reserve, which led to capital outflows from risk assets and a sharp contraction in equity valuations [31]. This period also saw severe liquidity crises in the cryptocurrency sector, exacerbating market volatility and reducing portfolio stability for static allocation strategies [11,69]. While traditional models like CAPM and Min-Variance struggled to mitigate losses, IMCA demonstrated superior adaptability by dynamically reallocating capital away from high-risk assets during these downturns.
As markets entered a volatile recovery phase in late 2022 and early 2023, instability in the banking sector—exemplified by the failures of Silicon Valley Bank (SVB) and Credit Suisse—further disrupted financial markets [69]. CAPM’s reliance on static risk premia rendered it unable to adjust to these shocks, while IMCA leveraged its reinforcement learning framework to recalibrate asset allocations in response to shifting market conditions. Similarly, during the resurgence of tech stocks and cryptocurrency markets in mid-2023, driven by advancements in artificial intelligence and investor speculation on future rate cuts, IMCA effectively captured upside momentum, outperforming both traditional models and static DRL strategies.
IMCA’s adaptive strategy proved superior in capitalizing on market recovery. By early 2024, expectations of Federal Reserve rate cuts and improved macroeconomic stability fueled a sustained market rally [30]. While all strategies benefited to some extent, CAPM and Min-Variance portfolios remained constrained by their rigid assumptions, failing to capitalize fully on emerging opportunities. In contrast, IMCA’s superior performance can be attributed to its ability to continuously integrate new market information and adjust its portfolio in real time, reflecting an enhanced capability to navigate financial cycles effectively.
4.3. Overall Performance Metrics
Table 2 presents the performance evaluation of different DRL-based portfolio allocation models compared to traditional investment strategies. The table includes key financial performance metrics such as cumulative returns, annual returns, annual volatility, daily VaR, Sharpe ratio, and maximum drawdown. The key findings are as follows:
- Among the DRL-based models, PPO delivers a strong cumulative return of 29.3% with an annual return of 6.04%, achieving a competitive balance between risk and profitability. Its Sharpe ratio of 0.7475 suggests an efficient risk-return tradeoff, making it one of the top-performing reinforcement learning models.
- The IMCA model outperforms all DRL strategies in terms of risk-adjusted returns, achieving the highest Sharpe ratio of 0.8293. It maintains a strong cumulative return of 29.5% with an annual return of 6.80%, confirming its adaptability in portfolio allocation. Additionally, its lower maximum drawdown of -13.50% compared to most DRL models demonstrates its enhanced ability to manage downside risks.
- The traditional Min-Variance strategy remains the most stable, exhibiting the lowest annual volatility of 5.99% and the smallest maximum drawdown of -10.96%. However, it produces the lowest cumulative return of only 0.75%, with an annual return of 0.17%, reflecting its conservative nature and limited growth potential.
- The CAPM model performs significantly worse in risk-adjusted terms, with the highest annual volatility of 17.17% and the largest maximum drawdown of -50.97%. Despite achieving a cumulative return of 16.1%, its Sharpe ratio of only 0.2033 indicates poor risk management.
In terms of overall performance, DRL-based strategies, particularly PPO and TD3, exhibit superior cumulative returns and risk-adjusted returns compared to traditional approaches. However, IMCA emerges as the most effective model, providing the best balance between return generation and risk control. Its ability to dynamically adjust model selection based on market conditions allows it to outperform individual DRL strategies, confirming the value of model aggregation in optimizing portfolio performance.
These findings reinforce the potential of adaptive reinforcement learning models in financial decision-making. The IMCA approach demonstrates that integrating multiple DRL models within a robust framework can enhance portfolio resilience and provide investors with a more effective alternative to traditional static portfolio allocation methods.
4.4. Advanced Robustness and Cross-Market Adaptability
In this study, the robustness and adaptability of the IMCA framework were thoroughly examined and demonstrated through multiple tests, as previously presented. The out-of-sample analysis, utilizing financial data from a distinct post-2022 period, confirmed the model’s generalizability across diverse economic cycles. The results, already discussed, showed that IMCA consistently achieved stable cumulative returns and superior risk-adjusted performance, reinforcing its resilience and effectiveness in adapting to evolving market dynamics.
As illustrated in Figure 2, the performance of the IMCA model clearly demonstrates its superior adaptability and resilience across different market regimes, including bull, bear, and sideways markets. The IMCA model (represented by the red line) consistently outperforms traditional strategies, maintaining a steady upward trajectory even during periods of heightened volatility and market downturns.
In contrast, the CAPM model (green line) exhibits significant declines, particularly during the early bear market phase, highlighting its vulnerability to sharp market corrections. Meanwhile, the Min-Variance model (blue line) demonstrates a stable but limited growth pattern, failing to capture substantial upward trends during bullish periods.
While stress testing frameworks are commonly employed to simulate extreme financial events such as abrupt interest rate hikes or geopolitical shocks [70], the out-of-sample analysis conducted in this study already provides robust evidence of IMCA’s superior adaptability. By applying IMCA to diverse post-2022 market conditions characterized by significant macroeconomic shifts and global financial disruptions, the framework demonstrated consistent cumulative return growth and effective drawdown management. This real-world validation reduces the necessity for hypothetical stress scenarios, aligning with findings that real market data-based evaluations offer more reliable insights into model robustness and practical applicability [71]. Thus, the demonstrated out-of-sample performance confirms IMCA’s capacity to dynamically adjust and outperform traditional models without requiring additional simulated stress conditions.
The cross-market adaptability of IMCA was assessed by analyzing evolving cross-asset correlations.
Figure 3 shows that during the early market phase (March 2022 - March 2023), correlations among global equities were relatively strong. This includes indices such as the S&P 500 (GSPC), NASDAQ Composite (IXIC), Dow Jones Industrial Average (DJI), Australian Securities Exchange (AXJO), FTSE 100 (FTSE), DAX (GDAXI), and CAC 40 (FCHI). In contrast, Bitcoin (BTC-USD) displayed weaker integration, particularly with regional indices like SET.BK (Stock Exchange of Thailand), indicating compartmentalized risk.
Figure 4 reveals a notable shift in the later phase (March 2023 - March 2024), with weakened equity correlations and BTC-USD exhibiting stronger and negative correlations with some markets, such as SET.BK, showing a correlation of -0.8. These shifts highlight increased diversification potential but also greater uncertainty, particularly regarding crypto-assets’ relationship with traditional equity markets.
Among all models evaluated in this study, IMCA consistently demonstrated superior adaptability by dynamically recalibrating portfolio allocations in response to evolving correlation structures. Unlike static models, IMCA effectively minimized concentrated risk exposures, ensured greater diversification, and enhanced resilience against market shocks. This adaptive mechanism allowed IMCA to outperform other strategies in terms of both cumulative returns and risk-adjusted performance, confirming its effectiveness in navigating complex and volatile financial environments.
IMCA’s ability to recalibrate in real-time is grounded in adaptive learning theories, where continuous feedback mechanisms enable models to optimize their strategies dynamically [72]. This approach aligns with regime-switching theories, where financial markets exhibit distinct behavior patterns that require adaptive modeling to ensure consistent performance [73,74].
4.4.1. Evaluating Learning Progression of IMCA
To assess the stability and effectiveness of the reinforcement learning-based portfolio allocation strategies using IMCA, we evaluate the learning progression over training steps. The cumulative reward and Sharpe ratio are key indicators of model performance, reflecting profitability and risk-adjusted returns, respectively.
Figure 5 presents the cumulative reward progression across training steps. The results show a steep increase in reward accumulation during the early training phase, with the model reaching a plateau around 15,000 time-steps. At 100,000 time-steps, the model demonstrates a stabilized learning process, where reward accumulation exhibits minor fluctuations but maintains an overall upward trend. Such convergence behavior is consistent with findings from Hachaïchi and Lanwer (2024), who observed similar early convergence in reinforcement learning-driven portfolio strategies [75]. Beyond this point, additional training yields marginal improvements, confirming that the model has effectively converged to an optimal policy [76].
Similarly, Figure 6 illustrates the Sharpe ratio evolution over training steps. Initially, the risk-adjusted return increases gradually, signifying model improvement in balancing profitability and risk. Around 100,000 time-steps, the Sharpe ratio stabilizes at a high level, indicating enhanced decision-making efficiency. This stabilization process aligns with the work of Huang et al. (2024), who highlighted that convergence in Sharpe ratio reflects the achievement of optimal trading policy [21]. Post-100,000 steps, the learning curve smooths out, confirming that the model has reached a robust state with consistent performance [77].
Despite its adaptive complexity, IMCA demonstrates computational efficiency, achieving convergence in under 100,000 steps. This efficiency makes it suitable for real-time deployment in fast-moving financial markets, where decision latency can significantly impact profitability [78].
4.5. Discussion
This study aims to identify the most effective investment strategy for optimizing trading strategies across multiple global financial markets by applying DRL algorithms and an IMCA. By extending beyond single-market applications, this research provides insights into how AI-driven models perform in varying economic conditions, across different asset classes, and under diverse regulatory constraints. The results reveal significant findings on portfolio optimization and risk management across global markets.
First, the IMCA framework demonstrates a notable advancement in portfolio optimization by dynamically adjusting model weights based on real-time market conditions across multiple regions and asset classes. Unlike traditional ensemble techniques, which apply static weighting mechanisms, IMCA continuously recalibrates itself in response to fluctuating market dynamics, thereby enhancing robustness in cross-market trading [32]. The empirical findings indicate that IMCA significantly mitigates the limitations of standalone DRL models, which often suffer from overfitting or inefficiencies in certain market conditions. By integrating adaptive model selection and reinforcement learning, IMCA consistently outperforms conventional strategies such as CAPM and the Min-Variance approach across different financial environments. This establishes IMCA as a more resilient and scalable framework for multi-asset, cross-market portfolio allocation.
Second, the analysis confirms that DRL models systematically outperform traditional investment strategies, reinforcing previous findings that demonstrated the superior risk-adjusted returns of DRL-based trading systems [3,5]. The study finds that DRL models achieve higher Sharpe Ratios than traditional portfolio allocation methods, despite their increased Maximum Drawdowns. Among the DRL models, PPO and TD3 emerge as the most effective algorithms, achieving cumulative returns of 29.3 percent and 29.4 percent, respectively. However, IMCA surpasses both models, achieving the highest cumulative return of 29.5 percent with the best Sharpe ratio of 0.8293. These results reinforce the importance of adaptive Reinforcement Learning models in financial markets, particularly when managing risk-adjusted performance in cross-market trading.
From a critical economic perspective, the adaptability of IMCA reflects the broader necessity for financial models to respond to increasingly complex and interconnected global markets. The integration of diverse assets, including both traditional equities and cryptocurrencies, aligns with the evolution of modern investment portfolios, which must account for rapid technological shifts and economic uncertainties. Traditional models, such as CAPM, inherently assume stable risk premia and static correlations, yet these assumptions are frequently invalidated during periods of market turbulence, geopolitical shifts, or monetary policy changes [30,31]. IMCA’s capacity to dynamically recalibrate model weights enables it to navigate such complexities, thereby offering resilience against unforeseen economic disruptions.
Furthermore, the study highlights the critical role of adaptive trading frameworks in responding to macroeconomic shocks. For instance, during periods of monetary tightening or global financial stress, static models may misallocate capital, failing to adjust to risk-off environments. IMCA’s dynamic approach allows for real-time reallocation, enhancing capital preservation during downturns while maximizing opportunities during market recoveries [9]. This capacity for adaptive responsiveness is particularly valuable in environments characterized by high inflation, interest rate volatility, or systemic market dislocations.
In contrast, the Min-Variance strategy is risk-averse but lacks the adaptability required for global financial markets. While it effectively reduces risk, as seen in its low annual volatility of 5.99 percent and minimal maximum drawdown of -10.96 percent, it fails to maximize returns, with a cumulative return of just 0.75 percent. This makes it suboptimal for investors seeking higher growth. Given the findings of this study, it is evident that static portfolio optimization strategies like Min-Variance lack the flexibility required to respond dynamically to cross-market conditions [17].
The cross-market comparison of DRL and IMCA underscores their ability to generate consistently higher returns while maintaining a risk profile comparable to traditional investment strategies. However, the analysis also reveals that DRL models remain vulnerable to high volatility and periods of extreme market stress, with annual volatility levels surpassing those of traditional approaches [6]. This suggests that despite their adaptability, DRL-based strategies still require more robust mechanisms for mitigating systemic risks, particularly in multi-market settings where correlations between assets fluctuate unpredictably.
Among DRL models, PPO and TD3 provide the most competitive risk-return tradeoffs, balancing performance across different market conditions. Their outperformance across global equities and cryptocurrency markets indicates a higher level of adaptability than traditionally assumed for reinforcement learning models, making them more applicable to multi-asset trading. However, IMCA outperforms all models by efficiently allocating across strategies, achieving the highest Sharpe Ratio and a more stable return profile.
Overall, the findings highlight the critical role of adaptive trading frameworks in cross-market portfolio management. IMCA’s integration with DRL enhances portfolio resilience, but further research is needed to refine risk-control mechanisms, optimize hyperparameters, and incorporate macroeconomic indicators and monetary policies. Future work should explore high-frequency trading, alternative asset classes, and transaction costs to improve practical viability.
4.5.1. Economic Policy Implications
The findings from this study also carry significant implications for financial institutions and policymakers. In an increasingly interconnected global economy, static portfolio models may lead to suboptimal asset allocations, exacerbating systemic risk during financial crises. Therefore, there is a strong policy argument for adopting AI-driven adaptive frameworks like IMCA. Such models not only enhance the profitability and resilience of investment portfolios but also contribute to the stability of financial systems by reducing the propagation of market shocks [9,39]. Regulatory bodies might also consider encouraging the development and adoption of dynamic risk-management systems to better prepare for periods of economic uncertainty and financial stress.
IMCA’s superior performance stems from its ability to dynamically adjust portfolio allocations based on macroeconomic shifts. Key contributing factors include GARCH-based risk estimation, adaptive interest rate sensitivity, and liquidity flow analysis. Unlike static models, IMCA continuously reweights these indicators, ensuring robust performance across varying financial regimes [37,38].
By advancing AI-driven portfolio optimization, this study establishes IMCA as a scalable and adaptable framework for global financial trading. Its ability to integrate macroeconomic signals and real-time market dynamics positions IMCA as a next-generation solution for risk-adjusted portfolio management [43].
For institutional investors, IMCA’s adaptive nature offers a robust framework for navigating periods of heightened volatility and market disruption. By dynamically reallocating portfolio exposures, it ensures optimal risk-adjusted returns while mitigating drawdown risks. This feature is particularly valuable for hedge funds managing diversified portfolios that require rapid responsiveness to evolving market conditions [36].
5. Conclusions
This study conducted a comprehensive analysis of the performance of various DRL models, including DDPG, PPO, TD3, SAC, and A2C, along with the IMCA. The primary objective was to evaluate the effectiveness of reinforcement learning-based trading strategies across diverse global markets, encompassing equities and cryptocurrency assets, while assessing their adaptability under fluctuating financial conditions. By adopting a cross-market approach, the research underscores the capacity of DRL models to optimize multi-asset portfolio allocations, offering a data-driven alternative to conventional strategies. Moreover, the IMCA framework demonstrates enhanced scalability across various asset classes and regional markets by dynamically adjusting model selection based on real-time financial conditions, positioning it as a robust solution for institutional and retail investors managing globally diversified portfolios.
Empirical findings indicate that DRL models consistently outperform traditional portfolio optimization techniques, including the Min-Variance approach and the CAPM. While PPO and TD3 emerge as top-performing DRL algorithms, the IMCA framework surpasses both by dynamically recalibrating model weights to align with evolving market conditions, thereby achieving superior cumulative returns and risk-adjusted performance. In contrast, the Min-Variance strategy, although effective in reducing risk exposure, yields significantly lower returns, reflecting its conservative approach. The CAPM model, characterized by moderate returns, suffers from heightened volatility and substantial drawdowns, highlighting its vulnerability during periods of financial stress. These findings underscore the trade-off between risk and return, emphasizing that while DRL models enhance profitability, they also introduce greater exposure to volatility and potential losses. Consequently, effective risk management strategies are critical to balancing return maximization with volatility mitigation in reinforcement learning-based portfolio optimization.
The IMCA framework plays a critical role in improving the robustness of reinforcement learning-based strategies. Unlike individual models that rely on fixed parameters and training environments, IMCA dynamically adjusts model selection based on real-time market conditions. The results show that IMCA achieves an annual return of 6.80 percent and a cumulative return of 29.5 percent, surpassing traditional strategies while maintaining competitive risk-adjusted returns. By leveraging multiple DRL models, IMCA demonstrates resilience in adapting to changing market structures, reducing the likelihood of performance degradation during periods of heightened market volatility. Additionally, IMCA’s adaptive nature ensures that it remains effective across multiple market regimes, allowing it to be deployed in various financial environments ranging from high-frequency trading to long-term portfolio management.
Despite these advancements, several challenges remain in applying reinforcement learning-based trading strategies to real-world financial markets. The dynamic nature of asset price movements, liquidity constraints, and transaction costs introduce additional complexities that must be addressed in future research. A key area for improvement involves integrating macroeconomic indicators, such as interest rates, inflation, and economic growth, into reinforcement learning models. The current study relies primarily on price-volume data, which, while effective, may not fully capture broader market trends.
Risk management remains a fundamental concern for reinforcement learning-based models, particularly in periods of market stress. Future research should focus on refining risk control mechanisms, such as adaptive drawdown constraints and real-time volatility adjustments, to mitigate sudden portfolio losses. The development of hybrid reinforcement learning frameworks that dynamically adjust across different financial environments could further enhance portfolio stability. Additionally, execution efficiency, including the reduction of latency in high-frequency trading applications, represents another avenue for improvement. Furthermore, while IMCA offers enhanced adaptability, its reliance on historical data and reinforcement learning algorithms presents the risk of overfitting, particularly in non-stationary market conditions. Future refinements should include more robust generalization techniques to ensure model effectiveness across unseen financial environments.
This study contributes to the growing body of research on reinforcement learning-based financial applications by demonstrating the effectiveness of adaptive model aggregation in cross-market trading. The findings provide strong empirical support for the use of reinforcement learning models in dynamic portfolio management while also identifying key areas for future enhancements. By addressing risk mitigation, macroeconomic integration, and execution efficiency, future reinforcement learning-based frameworks could become more reliable and scalable for institutional and retail investors alike. Additionally, continued research on model robustness, particularly in handling structural market shifts, is necessary to prevent over-reliance on historical patterns and to develop more resilient AI-driven financial strategies.
Author Contributions
Methodology, W.S.; Investigation, W.S.; Resources, S.T.; Writing—original draft, S.T. & K.P.; Writing—review & editing, W.S. All authors have read and agreed to the published version of the manuscript.
Funding
This research work was funded by Chiang Mai University
Data Availability Statement
The data can be freely downloaded from Yahoo Finance (finance.yahoo.com)
Acknowledgments
This research work was partially supported by Faculty of Economics at Chiang Mai University.
Conflicts of Interest
The authors declare no conflicts of interest.
References
- Deng, Y.; Bao, F.; Kong, Y.; Ren, Z.; Dai, Q. Deep direct reinforcement learning for financial signal representation and trading. IEEE Trans. Neural Networks Learn. Syst. 2016, 28, 653–664. [Google Scholar] [CrossRef] [PubMed]
- Haarnoja, T.; Zhou, A.; Abbeel, P.; Levine, S. Soft Actor-Critic: Off-Policy Maximum Entropy Deep Reinforcement Learning with a Stochastic Actor. arXiv Preprint 2018. Available online: https://arxiv.org/abs/1801.01290.
- Jiang, Z.; Xu, D.; Liang, J. A deep reinforcement learning framework for the financial portfolio management problem. arXiv Preprint 2017. Available online: https://arxiv.org/abs/1706.10059.
- Schulman, J.; Wolski, F.; Dhariwal, P.; Radford, A.; Klimov, O. Proximal Policy Optimization Algorithms. arXiv Preprint 2017. Available online: https://arxiv.org/abs/1707.06347.
- Lu, C.I. Evaluation of Deep Reinforcement Learning Algorithms for Portfolio Optimization. arXiv Preprint 2023. Available online: https://arxiv.org/abs/2307.07694.
- Vishal, M.; Vadlamani, R.; Ramanuj, L. Maglaras, L.A., Das, S., Tripathy, N., Patnaik, S., Eds.; Ensemble Deep Reinforcement Learning for Financial Trading. In Machine Learning Approaches in Financial Analytics; Springer Nature Switzerland: Cham, 2024. [Google Scholar] [CrossRef]
- Yang, H.; Liu, X.-Y.; Zhong, S.; Walid, A. Deep Reinforcement Learning for Automated Stock Trading: An Ensemble Strategy. SSRN Preprint 2020. Available online: https://ssrn.com/abstract=3690996. [CrossRef]
- Nassirtoussi, A.K.; Aghabozorgi, S.; Wah, T.Y.; Ngo, D.C.L. Text mining for market prediction: A systematic review. Expert Syst. Appl. 2014, 41, 7653–7670. [Google Scholar] [CrossRef]
- Rajendran, H.; Kayal, P.; Maiti, M. Is the U.S. Energy Independence and Security Act of 2022 associated with stock market volatility? Util. Policy 2024, 90, 101813. [Google Scholar] [CrossRef]
- Yang, J.; Li, P.; Cui, Y.; Han, X.; Zhou, M. Multi-Sensor Temporal Fusion Transformer for Stock Performance Prediction: An Adaptive Sharpe Ratio Approach. Sensors 2025, 25. [Google Scholar] [CrossRef]
- Aggrawal, N.; Rathi, M.; Kansal, R.; Jamwal, A.; Agarwal, S. QuantForecast-Navigating the Financial Future. ResearchSquare 2024. [Google Scholar] [CrossRef]
- Shahsafi, S.; Naderkhani, F. Enhancing Stock Trading Performance with Deep Q-Learning by Addressing Noisy Data through Advanced Denoising Techniques. In Proceedings of the 27th International Conference on Information Fusion (FUSION); Venice, Italy, 2024; pp. 1–7. [Google Scholar] [CrossRef]
- Yadav, P.; Giri, J.N. Challenges and Opportunities in Price Forecasting for Commodities: A Study of Technical Indicators in the NCR Region. Eur. Econ. Lett. 2025, 15, 1079–1088. [Google Scholar]
- Liu, A.; Chen, J.; Yang, S.Y.; Hawkes, A.G. The Flow of Information in Trading: An Entropy Approach to Market Regimes. Entropy 2020, 22, 1064. [Google Scholar] [CrossRef] [PubMed]
- Calefariu Giol, E.; Panazan, O.; Gheorghe, C. Cyber, Geopolitical, and Financial Risks in Rare Earth Markets: Drivers of Market Volatility. Risks 2025, 13, 46. [Google Scholar] [CrossRef]
- Sahut, J.M.; Hajek, P.; Olej, V.; Hikkerova, L. The Role of News-Based Sentiment in Forecasting Crude Oil Price During the Covid-19 Pandemic. Ann. Oper. Res. 2025, 345, 861–884. [Google Scholar] [CrossRef]
- Jagirdar, S.S.; Gupta, P.K. Charting the financial odyssey: a literature review on history and evolution of investment strategies in the stock market (1900–2022). China Account. Finance Rev. 2024, 25, 277–307. [Google Scholar] [CrossRef]
- Mohammadshafie, A.; Mirzaeinia, A.; Jumakhan, H.; Mirzaeinia, A. Deep Reinforcement Learning Strategies in Finance: Insights into Asset Holding, Trading Behavior, and Purchase Diversity. arXiv Preprint 2024. [Google Scholar] [CrossRef]
- Panya, T.; Khamkong, M. Deep Reinforcement Learning for Automated of Asian Stocks Trading. In Applications of Optimal Transport to Economics and Related Topics; Kreinovich, V., Yamaka, W., Leurcharusmee, S., Eds.; Springer Nature Switzerland: Cham, Switzerland, 2024. [Google Scholar] [CrossRef]
- Vetrin, D.; Koberg, M. Deep Reinforcement Learning in High-Frequency Trading. arXiv Preprint 2024. Available online: https://arxiv.org/abs/2404.09876.
- Huang, G.; Zhou, X.; Song, Q. A Deep Reinforcement Learning Framework for Dynamic Portfolio Optimization: Evidence from China’s Stock Market. arXiv 2025, arXiv:2412.18563. https://arxiv.org/abs/2412.18563. [Google Scholar]
- Zhong, X.; Wei, J.; Li, S.; Xu, Q. Deep reinforcement learning for dynamic strategy interchange in financial markets. Appl. Intell. 2024, 55. [Google Scholar] [CrossRef]
- Markowitz, H. Portfolio selection. J. Finance 1952, 7, 77–91. [Google Scholar]
- Sharpe, W.F. The Sharpe Ratio. J. Portf. Manag. 1994, 21, 49–58. [Google Scholar] [CrossRef]
- Breiman, L. Bagging predictors. Mach. Learn. 1996, 24, 123–140. [Google Scholar] [CrossRef]
- Freund, Y.; Schapire, R.E. A Decision-Theoretic Generalization of On-Line Learning and an Application to Boosting. J. Comput. Syst. Sci. 1997, 55, 119–139. [Google Scholar] [CrossRef]
- Friedman, J.H. Greedy function approximation: A gradient boosting machine. Ann. Stat. 2001, 29, 1189–1232. [Google Scholar] [CrossRef]
- Schapire, R.E. A brief introduction to boosting. IJCAI Int. Joint Conf. Artif. Intell. 1999, 2, 1401–1406. [Google Scholar]
- Wang, M.; Yu, S. Application of Bayesian network and genetic algorithm enhanced Monte Carlo method in urban transportation infrastructure investment. J. Comput. Methods Sci. Eng. 2025, 0. [Google Scholar] [CrossRef]
- Reifschneider, D. US Monetary Policy and the Recent Surge in Inflation. Peterson Inst. Int. Econ. Work. Pap. 2024, 24-13. [Google Scholar] [CrossRef]
- Shu, M.; Song, R. Real-time Bubble Status of US Stock Market After the 2020 Stock Market Crash. In 2024 JSM Proc.; American Statistical Association: Alexandria, VA, USA, 2024; Available online: https://ssrn.com/abstract=5075507. [CrossRef]
- Thongkairat, S.; Yamaka, W. A Combined Algorithm Approach for Optimizing Portfolio Performance in Automated Trading: A Study of SET50 Stocks. Mathematics 2025, 13. [Google Scholar] [CrossRef]
- Wang, Y.; Zhang, Y.; Zou, J.; Ravishanker, N. Online structural break detection in financial durations. Stat. Comput. 2025, 35. [Google Scholar] [CrossRef]
- Xiong, Z. Ensemble RL through Classifier Models: Enhancing Risk-Return Trade-offs in Trading Strategies. arXiv 2025, arXiv:2502.17518. https://arxiv.org/abs/2502.17518. [Google Scholar]
- Breiman, L. Random forests. Mach. Learn. 2001, 45, 5–32. [Google Scholar] [CrossRef]
- Rezaei, A.; Abdellatif, I.; Umar, A. Towards Economic Sustainability: A Comprehensive Review of Artificial Intelligence and Machine Learning Techniques in Improving the Accuracy of Stock Market Movements. Int. J. Financ. Stud. 2025, 13, 1–36. [Google Scholar]
- Bollerslev, T. Generalized autoregressive conditional heteroskedasticity. J. Econometrics 1986, 31, 307–327. [Google Scholar] [CrossRef]
- Engle, R.F. Dynamic Conditional Correlation: A Simple Class of Multivariate GARCH Models. J. Bus. Econ. Stat. 2002, 20, 339–350. [Google Scholar] [CrossRef]
- Goodell, J.W. COVID-19 and finance: Agendas for future research. Finance Res. Lett. 2020, 35, 101512. [Google Scholar]
- Mukherjee, A.; Singhal, R.; Shroff, G. Numin: Weighted-Majority Ensembles for Intraday Trading. In Proc. 5th ACM Int. Conf. AI Finance (ICAIF ’24); ACM, 2024; pp. 703–710. [Google Scholar] [CrossRef]
- Orra, A.; Bhambu, A.; Choudhary, H.; Thakur, M. Dynamic Reinforced Ensemble using Bayesian Optimization for Stock Trading. In Proc. 5th ACM Int. Conf. AI Finance (ICAIF ’24); ACM, 2024; pp. 361–369. [Google Scholar] [CrossRef]
- Balijepalli, N.S.S.; Thangaraj, V. Prediction of cryptocurrency’s price using ensemble machine learning algorithms. Eur. J. Manag. Bus. Econ. 2025. [Google Scholar] [CrossRef]
- Dong, Y.; Huang, H.; Zhang, G.; Jin, J. Adaptive Transit Signal Priority Control for Traffic Safety and Efficiency Optimization: A Multi-Objective Deep Reinforcement Learning Framework. Mathematics 2024, 12, 3994. [Google Scholar] [CrossRef]
- Fujimoto, S.; van Hoof, H.; Meger, D. Addressing Function Approximation Error in Actor-Critic Methods. In Proc. 35th Int. Conf. Mach. Learn. (ICML) 2018, 1582–1591. [Google Scholar]
- Buehler, H.; Gonon, L.; Teichmann, J.; Wood, B. Deep Hedging. Quant. Finance 2019, 19, 1271–1291. [Google Scholar] [CrossRef]
- Gao, H.; Kou, G.; Liang, H.; Zhang, H.; Chao, X.; Li, C.C.; Dong, Y. Machine learning in business and finance: A literature review and research opportunities. Financ. Innov. 2024, 10, 86. [Google Scholar]
- Sangve, S.; Kohad, N.D.; Khot, P.C.; Khobragrade, S.D.; Kumbhar, S.S. ProfitPulse: Reinforcement Learning-Driven Trading Strategy. Cureus J. Comput. Sci. 2025, 2, es44389–024. [Google Scholar] [CrossRef]
- Bai, X.; Zhuang, S.; Xie, H.; Guo, L. Leveraging Generative Artificial Intelligence for Financial Market Trading Data Management and Prediction. Preprints 2024. [Google Scholar] [CrossRef]
- Zhang, Z.; Zohren, S.; Roberts, S. Deep reinforcement learning for trading. J. Financ. Data Sci. 2020, 2, 25–40. [Google Scholar] [CrossRef]
- Narayana, M.L.; Kartha, A.J.; Mandal, A.K.; et al. Ensemble time series models for stock price prediction and portfolio optimization with sentiment analysis. J. Intell. Inf. Syst. 2025. [Google Scholar] [CrossRef]
- Vojtko, R.; Dujava, C. Using Inflation Data for Systematic Gold and Treasury Investment Strategies. SSRN 2025. [Google Scholar] [CrossRef]
- Li, W. The Study on the Application of Machine Learning Algorithms for Stock Prices Prediction During Special Periods. In Proc. Int. Workshop Navigating Digit. Bus. Frontier Sustain. Financ. Innov. (ICDEBA 2024); Atlantis Press, 2025; pp. 656–663. [Google Scholar] [CrossRef]
- Shahzad, S.J.H.; Raza, N.; Balcilar, M.; Ali, S.; Shahbaz, M. Can economic policy uncertainty and investors sentiment predict commodities returns and volatility? Resour. Policy 2017, 53, 208–218. [Google Scholar] [CrossRef]
- Kumar, A.; Ji, T. CryptoPulse: Short-Term Cryptocurrency Forecasting with Dual-Prediction and Cross-Correlated Market Indicators. arXiv 2025, arXiv:2502.19349. Available online: https://arxiv.org/abs/2502.19349.
- Mohammed, K.S.; Obeid, H.; Oueslati, K.; Kaabia, O. Investor sentiments, economic policy uncertainty, US interest rates, and financial assets: Examining their interdependence over time. Financ. Res. Lett. 2023, 57, 104180. [Google Scholar] [CrossRef]
- Qureshi, S.; Saeed, A.; Ahmad, F.; Khattak, A.; Almotiri, S.; Al Ghamdi, M.; Rukh, M. Evaluating machine learning models for predictive accuracy in cryptocurrency price forecasting. PeerJ Comput. Sci. 2025, 11, e2626. [Google Scholar] [CrossRef]
- Zúñiga-Cedillo, S.Y.; Jiménez-Preciado, A.L.; Cruz-Aké, S.; Venegas-Martínez, F. Behavioral Economics and Stock Market Sentiments in Investment Decisions in Mexico: Web Scraping, Natural Language Processing, and Pearson Correlation of Scores. Int. J. Econ. Financ. Issues 2025, 15, 344–354. [Google Scholar] [CrossRef]
- Jorion, P. Value at Risk: The New Benchmark for Managing Financial Risk, 3rd ed.; McGraw Hill Professional: New York, NY, USA, 2006. [Google Scholar]
- Rockafellar, R.; Uryasev, S. Optimization of conditional value-at-risk. J. Risk 2000, 2, 21–41. [Google Scholar]
- Alexander, C. Market Risk Analysis, Quantitative Methods in Finance; John Wiley & Sons: Hoboken, NJ, USA, 2008. [Google Scholar]
- Hull, J. Risk Management and Financial Institutions, 4th ed.; John Wiley & Sons: Hoboken, NJ, USA, 2015. [Google Scholar]
- Celestin, M.; Kumar, D.A.; Asamoah, P. Applications of GARCH Models for Volatility Forecasting in High-Frequency Trading Environments. Zenodo 2025, 10, 12–21. [Google Scholar] [CrossRef]
- Tsay, R.S. Analysis of Financial Time Series, 2nd ed.; John Wiley & Sons: Hoboken, NJ, USA, 2005. [Google Scholar]
- Enenkel, M.; Engle, N.L.; Svoboda, M. A major blind spot in drought risk financing: water services in low-income countries. Front. Clim. 2024. Available online: https://api.semanticscholar.org/CorpusID:270682748. [CrossRef]
- Pagano, M.S.; Schwartz, R.A. A closing call’s impact on market quality at Euronext Paris. J. Financ. Econ. 2003, 68, 439–484. [Google Scholar] [CrossRef]
- Rodríguez Cuadro, D.; Pérez-Plaza, S.; Castaño-Martínez, A.; Fernández-Palacín, F. A Study of the Colombian Stock Market with Multivariate Functional Data Analysis (FDA). Math. 2025, 13. [Google Scholar] [CrossRef]
- Koutmos, G.; Booth, G.G. Asymmetric volatility transmission in international stock markets. J. Int. Money Finance 1995, 14, 747–762. [Google Scholar] [CrossRef]
- Damodaran, A. Investment Valuation: Tools and Techniques for Determining the Value of Any Asset; John Wiley & Sons: Hoboken, NJ, USA, 2012. [Google Scholar]
- Dong, J. Silicon Valley Bank Bankruptcy—Liquidity Risk Analysis Based on Financial Statements. SHS Web Conf. 2024. [Google Scholar] [CrossRef]
- Majnoni, G.; Martinez Peria, M.; Blaschke, W.; Jones, M. Stress Testing of Financial Systems: An Overview of Issues, Methodologies, and FSAP Experiences. IMF Work. Pap. 2001, 01. [Google Scholar] [CrossRef]
- Sorge, M. Stress-Testing Financial Systems: An Overview of Current Methodologies. BIS Working Paper No. 165. 2004. [Google Scholar] [CrossRef]
- Sutton, R.S.; Barto, A.G. Reinforcement Learning: An Introduction, 2nd ed.; The MIT Press: Cambridge, MA, USA, 2018. [Google Scholar]
- Hamilton, J.D. A New Approach to the Economic Analysis of Nonstationary Time Series and the Business Cycle. Econometrica 1989, 57, 357–384. [Google Scholar] [CrossRef]
- Ooi, K.L. (2025). Modern Behavioural Finance Theories. In: Theories to Contemporary Applications and Future Perspectives. Springer. https://link.springer.com/chapter/10.1007/978-981-96-2690-8_4.
- Hachaïchi, Y.; Lanwer, A. Benchmarking Reinforcement Learning (RL) Algorithms for Portfolio Optimization. RG 2024. [Google Scholar] [CrossRef]
- Benhamou, E. Can Deep Reinforcement Learning solve the portfolio allocation problem? Université Paris Sciences et Lettres 2023. Available online: https://tel.archives-ouvertes.fr/tel-04397754.
- Sattar, A.; Sarwar, A.; Gillani, S.; Bukhari, M.; Rho, S.; Faseeh, M. A Novel RMS-Driven Deep Reinforcement Learning for Optimized Portfolio Management in Stock Trading. IEEE Access 2025, 13, 42813–42835. [Google Scholar] [CrossRef]
- Scaletta, G. Deep Reinforcement Learning for Portfolio Optimization. Politec. Torino 2024, Master’s Thesis, Corso di Laurea Magistrale in Ingegneria Informatica (Computer Engineering).
Figure 1.
Cumulative returns comparison of Reinforcement Learning portfolio allocation models.
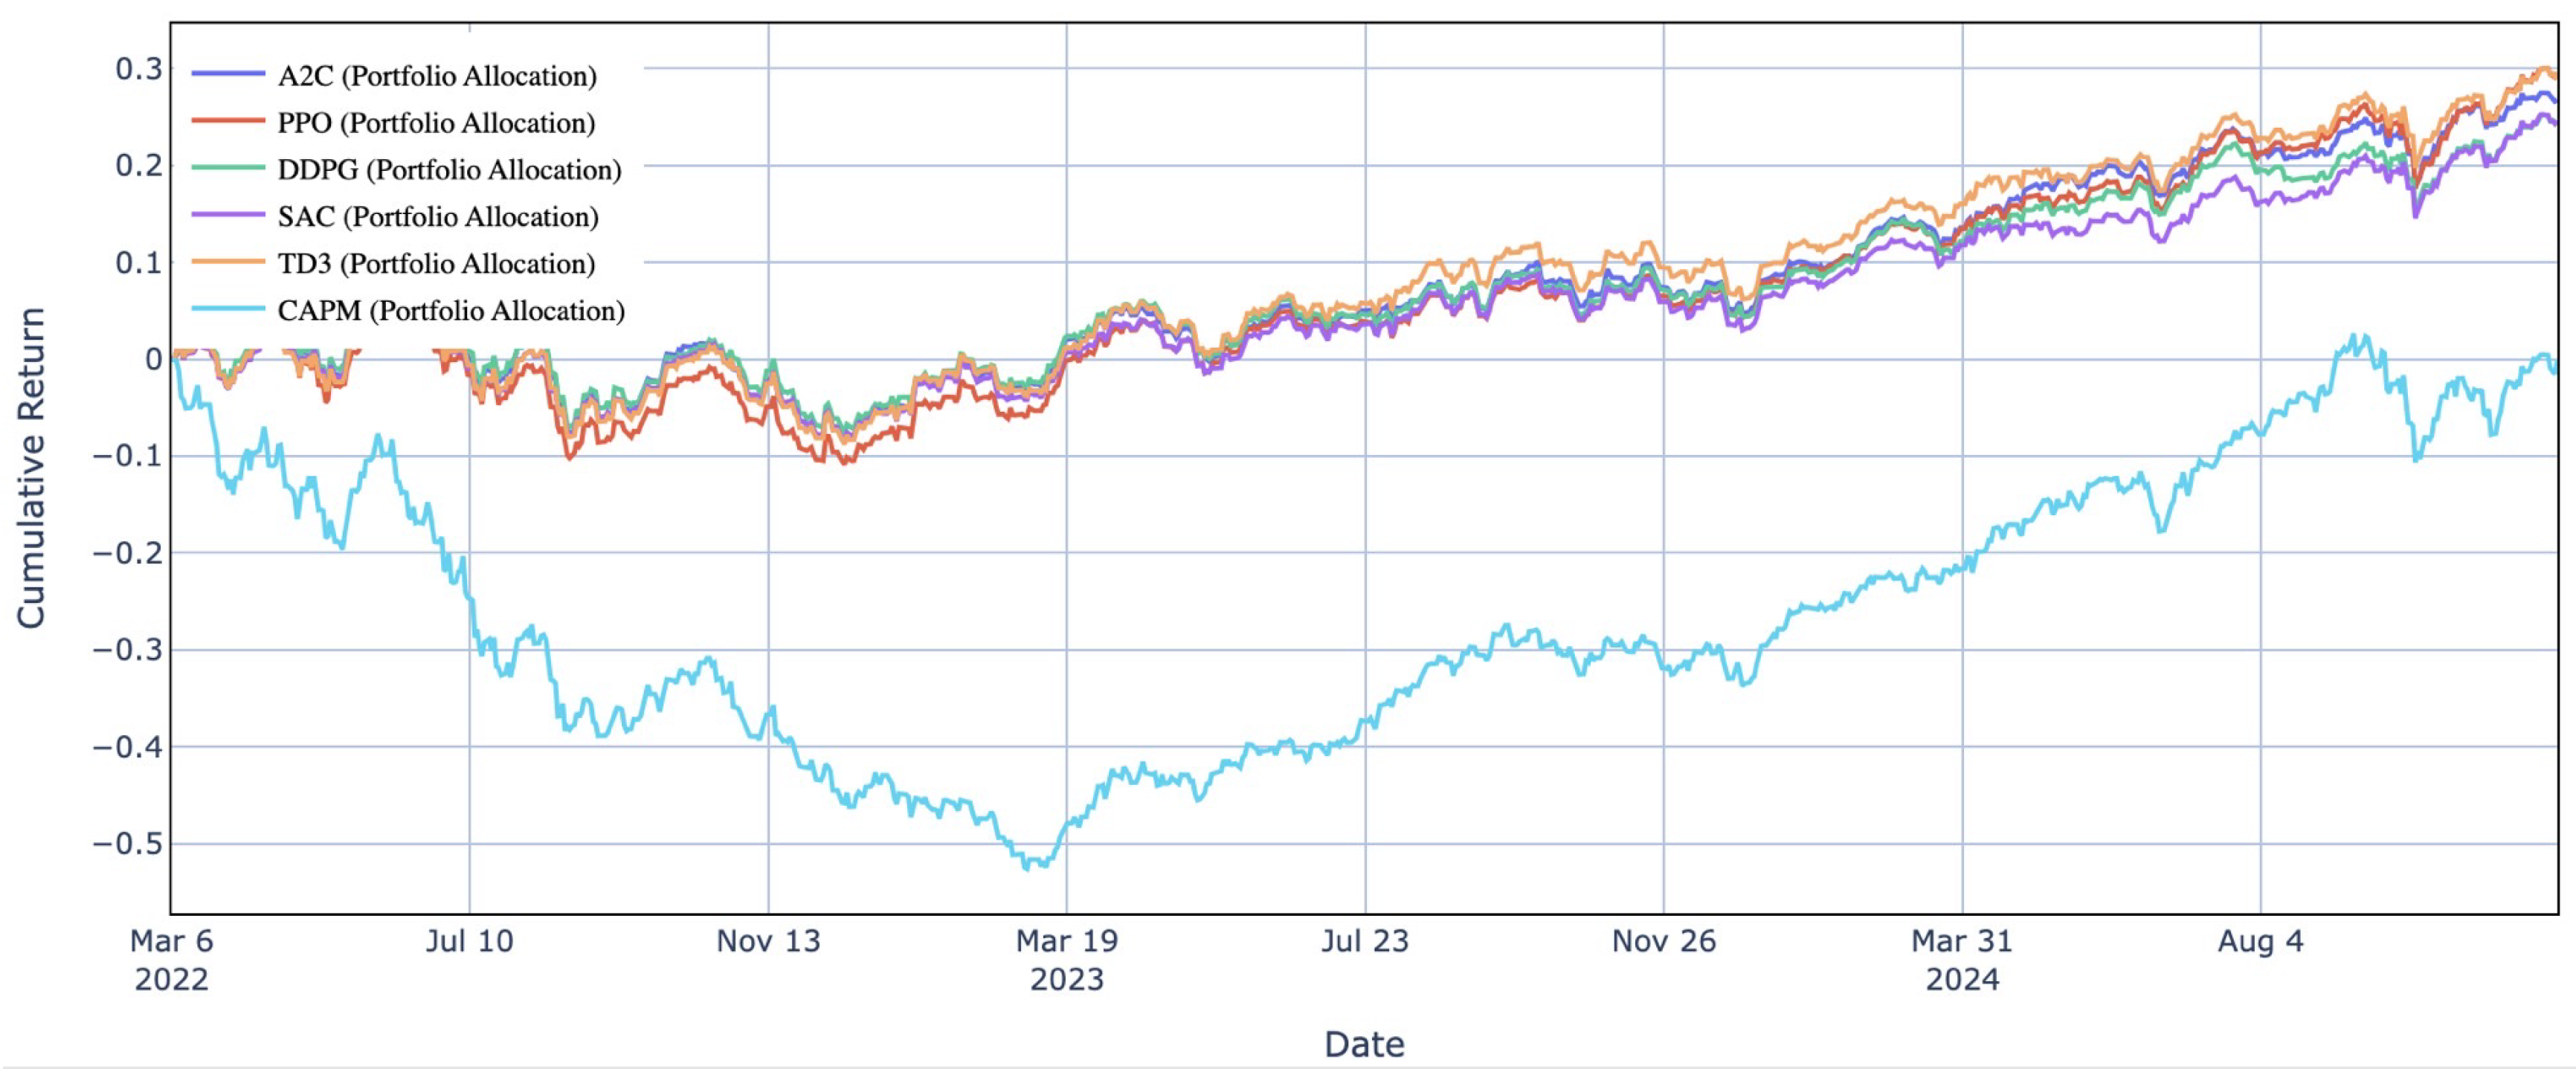
Figure 2.
Comparative performance of traditional and iterative model combining portfolio strategies.
Figure 2.
Comparative performance of traditional and iterative model combining portfolio strategies.
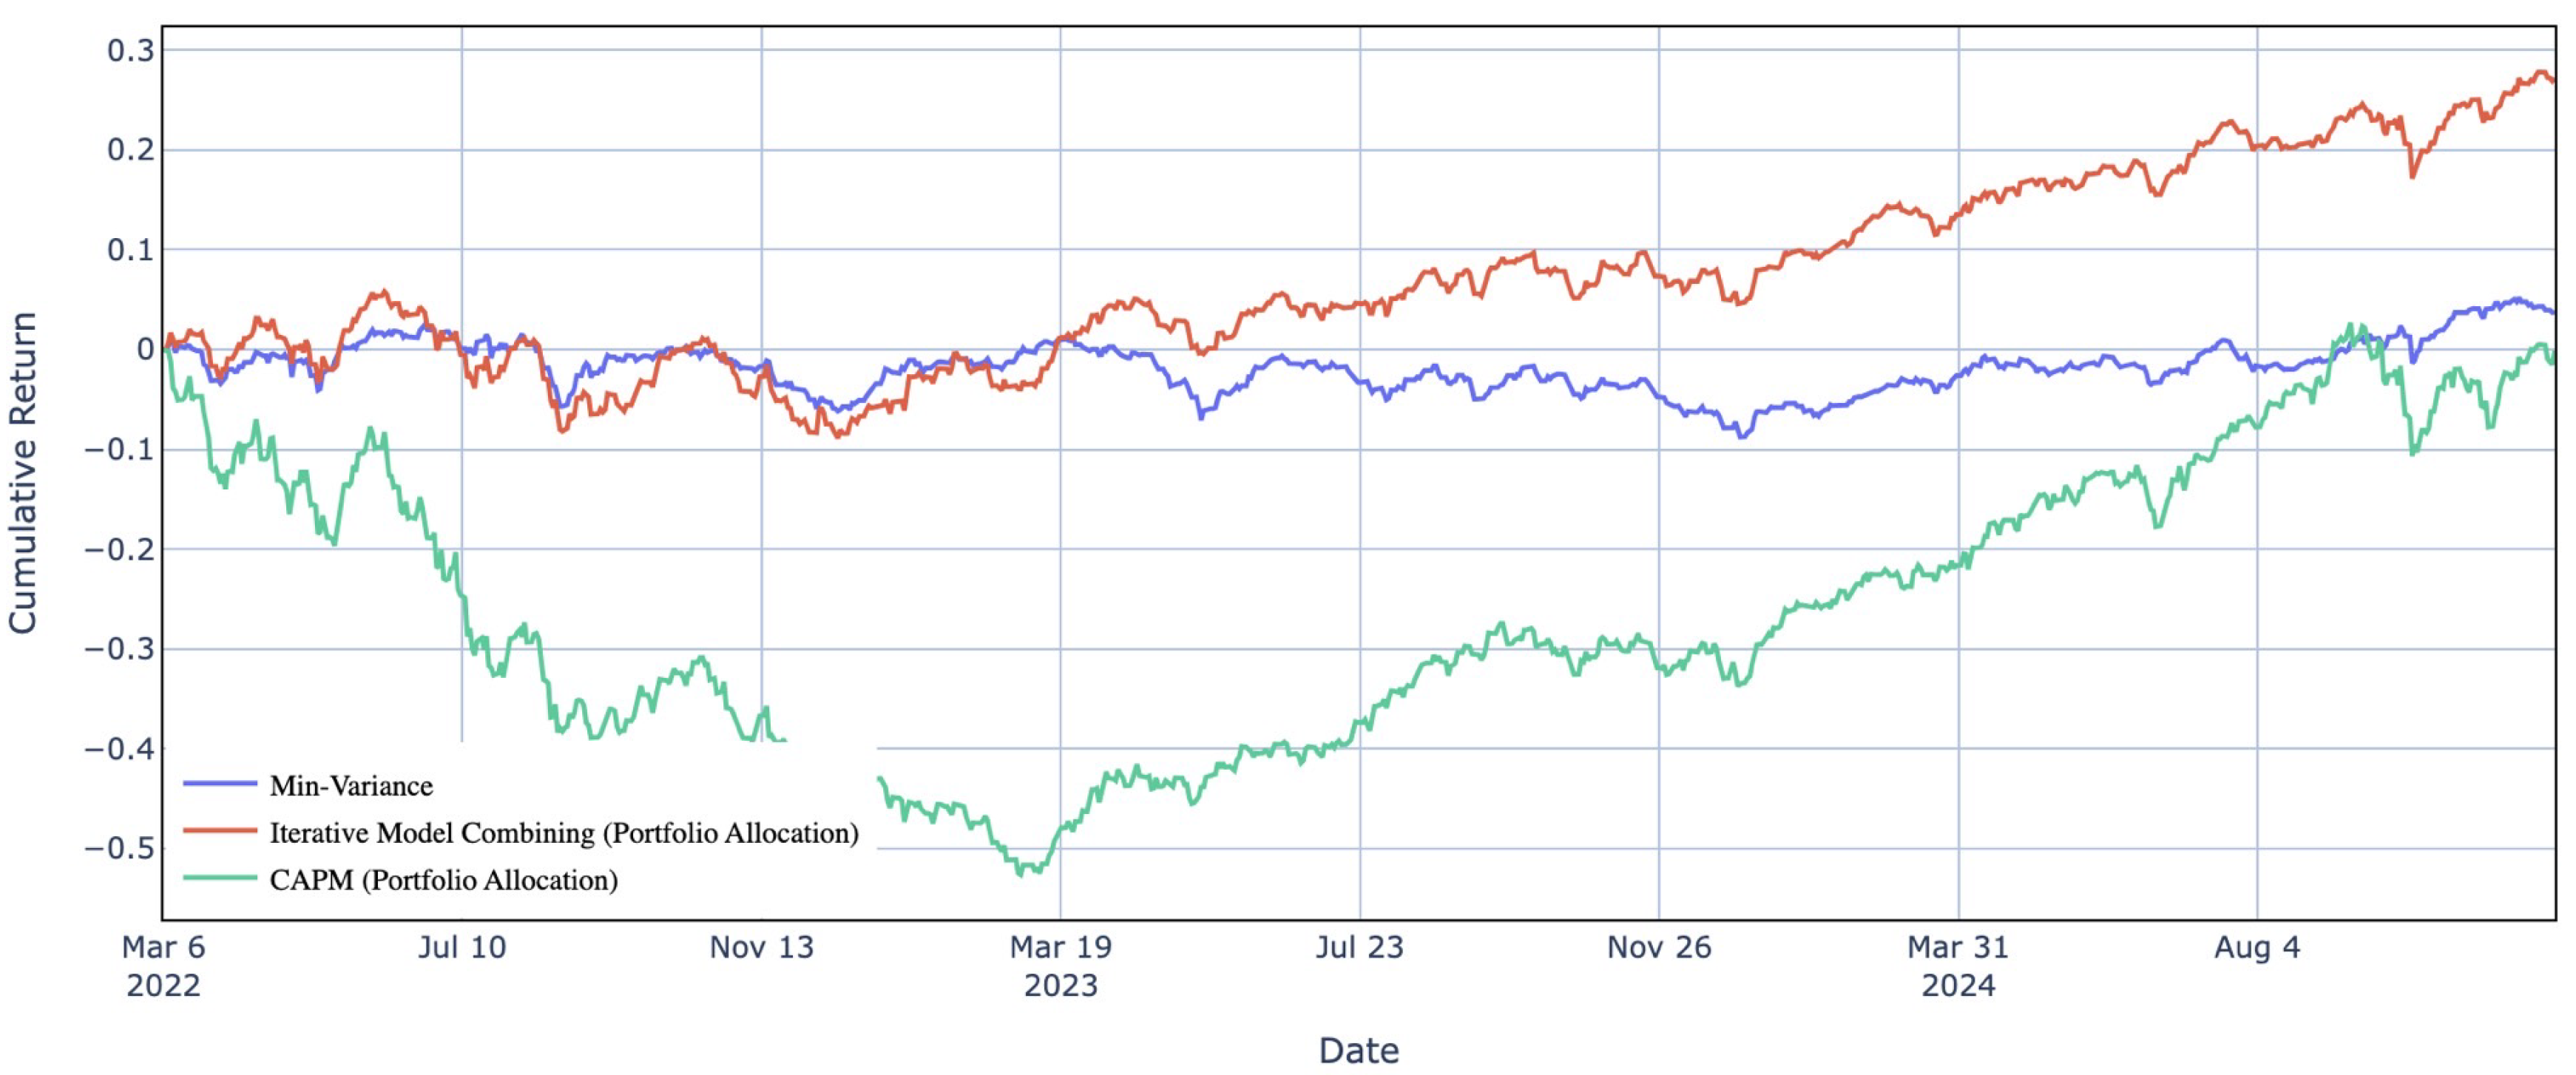
Figure 3.
Dynamic correlation trends during the early market phase (March 2022 - March 2023)
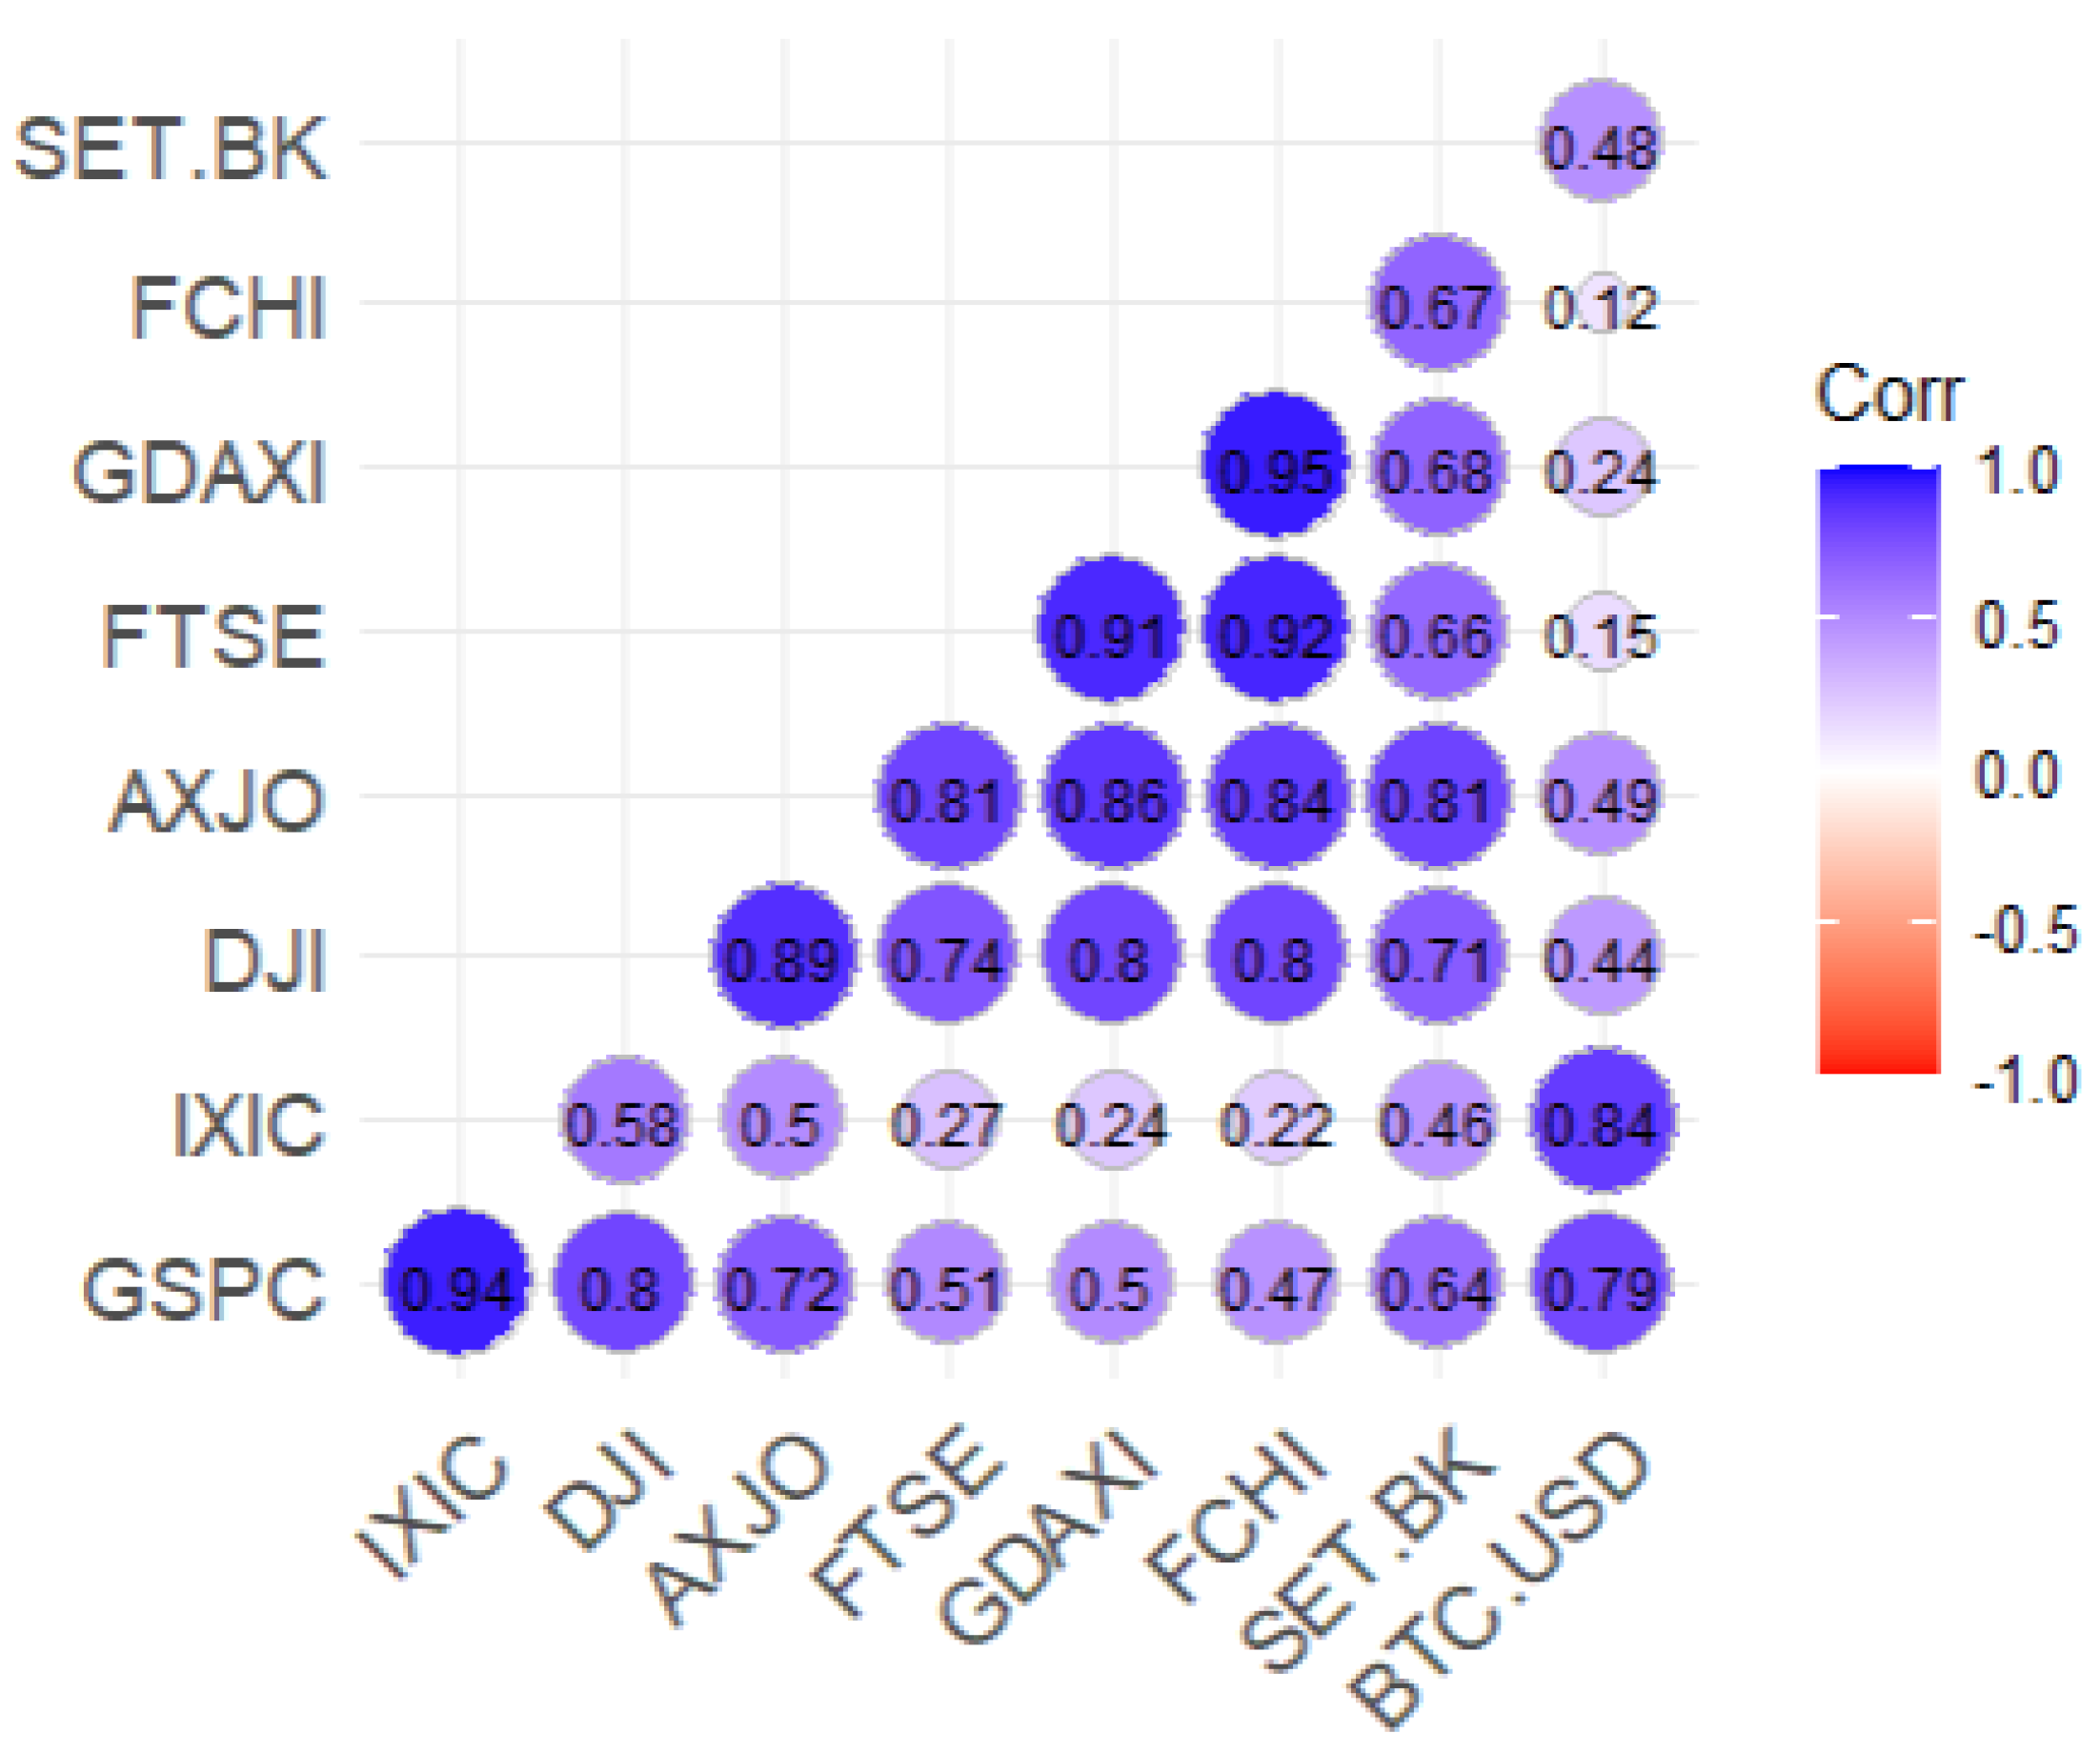
Figure 4.
Dynamic correlation trends during the later market phase (March 2023 - March 2024)
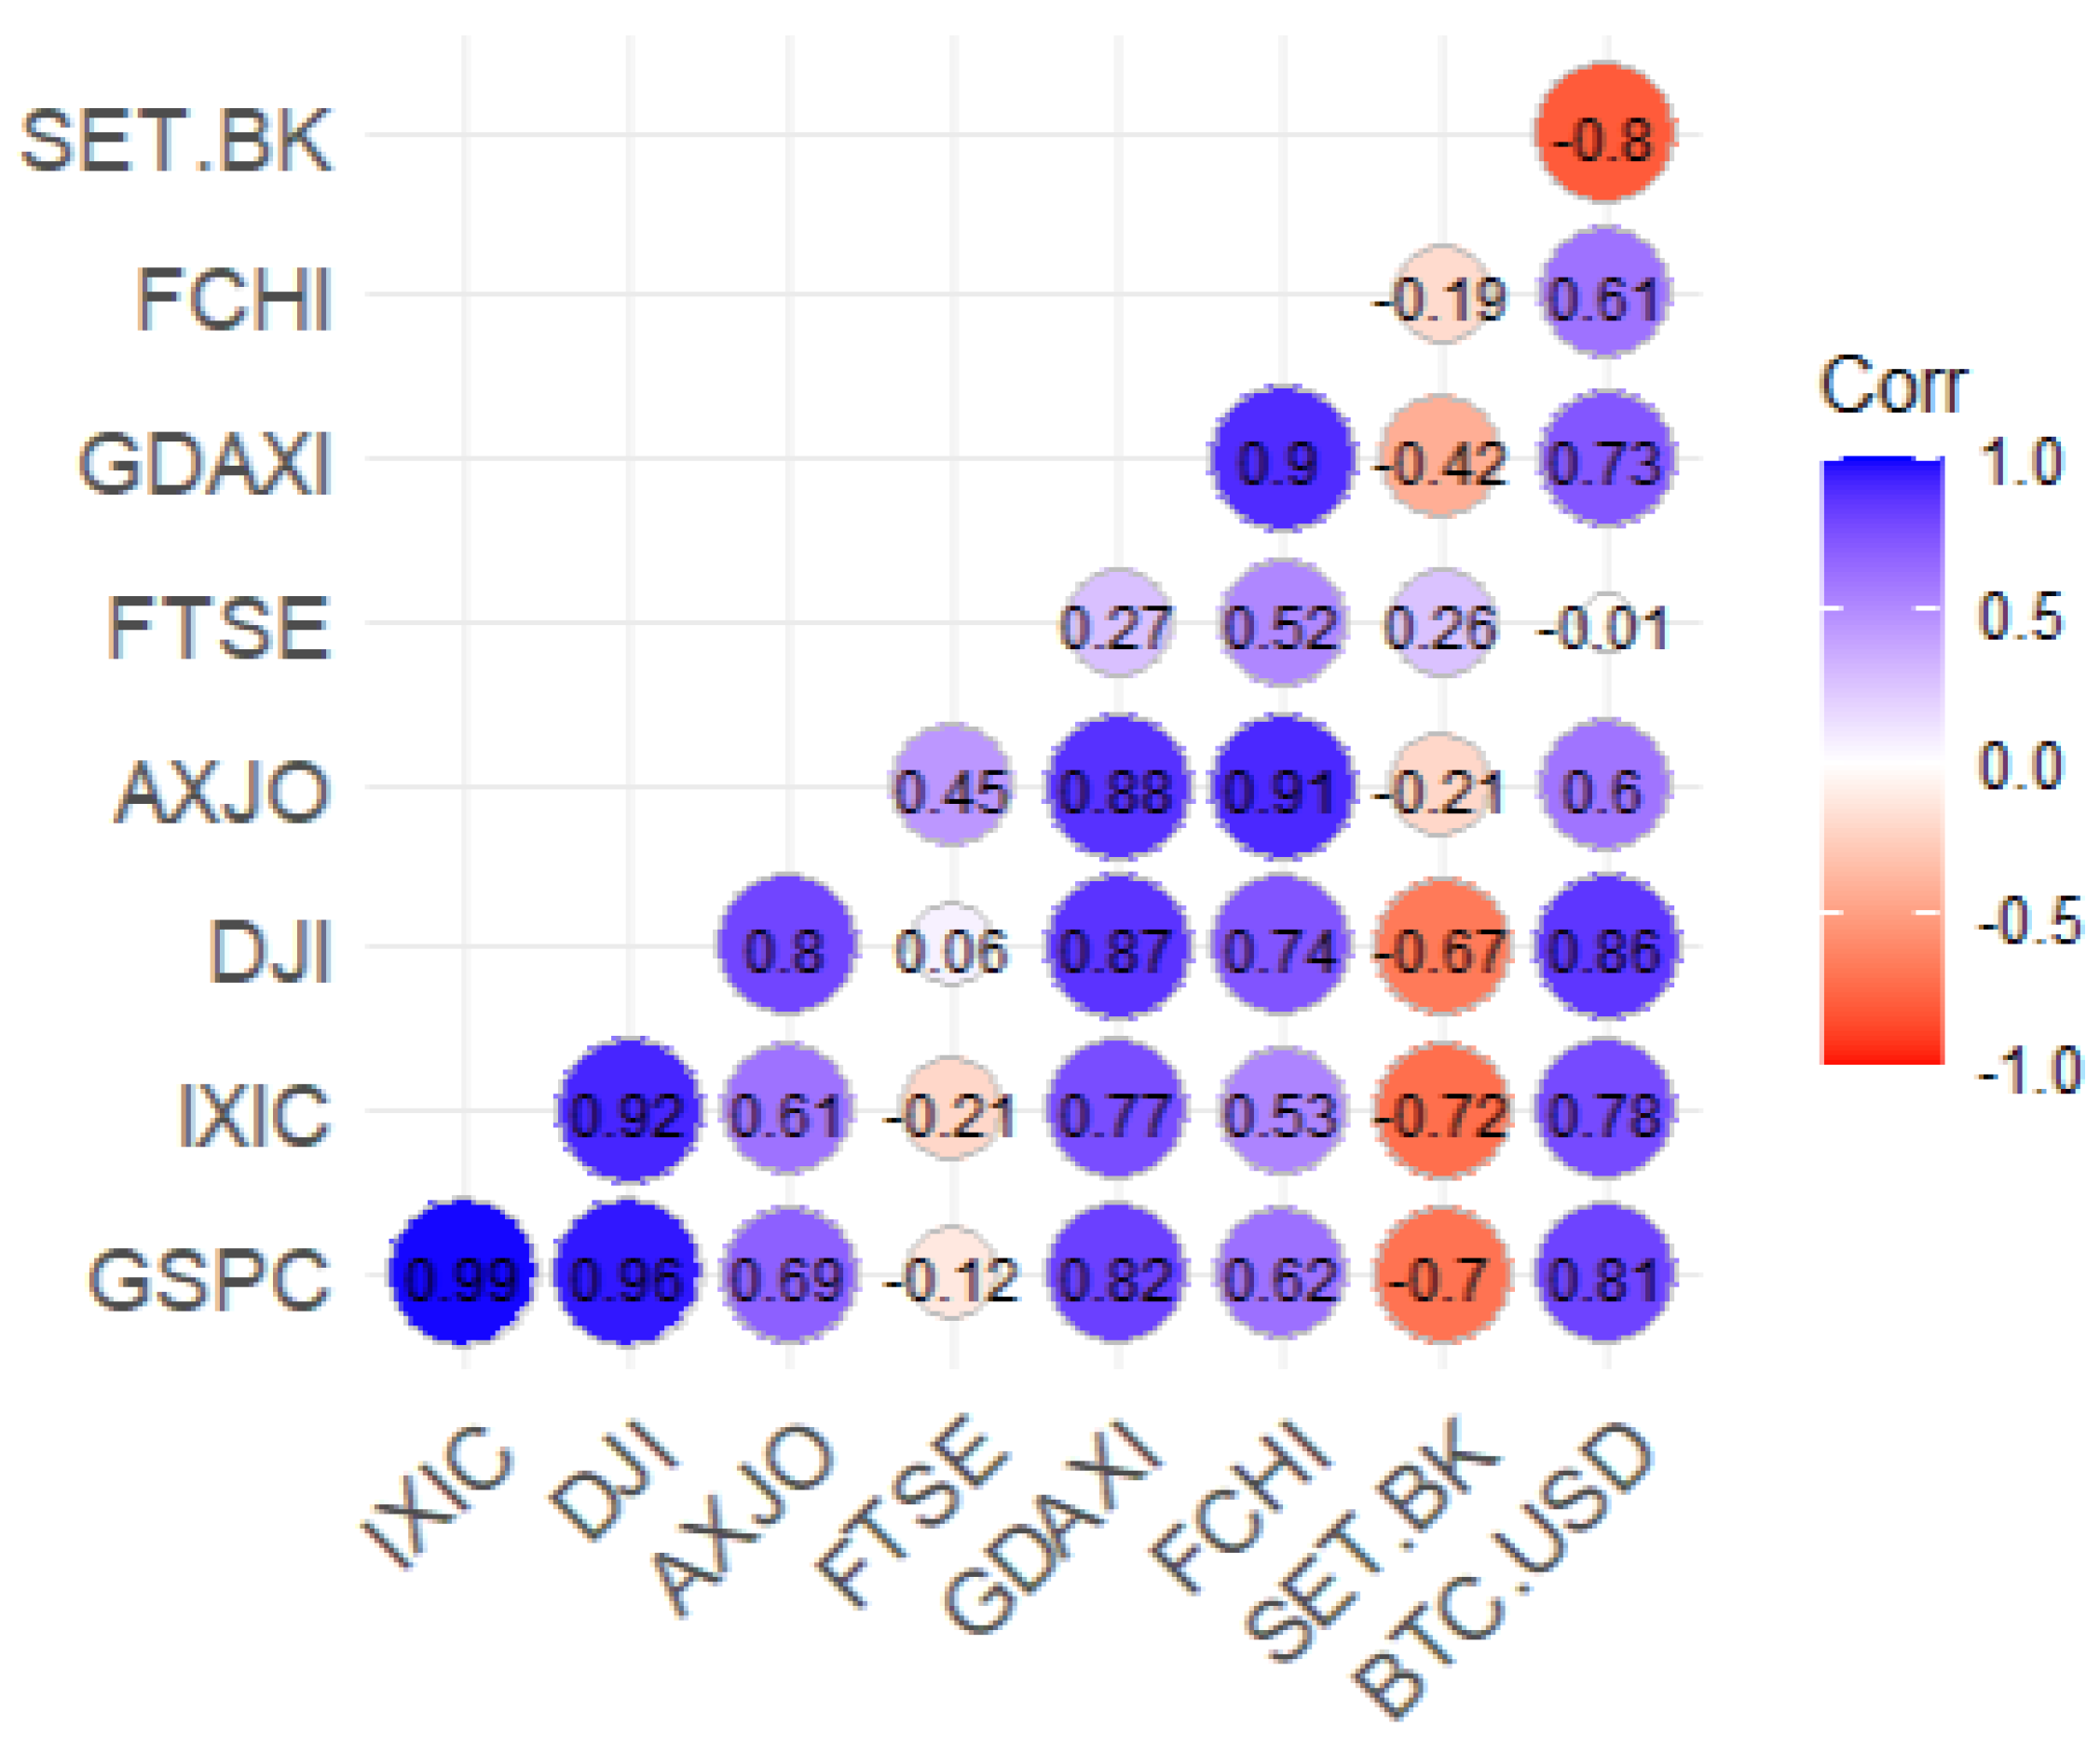
Figure 5.
Learning Progression: Cumulative Rewards of IMCA Across Training Steps.
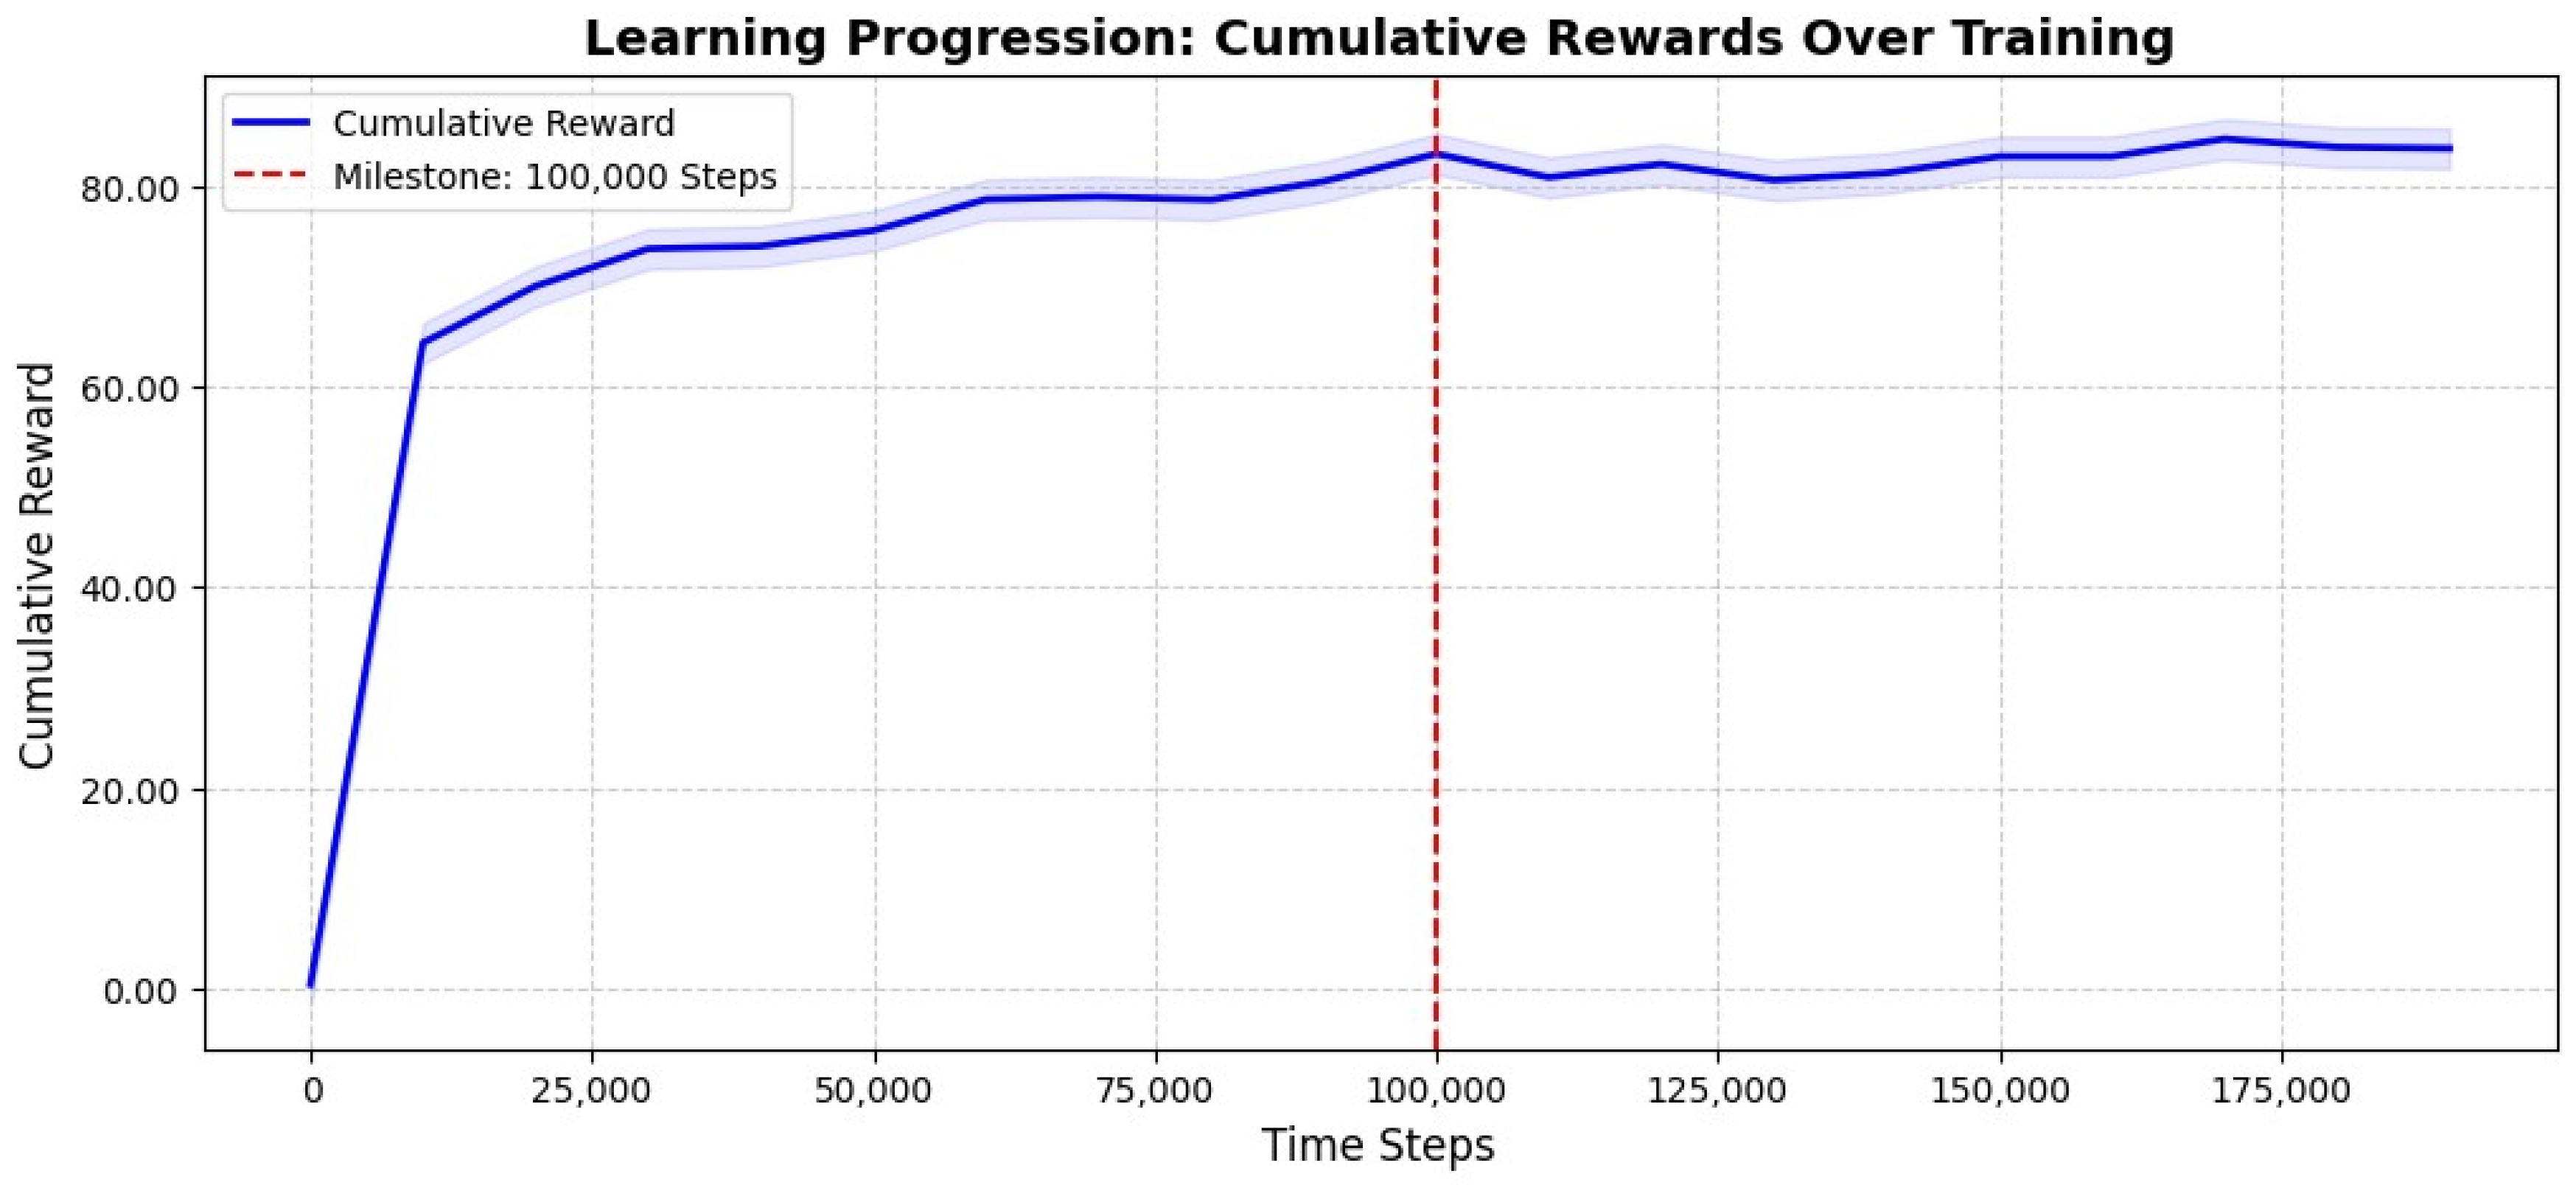
Figure 6.
Learning Progression: Sharpe Ratio of IMCA Across Training Steps.
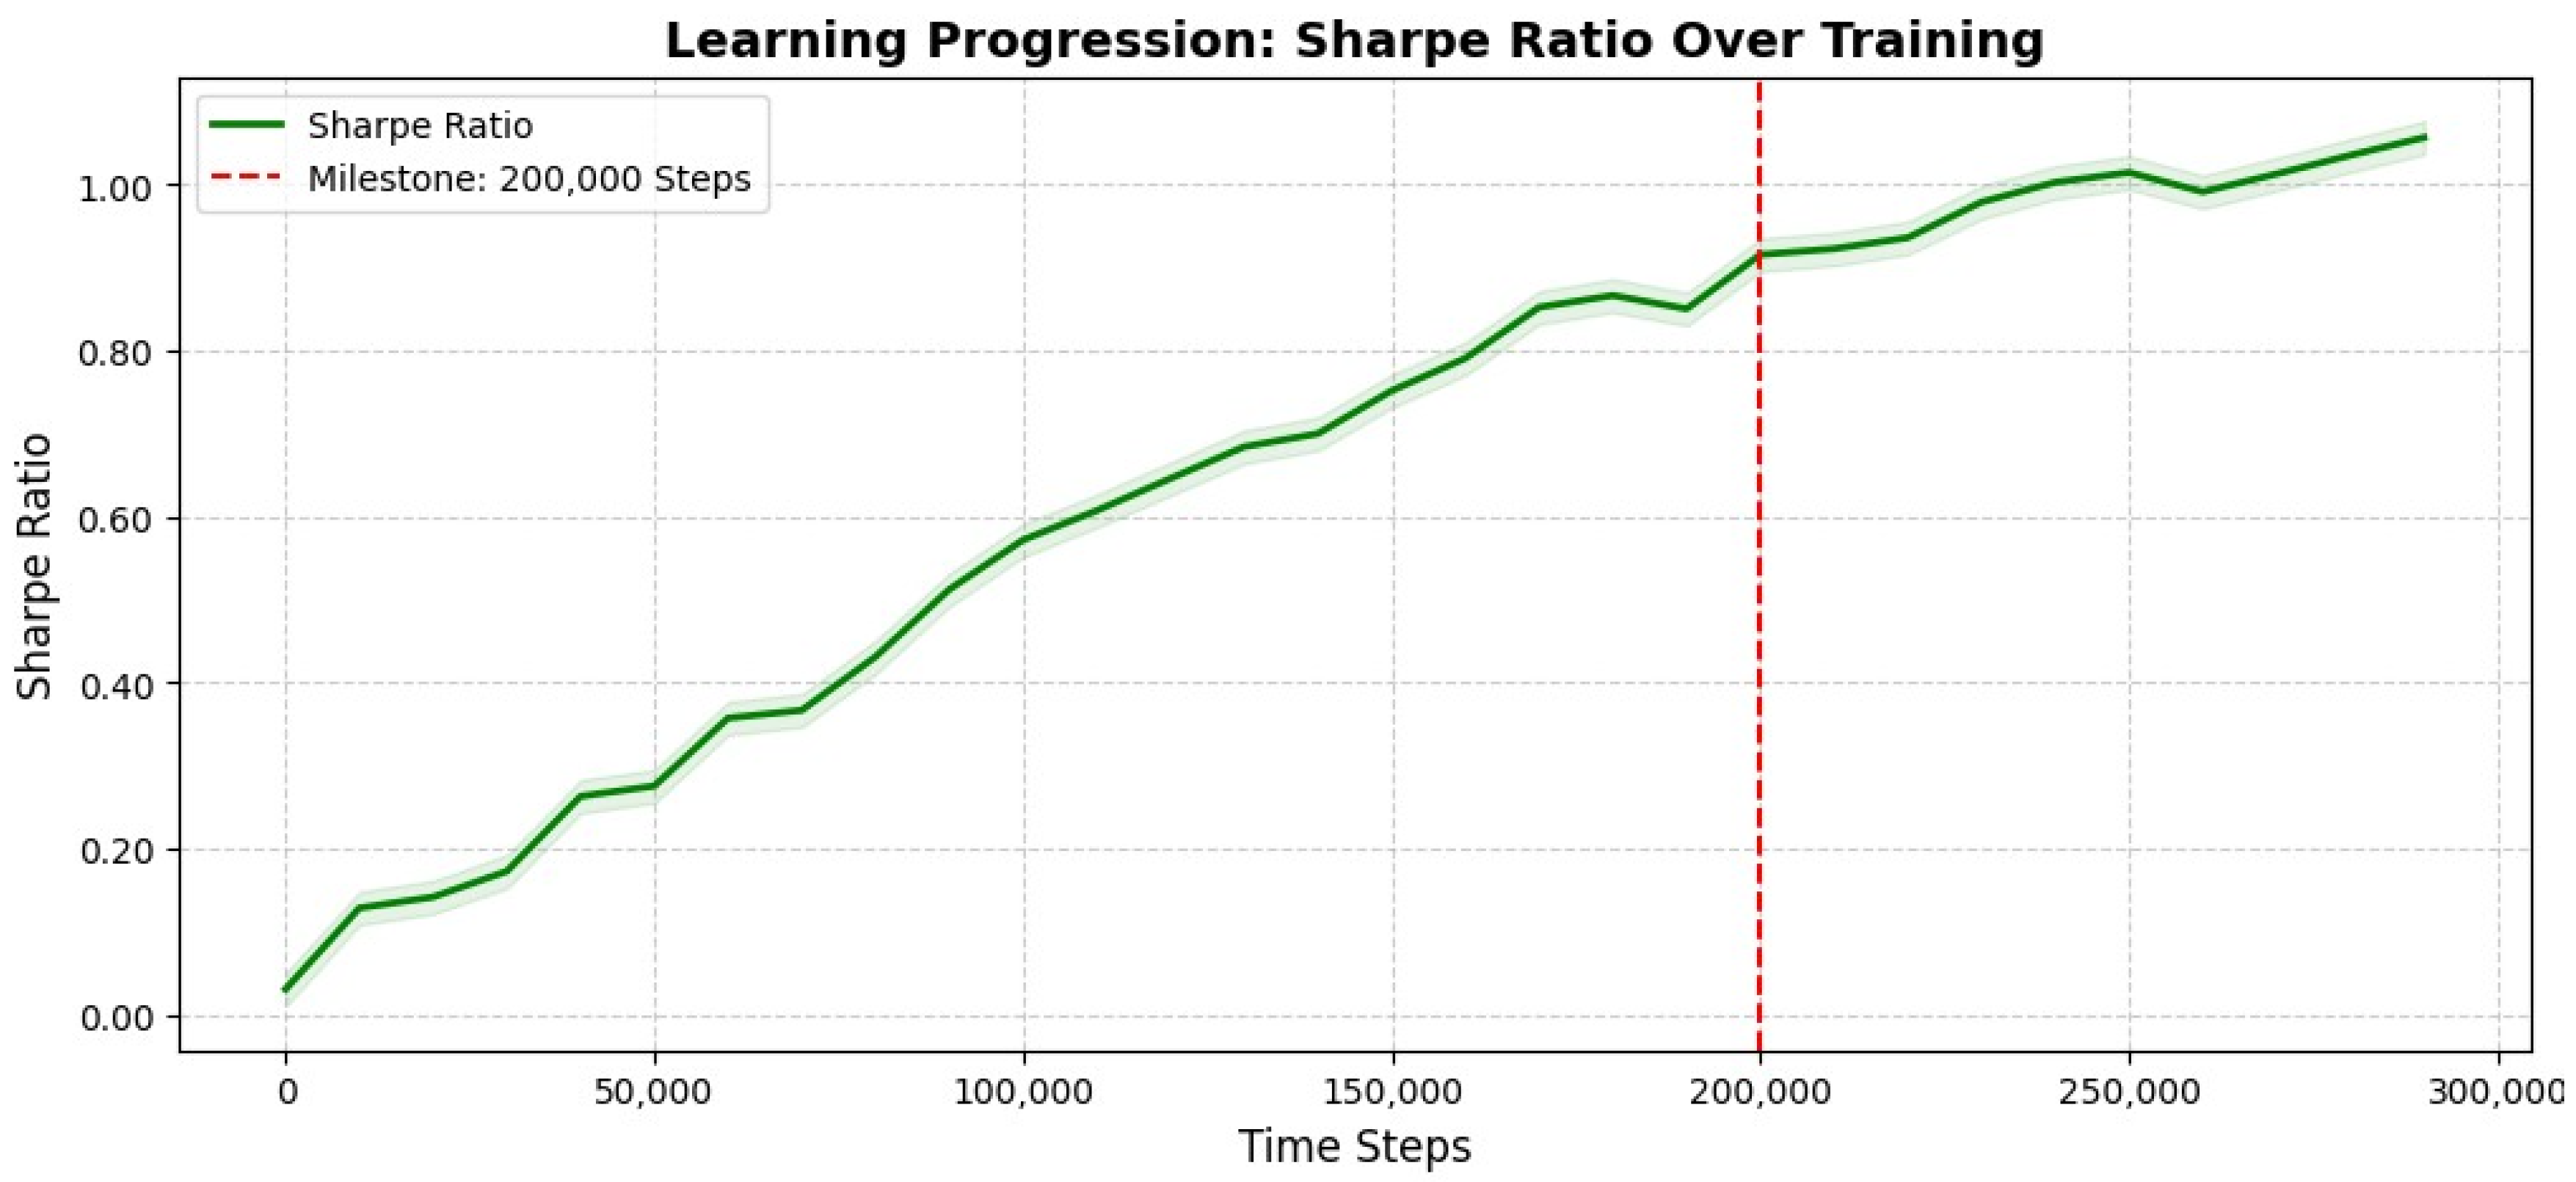

Table 1.
Training times and hyperparameters for each reinforcement learning model.
| Model | Hyperparameters | Timesteps | Training Time |
|---|---|---|---|
| A2C | “n_steps”: 10,000, “ent_coef”: 0.01, “learning_rate”: 0.001 |
200,000 | 8–18 min |
| PPO | “n_steps”: 10,000, “ent_coef”: 0.005, “learning_rate”: 0.001, “batch_size”: 256 |
200,000 | 12–20 min |
| DDPG | “batch_size”: 256, “buffer_size”: 1,000,000, “learning_rate”: 0.001 |
200,000 | 120–130 min |
| SAC | “batch_size”: 256, “buffer_size”: 1,000,000, “learning_rate”: 0.001, “learning_starts”: 0.01, “ent_coef”: “auto_0.1” |
200,000 | 130–140 min |
| TD3 | “batch_size”: 256, “buffer_size”: 1,000,000, “learning_rate”: 0.001 |
200,000 | 115–130 min |
Table 2.
Performance metrics of portfolio allocation models.
| Model | Annual Return (%) | Cumulative Returns (%) | Annual Volatility (%) | Sharpe Ratio | Max Drawdown (%) | Daily VaR (%) |
|---|---|---|---|---|---|---|
| A2C | 5.72 | 27.6 | 8.11 | 0.7053 | -13.20 | -1.00 |
| PPO | 6.04 | 29.3 | 8.08 | 0.7475 | -13.10 | -1.00 |
| DDPG | 5.35 | 25.4 | 8.26 | 0.6477 | -13.85 | -1.02 |
| SAC | 5.10 | 24.4 | 7.70 | 0.6623 | -12.98 | -0.95 |
| TD3 | 6.07 | 29.4 | 8.32 | 0.7296 | -12.96 | -1.02 |
| Min Variance | 0.17 | 0.75 | 5.99 | 0.0284 | -10.96 | -0.75 |
| CAPM | 3.49 | 16.1 | 17.17 | 0.2033 | -50.97 | -2.14 |
| IMCA | 6.80 | 29.5 | 8.20 | 0.8293 | -13.50 | -1.02 |
Disclaimer/Publisher’s Note: The statements, opinions and data contained in all publications are solely those of the individual author(s) and contributor(s) and not of MDPI and/or the editor(s). MDPI and/or the editor(s) disclaim responsibility for any injury to people or property resulting from any ideas, methods, instructions or products referred to in the content. |
© 2025 by the authors. Licensee MDPI, Basel, Switzerland. This article is an open access article distributed under the terms and conditions of the Creative Commons Attribution (CC BY) license (http://creativecommons.org/licenses/by/4.0/).
Copyright: This open access article is published under a Creative Commons CC BY 4.0 license, which permit the free download, distribution, and reuse, provided that the author and preprint are cited in any reuse.


