1. Introduction
Packaging is subject to random vibrations during transport. It is a set of frequencies and amplitudes constantly varying over time. Indeed, the packaging, by its design, can amplify or attenuate the movements to which it is subjected. Vibration tests make it possible to check the resistance of the packaging to these constraints. They also offer the possibility of comparing the difference in the behavior of different packaging solutions: either qualitatively by a classic test or quantitatively by instrumenting the test. During the product design phase, mechanical tests provide accurate information on structural strength, which is one of the very important steps to confirm the design. Cardboard boxes are made from paperboard, so to determine the mechanical properties of the box, it is necessary to determine the characteristics of the paperboard. There have been many research publications on the mechanical properties of paperboard using in-plane tensile tests, short compression tests, creasing tests, folding tests, and bending tests [
1,
2,
3,
4,
5,
6,
7,
8,
9,
10].
Many studies have been conducted by directly performing vertical compression experiments on corrugated boxes to obtain the force vs. displacement or stress vs. strain curves [
11]. In some studies, the results obtained after box compression are compared with numerical simulation results [
12,
13,
14]. Kwak [
15] studied the compressive strength of corrugated shipping containers with different handle geometries that are sources of decrease in vertical compressive strength. Other studies have evaluated the impact of environmental conditions on the performance of corrugated boxes by comparing the results of vertical compression at different relative humidities [
16]. Thorpe and Choi [
17] studied the behavior of corrugated cardboard boxes subjected to compression test using 2D digital image correlation. However, this method does not allow for the measurement of out-of-plane displacements, which is important when the panels are bent. Viguie et al. [
18] used 3D digital image correlation to determine the complete displacement field and to trace back the stress field of the body panels. Using this method, it is possible to visualize where the elastic limit is reached or exceeded in the panel during box compression.
Previous studies [
19,
20,
21,
22,
23] have analyzed vibration levels during the transportation of goods on road and rail networks to propose Power Spectral Density (PSD) for each type of transport. Testing methods for packaging systems based on these data have been proposed. Low-frequency vibrations (0.1–10 Hz) are much more harmful to products than high-frequency vibrations [
24]. Using the cumulative distribution functions (CDFs) of the RMS (Root Mean Square) values of vibrations in the time domain measured in the lateral, longitudinal, and vertical directions. Paternoster et al. [
25] analyzed the vibration levels of cardboard packaging during the transportation of beers by truck in Belgium. The results show the CDF of the RMS and Kurtosis values of the acceleration signals measured in the time domain during the different transports. It can be concluded that vertical vibrations are the most severe with the highest RMS values. Vibration tests at different frequencies of cardboard boxes containing agricultural products such as apples [
26] and bananas [
27] were carried out to evaluate the performance of the boxes. From these studies, the authors proposed optimized designs of cardboard boxes that reduce damage to the packaged fresh products. Many other vibration tests on cardboard packaging have also been conducted by other researchers. Guo et al. [
28] studied the vibration behavior of corrugated cardboard sheets using slow sine sweep vibration tests to analyze the resonance frequencies, vibration transmissibility, and damping ratios of different sheets. Zhang et al. [
29] tested the vibration resistance of three types of corrugated cardboard boxes by subjecting them to vibration-only tests and drop-plus-vibration tests. They concluded that for vibration-only tests, the package with the highest static stress performed best, while for drop-plus-vibration tests, the package with the lowest static stress performed best. Marcondes and Batt [
30] analyzed the vibration behavior of corrugated cardboard boxes on a force-controlled vibration table. They concluded that the greatest advantage of controlling the vibration table with force rather than acceleration is that a more realistic test can be performed with only a permanent load.
Studies have shown that the determination of durability for cardboard boxes generally uses experiments to directly determine the durability of the box. There is almost no research using numerical models for random vibration experiments on small cardboard boxes. This study will perform static compression and random vibration experiments for cardboard boxes, and numerical simulations of these experiments will also be performed to replace real experiments. This is very important in the packaging design process.
2. Theory
2.1. Random Vibrations
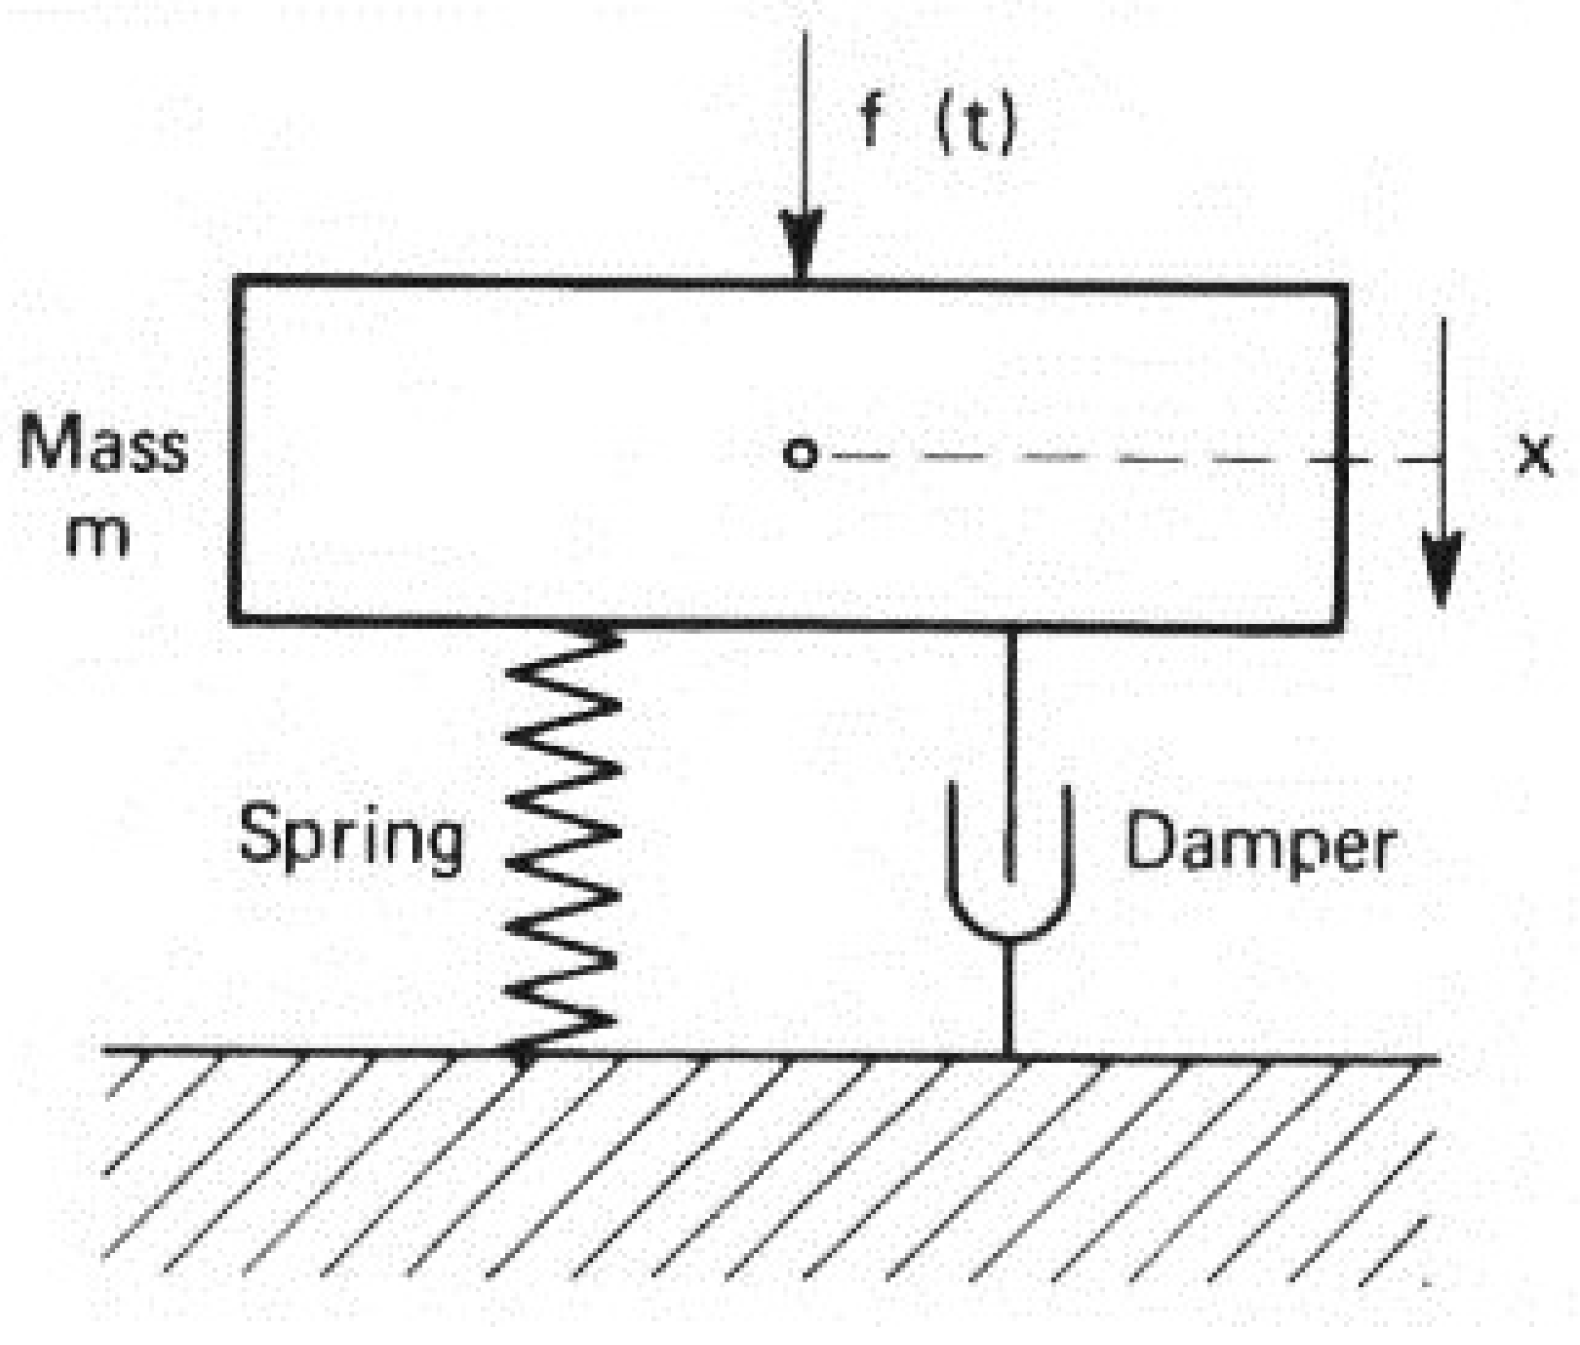
During the transportation of goods, cardboard boxes are often stacked on top of one another to maximize the use of available space and reduce shipping costs. The boxes are subjected to random vibrations occurring during the transport process. To design a random vibration experiment for cardboard boxes, it is essential to rely on the theoretical aspects related to vibration mechanics, frequency spectrum analysis, and random theory. The frequency spectrum represents the distribution of oscillation energy across various frequency bands. Acceleration spectra or Power Spectral Density (PSD) spectra are used to recreate real-world conditions. Consequently, the cardboard box is modeled as a single degree of freedom (SDOF) vibration system (
Figure 1) governed by the basic vibration differential equation:
where m is the mass, c is the damping factor, k is the stiffness, x(t) is the position variation over time, F(t) is the force
In frequency spectrum analysis, the Fourier transform is used to represent force signals and vibration responses in the frequency domain. In the case where the impact force F(t) is considered a random process, it is characterized by:
- Probability Density Function (PDF)
- Autocorrelation function
- Power Spectral Density – PSD:
In the frequency domain, the transfer function H(ω) of the system from the impact force F(t) to the response X(t) is determined. Applying the Fourier transform, to (1) we have:
The function H(ω) can be decomposed into two parts:
- Phase: Represents the phase change of the output signal relative to the input signal. The phase part shows the time shift between the input signal and the output at a given frequency. Power spectrum density (PSD) is used in random vibration analysis. The output power density spectrum is calculated as:
where S_p (ω) is the force spectrum and S_X (ω) is the system response spectrum.
The resonance frequency corresponding to the amplitude H(ω) reaching its maximum corresponds to the natural frequency of the system, which can cause damage if not controlled. Thus, to set up a random vibration experiment, the following requirements must be fully prepared:
Random Vibration Table: Programmed to replicate PSD spectra.
Data Recorder: Used to measure the responses of the cardboard box
Control and Sensor System: Includes accelerometers, pressure sensors, or motion sensors.
ASTM (American Society for Testing and Materials): Standards for random vibration testing of transportation packaging.
2.2. Material Model
Cardboard exhibits anisotropic properties, which means that its mechanical response varies depending on the direction of the applied stress. In this study, we adopt the Isotropic Plasticity Equivalent (IPE) model, as proposed by M¨akel¨a and O¨stlund [
34], to describe the mechanical behavior of paper. The following formulation characterizes the orthotropic elastic behavior under in-plane stresses:
where a, b, c, and d, are the anisotropy parameters.
The stress tensor can be decomposed into a sum of a hydrostatic part and a deviatoric part such that:
Karafillis and Boyce [
35] introduced the isotropic plasticity equivalent (IPE) material concept. The IPE material is a fictitious isotropic material subjected to a stress state equal to the corresponding stress state in the real anisotropic material. The isotropic relationship between the deviatoric stress tensor and the stress tensor given in equation (8) can be expressed as:
The IPE model load surface is given by the following expression:
where σ
y is the yield stress, {s} is the deviatoric stress tensor,
is the equivalent plastic strain, E
0 and ε
0, are two model parameters.
This IPE model was implemented in the ABAQUS software using the VUMAT user subroutine.
3. Experiment
3.1. Studied Material
Paperboard is the material used in this study, with a grammage of 320 g/m
2 and a thickness of 0.51 mm. The paper manufacturing process produces three characteristic directions: machine orientation (MD), cross direction (CD), and out-of-plane direction (ZD). Accordingly, Young’s modulus along the MD direction is usually about 200 times larger than the modulus in the ZD direction [
32]. The Poisson coefficients
vxzand
vyz are close to zero because the strain in the plane is negligible during thickness compression [
33].
3.2. Static Compression Test
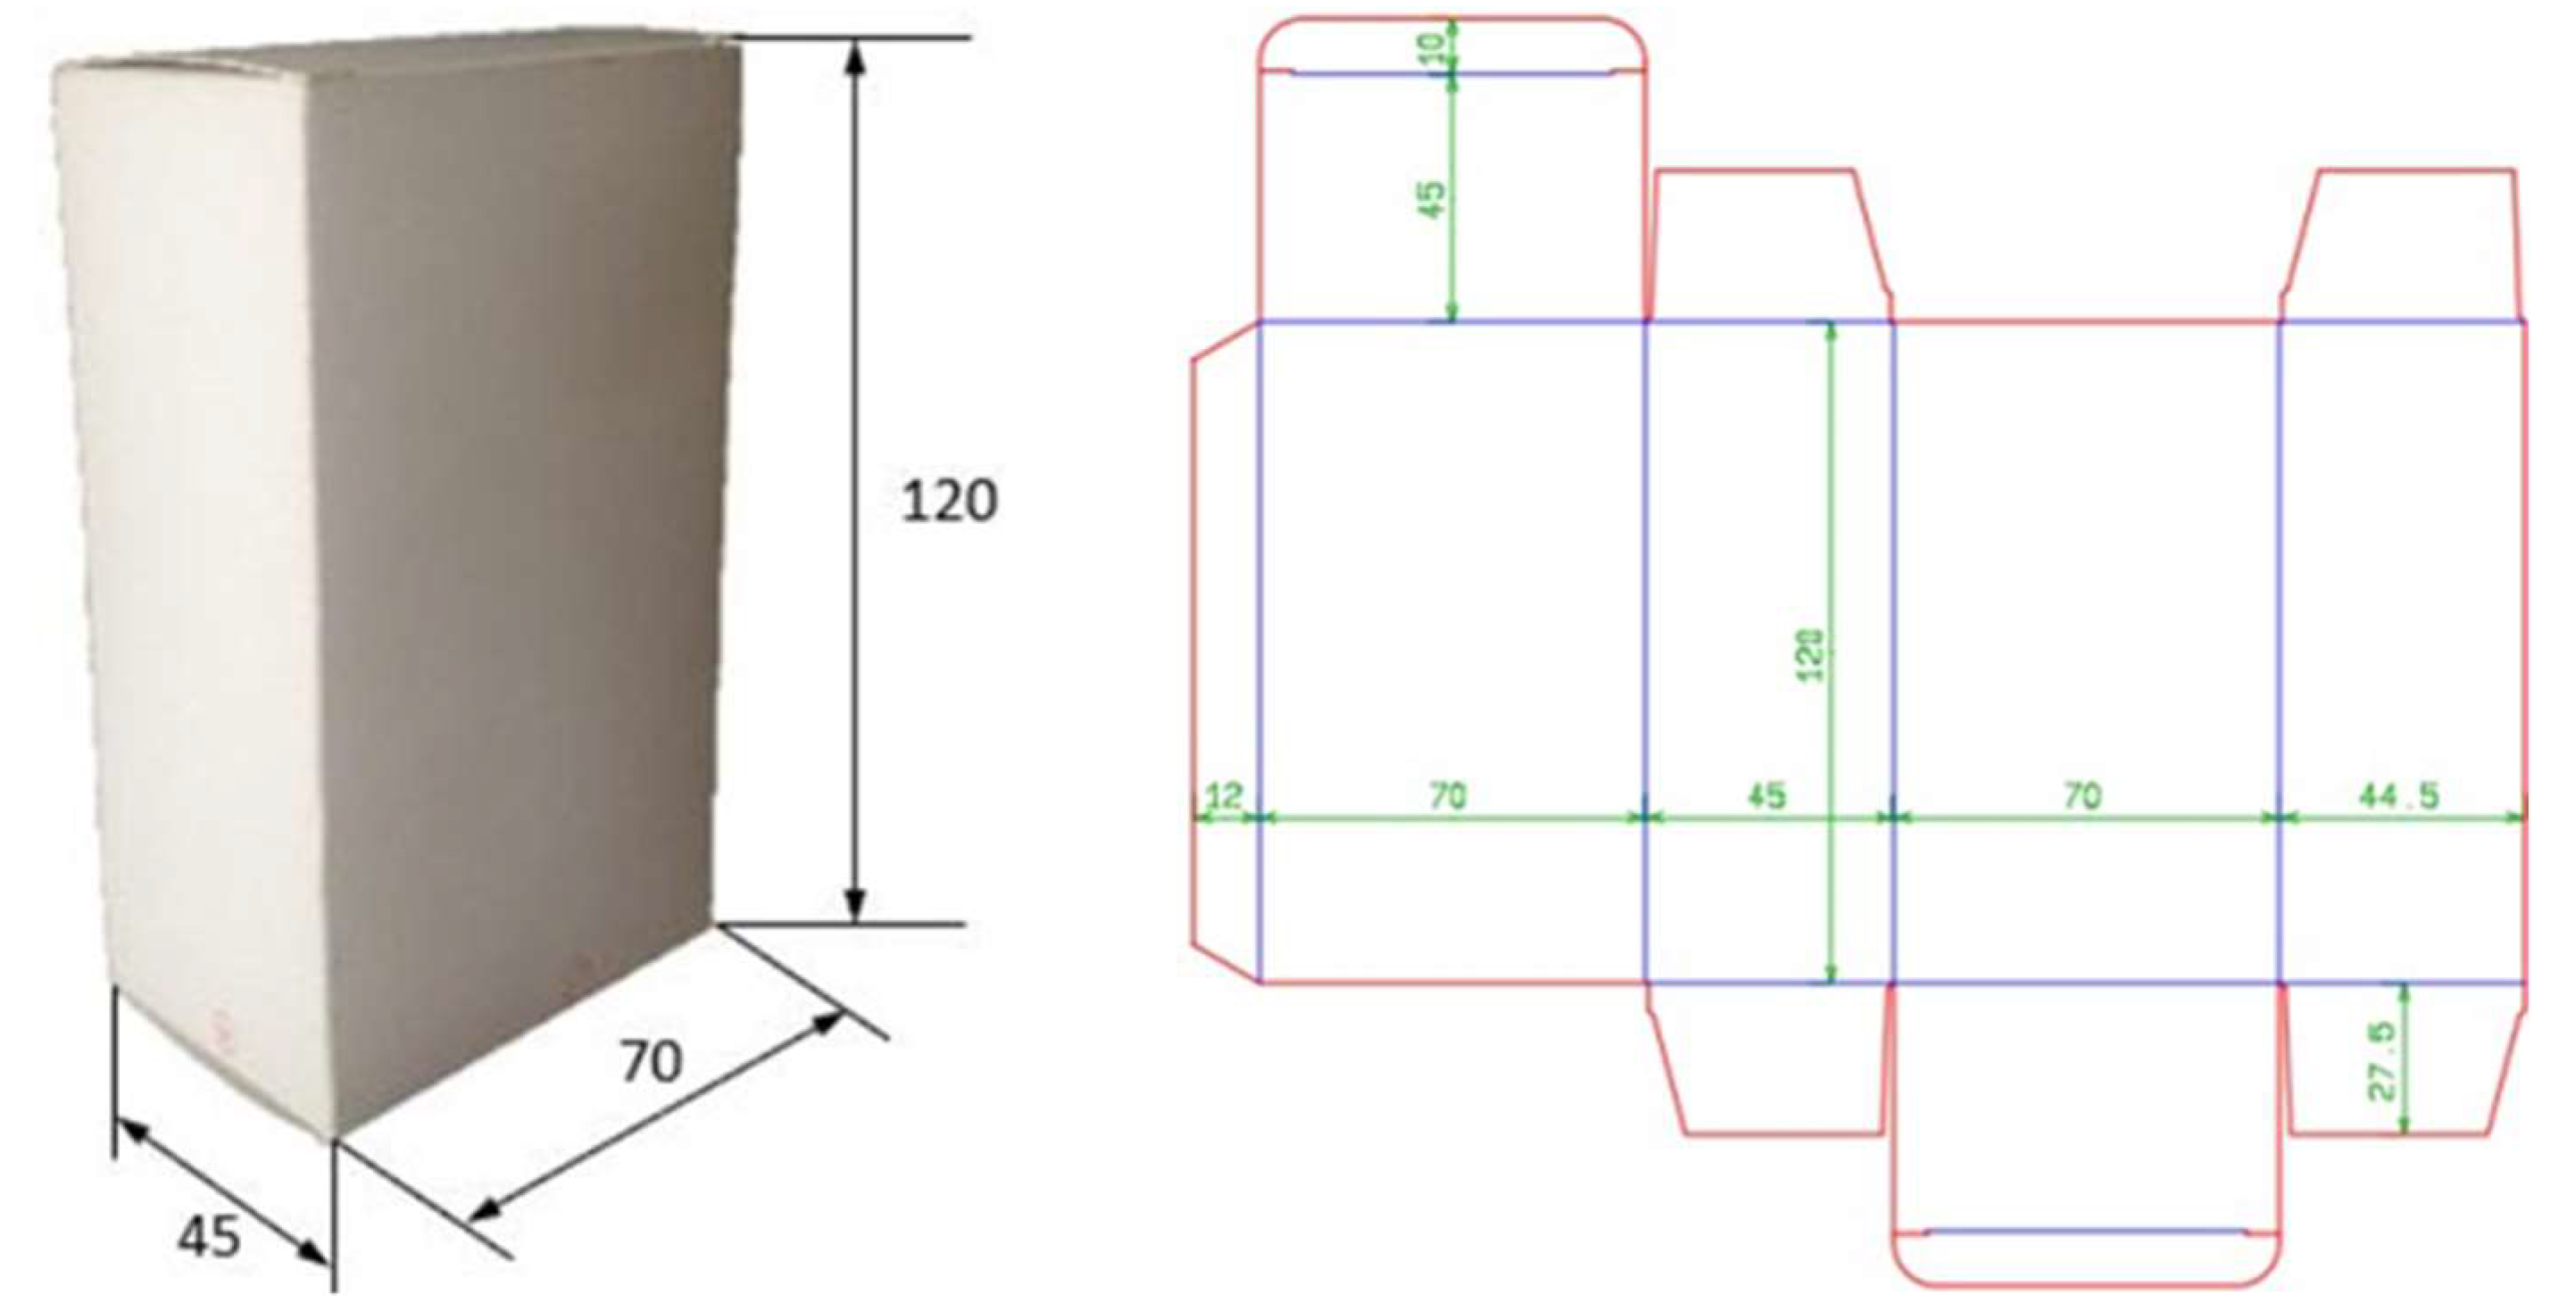
The boxes were designed using ArtiosCAD software and a cutting table (ZU¨ND M-1600). Two series of boxes were cut so that the vertical panels in compression were parallel to the MD and CD directions. The dimensions of the boxes are shown in
Figure 2. Three tests were carried out on each series.
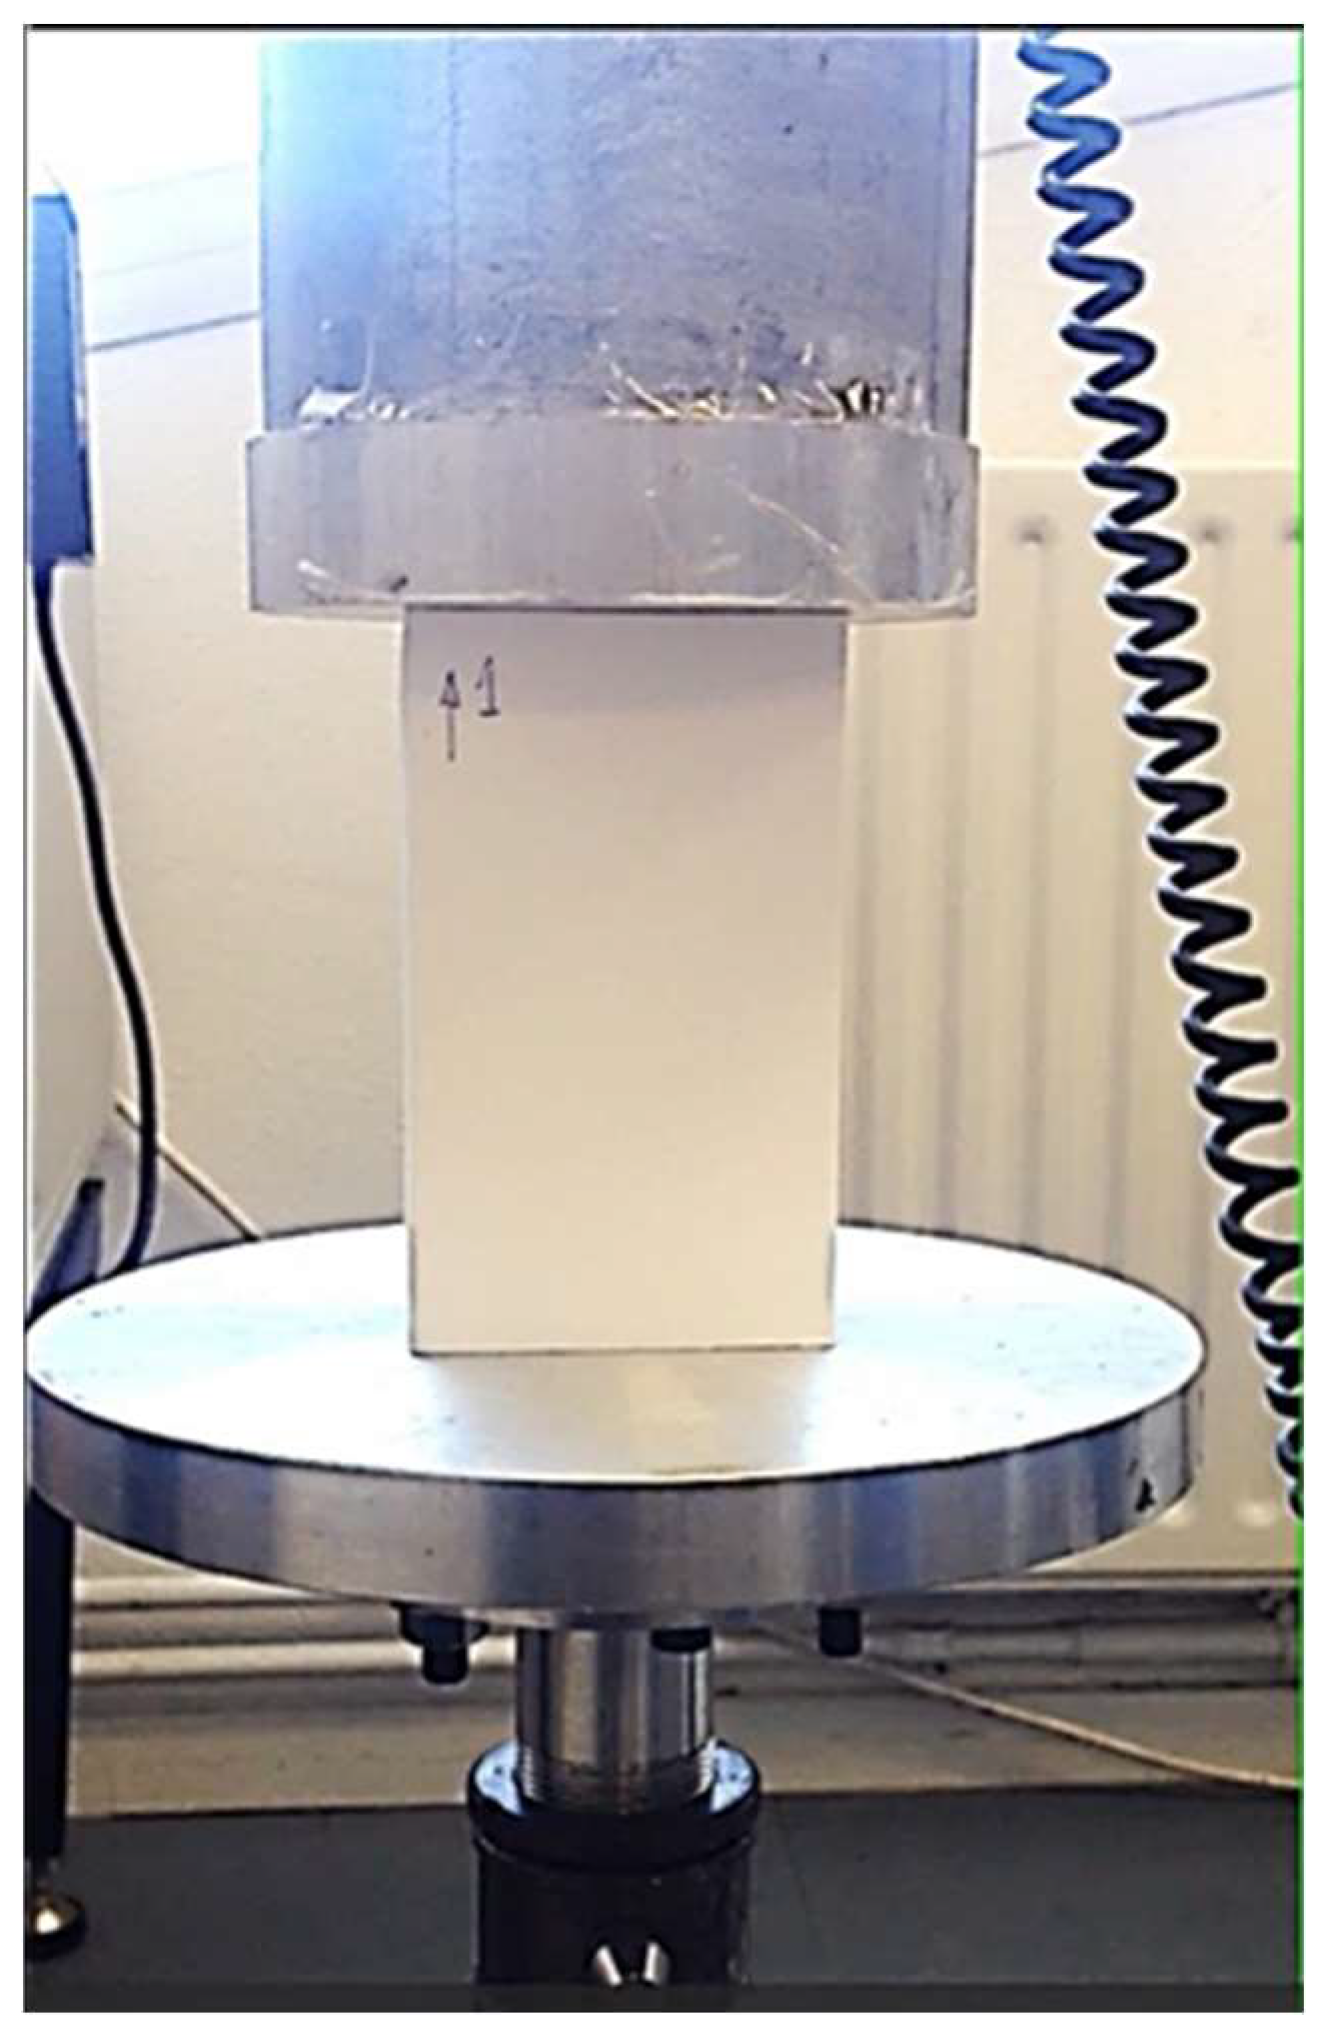
The experiment is set up as shown in
Figure 3.
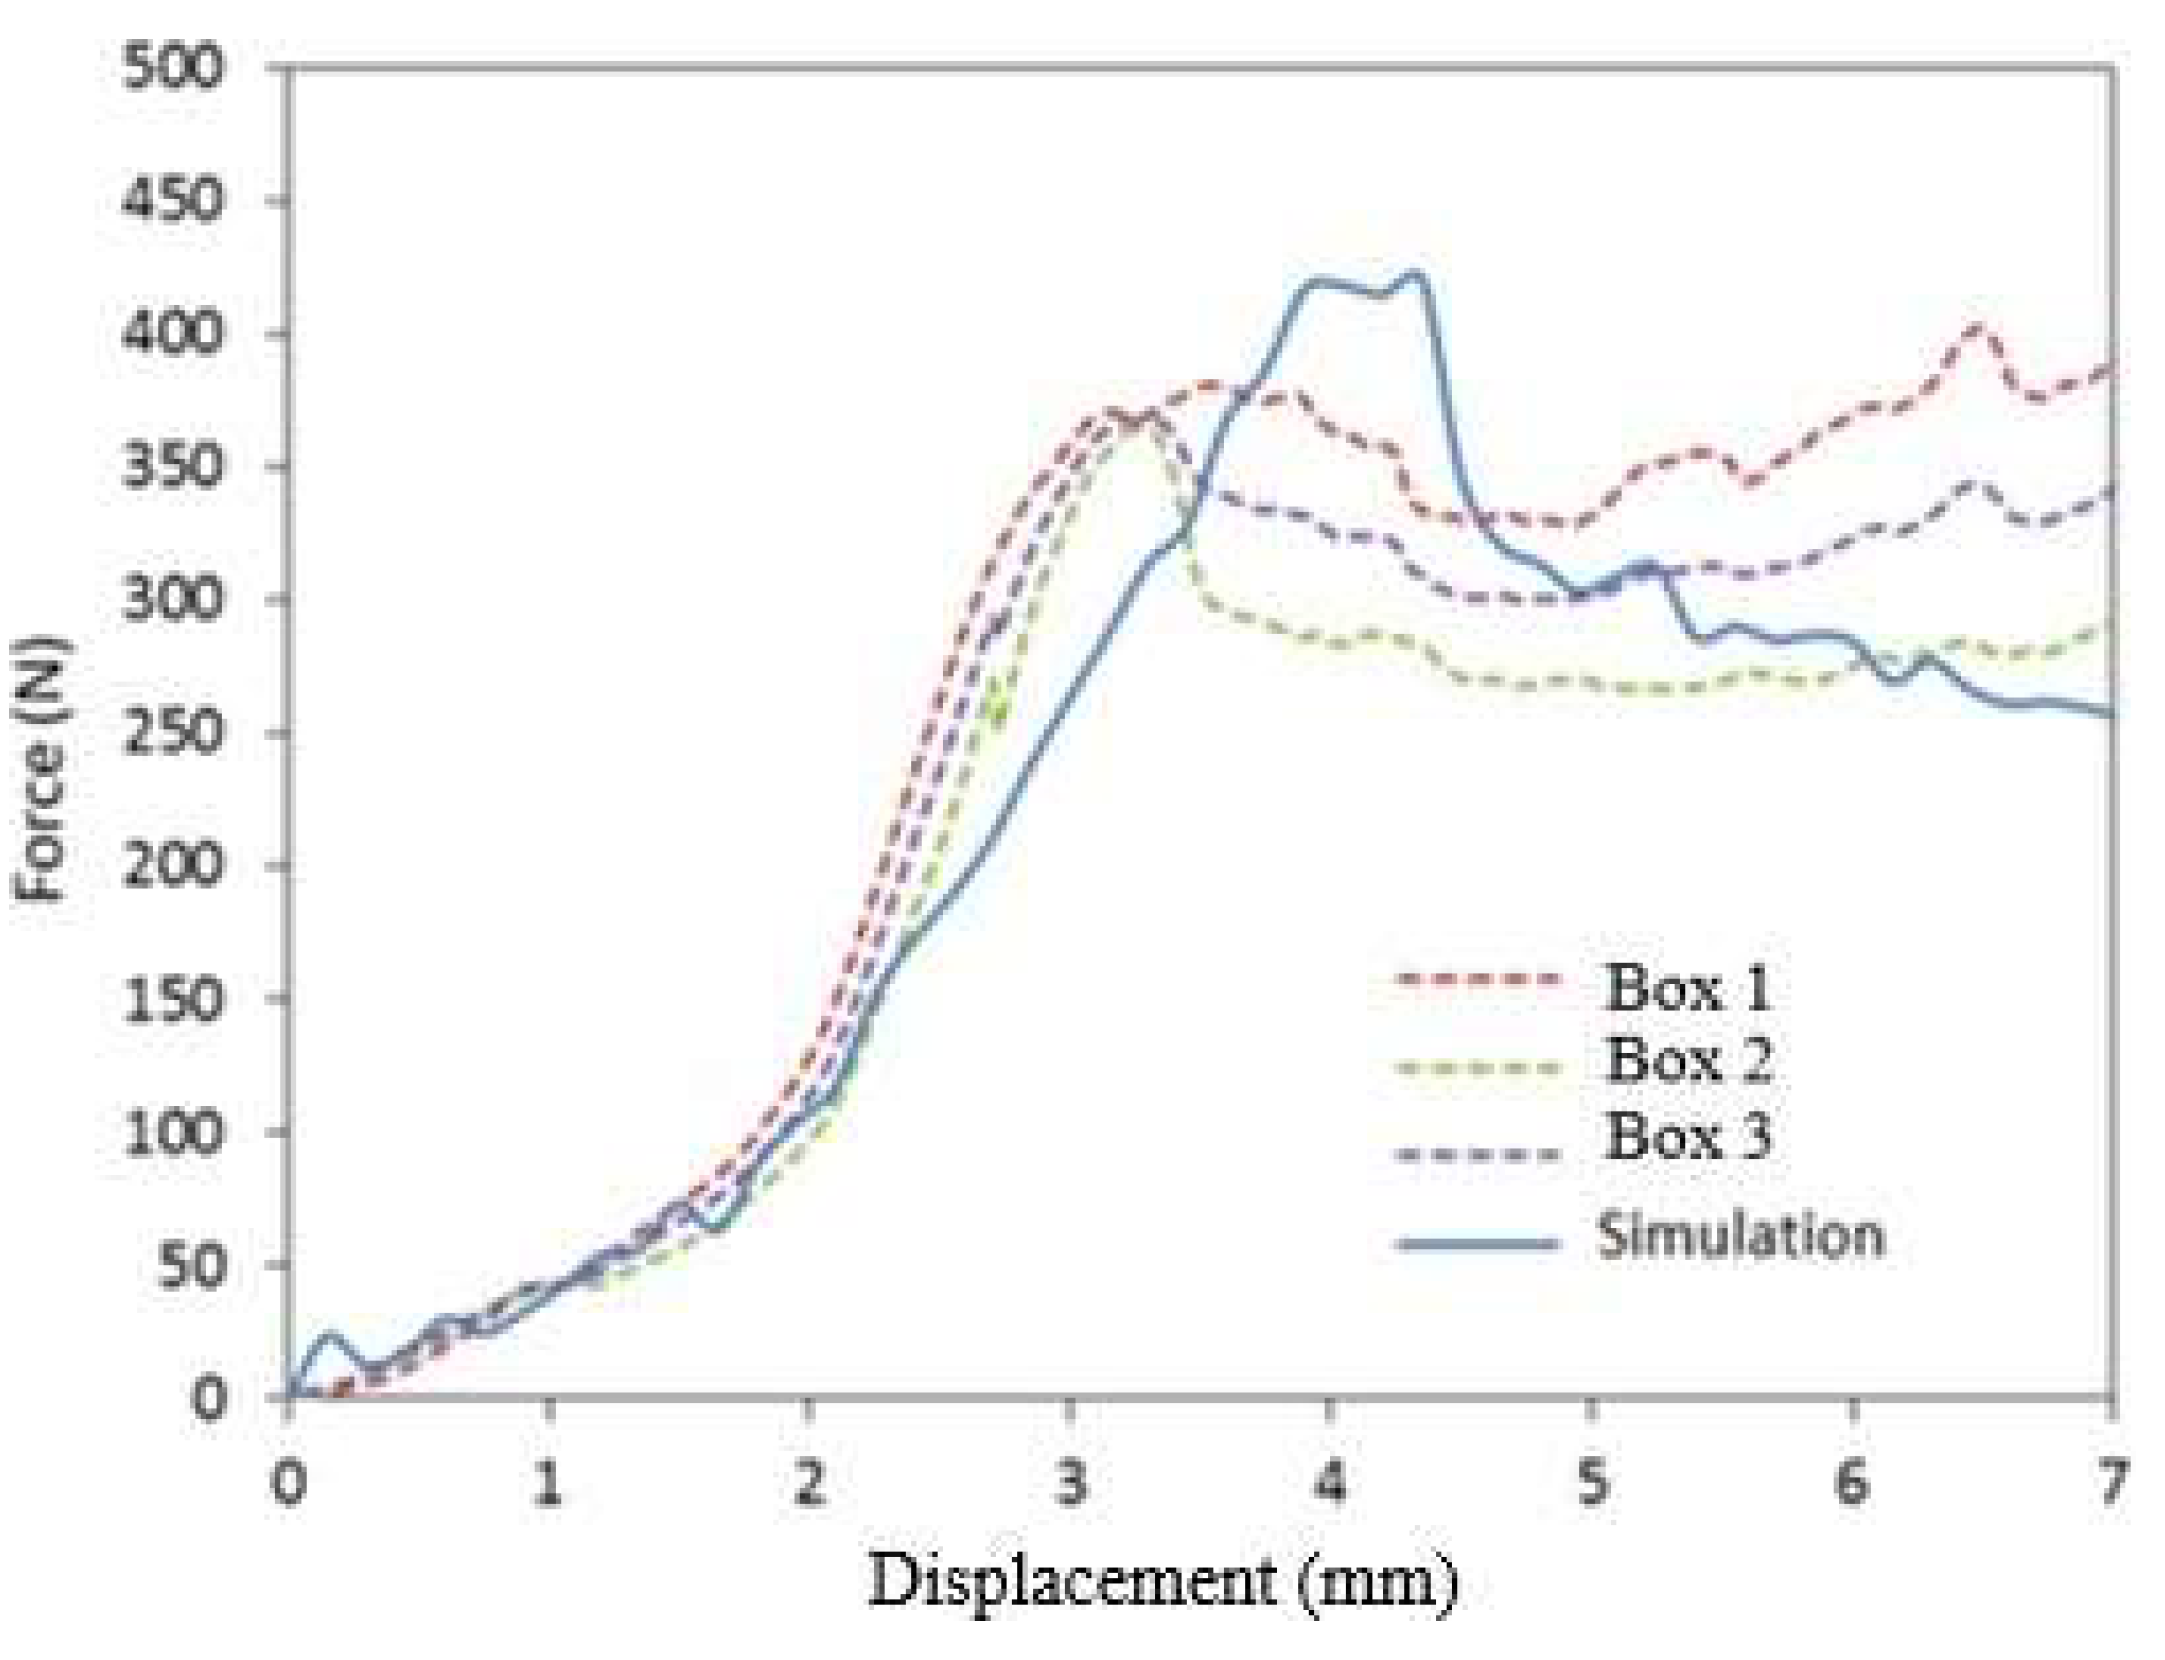
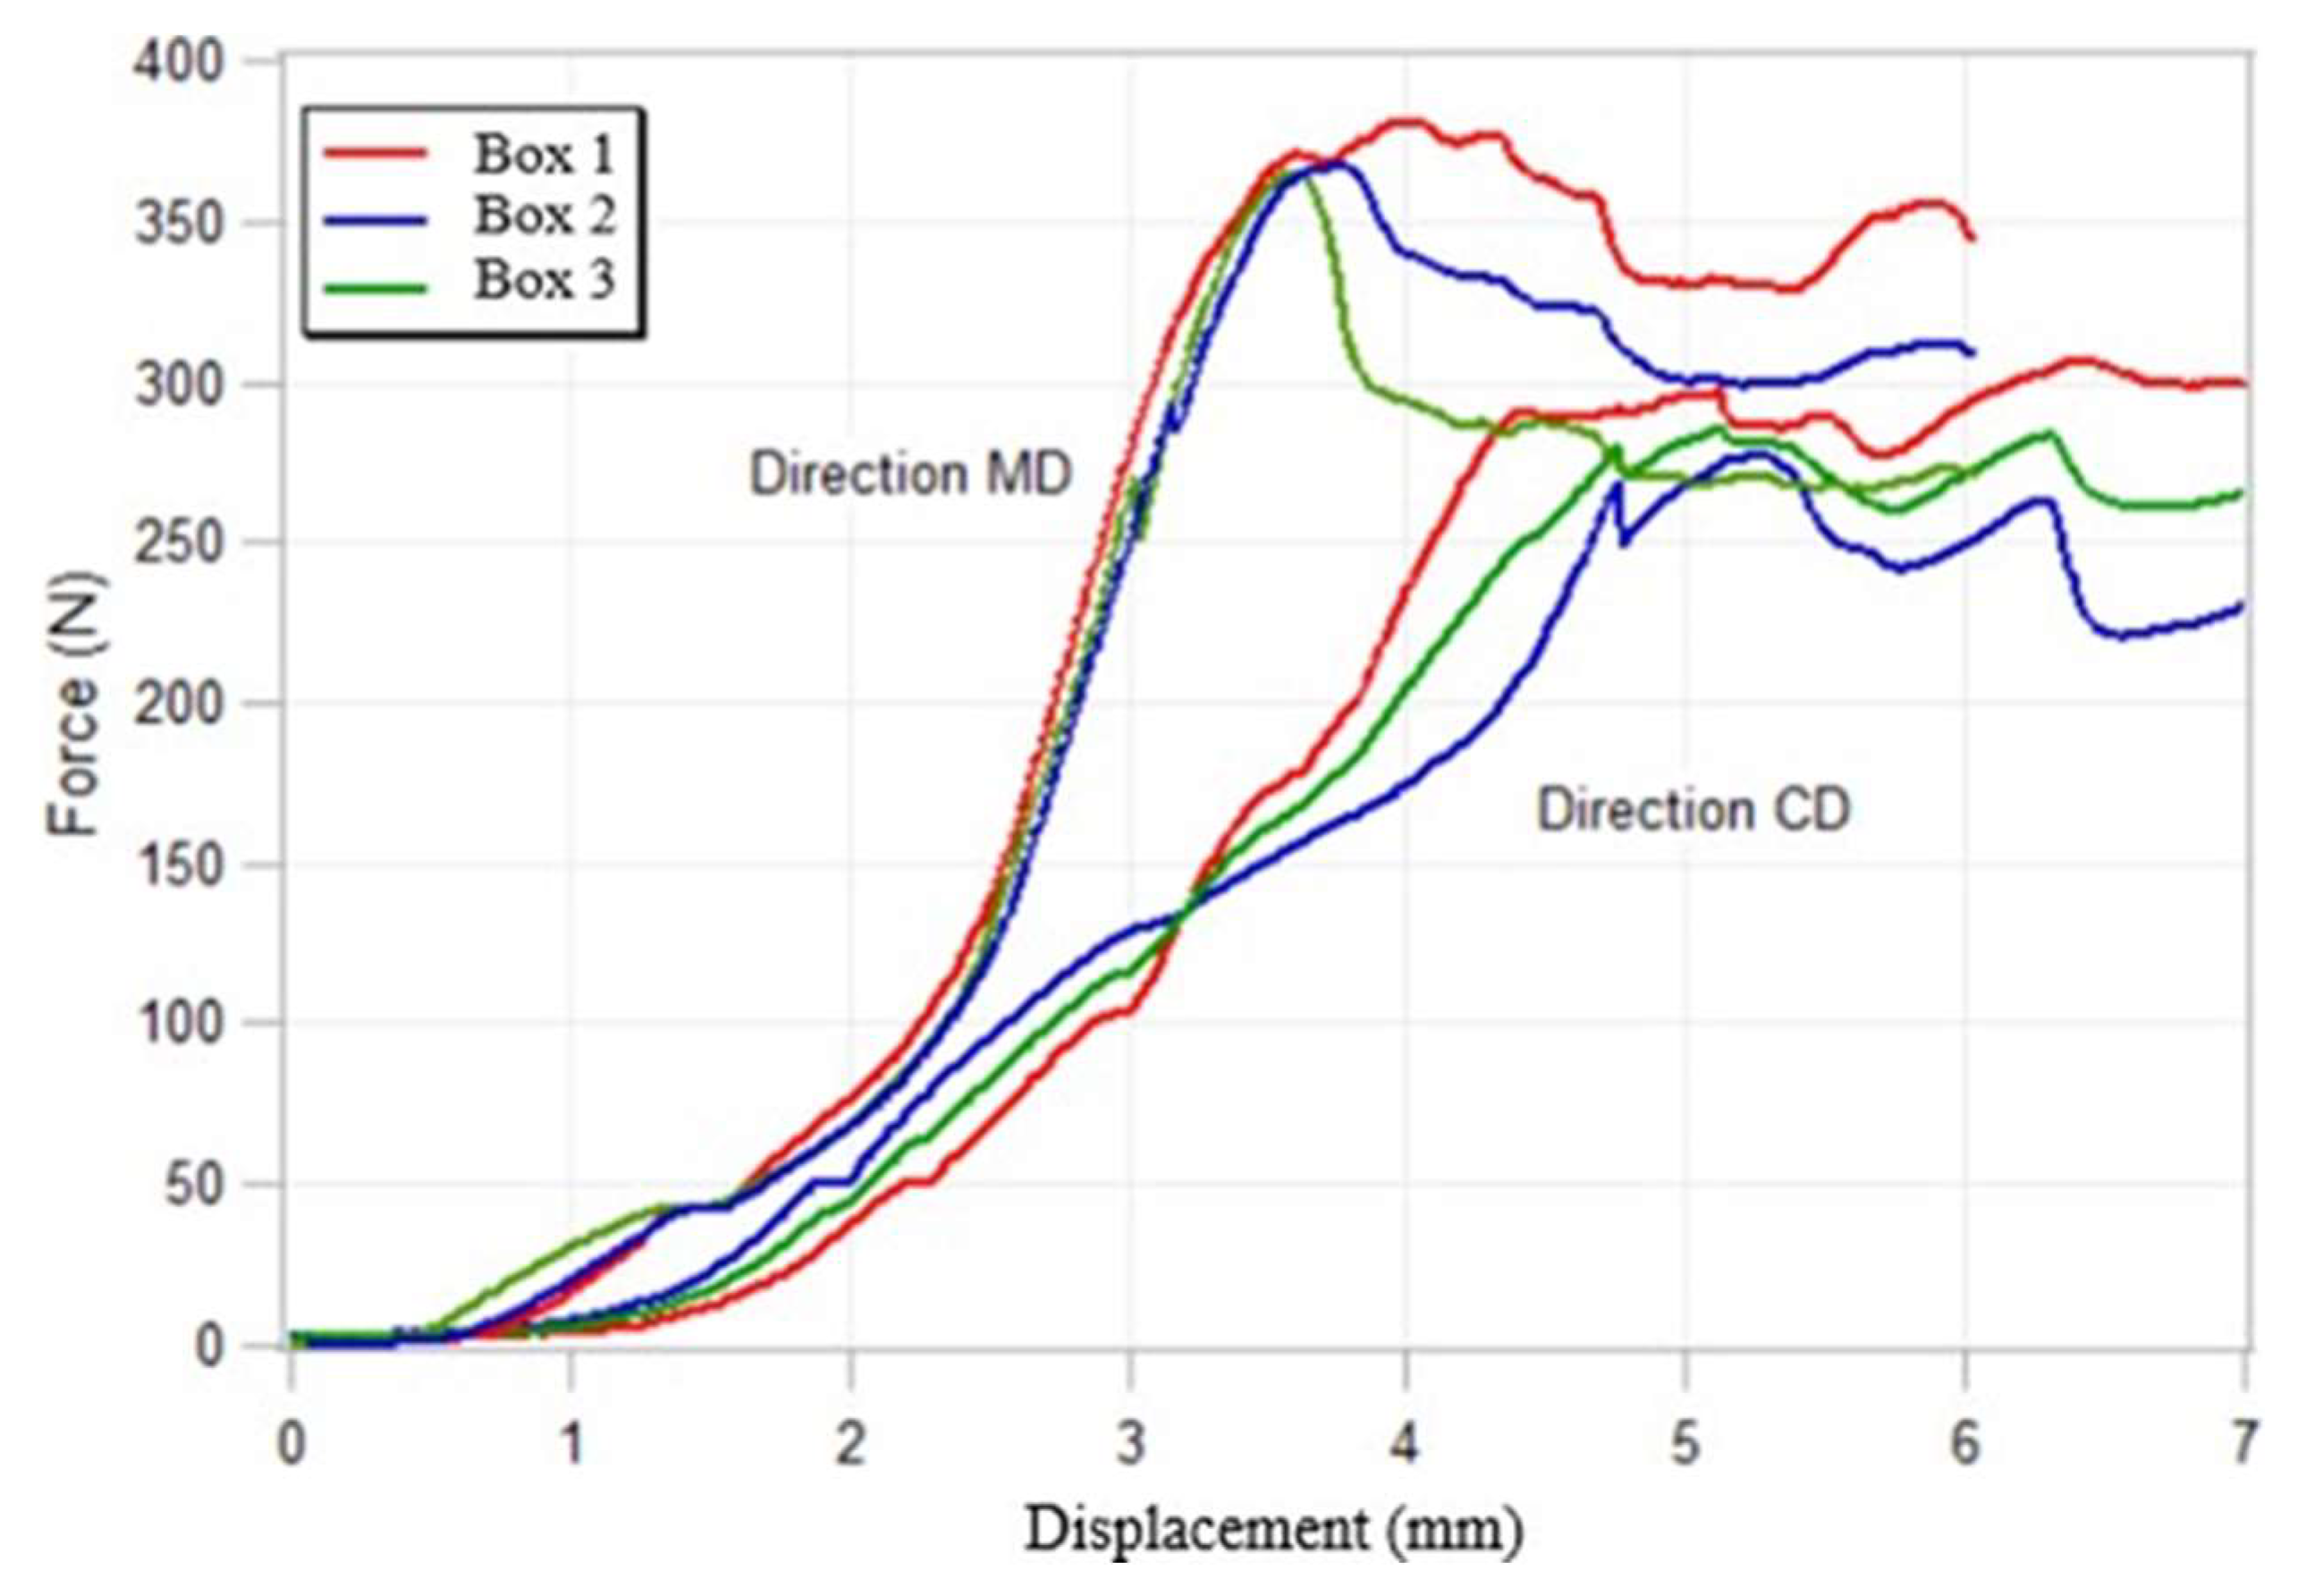
Figure 4 shows the experimental results of compressive force versus vertical displacement for MD and CD-oriented boxes. As shown in
Table 1, the BCT strength of the MD- oriented box is 28.4% higher than that of the CD-oriented box.
3.3. Vibration Test
Packaging can also be subjected to random vibrations during transportation. This is a set of frequencies and amplitudes that continuously change over time. In fact, according to the packaging design, it can amplify or damp the movements it is subjected to. Vibration tests help to evaluate the resistance of the packaging to these limitations. They also provide the possibility to compare the differences in the performance of different packaging solutions: qualitatively by classical testing or quantitatively by instrument testing.
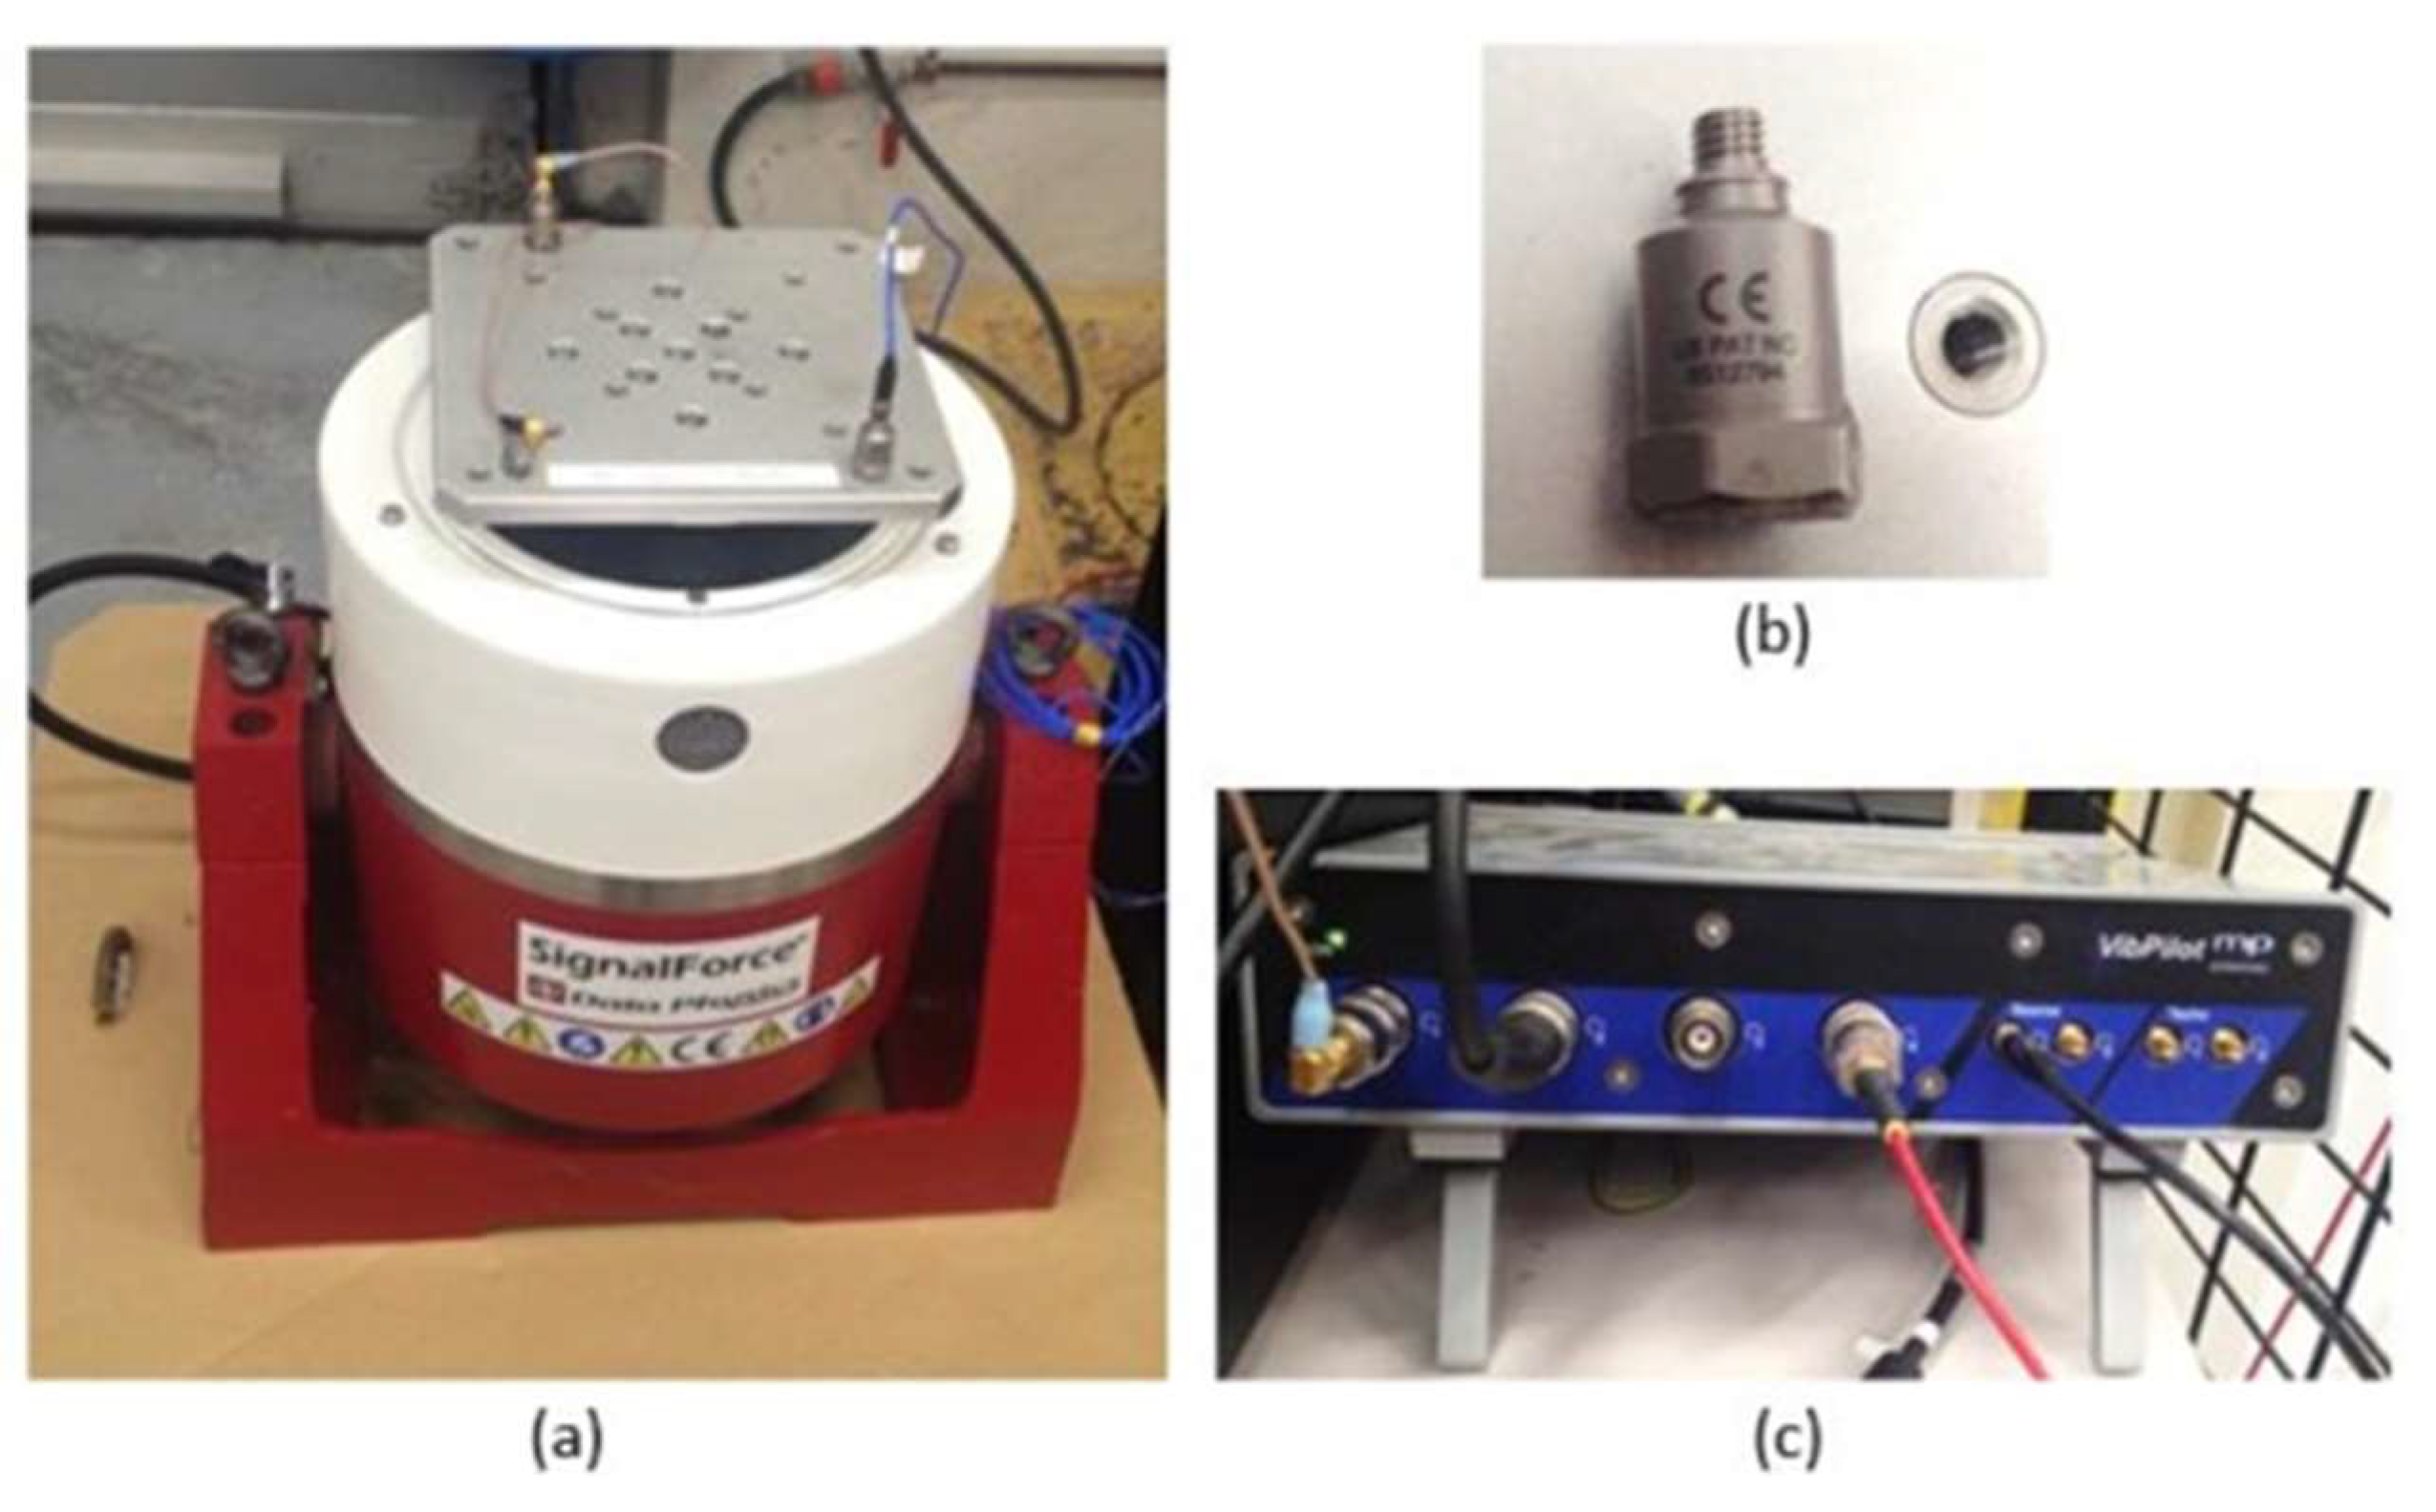
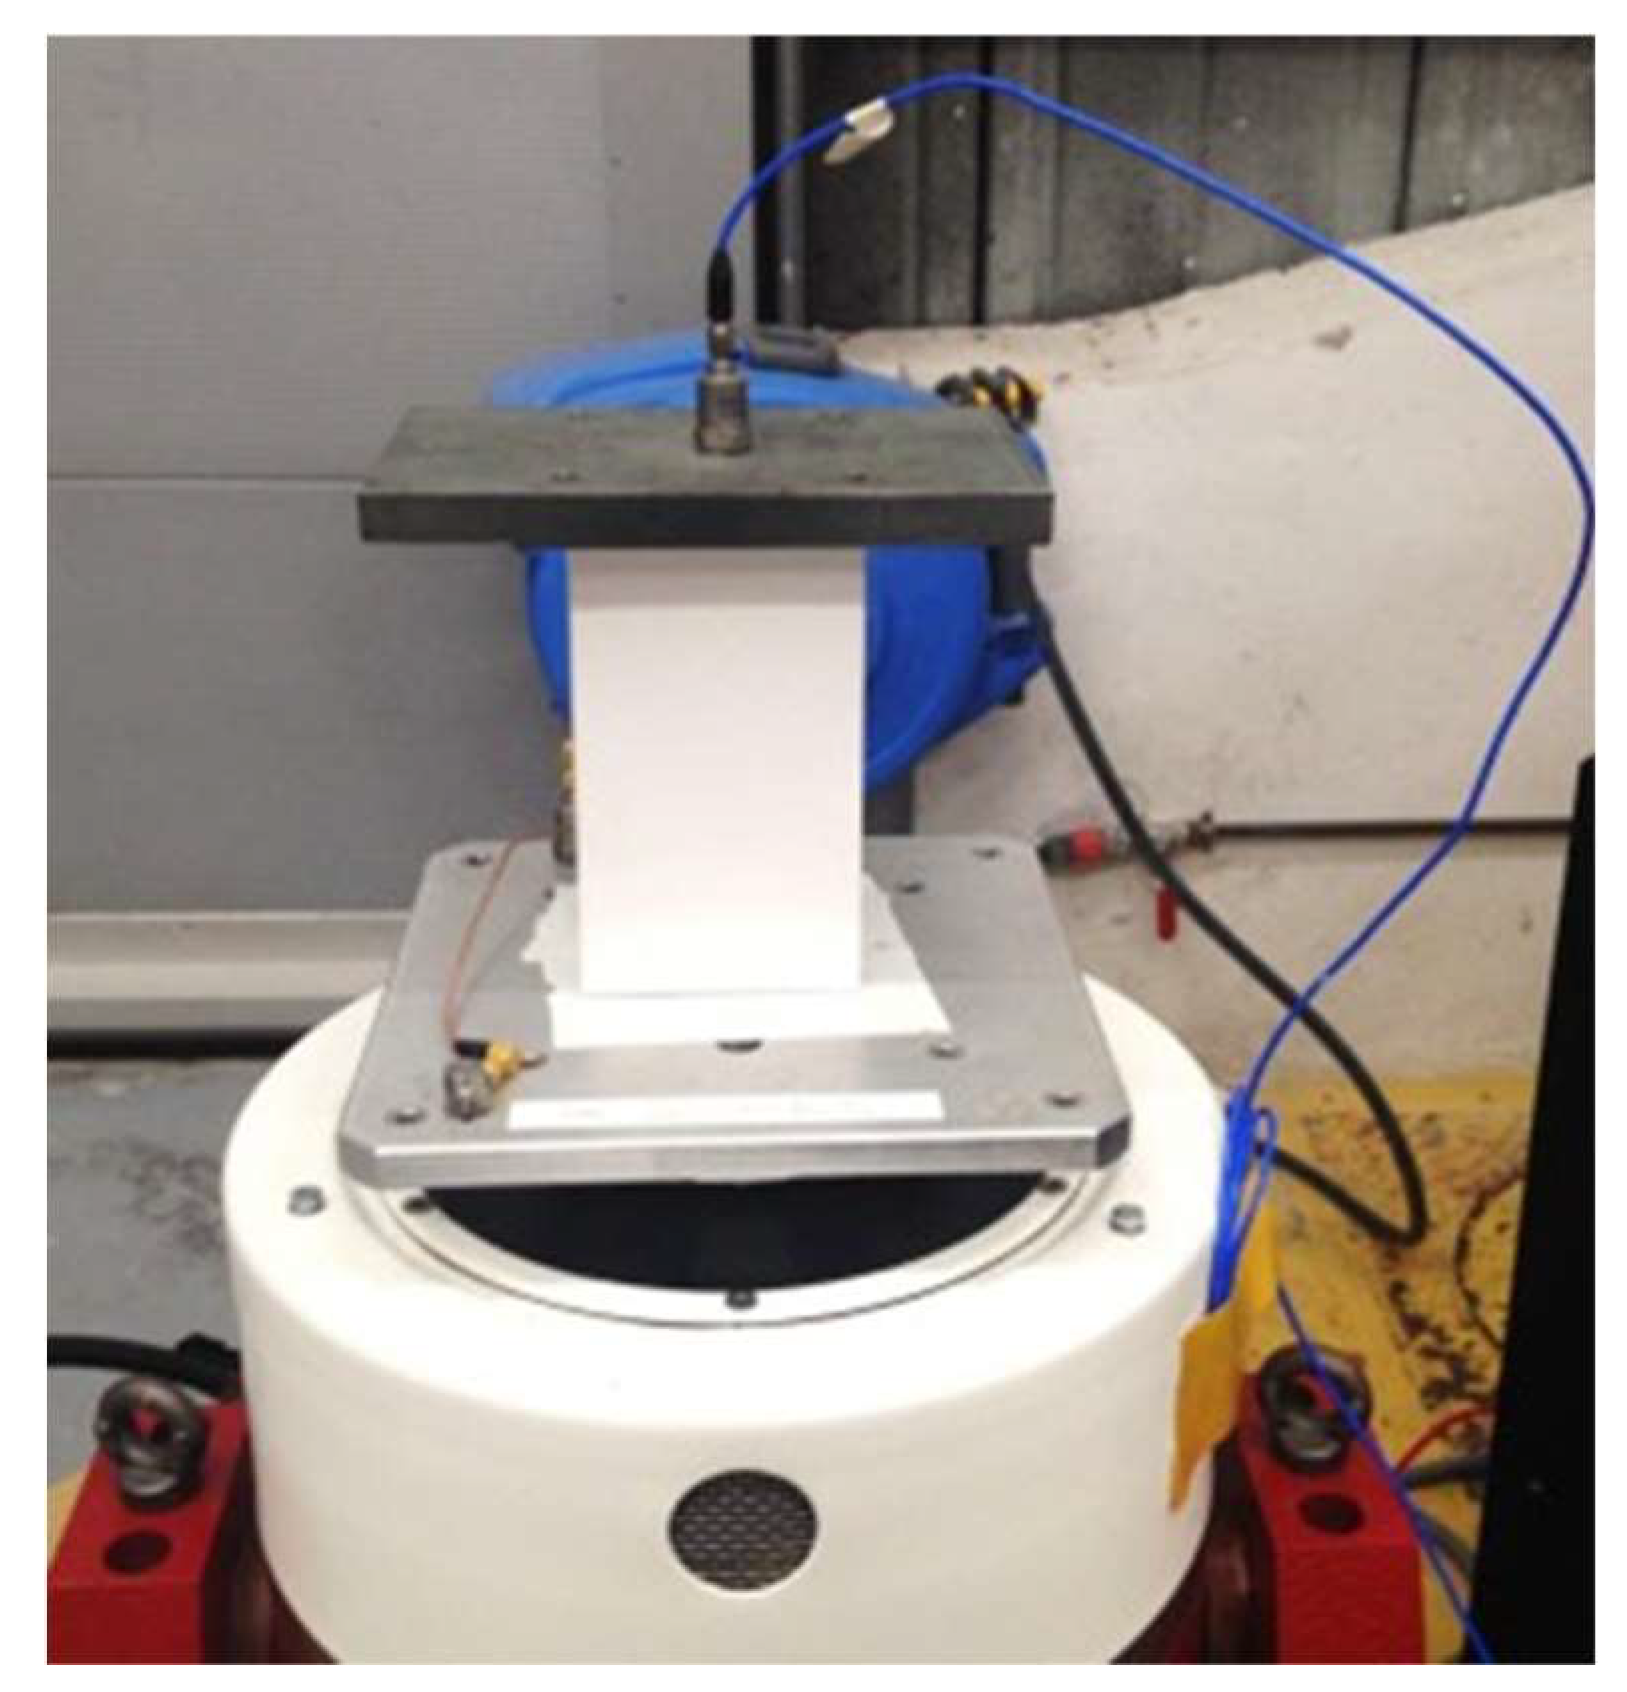
In this study, vibration tests on compact cardboard boxes were conducted. The objective of these tests was to obtain the natural frequencies and natural modes of the boxes. We used a Signal Force (Data Physics) vibration table as shown in (
Figure 5a) to perform the tests. The tested packaging systems were all equipped with accelerometers PAT NO 5512794 from the USA (
Figure 5b). The computer performed the acquisition of acceleration as a function of time through a vibration controller and a VibPilot4 dynamic signal analyzer (m+p International) connected to the accelerometer (
Figure 5c).
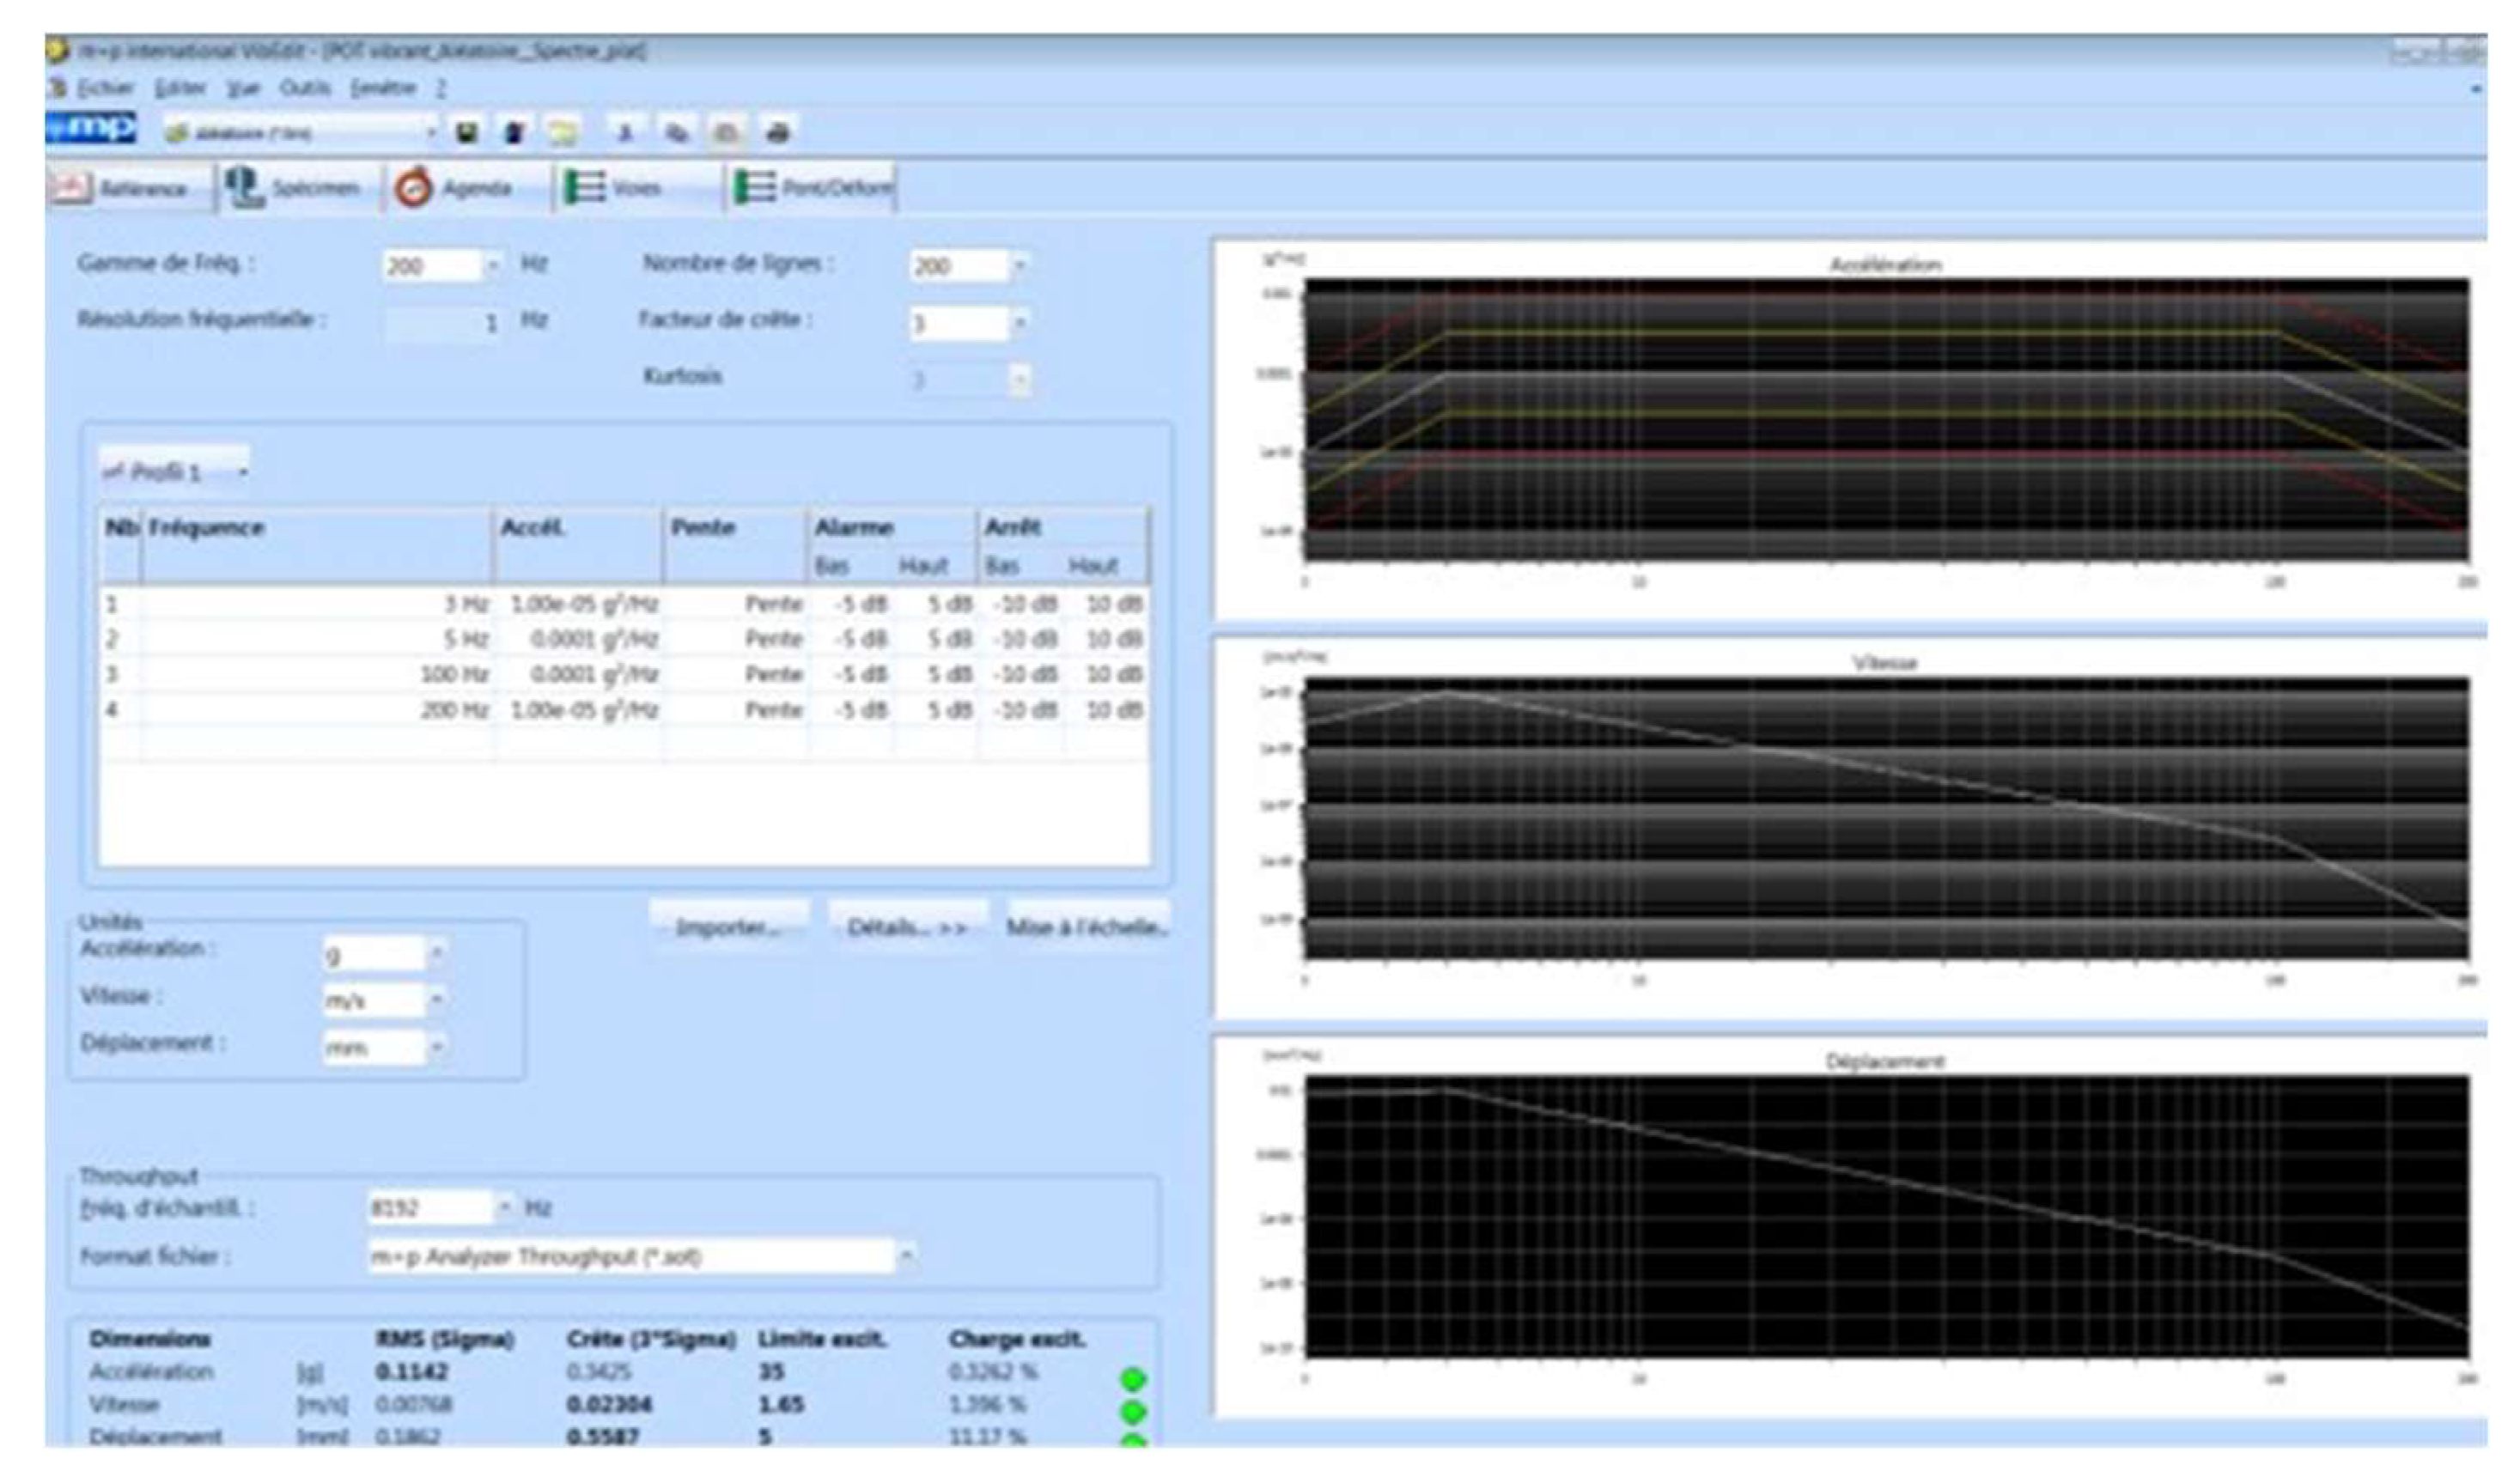
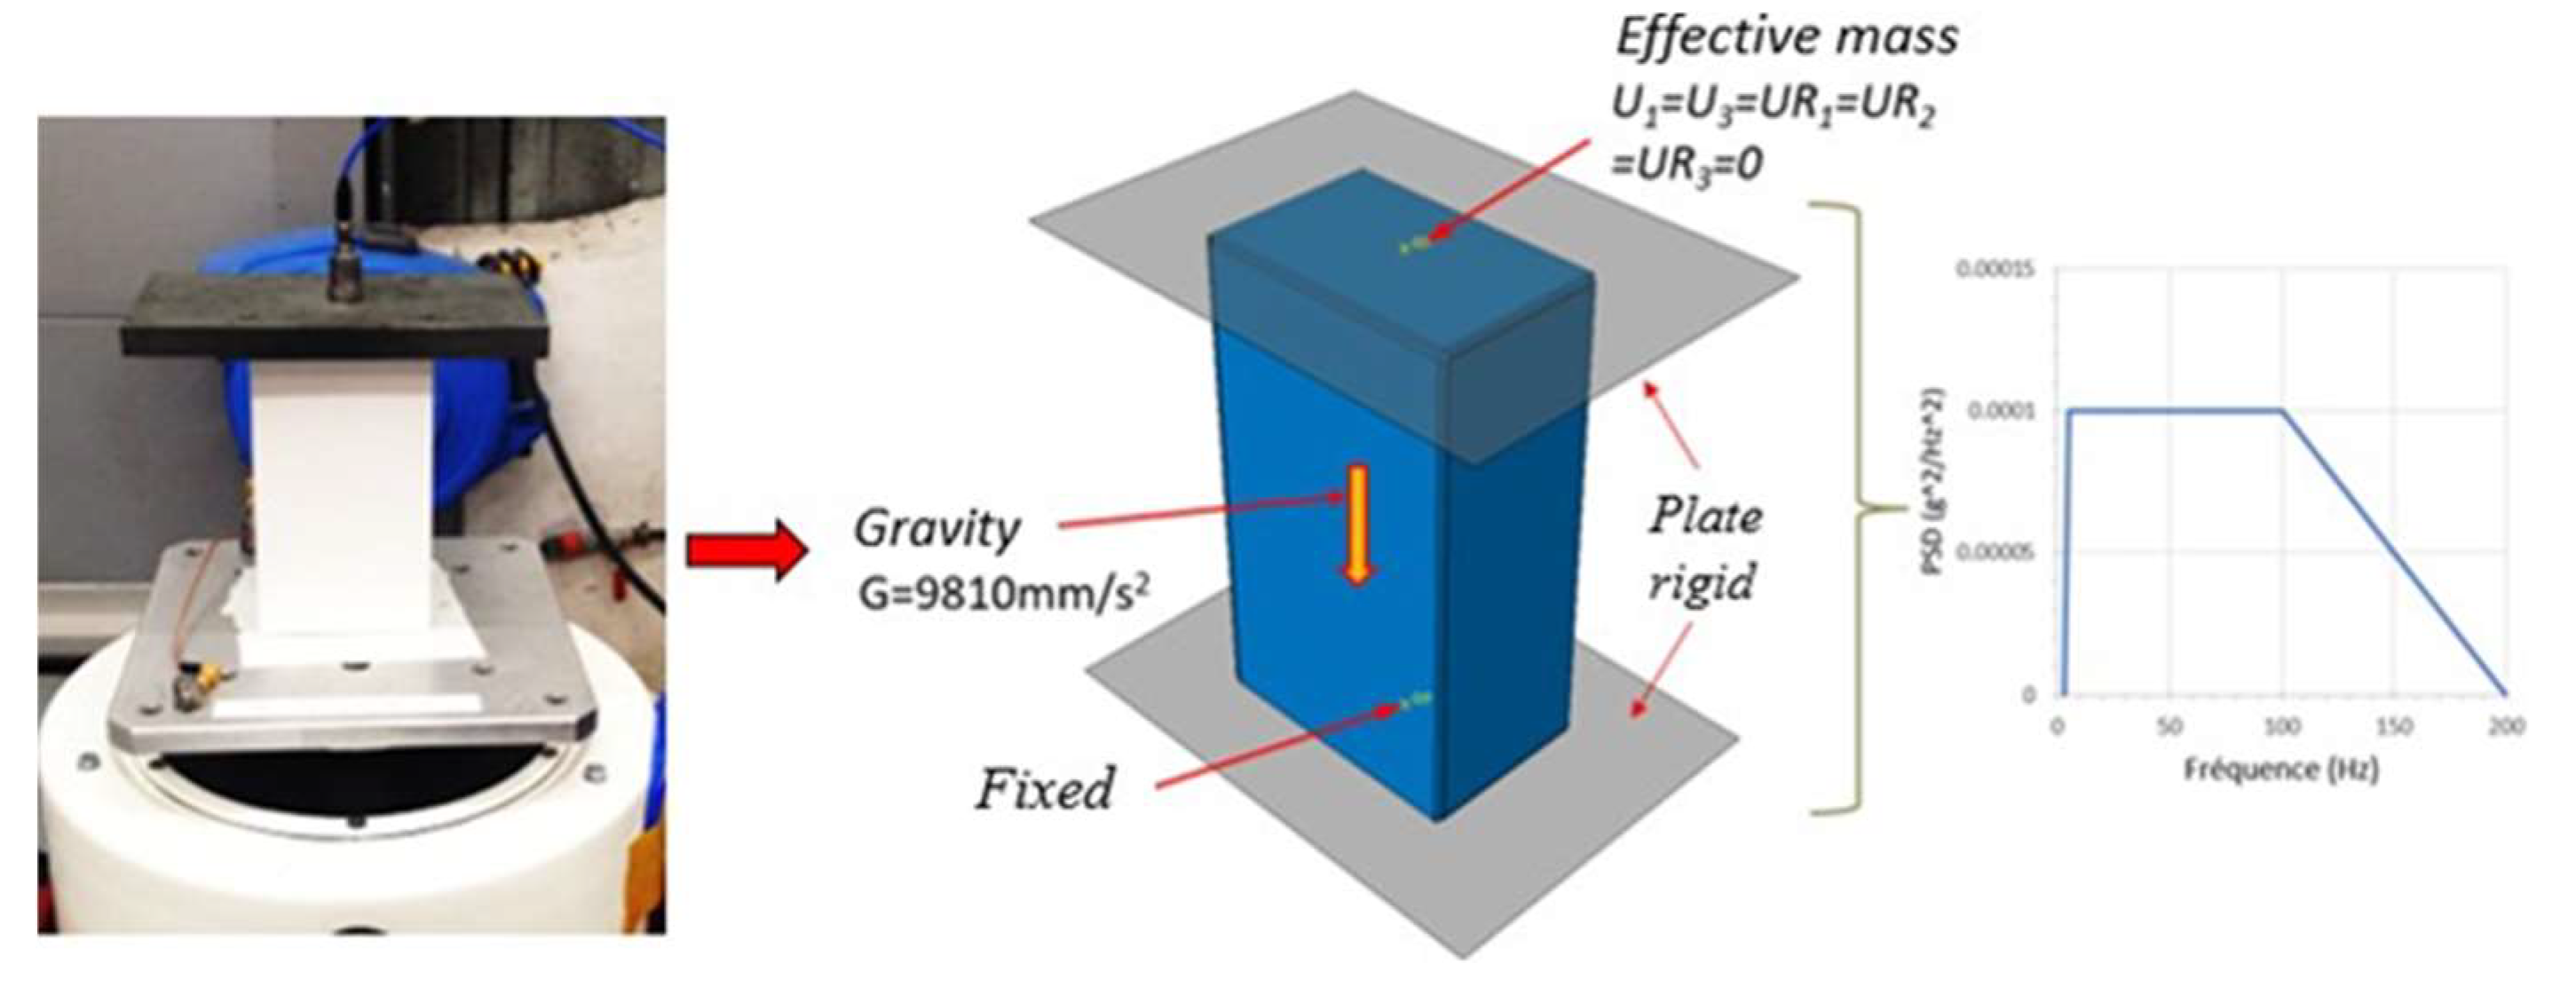
A compact cardboard box is placed on a vibrating table, on top of which is placed a 1.41 kg steel block (
Figure 6). An accelerometer is attached to the steel plate to record the system response. The box is subjected to random white noise vibrations with a constant power spectral density (PSD) of 0.0001 g2/Hz, over a frequency range of 3Hz to 200 Hz (
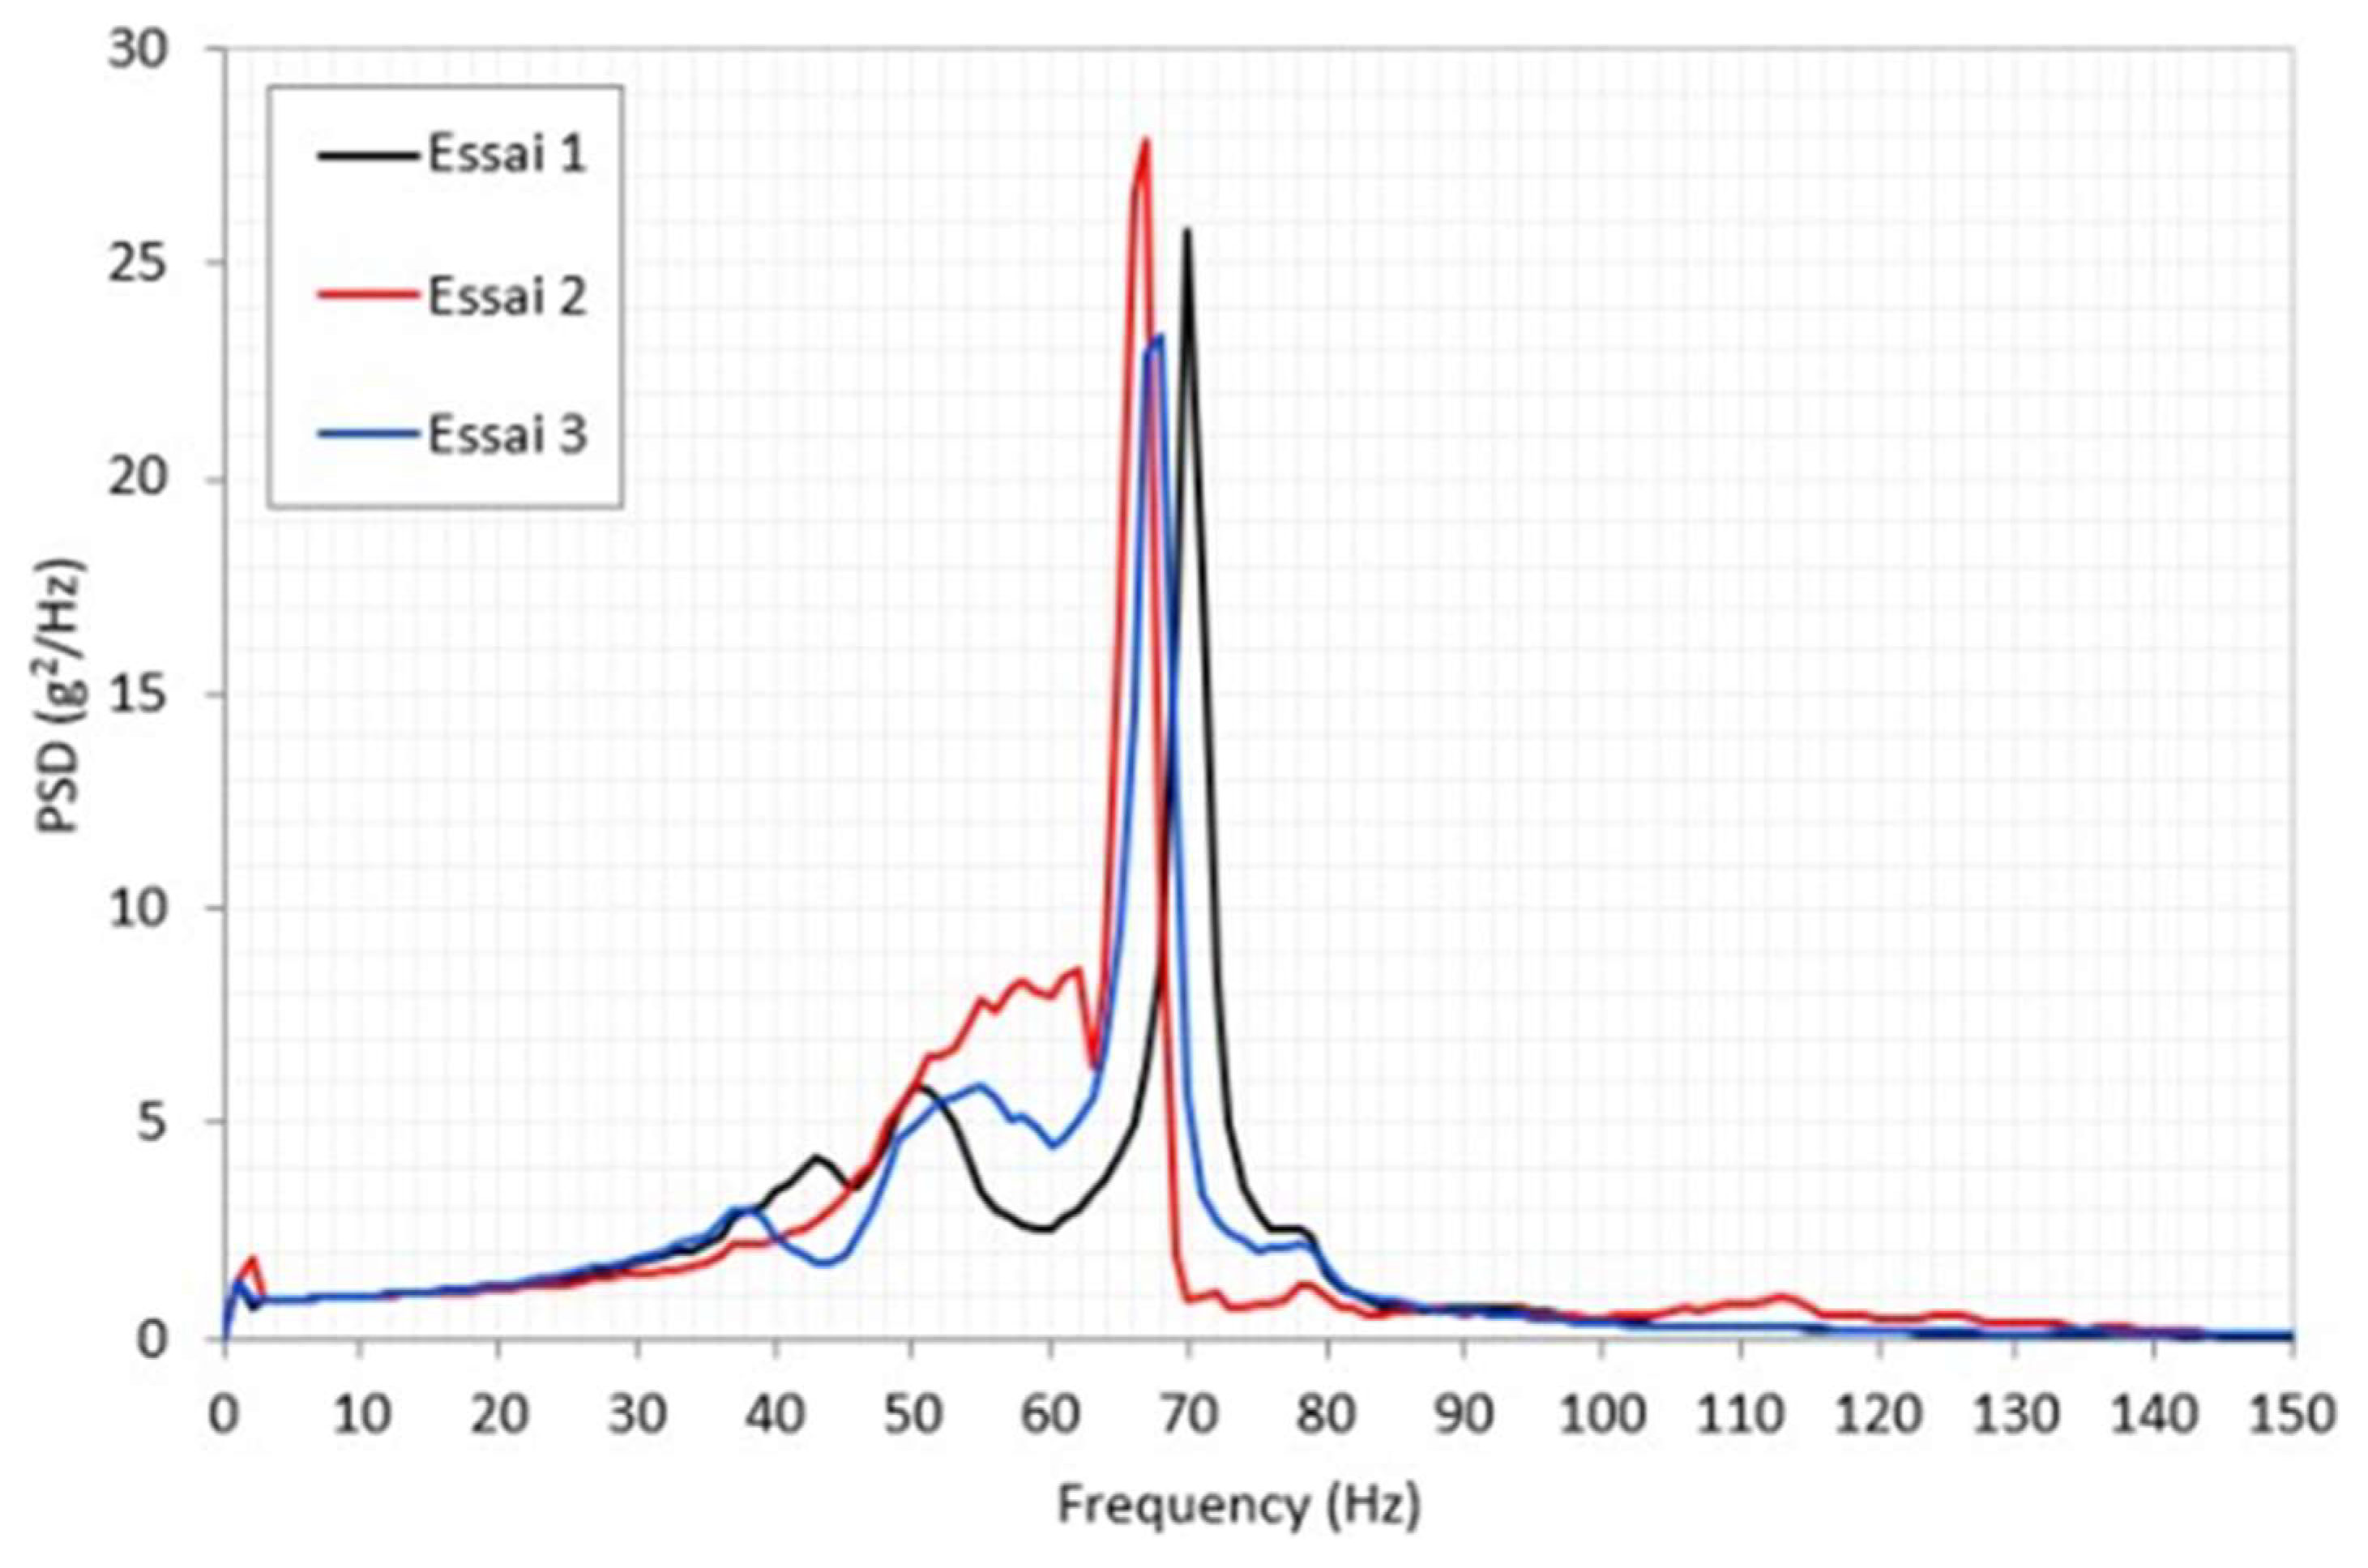
Figure 7). The test results are shown in
Figure 8 as the PSD response as a function of frequency. The results obtained were reproducible. The natural frequency of the compact cardboard block system was 68.3±1.5 Hz
4. Simulation
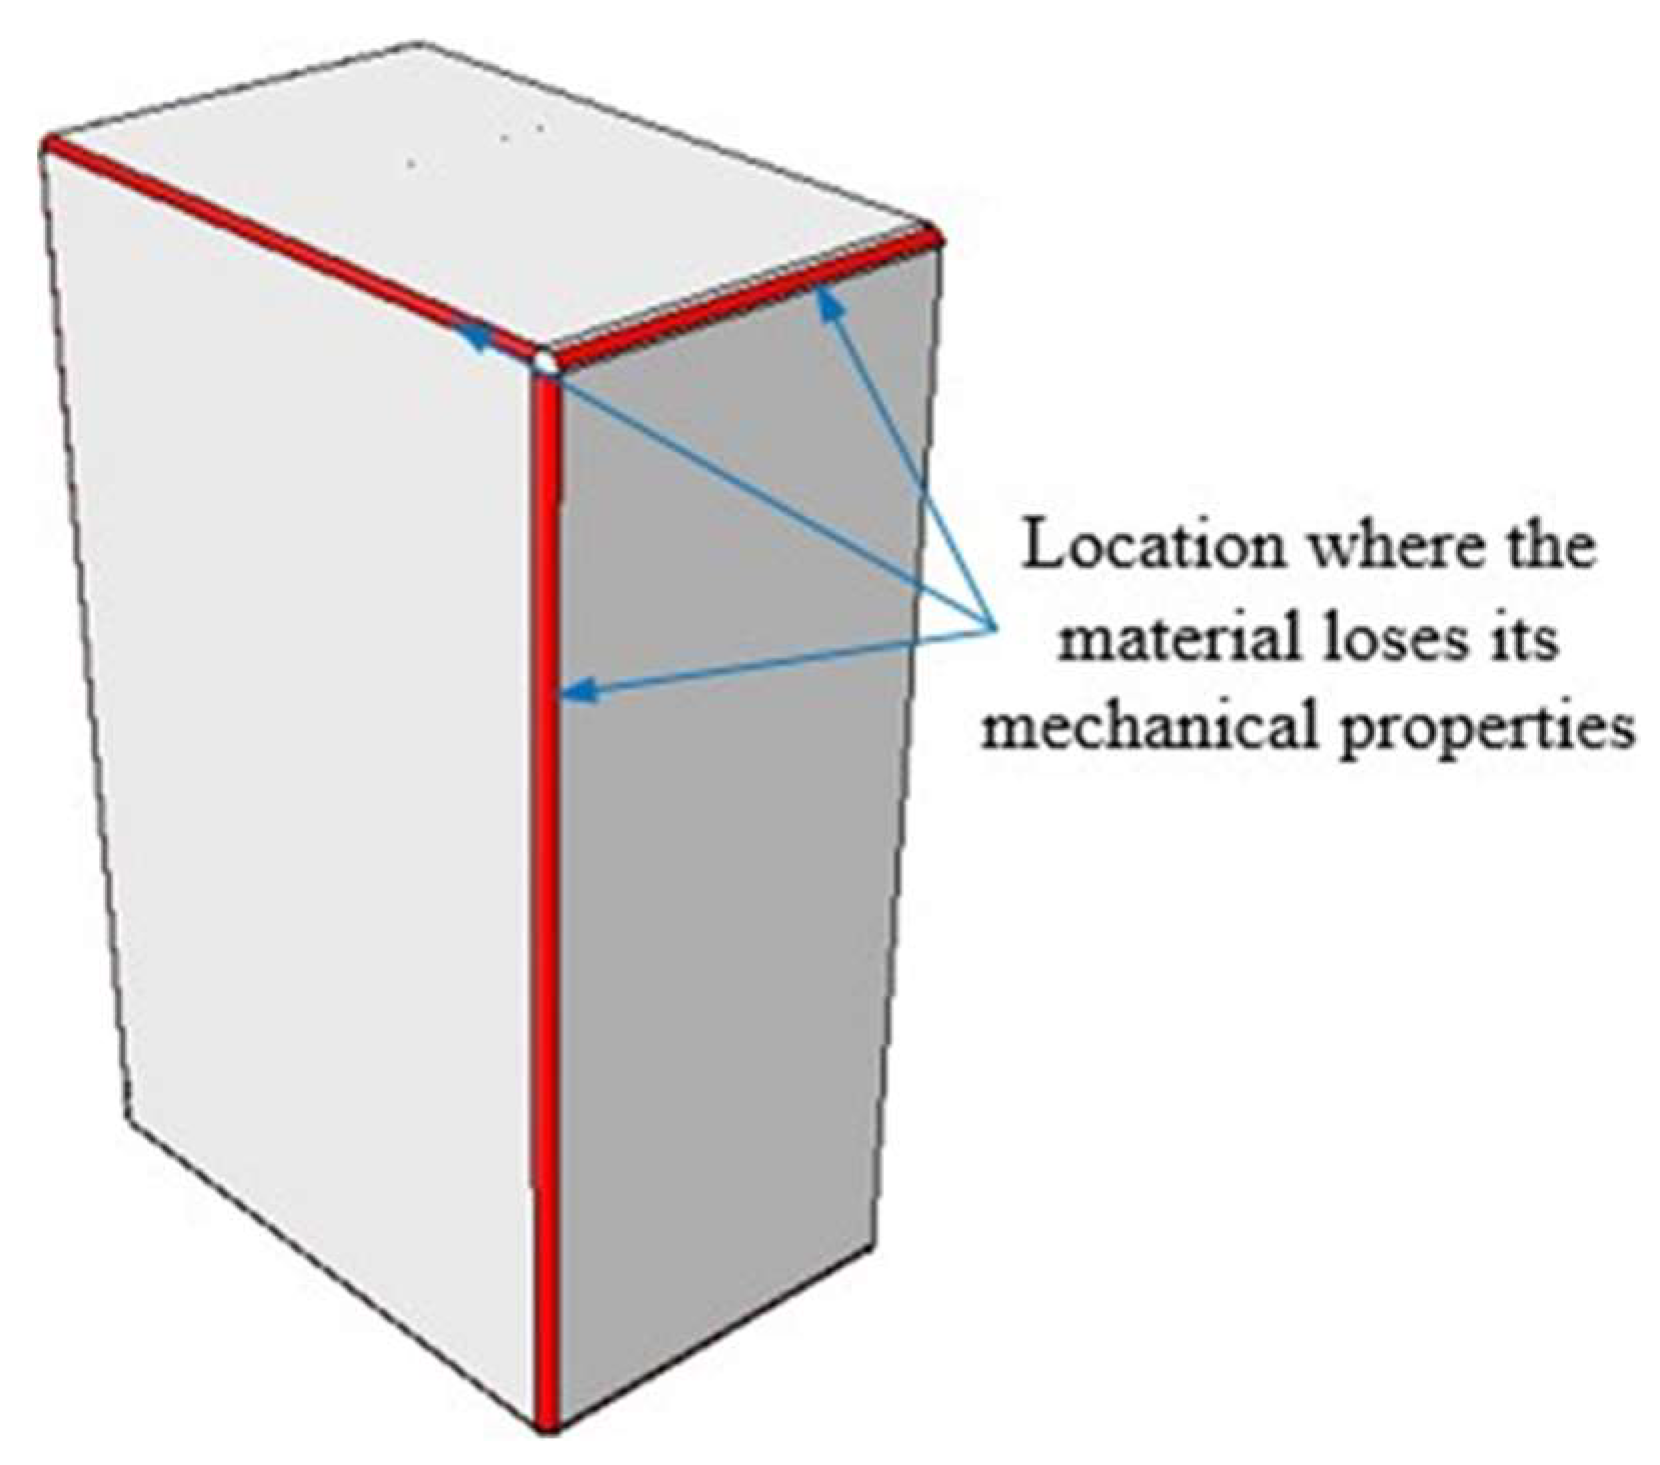
The finite element model of the box was developed using ABAQUS software to simulate its compression behavior. The model used a mesh of reduced-integration four-node shell elements (S4R) with an element size of 1 mm. During the paperboard box manufacturing process, in the folding positions where the box is formed (
Figure 9), the cellulose fibers are unevenly compressed and stretched, resulting in damage to the microstructure of the material, such as reduction of stiffness, propagation of cracks, and delamination of the cardboard layers. The bonding strength between the layers typically decreases by up to 80% during folding [
17]. This effect will be incorporated into the finite element model of the paperboard box.
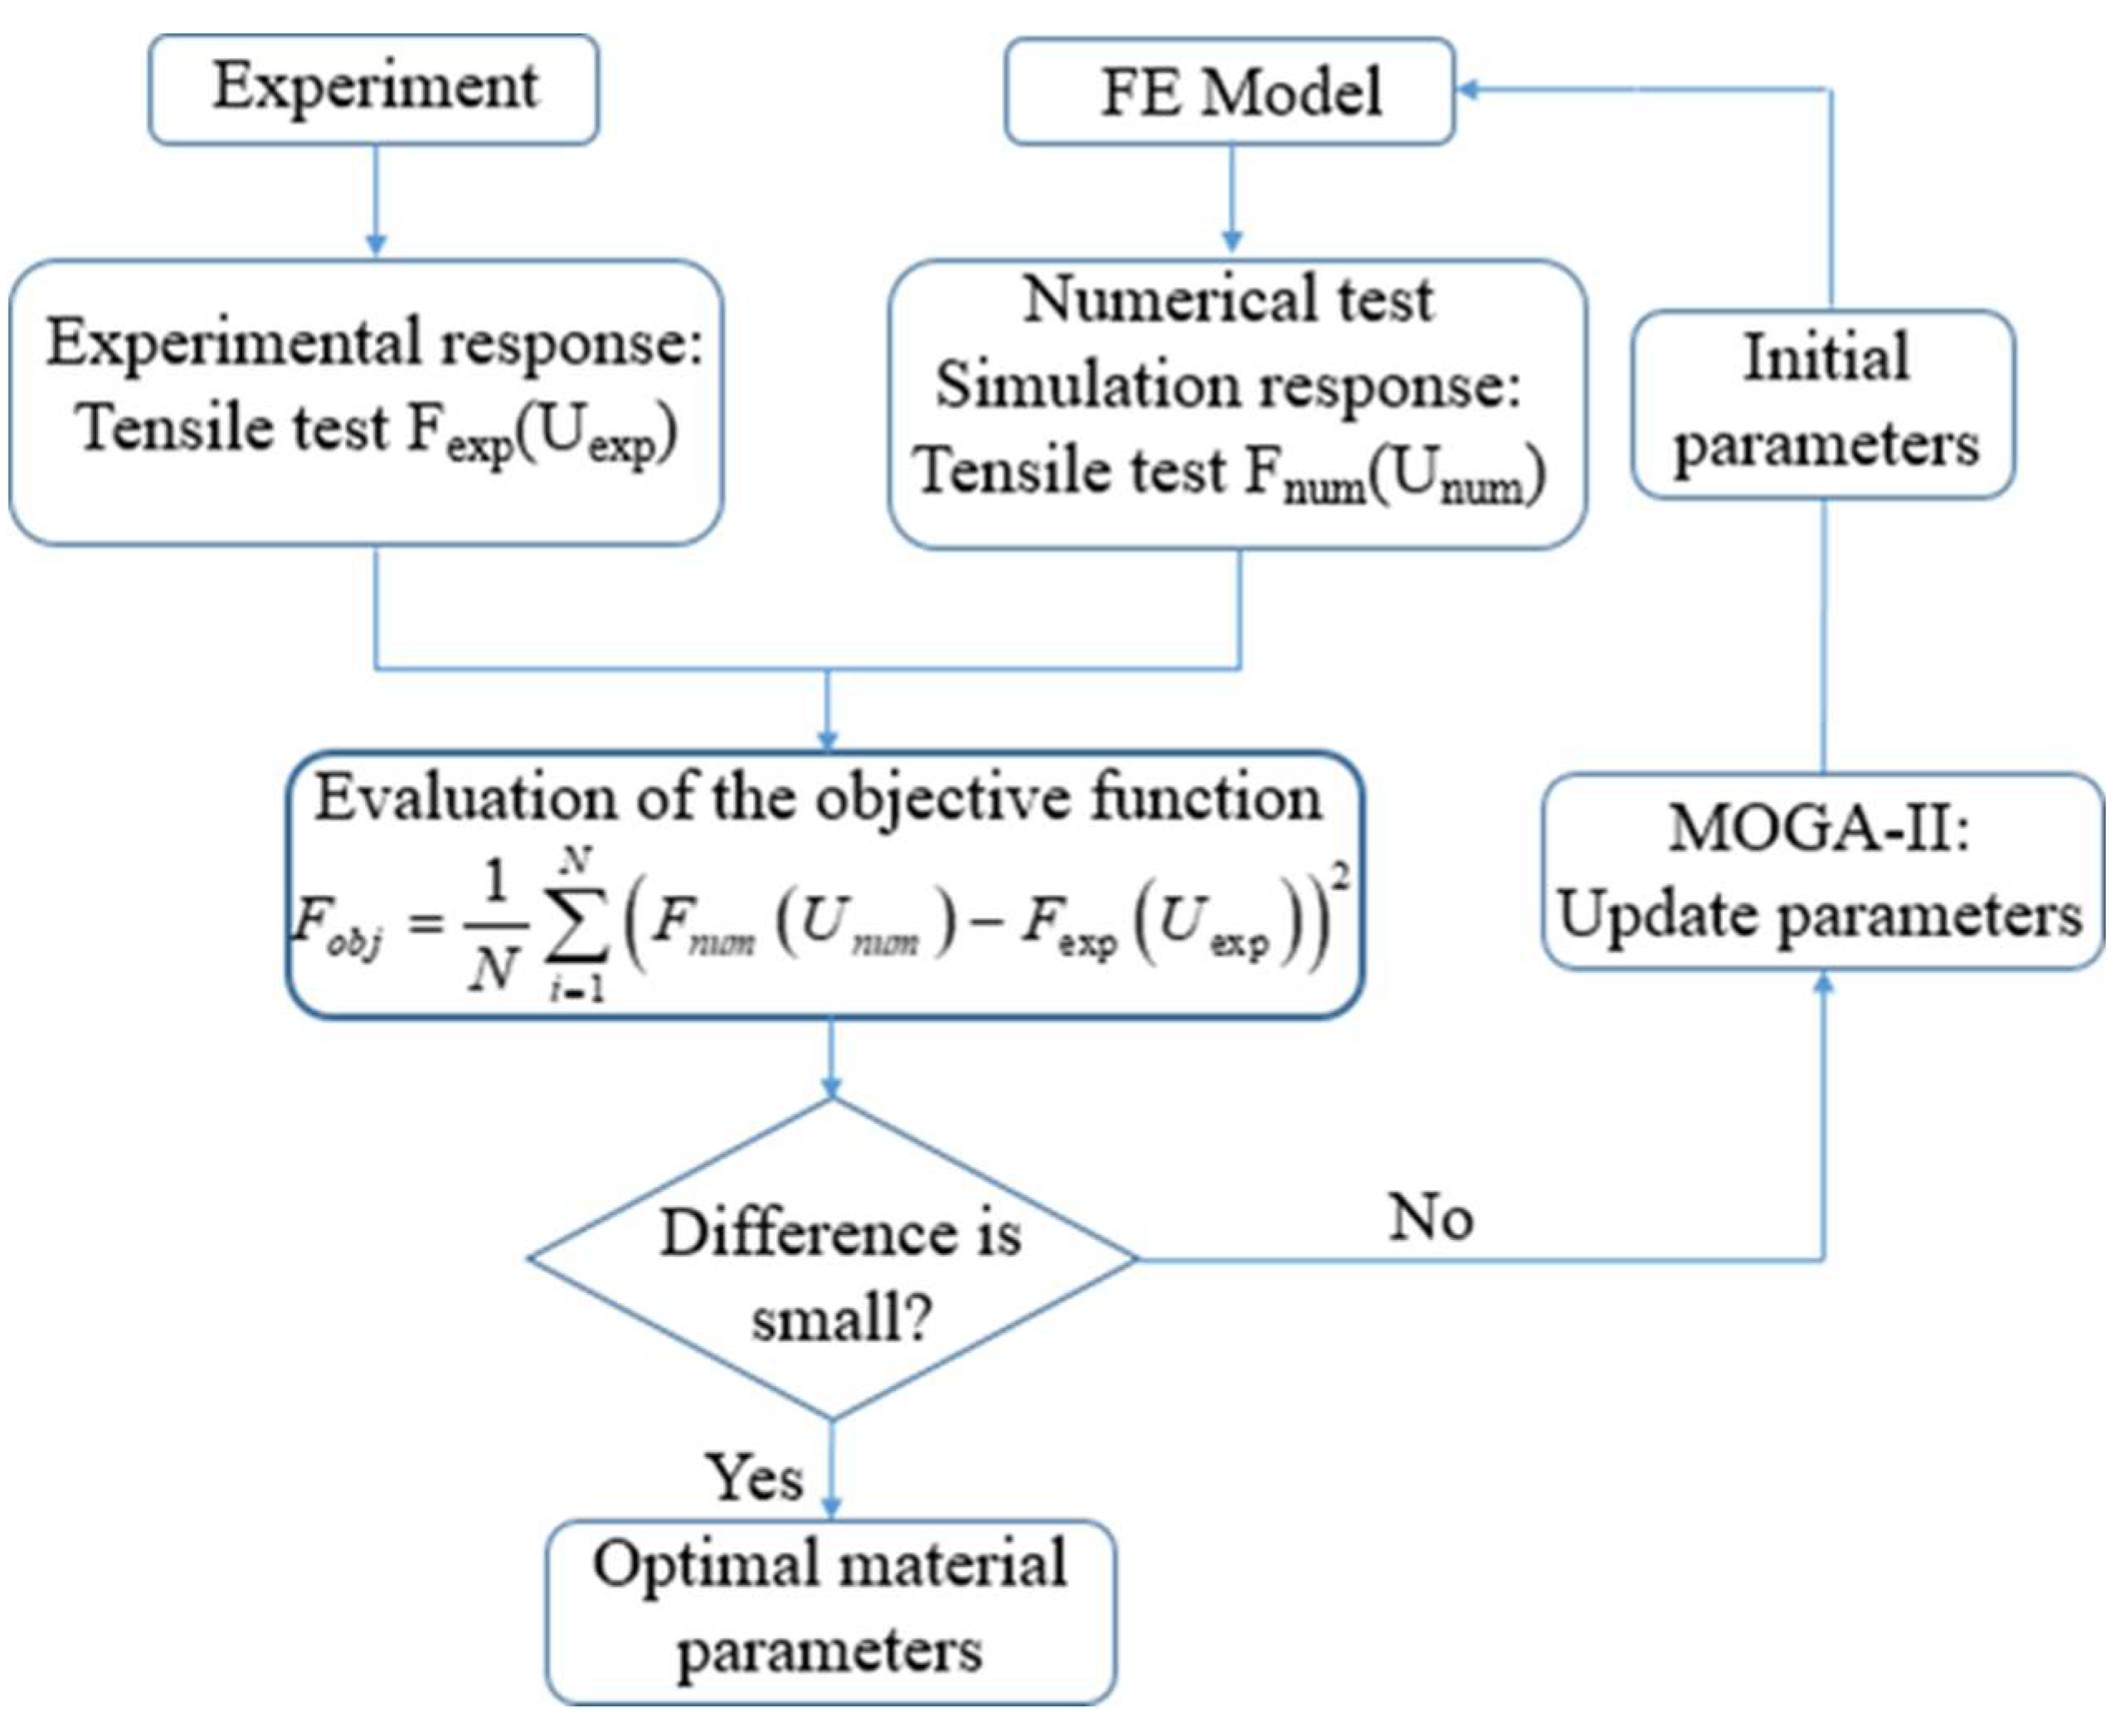
However, when conducting numerical simulations, the values of material parameters in the behavior model must be accurate. Therefore, an inverse identification process of the parameters in the behavior model is also carried out based on the discrepancy between experimental data and numerical data. The objective function used is the scalar least square’s function given in expression (12):
where N is the number of data sets, U_num and U_exp are the simulation and experimental displacements, and F_num and F_exp are the simulation and experimental tensile forces. The process diagram for identification is illustrated in
Figure 10.
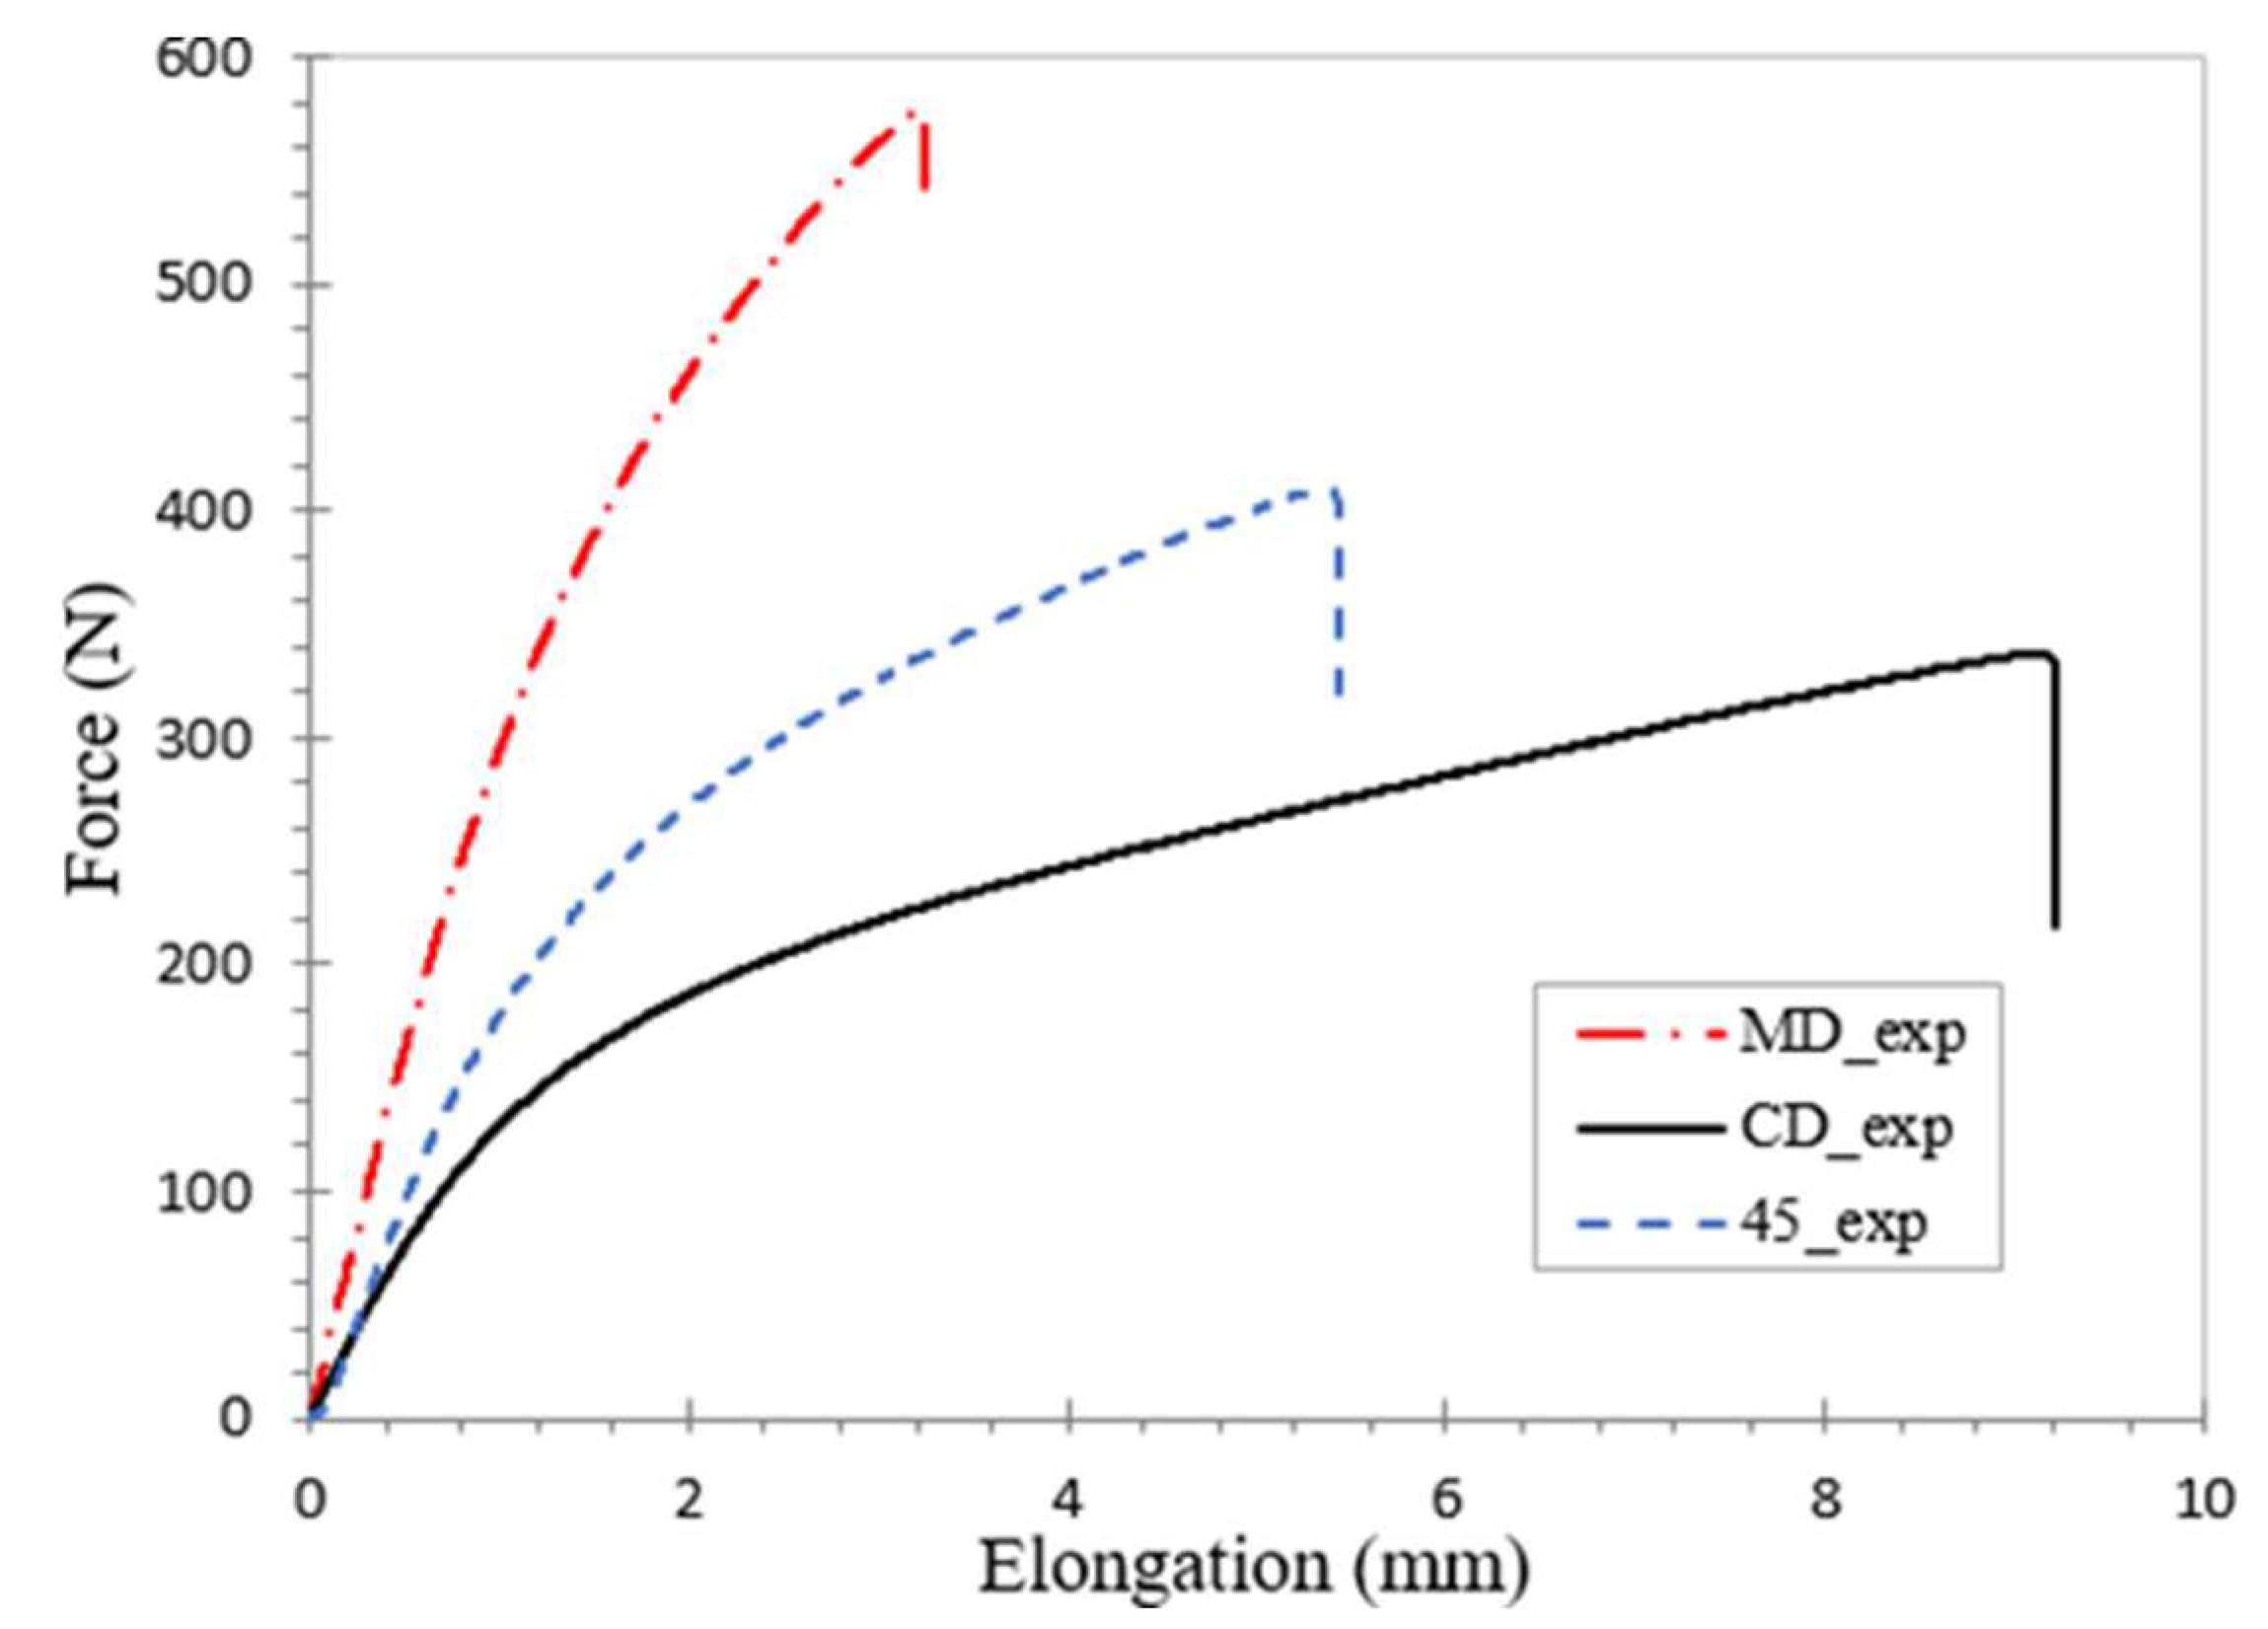
First, tensile experiments on cardboard samples were conducted. The samples were cut on the ZÜND M-1600 cutting machine. To ensure a tighter grip when placing the samples, cardboard pieces were attached to both sides of each end of the tensile specimens. Experimental tensile tests were conducted in three directions: MD, CD, and 45°, at a constant speed of 10 mm/min under standard conditions (23°C and 50% relative humidity). The experimental tensile test results are presented in
Figure 11.
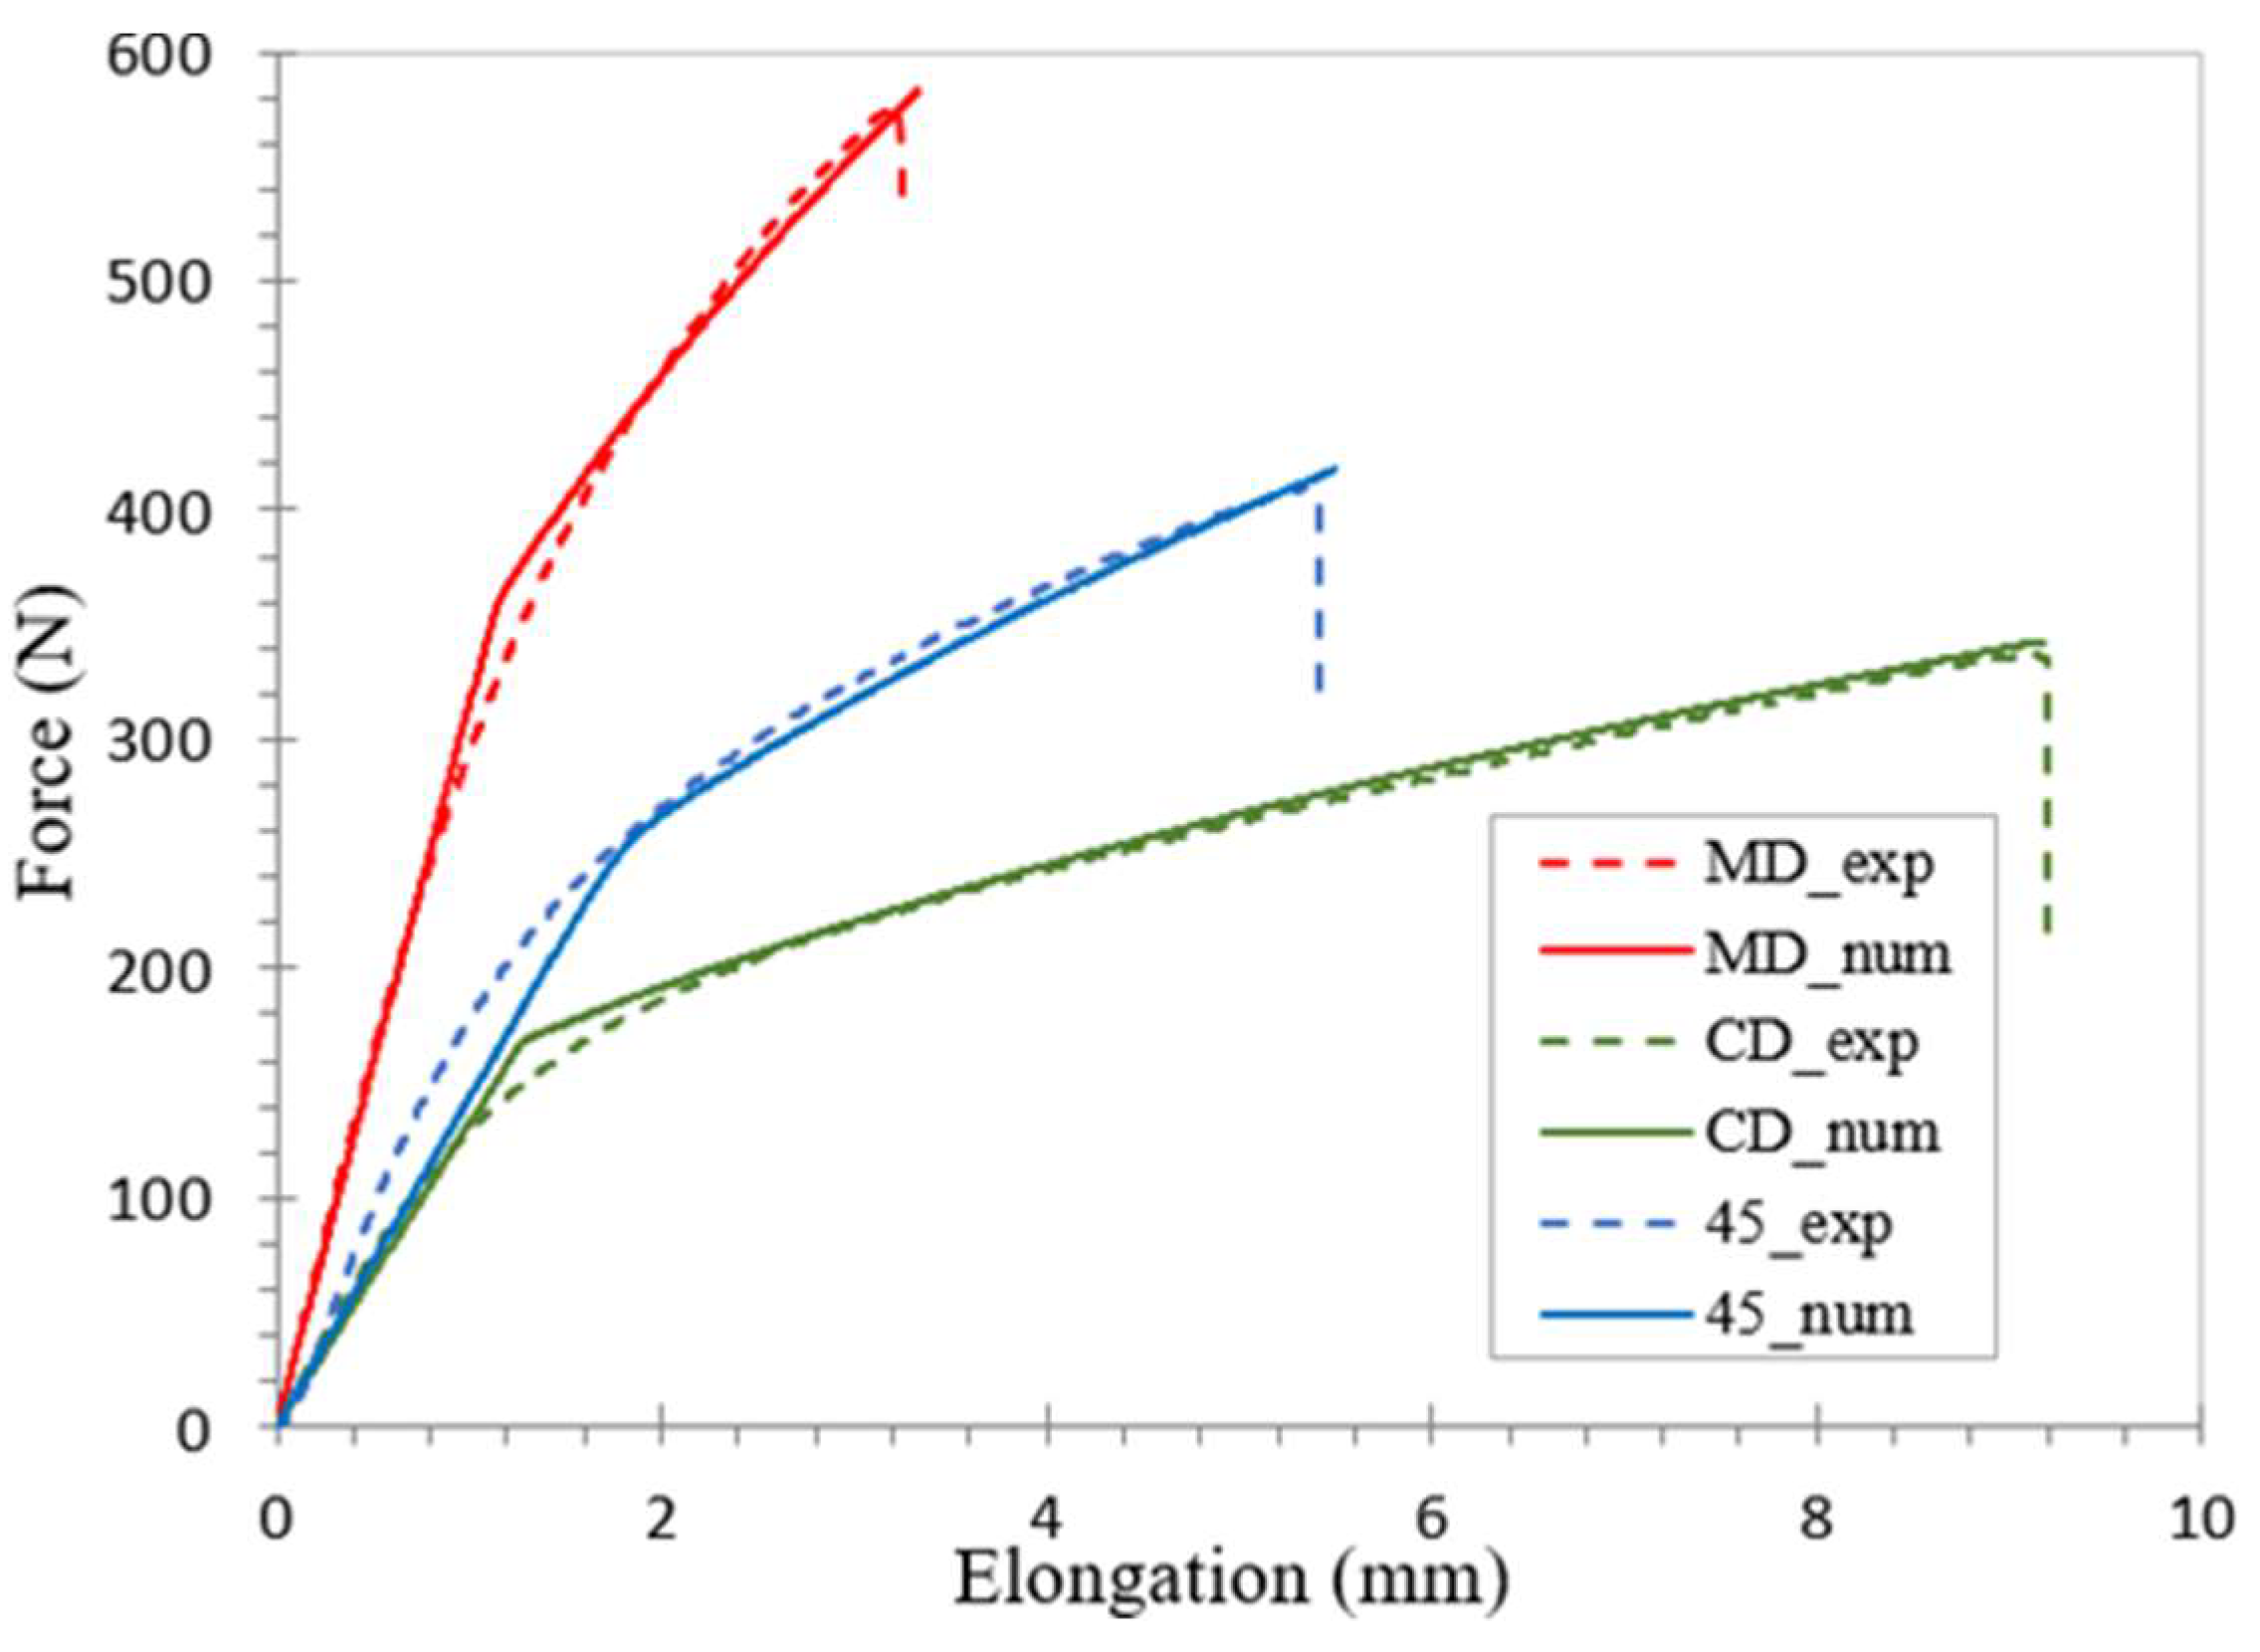
Next, the numerical simulation of cardboard tensile tests was performed using Abaqus software. The dimensions of the simulation model were taken to match the size of the tensile specimens in the experimental tests. In this study, the MOGA-II genetic optimization algorithm was utilized to minimize the objective function in Equation (12). The results of the material parameter determination process are presented in
Table 2,
Table 3, and
Figure 12.
Figure 12 demonstrates the good similarity between the experimental curves and the numerical results obtained through the parameter determination in the IPE model.
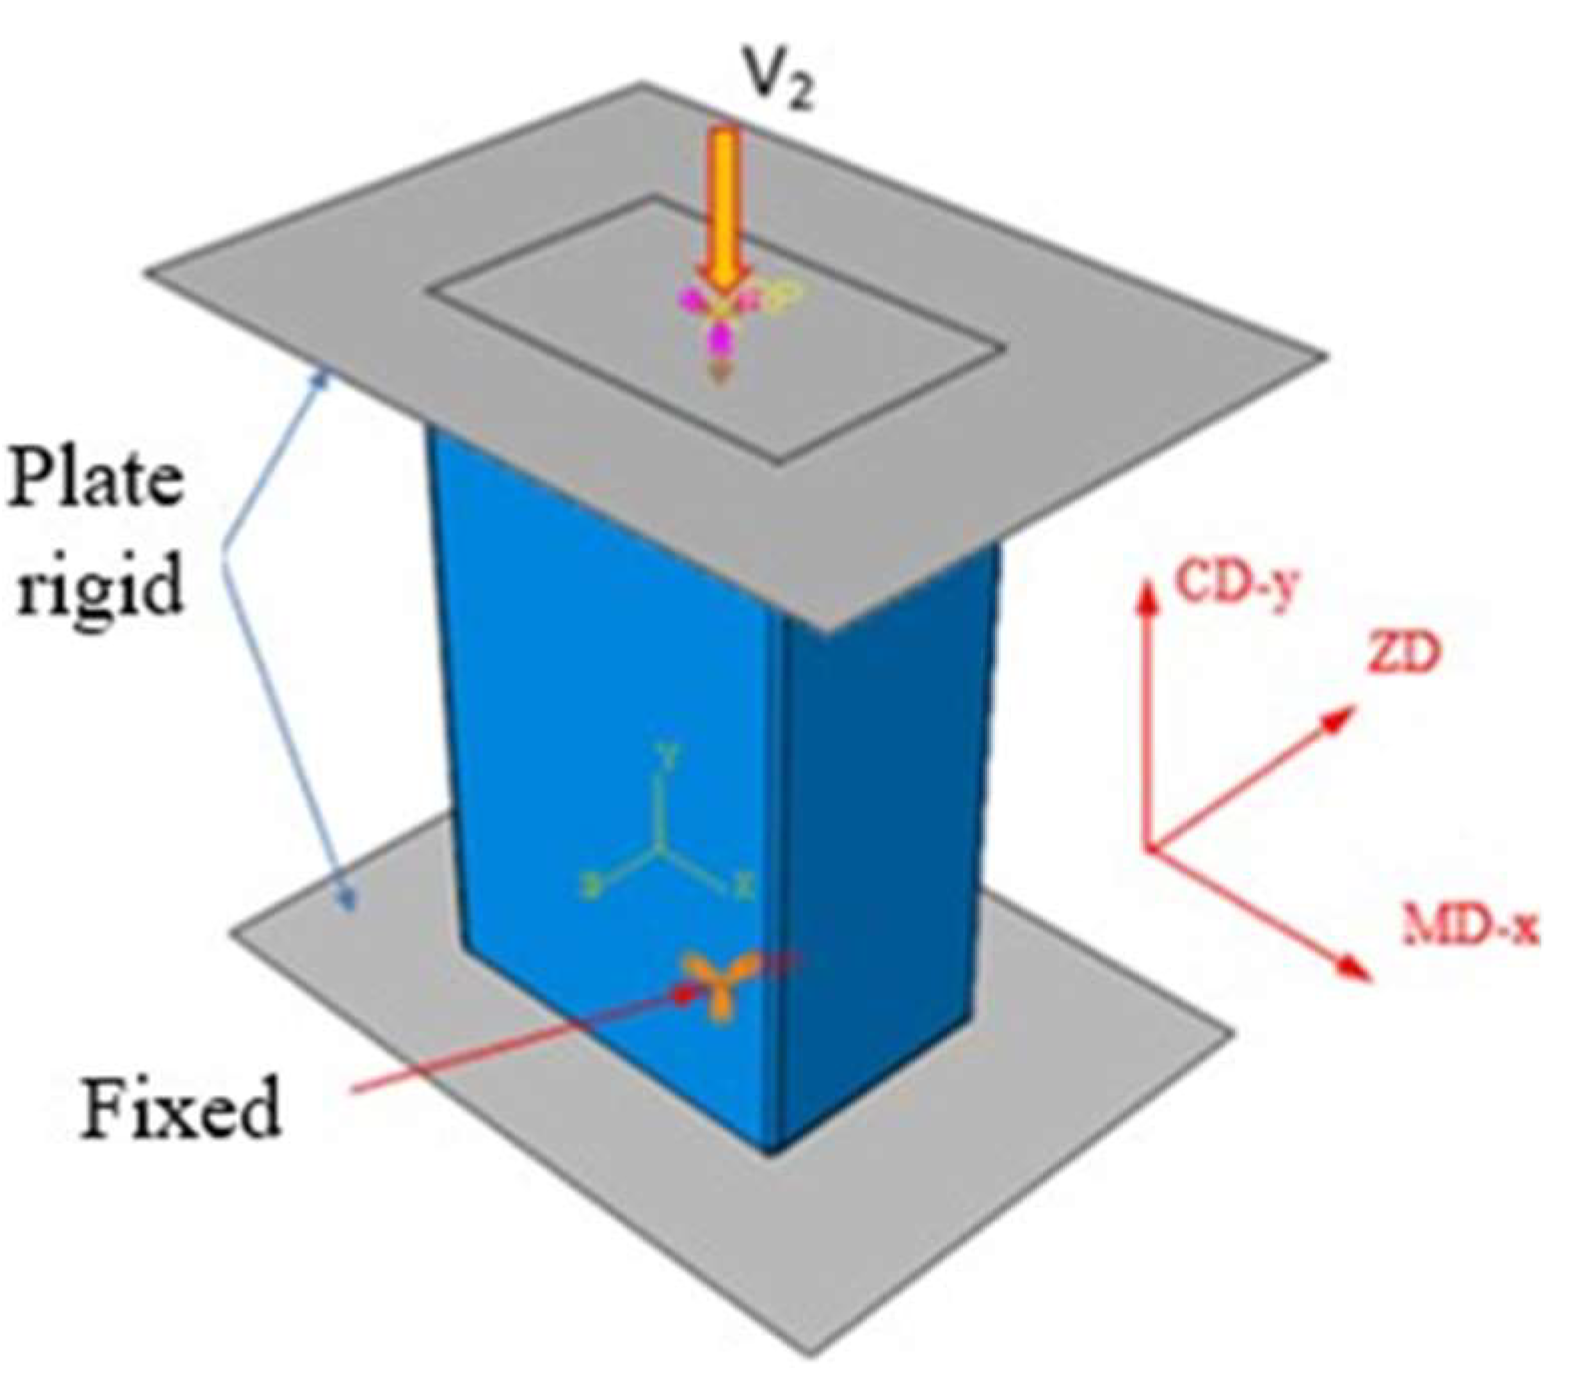
4.1. Simulation Experimental Compression
The box is placed between two rigid plates to simulate the longitudinal compression force. The lower plate is fixed, while the upper plate moves at a rate of 10 mm/min (
Figure 13). The coefficient of friction between the box and the plates is 0.1. We performed a sensitivity study on the coefficient of friction and found that it weakens the overall performance of the box.
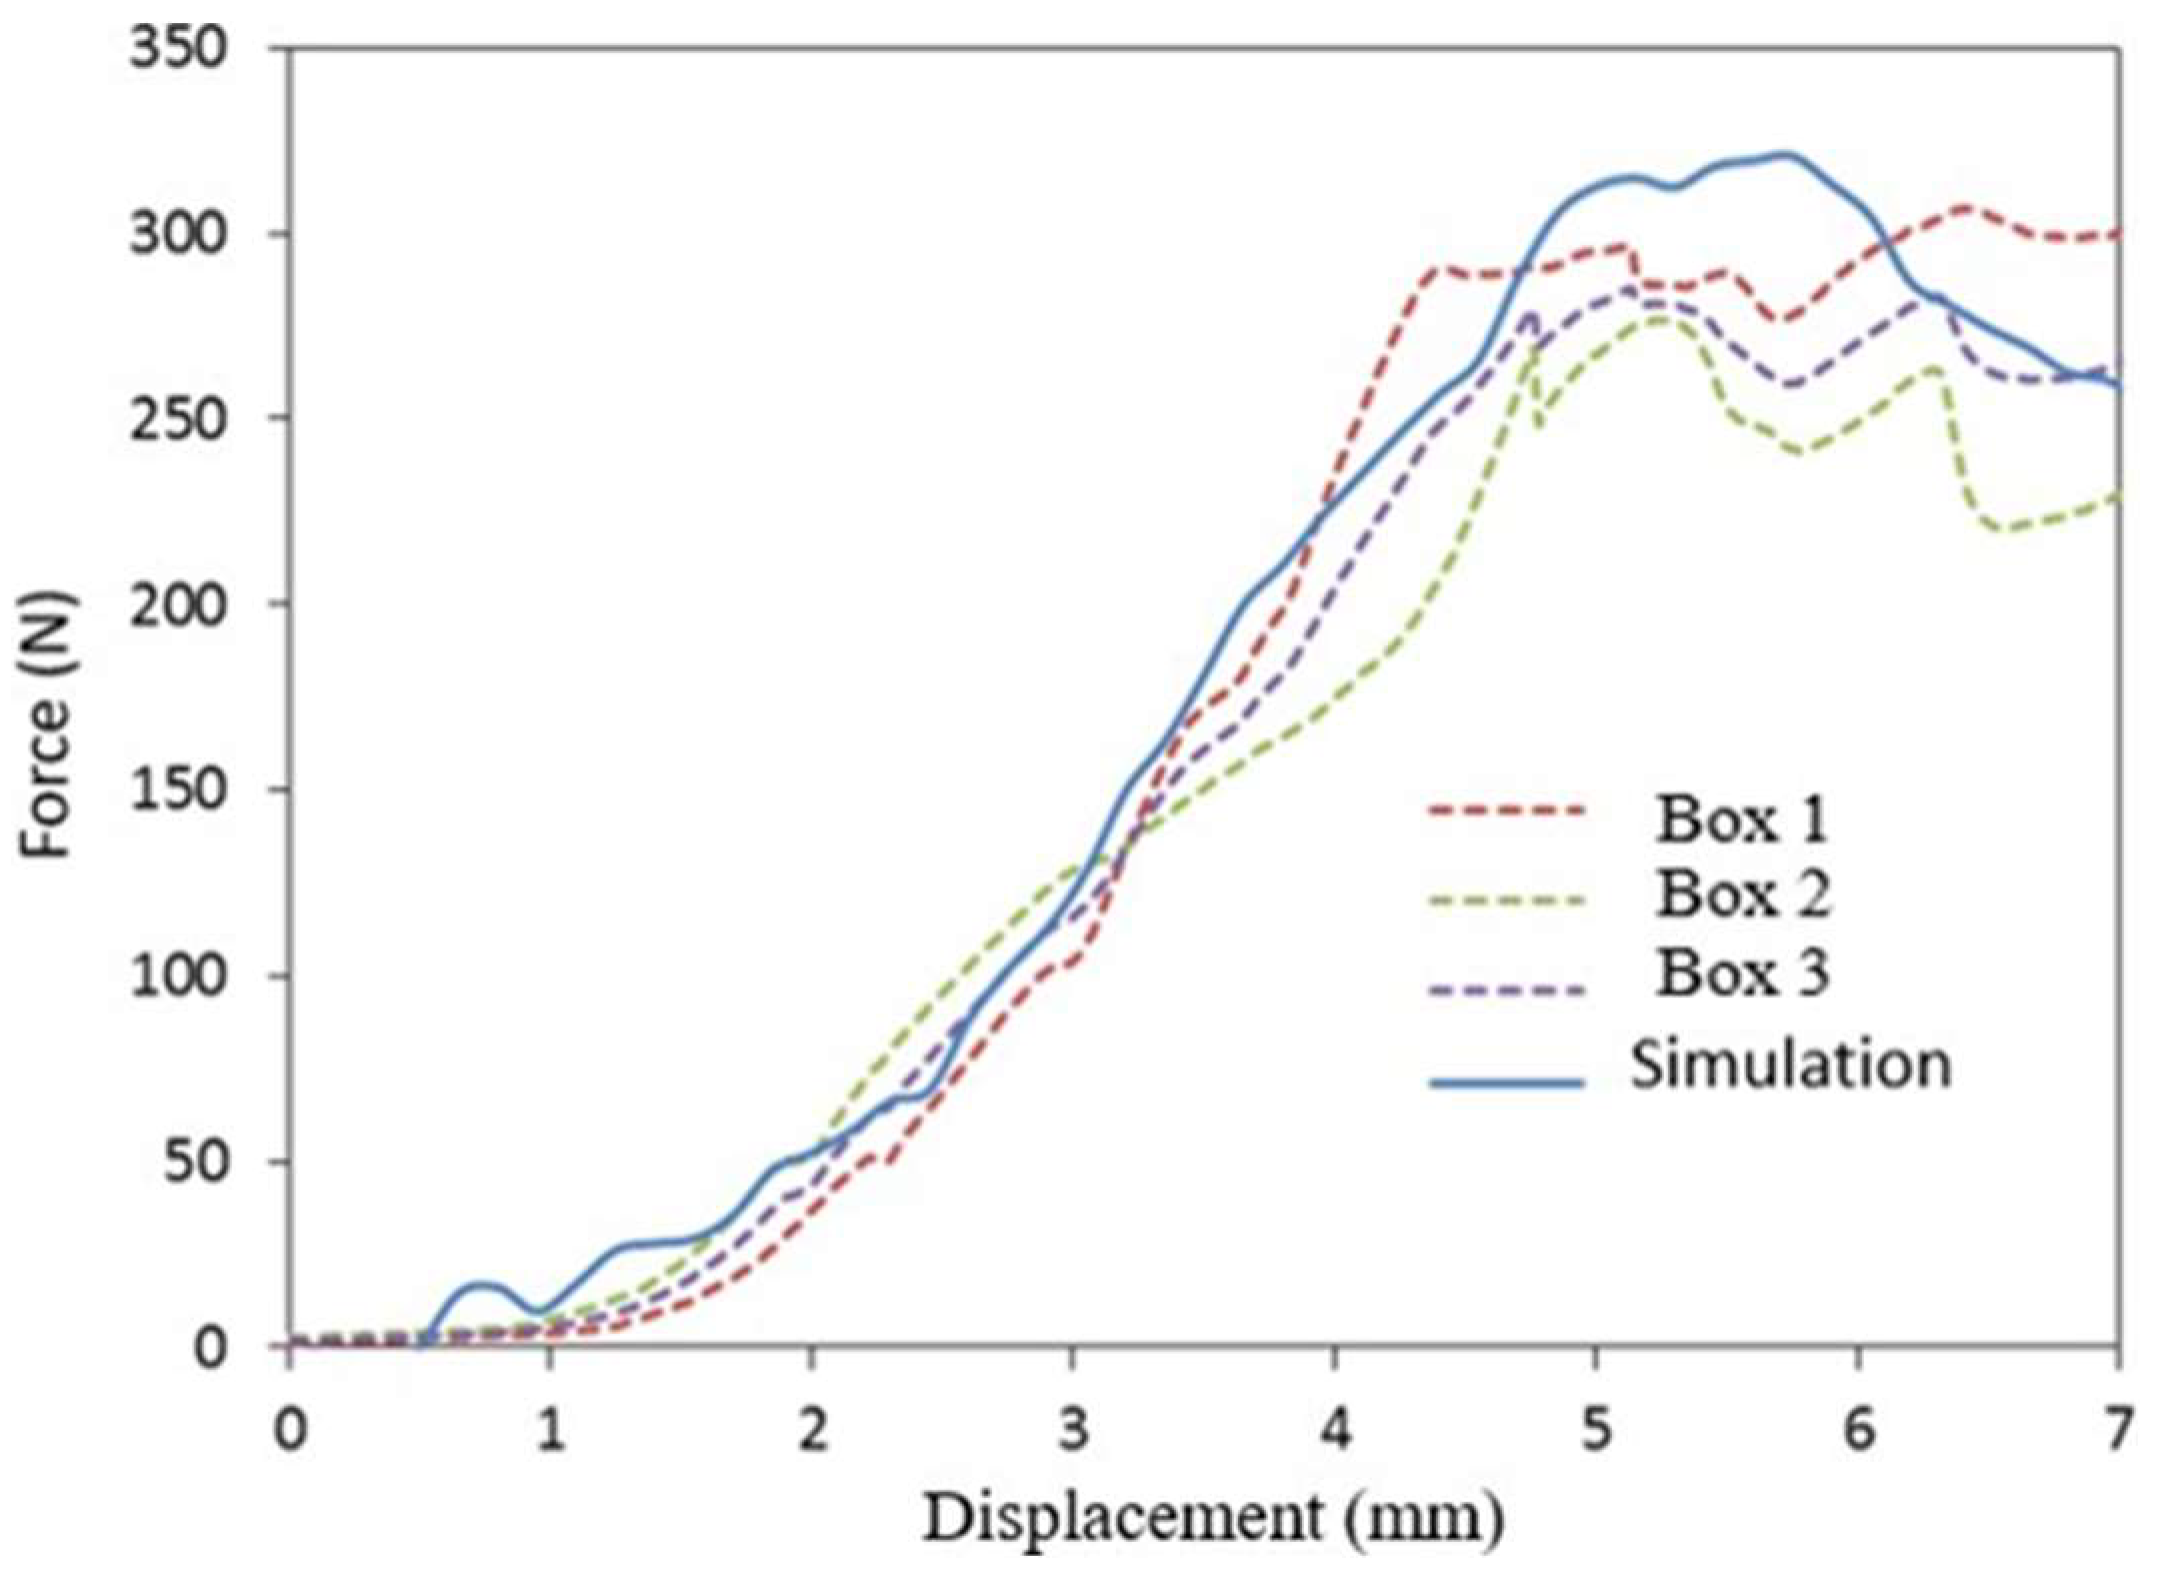
Figure 12 compare the experimental and numerical results of the longitudinal compression curves for the MD- and CD-oriented boxes, respectively. The numerical curves agree with the experimental curves and the difference between the BCT strength values is about 11%. We find that the deformations are concentrated in narrow regions along the corners. The maximum stress on the MD-oriented box (= 79.5 MPa) is higher than the maximum stress on the CD-oriented box (max = 59.0 MPa)
Figure 13.
Boundary conditions for vertical compression of a cardboard box.
Figure 13.
Boundary conditions for vertical compression of a cardboard box.
Figure 14.
Comparison of experimental and numerical results of the BCT strength of the box according to the MD.
Figure 14.
Comparison of experimental and numerical results of the BCT strength of the box according to the MD.
Figure 15.
Comparison of experimental and numerical results of the BCT strength of the box according to the CD.
Figure 15.
Comparison of experimental and numerical results of the BCT strength of the box according to the CD.
4.2. Vibration Test Simulation
The numerical model of the random vibration test was validated by comparing the numerical and experimental results. The same finite element model as the previous section was used, containing 95,135 reduced integral shell (S4R) elements and 95,981 nodes. To simulate the vibration test, two rigid plates were glued to a compact cardboard box: one on the upper side and the other on the lower side. The reference point of the lower plate was fixed and the upper plate with a mass of M=1.41 kg was free to move vertically (
Figure 16). The effect of gravity was enabled to account for the pressure exerted by the upper plate on the box. Frequency analysis (Abaqus/Frequency) followed by random vibration analysis (Abaqus/Random Response) was performed. The input PSD applied to the system was the same as that of the experimental test as shown in
Figure 16.
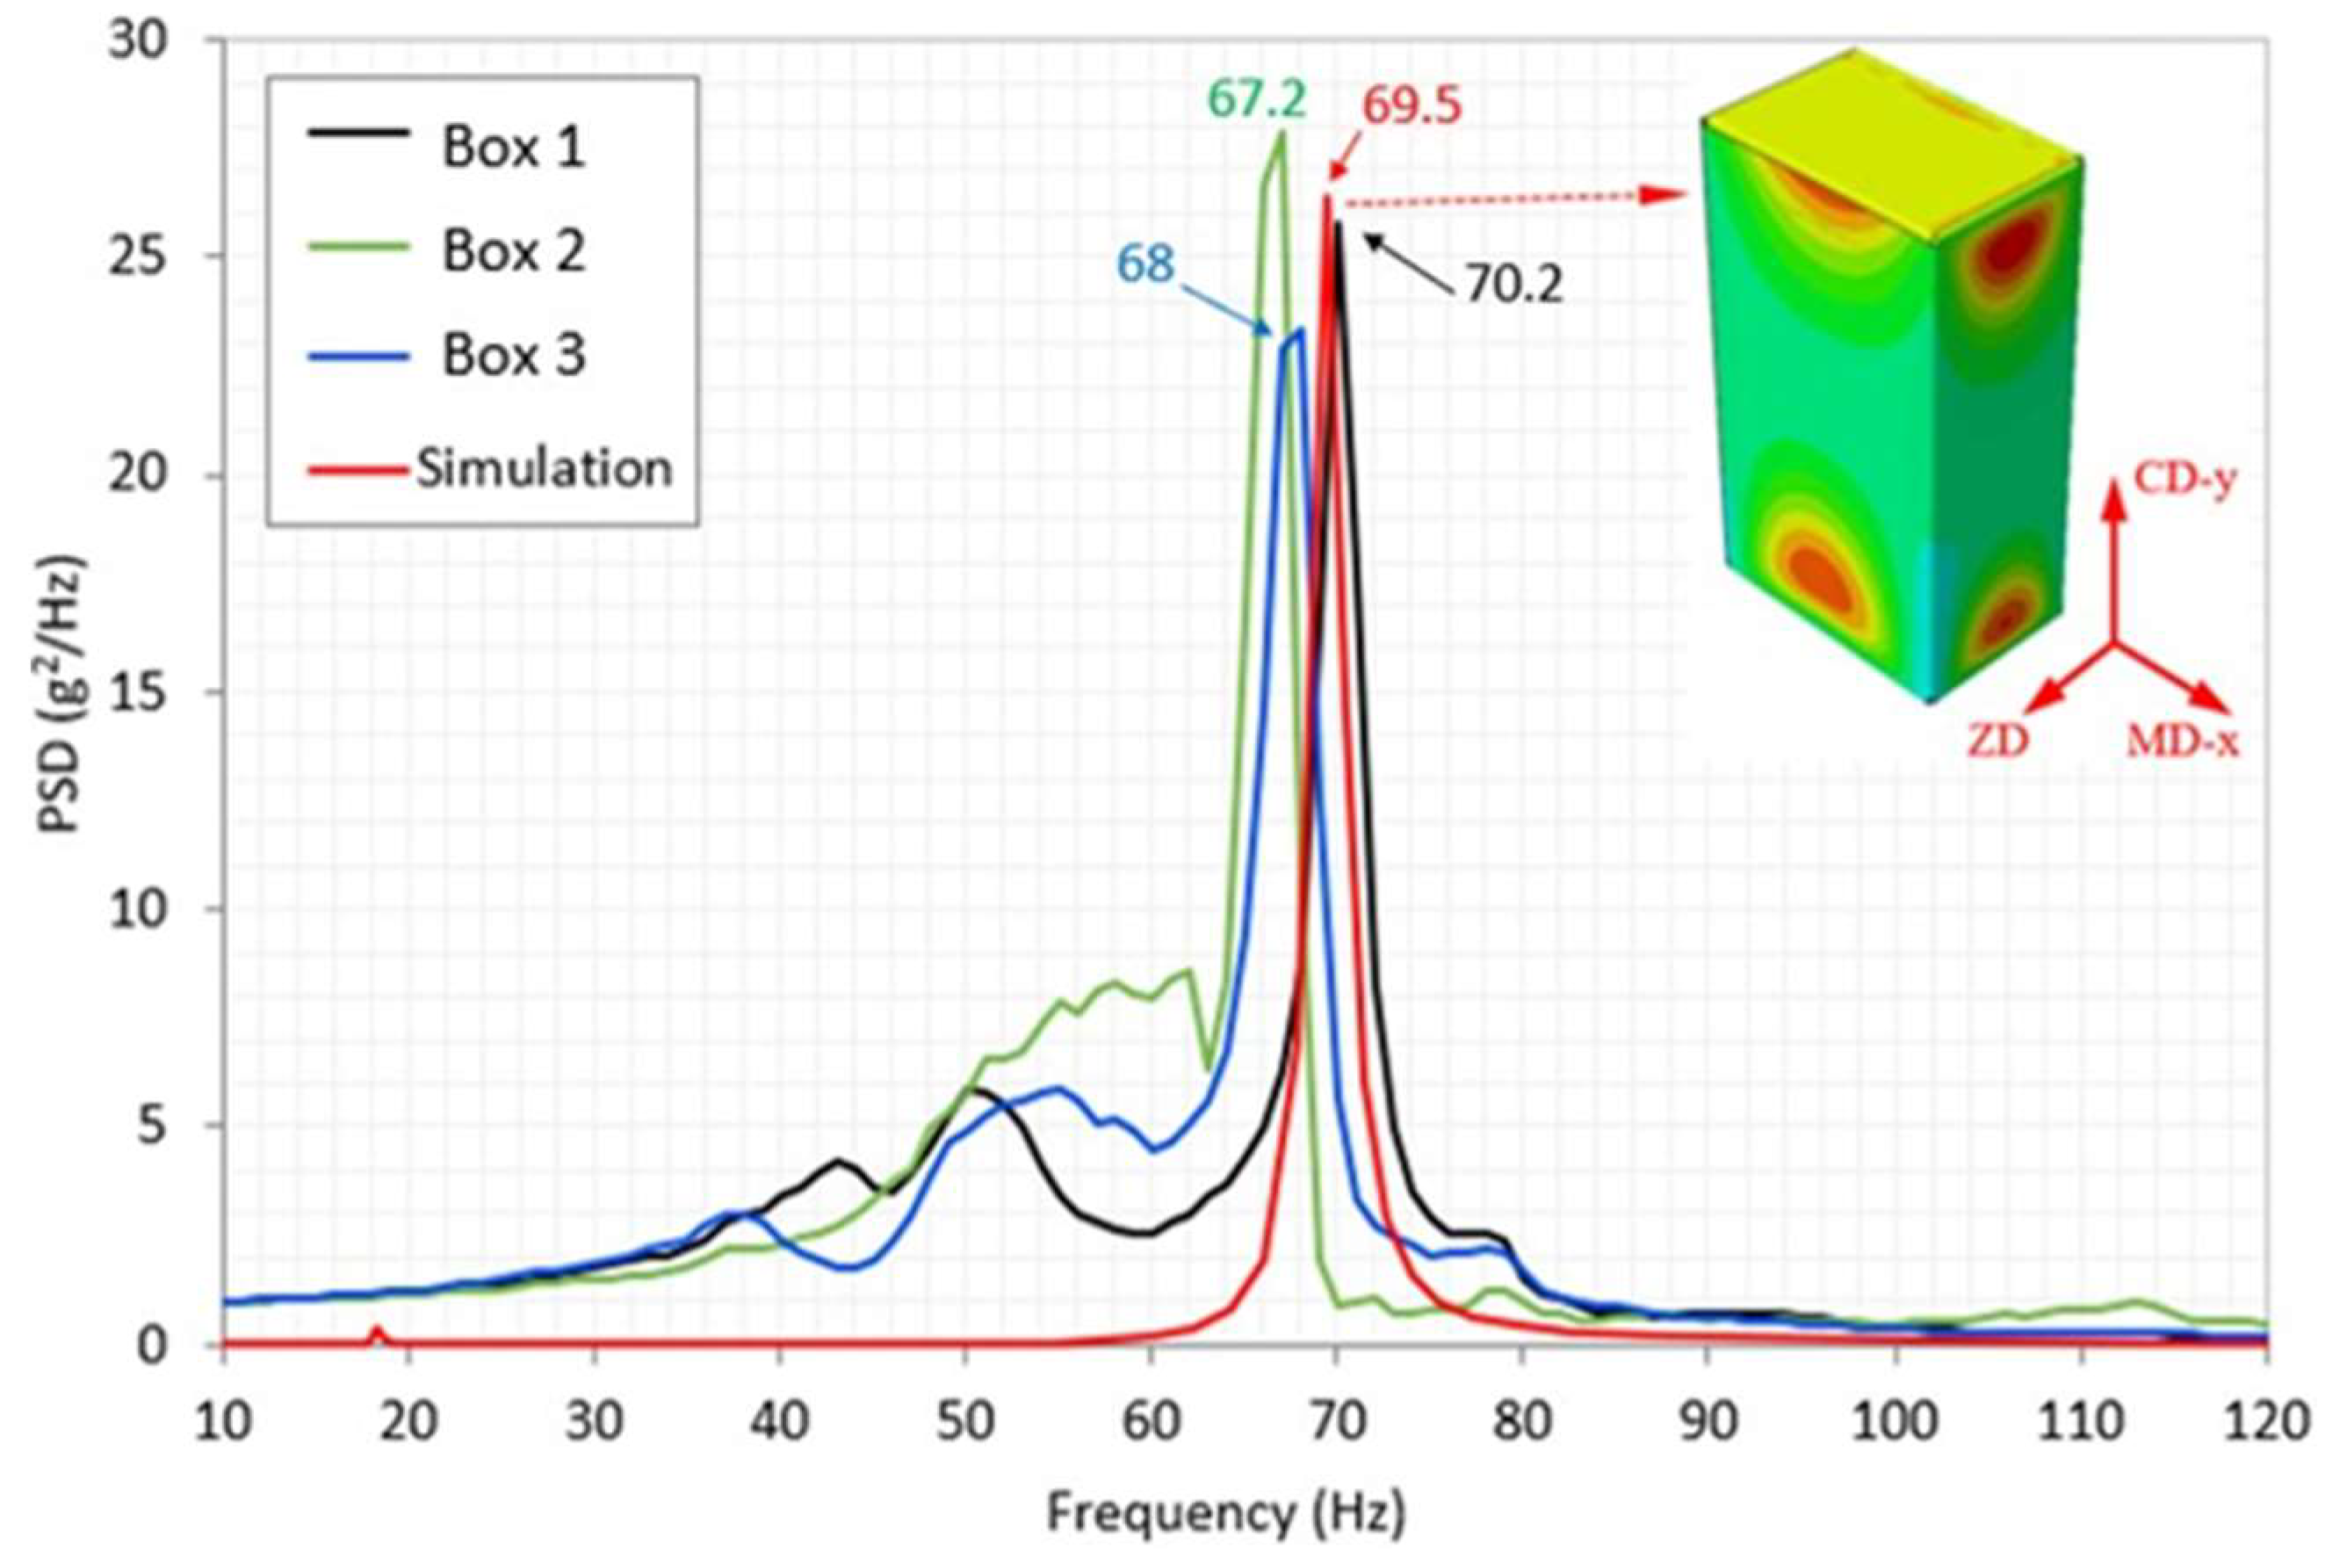
Figure 17 shows the comparison of the PSD response of the mass/box system obtained by numerical simulation with the responses obtained experimentally. The numerical natural frequency is f = 69.5 Hz which is in very good agreement with the values obtained during the experimental tests using the vibrating pot: f = 68.47±1.55 Hz
5. Conclusion
The study evaluated the durability limit of cardboard boxes through static and dynamic tests, including compression strength, natural frequencies, and natural modes. The experiments were set up and conducted under realistic conditions. The obtained results showed that the durability of cardboard boxes in MD and CD directions was different. Then, compression and vibration experiments were modeled and simulated to confirm the experimental results. The comparison showed that the power spectral density (PSD) response of the box system under random vibration, obtained through numerical simulation, was consistent with the experimental results. Similarly, the predicted force-displacement curves showed close agreement with the measured data. The study shows that static and dynamic tests to determine the durability of cardboard boxes can be replaced by numerical simulation models. This has great significance in the design process of cardboard packaging.
Author Contributions
Conceptualization, F.A and B.A.; Investigation, B.A and V.D.L.; Methodology L.T.D and P.T.M.D.; Resources, V.D.L. and B.A.; Software, V.D.L. and L.T.D.; Supervision, V.D.L. and B.A.; Validation, V.D.L. and L.T.D.; Writing—original draft, V.D.L and B.A.; Writing—review and editing, V.D.L and B.A. All authors have read and agreed to the published version of the manuscript.
Data Availability Statement
All data used to support the findings of this study are included withinthe article.
Acknowledgments
This work was funded by the Ministry of Education and Training Vietnam (grant number B2023-TNA-20).
Conflicts of Interest
The authors declare no conflicts of interest
References
- Carlsson, *!!! REPLACE !!!*; De Ruvo, A.; Fellers, C. Bending properties of creased zones of paperboard related to interlaminar defects. Journal of materials science. 1983, 18, 1365–1373. [Google Scholar]
- Carlsson, L.; Fellers, C.; De Ruvo, A. The mechanism of failure in bending of paperboard. Journal of materials science 1980, 15, 2636–2642. [Google Scholar]
- Cavlin, S. The unique convertibility of paperboard. Packaging Technology and Science 1988, 2, 77–92. [Google Scholar] [CrossRef]
- Edholm, B. Bending stiffness loss of paperboard at conversion—predicting the bending ability of paperboard. Packaging Technology and Science: An International Journal . 1998, 11, 131–140. [Google Scholar]
- Giampieri, A.; Perego, U.; Borsari, R. A constitutive model for the mechanical response of the folding of creased paperboard. International Journal of Solids and Structures. 2011, 48, 2275–2287. [Google Scholar] [CrossRef]
- Cavlin, S.; Dunder, I.; Edholm, B. Creasability testing by inclined rules—a base for standardized specification of paperboard. Packaging Technology and Science: An International Journal. 1997, 10, 191–207. [Google Scholar] [CrossRef]
- Nyg, M.; Just, M.; Tryding, J. Experimental and numerical studies of creasing of paperboard. International journal of solids and structures. 2009, 46, 2493–2505. [Google Scholar]
- Beex, L.; Peerlings, R. An experimental and computational study of laminated paperboard creasing and folding. International Journal of Solids and Structures. 2009, 46, 4192–4207. [Google Scholar]
- Amigo, J.C. Stiffness design of paperboard packages using the finite element method. 2011. [Google Scholar]
- Fadiji, T.; Ambaw, A.; Coetzee, C.J.; Berry, T.M.; Opara, U.L. Application of finite element analysis to predict the mechanical strength of ventilated corrugated paperboard packaging for handling fresh produce. Biosystems Engineering. 2018, 174, 260–281. [Google Scholar]
- Viguié, J.; Dumont, P.J.; Desloges, I.; Mauret, E. Some experimental aspects of the compression behaviour of boxes made up of g-flute corrugated boards. Packaging Technology and Science: An International Journal. 2010, 23, 69–89. [Google Scholar]
- Haidar, M. Modelling of failure mechanisms for corrugated board. 2015. [Google Scholar]
- Rodrigues, D.F.; Pereira, J.C. Experimental tests and numerical simulations for failure investigation on corrugated boxes used on house- hold appliance packaging. Journal of Applied Packaging Research. 2018, 10, 6. [Google Scholar]
- Biancolini, M.; Brutti, C. Numerical and experimental investigation of the strength of corrugated board packages. Packaging Technology and Science: An International Journal. 2003, 16, 47–60. [Google Scholar] [CrossRef]
- Kwak, W. Analysis of compression strength of corrugated shipping con tainers with different designed hand holes. Rochester Institute of Technology 2010. [Google Scholar]
- Lamb, M.J.; Rouillard, V. Static and dynamic strength of paperboard containers subjected to variations in climatic conditions. Packaging Technology and Science. 2017, 30, 103–114. [Google Scholar] [CrossRef]
- Thorpe, J.L.; Choi, D. Corrugated container failure. ii: Strain measurements in laboratory compression tests. Tappi journal 1992, 75, 155–161. [Google Scholar]
- Vigui, J.; Dumont, P.J.; Vacher, P.; Org, L.; Desloges, I.; Mauret, E. Analysis of the strain and stress fields of cardboard box during compression by 3d digital image correlation. Applied Mechanics and Materials. 2010, 24, 103–108. [Google Scholar] [CrossRef]
- Jarimopas, B.; Singh, S.P.; Saengnil, W. Measurement and analysis of truck transport vibration levels and damage to packaged tangerines during transit. Packaging Technology and Science: An International Journal. 2005, 18, 179–188. [Google Scholar] [CrossRef]
- Singh, S.P.; Sandhu, A.; Singh, J.; Joneson, E. Measurement and analysis of truck and rail shipping environment in India. Packaging Technology and Science: An International Journal. 2007, 20, 381–392. [Google Scholar] [CrossRef]
- Rissi, G.O.; Singh, S.P.; Burgess, G.; Singh, J. Measurement and analysis of truck transport environment in Brazil. Packaging Technology and Science: An International Journal. 2008, 21, 231–246. [Google Scholar] [CrossRef]
- Garcia-Romeu-Martinez, M.-A.; Singh, S.P.; Cloquell-Ballester, V.-A. Measurement and analysis of vibration levels for truck transport in Spain as a function of payload, suspension and speed. Packaging Technology and Science: An International Journal. 2008, 21, 439–451. [Google Scholar] [CrossRef]
- Borocz, P.; Singh, S.P. Measurement and analysis of vibration levels in rail transport in central Europe. Packaging Technology and Science. 2017, 30, 361–371. [Google Scholar] [CrossRef]
- Paternoster, A.; Vanlanduit, S.; Springael, J.; Braet, J. Vibration and shock analysis of specific events during truck and train transport of food products. Food packaging and shelf life. 2018, 15, 95–104. [Google Scholar]
- Paternoster, *!!! REPLACE !!!*; Vanlanduit, S.; Springael, J.; Braet, J. Measurement and analysis of vibration and shock levels for truck transport in Belgium with respect to packaged beer during transit. Food Packaging and Shelf Life. 2018, 15, 134–143. [Google Scholar]
- Fadiji, T.; Coetzee, C.; Chen, L.; Chukwu, O.; Opara, U.L. Susceptibility of apples to bruising inside ventilated corrugated paperboard packages during simulated transport damage. Postharvest Biology and Technology. 2016, 118, 111–119. [Google Scholar]
- Fernando, *!!! REPLACE !!!*; Fei, J.; Stanley, R.; Rouillard, V. Evaluating packaging performance for bananas under simulated vibration. Food Packaging and Shelf Life. 2020, 23, 100428. [Google Scholar]
- Guo, Y.; Xu, W.; Fu, Y.; Zhang, W.; et al. Comparison studies on dynamic packaging properties of corrugated paperboard pads. Engineering. 2010, 2, 378. [Google Scholar] [CrossRef]
- Zhang, Q.; Saito, K.; Nagaoka, K. Damping package design using structural corrugated board. Journal of Applied Packaging Research. 2017, 9, 19–33. [Google Scholar]
- Marcondes, *!!! REPLACE !!!*; Batt, G. Update on dynamic compression measurement and testing. 2003. [Google Scholar]
- Broch, T.; Courrech, J. Mechanical vibration and shock measurements, Bru¨el & Kjaer Nærum. 1980. [Google Scholar]
- Frank. Corrugated box compression—a literature survey. Packaging Technology and science. 2014, 27, 105–128. [Google Scholar] [CrossRef]
- Gudavicius. Finite element analysis of e-commerce corrugated board cushioning. Master’s Thesis, KTH, Stockholm, Sweden 2018.
- Makela, P.; Ostlund, S. Orthotropic elastic–plastic material model for paper materials. International Journal of Solids and Structures. 2003, 40, 5599–5620. [Google Scholar] [CrossRef]
- Karafillis, A.; Boyce, M. A general anisotropic yield criterion using bounds and a transformation weighting tensor. Journal of the Mechanics and Physics of Solids. 1993, 41, 1859–1886. [Google Scholar] [CrossRef]
|
Disclaimer/Publisher’s Note: The statements, opinions and data contained in all publications are solely those of the individual author(s) and contributor(s) and not of MDPI and/or the editor(s). MDPI and/or the editor(s) disclaim responsibility for any injury to people or property resulting from any ideas, methods, instructions or products referred to in the content. |
© 2025 by the authors. Licensee MDPI, Basel, Switzerland. This article is an open access article distributed under the terms and conditions of the Creative Commons Attribution (CC BY) license (http://creativecommons.org/licenses/by/4.0/).