Submitted:
10 March 2025
Posted:
11 March 2025
You are already at the latest version
Abstract
This study aims to explore the impact of social media usage frequency on individual air travel behavior, addressing a gap in the existing literature regarding the relationship between social media usage and air travel behavior. Grounded in the Theory of Planned Behavior (TPB) and the Media System Dependency (MSD) theory, the study constructs a dual-path transmission model of individual behavior. Empirical analysis is conducted using data from the 2022 China Family Panel Studies (CFPS), employing statistical methods such as Ordered Logistic regression, the Instrumental Variable method, and Mediation Effect analysis. Additionally, marginal effect analysis of interaction terms is utilized to examine heterogeneity. The results indicate that social media usage frequency has a significant positive impact on air travel behavior, which varies across different educational and health status groups. Notably, individuals in lower-income groups are more likely to choose air travel when their social media usage frequency is high. These findings provide new insights into the role of social media in individual travel decision-making and highlight the complexity of social media’s influence, revealing multiple pathways in different behavioral contexts.
Keywords:
social media
; air travel
; TPB
; 2022 CFPS
; WeChat
1. Introduction
1.1. Background
Against the backdrop of sustained economic growth and rising income levels in China, the popularization of air travel has accelerated, revealing significant potential for further expansion in this burgeoning market. According to the Civil Aviation Administration of China (CAAC), as of 2019, almost 1 billion people in China had never flown on an airplane, with the average number of air travel trips per person being only 0.47, merely 20% of the level observed in developed countries.[1] Despite competition from high-speed rail and the disruptions caused by the COVID-19 pandemic, passenger traffic in China’s aviation market had rebounded to pre-pandemic levels by 2023, highlighting its remarkable growth potential.[2] Forecasts from the Aviation Industry Corporation of China (AVIC) indicate that the number of commercial aircraft in China is expected to represent 15% of the global market, positioning the country as a key player in the international civil aviation industry.[3]
The growth prospects of the aviation market face multiple challenges. On one hand, the widespread adoption of high-speed rail and uncertainties in international geopolitics have introduced volatility into the development of the aviation industry. On the other hand, the rise of social media platforms is profoundly influencing people’s decision-making in travel. These platforms, through innovative content dissemination and visual effects, have transformed traditional communication methods and quickly impacted people’s consumption habits and travel choices. In China, platforms such as WeChat, TikTok, and Rednote have become integral to residents' daily lives. Their content not only meets entertainment and work needs but also influences public perceptions and attitudes toward air travel.
For civil aviation and other related industries, leveraging social media platforms for digital marketing could enhance brand awareness, and even influence the construction of electronic word-of-mouth (eWOM).[4] Whereas the dissemination of negative content on social media, such as reports of aviation accidents or service complaints, can have substantial adverse effects on the public’s intention to travel by air. Therefore, understanding the impact of social media and responding to the emotional fluctuations it generates has become a critical issue for the aviation industry in enhancing market competitiveness and stability. This study focuses on addressing these challenges.
1.2. Questions
Based on the aforementioned context, we have addressed three core questions: (1) Through which mechanisms does social media influence an individual’s willingness to travel by air? (2) Do the effects of these mechanisms exhibit significant differences across various demographic groups? (3) How can effective regulatory strategies be developed to optimize the positive impact of social media dissemination? In order to answer them, we construct an analytical framework to examine how social media affects individual travel behavior. We will use data from the 2022 CFPS and employ various empirical methods, including Ordered Logistic Regression, Instrumental Variables methods, Mediation Effect Analysis, etc, to implement what we have planned.
The contributions of this study are as follows: (1) It examines the frequency of social media usage and analyzes the specific mechanisms through which it influences individual travel behavior, providing a novel perspective that enhances the existing literature. (2) It elucidates the heterogeneity of social media effects across various dimensions, such as education level and health status. (3) It employs a range of empirical methods to ensure the accuracy and reliability of the results, including Ordered Logistic Regression, Instrumental Variables method, and Mediation Effect Analysis, etc.
2. Literature Review
2.1. The Impact of Social Media on Individual Travel Behavior
Existing studies examining the influence of social media on individual travel behavior can be broadly categorized into empirical and normative research, the former focuses on specific case studies, while the latter analyzes underlying mechanisms. In empirical research, Ekkapong Cheunkamon et al. (2020) applied the Theory of Planned Behavior to investigate the impact of social media on travel planning among Thai tourists, they found that social media influences tourists’ travel behavior intentions through factors such as satisfaction, subjective attitudes, and overall perceptions.[5] Similarly, Gulati et al. (2024) utilized Partial Least Squares Structural Equation Modeling (PLS-SEM) to examine the cyclical changes in social media usage during the travel decision-making process among residents in developing countries, with a particular focus on India.[6] Van der Meer et al. (2021) conducted a comparative analysis of media coverage of aviation and road accidents in the United States from 1996 to 2017, their results suggested that the risks associated with air travel were more likely to be exaggerated by the media, and that biased reporting of negative events could reinforce irrational risk-avoidance behaviors among audiences.[7]
In normative research, Sobia Shahzad et al. (2024) examined the differential impacts of social media usage across various entities, revealing that promotional activities by governments, official institutions, and tourism organizations received positive feedback through media engagement.[8] P. Pushparaj et al. (2024) conducted a comprehensive analysis of the mechanisms through which social media influences consumer decision-making, synthesizing 62 cases to explain why certain factors positively or negatively affect decision outcomes.[9] Jumakova Lale et al. (2024) explored how social media platforms shape individual travel decisions, noting that, based on gender analysis, females tend to utilize social media more frequently than males in their travel decision-making process.[10]
2.2. Key Factors Influencing Individual Air Travel Behavior
As for the factors influencing air travel, the existing literature primarily concentrates on several specific determinants, including economic conditions, education levels, alternative modes of transportation, and health status. Fangni Zhang et al. (2020) analyzed the causal relationship between air transport and economic growth, concluding that this relationship is often bidirectional in underdeveloped economies, while in developed economies, the causal direction is typically one-way, flowing from air transport to economic growth.[11] Ae Dingil et al. (2021) highlighted the significant impact of education levels on urban residents’ travel decisions, noting that air travel serves as a critical alternative to reliance on cars, thereby promoting the development of sustainable transportation modes.[12] Hongchang Li (2019) examined the competitive pressure faced by China’s aviation industry from high-speed rail and found that the introduction of high-speed rail led to a more than 50% decline in the number of passengers choosing air travel within two years, significantly impacting the growth of the aviation industry.[13] Aliza Fleischer et al. (2012) investigated the impact of fear of flying (FOF) on air travel behavior, noting that individuals with higher levels of FOF exhibit lower price elasticity for flight demand, which in turn affects their valuation of flight attributes.[14] The above studies have laid a basic direction of reference for the subsequent studies.
2.3. The Impact of Social Media on Air Travel Behavior
Direct research on the impact of social media on individual air travel behavior is relatively limited, with most studies concentrating on the content of platform information or analyzing the attributes of the media itself. Chao Pan et al. (2020) examined the TikTok accounts of Chinese airlines as the research subject. They analyzed the current state of these services and proposed 4 optimization strategies designed to enhance the influence of the TikTok accounts in China. The goal was to strengthen recognition of the accounts among both the airlines and ordinary users.[15] Kai Li et al. (2024) investigated the relationship between disaster information disseminated through media and vicarious traumatization among users, they utilized the MU5735 crash as a case study, arguing that different algorithmic rules play a crucial mediating role in shaping this relationship.[16] Adam Buday et al. (2023) highlighted the importance of social media as a tool for airlines to evaluate service quality. Their findings indicated that full-service carriers typically received complaints related to reservations and service quality, whereas low-cost carriers encountered more complaints regarding delays and flight cancellations.[17]
2.4. Summary and Critical Review
Upon reviewing the existing literature, it is evident that numerous studies have highlighted the significant impact of social media on individual travel decisions. However, several gaps remain that need to be addressed. (1) Regarding the theoretical frameworks, current studies predominantly develop analytical models from the perspectives of information dissemination and consumer behavior; whereas their theoretical compatibility and explanatory power require further enhancement. (2) In terms of research content, the existing literature primarily concentrates on the specific content of social media and the characteristics of media tools, with limited consideration of how the frequency of social media usage may influence individual decision-making. (3) Concerning research methods, most studies rely on singular quantitative analyses, such as PLS-SEM, with insufficient exploration of the interactive effects of multidimensional variables.
Building upon these gaps, this study aims to contribute to the existing literature by addressing the following parts: (1)Theoretically, it seeks to integrate media factors into the TPB, revealing the dual-pathway mediation mechanisms through which media influences individual behavior. (2)In terms of content, it will focus on the impact of social media usage frequency on individual air travel behavior, utilizing a case study from China for empirical analysis. (3)Methodologically, it will employ Ordered Logistic regression, Instrumental Variable methods, Mediation Effect Analysis, etc, to evaluate these impacts.
3. Theoretical Framework and Research Hypotheses
3.1. Core Concepts of the Theory of Planned Behavior
From a social-psychological perspective, individual travel behavior is influenced by personal needs and external environmental stimuli, ultimately leading to specific behavioral actions.[18] In the studies of individual behavior, two major theoretical frameworks are predominant: the Theory of Reasoned Action (TRA) and the Theory of Planned Behavior (TPB), both developed by Icek Ajzen and his colleagues. These theories primarily investigate the relations between individual behavior and attitudes, providing valuable insights into decision-making.
The TRA is based on the premise of rational decision-making, akin to the concept of the “Rational Economic Man” in economics. This theory is structured around two primary components, attitude toward the behavior and subjective norm; the former refers to an individual’s positive or negative evaluation of a specific action, with stronger attitudes leading to more definitive behaviors; the latter represents the social pressure an individual experiences when engaging in a particular behavior, highlighting the influence of social groups on individual decision-making; this theory aims to predict behavioral intentions by evaluating the consequences of actions based on the information an individual has gathered in a wholly rational manner.[19] However, in real-world scenarios, individual willpower is not entirely autonomous; it is influenced by various factors. Consequently, Ajzen expanded the TRA into TPB to address the limitations of the former.
The TPB further refines the framework by introducing the variable of perceived behavioral control, which reflects an individual’s perception of the extent of control they have over performing a behavior, taking into account factors such as knowledge, skills, and available resources, this perception of control directly influences actual behavior; Ajzen emphasized a strong positive correlation between behavioral intention and the attitude, subjective norm, and perceived behavioral control; in other words, a more positive attitude and a stronger perception of control lead to a greater intention to act, and the relationships among these variables are illustrated in Figure 1.[20] It can be seen that the attitude toward the behavior, subjective norm, and perceived behavioral control are independent yet interrelated, collectively influencing both behavioral intention and actual behavior. Ajzen further argued that factors such as individual and socio-cultural characteristics, including personality, and cultural background, exert influence on these variables, ultimately shaping an individual’s intentions and behaviors.[21]
Due to its comprehensive integration of individual will and the influence of the social environment, as well as its capacity to predict and explain individual behavior, the TPB has been widely applied across various fields, including travel behavior, dining, and investment.[22] Given these advantages, it is highly feasible to use the TPB framework to analyze the factors influencing individual air travel behavior, with the potential to incorporate additional variables such as social media.
3.2. Theoretical Integration of Social Media
In the context of Media System Dependency (MSD) theory, individuals are more likely to rely on media to navigate ambiguous and uncertain events, as media provide a means to address unclear information.[23] Furthermore, during significant risks or crises, the frequency of media usage tends to increase, enabling individuals to acquire valuable information in a timely manner for assessing the situation.[24] As individuals become more reliant on media, they gradually build trust in the content provided which subsequently influences their behavioral intentions, which suggests that an individual’s behavior is affected by the media dependence they develop.[25] If the quality of media content fails to meet individuals’ informational needs, their trust in the media diminishes, prompting them to seek alternative sources of information.[26] This can lead to a phenomenon similar to the “Tacitus Trap”. Therefore, media trust and media dependence create a positive feedback loop that ultimately influences individual behavior. This relationship can be expressed in terms of the frequency of media usage, with all three variables exhibiting bidirectional correlations.
When integrating the above with the TPB, an individual’s behavior is influenced by three core independent variables: attitude toward the behavior, subjective norm, and perceived behavioral control. The inclusion of social media as a variable indicates that individual behavior is directly affected by media dependence. The development of media dependence, in turn, influences an individual’s overall assessment of available resources, which is subsequently reflected at the behavioral level as perceived behavioral control. Furthermore, as media trust emerges from media dependence, the establishment of media trust inevitably impacts an individual’s attitude toward uncertain events. These resultant effects ultimately shape behavior itself. Since selecting a mode of transportation is an uncertain event, individuals typically seek information from various sources before making their final decision. Social media, as a well-established source of information, provides individuals with resources that gradually enhance their media dependence and media trust, which are manifested in terms of the frequency of media use. Through this process, social media significantly influences final travel behavior. Figure 2 offers a clearer illustration of the mechanism by which social media affects individual travel behavior.
3.3. Introduction to Air Travel Behavior and Research Hypotheses
Air travel, as a subset of travel behavior, falls within the scope of the proposed mechanism. When faced with the uncertainty of whether to choose air travel, individuals similarly rely on media and other channels to acquire valuable information that assists in their decision-making. If individuals receive information from social media more quickly and of higher quality than from other channels, their dependence on media and trust in it gradually develop through a process of reciprocal reinforcement, leading to an increase in the frequency of media usage.
The information individuals obtain from the media regarding air travel can be divided into two types: the positive, brand-building marketing advertisements; and the negative, complaints or safety incidents. The application of social media in air travel enhances the digital experience for users, reduces individual travel costs, and promotes airline revenue.[27] While incidents such as airline accidents are relatively infrequent, their media attention is increasing, and the disproportionate coverage of negative events further distorts individuals’ risk perception of air travel.[28] As individuals’ frequency of social media usage increases, the likelihood of encountering positive or negative information theoretically becomes equal. Due to the influence of platform algorithms and so on, individuals are likely to be exposed to one type of information over the other, affecting their decisions on air travel.
It is evident that the frequency of social media usage, given the media’s “magnifying glass” and “double-edged sword” functions, does not exert a uniform effect on individual air travel behavior. Considering the sporadic nature of air disasters and complaints, along with ongoing improvements in safety measures, air travel continues to be one of the safest modes of transportation.[29] Even with an increase in the frequency of social media usage, the impact of negative information on individual air travel behavior remains limited. Hence we propose Hypothesis 1:
H1:
The frequency of social media usage has an overall positive effect on individual air travel behavior.
In examining the factors that influence individual air travel behavior, the existing literature typically addresses dimensions such as economic conditions and educational attainment. Furthermore, according to the TPB, behavior is influenced not only by core variables like perceived behavioral control but also by indirect factors such as personality, culture, and so on. Most existing analyses mainly focus on these aspects. This study aims to differentiate groups based on education level and health status to explore the variations within these dimensions, which represents a significant contribution of this study. Thus we propose Hypothesis 2:
H2:
The frequency of social media usage impacts individual air travel behavior differently, with various groups experiencing these effects to varying degrees.
4. Data and Methods
4.1. Data Source
The data utilized in this study are derived from the 2022 CFPS, conducted by Peking University. This longitudinal survey aims to track and collect data at the individual, family, and community levels across China, reflecting changes in various aspects of Chinese society, economy, education, etc. The survey comprises four Questionnaires: the Family Member, the Family Economic, the Individual Self-Report, and the Parent Proxy for Children. These four modules generate distinct datasets based on the content and results of the questionnaires. For this study, we merged the four datasets to create a comprehensive database.
4.2. Variable Construction
This study investigates the impact of social media usage frequency on the air travel behavior of Chinese residents, establishing a direct link among the relevant variables. To evaluate this relationship, we analyzed responses to the question, “Have you ever taken a plane?” with possible answers being “No” and “Yes”. Missing values were interpreted as either a lack of data or a “No”. Notably, in the 2022 CFPS database, the proportion of missing and uncertain values for related variables exceeds 90%, making both imputation and deletion as the sub-optimal methods. To address concerns regarding endogeneity and enhance the reliability of the sample, we re-coded the values: “No” was coded as 1, “Yes” was coded as 2, and all other responses were assigned a value of 0, thereby ensuring the representativeness of the sample.
The selection of independent variable focused on the frequency of social media usage. A directly observable variable was employed for this purpose: “In the past year, how frequently have you shared Moments on WeChat?” Responses were categorized into 7 levels, ranging from “Never” to “Almost daily,” and assigned values from 1 to 7, respectively. Missing and uncertain values were assigned a score of 0.
Based on the theoretical framework and the content of the 2022 CFPS questionnaire, we identified and re-coded several control variables for analysis, which include: Gender (Male=1, Female=0), Age (divided into five groups based on age brackets: 30, 40, 50, and 60 years, with values assigned from 1 to 5), Health (ranging from “Unhealthy” to “Very Healthy” across five levels, coded from 1 to 5, with other coded as 0), Marriage (Other=0, Married=1, Unmarried=2), Hukou (Other=0, Rural=1, Non-rural=2), Education (Other=0, Below Associate Degree=1, Associate Degree or Above=2), and Income (Other=0, Annual Income < 50,000 ¥ = 1, Annual Income ≥ 50,000 ¥ = 2).
We used 4 mediator variables to indirectly measure the frequency of social media usage while simultaneously assessing media dependence and media trust, which evaluate the significance of the Internet across various aspects of respondents’ lives, including work, rest, learning, and daily life. Responses were divided into 5 levels, ranging from “Not important at all” to “Very important”, and values were assigned from 1 to 5, missing values and other responses were still re-coded as 0. A detailed description of the variables mentioned above is provided in Table 1.
4.3. Model Selection
To better understand the impact of social media usage frequency on the air travel behavior of Chinese residents, we adopt a comprehensive approach that involves several methods: (1) In the descriptive statistics section, we provide a brief overview of the characteristics of the sample data. (2) In the benchmark regression section, we utilize Ordinary Least Squares (OLS) and Ordered Logistic (Ologit) regression to analyze the effects of various variables on air travel behavior. (3) In the endogeneity analysis section, to address potential omitted variable bias, we employ instrumental variables to revalidate the model. (4) In the robustness check section, we apply the control variable method and placebo test to assess the robustness of the model. (5) For potential mediating channels, we further implement a non-parametric percentile Bootstrap method for testing, while using the KHB method to decompose the mediation effects; (6) In the part of heterogeneity analysis, we use the interaction term regression and marginal effect analysis to clarify the differential effects of WeChat on Plane across different groups.
4.4. Specification of the Benchmark Regression Model
In the benchmark regression section, we conduct a comparative analysis using both OLS regression and Ologit regression. It is important to note that, theoretically, for the dependent variable “Have you ever taken a plane” which has two possible outcomes (Yes/No), a Binary Logistic regression model should be applied. Due to the peculiarities of the 2022 CFPS data, such as the massive missing and uncertain values, performing imputation or deletion may compromise the interpretability of the results. Hence we choose to re-code the values as 0, 1, 2, effectively transforming it into an ordered variable, and construct an Ologit model to address this issue. The model is presented as equation (1).
The Planed represents the cumulative probability of individuals choosing air travel. β₀ is the constant term of the model, while β₁ and βⱼ represent the coefficients of the independent and control variables, including the sum of the control variables, and εd denotes the random error term. After the Benchmark regression, we further apply a Variance Inflation Factor (VIF) test to assess multicollinearity among them.
4.5. Endogeneity Issues
This study identifies two primary sources of endogeneity. First, there exists a bidirectional causal relationship between the dependent and independent variables. For instance, individuals who travel by air may increase their social media usage to either recommend or complain it. Second, there may be omitted variables that could influence the results. To address these concerns, we employ an Instrumental Variable method. The selection of instrumental variables must satisfy the criteria of relevance and exogeneity, meaning that they should be highly correlated with the frequency of social media usage but not directly affect air travel. Based on the 2022 CFPS, we select “Do you play online games daily” and “Do you use the computer to surf the Internet” as instrument variables, labeled as Game and Computer, other values of responses, and “No”, “Yes” were assigned as 0, 1, 2. Then we apply Two-Stage Least Squares (2SLS) estimation, which consists of two stages.
First Stage: We utilize Game and Computer as instrumental variables to predict WeChat. The equations are specified as (2), where WeChatd represents the independent variable, indicating the frequency with WeChat usage of the residents. Gamed and Computerd indicate whether the respondent plays online games or uses a computer. The model also includes a sum of control variables, with θd and λd representing the error terms in the regression model. After the first stage, we will conduct an Over-identification test like the Hansen J test. If the test results show p > 0.05, it indicates that there is insufficient evidence to reject the null hypothesis of the validity of the instrumental variables, suggesting that the selected instrumental variables are appropriate.
Second Stage: In this stage, we replace the original independent variable with the predicted values obtained from the first stage and continue to employ the Ologit regression to estimate the impact of social media usage on air travel behavior, as in equation (3). This approach enables us to control for endogeneity between the frequency of social media usage and air travel behavior, thereby yielding a more accurate estimate of the effect between them.
4.6. Robustness Checks
To ensure the robustness of our research findings, we conduct multiple tests, including the control variable method and the placebo test. These methods effectively assess the reliability of our model and verify whether the effect of the independent variable on the dependent variable remains consistent. The control variable method is utilized to ensure that other potential factors do not confound the relationship between the independent and dependent variables. By sequentially introducing control variables such as Age, Health, into the models and comparing the results of different model specifications, we assess the stability of our findings.
The placebo test involves constructing a dummy variable that is expected to have no effect, allowing us to determine whether it produces significant results. If the regression coefficient is not significant, this indicates the robustness of the model, as demonstrated in equation (4). In this equation, Planei represents the i-th sample of the dependent variable, Xij represents the j-th control variable for the i-th individual, γj represents the coefficient of the control variable, and Placeboi is the dummy variable unrelated to air travel, with εi representing the random error term. In this way, the placebo test serves as a diagnostic tool for assessing the reliability of a regression model.
4.7. Mediation Effects Analysis
As the frequency of social media usage may influence air travel behavior through mediating variables, it is essential to investigate potential mediation effects. Building on previous discussions, we specify models (5) and (6) to explore these effects. In model (5), Mediatori,j represents one of the four mediating variables: Work, Rest, Study, and Life. γj denotes the regression coefficient of the independent variable on each mediating variable, while εi,j represents the random error term. In model (6), j' indicates the impact coefficient of each mediating variable on air travel behavior, and εi denotes the random error term.
To further investigate the mediating effect of social media usage frequency on air travel behavior, we employ the non-parametric percentile Bootstrap method, which accurately estimates the standard errors of mediation paths. We set the Bootstrap resampling iterations to 500 and the confidence level to 95%. If the 95% confidence interval for the mediation effect does not include 0, it indicates a significant mediating effect. Additionally, we use the KHB method to estimate the mediation effects, which encompass the direct effect, indirect effect, and contribution rates of each mediating variable. The direct effect refers to the impact of the independent variable on the dependent variable without mediation, while the indirect effect pertains to the impact through the mediate variables. The total effect is the sum of both effects, and the contribution rate is the ratio of the indirect effect to the total effect.
4.8. Heterogeneity Analysis
To further investigate the intricate non-linear relationship between the frequency of social media usage and air travel behavior, we conduct a heterogeneity analysis. Given the substantial sample size in this study, along with the presence of ordered multinomial variables and their joint effects, grouping regression methods may not fully and effectively leverage the data, particularly when subgroup sample sizes are small. Therefore we prefer to use interaction term regression to analyze heterogeneity, as presented in Equation (7).
Based on the Ologit regression model discussed earlier, we incorporate interaction terms between the independent variable Video and the control variables to capture the interaction effects WeChati*Xik . The coefficient of the interaction term enables us to more comprehensively examine how the control variables influence the relationship between WeChat and Plane, determine whether the control variables moderate this relationship, and analyze their marginal effects. This analysis enhances the predictive power of the model and provides targeted references for policy recommendations and further research.
5. Empirical Analysis Results
5.1. Descriptive Statistics
Table 2 presents the descriptive statistics for the variables utilized in this study. Based on the sample data, a total of 54,002 observations were included. The mean of the dependent variable, Plane, is 0.0749, with a standard deviation of 0.2783, indicating that the majority of respondents have not traveled by plane. The mean of the independent variable, WeChat, is 1.7959, with a standard deviation of 1.8305, suggesting that most respondents exhibit a low frequency of sharing the Moments in WeChat, and there is considerable variation in the overall data.
As for the control variables, the mean for gender, Gen, is 0.5002, suggesting a balanced distribution between males and females. The mean Age is 2.9387, meaning that the largest proportion of respondents falls within the 30-40 age group. The mean for Mar is 1.5110, implying most respondents are married. The mean for Hukou is 1.1313, meaning a higher proportion of respondents with urban household registration. The mean Health score is 3.0941, meaning the majority of respondents are in good health. The means for Edu and Inc are 0.2329 and 0.1212, suggesting that most respondents possess an education level higher than an Associate Degree, while their annual income is below 50,000 ¥.
For the mediate variables, the means are approximately close to 3, indicating that most respondents perceive the importance of the internet in areas such as Work, Rest, Study, and Life to be at a moderate level, albeit with some variation. And the relatively high standard deviations of these variables suggest considerable differences among the respondents.
Overall, these results illustrate the broad distribution of individuals in the sample concerning social media usage, air travel behavior, and other variables, established the foundation for the subsequent analysis.
5.2. Benchmark Regression
The results of the benchmark regression are presented in Table 3. Column (1) displays the OLS results for the dependent variable on the independent variable. Column (2) incorporates control variables based on the model in Column (1). Columns (3) and Column (4) demonstrate similar analyses using the Ologit regression model. Given that both the independent and dependent variables are ordinal categorical variables, the Ologit regression model is theoretically more suitable and compelling.
As observed, the effect of the variable WeChat in the OLS model becomes insignificant after the inclusion of control variables. However, it strengthens the Ologit model. The coefficient for WeChat shifts from negative to positive in the Ologit model, indicating a significant positive correlation between the frequency of sharing Moments in WeChat and air travel when accounting for multiple variables.
Furthermore, the significance of the variable Gen is weak in both models, which means gender has a minimal impact on air travel. The variables Age and Hukou show significant results in the OLS model but perform poorly in the Ologit model, meaning that older respondents and those with rural household registration are less likely to choose air travel. Whereas the results for Health, Mar, Edu, and Inc are significant in both models, indicating that respondents who are in good health, unmarried, highly educated, and have relatively lower incomes are more likely to opt for air travel. The result of Inc appears to be against the general economic patterns, we will analyze it in the section of further discussion.
Additionally, based on the OLS regression, we conducted a Variance Inflation Factor (VIF) test for each variable. This method is primarily employed to detect multicollinearity among the variables. A VIF value of less than 10, or a value of 1/VIF that is close to 1, indicates a low correlation between the independent variables, suggesting only a mild multicollinearity problem. Conversely, a high VIF value signals a greater degree of multicollinearity, which may necessitate the removal of highly collinear variables. The results of the VIF test are presented in Table 4. As shown, the VIF values for all variables are relatively low, with Age exhibiting a somewhat higher VIF, yet still within a reasonable range. This suggests that there is rarely a significant multicollinearity issue in the regression model, and the model demonstrates strong explanatory power, providing a solid foundation for subsequent analysis.
5.3. Endogeneity Analysis
To address the endogeneity issues in the model, including potential bidirectional causality and omitted variable bias, we employed the instrumental variables Game and Computer, then processed with the 2SLS method for the following reasons: Both Game and Computer are correlated with the core independent variable, WeChat, as they likely influence the frequency of social media usage; however, they do not have a direct relationship with the dependent variable, air travel behavior. These characteristics render both variables suitable as instrumental variables according to the established criteria: correlated with the endogenous variable but do not exert a direct causal effect on the dependent variable. Meanwhile, in order to further test the exogenous characteristics of the instrumental variables, we will further use the Over-identification test methods such as the Hansen J test to verify the rationality of the selection of instrumental variables.
Table 5 presents the results of the instrumental variable method. Column (1) presents the OLS results for the Game, and Computer on WeChat, indicating a significant positive correlation. Column (2) shows the results of the first stage adjusted by 2SLS. It is evident that the regression results of WeChat on Plane are still significantly positive correlation, with a p-value of the Hansen J test at 0.2834. This indicates that we cannot reject the hypothesis regarding the instrumental variables, suggesting that the selection of instrumental variables Game and Computer is reasonable. Column (3) is based on the second-stage results of the Ologit. After incorporating the instrumental variable into the independent variable, the WeChat_hat also demonstrated a significant positive correlation. These analyses provide a more accurate causal inference while addressing issues of regulatory endogeneity, thereby offering stronger support for the establishment of hypothesis H1.
5.4. Robustness Check
To further validate the robustness of the model, we first employed the control variable method to verify the results, which are shown in Table 6. It is evident that by continuously incorporating control variables into the existing Ologit model, WeChat exerts a significant influence, and the value of the Pseudo R² for the model is notably improved. This enhancement indicates that the model demonstrates a strong fit and robust performance. Notably, the coefficient for WeChat shifted from negative to positive with the addition of control variables. This suggests that when WeChat is considered in isolation, it may have some negative effects on the Plane, but after accounting for other factors, a significant positive association emerges between them. Overall, it can be concluded that the H1 hypothesis is largely supported, although additional testing methods are required for further validation.
We also conducted a placebo test by introducing a randomly generated dummy variable that is unrelated to both the independent and dependent variables into the regression model. The significance of this dummy variable’s effect was used to assess the robustness of the model, with the results presented in Table 7. As shown, the coefficient of the dummy variable, Placebo_var, is not statistically significant, and the regression coefficients of the other variables remain unaffected by the inclusion of the dummy variable. This further indicates that the existing model passes the placebo test, demonstrating strong robustness.
5.5. Mediation Effect Analysis
The mediation effect pathway model typically involves two steps: first, analyzing the effect of the independent variable on the mediator variable; and second, assessing the impact of the mediator variable on the dependent variable. Since all variables are ordered categorical variables, we employed Ologit regression for the mediation effect analysis. We examined the influence of WeChat on 4 mediator variables: Work, Rest, Study, and Life, then we evaluated their effects on the Plane. Additionally, we utilized the bootstrap method for resampling, setting the number of resamples to 500 and the confidence interval to 95%. If the confidence interval for the mediation effect does not include 0, the effect is considered significant. The results are presented in Table 8. As shown, the confidence intervals for Work and Life include 0, while Rest and Study demonstrate significant mediation effects.
We further employed the KHB method to measure the mediation effect. This method is commonly used to estimate mediation effects and to decompose the influence of independent variables on dependent variables. The results are presented in Table 9. It is evident that the contribution rates of Work and Life are relatively low, at 58.26% and 54.67%, respectively, indicating that they have a limited influence on the relationship between WeChat and Plane. In contrast, Rest and Study exhibit higher contribution rates of 83.92% and 88.97%, with Study showing the highest total effect value of 0.8152. This demonstrates significant mediation effects that align with the Bootstrap results.
5.6. Heterogeneity Analysis
Based on the results from the benchmark regression, this section conducts a heterogeneity analysis utilizing several control variables that demonstrated significant results, including Health, Mar, Edu, and Inc. We then introduced interaction terms for these variables and performed an additional regression, comparing results based on both OLS and Ologit methods. The Ologit results were used as the primary reference, and the outcomes are shown in Table 10. The findings indicate that the interaction terms WeChat_Health and WeChat_Edu exhibit significant effects, revealing a negative relationship between WeChat, Health, and Edu. Conversely, the interaction terms WeChat_Mar and WeChat_Inc suggest that the combined effects of marital status and income on the frequency of social media usage have a weaker impact on the dependent variable.
We further analyzed the marginal effects of WeChat_Health and WeChat_Edu, with the results presented in Figure 3 and Figure 4. As shown in Figure 3, individuals with a higher education level (Edu=2) are less impacted by the frequency of WeChat usage on their air travel decisions compared to those with a lower education level (Edu=1). This indicates that residents with an Associate Degree or below are more influenced by social media usage when deciding whether to travel by air. Figure 4 illustrates that the marginal effect of health status on the frequency of sharing moments on WeChat exhibits a negative trend. Specifically, individuals in better health (Health=5) are less affected by their social media usage frequency when considering air travel, whereas those in poor health (Health=1) tend to use social media more frequently when faced with the decision to travel by air. Consequently, the hypothesis H2 could be supported by the findings above.
6. Further Discussion
An informative observation from the benchmark regression is that while the variable Inc shows statistically significant results, its coefficient is negative, which suggests that as the frequency of social media usage increases, lower-income groups are more likely to choose air travel. This finding seems to contradict conventional economic principles, prompting us to conduct further research to explore the underlying reasons.
In this context, previous studies have analyzed market data and indicated that the demand for low-cost air travel is positively correlated with regional income and the number of online air travel advertisements.[30] Additionally, in the literature review section, we have highlighted that the relationship between air transport and economic development tends to be bidirectional in underdeveloped regions, whereas, in developed economies, the relationship is typically unidirectional, flowing from air transport to economic growth.[31]
One possible explanation is that lower-income groups have not yet “disenchanted” with air travel and other relatively non-traditional modes of transportation, continuing to associate air travel with “high income” and “high consumption”. Thus, as their economic situation improves, along with an increase in social media usage, they are exposed to more air travel advertisements and information on low-cost flights, which in turn influences their intentions to travel by air and, eventually, their actual travel behavior. From the perspective of social and consumer psychology, this can, to some extent, be viewed as a form of overcompensation.
For higher-income groups, the opportunity and demand for air travel are already at a high level. Consequently, their willingness to travel by air and the impact of social media usage on their behavior are relatively less pronounced. The presence of such dynamics may further affect the correlations between variables such as Inc, ultimately influencing the model’s output. Thus further causal inference and a more comprehensive analysis that includes additional control variables are necessary to fully understand it. These insights offer guidance for future research.
7. Conclusions
7.1. Findings
This study rigorously examines the influence of social media usage frequency on individual air travel behavior. The findings reveal a significant positive correlation between the frequency of social media usage and individual air travel behavior. Specifically, as individuals increase their engagement with social media, their intention to engage in air travel intensifies, particularly among those exhibiting higher levels of media dependency and trust, where the effect is markedly pronounced.
According to the TPB framework, individual behavior is shaped by three fundamental constructs: attitude toward the behavior, subjective norm, and perceived behavioral control. By integrating social media usage into this framework, the study clarifies that social media not only directly influences individuals’ attitudes and normative beliefs regarding air travel but also enhances their perceived behavioral control through the cultivation of media dependency. Furthermore, the information resources and eWOM disseminated via social media significantly impact individuals’ travel decisions. Notably, in the face of uncertainty, information sourced from social media exerts a direct influence on individuals’ travel intentions. While the dissemination of negative events on social media may yield short-term detrimental effects, the overarching trend indicates that the positive impacts of social media, such as fostering information transparency and facilitating low-cost promotions, exert a more substantial influence on individuals’ intentions to travel by air.
Furthermore, this study explores the diverse characteristics of individuals, including educational attainment and health status. The results indicate that the impact of social media usage frequency on air travel behavior varies significantly across different demographic segments. Individuals with higher levels of education and those in better health exhibit a greater reliance on and trust in information obtained from social media, which in turn influences their travel decisions. Conversely, the relationship between social media usage frequency and air travel behavior is less pronounced among individuals with lower educational attainment and poorer health. This finding provides valuable insights for the industry, highlighting the necessity for tailored digital marketing strategies that address the needs of various demographic groups. Specifically, when disseminating information related to air travel, it is essential to adapt the approach based on the individual’s background.
7.2. Policy Recommendation
Drawing on the findings presented above, this study proposes several strategic recommendations for the industry and its stakeholders, in order to answer the question we have proposed since the beginning.
(1)Strengthen Brand Presence on Social Media: Given the significant impact of social media on individual air travel decisions, airlines should prioritize the development of a strong brand identity and the promotion of a positive image across various social media platforms. Particularly during crisis events, such as pandemics, airlines must utilize these platforms to share timely and accurate information regarding flight safety. This proactive communication helps to alleviate public anxieties, thereby enhancing consumer trust and confidence in air travel.
(2)Refine Social Media Information Dissemination Strategies: Airlines should develop and implement a more nuanced and targeted information dissemination strategy on social media to address the diverse needs of various audience segments. Specifically, for individuals with lower educational attainment or those in poorer health, communication should be simplified, using clear and accessible language. This approach would not only enhance their trust in air travel but also alleviate the fear associated with information asymmetry.
(3) Leverage eWOM for Strategic Marketing: Airlines can harness the power of eWOM to enhance their marketing efforts. By encouraging passengers to share their travel experiences and engage with the brand on social media, airlines can effectively influence potential customers' purchasing decisions. This strategy not only increases brand visibility but also capitalizes on the expanding domestic air travel market, ultimately fostering customer loyalty and improving market penetration.
While the empirical conclusions of this study are robust, it is essential to acknowledge certain limitations. First, the analysis primarily relies on data from the 2022 CFPS, which is characterized by a relatively narrow sample scope. The timing and methodology of data collection may also introduce potential biases. Second, despite the inclusion of various control variables, the study still faces concerns regarding endogeneity, particularly concerning the causal relationship between the frequency of social media usage and individual behavioral outcomes. Future research could address these issues by employing longitudinal data analysis and experimental designs. Additionally, it would be valuable to examine the differential effects of various social media platforms on individual behavior. Finally, while this study focuses on air travel, future investigations could explore the impact of social media on other modes of transportation, such as high-speed rail and automobiles, and consider cross-national comparisons to investigate cultural variations in the influence of social media on travel behavior.
Funding
This research was funded by the Zhujiang College, South China Agricultural University 2024 Annual University-Level Research Project (Grant No. 2024ZJKYC015).
Institutional Review Board Statement
Not applicable.
Data Availability Statement
Not applicable.
Conflicts of Interest
There is no conflict of interest.
Note
All the data used in this paper are from the Chinese family tracking survey funded by Peking University and conducted by the China Social Science Survey Center of Peking University.
References
- Civil Aviation Administration of China. (2021-09-03). Northwest Civil Aviation launches “Warmth and Smooth Journey for First-time Passengers” activity. Available online: http://www.caac.gov.cn/local/XBGLJ/XB_XWZX/XB_DQYW/202109/t20210903_209114.html (accessed on 1 February 2025).
- Civil Aviation Administration of China. (2024-05,-31). 2023 civil aviation industry development statistical bulletin. Available online: http://www.caac.gov.cn/XXGK/XXGK/TJSJ/202405/P020240531700964611105.pdf (accessed on 1 February 2025).
- Lee, K.; Hwang, H.; Oh, Y. (2014). Study on the Current status and prospects of China aviation industry, 22, 51-64. [CrossRef]
- Lerrthaitrakul, W.; Panjakajornsak, V. (2014). The Impact of Electronic Word-of-Mouth Factors on Consumers’ Buying Decision-Making Processes in the Low Cost Carriers: A Conceptual Framework. International journal trade, economics and finance, 5, 142-146. [CrossRef]
- Cheunkamon, E.; Jomnonkwao, S.; Ratanavaraha, V. (2020). Determinant Factors Influencing Thai Tourists’ Intentions to Use Social Media for Travel Planning. Sustainability, 12(18), 7252. [CrossRef]
- Gulati, S. (2024). Unveiling the tourist’s social media cycle: use of social media during travel decision-making. Global Knowledge, Memory and Communication, 73, 4/5, 575-595. [CrossRef]
- Van Der Meer, T.; Kroon, A.; Vliegenthart, R. (2021). Do News Media Kill? How a Biased News Reality can Overshadow Real Societal Risks, The Case of Aviation and Road Traffic Accidents. Social Forces, 101, 506-540. [CrossRef]
- Shahzad, S.; Zeib, F.; Tariq, N. (2024). Social Media Adoption in Tourism Promotion and Tourist Intention: A Diffusion of Invovation Approach. Journal of Media and Entrepreneurial Studies, 4, 118-128. [CrossRef]
- Pushparaj, P.; Kushwaha, B.(2024). Social Media Influencer Marketing: A Systematic Literature Review Using TCM and ADO Framework. International Journal of Consumer Studies, 48(6), e13098. [CrossRef]
- Wibisono, R.; Lale, J. (2024). The Impact of Social Media on Tourist Destination Choices: A Quantitative Analysis. OPSearch: American Journal of Open Research, 3(6), 141-146. [CrossRef]
- Zhang, F.; Graham, D. (2020). Air transport and economic growth: a review of the impact mechanism and causal relationships. Transport Reviews, 40, 506-528. [CrossRef]
- Dingil, A.; Esztergár-Kiss, D. (2021). The Influence of Education Level on Urban Travel Decision-making. Periodica Polytechnica Transportation Engineering, 50(1), 49-57. [CrossRef]
- Li, H.; Strauss, J.; Lu, L. (2019). The impact of high-speed rail on civil aviation in China. Transport Policy. [CrossRef]
- Fleischer, A.; Tchetchik, A.; Toledo, T. (2012). The Impact of Fear of Flying on Travelers’ Flight Choice. Journal of Travel Research, 51, 653-663. [CrossRef]
- Pan, C.; Chi, R. (2020). Analysis and Research on Operation of Tik Tok Accounts of Chinese Airlines. 2020 IEEE 2nd International Conference on Civil Aviation Safety and Information Technology (ICCASIT), 936-939. [CrossRef]
- Li, K.; Li, J.; Li, Y. (2024). The effects of social media usage on vicarious traumatization and the mediation role of recommendation systems usage and peer communication in China after the aircraft flight accident. European Journal of Psychotraumatology, 15(1), 2337509.
- Buday, A.; Badánik, B. (2023). Social media as a tool for airline service quality assessment, 14, 29-34. Práce a štúdie. [CrossRef]
- Pronello, C.; Gaborieau, J. (2018). Engaging in Pro-Environment Travel Behaviour Research from a Psycho-Social Perspective: A Review of Behavioural Variables and Theories. Sustainability, 10(7), 2412. [CrossRef]
- Yzer, M. (2017). Theory of Reasoned Action and Theory of Planned Behavior, 1-7. [CrossRef]
- Ajzen, I. (1991). The theory of planned behavior. Organizational Behavior and Human Decision Processes, 50, 179-211. [CrossRef]
- Ajzen, I. (1991). The theory of planned behavior. Organizational Behavior and Human Decision Processes, 50, 179-211. [CrossRef]
- Kepatuhan, T.; Diabetes, P.; Tipe, M.; Menjalani, Y.; Diet, T.; Dari, D.; Kasus, P.; Elfa, O.; Izza, L.; Studi, P.; Keperawatan, M.; Keperawatan, F.; Airlangga, U.; Izza, E.; Pihak, B.; Itu, M.; Segenap, T.; Tulus, H.; Kepada, D.; Yuswanto, J.; Luang, W.; Yang, M.; Memberikan, S.; Motivasi, F.; Menyelesaikan, D.; Pendidikan, P.; Penguji, S.; Memberikan, Y.; Masukan, A. (2008). THEORY OF PLANNED BEHAVIOUR, 223-228. [CrossRef]
- Ball-Rokeach, S.; Defleur, M. (1976). A Dependency Model of Mass-Media Effects. Communication Research, 3, 21-3. [CrossRef]
- Van Aelst, P.; Tóth, F.; Castro, L.; Štětka, V.; Vreese, C.; Aalberg, T.; Cardenal, A.; Corbu, N.; Esser, F.; Hopmann, D.; Koc-Michalska, K.; Matthes, J.; Schemer, C.; Sheafer, T.; Splendore, S.; Stanyer, J.; Stępińska, A.; Strömbäck, J.; Theocharis, Y. (2021). Does a Crisis Change News Habits? A Comparative Study of the Effects of COVID-19 on News Media Use in 17 European Countries. Digital Journalism, 9, 1208-1238. [CrossRef]
- Bangerter, A.; Krings, F.; Mouton, A.; Gilles, I.; Green, E.; Clemence, A. (2012). Longitudinal Investigation of Public Trust in Institutions Relative to the 2009 H1N1 Pandemic in Switzerland, PLOS ONE 7(11): e49806. [CrossRef]
- Li, P.; Zhong, F. (2022). A Study on the Correlation Between Media Usage Frequency and Audiences’ Risk Perception, Emotion and Behavior. Frontiers in Psychology, 12, 822300. [CrossRef]
- Awori, K.; Clark, E.; Gonçalves, A.; Effner, T.; Yang, J.; Oakley, I.; Nunes, N. (2012). Flytalk: social media to meet the needs of air travelers. CHI’ 12 Extended Abstracts on Human Factors in Computing Systems, 1769-1774. [CrossRef]
- Van Der Meer, T.; Kroon, A.; Verhoeven, P.; Jonkman, J. (2018). Mediatization and the Disproportionate Attention to Negative News. Journalism Studies, 20, 783-803. [CrossRef]
- Borucka, A.; Romele, M. (2024). Examining Airplane Accidents through the Lens of Fatalities in Such Catastrophes. 2024 12th International Conference on Traffic and Logistic Engineering (ICTLE), 84-87. [CrossRef]
- Watt, D. (1999). AIR TRAVEL DEMAND BASED ON FARE, REGIONAL INCOME DISTANCE, AND NEWSPAPER ADVERTISING, 41, 166-186. [CrossRef]
- Zhang, F.; Graham, D. (2020). Air transport and economic growth: a review of the impact mechanism and causal relationships. Transport Reviews, 40, 506-528. [CrossRef]
Figure 1.
TPB Analytical Framework.
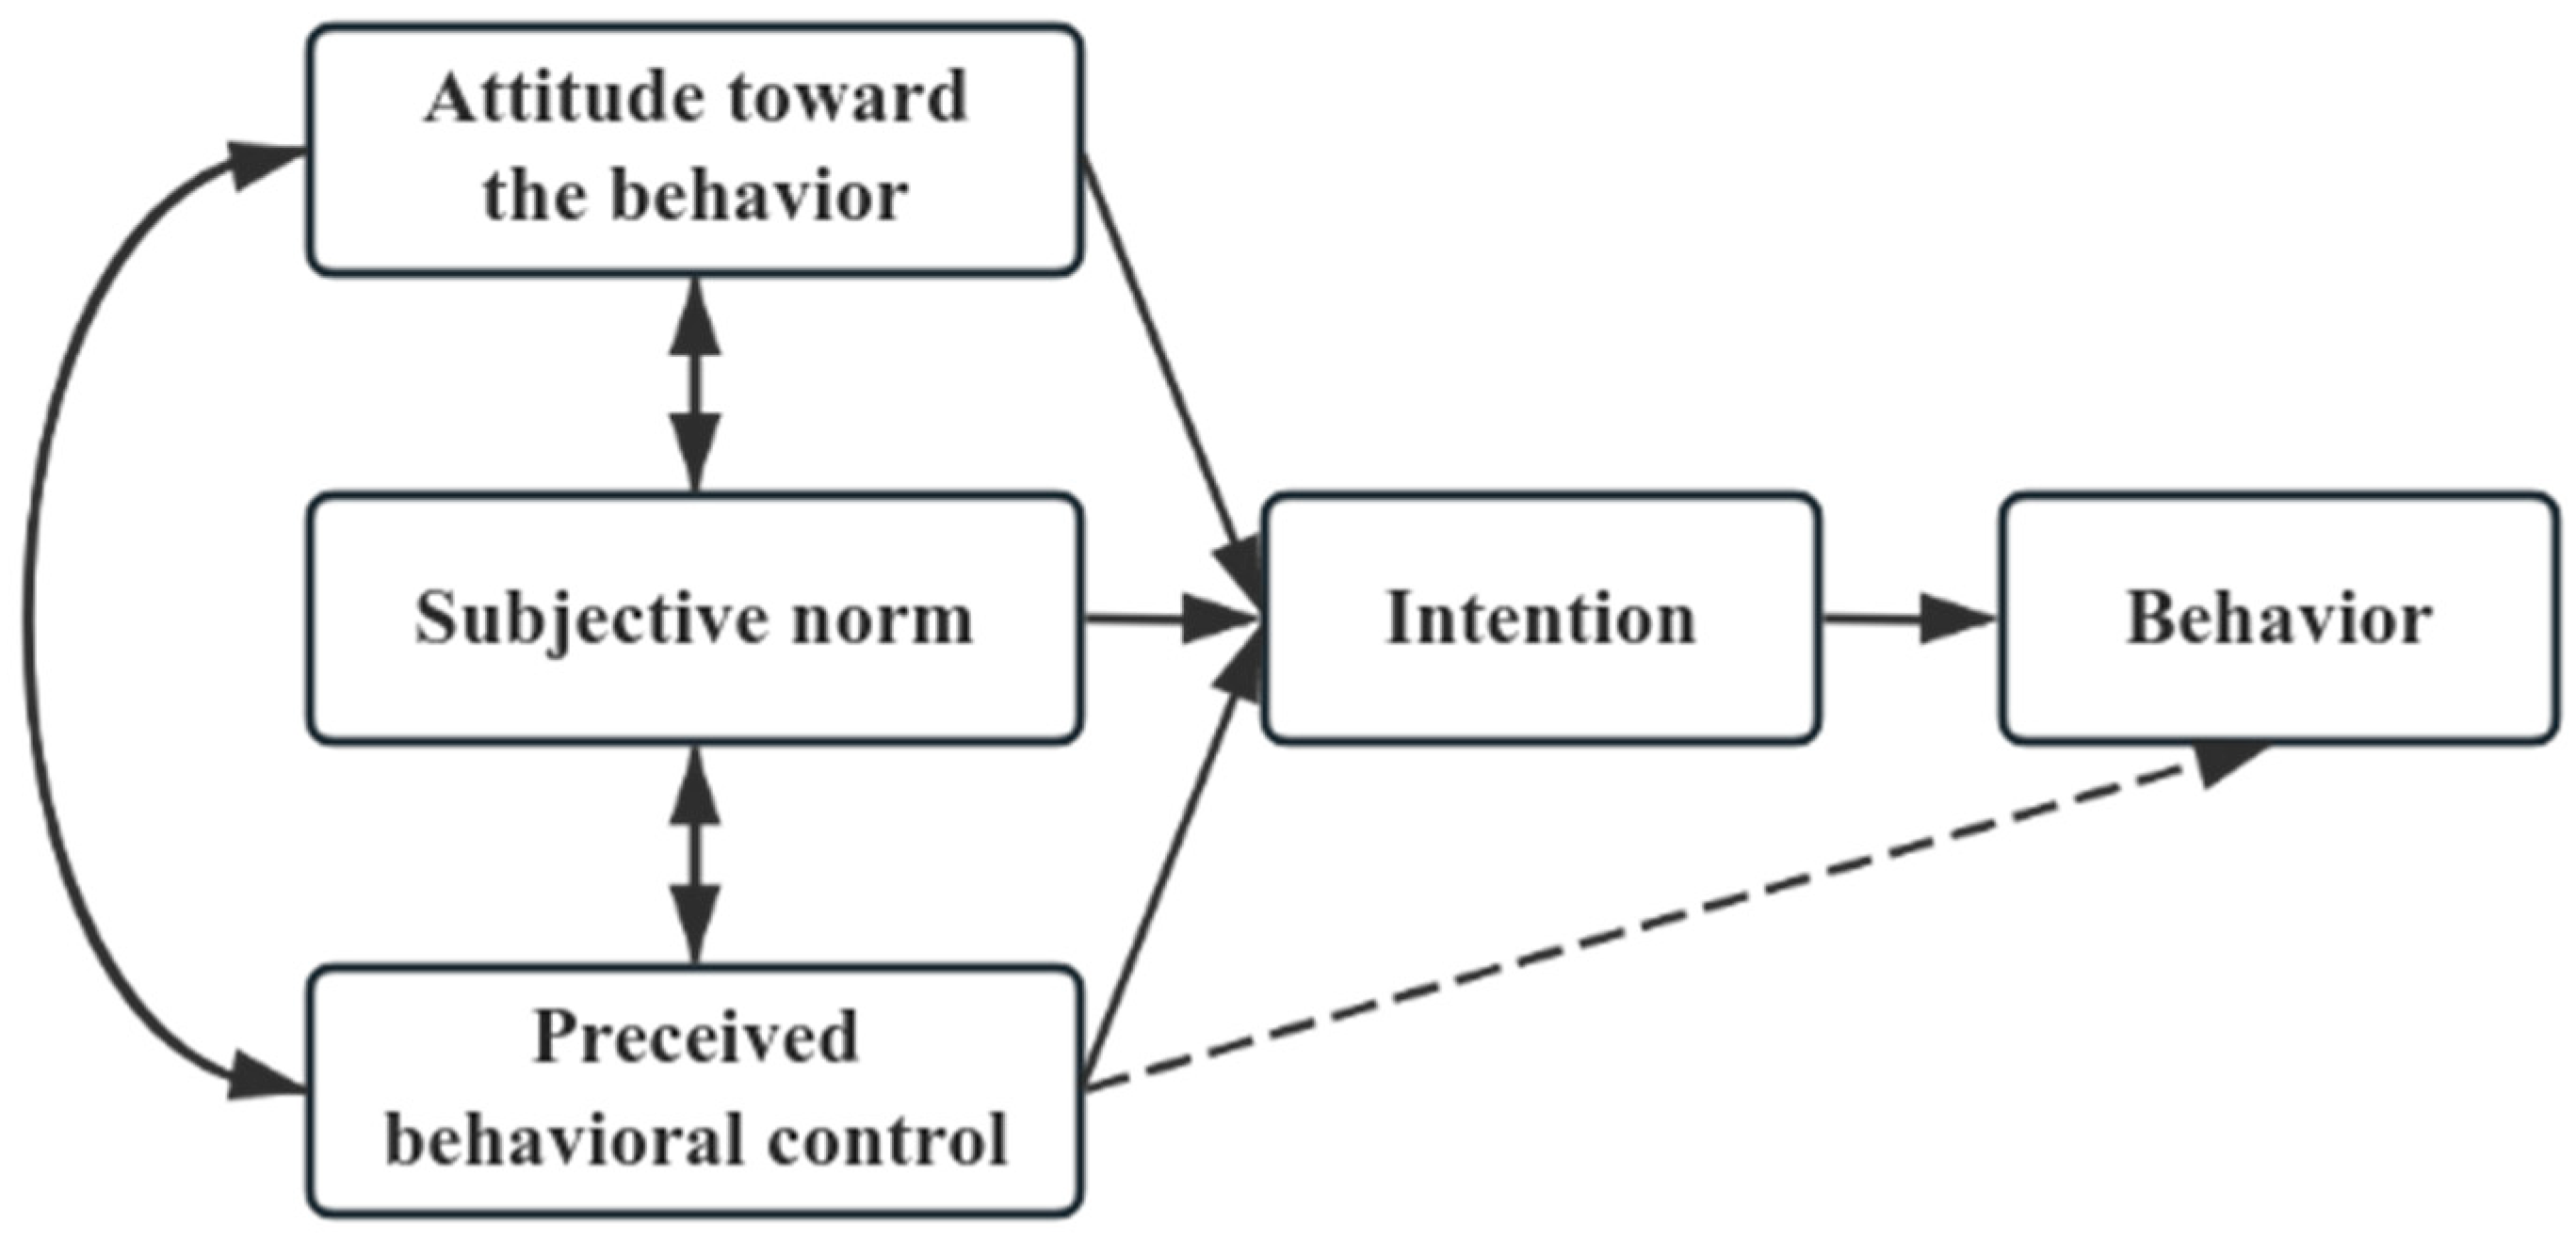
Figure 2.
TPB-MSD Analytical Framework.
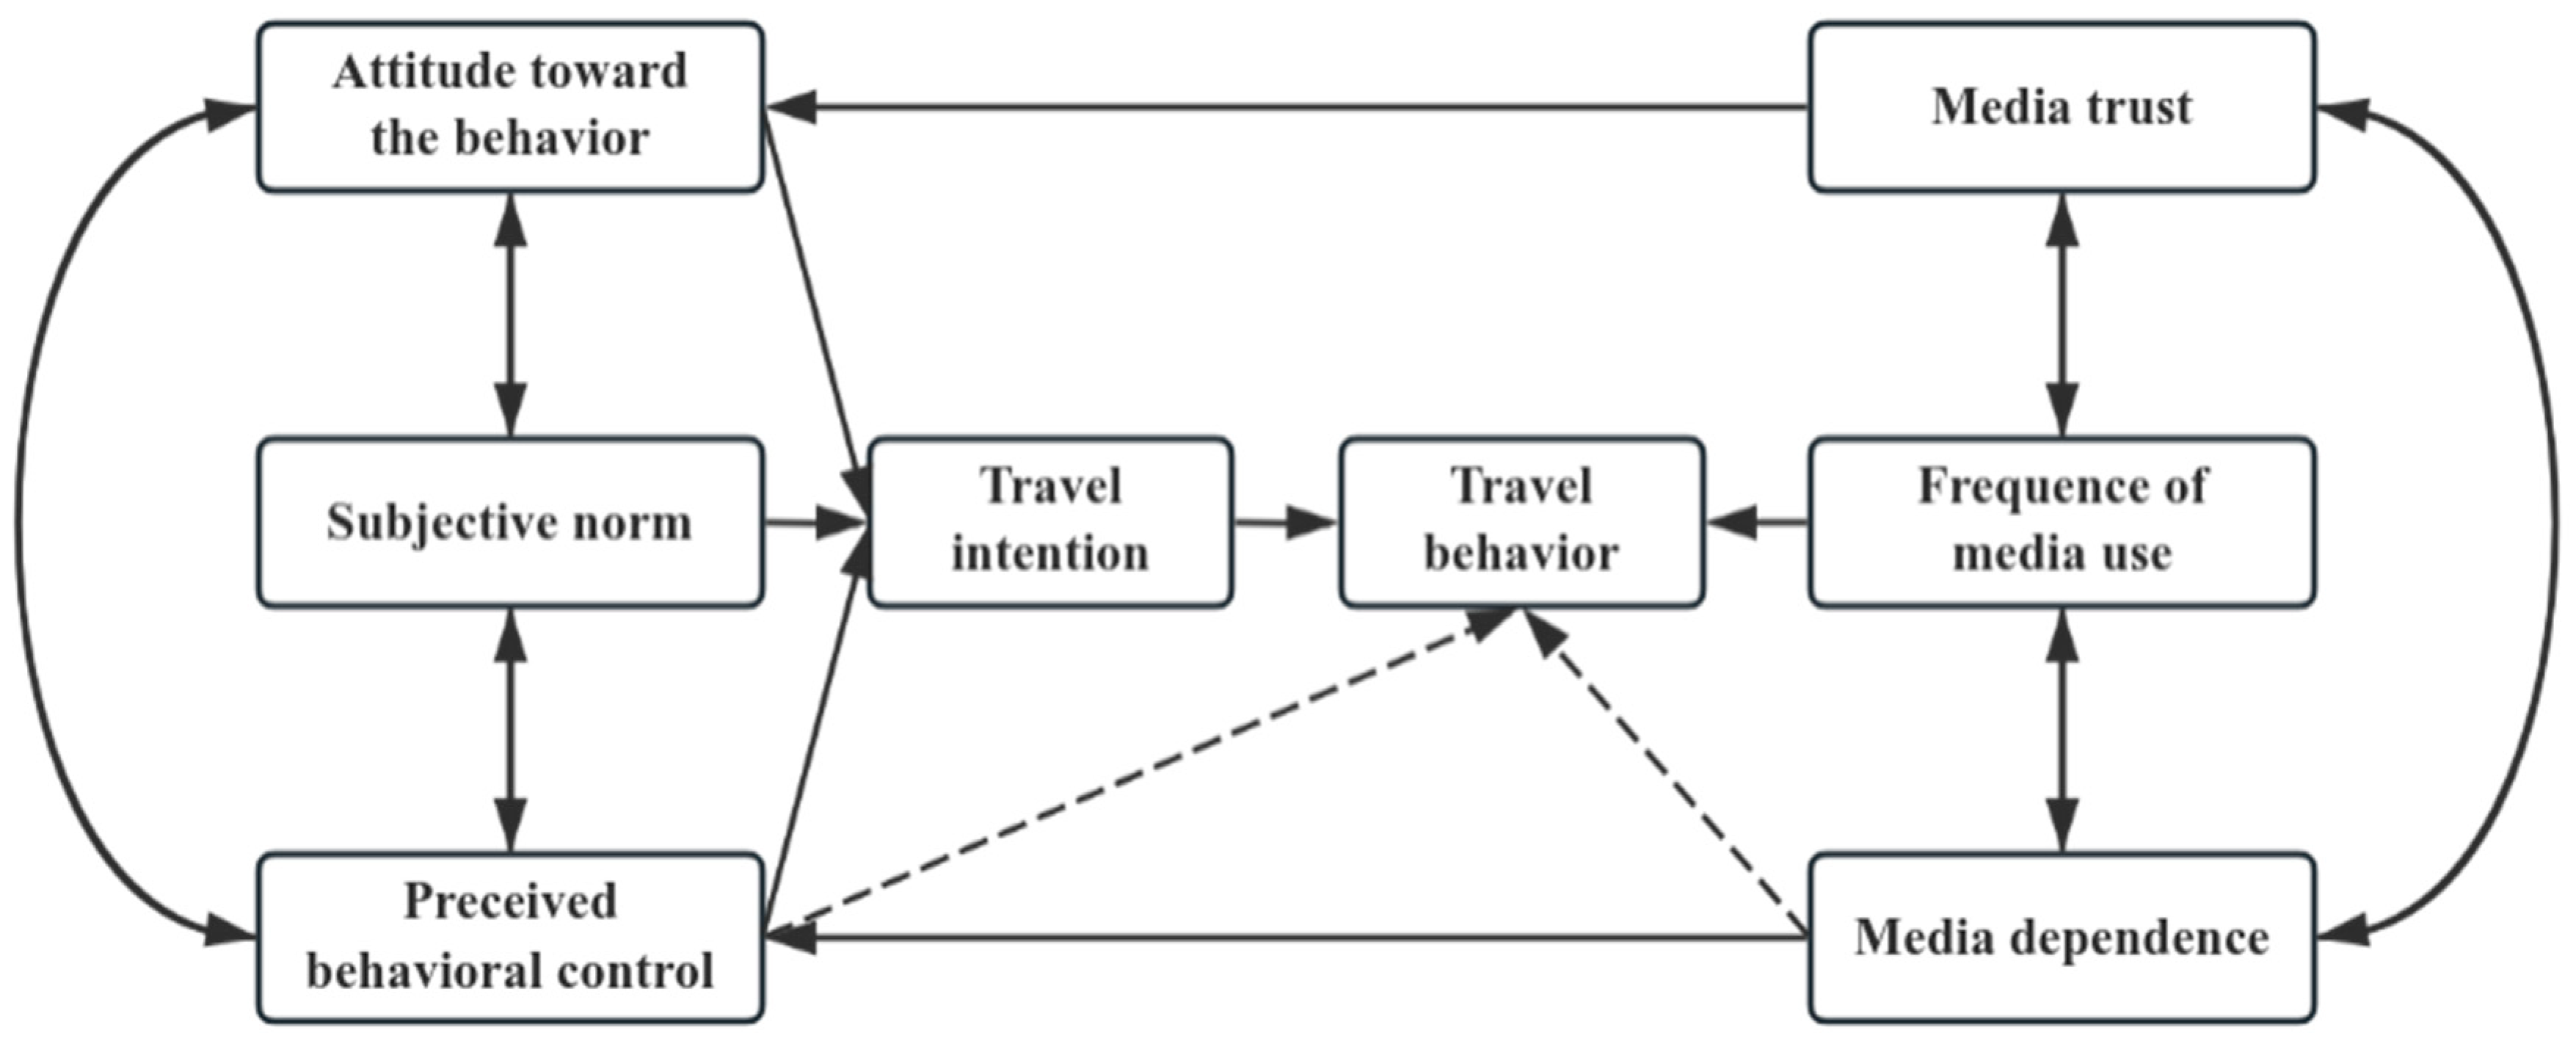
Figure 3.
The Marginal Effects Results of Edu.
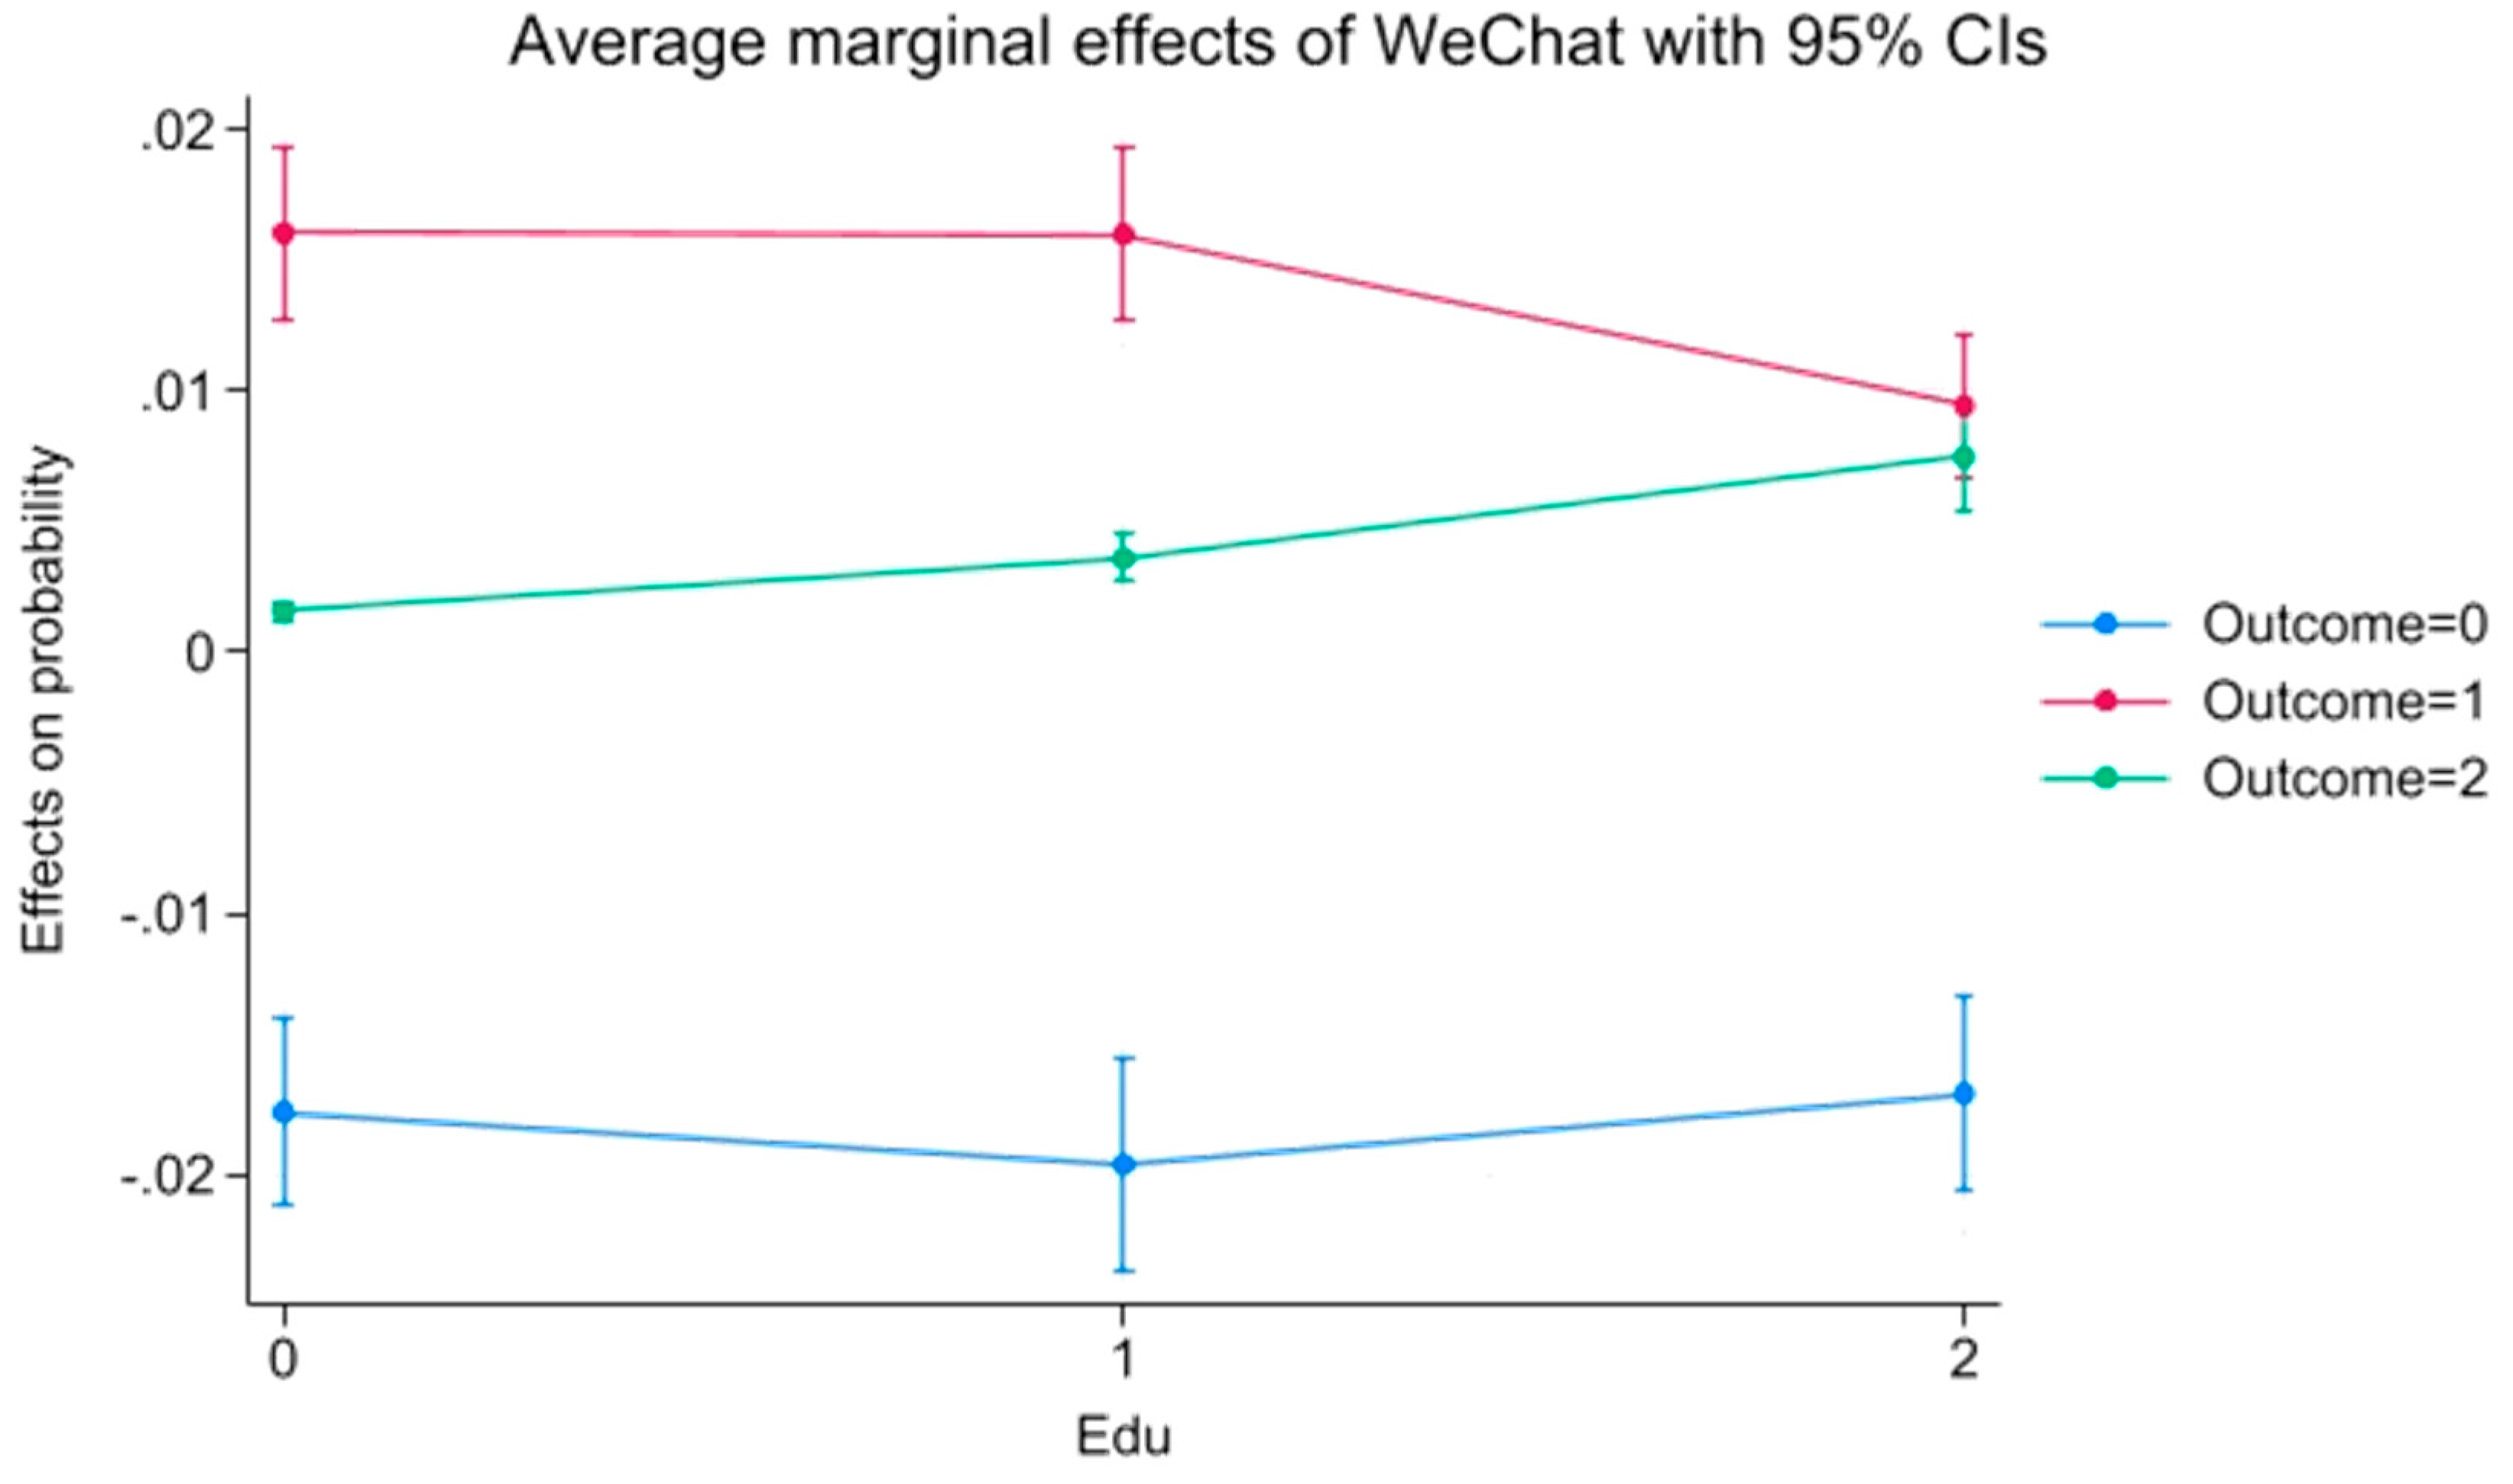
Figure 4.
The Marginal Effects Results of Health.
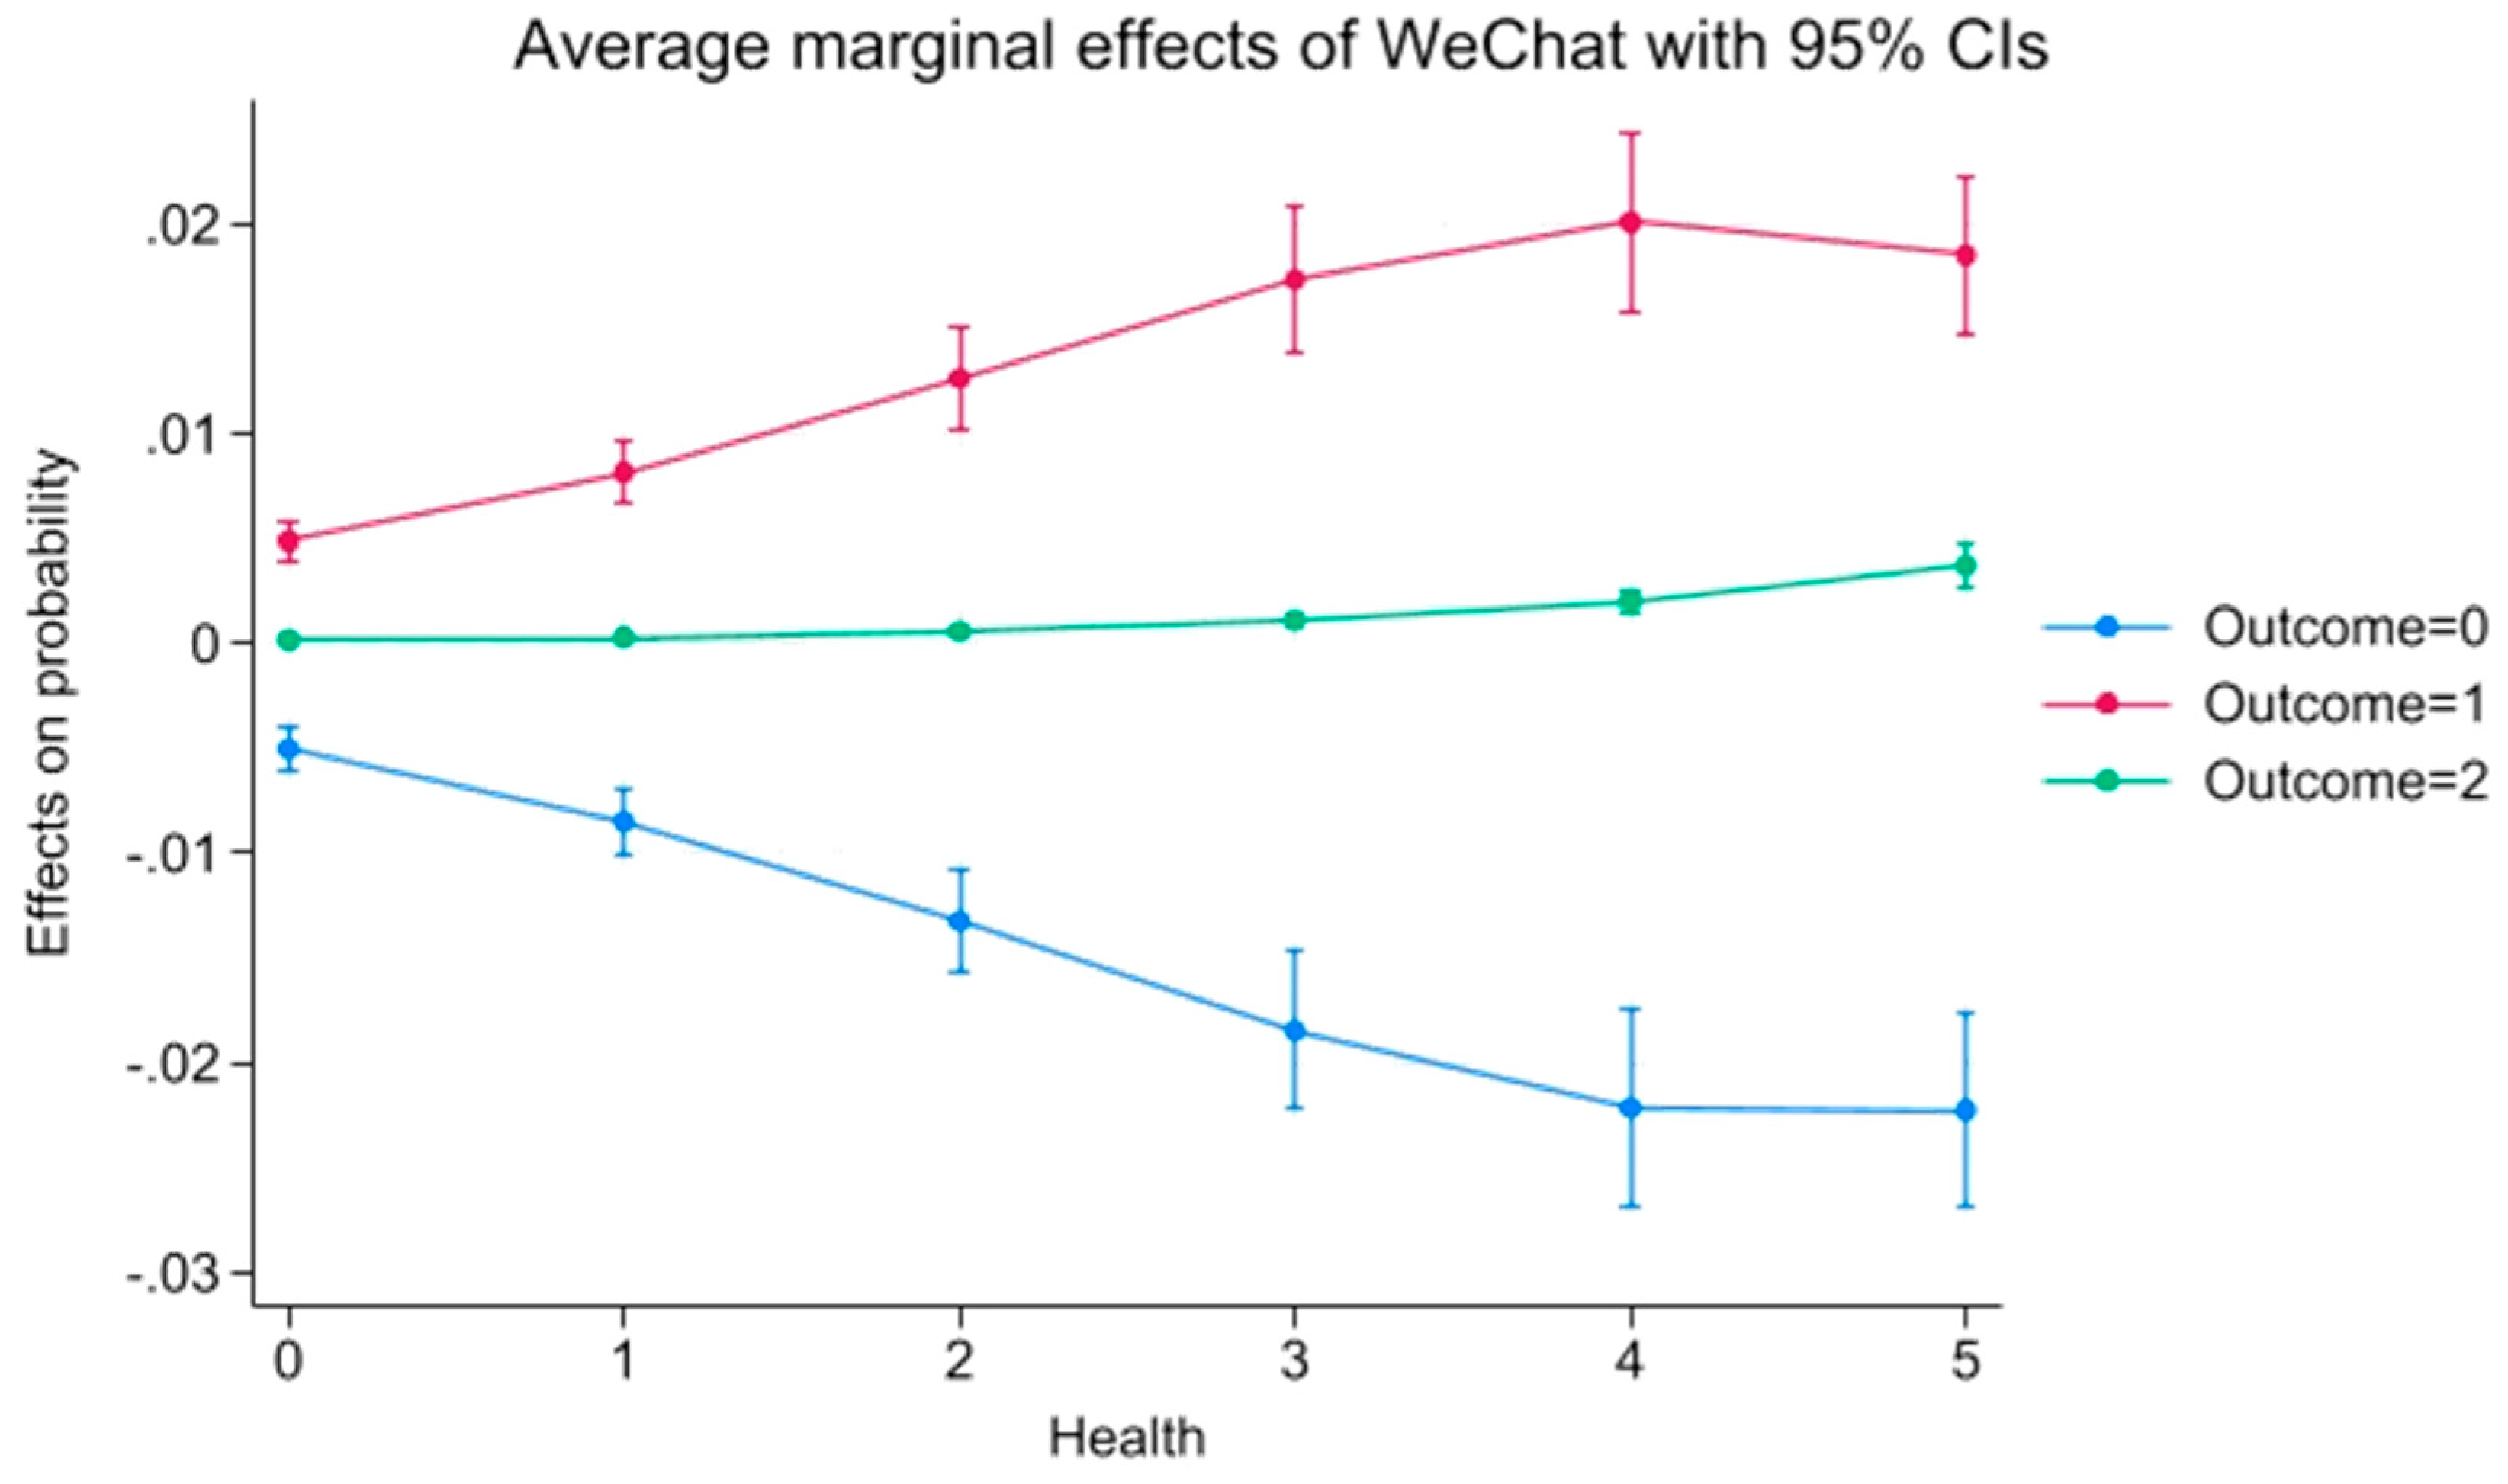

Table 1.
Variable Definitions.
| Variable Name | Variable Label | Value Assignments |
| Dependent Variable | ||
| Have you ever taken a plane | Plane | Other = 0, No = 1, Yes = 2 |
| Independent Variable | ||
| The frequency of you share the Moments in WeChat | Other=0, Never=1, Once in a few months=2, Once in a month=3, 2 to 3 times in a month=4, 1 to 2 times in a week=5, 3 to 4 times in a week=6, Almost daily=7 | |
| Control Variables | ||
| Gender | Gen | Female=0,Male=1 |
| Age | Age | 30 or below = 1,31 to 40 = 2,41 to 50 = 3,51 to 60 = 4,61 or above = 5 |
| Health level | Health | Other = 0,Unhealthy = 1,Fairly unhealthy = 2, General = 3,Quite healthy = 4,Very healthy = 5 |
| Marriage | Mar | Other = 0,Unmarried = 1,Married = 2 |
| Household registration | Hukou | Other = 0,Rural =1,Non-rural = 2 |
| Education level | Edu | Other = 0, Below Associate Degree = 1, Associate degree or above =2 |
| Income level | Inc | Other = 0, Below 50,000 ¥ per year = 1, 50,000 ¥ or above per year = 2 |
| Mediator Variables | ||
| The importance of the Internet towards work | Work | Other = 0, Not important at all = 1, Not important = 2, General = 3, Quite important = 4, Very important = 5 |
| The importance of the Internet towards rest | Rest | Same as above |
| The importance of the Internet towards study | Study | Same as above |
| The importance of the Internet towards life | Life | Same as above |
Table 2.
Descriptive Statistics of Variables.
| Variable | Obs | Mean | Std. dev. | Min | Max |
| Plane | 54,002 | 0.0749232 | 0.2783145 | 0 | 2 |
| 54,002 | 1.795933 | 1.830502 | 0 | 7 | |
| Age | 54,002 | 2.938706 | 1.539004 | 1 | 5 |
| Health | 54,002 | 3.094071 | 1.291772 | 0 | 5 |
| Gen | 54,002 | 0.5002037 | 0.5000046 | 0 | 1 |
| Mar | 54,002 | 1.511018 | 0.7811356 | 0 | 2 |
| Hukou | 54,002 | 1.131328 | 0.5944849 | 0 | 2 |
| Edu | 54,002 | 0.2329543 | 0.5149824 | 0 | 2 |
| Inc | 54,002 | 0.1212177 | 0.4182046 | 0 | 2 |
| Work | 54,002 | 2.621088 | 1.984928 | 0 | 5 |
| Rest | 54,002 | 2.567164 | 1.866912 | 0 | 5 |
| Study | 54,002 | 2.768046 | 1.982332 | 0 | 5 |
| Life | 54,002 | 2.647458 | 1.990544 | 0 | 5 |
Table 3.
Benchmark Regression Results.
| (1) | (2) | (3) | (4) | |
| OLS | OLS | Ologit | Ologit | |
| -0.011*** | -0.004*** | -0.197*** | 0.308*** | |
| (-17.367) | (-5.921) | (-17.840) | (12.113) | |
| Age | -0.014*** | -20.404 | ||
| (-15.740) | (-0.024) | |||
| Health | 0.016*** | 0.301*** | ||
| (19.338) | (8.991) | |||
| Gen | -0.004* | 0.055 | ||
| (-1.835) | (0.840) | |||
| Mar | -0.108*** | -5.433*** | ||
| (-61.385) | (-7.380) | |||
| Hukou | -0.153*** | -23.140 | ||
| (-79.921) | (-0.031) | |||
| Edu | -0.012*** | 0.978*** | ||
| (-6.001) | (12.930) | |||
| Inc | -0.030*** | -3.524*** | ||
| (-12.911) | (-4.097) | |||
| _cons | 0.095*** | 0.417*** | ||
| (56.942) | (92.119) | |||
| /: | ||||
| cut1 | 2.270*** | -19.765 | ||
| (102.302) | (-0.023) | |||
| cut2 | 5.202*** | -14.996 | ||
| (75.351) | (-0.018) | |||
| N | 54002 | 54002 | 54002 | 54002 |
Standard errors are in parentheses,*** p<.01, ** p<.05, * p<.1.
Table 4.
VIF Test Results.
| Variable | Mar | Age | Hukou | Edu | Health | Inc | Gen | Mean VIF | |
| VIF | 2.070 | 2.020 | 1.430 | 1.310 | 1.230 | 1.200 | 1.040 | 1.020 | 1.420 |
| 1/VIF | 0.483 | 0.495 | 0.701 | 0.761 | 0.812 | 0.834 | 0.957 | 0.982 |
Table 5.
Instrumental Variables Regression Results.
| (1) | (2) | (3) | |
| OLS | 2SLS | Ologit | |
| Game | 0.127*** | ||
| (9.446) | |||
| Computer | 0.747*** | ||
| (51.283) | |||
| Gen | -0.225*** | 0.014*** | 0.016 |
| (-16.444) | (5.586) | (0.248) | |
| Age | -0.402*** | 0.052*** | -20.543 |
| (-62.697) | (23.797) | (-0.024) | |
| Health | 0.077*** | 0.002** | 0.295*** |
| (13.443) | (2.205) | (8.807) | |
| Mar | 0.418*** | -0.173*** | -4.969*** |
| (33.457) | (-50.796) | (-6.767) | |
| Hukou | 0.471*** | -0.234*** | -22.511 |
| (34.289) | (-60.328) | (-0.030) | |
| Edu | 0.033** | -0.036*** | 1.076*** |
| (2.228) | (-12.234) | (14.564) | |
| Inc | 0.167*** | -0.054*** | -3.380*** |
| (10.200) | (-21.065) | (-3.931) | |
| 0.114*** | |||
| (31.210) | |||
| WeChat_hat | 2.686*** | ||
| (12.113) | |||
| Hansen J statistic | 1.151 | ||
| (0.2834) | |||
| _cons | 0.835*** | 0.243*** | |
| (24.970) | (30.965) | ||
| /: | |||
| cut1 | -19.112 | ||
| (-0.022) | |||
| cut2 | -14.343 | ||
| (-0.017) | |||
| N | 54002 | 54002 | 54002 |
Standard errors are in parentheses,*** p<.01, ** p<.05, * p<.1.
Table 6.
Ologit Regression Results with Control Variables.
| (1) | (2) | (3) | (4) | (5) | (6) | (7) | |
| Plane | Plane | Plane | Plane | Plane | Plane | Plane | |
| -0.499*** | -0.477*** | -0.484*** | -0.181*** | 0.403*** | 0.304*** | 0.308*** | |
| (-35.281) | (-33.354) | (-33.638) | (-12.874) | (16.678) | (12.014) | (12.113) | |
| Age | -21.603 | -21.326 | -21.323 | -20.495 | -20.594 | -20.396 | -20.404 |
| (-0.026) | (-0.027) | (-0.027) | (-0.026) | (-0.025) | (-0.024) | (-0.024) | |
| Health | 0.551*** | 0.560*** | 0.374*** | 0.278*** | 0.302*** | 0.301*** | |
| (25.193) | (25.426) | (14.852) | (8.458) | (9.034) | (8.991) | ||
| Gen | -0.199*** | -0.082* | 0.083 | 0.055 | 0.055 | ||
| (-4.817) | (-1.697) | (1.283) | (0.847) | (0.840) | |||
| Mar | -7.793*** | -5.288*** | -5.539*** | -5.433*** | |||
| (-11.010) | (-7.194) | (-7.559) | (-7.380) | ||||
| Hukou | -22.857 | -23.214 | -23.140 | ||||
| (-0.029) | (-0.030) | (-0.031) | |||||
| Edu | 0.961*** | 0.978*** | |||||
| (12.757) | (12.930) | ||||||
| Inc | -3.524*** | ||||||
| (-4.097) | |||||||
| /: | |||||||
| cut1 | -21.514 | -19.038 | -19.117 | -19.472 | -20.276 | -19.753 | -19.765 |
| (-0.026) | (-0.024) | (-0.024) | (-0.025) | (-0.024) | (-0.023) | (-0.023) | |
| cut2 | -18.216 | -15.649 | -15.724 | -15.764 | -15.644 | -14.998 | -14.996 |
| (-0.022) | (-0.020) | (-0.020) | (-0.020) | (-0.019) | (-0.018) | (-0.018) | |
| Pseudo R2 | 0.4301 | 0.4546 | 0.4554 | 0.6223 | 0.7725 | 0.7785 | 0.7792 |
| N | 54002 | 54002 | 54002 | 54002 | 54002 | 54002 | 54002 |
Standard errors are in parentheses,*** p<.01, ** p<.05, * p<.1.
Table 7.
Placebo Test Results.
| (1) | (2) | (3) | (4) | |
| OLS | OLS | Ologit | Ologit | |
| -0.011*** | -0.004*** | -0.197*** | 0.307*** | |
| (-17.362) | (-5.918) | (-17.837) | (12.107) | |
| Placebo_var | 0.004 | 0.004 | 0.077 | 0.099 |
| (1.073) | (1.144) | (1.314) | (0.885) | |
| Age | -0.014*** | -20.404 | ||
| (-15.738) | (-0.024) | |||
| Health | 0.016*** | 0.301*** | ||
| (19.341) | (8.992) | |||
| Gen | -0.004* | 0.056 | ||
| (-1.838) | (0.850) | |||
| Mar | -0.108*** | -5.433*** | ||
| (-61.388) | (-7.378) | |||
| Hukou | -0.153*** | -23.141 | ||
| (-79.915) | (-0.030) | |||
| Edu | -0.012*** | 0.977*** | ||
| (-5.999) | (12.919) | |||
| Inc | -0.030*** | -3.529*** | ||
| (-12.906) | (-4.104) | |||
| _cons | 0.093*** | 0.415*** | ||
| (34.871) | (86.052) | |||
| /: | ||||
| cut1 | 2.309*** | -19.716 | ||
| (62.499) | (-0.023) | |||
| cut2 | 5.240*** | -14.946 | ||
| (69.782) | (-0.017) | |||
| N | 54002 | 54002 | 54002 | 54002 |
Standard errors are in parentheses,*** p<.01, ** p<.05, * p<.1.
Table 8.
Bootstrap Test results.
| Variable | Observed coefficient | Bootstrap std.err. | z | P | LLCI | ULCI |
| Work | 0.006 | 0.0402095 | 0.16 | 0.876 | -0.0725403 | 0.085078 |
| Rest | 0.282*** | 0.0416124 | 6.77 | 0.000 | 0.2001814 | 0.3632992 |
| Study | 0.483*** | 0.0364003 | 13.28 | 0.000 | 0.4120698 | 0.5547565 |
| Life | -0.072* | 0.0398943 | -1.8 | 0.073 | -0.1498356 | 0.0065472 |
Standard errors are in parentheses,*** p<.01, ** p<.05, * p<.1.
Table 9.
The KHB Decomposition Results.
| Variable | Direct Effect | Indirect Effect | Total Effect | Contribution |
| Work | 0.0122863 | 0.21375043 | 0.22603673 | 58.26% |
| Rest | 0.292681 | 0.30792209 | 0.60060309 | 83.92% |
| Study | 0.4887029 | 0.32644762 | 0.81515052 | 88.97% |
| Life | -0.0631805 | 0.20057489 | 0.13739439 | 54.67% |
Table 10.
Interaction Term Regression Results.
| (1) | (2) | |
| OLS | Ologit | |
| 0.011*** | 0.549*** | |
| (4.730) | (9.187) | |
| Health | 0.029*** | 0.655*** |
| (27.804) | (24.504) | |
| Mar | -0.181*** | -4.681*** |
| (-99.336) | (-7.503) | |
| Edu | 0.030*** | 0.947*** |
| (8.600) | (16.100) | |
| Inc | -0.040*** | -6.149*** |
| (-9.074) | (-3.027) | |
| WeChat_Health | -0.005*** | -0.038*** |
| (-9.992) | (-2.650) | |
| WeChat_Mar | 0.000 | -15.055 |
| (0.178) | (-0.027) | |
| WeChat_Edu | -0.025*** | -0.688*** |
| (-20.646) | (-22.358) | |
| WeChat_Inc | 0.004** | 0.670 |
| (2.517) | (1.402) | |
| _cons | 0.277*** | |
| (56.725) | ||
| /: | ||
| cut1 | 3.195*** | |
| (28.691) | ||
| cut2 | 6.822*** | |
| (50.758) | ||
| N | 54002 | 54002 |
Standard errors are in parentheses,*** p<.01, ** p<.05, * p<.1.
Disclaimer/Publisher’s Note: The statements, opinions and data contained in all publications are solely those of the individual author(s) and contributor(s) and not of MDPI and/or the editor(s). MDPI and/or the editor(s) disclaim responsibility for any injury to people or property resulting from any ideas, methods, instructions or products referred to in the content. |
© 2025 by the authors. Licensee MDPI, Basel, Switzerland. This article is an open access article distributed under the terms and conditions of the Creative Commons Attribution (CC BY) license (http://creativecommons.org/licenses/by/4.0/).
Copyright: This open access article is published under a Creative Commons CC BY 4.0 license, which permit the free download, distribution, and reuse, provided that the author and preprint are cited in any reuse.


