
Submitted:
09 March 2025
Posted:
10 March 2025
You are already at the latest version
Abstract
Asymmetric deformation has been observed along the Altyn Tagh Fault (ATF), the northern boundary of the Tibetan Plateau. Several mechanisms have been proposed to explain this asymmetry, including contrasts in crustal strength, lower crust/upper mantle rheology, deep fault dislocation shifts, and gently dipping fault planes; however, their relative contributions remain debated. This study utilizes time series Interferometric Synthetic Aperture Radar (InSAR) technique to investigate spatially variable asymmetries across the western section of the ATF (83°E - 89°E). By analyzing Sentinel-1 data, we generated high-resolution (2 km) three-dimensional (3D) crustal velocity field for the northwestern Tibetan Plateau (~82°E–92°E; 33°N–40°N). Our results confirm greater deformation within the Tibetan Plateau compared to the Tarim Basin along the westernmost section of the ATF (83°E - 85.5°E). We propose that this asymmetry is primarily driven by a splay fault system within the zone between the ATF in the north and the Jinsha Suture (JSS)-Kunlun Fault (KFL) in the south. This shear zone acts as a transition zone, accommodating east-west extension in central Tibetan Plateau while transferring sinistral shear to the KLF in the east. The concentrated strain observed along the ATF and JSS-KLF further supports a block-style eastward extrusion model for Tibetan crustal deformation rather than a continuously deforming viscous model.
Keywords:
Altyn Tagh Fault
; InSAR
; Asymmetric Deformation
; Tibetan Plateau
; Sentinel-1
; Slip Rate
; Active Fault
; Interseismic Deformation
1. Introduction
Deformation across strike-slip faults is generally expected to be symmetric, as described by the screw dislocation model [1]. This elastic dislocation theory has been widely applied to invert slip rates of continental strike-slip faults using modern geodetic observations. However, asymmetric deformation has been observed along several major strike-slip faults during interseismic strain accumulation, including the North Anatolian Fault [2], the Sumatra Fault [3], the San Andreas Fault [4,5], the Xianshuihe Fault [6], and the Altyn Tagh Fault (ATF) [7,8,9,10,11,12,13,14,15]. Asymmetry is also often evident in coseismic displacements, as exemplified by the 1906 San Francisco earthquake [16], the 1997 Mw7.6 Manyi (Tibet) earthquake [17], the 2001 Mw7.8 Koloxili (Tibet) earthquake [18], and the 2013 Mw7.7 Balochistan earthquake [19,20], and can sometimes be observed within fault damage zones [21]. The degree of asymmetry can vary significantly among faults, with a magnitude ratio of deformation across the fault ranging from 1.2 to 30 [2]. This phenomenon provides valuable insights into key parameters, such as fault geometry at depth, the lithospheric layered structure, and the rheological properties of the terranes bounding the fault. Understanding the physical mechanisms driving asymmetric deformation across strike-slip faults is crucial for accurately assessing earthquake potential and developing robust geodynamic models of crustal deformation.
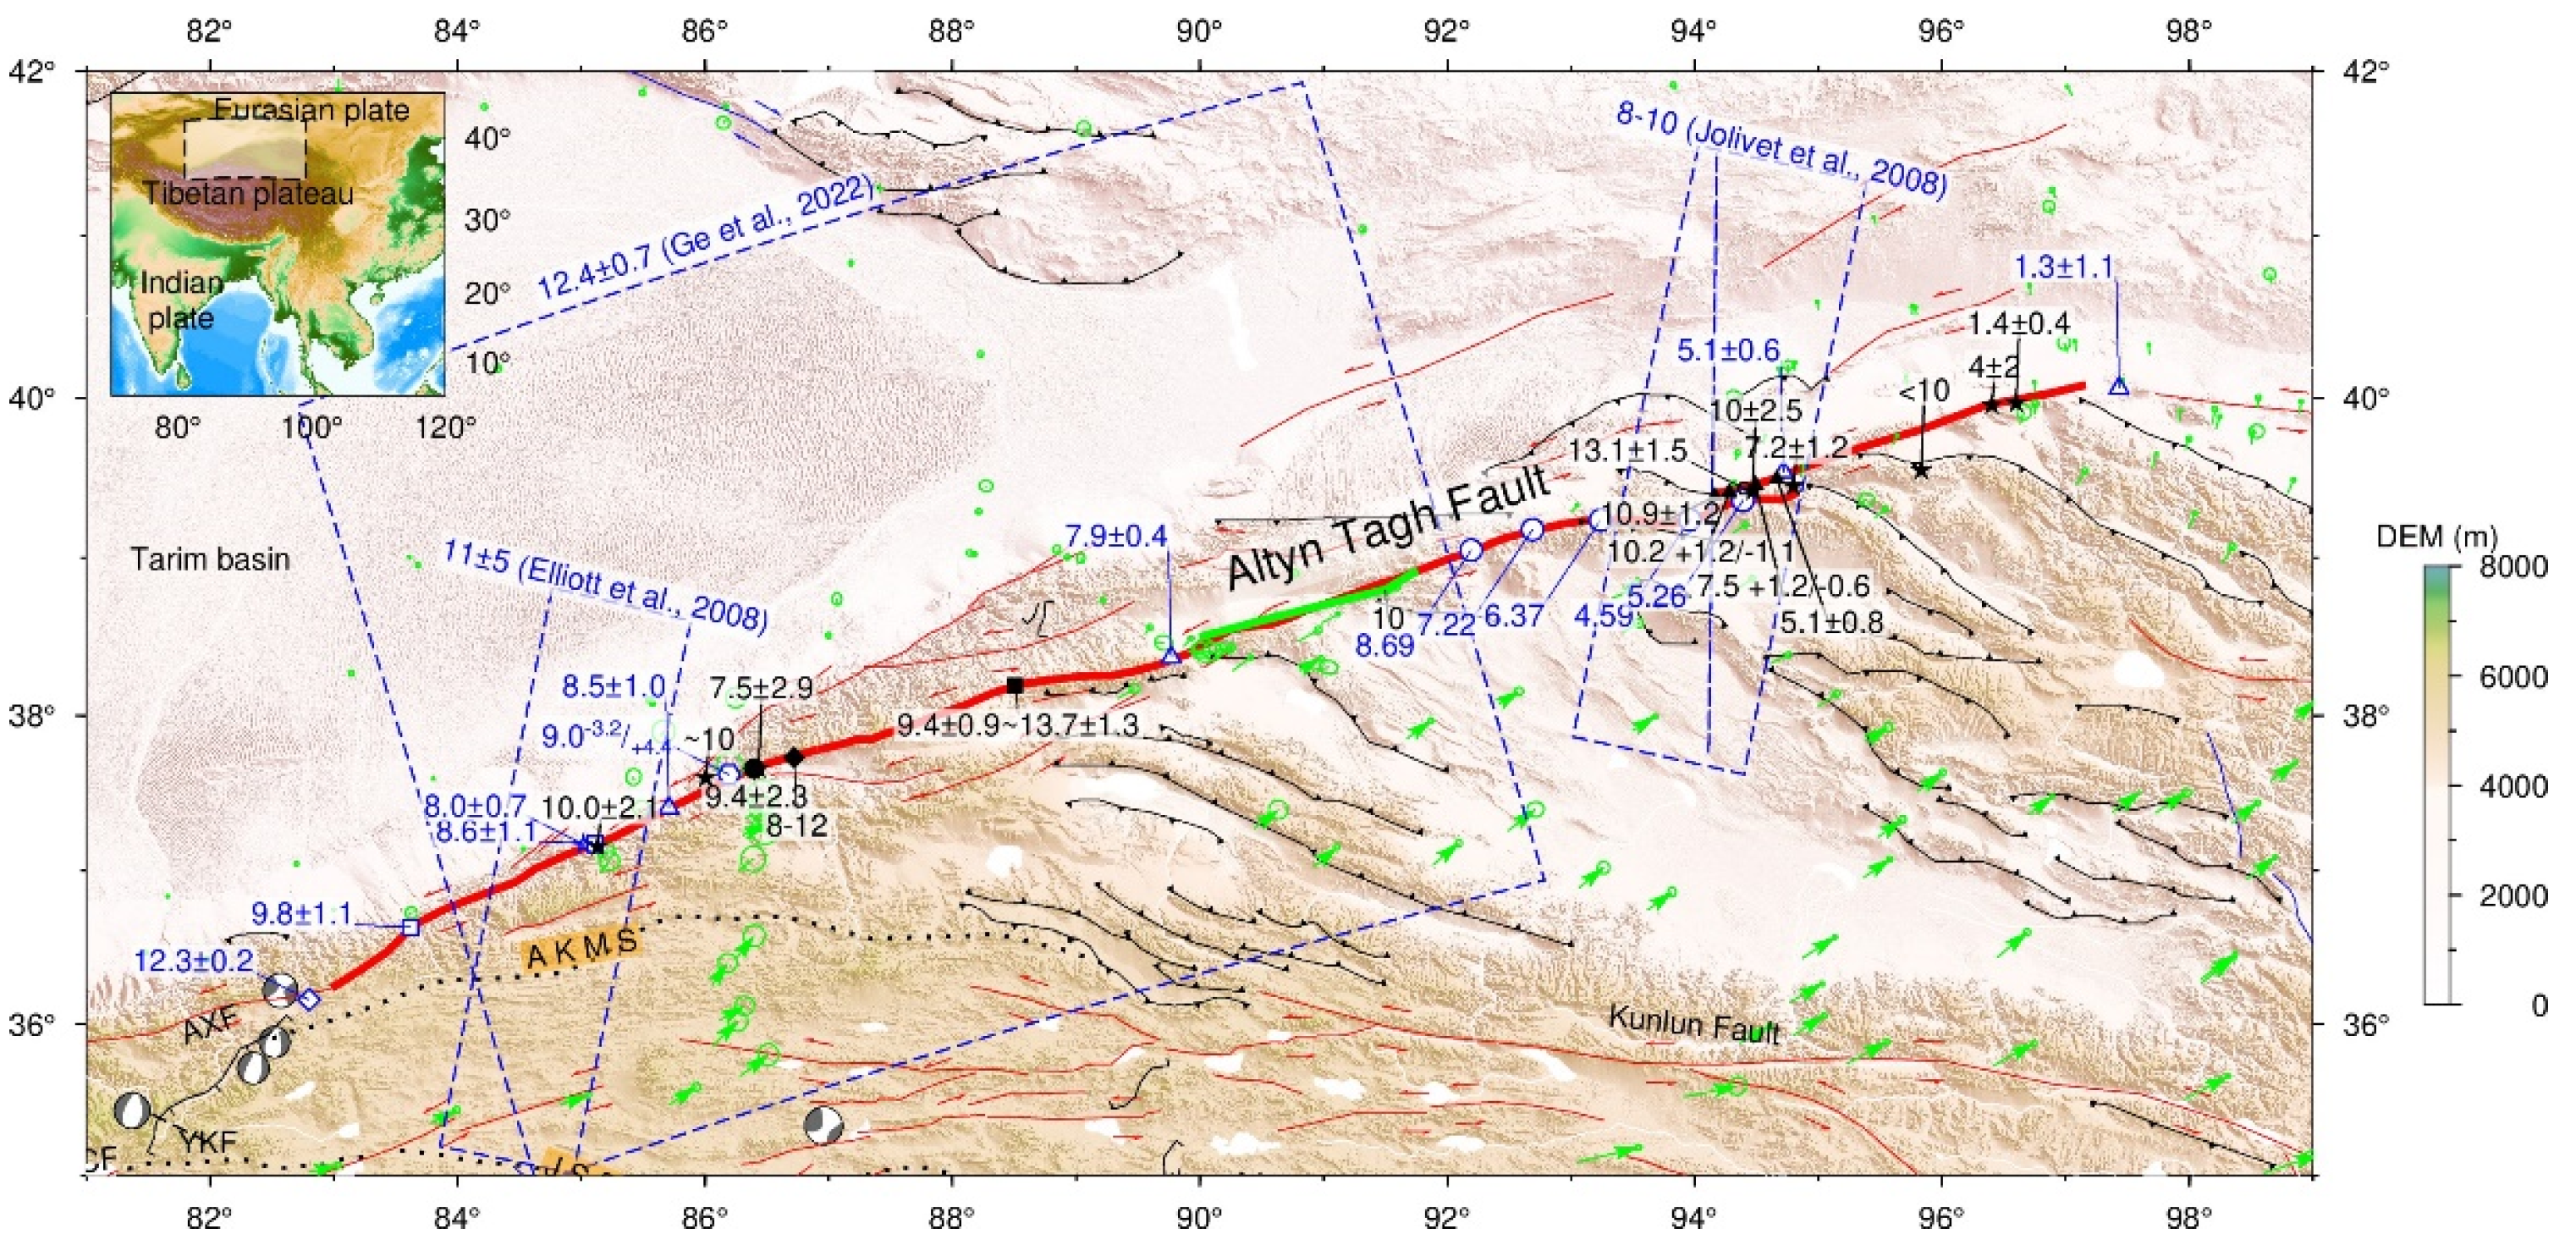
The ATF plays a significant role in the tectonic evolution of the Tibetan Plateau. Since the collision of the Indian and Eurasian plates ~50 Ma ago, the Tibetan Plateau has undergone a process from uplift to thinning [22,23]. The fault is approximately 1200 km long with a strike direction of NEE (about N70˚E) and a left-lateral displacement of about 350-470 km [24,25]. Geological studies suggest that the ATF has accommodated consideratble crustal shortening [22,26]. Its slip rate derived in early studies, constrained by the data and technical methods available at that time, suggested a high slip rate (>20 mm/yr) [27,28]. With more detailed field work and improvement of geodetic observation, a consensus has gradually been reached among geological, paleoseismological and geodetic studies, with most supporting a moderate slip rate of 8-12 mm/yr for the ATF [9,12,24,29,30,31,32,33,34,35,36,37,38,39] (Figure 1).
Asymmetric deformation across the ATF was first observed using early Synthetic Aperture Radar (SAR) data. Jolivet et al. [10], using descending ERS and ENVISAT data in the eastern section (94°E), found that the deformation zone on the Qaidam Basin side was significantly wider than that on the Tarim Basin side, taking the northern branch of the ATF as the primary trace. They proposed that the asymmetry resulted from southward fault offset by 5–7 km at depth (close to the southern branch of the ATF) together with a rigidity constrast of 0.85. Elliott et al. also observed asymmetric deformation in the central section (85°E) using descending ERS-1/2 data [7], but with a pattern opposite to that in the east. They found the maximum deformation gradient located approximately 10 km into the Tarim Basin side—a finding also inconsistent with the understanding of the Tarim Basin's greater crustal rigidity. He et al. established 16 new campaign Global Navigation Satellite System (GNSS) stations in the central section (approximately 86.2°E), and conducted 2–3 observation campaigns between 2009 and 2011 [9]. Their 400-km-long GNSS velocity profile revealed southward fault offset of approximately 13 km at depth. Using ascending and descending ENVISAT data, Zhu et al. also observed asymmetric deformation near 85°E but did not provide details [15]. Liu et al. used ascending and descending Sentinel-1 SAR data to derive Interferometric SAR (InSAR) deformation fields between 82°E and 89°E [12]. They identified asymmetric deformation near 83.5°E and 85°E but likewise did not provide detailed characterization. They discussed the contributions of various physical mechanisms (viscoelastic effects, crustal property contrasts, etc.) but could not isolate the dominant factor, attributing their findings to the contrast in elastic layer thickness and shear modulus between the Tibetan Plateau and the Tarim Basin. Ge et al. [8], using 7 new continuous GNSS stations near approximately 90°E and incorporating data from other GNSS stations near approximately 86°E, found that, along this section (86–90°E), the average shear deformation on the south side of the fault (approximately 8.2 mm/yr) was roughly twice that on the north side (approximately 4.2 mm/yr). They inferred a significantly smaller effective elastic thickness on the south side (16.5–20 km) compared to the Tarim Basin (>60 km). Luo et al. identified significant asymmetric deformation in ascending Sentinel-1 velocity profiles near 85°E across the entire Himalaya-Tibet-Tarim region [13], attributing it to the combined contribution of several adjacent, sub-parallel active faults, but did not quantify the contribution of individual faults. A single screw dislocation model for a fault across the region suggested a fault location approximately 55 km south of the ATF, near the Anyimaqin-Kunlun-Mutztagh Suture (AKMS). Shen et al. demonstrated that strain localization is variable [14], with strain concentrated at the fault in some sections and distributed across broad (>100 km) shear zones in others. They suggested that the variable shear zone width may be related to geological variability and heat flow, implying a significant role for sub-parallel faults in shaping the overall deformation field. Liu et al. found asymmetric interseismic strain in the velocity profile across the ATF and proposed that this asymmetry results from the combined effects of decreasing rigidity from the Tarim Basin to the Tibetan Plateau and a southward horizontal offset [11].
Conversely, other studies have not observed asymmetric deformation [40,41,42]. For example, Li et al. [40], using a combined analysis of GNSS and ENVISAT InSAR deformation fields, examined rate profiles near approximately 86°E and found no evidence of asymmetry. Near approximately 94°E, where Jolivet et al. observed southward asymmetric deformation across the fault [10], Wang et al. did not detect a significant asymmetric pattern using Sentinel-1 observations [41]. They further proposed that the observed asymmetric deformation across the Tarim-Altun Shan-Qaidam Basin profile is more likely controlled by secondary faults within the Qaidam Basin. Using ENVISAT data (2003–2010) covering the section near approximately 85°E, Zhang et al. also found that strain was not only localized along the ATF but also accumulated on four subsidiary faults to the south [42].
The northwestern Tibetan Plateau, characterized by high altitude, cold climate, and sparse population, presents significant challenges for geodetic observations, particularly GNSS measurements. This data scarcity hinders detailed characterization of fault-perpendicular and along-strike deformation variations, consequently limiting the accuracy of slip rate analyses for active faults in the region. Previous geodetic studies have largely focused on the ATF itself, primarily utilizing SAR data from a relatively narrow zone (<200 km) surrounding the fault [11,14,41]. However, recognizing that regional crustal deformation significantly influences local fault behavior, accurate characterization of regional crustal motion is essential for reliably inverting the current slip rate of the ATF. The existing GNSS network in the region lacks sufficient spatial resolution to capture subtle variations in deformation gradients both perpendicular and parallel to the fault [43,44,45,46,47]. To address these limitations, we employed Sentinel-1 InSAR to acquire a large-scale deformation field encompassing the northwestern Tibetan Plateau. This approach enabled a detailed depiction of the asymmetric deformation characteristics along the western section of the ATF. We then interpreted these observations using a simplified model—the cumulative contribution of multiple adjacent faults—a factor frequently overlooked in previous studies.
Figure 1.
Map of the ATF. Black lines are mapped active faults [48]. Green arrows are GNSS horizontal velocity vectors [45], relative to the rigid Tarim Basin. Solid black symbols are geological fault slip rates, with circles for Cowgill et al. [29], stars for Zhang et al. [38], hexagons for Xu et al. [37], squares for Cowgill et al. [30], diamond for Gold et al. [31], and triangles for Liu et al.[35], respectively. Blue hollow symbols are geodetic slip rates, with hexagons for He et al. [9], stars for Zhu et al. [15], triangles for Li et al. [32], circles for Liu et al. [34], squares for Liu et al. [12], and diamond for Zhao et al. [39], respectively.
2. Materials and Methods
2.1. Sentinel-1 SAR Data
The European Space Agency (ESA)'s Sentinel-1 C-band SAR data were used to derive the crustal deformation. The footprint of one standard Sentinel-1 Interferometric Wide Swath (IW) image covers a geographical area of ~250 km × 180 km over the Tibetan Plateau. To fully cover the study area, we used data from 5 ascending tracks and 5 descending tracks, mosaicking 5-6 frames along each track (Table 1).
2.2. Time Series InSAR Processing
The open-source software GMTSAR [49] was used to perform the InSAR analysis. The processing was automated using the iGPS software [13,50]. Conventional processing steps were followed, as detailed in Luo et al. [13]. The main configurations are summarized in text S1 in the supplementary material. The derived rate maps are shown in Figure 2. A key feature in the rate maps is the contrasting sense of motion along two major fault zones (Figure 2): the ATF, marking the northern edge of the Tibetan Plateau, and the Jinsha Suture (JSS)-Margai Chaka Fault (MCF)-Kunlun Fault (KLF) zone, separating northern Tibetan Plateau (the Songpan-Ganzi Terrane) and central Tibetan Plateau (the Qiangtang Terrane). This is consistent with the known patterns of Tibetan crustal movement.
2.3. Three-Dimensional (3D) Deformation Fields Reconstruction
InSAR only record deformation in the line-of-sight (LOS) direction of the satellite (i.e., the straight line direction from the satellite to the ground). It is preferable to analyze fault movement based on 3D deformation fields. A single-view InSAR deformation field may not accurately reflect the spatial morphology of surface deformation. For example, results obtained from ascending and descending orbits for the same coseismic deformation field often differ in terms of spatial coverage, movement direction, and displacement magnitude.
The relationship between the 3D crustal displacements and their LOS projection is [51]
where, i is the InSAR LOS displacement; n, e, and u are the north-south, east-west and vertical movements, respectively; ϕ is the orbital direction; θ is the local incidence angle.
We first transformed the InSAR LOS rate map into the GNSS horizontal velocity frame as the followings. Firstly, to highlight the deformation within the Tibetan Plateau, the GNSS velocities [45] relative to the fixed Eurasian plate were transformed into the frame of the Tarim Basin. Secondly, for each track, the GNSS horizontal velocities were projected onto the LOS direction by accounting for the varying SAR imaging geometry. Then, the differences between the projected GNSS velocities and the InSAR velocities were calculated and then used to fit a third-order trend surface. This trend surface was lastly subtracted from the InSAR rate map. The resulting rate maps from adjacent tracks showed good agreement within overlapping areas (Figure 2), with only negligible discontinuity across the boundaries.
With Equation (1), the 3D velocity fields were derived at places where least one ascending and one descending InSAR rate maps exist, with a ground resolution of ~2 km × 2 km. In Equation (1), there are three unknowns to be solved, i.e., the crustal movement in three directions (e - east-west; n - north-south; u - vertical), with the satellite orbit direction ϕ and the incident angle θ being known quantities, and i being the observed quantity (InSAR LOS deformation). In most areas, Sentinel-1 can only provide two-view observations, i.e., one ascending and one descending (1A+1D). With three unknowns but only two independent observations, the system of equations is still underdetermined. Considering that InSAR is insensitive to north-south fault movement and that the faults we are studying are primarily in strike of nearly east-west direction, if we use GNSS north-south velocities as the measurement of n in Equation (1), we can directly solve for the remaining two unknowns (e and u). In overlapping areas of adjacent tracks, there may be at most two ascending and two descending views (2A+2D). In such cases, the least squares method is used to solve for the unknowns. The resulting 3D crustal velocity fields are shown in Figure 3.
3. Results
3.1. Overall Pattern of Deformation Field in Northwestern Tibetan Plateau
The most prominent signal in our InSAR-derived 3D crustal deformation field is the left-slip of the ATF (Figure 3a), consistent with its rapid slip rate of 8–12 mm/yr [36]. The deformation of the 2020 Mw 6.4 Nima normal earthquake [52] in Central Tibet is also apparent. However, it is primarily in the vertical direction and the seismogenic fault, the Yibu Chaka Fault, lies approximately 200 km south of the Kunlun Fault, it thus does not affect our analysis of fault motion of the ATF. Furthermore, clear velocity contrast across the surface rupture of the 1997 Mw 7.6 Manyi earthquake is also evident, indicating post-seismic deformation persists after two decades [53,54].
To characterize regional strain accumulation, we constructed fault-parallel velocity profiles along the JSS-MCF-KLF zone, another prominent left slip boundary south of the ATF. This zone is affected by recent large earthquakes: the 1997 Mw 7.6 Manyi earthquake on the MCF [17] and the 2001 Mw 7.8 Kokoxili earthquake on the Kunlun Fault [55]. While some researchers attribute both events to the Kunlun Fault, the MCF belongs to the distinct tectonic setting of the central Tibetan Plateau's V-shaped conjugate strike-slip fault system. Furthermore, the Kunlun Fault forms the northern boundary of the Songpan-Ganzi terrane, while the MCF lies near the southern margin of this terrane [56], suggesting they are likely distinct geological structures. Nevertheless, we consider the MCF-KLF zone as the southern boundary of the left-lateral shear zone in northwestern Tibetan Plateau accommodating east-west extrusion, based upon the closeness of the observed concentrated deformation on these two faults. The westward extent of left-lateral slip on the MCF is unclear. ENVISAT SAR data revealed a 4–8 mm/yr left-lateral slip rate along the JSS near 84–85°E [57]. Therefore, we extended the southern edge westward along the JSS. These velocity profiles, perpendicular to the JSS-MCF-KLF zone's overall trend and spaced 10 km apart (Figure 4), were then constructed by incorporating data within 5 km of their centerlines.
These profiles confirm that the ATF and the JSS-MCF-KLF are the most prominent boundaries accommodating sinistral shear within the northwestern Tibetan Plateau. No visible shear exists to the north of the ATF; and only a modest portion (~5 mm/yr out of 23 mm/yr) of eastwards extrusion exists south of the JSS-MCF-KLF zone. Additionally, a third active fault is required to accommodate the remaining shear strain within the belt that can be visible somewhere, especially at the westmost section of the ATF. For instance, a significant jump in velocities near the AKMS (at 87°E) (Figure S2 in the supplementary material) suggests the presence of this additional structure. This led us to incorporate the Heishibeihu Fault (HF)-AKMS into the splay fault model. Consequently, our proposed fault system incorporates three primary structures that accommodate the complex lateral motion within the region: 1) the ATF, 2) the HF-AKMS; 3) the JSS-MCF-KLF.
Typical fault-parallel velocity profiles are presented in Figure 4. At the western end, strain accumulation primarily occurs along the ATF, with significant asymmetry across the fault (e.g., in profile AA'-CC' in Figure 4). Deformation is minor on the side of the Tarim Basin compared to on the southern side (the Tibetan Plateau). The velocity gradient is smooth from north to south, with no obvious discontinuities at mapped active faults in most areas. The individual deformation signals of each fault are not clearly distinguishable, especially near the western tip of the ATF (<85˚E, e.g., profiles AA’-CC’ in Figure 4). In the east, however, velocity profiles clearly show that strain accumulation primarily occurs along two zones, the ATF and the JSS-MCF-KLF, with insignificant strain accumulation observed on the intermediate secondary fault, e.g., profile GG’ in Figure 4.
3.2. Inversion of Fault Slip Rate
The slip rates and locking depths were estimated using the screw dislocation model [1]:
where, x is the distance to fault trace (in km); v is the observed fault-parallel velocity (in mm/yr) at location x; D is locking depth of fault plane (in km); S is the slip rate (in mm/yr) between the freely creeping sides beneath the locked upper layer; γ is the shift to compensate for mapped fault trace uncertainty; μ is the velocity shift; the subscripts 1-3 represent the JSS-MCF-KLF, the HF-AKMS, and the ATF, respectively. Because the ATF, HF-AKMS and JSS-MCF-KLF zones are roughly parallel in strike, we ignored the strike difference among those three structures.
The unknown model parameters (S, D, γ, and μ) were estimated with Delayed-Rejection Adaptive Metropolis (DRAM) version of Markov Chain Monte Carlo (MCMC) method [58]. The a priori values and ranges for parameters were specified as shown in Table 2.
Figure 5 presents the optimized estimates of fault position offsets, slip rates, and locking depths for all profiles, derived using the cumulative three-fault model (Equation 2). This relatively simple model effectively accounts for the prominent first-order asymmetry observed in the interseismic deformation, although minor residual asymmetry remains locally. Analysis of slip rates reveals that, in the western section of the AFT (83-86°E), an additional, intermediate fault is required to explain the asymmetric deformation; east of 86°E, however, shear strain is predominantly accommodated by the ATF and the Kunlun Fault. The slip rate of the southernmost fault system, the JSS-MCF-KLF zone, increases gradually from west to east, consistent with the east-west extension in central Tibetan Plateau. It is important to note that by incorporating the HF-AKMS zone into the inversion model, slip rate estimates for the ATF are relatively small (~5 mm/yr) along its western section (83-85°E), which is significantly lower than the commonly accepted slip rate of around 10 mm/yr [36]. The ATF and Heishibeihu faults may merge into one at depth along this section. Along the MCF, geological offset and dating yields an average left-lateral slip rate of 10 ± 2.2 mm/a [62]. ERS2 data spanning 1.63 year derived an interseismic slip rate of 10.2± 0.4 mm/yr, with a locking depth of 18 km [63]. Bell et al. estimated relative motion across the fault of 3 ± 2 mm/yr prior to the 1997 earthquake, with a poorly resolved locking depth of 22 ±15 km [64]. Our deformation data reveal a dextral slip rate of ~6 mm/yr 20 years after the event, lying in the middle of previous estimates.
The estimates of locking depth align with the occurrence of significant earthquake events in the region during the last 30 years. The MCF where the 1997 Mani earthquake occurred [17], the ATF east of the 2014 Yutian earthquake [59,60], and the Kunlun Fault west of the 2001 Kokoxili earthquake [55] exhibit shallow locking depths, confirming that these areas remain influenced by postseismic deformation [53,54,61]. Notably, the gap between ruptured zones of the 1997 Manyi and the 2001 Kokoxili earthquakes also exhibits shallow locking depths, potentially indicating reduced seismic hazard due to strain release through postseismic afterslip. Elsewhere along the ATF, locking depths are generally greater (20-30 km).
3.3. Residual Asymmetric Deformation
The three-fault model suggests that the asymmetric deformation across the ATF is primarily accommodated by the HF-AKMS and the JSS-MCF-KLF structures. However, the question remains: does this model completely account for the observed asymmetry, or is some degree of residual asymmetry still present? During the model estimation process, we permitted all faults to have a maximum position offset of 30 km (Table 2). Consequently, the estimated offset of the ATF can serve as a metric to assess whether a significant residual asymmetry persists. Our analysis reveals that the remaining asymmetric deformation along the ATF is not consistent along its entire extent.
(1) At approximately >88˚E along the ATF, a southwards fault offset of around 10 km is commonly observed, as depicted in Figure S3 in the supplementary material. This aligns with observations in the eastern section utilizing InSAR [10] and employing GNSS [8]. Geological investigations indicate that around ~89˚E, the ATF zone bifurcates into two branches: the north ATF and the south ATF. According to the fault offset estimates in this study, contemporary deformation primarily occurs on the south branch, which is consistent with the findings at approximately 94˚E using ENVISAT data [10].
(2) In the central ATF region near 86°E (approximately 85.5-86.5°E), there is a northward asymmetry with larger deformation towards the Tarim Basin side. This pattern is illustrated by a specific example near 86.4°E across the ATF, as shown in Figure S4 in the supplementary material. This gradient pattern aligns with the InSAR observation around ~85°E [7], where the maximum deformation gradient was observed about 10 km into the Tarim Basin side. However, it contradicts the GNSS result at ~86°E which suggest a southward offset of approximately 13 km at depth into the Tibetan plateau [9].
(3) In the westmost section of the ATF (<85˚E), the asymmetry is most significant and can be largely accounted for by considering additional contributions from the Heishibeihu Fault – AKMS zone within the Tibetan Plateau, e.g., near 84.5°E across the ATF as depicted in Figure S5 in the supplementary material. Despite some residual asymmetry towards the plateau, the estimated fault position offsets are consistent with the known ATF location, falling within the model error limits.
(4) Additionally, in other sections, e.g., between 85-85.5°E and 87-88°E along the central ATF, the remaining asymmetric feature is not notably pronounced in our cumulative model, as shown in Figure S6 in the supplementary material.
To sum up, the interseismic deformation centers of the ATF derived from the cumulative dislocation model generally align well with the surface fault traces provided by geological investigations at most locations. In some areas, there are slight deviations towards the Tarim Basin or the Tibetan Plateau side, but typically less than 10 km.
4. Discussion
4.1. Can Crust Rigidity Contrast Solely Explain the Asymmetry?
We test whether the rigidity contrast between Tibetan Plateau and Tarim Basin can fully explain the observed asymmetry in interseismic deformation across the ATF. The modified half-space elastic dislocation model [10] is employed to calculate and analyze the asymmetric deformation across the fault.
where, K represents the asymmetry coefficient ranging from 0 to 1, indicating the extent of rigidity contrast between both sides of the fault. A value of K=0.5 signifies no asymmetry in the interseismic deformation field across the fault, as per Equation 2.
In this inversion, we have made the assumption that the mapped trace of the ATF is accurate, based on its significant geomorphic expression. Consequently, we permitted it to vary within a narrow range of [-3 km, 3 km] to accommodate minor inaccuracies in fault trace mapping without compromising our asymmetry analysis. The results reveal that in order to comprehensively account for the asymmetry near the western tip of the ATF across the region, a rigidity coefficient of approximately 0.2 is required (profile AA’ in Figure 6). Notably, even with an extreme rigidity contrast further eastward, it remains insufficient to adequately explain large-scale asymmetric deformation (profiles BB’-CC’ in Figure 6). East of 85°E longitude, most derived rigidity coefficients fall within the range of [0.4, 0.6], signifying a relatively modest presence of asymmetry in interseismic deformation (profiles DD’-FF’ in Figure 6). In light of these results, it appears unlikely that crustal rigidity contrast serves as the primary determinant responsible for widespread asymmetric interseismic deformation along the ATF.
Our findings do not support previously proposed primary mechanisms attributing the asymmetric interseismic deformation across the ATF to rheological contrasts, varying crustal thickness [8], deep fault dislocation [9], or combinations thereof [10]. If rheological contrasts were the primary driver, a consistent deformation pattern would be expected along the entire ATF, contrary to our observations and previous findings along several segments [14,41,42]. Even in the westernmost ATF, where asymmetry is most pronounced, the combined influence of multiple faults adequately explains the large-scale interseismic deformation. Consequently, we propose that the observed asymmetry is predominantly a result of multiple nearby faults, with other potential factors playing a subordinate role.
4.2. Can a Two-Fault Model Explain the Asymmetric Deformation?
Assuming the absence of any additional faults between the ATF and the JSS-MCF-KLF zone, we explore whether the deformation field in the northwestern Tibetan Plateau can be adequately represented by a dislocation model incorporating only these two faults. Results (Figure S7) show good agreement between the two- and three-fault models east of 86°E. However, significant discrepancies exist in the western ATF section (83–86°E). Achieving a satisfactory fit to the asymmetric interseismic loading rate in this area necessitates two key criteria: 1) a more deeper locking depth (~40 km) and a substantial fault position offset towards the Tibetan Plateau, reaching a maximum of >30 km and varying along strike (Figure S7a). It seems that this variation cannot be fully explained by a shallow-deep fault location offset, a south dipping fault plane, or a single crustal rigidity contrast across the ATF. Therefore, the two-fault model cannot adequately fit the asymmetric interseismic deformation across the ATF.
5. Conclusions
Using ~9 years of Sentinel-1 data, we derive a 3D crustal deformation field for the northwestern Tibetan Plateau. Our analysis reveals the following findings.
Interseismic deformation across the ATF displays pronounced spatial variability in asymmetry. The western section (~83°E-85°E) is characterized by the most significant asymmetry, with predominant elastic deformation occurring within the Tibetan Plateau. In contrast, asymmetry is less apparent along the central section of the ATF. The transition zone between these segments exhibits marked lateral variations in the spatial extent and gradient of asymmetric deformation. Notably, larger deformation is not consistently observed on the Tibetan Plateau side.
The observed asymmetry in deformation cannot be attributed solely to a consistent rigidity contrast between the Tarim Basin and the Tibetan Plateau. Instead, the combined influence of the ATF, Jinsha Suture-Kunlun Fault, and secondary faults fully explains the deformation pattern. Consequently, the asymmetric deformation in the northwestern Tibetan Plateau region is primarily a manifestation of these fault interactions rather than crustal property variations, viscoelastic effects, or other factors.
Rapid strain accumulation within the Tibetan Plateau is concentrated along major fault zones rather than being uniformly distributed, supporting the eastward extrusion model of block-style tectonic movement.
Supplementary Materials
The following supporting information can be downloaded at the website of this paper posted on Preprints.org, Text S1: Processing steps of time series InSAR analysis; Figure S1: Temporal and spatial baseline of interferograms; Figure S2: Fault-parallel velocity profile near 87°E across the ATF; Figure S3: Fault-parallel velocity profile near 89°E across the ATF; Figure S4: Fault-parallel velocity profile near 86.4°E across the ATF; Figure S5: Fault-parallel velocity profile near 84.5°E across the ATF; Figure S6: Fault-parallel velocity profile near 87.75°E across the ATF; Figure S7: Inversion results for two-fault model.
Author Contributions
Conceptualization, Y.T.; methodology, Y.L.; software, Y.T. and Y.L.; validation, W.J., Y.T. and W.F.; formal analysis, Y.L.; investigation, Y.L. and H.J.; resources, Y.T. and W.J. ; data curation, Y.L.; writing—original draft preparation, Y.L. and H.J.; writing—review and editing, Y.T. and W.F.; visualization, Y.L.; supervision, Y.T. and H.J.; project administration, Y.T. and W.J.; funding acquisition, Y.T. and W.J. All authors have read and agreed to the published version of the manuscript.
Funding
This research was funded by the National Natural Science Foundation of China, grant numbers 42271015 and 41972230, and the Basic Research Special Fund of the Ministry of Emergency Management, grant number ZDJ2018-13.
Data Availability Statement
The Sentinel-1 data used in this study are publicly available from the European Space Agency (ESA) through the Copernicus Open Access Hub service (https://scihub.copernicus.eu/). Interferometric processing and time series analysis were performed using the open-source GMTSAR software (https://topex.ucsd.edu/gmtsar/). Following acceptance of this manuscript, our 3D deformation fields will be deposited online for public access.
Acknowledgments
The plots were generated using the GMT software package (https://www.generic-mapping-tools.org/).
Conflicts of Interest
The authors declare no conflicts of interest. The funders had no role in the design of the study; in the collection, analyses, or interpretation of data; in the writing of the manuscript; or in the decision to publish the results.
Abbreviations
The following abbreviations are used in this manuscript:
| ATF | Altyn Tagh Fault |
| GNSS | Global Navigation Satellite System |
| InSAR | Interferometric Synthetic Aperture Radar |
| JSS | Jinsha Suture |
| KLF | Kunlun Fault |
| LOS | line-of-sight |
| MCF | Margai Caka Fault |
References
- Savage, J.C.; Burford, R.O. Geodetic Determination of Relative Plate Motion in Central California. J. Geophys. Res. 1973, 78, 832–845. [Google Scholar] [CrossRef]
- Le Pichon, X.; Kreemer, C.; Chamot-Rooke, N. Asymmetry in Elastic Properties and the Evolution of Large Continental Strike-slip Faults. J. Geophys. Res. Solid Earth 2005, 110, 2004JB003343. [Google Scholar] [CrossRef]
- Genrich, J.F.; Bock, Y.; McCaffrey, R.; Prawirodirdjo, L.; Stevens, C.W.; Puntodewo, S.S.O.; Subarya, C.; Wdowinski, S. Distribution of Slip at the Northern Sumatran Fault System. J. Geophys. Res. Solid Earth 2000, 105, 28327–28341. [Google Scholar] [CrossRef]
- Freymueller, J.T.; Murray, M.H.; Segall, P.; Castillo, D. Kinematics of the Pacific-North America Plate Boundary Zone, Northern California. J. Geophys. Res. Solid Earth 1999, 104, 7419–7441. [Google Scholar] [CrossRef]
- Prescott, W.H.; Yu, S. Geodetic Measurement of Horizontal Deformation in the Northern San Francisco Bay Region, California. J. Geophys. Res. Solid Earth 1986, 91, 7475–7484. [Google Scholar] [CrossRef]
- Ji, L.; Zhang, W.; Liu, C.; Zhu, L.; Xu, J.; Xu, X. Characterizing Interseismic Deformation of the Xianshuihe Fault, Eastern Tibetan Plateau, Using Sentinel-1 SAR Images. Adv. Space Res. 2020, 66, 378–394. [Google Scholar] [CrossRef]
- Elliott, J.R.; Biggs, J.; Parsons, B.; Wright, T.J. InSAR Slip Rate Determination on the Altyn Tagh Fault, Northern Tibet, in the Presence of Topographically Correlated Atmospheric Delays. Geophys. Res. Lett. 2008, 35, 2008GL033659. [Google Scholar] [CrossRef]
- Ge, W.; Shen, Z.; Molnar, P.; Wang, M.; Zhang, P.; Yuan, D. GPS Determined Asymmetric Deformation Across Central Altyn Tagh Fault Reveals Rheological Structure of Northern Tibet. J. Geophys. Res. Solid Earth 2022, 127, e2022JB024216. [Google Scholar] [CrossRef]
- He, J.; Vernant, P.; Chéry, J.; Wang, W.; Lu, S.; Ku, W.; Xia, W.; Bilham, R. Nailing down the Slip Rate of the Altyn Tagh Fault. Geophys. Res. Lett. 2013, 40, 5382–5386. [Google Scholar] [CrossRef]
- Jolivet, R.; Cattin, R.; Chamot-Rooke, N.; Lasserre, C.; Peltzer, G. Thin-plate Modeling of Interseismic Deformation and Asymmetry across the Altyn Tagh Fault Zone. Geophys. Res. Lett. 2008, 35, 2007GL031511. [Google Scholar] [CrossRef]
- Liu, C.; Ji, L.; Zhu, L.; Xu, C.; Qiu, J. Interseismic Strain Rate Distribution Model of the Altyn Tagh Fault Constrained by InSAR and GPS. Earth Planet. Sci. Lett. 2024, 642, 118884. [Google Scholar] [CrossRef]
- Liu, Y.; Zhao, D.; Shan, X. Asymmetric Interseismic Strain across the Western Altyn Tagh Fault from InSAR. Remote Sens. 2022, 14, 2112. [Google Scholar] [CrossRef]
- Luo, Y.; Tian, Y.; Feng, W.; Hu, Y. Development and application of automated processing tool for time series deformation analysis using open-source GMTSAR and iGPS software. Rev. Geophys. Planet. Phys. 2023, 54, 653–666. [Google Scholar] [CrossRef]
- Shen, L.; Hooper, A.; Elliott, J.R.; Wright, T.J. Variability in Interseismic Strain Accumulation Rate and Style along the Altyn Tagh Fault. Nat. Commun. 2024, 15, 6876. [Google Scholar] [CrossRef]
- Zhu, S.; Xu, C.; Wen, Y.; Liu, Y. Interseismic Deformation of the Altyn Tagh Fault Determined by Interferometric Synthetic Aperture Radar (InSAR) Measurements. Remote Sens. 2016, 8, 233. [Google Scholar] [CrossRef]
- Thatcher, W.; Marshall, G.; Lisowski, M. Resolution of Fault Slip along the 470-km-long Rupture of the Great 1906 San Francisco Earthquake and Its Implications. J. Geophys. Res. Solid Earth 1997, 102, 5353–5367. [Google Scholar] [CrossRef]
- Peltzer, G.; Crampé, F.; King, G. Evidence of Nonlinear Elasticity of the Crust from the Mw7.6 Manyi (Tibet) Earthquake. Science 1999, 286, 272–276. [Google Scholar] [CrossRef]
- Wan, Y.; Shen, Z.; Wang, M.; Zhang, Z.-S.; Gan, W.; Wang, Q.-L.; Sheng, S.-Z. Coseismic Slip Distribution of the 2001 Kunlun Mountain Pass West Earthquake Constrained by GPS and Insar Data. Chin. J. Geophys. 2008, 51, 753–764. [Google Scholar] [CrossRef]
- Avouac, J.-P.; Ayoub, F.; Wei, S.; Ampuero, J.-P.; Meng, L.; Leprince, S.; Jolivet, R.; Duputel, Z.; Helmberger, D. The 2013, Mw 7.7 Balochistan Earthquake, Energetic Strike-Slip Reactivation of a Thrust Fault. Earth Planet. Sci. Lett. 2014, 391, 128–134. [Google Scholar] [CrossRef]
- Lauer, B.; Grandin, R.; Klinger, Y. Fault Geometry and Slip Distribution of the 2013 Mw 7.7 Balochistan Earthquake From Inversions of SAR and Optical Data. J. Geophys. Res. Solid Earth 2020, 125, e2019JB018380. [Google Scholar] [CrossRef]
- Savage, H.M.; Shreedharan, S.; Fagereng, Å.; Morgan, J.K.; Meneghini, F.; Wang, M.; McNamara, D.D.; Wallace, L.M.; Saffer, D.M.; Barnes, P.M.; et al. Asymmetric Brittle Deformation at the Pāpaku Fault, Hikurangi Subduction Margin, NZ, IODP Expedition 375. Geochem. Geophys. Geosystems 2021, 22, e2021GC009662. [Google Scholar] [CrossRef]
- Molnar, P.; Tapponnier, P. Cenozoic Tectonics of Asia: Effects of a Continental Collision: Features of Recent Continental Tectonics in Asia Can Be Interpreted as Results of the India-Eurasia Collision. Science 1975, 189, 419–426. [Google Scholar] [CrossRef] [PubMed]
- Molnar, P.; England, P.; Martinod, J. Mantle Dynamics, Uplift of the Tibetan Plateau, and the Indian Monsoon. Rev. Geophys. 1993, 31, 357–396. [Google Scholar] [CrossRef]
- Cowgill, E.; Yin, A.; Harrison, T.M.; Xiao-Feng, W. Reconstruction of the Altyn Tagh Fault Based on U-Pb Geochronology: Role of Back Thrusts, Mantle Sutures, and Heterogeneous Crustal Strength in Forming the Tibetan Plateau. J. Geophys. Res. Solid Earth 2003, 108, 2002JB002080. [Google Scholar] [CrossRef]
- Yin, A.; Rumelhart, P.E.; Butler, R.; Cowgill, E.; Harrison, T.M.; Foster, D.A.; Ingersoll, R.V.; Qing, Z.; Xian-Qiang, Z.; Xiao-Feng, W.; et al. Tectonic History of the Altyn Tagh Fault System in Northern Tibet Inferred from Cenozoic Sedimentation. Geol. Soc. Am. Bull. 2002, 114, 1257–1295. [Google Scholar] [CrossRef]
- Avouac, J.; Tapponnier, P. Kinematic Model of Active Deformation in Central Asia. Geophys. Res. Lett. 1993, 20, 895–898. [Google Scholar] [CrossRef]
- Mériaux, A. -S.; Ryerson, F.J.; Tapponnier, P.; Van Der Woerd, J.; Finkel, R.C.; Xu, X.; Xu, Z.; Caffee, M.W. Rapid Slip along the Central Altyn Tagh Fault: Morphochronologic Evidence from Cherchen He and Sulamu Tagh. J. Geophys. Res. Solid Earth 2004, 109, 2003JB002558. [Google Scholar] [CrossRef]
- Peltzer, G.; Socquet, A.; Lasserre, C.; Meriaux, A.; Tapponnier, P.; Ryerson, R. InSAR Observations of Interseimsic Strain along the Central Altyn Tagh Fault Consistent with Holocene Slip-Rate. 2006, 2006, T21E–02.T21E-02.
- Cowgill, E. Impact of Riser Reconstructions on Estimation of Secular Variation in Rates of Strike–Slip Faulting: Revisiting the Cherchen River Site along the Altyn Tagh Fault, NW China. Earth Planet. Sci. Lett. 2007, 254, 239–255. [Google Scholar] [CrossRef]
- Cowgill, E.; Gold, R.D.; Xuanhua, C.; Xiao-Feng, W.; Arrowsmith, J.R.; Southon, J. Low Quaternary Slip Rate Reconciles Geodetic and Geologic Rates along the Altyn Tagh Fault, Northwestern Tibet. Geology 2009, 37, 647–650. [Google Scholar] [CrossRef]
- Gold, R.D.; Cowgill, E.; Arrowsmith, J.R.; Chen, X.; Sharp, W.D.; Cooper, K.M.; Wang, X.-F. Faulted Terrace Risers Place New Constraints on the Late Quaternary Slip Rate for the Central Altyn Tagh Fault, Northwest Tibet. Geol. Soc. Am. Bull. 2011, 123, 958–978. [Google Scholar] [CrossRef]
- Li, Y.; Shan, X.; Qu, C.; Liu, Y.; Han, N. Crustal Deformation of the Altyn Tagh Fault Based on GPS. J. Geophys. Res. Solid Earth 2018, 123, 10309–10322. [Google Scholar] [CrossRef]
- Liu, C.; Ji, L.; Zhu, L.; Zhao, C. InSAR-Constrained Interseismic Deformation and Potential Seismogenic Asperities on the Altyn Tagh Fault at 91.5–95°E, Northern Tibetan Plateau. Remote Sens. 2018, 10, 943. [Google Scholar] [CrossRef]
- Liu, C.J.; Zhao, C.Y.; Ji, L.Y.; Zhang, Z.R.; Sun, H. Interseismic Deformation Across The Eastern Altyn Tagh Fault from InSAR Measurements. Int. Arch. Photogramm. Remote Sens. Spat. Inf. Sci. 2018, XLII-3, 1029–1033. [Google Scholar] [CrossRef]
- Liu, J.; Ren, Z.; Zheng, W.; Min, W.; Li, Z.; Zheng, G. Late Quaternary Slip Rate of the Aksay Segment and Its Rapidly Decreasing Gradient along the Altyn Tagh Fault. Geosphere 2020, 16, 1538–1557. [Google Scholar] [CrossRef]
- Wang, Y.; Wang, M. A Review of Slip Rates Along the Altyn Tagh Fault and Its Implications. Earthq. Res. China 2020, 36, 817–826. [Google Scholar]
- Xu, X.; Wang, F.; Zheng, R.; Chen, W.; Ma, W.; Yu, G.; Chen, G.; Tapponnier, P.; Van Der Woerd, J.; Meriaux, A.S.; et al. Late Quaternary Sinistral Slip Rate along the Altyn Tagh Fault and Its Structural Transformation Model. Sci. China Ser. Earth Sci. 2005, 48, 384. [Google Scholar] [CrossRef]
- Zhang, P.; Molnar, P.; Xu, X. Late Quaternary and Present-day Rates of Slip along the Altyn Tagh Fault, Northern Margin of the Tibetan Plateau. Tectonics 2007, 26, 2006TC002014. [Google Scholar] [CrossRef]
- Zhao, X.; Wang, C.; He, J.; Liang, L.; Tang, Y.; Zhang, H. Recent Tectonic Movement in the Western Tibetan Plateau Revealed by InSAR Measurements. IEEE J. Sel. Top. Appl. Earth Obs. Remote Sens. 2023, 16, 9336–9349. [Google Scholar] [CrossRef]
- Li, Y.; Nocquet, J.-M.; Shan, X. Crustal Deformation across the Western Altyn Tagh Fault (86° E) from GPS and InSAR. Geophys. J. Int. 2021, 228, 1361–1372. [Google Scholar] [CrossRef]
- Wang, D.; Elliott, J.R.; Zheng, G.; Wright, T.J.; Watson, A.R.; McGrath, J.D. Deciphering Interseismic Strain Accumulation and Its Termination on the Central-Eastern Altyn Tagh Fault from High-Resolution Velocity Fields. Earth Planet. Sci. Lett. 2024, 644, 118919. [Google Scholar] [CrossRef]
- Zhang, G.; Qu, C.; Shan, X.; Song, X.; Zhang, Y.; Li, Y. Present-Day Crustal Deformation of the Northwestern Tibetan Plateau Based on InSAR Measurements. Remote Sens. 2023, 15, 5195. [Google Scholar] [CrossRef]
- Gan, W.; Zhang, P.; Shen, Z.; Niu, Z.; Wang, M.; Wan, Y.; Zhou, D.; Cheng, J. Present-day Crustal Motion within the Tibetan Plateau Inferred from GPS Measurements. J. Geophys. Res. Solid Earth 2007, 112, 2005JB004120. [Google Scholar] [CrossRef]
- Shen, Z.; Wang, M.; Li, Y.; Jackson, D.D.; Yin, A.; Dong, D.; Fang, P. Crustal Deformation along the Altyn Tagh Fault System, Western China, from GPS. J. Geophys. Res. Solid Earth 2001, 106, 30607–30621. [Google Scholar] [CrossRef]
- Wang, M.; Shen, Z. Present-Day Crustal Deformation of Continental China Derived From GPS and Its Tectonic Implications. J. Geophys. Res. Solid Earth 2020, 125, e2019JB018774. [Google Scholar] [CrossRef]
- Wang, Q.; Zhang, P.-Z.; Freymueller, J.T.; Bilham, R.; Larson, K.M.; Lai, X.; You, X.; Niu, Z.; Wu, J.; Li, Y.; et al. Present-Day Crustal Deformation in China Constrained by Global Positioning System Measurements. Science 2001, 294, 574–577. [Google Scholar] [CrossRef]
- Zhang, P.-Z.; Shen, Z.; Wang, M.; Gan, W.; Bürgmann, R.; Molnar, P.; Wang, Q.; Niu, Z.; Sun, J.; Wu, J.; et al. Continuous Deformation of the Tibetan Plateau from Global Positioning System Data. Geology 2004, 32, 809. [Google Scholar] [CrossRef]
- Taylor, M.; Yin, A. Active Structures of the Himalayan-Tibetan Orogen and Their Relationships to Earthquake Distribution, Contemporary Strain Field, and Cenozoic Volcanism. Geosphere 2009, 5, 199–214. [Google Scholar] [CrossRef]
- Sandwell, D.; Mellors, R.; Tong, X.; Wei, M.; Wessel, P. Open Radar Interferometry Software for Mapping Surface Deformation. Eos Trans. Am. Geophys. Union 2011, 92, 234. [Google Scholar] [CrossRef]
- Tian, Y. iGPS: IDL Tool Package for GPS Position Time Series Analysis. GPS Solut. 2011, 15, 299–303. [Google Scholar] [CrossRef]
- Fialko, Y.; Simons, M.; Agnew, D. The Complete (3-D) Surface Displacement Field in the Epicentral Area of the 1999 MW 7.1 Hector Mine Earthquake, California, from Space Geodetic Observations. Geophys. Res. Lett. 2001, 28, 3063–3066. [Google Scholar] [CrossRef]
- Li, K.; Li, Y.; Tapponnier, P.; Xu, X.; Li, D.; He, Z. Joint InSAR and Field Constraints on Faulting During the Mw 6.4, July 23, 2020, Nima/Rongma Earthquake in Central Tibet. J. Geophys. Res. Solid Earth 2021, 126, e2021JB022212. [Google Scholar] [CrossRef]
- Ryder, I.; Parsons, B.; Wright, T.J.; Funning, G.J. Post-Seismic Motion Following the 1997 Manyi (Tibet) Earthquake: InSAR Observations and Modelling. Geophys. J. Int. 2007, 169, 1009–1027. [Google Scholar] [CrossRef]
- Ryder, I.; Wang, H.; Bie, L.; Rietbrock, A. Geodetic Imaging of Late Postseismic Lower Crustal Flow in Tibet. Earth Planet. Sci. Lett. 2014, 404, 136–143. [Google Scholar] [CrossRef]
- Xu, X.; Yu, G.; Klinger, Y.; Tapponnier, P.; Van Der Woerd, J. Reevaluation of Surface Rupture Parameters and Faulting Segmentation of the 2001 Kunlunshan Earthquake ( Mw 7.8), Northern Tibetan Plateau, China. J. Geophys. Res. Solid Earth 2006, 111, 2004JB003488. [Google Scholar] [CrossRef]
- Burchfiel, B.C.; Chen, Z. Tectonics of the Southeastern Tibetan Plateau and Its Adjacent Foreland; Geological Society of America, 2013; ISBN 978-0-8137-1210-9. [Google Scholar]
- Daout, S.; Doin, M.; Peltzer, G.; Lasserre, C.; Socquet, A.; Volat, M.; Sudhaus, H. Strain Partitioning and Present-Day Fault Kinematics in NW Tibet From Envisat SAR Interferometry. J. Geophys. Res. Solid Earth 2018, 123, 2462–2483. [Google Scholar] [CrossRef]
- Haario, H.; Laine, M.; Mira, A.; Saksman, E. DRAM: Efficient Adaptive MCMC. Stat. Comput. 2006, 16, 339–354. [Google Scholar] [CrossRef]
- Yuan, Z.; Liu-Zeng, J.; Li, X.; Xu, J.; Yao, W.; Han, L.; Li, T. Detailed Mapping of the Surface Rupture of the 12 February 2014 Yutian Ms7.3 Earthquake, Altyn Tagh Fault, Xinjiang, China. Sci. China Earth Sci. 2021, 64, 127–147. [Google Scholar] [CrossRef]
- Li, H.; Pan, J.; Lin, A.; Sun, Z.; Liu, D.; Zhang, J.; Li, C.; Liu, K.; Chevalier, M.; Yun, K.; et al. Coseismic Surface Ruptures Associated with the 2014 Mw 6.9 Yutian Earthquake on the Altyn Tagh Fault, Tibetan Plateau. Bull. Seismol. Soc. Am. 2016, 106, 595–608. [Google Scholar] [CrossRef]
- Luo, Y.; Hu, Y.; Tian, Y.; Zhang, J. Seismogenic fault and aftershock characteristics for the 2014 MS7.3 Yutian earthquake,Xinjiang. Acta Seismol. Sin. 2021, 43, 48–56. [Google Scholar] [CrossRef]
- Xu, X.; Chen, W.; Ma, W.; Yu, G.; Chen, G. Surface Rupture of the Kunlunshan Earthquake (Ms 8.1), Northern Tibetan Plateau, China. Seismol. Res. Lett. 2002, 73, 884–892. [Google Scholar] [CrossRef]
- Sun, J.; Xu, X.; Shi, Y.; Liang, F. InSAR-Derived Interseismic Deformation and Preliminary Slip Rate Estimation of the Mani Segment of the East Kunlun Fault. Prog. Nat. Sci. 2007, 1361–1370. [Google Scholar]
- Bell, M.A.; Elliott, J.R.; Parsons, B.E. Interseismic Strain Accumulation across the Manyi Fault (Tibet) Prior to the 1997 Mw 7.6 Earthquake:Manyi Fault Strain Accumulation. Geophys. Res. Lett. 2011, 38, n. [Google Scholar] [CrossRef]
Figure 2.
InSAR LOS rate maps of the northwestern Tibetan Plateau. (a) Ascending tracks (b) Descending tracks. Positive velocity represents uplift (moving toward satellite).
Figure 2.
InSAR LOS rate maps of the northwestern Tibetan Plateau. (a) Ascending tracks (b) Descending tracks. Positive velocity represents uplift (moving toward satellite).
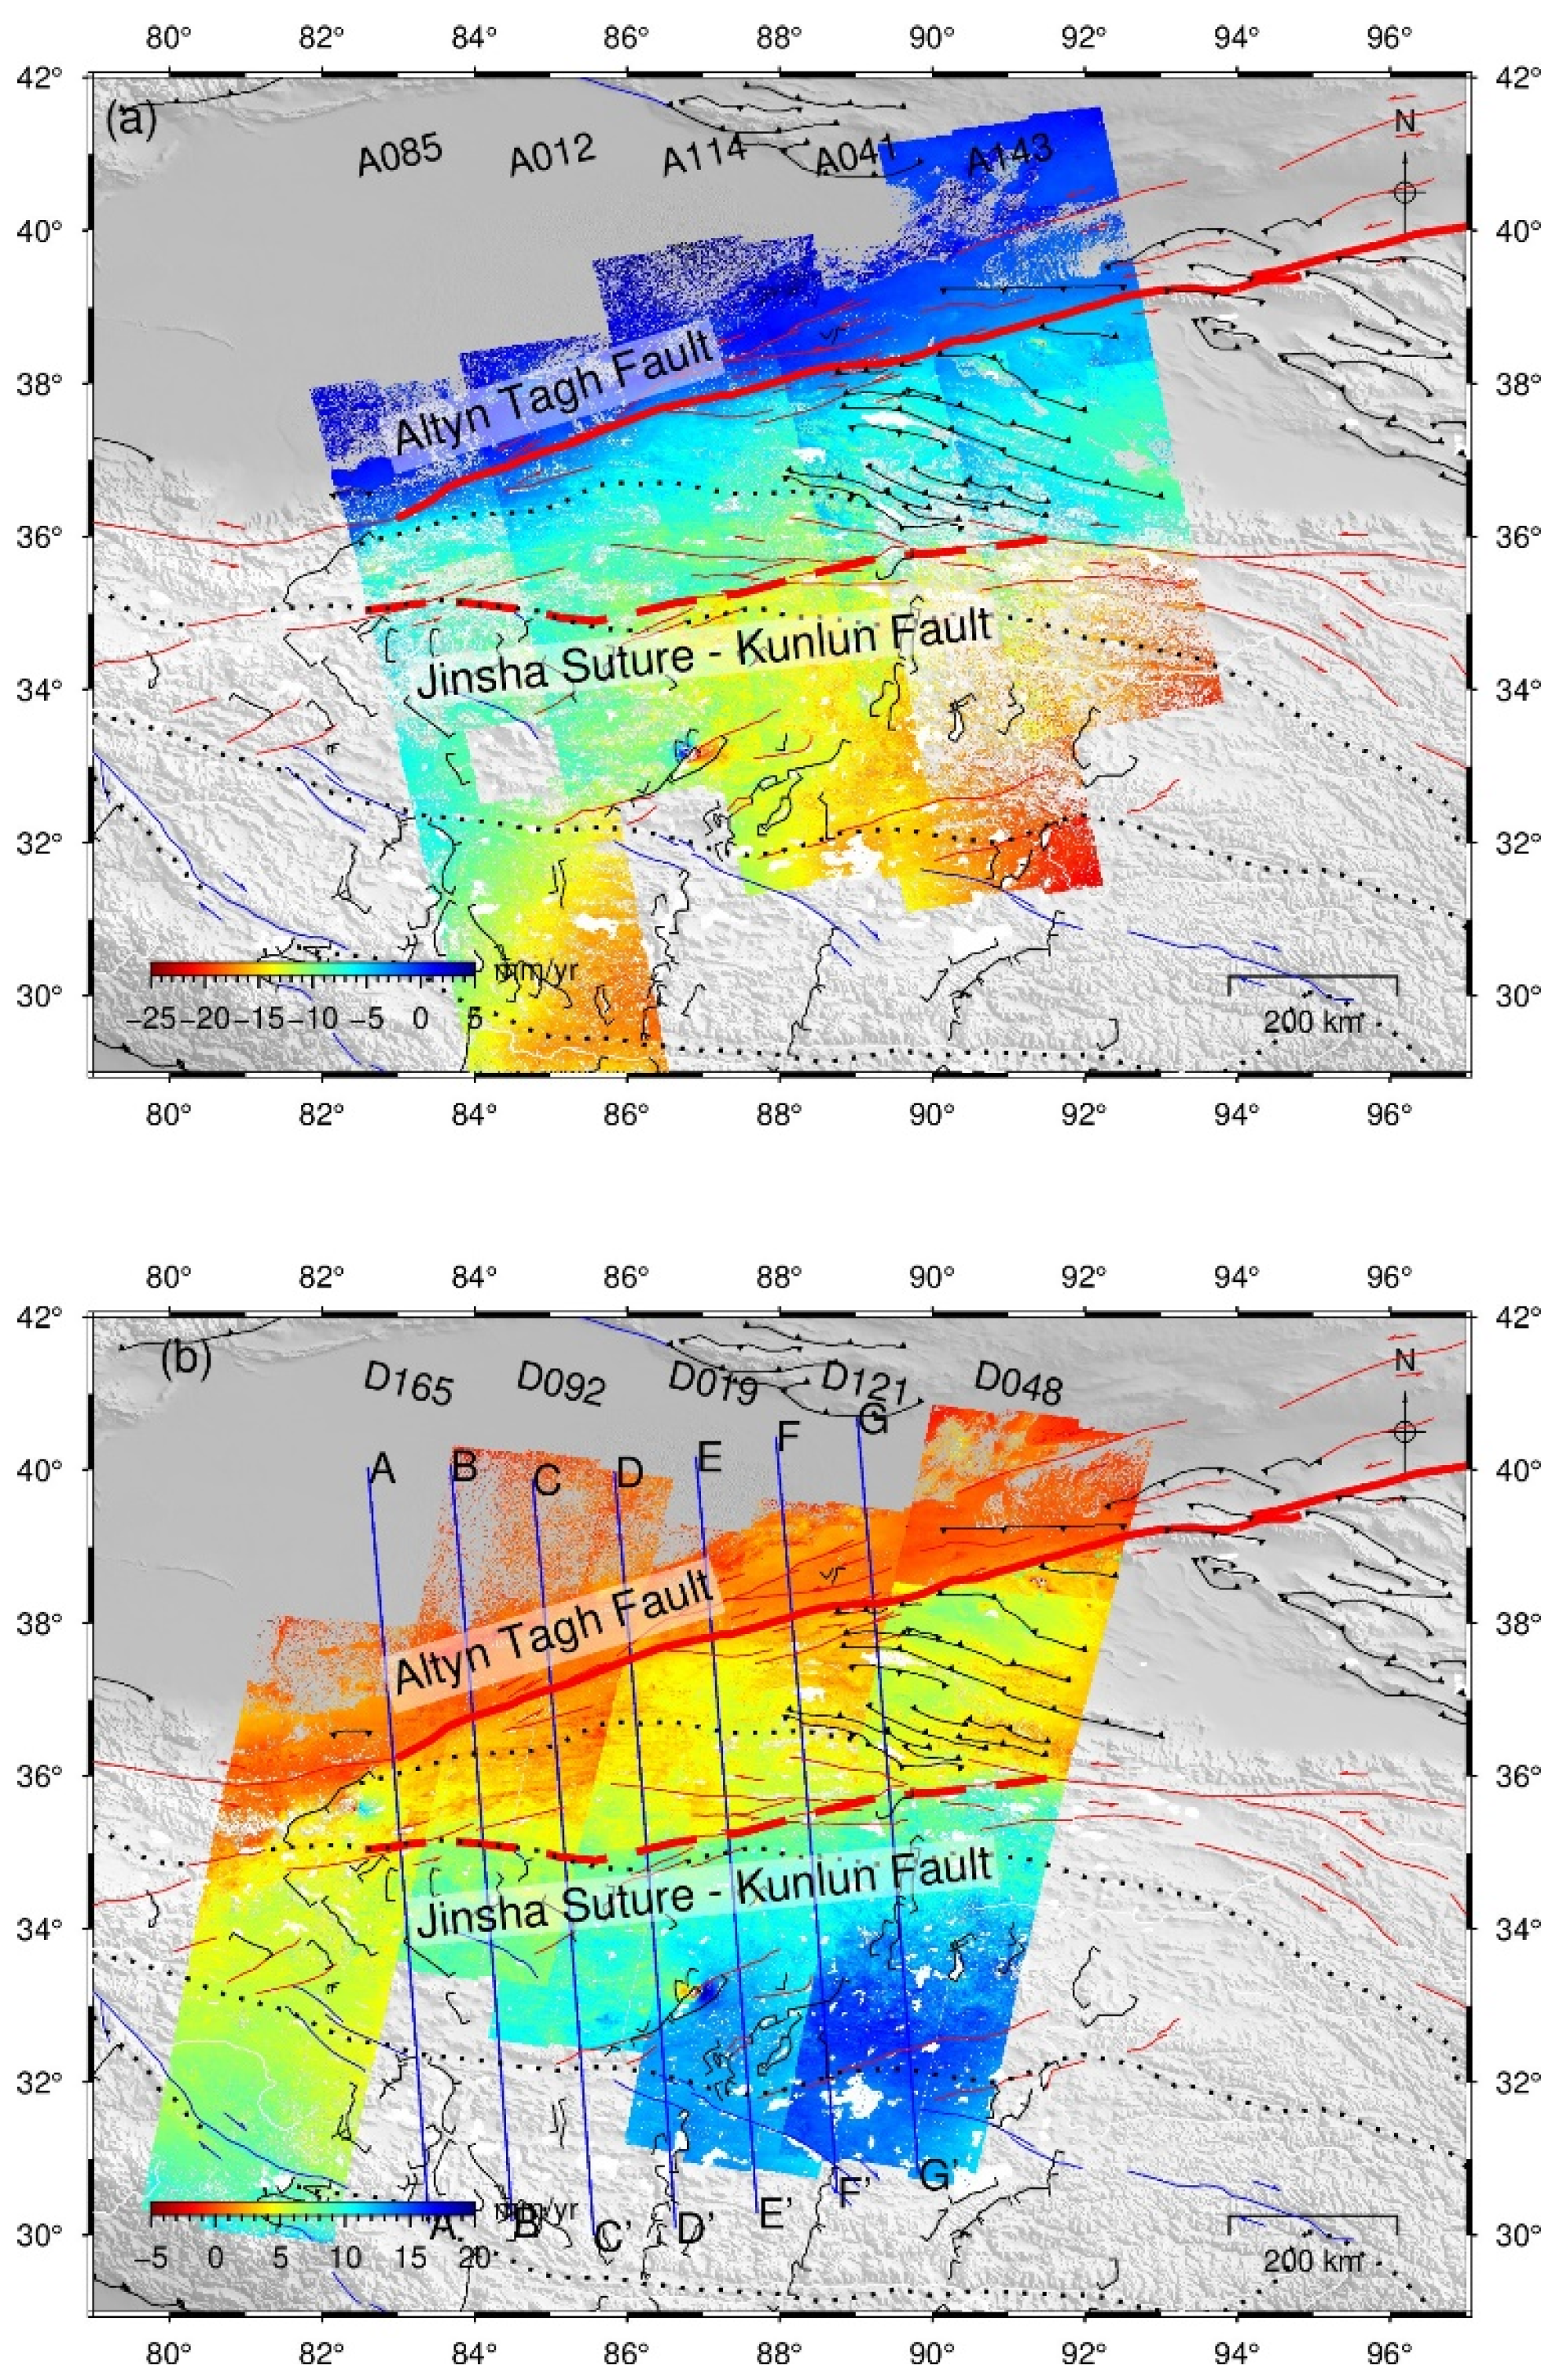
Figure 3.
InSAR-derived 3D crustal velocity fields of northwestern Tibetan Plateau. (a) East-west; (b) North-south; (c) Uplift. Purple arrows are GNSS horizontal velocity vectors [45], relative to Tarim Basin.
Figure 3.
InSAR-derived 3D crustal velocity fields of northwestern Tibetan Plateau. (a) East-west; (b) North-south; (c) Uplift. Purple arrows are GNSS horizontal velocity vectors [45], relative to Tarim Basin.
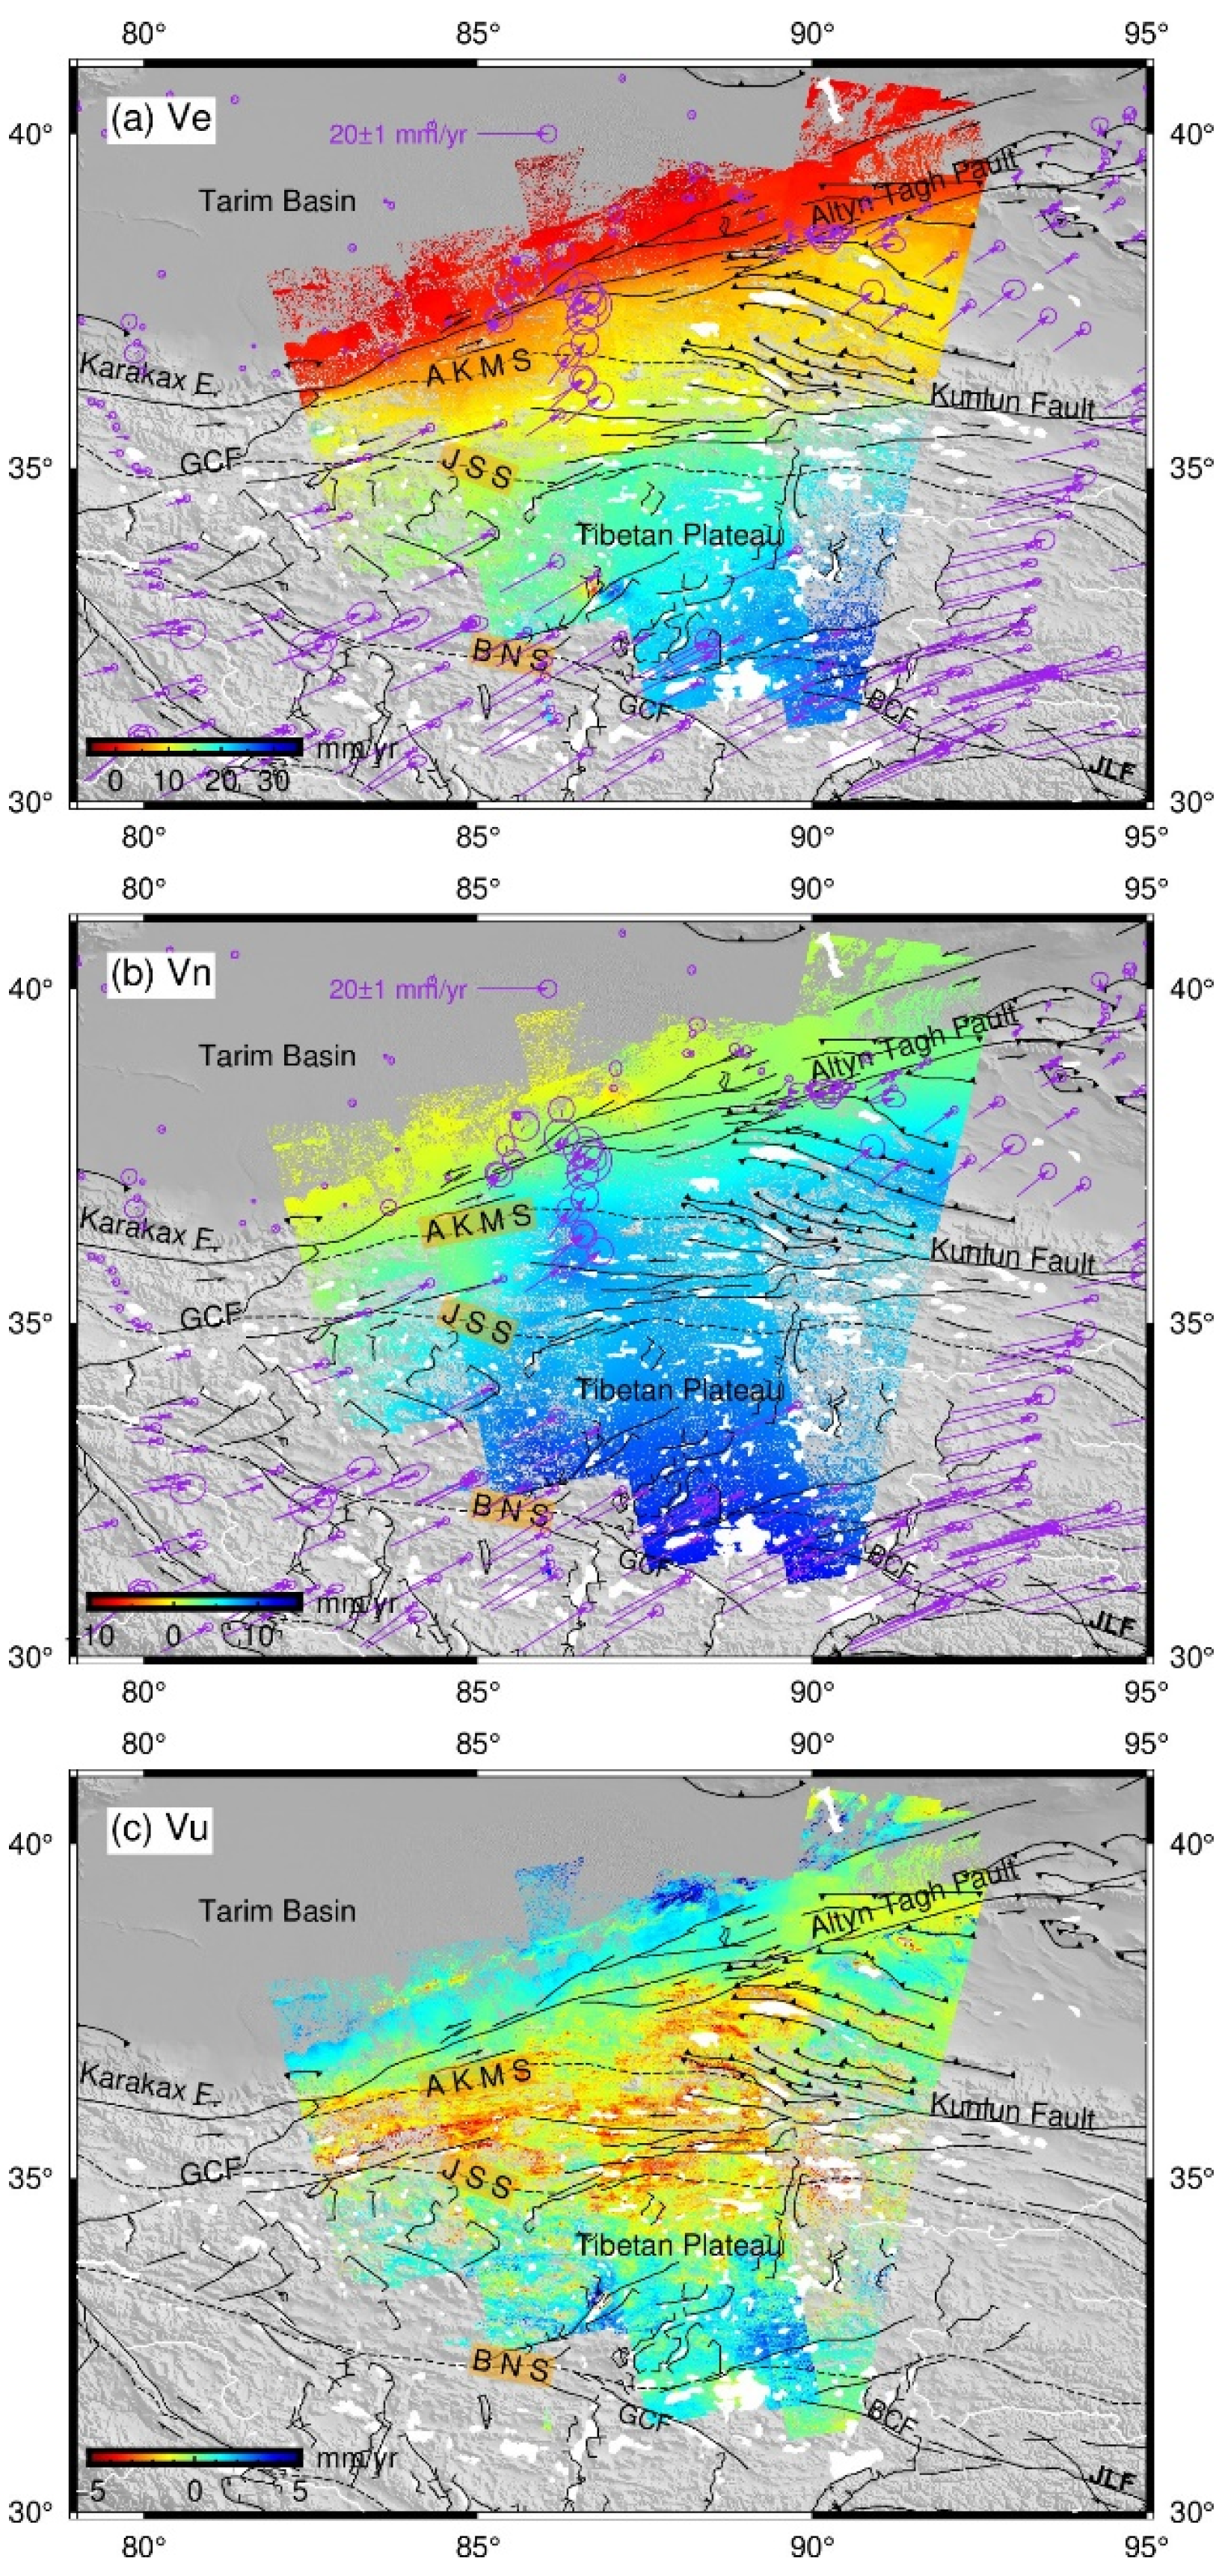
Figure 4.
Fault-parallel (strike-slip) velocity profiles across the northwestern Tibetan Plateau. Profile locations are shown in Figure 2b. Positive velocities indicate moving eastward. Blue dots are InSAR-derived fault-parallel velocities. Yellow dots represent interpolated GNSS velocities. Red solid lines are best-fit model. The numbers are optimal estimates of strike-slip rates and locking depths. The dashed lines indicate mapped fault traces; and the shaded rectangle shows best-fit range of fault trace. H-A: the HF-AKMS; J-K: the JSS-MCF-KLF.
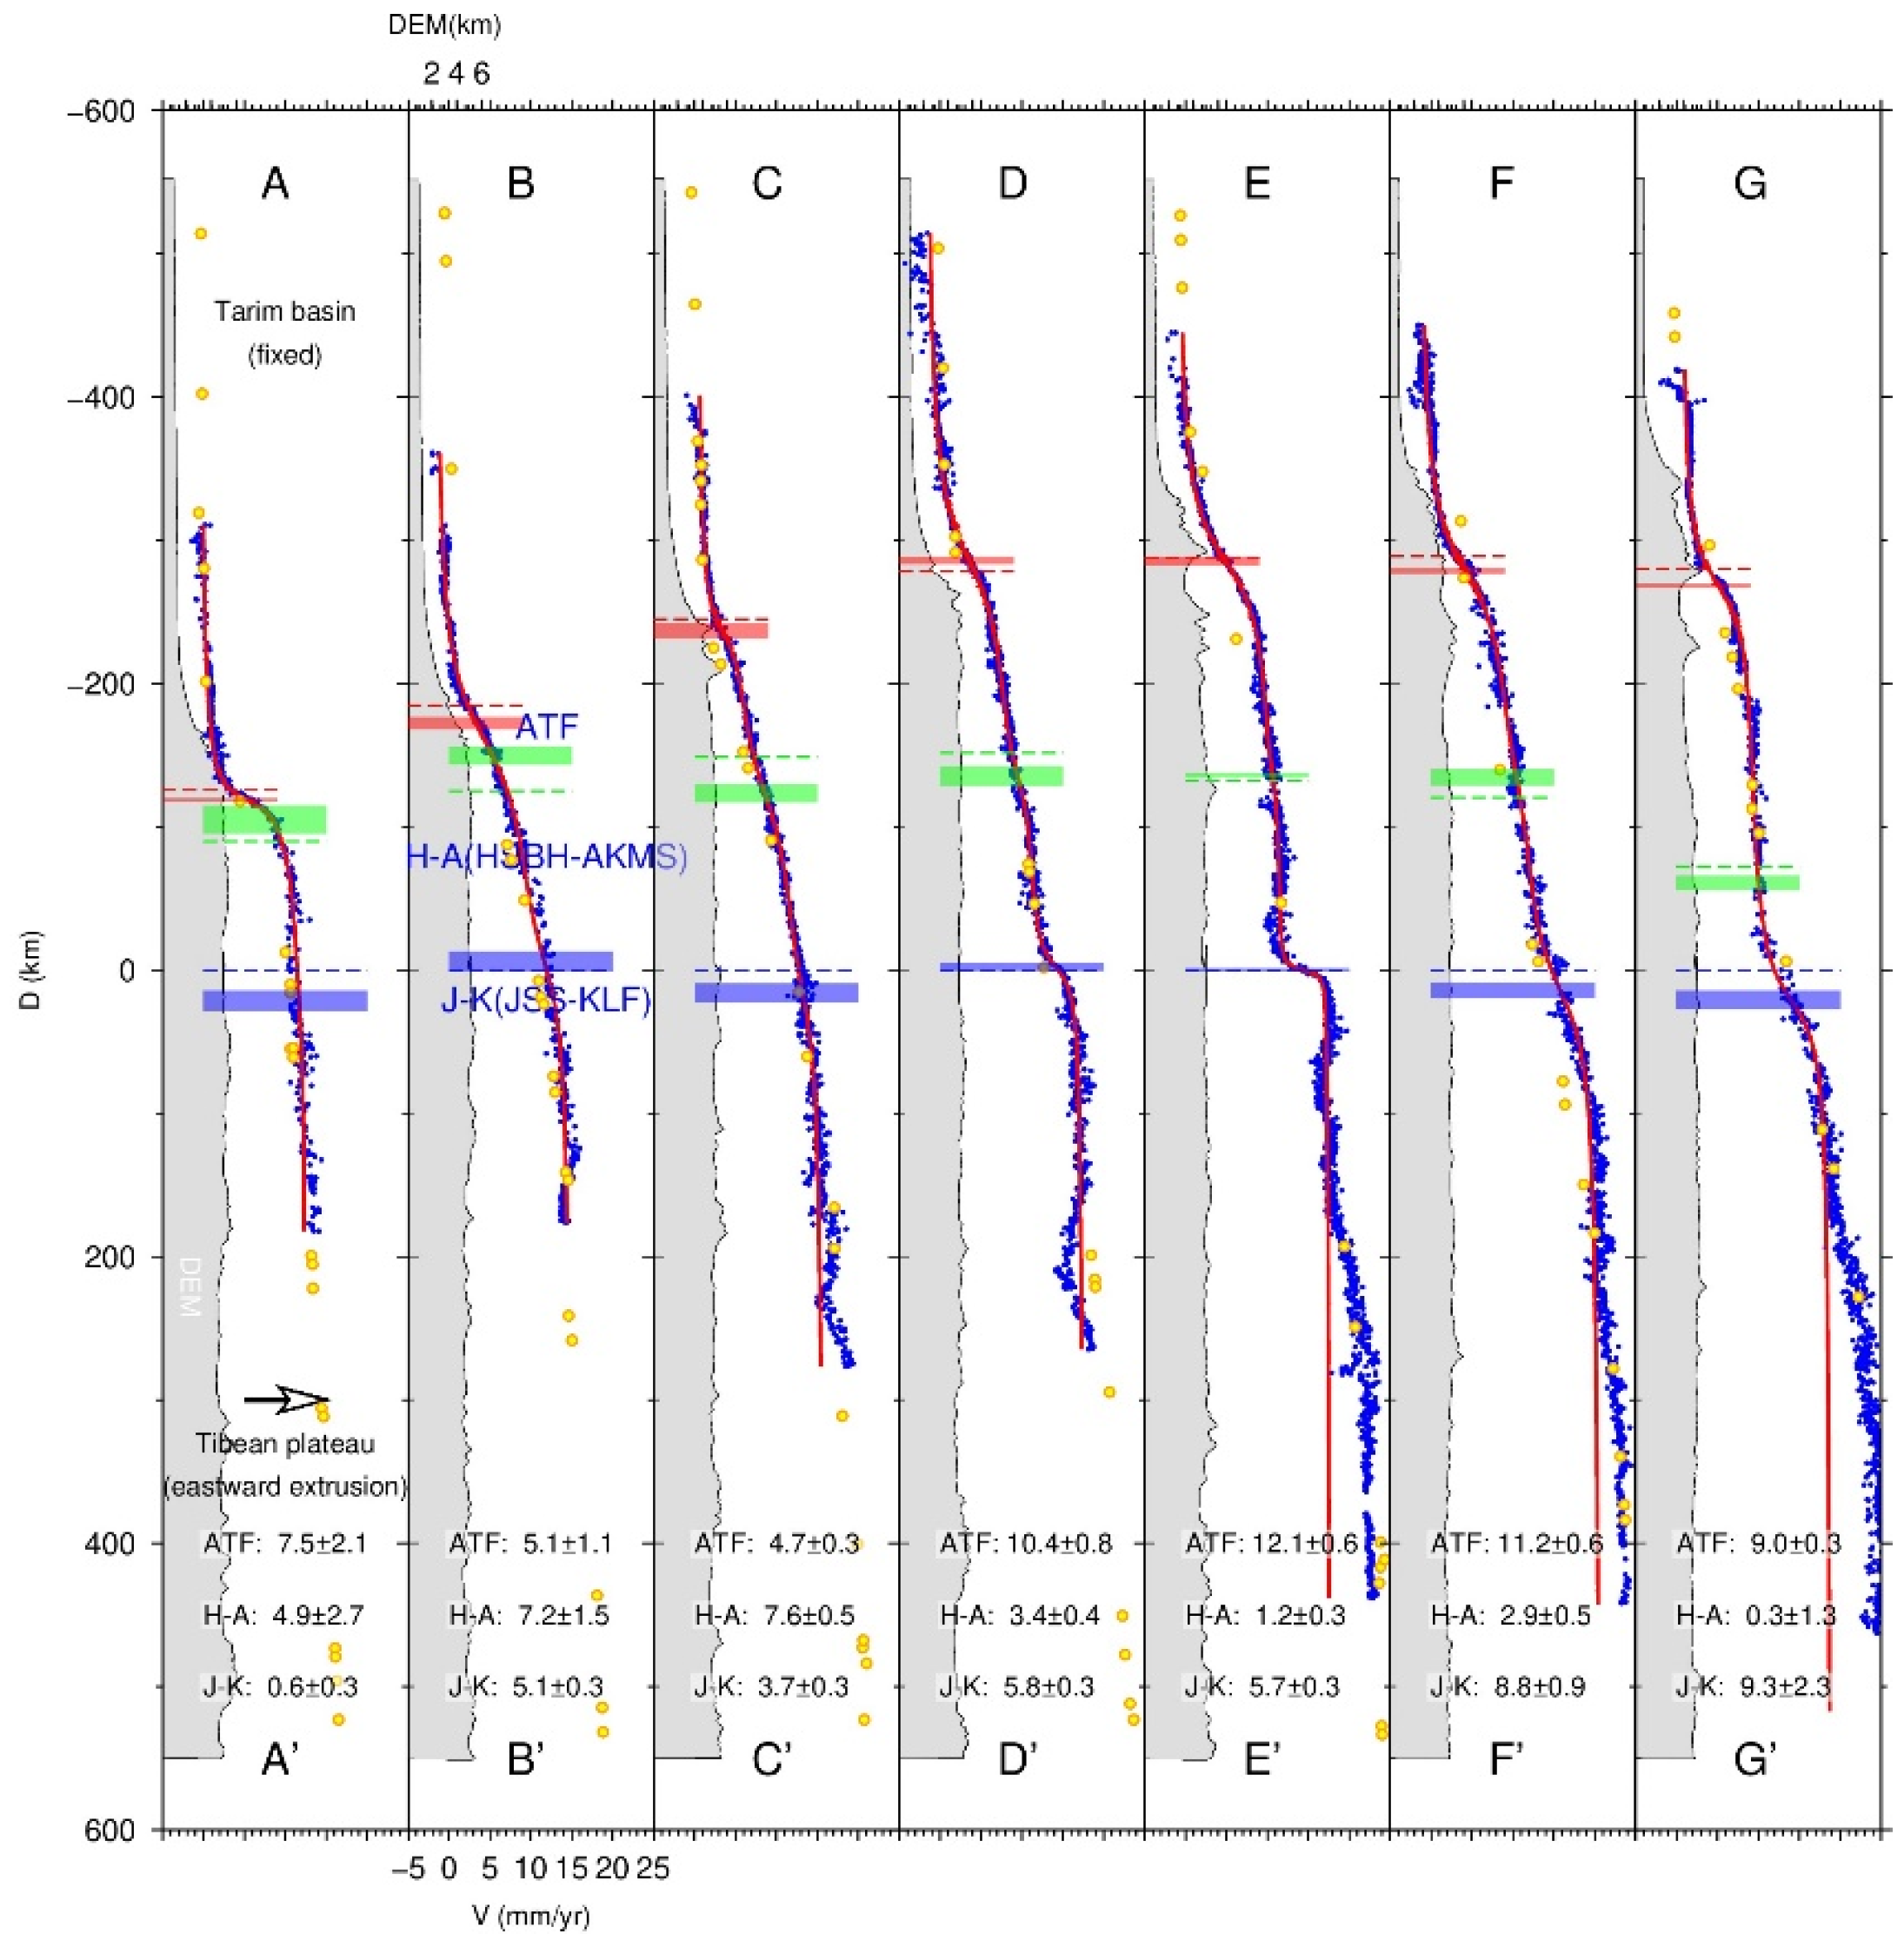
Figure 5.
Inversion results for active faults in northwestern Tibetan Plateau. (a) Fault trace shifts estimates. The dashed green lines indicate mapped fault trace. Vertical bars indicate range of fault trace shift estimates. (b) Slip rates and locking depths estimates. The size and color of circle represents slip rate and locking depth, respectively. Beach balls are earthquake mechanism from GCMT.
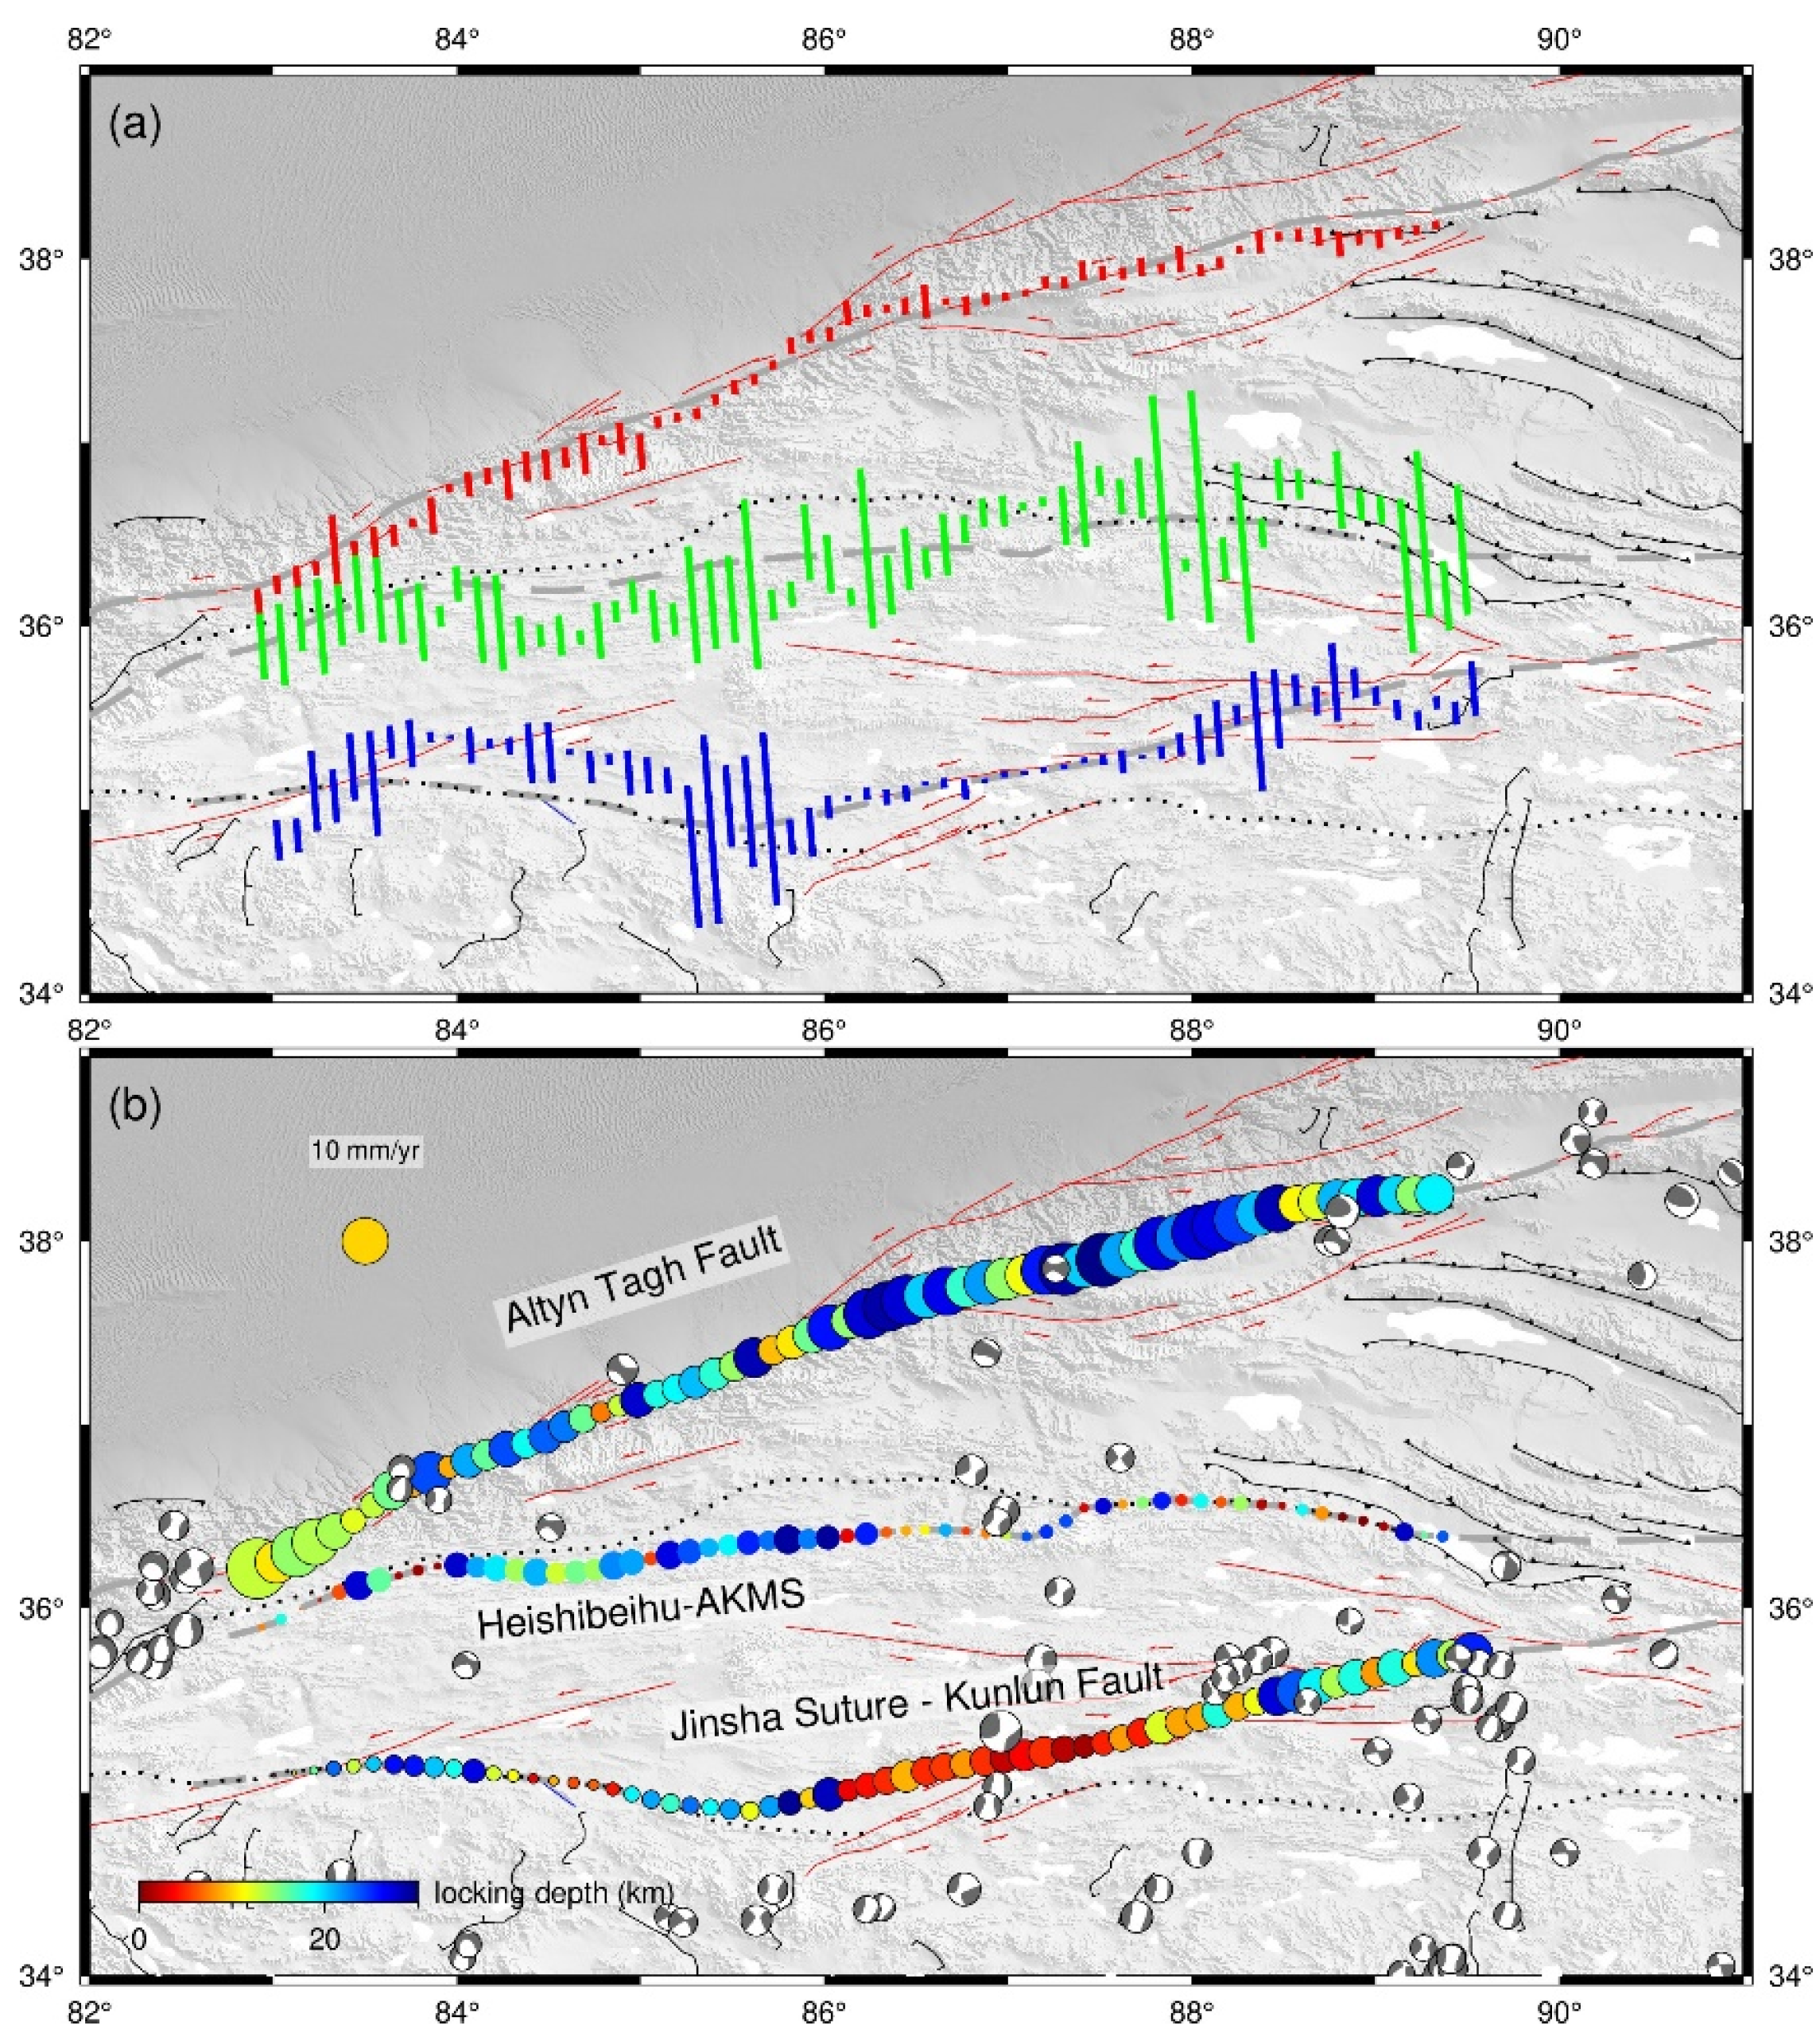
Figure 6.
Asymmetry analysis using the modified half-space elastic dislocation model considering rigidity contrast. (a) Profile locations. (b) Crustal rigidity (K) inversion results.
Figure 6.
Asymmetry analysis using the modified half-space elastic dislocation model considering rigidity contrast. (a) Profile locations. (b) Crustal rigidity (K) inversion results.
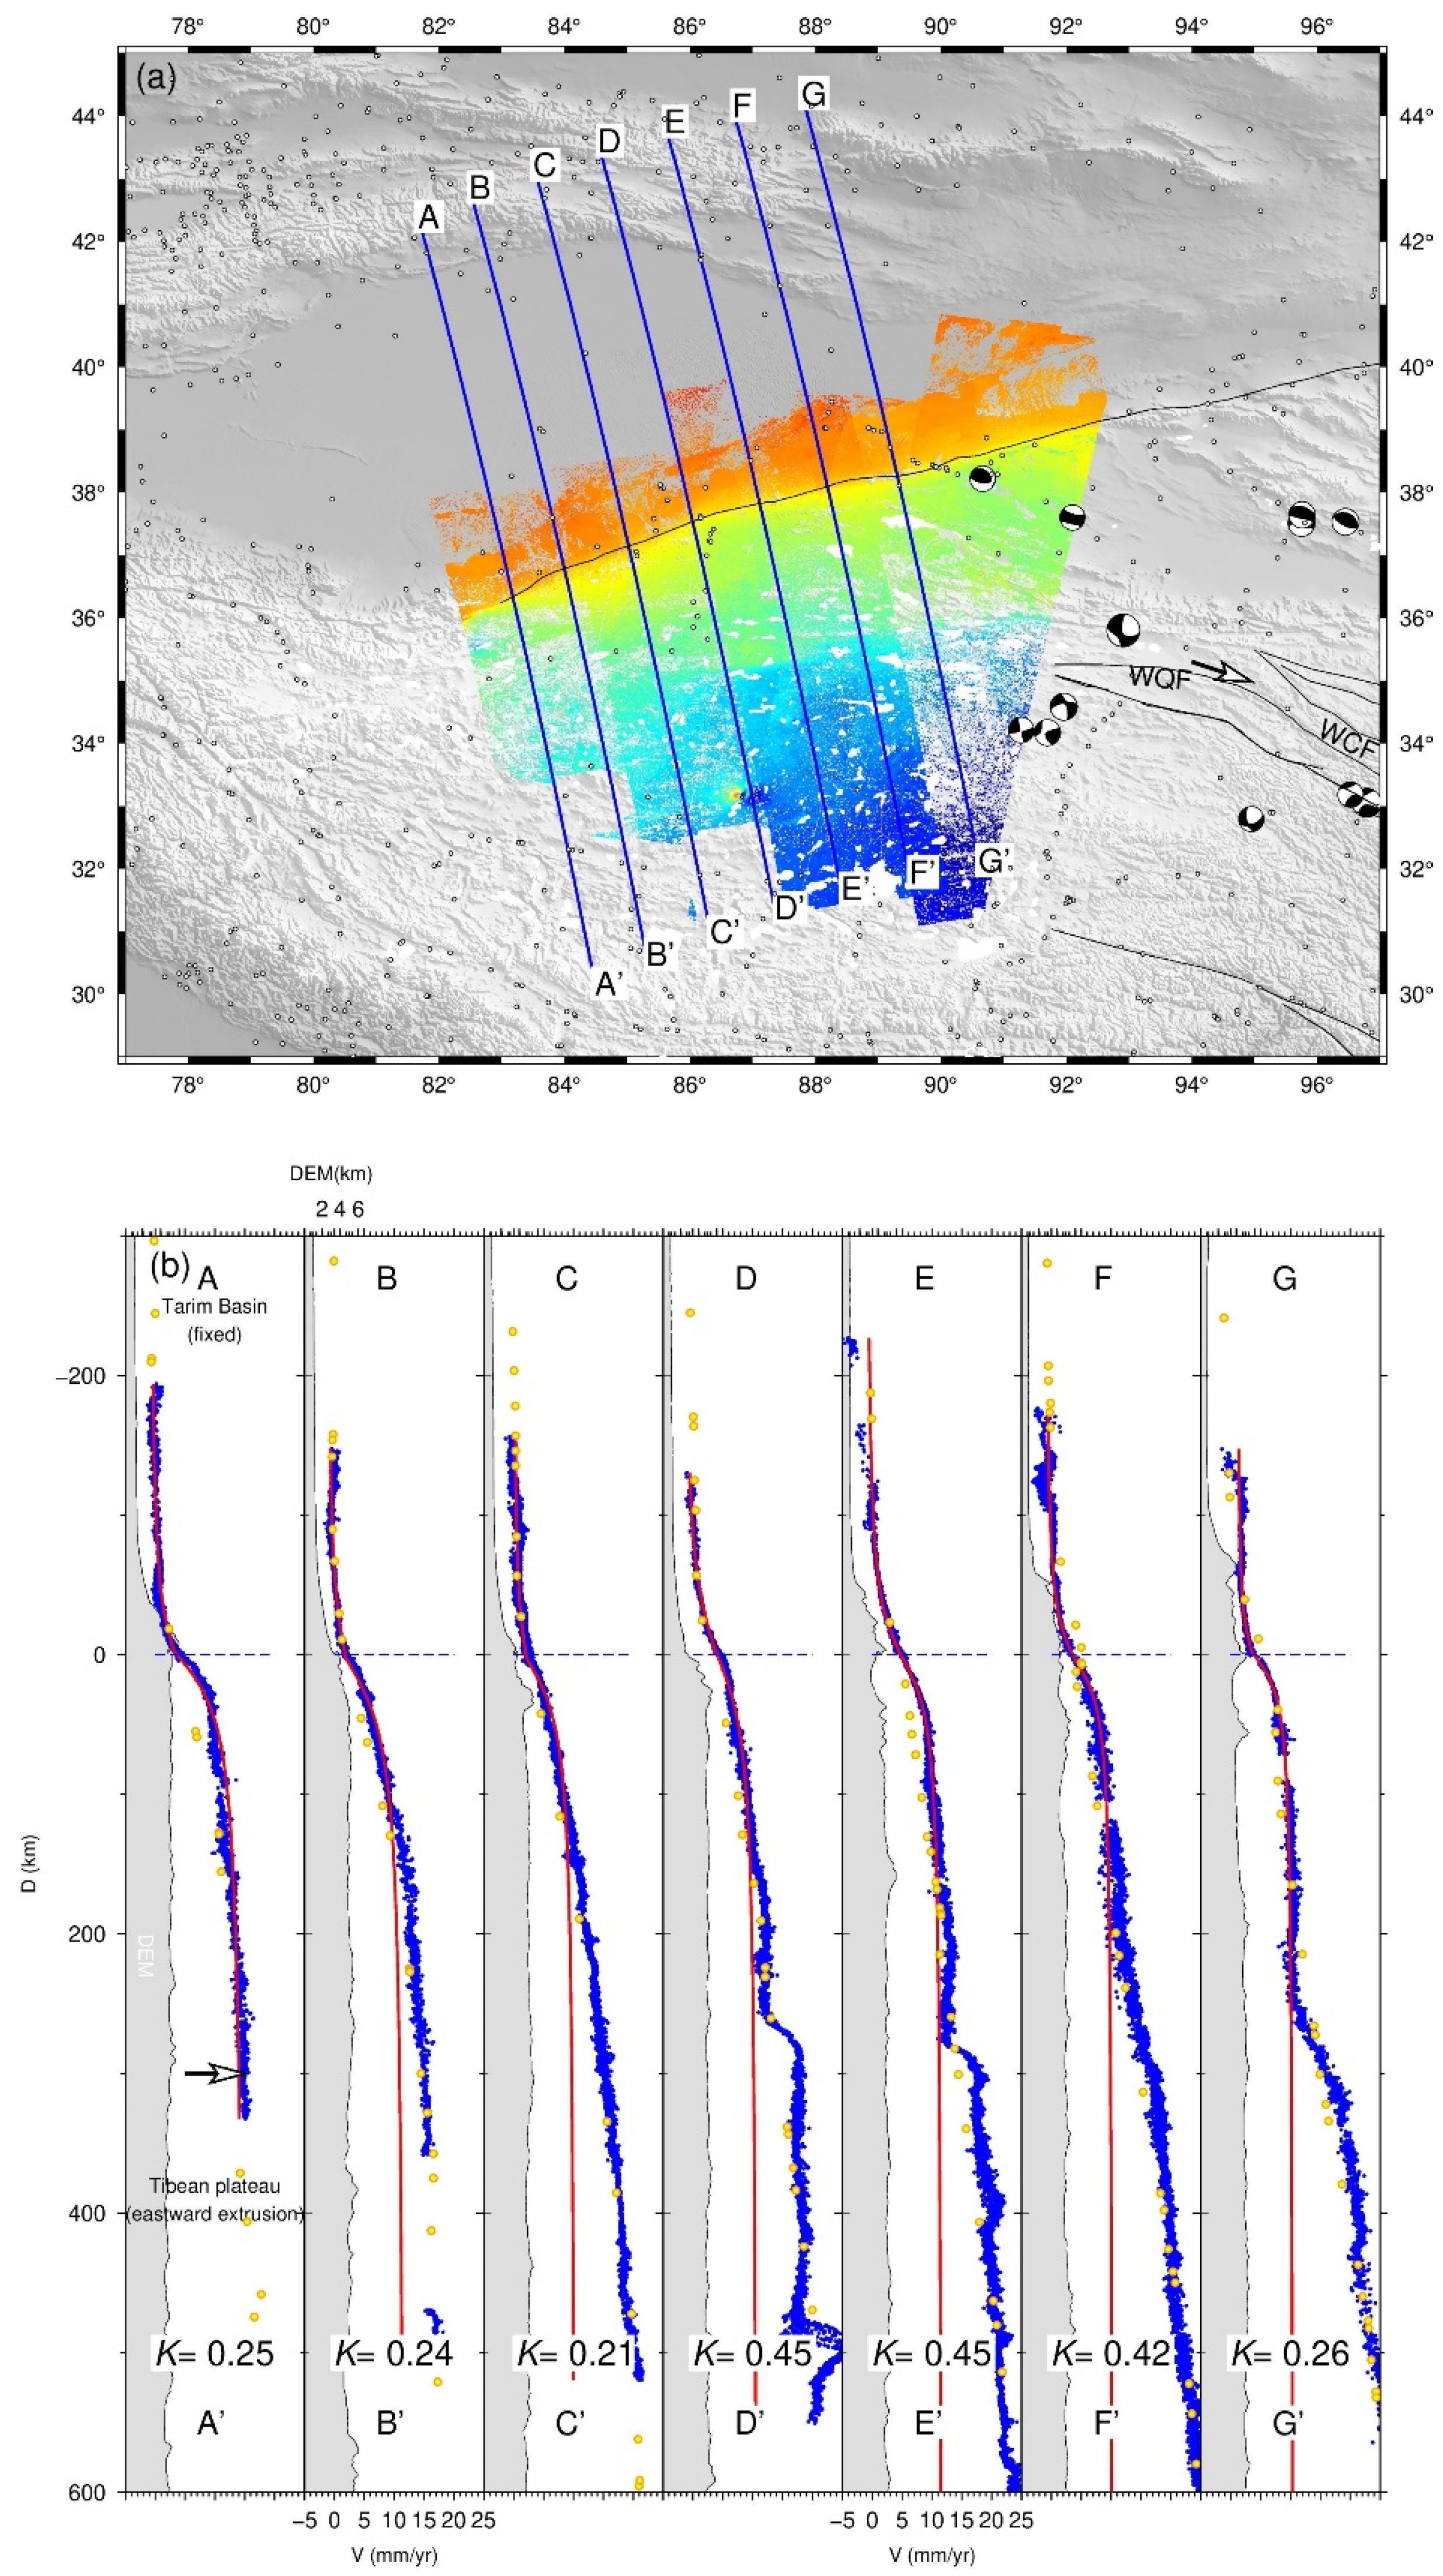

Table 1.
Sentinel-1 data used this work.
| Track | Track direction | ASF Frames | Starting Time | Ending Time | #Acquisitions | #Interferograms | |
|---|---|---|---|---|---|---|---|
| 85 | Ascending | 0088-0119 | 2014-11-16 | 2022-03-03 | 164-182 | 557-1300 | |
| 12 | Ascending | 0104-0129 | 2014-12-29 | 2023-04-10 | 57 | 557 | |
| 114 | Ascending | 0100-0125 | 2014-11-06 | 2023-11-07 | 120 | 546 | |
| 41 | Ascending | 0099-0124 | 2014-10-20 | 2023-02-23 | 60 | 101 | |
| 143 | Ascending | 0105-0130 | 2014-10-15 | 2021-04-17 | 154 | 739-1300 | |
| 165 | Descending | 0467-0492 | 2014-10-29 | 2023-02-08 | 63 | 258 | |
| 92 | Descending | 0460-0480 | 2014-10-12 | 2022-10-30 | 54 | 800 | |
| 19 | Descending | 0461-0481 | 2014-10-31 | 2024-02-29 | 57-155 | 238-323 | |
| 121 | Descending | 0462-0487 | 2014-10-26 | 2023-03-25 | 48 | 459 | |
| 48 | Descending | 0457-0487 | 2014-11-01 | 2023-04-01 | 54-160 | 103-1300 | |
Table 2.
Parameters used in MCMC analysis
| Symbol | Parameter Description | Initial value | Searching ranges |
|---|---|---|---|
| S | slip rate (mm/yr) | 10 | [-20, 20] |
| D | locking depth (km) | 10 | [0, 50] |
| γ | fault track offset (km) | 0 | [-30, 30] |
| μ | velocity offset | Mean of data | Range of data |
Disclaimer/Publisher’s Note: The statements, opinions and data contained in all publications are solely those of the individual author(s) and contributor(s) and not of MDPI and/or the editor(s). MDPI and/or the editor(s) disclaim responsibility for any injury to people or property resulting from any ideas, methods, instructions or products referred to in the content. |
© 2025 by the authors. Licensee MDPI, Basel, Switzerland. This article is an open access article distributed under the terms and conditions of the Creative Commons Attribution (CC BY) license (http://creativecommons.org/licenses/by/4.0/).
Copyright: This open access article is published under a Creative Commons CC BY 4.0 license, which permit the free download, distribution, and reuse, provided that the author and preprint are cited in any reuse.


