
Submitted:
10 March 2025
Posted:
11 March 2025
You are already at the latest version
Abstract
Long-term industrialization has led to high HCHO concentrations in North China. In this study, we analyzed the spatial and temporal distribution characteristics of tropospheric HCHO VCD and its driving factors in North China from 2019 to 2023 based on the HCHO daily dataset from TROPOMI. The results showed that the spatial distribution trend of tropospheric HCHO VCD in North China remained unchanged in the past 5 years, with the highest in the center, followed by the east and the lowest in the west. Seasonal variations were clearly characterized, with summer being higher than other seasons and spring being the lowest. In addition, the effects of meteorological elements on HCHO VCD were analyzed based on the ERA5 dataset, and the correlation between HCHO VCD and temperature and wind was strong, while the correlation with precipitation and surface solar radiation was low, and the effects were obviously different between the growing and non-growing seasons. Population density is directly proportional to tropospheric HCHO VCD. In this study, a higher-resolution spatial and temporal distribution model of tropospheric HCHO VCD in North China is obtained based on TROPOMI, which effectively characterizes the driving factors of HCHO VCD.
Keywords:
North China
; TROPOMI
; Tropospheric HCHO
; Growing and non-growing seasons differences
; Spatial and temporal distribution
; Driving factors
1. Introduction
Long-term high ozone concentrations in urban and industrial areas around the world have not only caused serious air quality problems[1,2],but also brought many hazards to humans, animals and crops. High concentrations of ozone inhibit plant growth and lead to reduced crop yields[2,3,4,5,6], and excessive ozone inhalation by humans can cause neurotoxic reactions, respiratory infections, or direct damage to their immune systems[7]. In the last three decades, with the rapid growth of fossil fuel use in China, the emissions of volatile organic compounds (VOCs), the chemical precursors of ozone, have increased dramatically, even exceeding those in North America and Europe, and the deterioration of ozone pollution has triggered strong social concerns acid rain, particulate matter, and more recently fine particulate matter (PM2.5) have been the focus of research and control, and in contrast, less is known about ozone and its precursors[3].
In the troposphere, ozone is mainly produced by photochemical reactions of volatile organic compounds (VOCs) and nitrogen oxides in the presence of sunlight [8]. Highly reactive VOCs have a short life cycle and undergo rapid photochemical oxidation in the atmosphere to produce HCHO, so emissions of VOCs can be inferred from HCHO concentrations[9]. Previous studies by Sillman [10] showed that HCHO can be used as an indicator of total VOCs, and Shen et al.[11] used space-based tropospheric HCHO columns to infer the long-term trend of VOCs emissions in China over the period of 2005-2016. In addition to being an important precursor of ozone, HCHO is itself a seriously hazardous air pollutant. HCHO is produced not only by human activities such as transportation, solvent use, industrial processes and coal combustion[12], but also by photochemical oxidation of methane and non-methane VOCs (e.g., isoprene emitted from natural vegetation) in the far atmosphere[13]. HCHO is listed as one of the 187 hazardous air pollutants by the U.S. Environmental Protection Agency (EPA), and short-term exposure to low concentrations of HCHO increases the risk of death from non-accidental, circulatory, and respiratory diseases[14]. The EPA found that long-term exposure to 0.08 µg/m3 HCHO concentrations over a human lifetime increases the odds of developing cancer by one in a million [15,16,17,18,19,20].
While ground-based measurements and monitoring are extremely valuable, they are often limited in terms of spatial and, in some cases, temporal coverage, making it difficult to monitor in a systematic and comprehensive manner [21,22,23]. However, the rapid development of satellite remote sensing has made up for the shortcomings of ground monitoring. Compared with ground observation, satellite remote sensing has the advantages of day-by-day observation, high spatial resolution, wide spatial coverage, etc., and avoids many interfering factors, so that satellite remote sensing can obtain a wide range of long time series of observational data, which provides a scientific data basis for HCHO monitoring[24]. Since 1996, scholars have carried out satellite observations of HCHO using a series of satellite instruments[25], and compared with previous satellite observations (e.g., GOM-2 and OMI, etc.), the newly TROPOMI satellite observations have unprecedented spatial accuracy (3.5 km×5.5 km ~ 3.5 km×7.5 km)[26] and higher signal-to-noise ratio. TROPOMI, on board the Sentinel-5 satellite, was launched on October 13, 2017, and operates in a near-polar solar orbit of 824 km, where it scans the globe daily at 13:30 local time. The high-resolution satellite measurements allow us to analyze HCHO spatial and temporal features at finer scales. The Tropospheric Monitoring Instrument TROPOMI builds on the great success of OMI[27], and its pixel resolution and instrumental stability are more advantageous for observing urban-scale HCHO pollution. Its pixel resolution and instrument stability are more advantageous for observing HCHO pollution at the urban scale. Recently, TROPOMI has been used to estimate NOx emissions [28,29,30,31,32] and their changes during COVID-19 closure [33,34,35,36,37,38,39], whereas TROPOMI-based HCHO studies are still relatively scarce. The high spatial resolution of TROPOMI makes it an excellent instrument for observing HCHO pollution on a number of small scales, e.g., within cities[40,41,42,43,44], near power plants[45,46], near ships[47], and wildfires [48,49] as well as in oil and gas operations [31,41,50].
The North China Plain (NCP) is one of the most densely populated, industrialized, and economically developed regions in China, with four distinct seasons, a warm temperate semi-humid monsoon climate, and northeasterly and southwesterly winds throughout the year. It covers Hebei, Henan, Shandong, Anhui, and northern Jiangsu, as well as most of the megacities of Beijing and Tianjin, with Beijing, Tianjin, and Hebei forming a large cluster of megacities within the NCP, known as the JJJ region. The large number of industries, coupled with transportation emissions, has led to a significant increase in anthropogenic emissions of VOCs (a prerequisite for HCHO) in the region. In addition, JJJ has a typical continental monsoon climate, suggesting that winds play an important role in the local climate and environment[51]. The NCP region is bounded by the Bohai and Yellow Seas to the east and the Taihang Mountains to the west. The north-south boundary is delineated by the Yanshan Mountains, the Dabie Mountains, and the Yangtze River.The main part of the NCP region is shown in Figure 1. In recent years, the concentration of HCHO in China has been on the rise, with the NCP being one of the more severe regions [52]. The study shows that the extreme heat during 2016-2017 led to severe O3 pollution in the North China Plain, which in turn influenced the long-term O3 trend[2]. According to a report by the Department of Environmental Protection (MEP, 2023), the NCP has a growing air pollution problem caused by the accumulation of high levels of HCHO[53]. HCHO pollution adversely affects all aspects of human life, including climate and human health[51], therefore, the study of HCHO in North China has important social and economic value.
Long-term and large-scale HCHO concentrations can be effectively obtained using satellite remote sensing technology, which provides necessary data support for understanding the causes of pollution and pollution prevention in North China. This study takes North China as the study area, analyzes the spatial and temporal distribution of HCHO as well as the interannual variation and seasonal characteristics of HCHO in North China from 2019 to 2023 based on TROPOMI observations, and explores the impacts of meteorological conditions, vegetation cover, and population density on the concentration of HCHO in the tropospheric column, with a view to providing basic data support for the improvement of air quality in North China.
2. Materials and Methods
2.1. Data Sources
This study uses the 2019-2023 HCHO dataset from TROPOMI, derived from the European Space Agency Copernicus Open Access Center (Copernicus Open Access Hub)(https://dataspace.copernicus.eu/). TROPOMI consists of four spectrometers (UV, UV-visible, NIR, and short-wave IR) covering eight non-overlapping and discontinuous spectral bands from 270 nm to 2385 nm. HCHO is obtained by spectral inversion in band 3, which is acquired by a UV-visible spectrometer with a spectral resolution of 0.5 nm. The wavelengths in band 3 range from 320 to 405 nm, and the minimum signal-to-noise ratios in this band are all 800 to 1000. nm, and the lowest signal-to-noise ratios in this band are all 800~1000. Regarding the uncertainties of the above products, previous studies have carried out comprehensive and in-depth theoretical analyses and comparative validations. In order to further reduce the relevant impact, this study filters the relevant data with the following filtering criteria: quality control coefficient (qa_value) > 0.6, solar zenith angle (SZA) < 70°, and atmospheric mass factor (AMF) > 0. 1. This study covers the period of 2019-2023, and the spatial accuracy of the corresponding data is 3.5 km×5.5 km~3.5 km×7.5 km. In this study, annual and seasonal mean data with a spatial accuracy of 0.01°×0.01° were constructed based on the daily observation data by applying the oversampling method. In order to analyze the seasonal variation characteristics, the seasonal mean was calculated based on the following criteria: March-May for spring, June-August for summer, September-November for autumn, and December-February for winter.
ECMWF Reanalysis v5 (ERA5) is the latest global reanalysis dataset of the European Center for Medium-Range Weather Forecasts (ECMWF)(https://landscan.ornl.gov/).ERA5 is based on the 4D-Var data assimilation method and the 41r2 cycle of the Integrated Forecasting System (IFS) and provides various quantities of long-term global atmospheric data, such as absolute temperature, relative humidity, and wind speed, for selectable regions, and it replaces ERA-Interim. its unique advantage is the relatively high spatial and temporal resolution, with a spatial resolution of 31×31 kilometers, and a temporal resolution of 1 hour. that provides more details of atmospheric parameters. In this study, in order to investigate the effects of temperature, precipitation, and wind speed on HCHO column concentrations, monthly mean surface temperature, monthly cumulative precipitation, and monthly mean wind speed from ERA5 were spatially correlated with monthly mean tropospheric formaldehyde column concentrations for the period 2019-2023. The ERA5 data were resampled onto a grid with the same spatial resolution as the formaldehyde column concentrations (0.01° × 0.01°), and thematic maps of the spatial distribution were generated based on the calculated correlation coefficients.
The Normalized Difference Vegetation Index (NDVI) data are derived from the MODIS terrestrial tertiary product system developed by the National Aeronautics and Space Administration (NASA), and the MOD13A3 dataset was used in this study. The data were collected and generated by the Terra polar orbiting environmental remote sensing satellite, constructed by sinusoidal projection with 1000 m spatial resolution and monthly temporal resolution, and belong to the global scale standardized processing products. The dataset significantly improves the characterization accuracy of the surface vegetation information through the unified algorithm of radiometric correction, geometric correction and elimination of atmospheric interferences (including aerosols, clouds, water vapor, etc.) on the original observation data. Thanks to its multispectral characteristics, global coverage, timeliness and open access, this product has become an important data source for vegetation cover dynamics monitoring studies. The time-series data of this study were selected from January 2019 to December 2023, totaling 60 months of continuous observation series.
The LandScan global vital statistics database was developed by the U.S. Department of Energy's Oak Ridge National Laboratory (ORNL) and published by East View Cartographic. The database integrates GIS and remote sensing technologies to build a high-precision vital statistics system through spatial distribution modeling, and has become an internationally recognized benchmark dataset for demographic analyses in socio-economic fields due to its superior geospatial positioning accuracy (with the optimal resolution globally) and data reliability. The LandScan dataset is a comprehensive, high-resolution global population distribution dataset, and a valuable resource for a wide range of applications. The LandScan dataset is a comprehensive high-resolution global population distribution dataset, which is a valuable resource for a wide range of applications. Utilizing state-of-the-art spatial modeling techniques and advanced geospatial data sources, LandScan provides detailed information on population size and density at a resolution of 30", allowing for an accurate and up-to-date understanding of human settlement patterns on a global scale. With its accuracy and granularity, LandScan supports a wide range of fields such as urban planning, disaster response, epidemiology, and environmental research, making it an important tool for policymakers and researchers to understand and address a wide range of social and environmental challenges on a global scale. In this study, year-by-year population data from 2019-2023 were selected to analyze the distribution of population density and HCHO column concentration in different regions.
2.2. Modeling of Inter-Annual Variability
In this study, a model was constructed to simulate the annual growth rate of tropospheric HCHO column concentration in North China:
where Y is the monthly mean of tropospheric HCHO concentration, n denotes the number of months from 2019-2023, indicates a linear trend in tropospheric HCHO column concentration, A is the annual growth rate of HCHO and B represents the intercept, indicates the trend in the seasonal cycle of monthly average HCHO column concentrations, and is the coefficient of variation of the seasonal cycle.
In addition, in order to measure the merit of the model, the following two equations were used in this study to calculate the correlation coefficients, R and RMSE, between the simulated HCHO column concentration and the measured HCHO column concentration:
where Vmea denotes the measured HCHO column concentration, Vsim denotes the simulated HCHO column concentration, the variable with the horizontal line above denotes the mean value of the variable, and N is the total number of months from 2019-2023.
2.3. Calculation of the Correlation Between Each Influencing Factor and HCHO Column Concentration
In this study, based on the monthly mean surface temperature, monthly cumulative precipitation, and monthly mean wind speed data from the European Center for Medium-Range Weather Forecasts (ECMWF) fifth-generation reanalysis data (ERA5) and the monthly mean products of formaldehyde (HCHO) column concentration from the TROPOMI satellite inversion, a spatially gridded analysis method is used to carry out a spatial correlation study on a month-by-month scale over the period of 2019-2023 by integrating the ERA5 data and HCHO column concentration data were unified to a 0.01° × 0.01° spatial grid by bilinear interpolation. The grid-point-by-grid-point Pearson correlation coefficient method was used for correlation calculation:
where Ti,j,t and Hi,j,t denote the ERA5 data with HCHO column concentration at month t of grid point (i,j), respectively, and the variable with a horizontal line above it denotes the mean value of the variable, n = 60 months.
3. Results and Discussion
3.1. Spatial and Temporal Distribution Characteristics of Formaldehyde in North China
The tropospheric column concentrations of HCHO in North China for the last five years from 2019 to 2023 were observed based on the Sentinel-5P satellite TROPOMI sensor. As shown in Figure 2, from 2019 to 2023, the tropospheric HCHO column concentration in North China is 1.76×10⁻⁴ mol m-2 in the last five years, which is significantly higher than that in the neighboring provinces, such as Henan, Anhui, Gansu, and Inner Mongolia. Based on the topography and geographic location, we divided North China into three regions: western region, central region, and eastern region (as shown in Figure 1), and the distribution characteristics of HCHO column concentration in these three regions are obviously different. The western region is located along the Loess Plateau and Qinling Mountains, sparsely populated, industrially underdeveloped, and economically backward, and has the lowest tropospheric column concentration of HCHO, with a 5-year average of 1.65×10⁻⁴ mol m-2. The central region is dominated by the Taihang Mountains and the North China Plain, and the eastern region and the mountainous hills, with populations mainly concentrated in the central and eastern regions, have relatively high tropospheric column concentrations of HCHO, which are respectively 2.23×10⁻⁴ mol m-2, and 1.90×10⁻⁴ mol m-2.
From 2019 to 2023, the spatial distribution of HCHO tropospheric column concentrations in and around North China remains largely unchanged, with the central region consistently maintaining the highest HCHO tropospheric column concentrations (Figure 3). The tropospheric HCHO column concentration in North China shows an overall increasing trend, however, the central and eastern parts of North China show a decreasing and then increasing trend over the past 5 years, while the western part increases steadily. In order to investigate the monthly and interannual variation characteristics in North China, this study calculated the monthly average of tropospheric HCHO column concentrations in North China from 2019 to 2023 (Figure 4A). Statistically, the percentage of valid data in each month is above 70%, which is sufficient to ensure the accuracy of the time series of tropospheric HCHO column concentration. The HCHO tropospheric column concentrations in North China show significant and regular monthly variations, with a maximum in June-August and a minimum in February-April, and the peak patterns are slightly different from the general variations in other studies[15]. To quantify the interannual variability of tropospheric HCHO column concentrations, we fit monthly mean HCHO data using linear equations with seasonally varying sine and cosine functions (Equation (1)). The fitting parameter A of the modeling function represents the slope and is used to estimate the growth rate of the HCHO tropospheric column concentration. As shown in Figure 4A, the model successfully captured the monthly-averaged trend of tropospheric HCHO column concentration in North China. The modeled tropospheric HCHO column concentrations and the monitored HCHO data are strongly correlated with a correlation coefficient R of 0.895 and a root mean square error RMSE of 0.079 (Table 1). The fitting results show that the HCHO tropospheric column concentration in North China shows a significant positive trend, with a growth rate of 1.37×10⁻⁶ mol m-2 yr-1, or about 3.70% yr-1, from 2019 to 2023, which is much higher than the growth rate of HCHO in North China from 2005 to 1.80% yr-1 in 2016[11]. The anomalous increase in the tropospheric column concentration of HCHO in North China was unexpected because most of the world shows a decreasing trend in the tropospheric HCHO column concentration.
Similarly, this study used the same methodology to investigate the variation characteristics of HCHO tropospheric column concentrations in western, central and eastern North China over the last 5 years. As shown in Figure 4B-D, the tropospheric column concentrations of HCHO in both the central and eastern regions follow a similar monthly variation pattern, reaching a maximum in June-July and a minimum in March-April. In contrast, a bimodal distribution was observed in the western region, with the first peak occurring in June-July, the second peak in ovember-December, and the minimum in March-April, which is consistent with the trend in northern China. The simulated HCHO tropospheric column concentrations are closely correlated with satellite monitoring data, with correlation coefficients R values of 0.90, 0.89, 0.87, and 0.76 for North, West, Central, and East China, respectively. The fitting results show that the tropospheric HCHO column concentrations in the western part of North China show an increasing trend from 2019 to 2023, with an annual growth rate of 1.93×10⁻⁶ mol m -2 yr-1, however, the central region shows a clear decreasing trend with an annual growth rate of -1.22×10⁻⁶ mol m-2 yr-1, and the eastern region shows little change with a 5-year annual growth rate of only 0.15×10⁻⁶ mol m -2 yr-1, as shown in Figure 3. However, as shown in Figure 2, the annual mean HCHO tropospheric column concentration from 2019 to 2023 is highest in the central region at 2.23×10⁻⁶ mol m -2 yr-1, followed by 1.90×10⁻⁶ mol m -2 yr-1 in the eastern region, and the lowest was 1.65×10⁻⁶ mol m-2 yr-1 in the western region.
In addition, the 5-year time evolution characteristics of the tropospheric HCHO column concentrations in eight typical cities in North China, including Beijing, Jinan, Qingdao, Shijiazhuang, Taiyuan, Tianjin, Xi'an, and Zhengzhou, were also studied (Figure 4 E-L). The HCHO column concentration of the city is the tropospheric HCHO column concentration within the latitude and longitude ± 0.5° of the city center range. Xi'an, located in the western region, has the largest annual growth rate of 2.13×10⁻⁶ mol m-2 yr-1 but the lowest 5-year mean HCHO tropospheric column concentration of 1.51×10⁻⁴ mol m-2. The 2019 to 2023 mean HCHO VCD is highest in Taiyuan and Shijiazhuang, 2.22×10⁻⁴ mol m-2 and 2.19×10⁻⁴ mol m-2, respectively, but their annual growth rates are the lowest, 0.35×10⁻⁶ mol m-2 yr -1, 0.14×10⁻⁶ mol m-2 yr-1. Jinan, Tianjin, and Zhengzhou show a decreasing trend, with annual growth rates of -0.55×10⁻⁶ mol m-2 yr-1, - 0.94×10⁻⁶ mol m-2 yr-1, -1.59×10⁻⁶ mol m-2 yr-1, whereas the 5-year averages of Jinan, Tianjin, and Zhengzhou were higher than those of North China (1.76×10⁻⁴ mol m-2), which are 2.15×10⁻⁴ mol m-2, 2.04×10⁻⁴ mol m-2, and 2.15×10⁻⁴ mol m-2, respectively.The tropospheric column concentration of HCHO in Beijing grows slowly from 2019 to 2023 with an annual growth rate of 0.61×10⁻⁶ mol m-2 yr-1 and an average HCHO tropospheric column concentration of 2.02×10⁻⁴ mol m-2. Table 1 lists the 5-year average tropospheric HCHO VCD in North China, the annual growth rate, the simulated and measured values between the correlation coefficients R and RMSE in detail.
Previous studies have shown that HCHO VCD generally has significant seasonal characteristics[54]. The distribution and boxplots of the 5-year seasonal mean tropospheric HCHO VCD in North China from 2019 to 2023 are shown in Figure 5A and B, respectively. As shown in the figures, the tropospheric HCHO VCD shows similar seasonal variation characteristics in different regions of North China, all of which reach a maximum in summer and a reaches a minimum in spring, and remains basically flat in fall and winter. Similarly, the typical urban areas also maintain similar seasonal variation characteristics, i.e., the maximum value is reached in summer, the minimum value is reached in spring, and the magnitude of the tropospheric HCHO VCD values in fall and winter is located between spring and summer, and the magnitude of the tropospheric HCHO VCD values in autumn and winter is not comparable to each other. From the seasonal distribution map, it is still the highest in the center, followed by the east and the lowest in the west.
3.2. Factors Affecting Tropospheric HCHO Column Concentrations in North China
Many factors can affect the concentration of HCHO[25,55,56,57,58].Based on previous studies, the influencing factors that may affect HCHO VCD in North China were selected for this study.
The effect of temperature on HCHO concentrations was first explored. Monthly surface temperature data from ERA5 were selected for correlation analysis with monthly mean tropospheric HCHO VCD data from 2019 to 2023, and this operation was performed on a grid per 0.1° × 0.1°. We divided the study period into the growing season (March-November) and the non-growing season (December-February), and generated spatial distribution maps based on the calculated correlation coefficients, which are shown in Figure 6A (growing season) and Figure 6B (non-growing season), respectively. The results showed that in the growing season, temperature and HCHO VCD were positively correlated, and the correlation coefficient R was high, with a mean value of 0.50, with the highest value of 0.63 in Jinan, followed by 0.61 in Shijiazhuang, and 0.59 and 0.58 in Tianjin and Taiyuan, respectively, while in the non-growing season, they were negatively correlated to varying degrees, with a mean value of -0.1, with the values of R in Beijing, Shijiazhuang, and Beijing reaching -0.41. During the growing season, high temperatures favor the oxidation of volatile organic compounds[59],which increases the atmospheric concentration of formaldehyde, whereas for the non-growing season, low winter temperatures require coal heating, which consumes a large amount of fossil fuels such as coal and leads to the emission of formaldehyde and volatile organic compounds, so that the temperature is positively correlated with the concentration of formaldehyde during the growing season, and negatively correlated with the temperature and the concentration of formaldehyde during the non-growing season.
We used the same method to study the effect of precipitation on HCHO concentration, which is an indirect factor affecting the concentration of formaldehyde columns, and Figure 7A (growing season) and B (non-growing season) shows the spatial distribution of correlation coefficients between HCHO concentration and precipitation in North China from 2019 to 2023. The average R value in the growing season is 0.22, with positive correlation and positive R values in eastern, central, and western North China as well as in typical urban areas, with Zhengzhou and Xi'an being the highest, 0.32 and 0.28, respectively.The average R value in the non-growing season is -0.11, with positive correlation and positive correlation in central North China, with Qingdao having an R value of 0.29, Zhengzhou having an R value of 0.15, and Jinan having an R value of 0.05, and the rest of the regions were negatively correlated. A small amount of precipitation can promote the growth of plants and increase the VOCs produced during plant growth, which cannot be easily purified by water, so that these VOCs have the opportunity to be converted into formaldehyde [60].On the other hand, precipitation has an obvious scavenging effect on atmospheric formaldehyde, and the atmospheric formaldehyde content after precipitation is generally lower than that before precipitation, but over time, precipitation increases air humidity and promotes hydrolysis of formaldehyde polymers, which leads to an increase in the concentration of formaldehyde columns [59].
Next, we explored the effect of another important meteorological element, wind, on HCHO concentration, and the results are shown in Figure 8. The correlation coefficients between HCHO concentration and wind speed in North China from 2019 to 2023 are low, with R-values of only 0.07 and 0.04 for the growing and non-growing seasons, suggesting that overall North China's HCHO concentration has little correlation with wind. However, Qingdao and Tianjin, which are located in the coastal area, have relatively high R-values, which is caused by the fact that the region is mainly affected by sea winds and land winds, which transport wet sea vapors to the land and have a certain dilution effect on formaldehyde[59]. It has been shown that wind direction directly affects the direction of formaldehyde diffusion, as shown in Figure 8, the R-value is higher in the southern part of North China during the growing season, whereas during the non-growing season, the R-value is higher in the northern part of the country, which may be related to the difference in wind direction in different seasons.
Figure 9 shows the correlation between HCHO column concentration and net surface solar radiation in North China from 2019-2023. As shown in the figure, during the growing season, the HCHO column concentration is positively correlated with the net surface solar radiation as a whole, but the correlation is not large. While in the non-growing season, the correlation between the two was higher in most areas, but inversely correlated.
Another important natural influence is NDVI, and the spatial distribution of correlation coefficients between HCHO column concentrations and NDVI is shown in Figure 10. During the growing season, the HCHO column concentrations in the western and eastern regions were positively correlated with NDVI and the correlation was high, whereas the correlation with NDVI in the central region was low, presumably related to the concentration of heavy industries such as copper processing plants, mining plants, and steel plants in this region. The correlation coefficients between HCHO column concentrations and NDVI were similar and lower in most areas during the non-growing season.
Finally, we calculated the mean population density within the same urban +0.5° grid as above based on the LandScan population dataset and plotted it against the mean tropospheric HCHO VCD for 2019-2023 (Figure 11). The results show that overall the population density and the mean tropospheric HCHO column concentration are positively proportional in North China, e.g., the central region has the highest population density (434.43 persons/km2) and the highest mean tropospheric HCHO column concentration (2.23×10⁻⁴ mol m-2), followed by the eastern region with a population density of 288.54 persons/km2 and a mean tropospheric HCHO column concentration of 1.90×10⁻⁴ mol m-2, and the lowest population density (245.56 people/km2) and the lowest mean tropospheric HCHO column concentration (1.65×10⁻⁴ mol m-2) in the west. However, this pattern is not fully satisfied for typical cities specifically, and population density is not the main factor affecting these cities.
4. Conclusions
In this study, the temporal and spatial trends of tropospheric HCHO VCD in North China from 2019 to 2023 are investigated based on the HCHO dataset from the TROPOMI sensor of the Sentinel-5 satellite. The tropospheric HCHO column concentration in North China shows an overall increasing trend, with the central and eastern parts of the region showing a decreasing and then increasing trend, and the North China region shows a steady increasing trend with smaller changes. The HCHO VCD in North China shows a spatial distribution trend of lowest in the west and highest in the center. The seasonal variation of HCHO VCD in North China is obvious, with the summer season being higher than the other seasons as a whole and the spring season being the lowest, and the high value of HCHO VCD basically occurs in June-August and reaches the lowest value in March-April every year. During the growing season, high temperatures are favorable for VOCs to undergo oxidation and increase HCHO VCD, and temperature and HCHO VCD are positively proportional, while during the non-growing season, temperature is inversely proportional to the change in HCHO VCD. The correlation coefficients of precipitation, wind, and net surface solar radiation with HCHO VCD were smaller than those of temperature, whereas NDVI was positively correlated with HCHO VCD and the correlation was high during the growing season. Human activities also have some influence on HCHO VCD, and the population density in North China is proportional to the mean tropospheric HCHO column concentration.
Author Contributions
Conceptualization, L.L. and M.X.; methodology, L.L. and M.X.; software, L.L. and M.X.; validation, L.L. and M.X.; formal analysis, L.L. and M.X.; investigation, L.L. and M.X.; resources, L.L. and M.X.; data curation, L.L. and M.X.; writing—original draft preparation, L.L. and M.X.; writing—review and editing, L.L., M.X. and C.D.; visualization, L.L. and M.X.; supervision, C.D.; project administration, L.L. and M.X.; funding acquisition, L.L. and M.X. All authors have read and agreed to the published version of the manuscript.
Funding
This research was funded by Shandong Agriculture and Engineering University Start-Up Fund for Talented Scholars, grant number 2024GCCZR and Commercial research funds, grant number 317200229.
Conflicts of Interest
The authors declare no conflicts of interest.
Abbreviations
The following abbreviations are used in this manuscript:
| VOCs | Volatile organic chemicals |
| VCD | Vertical column density |
| TROPOMI | Tropospheric Monitoring Instrument |
| EPA | Environmental Protection Agency |
| JJJ | Jing Jin Ji |
| NCP | North China Plain |
References
- Xu-dong, W.; Sha-sha, Y.; Jian, Y.; Ming-hao, Y.; Rui-qi, Z.; Ya-song, L.; Xuan, L. Characteristics, Meteorological Influences, and Transport Source of Ozone Pollution in Zhengzhou City. Environmental Science 2021, 42, 604–615. [Google Scholar]
- Zhang, X.; Sun, J.; Lin, W.; Xu, W.; Zhang, G.; Wu, Y.; Dai, X.; Zhao, J.; Yu, D.; Xu, X. Long-term variations in surface ozone at the Longfengshan Regional Atmosphere Background Station in Northeast China and related influencing factors. Environ Pollut 2024, 348, 123748. [Google Scholar] [CrossRef] [PubMed]
- Wang, T.; Xue, L.; Brimblecombe, P.; Lam, Y.F.; Li, L.; Zhang, L. Ozone pollution in China: A review of concentrations, meteorological influences, chemical precursors, and effects. Sci Total Environ 2017, 575, 1582–1596. [Google Scholar] [CrossRef]
- Feng, Z.; Hu, E.; Wang, X.; Jiang, L.; Liu, X. Ground-level O3 pollution and its impacts on food crops in China: a review. Environ Pollut 2015, 199, 42–48. [Google Scholar] [CrossRef]
- Li, T.; Yan, M.; Ma, W.; Ban, J.; Liu, T.; Lin, H.; Liu, Z. Short-term effects of multiple ozone metrics on daily mortality in a megacity of China. Environ Sci Pollut Res Int 2015, 22, 8738–8746. [Google Scholar] [CrossRef]
- Brauer, M.; Freedman, G.; Frostad, J.; van Donkelaar, A.; Martin, R.V.; Dentener, F.; van Dingenen, R.; Estep, K.; Amini, H.; Apte, J.S.; et al. Ambient Air Pollution Exposure Estimation for the Global Burden of Disease 2013. Environ Sci Technol 2016, 50, 79–88. [Google Scholar] [CrossRef] [PubMed]
- Yu, R.; Lin, Y.; Zou, J.; Dan, Y.; Cheng, C. Review on Atmospheric Ozone Pollution in China: Formation, Spatiotemporal Distribution, Precursors and Affecting Factors. Atmosphere 2021, 12. [Google Scholar] [CrossRef]
- Shu, L.; Wang, T.; Han, H.; Xie, M.; Chen, P.; Li, M.; Wu, H. Summertime ozone pollution in the Yangtze River Delta of eastern China during 2013–2017: Synoptic impacts and source apportionment. Environmental Pollution 2020, 257, 113631. [Google Scholar] [CrossRef]
- Hong, Q.; Liu, C.; Hu, Q.; Zhang, Y.; Xing, C.; Su, W.; Ji, X.; Xiao, S. Evaluating the feasibility of formaldehyde derived from hyperspectral remote sensing as a proxy for volatile organic compounds. Atmospheric Research 2021, 264. [Google Scholar] [CrossRef]
- Sillman, S. The use of NO y, H2O2, and HNO3 as indicators for ozone-NO x -hydrocarbon sensitivity in urban locations. Journal of Geophysical Research: Atmospheres 1995, 100, 14175–14188. [Google Scholar] [CrossRef]
- Shen, L.; Jacob, D.J.; Zhu, L.; Zhang, Q.; Zheng, B.; Sulprizio, M.P.; Li, K.; De Smedt, I.; González Abad, G.; Cao, H.; et al. The 2005–2016 Trends of Formaldehyde Columns Over China Observed by Satellites: Increasing Anthropogenic Emissions of Volatile Organic Compounds and Decreasing Agricultural Fire Emissions. Geophysical Research Letters 2019, 46, 4468–4475. [Google Scholar] [CrossRef]
- Su, W.; Hu, Q.; Chen, Y.; Lin, J.; Zhang, C.; Liu, C. Inferring global surface HCHO concentrations from multisource hyperspectral satellites and their application to HCHO-related global cancer burden estimation. Environ Int 2022, 170, 107600. [Google Scholar] [CrossRef]
- Cheng, S.; Cheng, X.; Ma, J.; Xu, X.; Zhang, W.; Lv, J.; Bai, G.; Chen, B.; Ma, S.; Ziegler, S.; et al. Mobile MAX-DOAS observations of tropospheric NO2 and HCHO during summer over the Three Rivers' Source region in China. Atmospheric Chemistry and Physics 2023, 23, 3655–3677. [Google Scholar] [CrossRef]
- Su, W.; Hu, Q.; Chen, Y.; Lin, J.; Zhang, C.; Liu, C. Inferring global surface HCHO concentrations from multisource hyperspectral satellites and their application to HCHO-related global cancer burden estimation. Environment International 2022, 170, 107600. [Google Scholar] [PubMed]
- Xu, Y.; Su, W.; Hu, Q.; Zhang, C.; Javed, Z.; Tian, Y.; Hou, H.; Liu, C. Unexpected HCHO transnational transport: influence on the temporal and spatial distribution of HCHO in Tibet from 2013 to 2021 based on satellite. npj Climate and Atmospheric Science 2024, 7, 102. [Google Scholar] [CrossRef]
- Vaughan, T.L.; Strader, C.; Davis, S.; Daling, J.R. Formaldehyde and cancers of the pharynx, sinus and nasal cavity: I. Occupational exposures. International Journal of Cancer 1986, 38, 677–683. [Google Scholar] [CrossRef]
- Hayes, R.B.; Blair, A.; Stewart, P.A.; Herrick, R.F.; Mahar, H. Mortality of U.S. Embalmers and funeral directors. American Journal of Industrial Medicine 1990, 18, 641–652. [Google Scholar] [CrossRef]
- Hauptmann, M.; Lubin, J.H.; Stewart, P.A.; Hayes, R.B.; Blair, A. Mortality from Solid Cancers among Workers in Formaldehyde Industries. American Journal of Epidemiology 2004, 159, 1117–1130. [Google Scholar] [CrossRef]
- Hauptmann, M.; Lubin, J.H.; Stewart, P.A.; Hayes, R.B.; Blair, A. Mortality From Lymphohematopoietic Malignancies Among Workers in Formaldehyde Industries. JNCI: Journal of the National Cancer Institute 2003, 95, 1615–1623. [Google Scholar] [CrossRef]
- Cancer, I.A.f.R.o. Formaldehyde, 2-Butoxyethanol and 1-tert-Butoxypropan-2-ol. In Formaldehyde, 2-Butoxyethanol and 1-tert-Butoxypropan-2-ol; 2006; pp. 478–478. [Google Scholar]
- Kanaya, Y.; Pochanart, P.; Liu, Y.; Li, J.; Tanimoto, H.; Kato, S.; Suthawaree, J.; Inomata, S.; Taketani, F.; Okuzawa, K.; et al. Rates and regimes of photochemical ozone production over Central East China in June 2006: a box model analysis using comprehensive measurements of ozone precursors. Atmos. Chem. Phys. 2009, 9, 7711–7723. [Google Scholar] [CrossRef]
- Kar, J.; Fishman, J.; Creilson, J.K.; Richter, A.; Ziemke, J.; Chandra, S. Are there urban signatures in the tropospheric ozone column products derived from satellite measurements? Atmos. Chem. Phys. 2010, 10, 5213–5222. [Google Scholar] [CrossRef]
- Sharma, S.; Kumar, P.; Vaishnav, R.; Shukla, K.K.; Phanikumar, D.V. Analysis of total column ozone, water vapour and aerosol optical thickness over Ahmedabad, India. Meteorological Applications 2018, 25, 33–39. [Google Scholar] [CrossRef]
- Baruah, U.D.; Robeson, S.M.; Saikia, A.; Mili, N.; Sung, K.; Chand, P. Spatio-temporal characterization of tropospheric ozone and its precursor pollutants NO(2) and HCHO over South Asia. Sci Total Environ 2022, 809, 151135. [Google Scholar] [CrossRef] [PubMed]
- Su, W.; Liu, C.; Chan, K.L.; Hu, Q.; Liu, H.; Ji, X.; Zhu, Y.; Liu, T.; Zhang, C.; Chen, Y.; et al. An improved TROPOMI tropospheric HCHO retrieval over China. Atmos. Meas. Tech. 2020, 13, 6271–6292. [Google Scholar] [CrossRef]
- De Smedt, I.; Theys, N.; Yu, H.; Danckaert, T.; Lerot, C.; Compernolle, S.; Van Roozendael, M.; Richter, A.; Hilboll, A.; Peters, E.; et al. Algorithm theoretical baseline for formaldehyde retrievals from S5P TROPOMI and from the QA4ECV project. Atmos. Meas. Tech. 2018, 11, 2395–2426. [Google Scholar] [CrossRef]
- Levelt, P.F.; Joiner, J.; Tamminen, J.; Veefkind, J.P.; Bhartia, P.K.; Stein Zweers, D.C.; Duncan, B.N.; Streets, D.G.; Eskes, H.; van der A, R.; et al. The Ozone Monitoring Instrument: overview of 14 years in space. Atmos. Chem. Phys. 2018, 18, 5699–5745. [Google Scholar] [CrossRef]
- Griffin, D.; Zhao, X.; McLinden, C.A.; Boersma, F.; Bourassa, A.; Dammers, E.; Degenstein, D.; Eskes, H.; Fehr, L.; Fioletov, V. High-resolution mapping of nitrogen dioxide with TROPOMI: First results and validation over the Canadian oil sands. Geophysical Research Letters 2019, 46, 1049–1060. [Google Scholar] [CrossRef]
- Goldberg, D.L.; Lu, Z.; Streets, D.G.; de Foy, B.; Griffin, D.; McLinden, C.A.; Lamsal, L.N.; Krotkov, N.A.; Eskes, H. Enhanced capabilities of TROPOMI NO2: Estimating NO X from north american cities and power plants. Environmental science & technology 2019, 53, 12594–12601. [Google Scholar]
- de Foy, B.; Schauer, J.J. An improved understanding of NOx emissions in South Asian megacities using TROPOMI NO2 retrievals. Environmental Research Letters 2022, 17, 024006. [Google Scholar] [CrossRef]
- Dix, B.; Francoeur, C.; Li, M.; Serrano-Calvo, R.; Levelt, P.F.; Veefkind, J.P.; McDonald, B.C.; de Gouw, J. Quantifying NOx Emissions from U.S. Oil and Gas Production Regions Using TROPOMI NO2. ACS Earth and Space Chemistry 2022, 6, 403–414. [Google Scholar] [CrossRef]
- Beirle, S.; Borger, C.; Dörner, S.; Li, A.; Hu, Z.; Liu, F.; Wang, Y.; Wagner, T. Pinpointing nitrogen oxide emissions from space. Science advances 2019, 5, eaax9800. [Google Scholar] [CrossRef] [PubMed]
- Wang, Z.; Uno, I.; Yumimoto, K.; Itahashi, S.; Chen, X.; Yang, W.; Wang, Z. Impacts of COVID-19 lockdown, Spring Festival and meteorology on the NO2 variations in early 2020 over China based on in-situ observations, satellite retrievals and model simulations. Atmospheric environment 2021, 244, 117972. [Google Scholar] [PubMed]
- Souri, A.H.; Chance, K.; Bak, J.; Nowlan, C.R.; González Abad, G.; Jung, Y.; Wong, D.C.; Mao, J.; Liu, X. Unraveling pathways of elevated ozone induced by the 2020 lockdown in Europe by an observationally constrained regional model using TROPOMI. Atmospheric chemistry and physics 2021, 21, 18227–18245. [Google Scholar]
- Sun, K.; Li, L.; Jagini, S.; Li, D. A satellite-data-driven framework to rapidly quantify air-basin-scale NO2 emissions and its application to the Po Valley during the COVID-19 pandemic. Atmospheric Chemistry and Physics 2021, 21, 13311–13332. [Google Scholar]
- Liu, F.; Page, A.; Strode, S.A.; Yoshida, Y.; Choi, S.; Zheng, B.; Lamsal, L.N.; Li, C.; Krotkov, N.A.; Eskes, H. Abrupt decline in tropospheric nitrogen dioxide over China after the outbreak of COVID-19. Science Advances 2020, 6, eabc2992. [Google Scholar]
- Goldberg, D.L.; Anenberg, S.C.; Griffin, D.; McLinden, C.A.; Lu, Z.; Streets, D.G. Disentangling the impact of the COVID-19 lockdowns on urban NO2 from natural variability. Geophysical Research Letters 2020, 47, e2020GL089269. [Google Scholar] [CrossRef]
- Cooper, M.J.; Martin, R.V.; Hammer, M.S.; Levelt, P.F.; Veefkind, P.; Lamsal, L.N.; Krotkov, N.A.; Brook, J.R.; McLinden, C.A. Global fine-scale changes in ambient NO2 during COVID-19 lockdowns. Nature 2022, 601, 380–387. [Google Scholar]
- Bauwens, M.; Compernolle, S.; Stavrakou, T.; Müller, J.F.; Van Gent, J.; Eskes, H.; Levelt, P.F.; Van Der A, R.; Veefkind, J.; Vlietinck, J. Impact of coronavirus outbreak on NO2 pollution assessed using TROPOMI and OMI observations. Geophysical Research Letters 2020, 47, e2020GL087978. [Google Scholar]
- Zhao, X.; Griffin, D.; Fioletov, V.; McLinden, C.; Cede, A.; Tiefengraber, M.; Müller, M.; Bognar, K.; Strong, K.; Boersma, F. Assessment of the quality of TROPOMI high-spatial-resolution NO 2 data products in the Greater Toronto Area. Atmospheric Measurement Techniques 2020, 13, 2131–2159. [Google Scholar]
- Ialongo, I.; Stepanova, N.; Hakkarainen, J.; Virta, H.; Gritsenko, D. Satellite-based estimates of nitrogen oxide and methane emissions from gas flaring and oil production activities in Sakha Republic, Russia. Atmospheric Environment: X 2021, 11, 100114. [Google Scholar] [CrossRef]
- Goldberg, D.L.; Anenberg, S.C.; Kerr, G.H.; Mohegh, A.; Lu, Z.; Streets, D.G. TROPOMI NO2 in the United States: A detailed look at the annual averages, weekly cycles, effects of temperature, and correlation with surface NO2 concentrations. Earth's future 2021, 9, e2020EF001665. [Google Scholar] [PubMed]
- Geddes, J.A.; Wang, B.; Li, D. Ozone and nitrogen dioxide pollution in a coastal urban environment: The role of sea breezes, and implications of their representation for remote sensing of local air quality. Journal of Geophysical Research: Atmospheres 2021, 126, e2021JD035314. [Google Scholar]
- Demetillo, M.A.G.; Navarro, A.; Knowles, K.K.; Fields, K.P.; Geddes, J.A.; Nowlan, C.R.; Janz, S.J.; Judd, L.M.; Al-Saadi, J.; Sun, K. Observing nitrogen dioxide air pollution inequality using high-spatial-resolution remote sensing measurements in Houston, Texas. Environmental Science & Technology 2020, 54, 9882–9895. [Google Scholar]
- Shikwambana, L.; Mhangara, P.; Mbatha, N. Trend analysis and first time observations of sulphur dioxide and nitrogen dioxide in South Africa using TROPOMI/Sentinel-5 P data. International Journal of Applied Earth Observation and Geoinformation 2020, 91, 102130. [Google Scholar]
- Saw, G.K.; Dey, S.; Kaushal, H.; Lal, K. Tracking NO2 emission from thermal power plants in North India using TROPOMI data. Atmospheric Environment 2021, 259, 118514. [Google Scholar] [CrossRef]
- Georgoulias, A.K.; Boersma, K.F.; Van Vliet, J.; Zhang, X.; Zanis, P.; de Laat, J. Detection of NO2 pollution plumes from individual ships with the TROPOMI/S5P satellite sensor. Environmental Research Letters 2020, 15, 124037. [Google Scholar] [CrossRef]
- Jin, X.; Zhu, Q.; Cohen, R.C. Direct estimates of biomass burning NO x emissions and lifetimes using daily observations from TROPOMI. Atmospheric Chemistry and Physics 2021, 21, 15569–15587. [Google Scholar]
- Griffin, D.; McLinden, C.A.; Dammers, E.; Adams, C.; Stockwell, C.; Warneke, C.; Bourgeois, I.; Peischl, J.; Ryerson, T.B.; Zarzana, K.J. Biomass burning nitrogen dioxide emissions derived from space with TROPOMI: methodology and validation. Atmospheric Measurement Techniques Discussions 2021, 2021, 1–44. [Google Scholar] [CrossRef]
- van der A, R.; de Laat, A.; Ding, J.; Eskes, H. Connecting the dots: NO x emissions along a West Siberian natural gas pipeline. npj Climate and Atmospheric Science 2020, 3, 16. [Google Scholar] [CrossRef]
- Song, Y.; Xing, C.; Liu, C.; Lin, J.; Wu, H.; Liu, T.; Lin, H.; Zhang, C.; Tan, W.; Ji, X.; et al. Evaluation of transport processes over North China Plain and Yangtze River Delta using MAX-DOAS observations. Atmospheric Chemistry and Physics 2023, 23, 1803–1824. [Google Scholar] [CrossRef]
- Wang, Y.; Dörner, S.; Donner, S.; Böhnke, S.; De Smedt, I.; Dickerson, R.R.; Dong, Z.; He, H.; Li, Z.; Li, Z.; et al. Vertical profiles of NO2, SO2, HONO, HCHO, CHOCHO and aerosols derived from MAX-DOAS measurements at a rural site in the central western North China Plain and their relation to emission sources and effects of regional transport. Atmos. Chem. Phys. 2019, 19, 5417–5449. [Google Scholar] [CrossRef]
- Kang, Y.; Tang, G.; Li, Q.; Liu, B.; Cao, J.; Hu, Q.; Wang, Y. Evaluation and Evolution of MAX-DOAS-observed Vertical NO2 Profiles in Urban Beijing. Advances in Atmospheric Sciences 2021, 38, 1188–1196. [Google Scholar] [CrossRef]
- Zhao, T.; Mao, J.; Ayazpour, Z.; González Abad, G.; Nowlan, C.R.; Zheng, Y. Interannual variability of summertime formaldehyde (HCHO) vertical column density and its main drivers at northern high latitudes. Atmospheric Chemistry and Physics 2024, 24, 6105–6121. [Google Scholar] [CrossRef]
- Fan, J.; Ju, T.; Wang, Q.; Gao, H.; Huang, R.; Duan, J. Spatiotemporal variations and potential sources of tropospheric formaldehyde over eastern China based on OMI satellite data. Atmospheric Pollution Research 2021, 12, 272–285. [Google Scholar] [CrossRef]
- Huang, C.; Ju, T.; Geng, T.; Fan, J.; Peng, S.; Xia, X.; Niu, X. Spatial and temporal distribution of HCHO and its pollution sources based on satellite remote sensing: a case study of the Yangtze River Economic Belt. Environmental Research Communications 2023, 5, 075014. [Google Scholar] [CrossRef]
- Zhang, Y.; Li, R.; Min, Q.; Bo, H.; Fu, Y.; Wang, Y.; Gao, Z. The Controlling Factors of Atmospheric Formaldehyde (HCHO) in Amazon as Seen From Satellite. Earth and Space Science 2019, 6, 959–971. [Google Scholar] [CrossRef]
- Zhu, S.; Li, X.; Yu, C.; Wang, H.; Wang, Y.; Miao, J. Spatiotemporal Variations in Satellite-Based Formaldehyde (HCHO) in the Beijing-Tianjin-Hebei Region in China from 2005 to 2015. Atmosphere 2018, 9, 5. [Google Scholar] [CrossRef]
- Huang, C.; Ju, T.; Li, B.; Wang, J.; Zhang, J.; Lei, S.; Li, C. Analysis on the Influencing Factors and Future Trend of HCHO Pollution in Brazil. Water, Air, & Soil Pollution 2023, 234. [Google Scholar] [CrossRef]
- Atkinson, R. Atmospheric chemistry of VOCs and NOx. Atmospheric Environment 2000, 34, 2063–2101. [Google Scholar] [CrossRef]
Figure 1.
Elevation distribution of North China in 3D view. The area framed by the thick black line is the North China region. The rectangles from left to right are the western region (red), the central region (blue) and the eastern region (black).
Figure 1.
Elevation distribution of North China in 3D view. The area framed by the thick black line is the North China region. The rectangles from left to right are the western region (red), the central region (blue) and the eastern region (black).
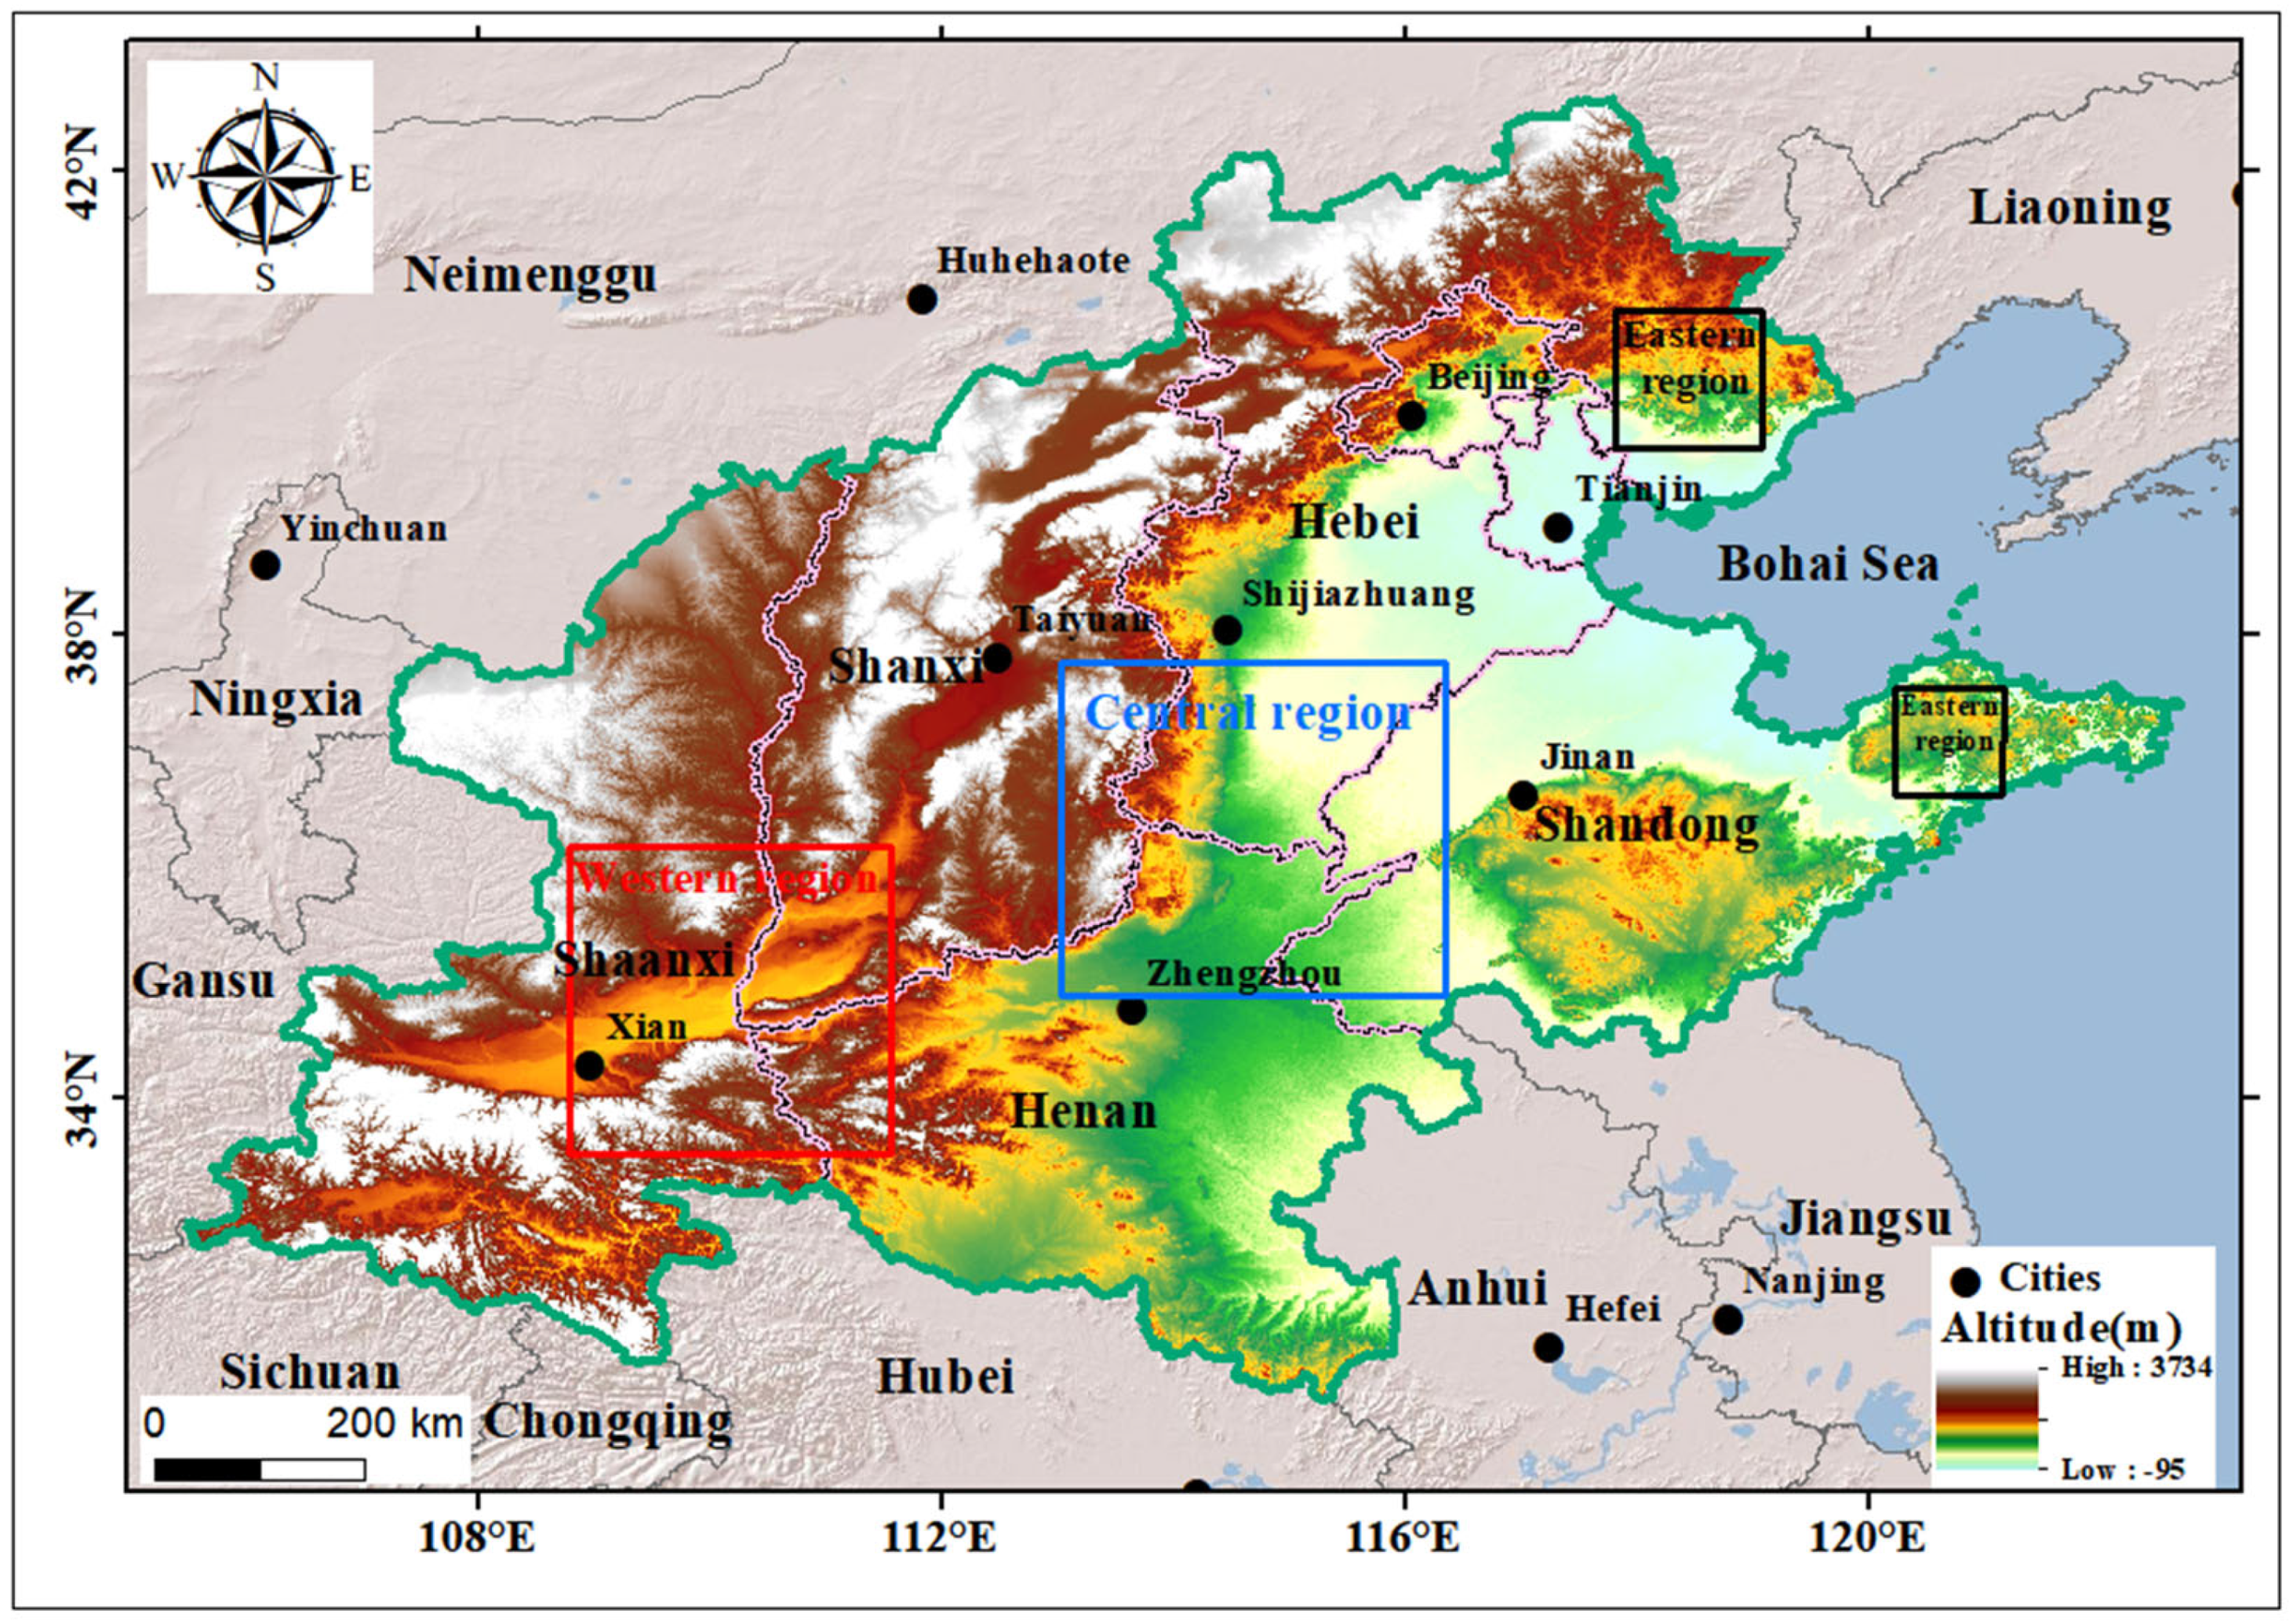
Figure 2.
Spatial distribution of 5-year mean column concentrations of HCHO in the troposphere in North China, 2019-2023.
Figure 2.
Spatial distribution of 5-year mean column concentrations of HCHO in the troposphere in North China, 2019-2023.
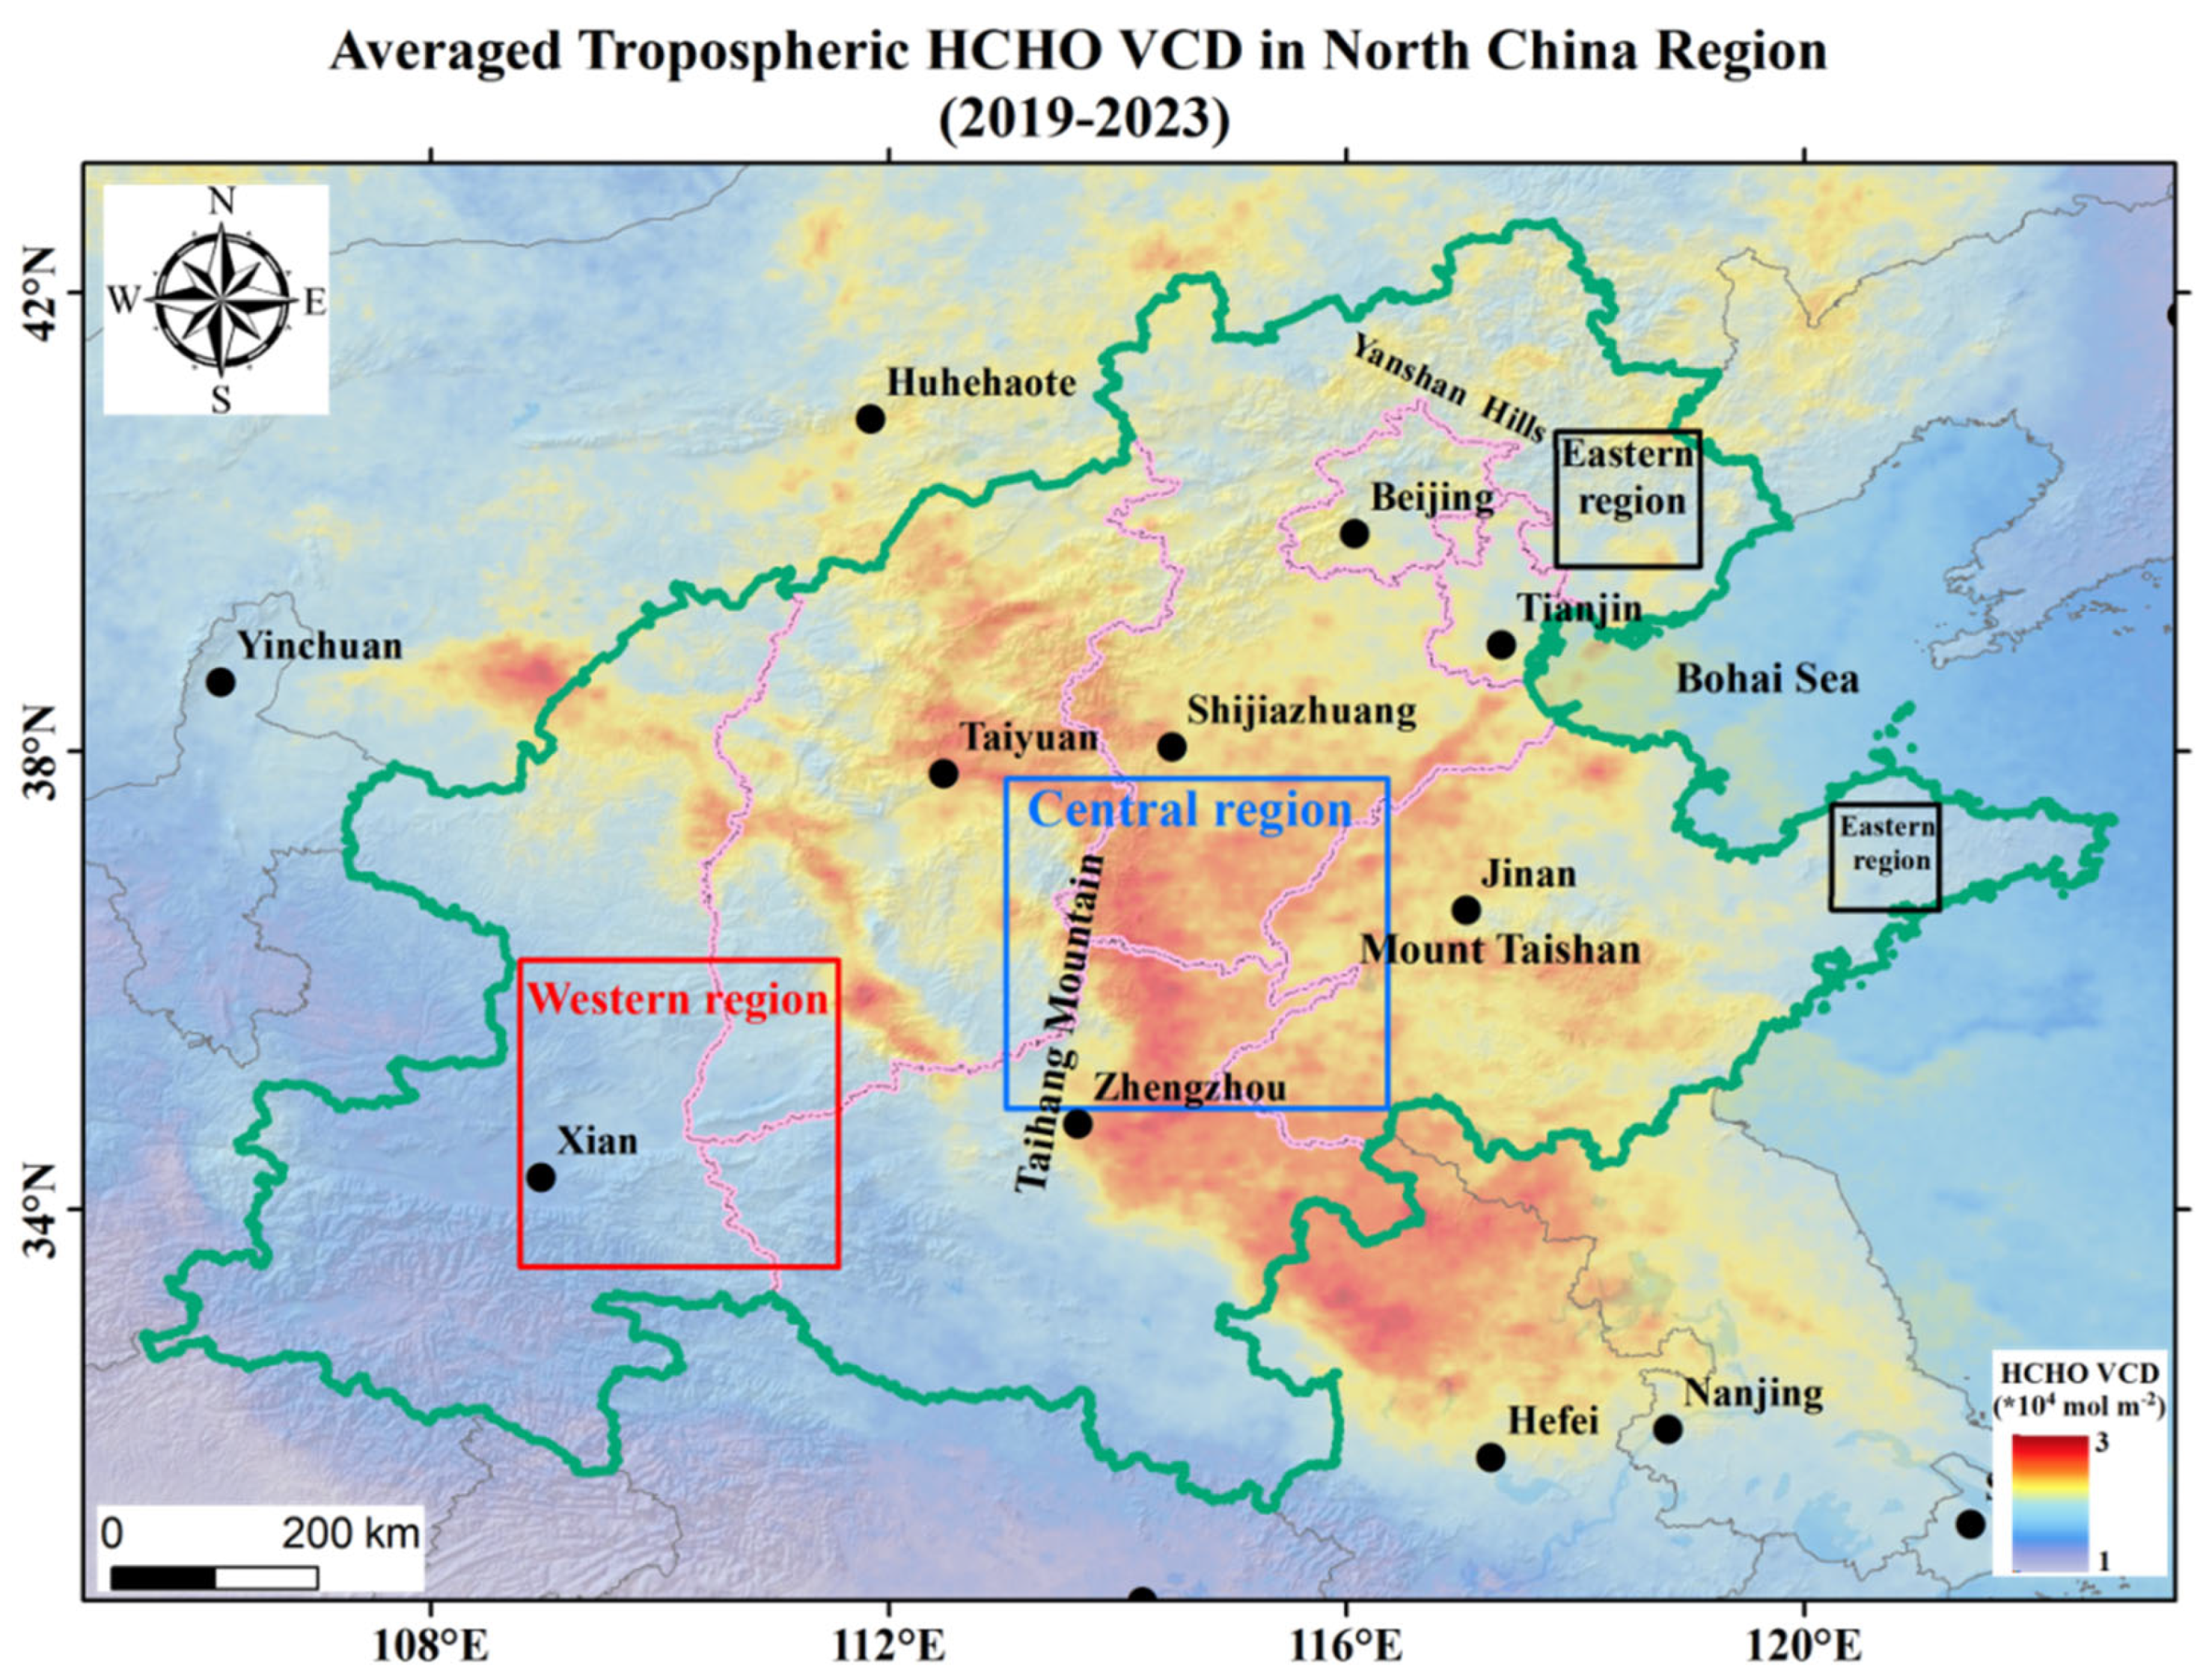
Figure 3.
Annual average spatial distribution of HCHO tropospheric column concentrations in North China, 2019-2023.
Figure 3.
Annual average spatial distribution of HCHO tropospheric column concentrations in North China, 2019-2023.
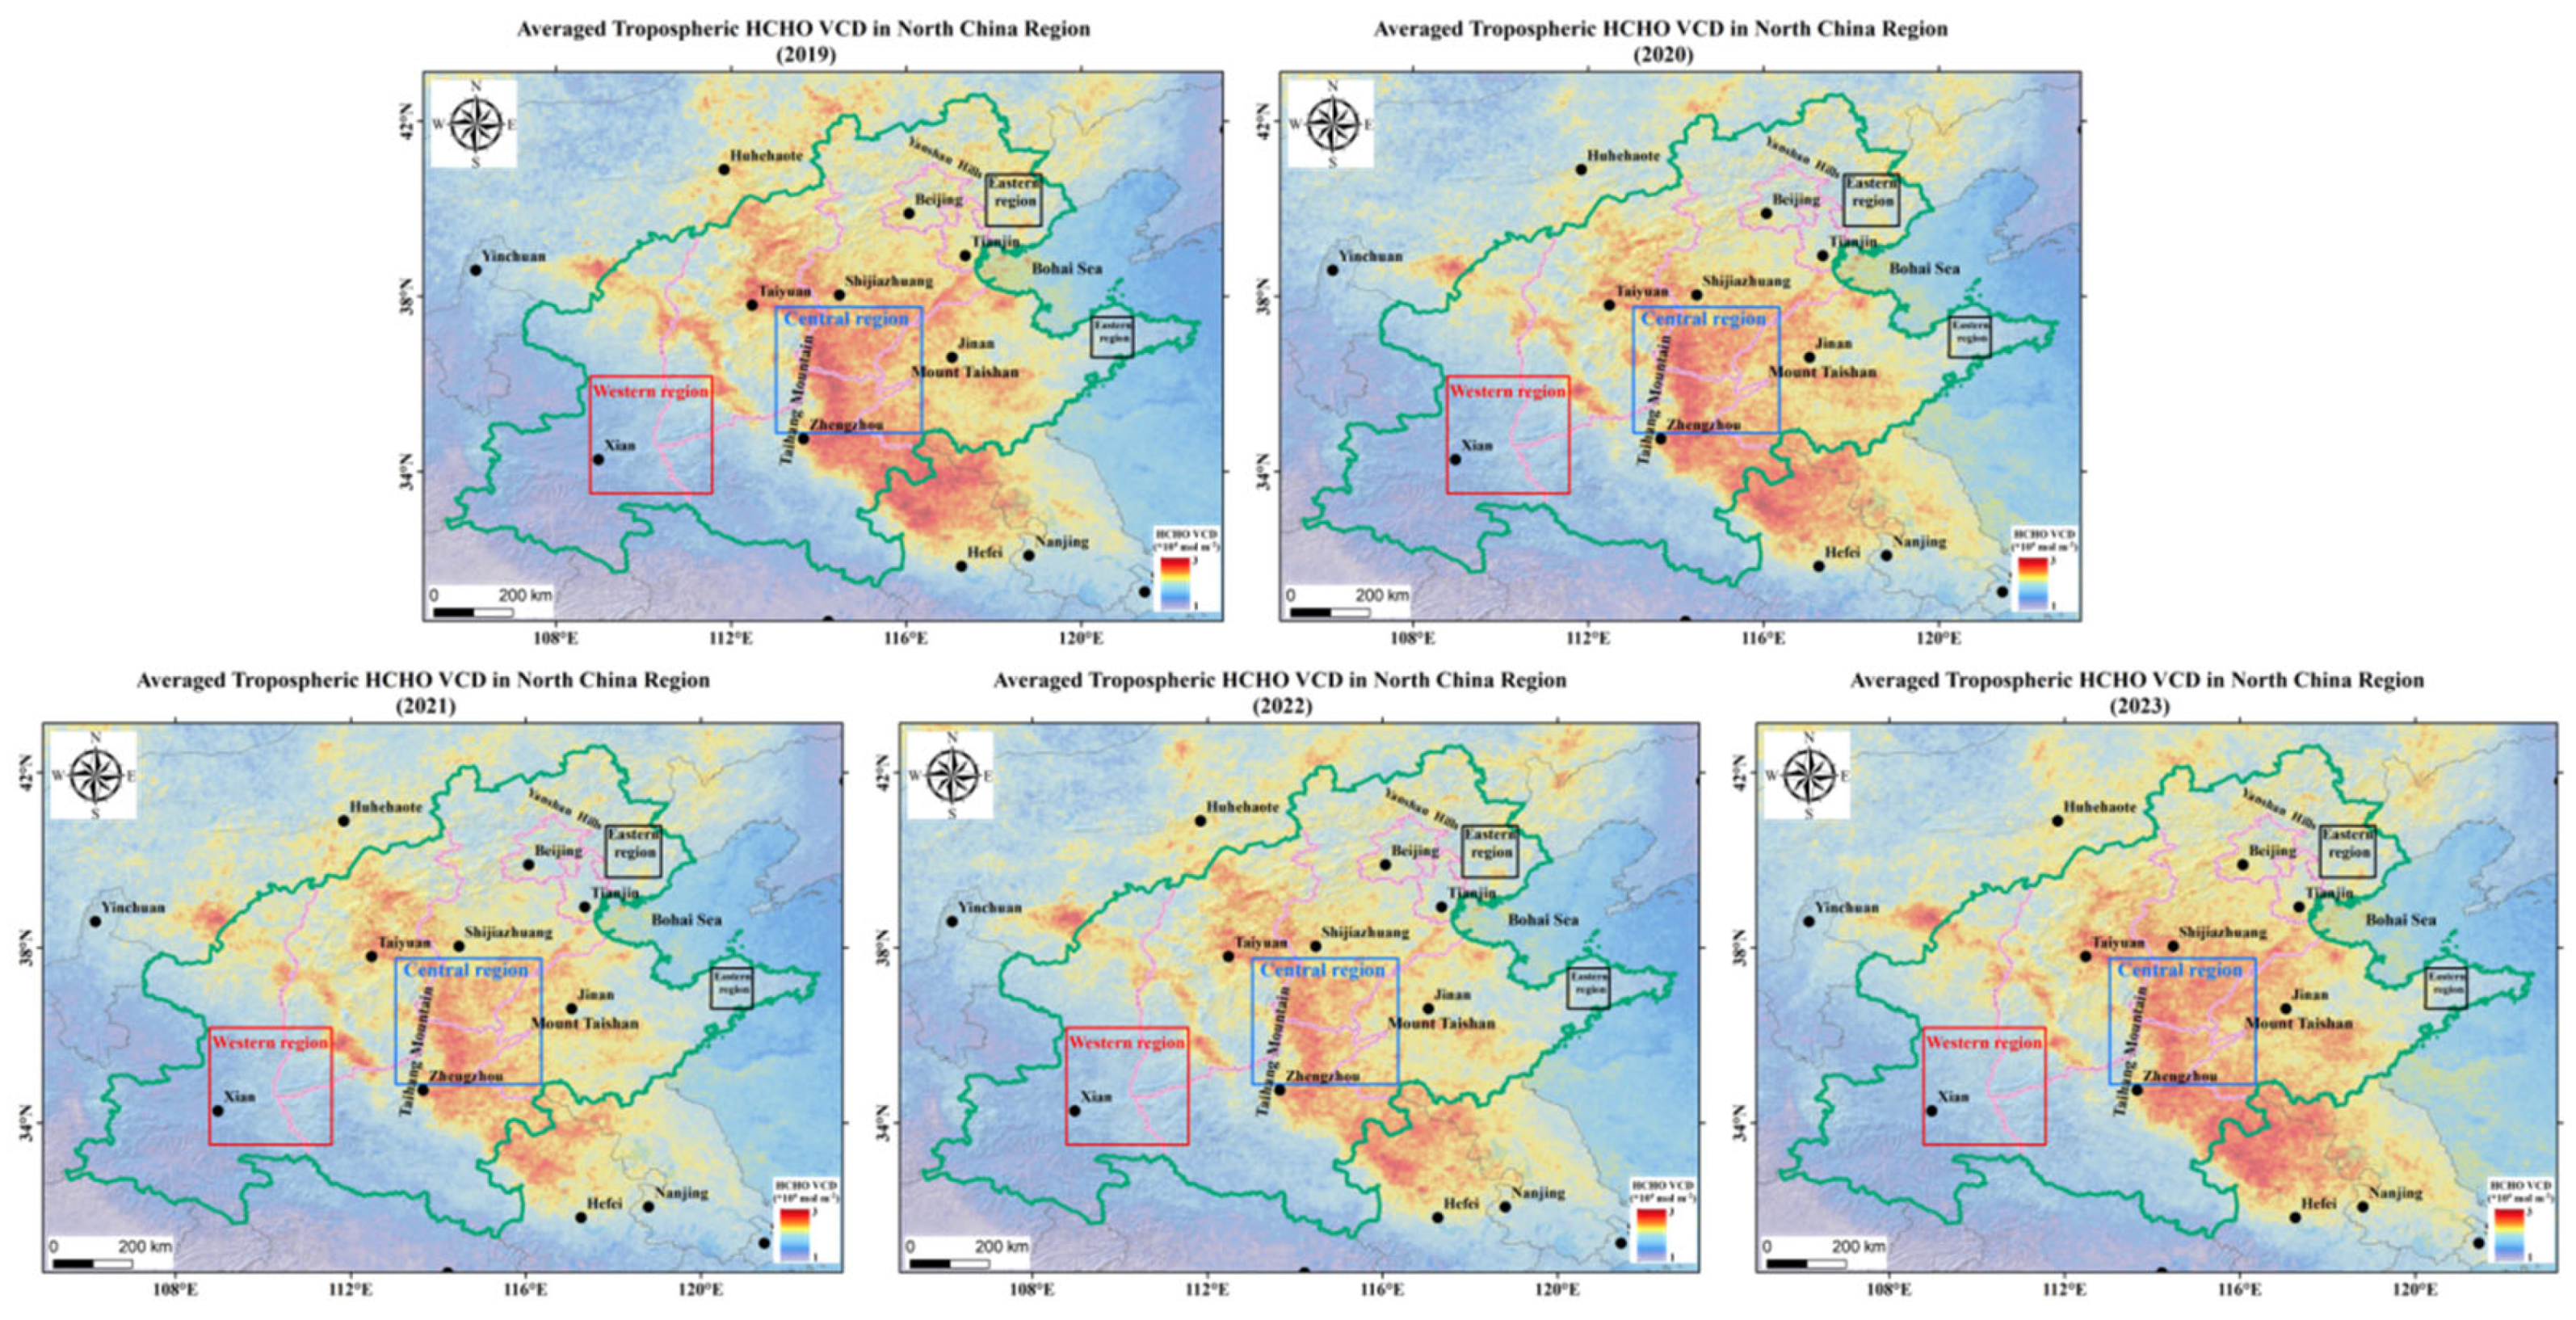
Figure 4.
Time series of monthly mean tropospheric column concentrations of HCHO in North China, 2019-2023.
Figure 4.
Time series of monthly mean tropospheric column concentrations of HCHO in North China, 2019-2023.
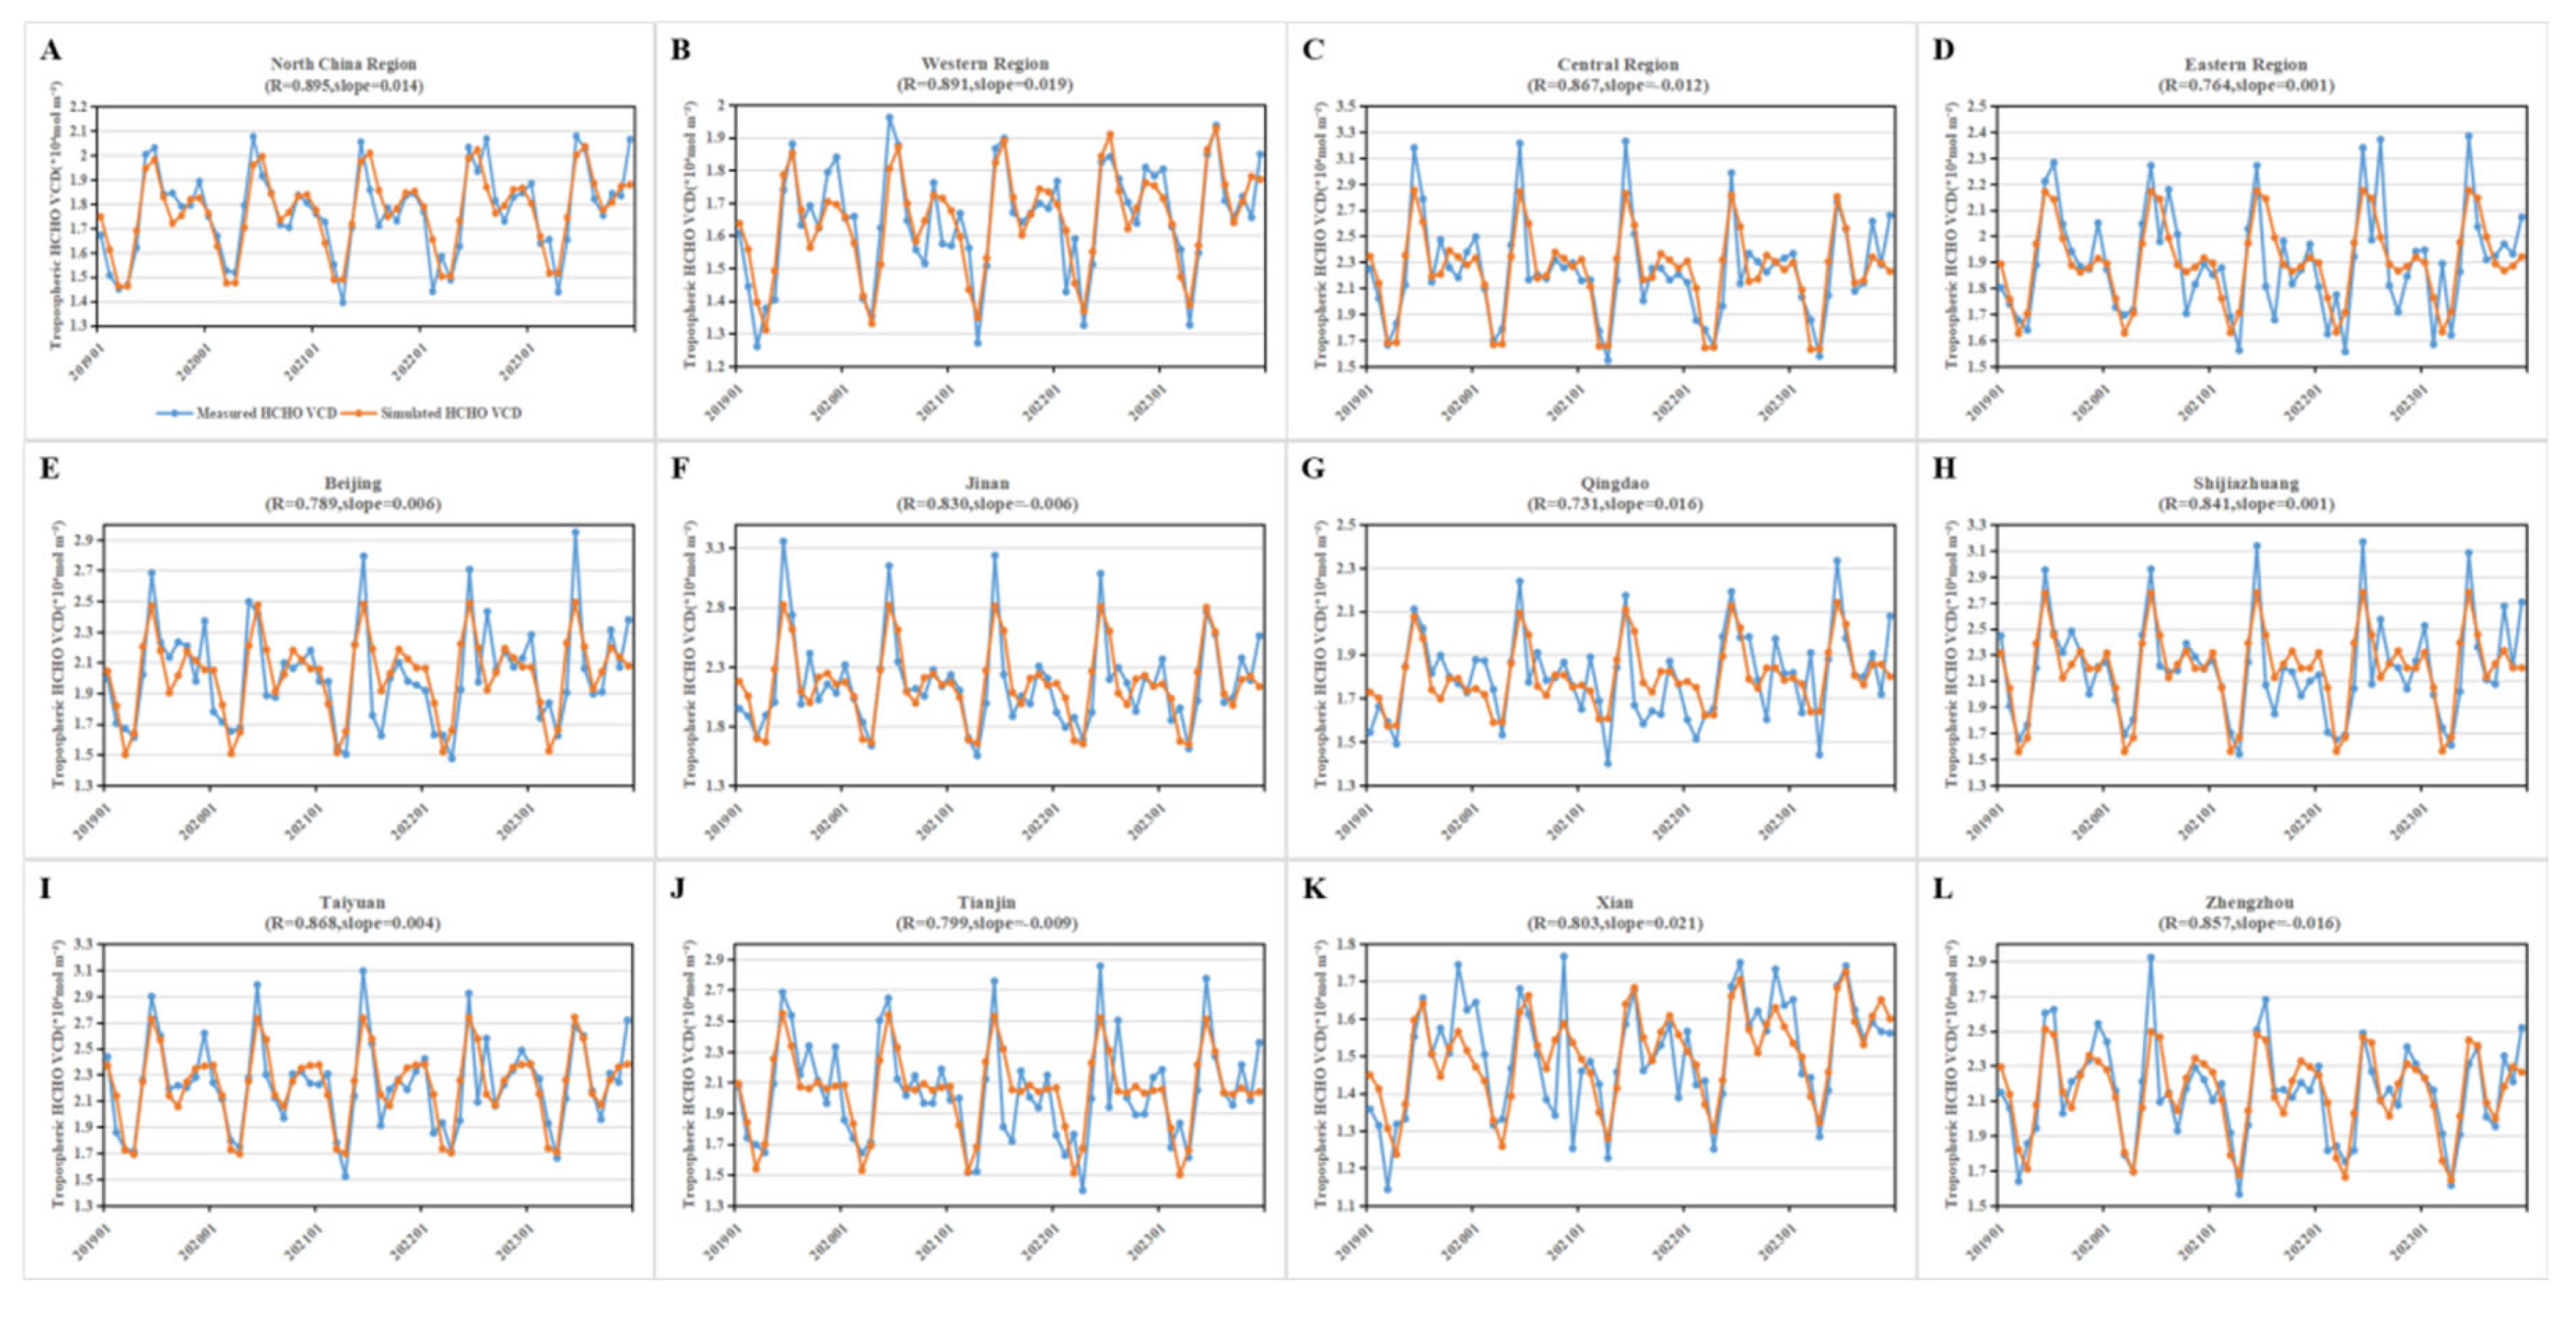
Figure 5.
Seasonal mean of tropospheric HCHO VCD in North China.
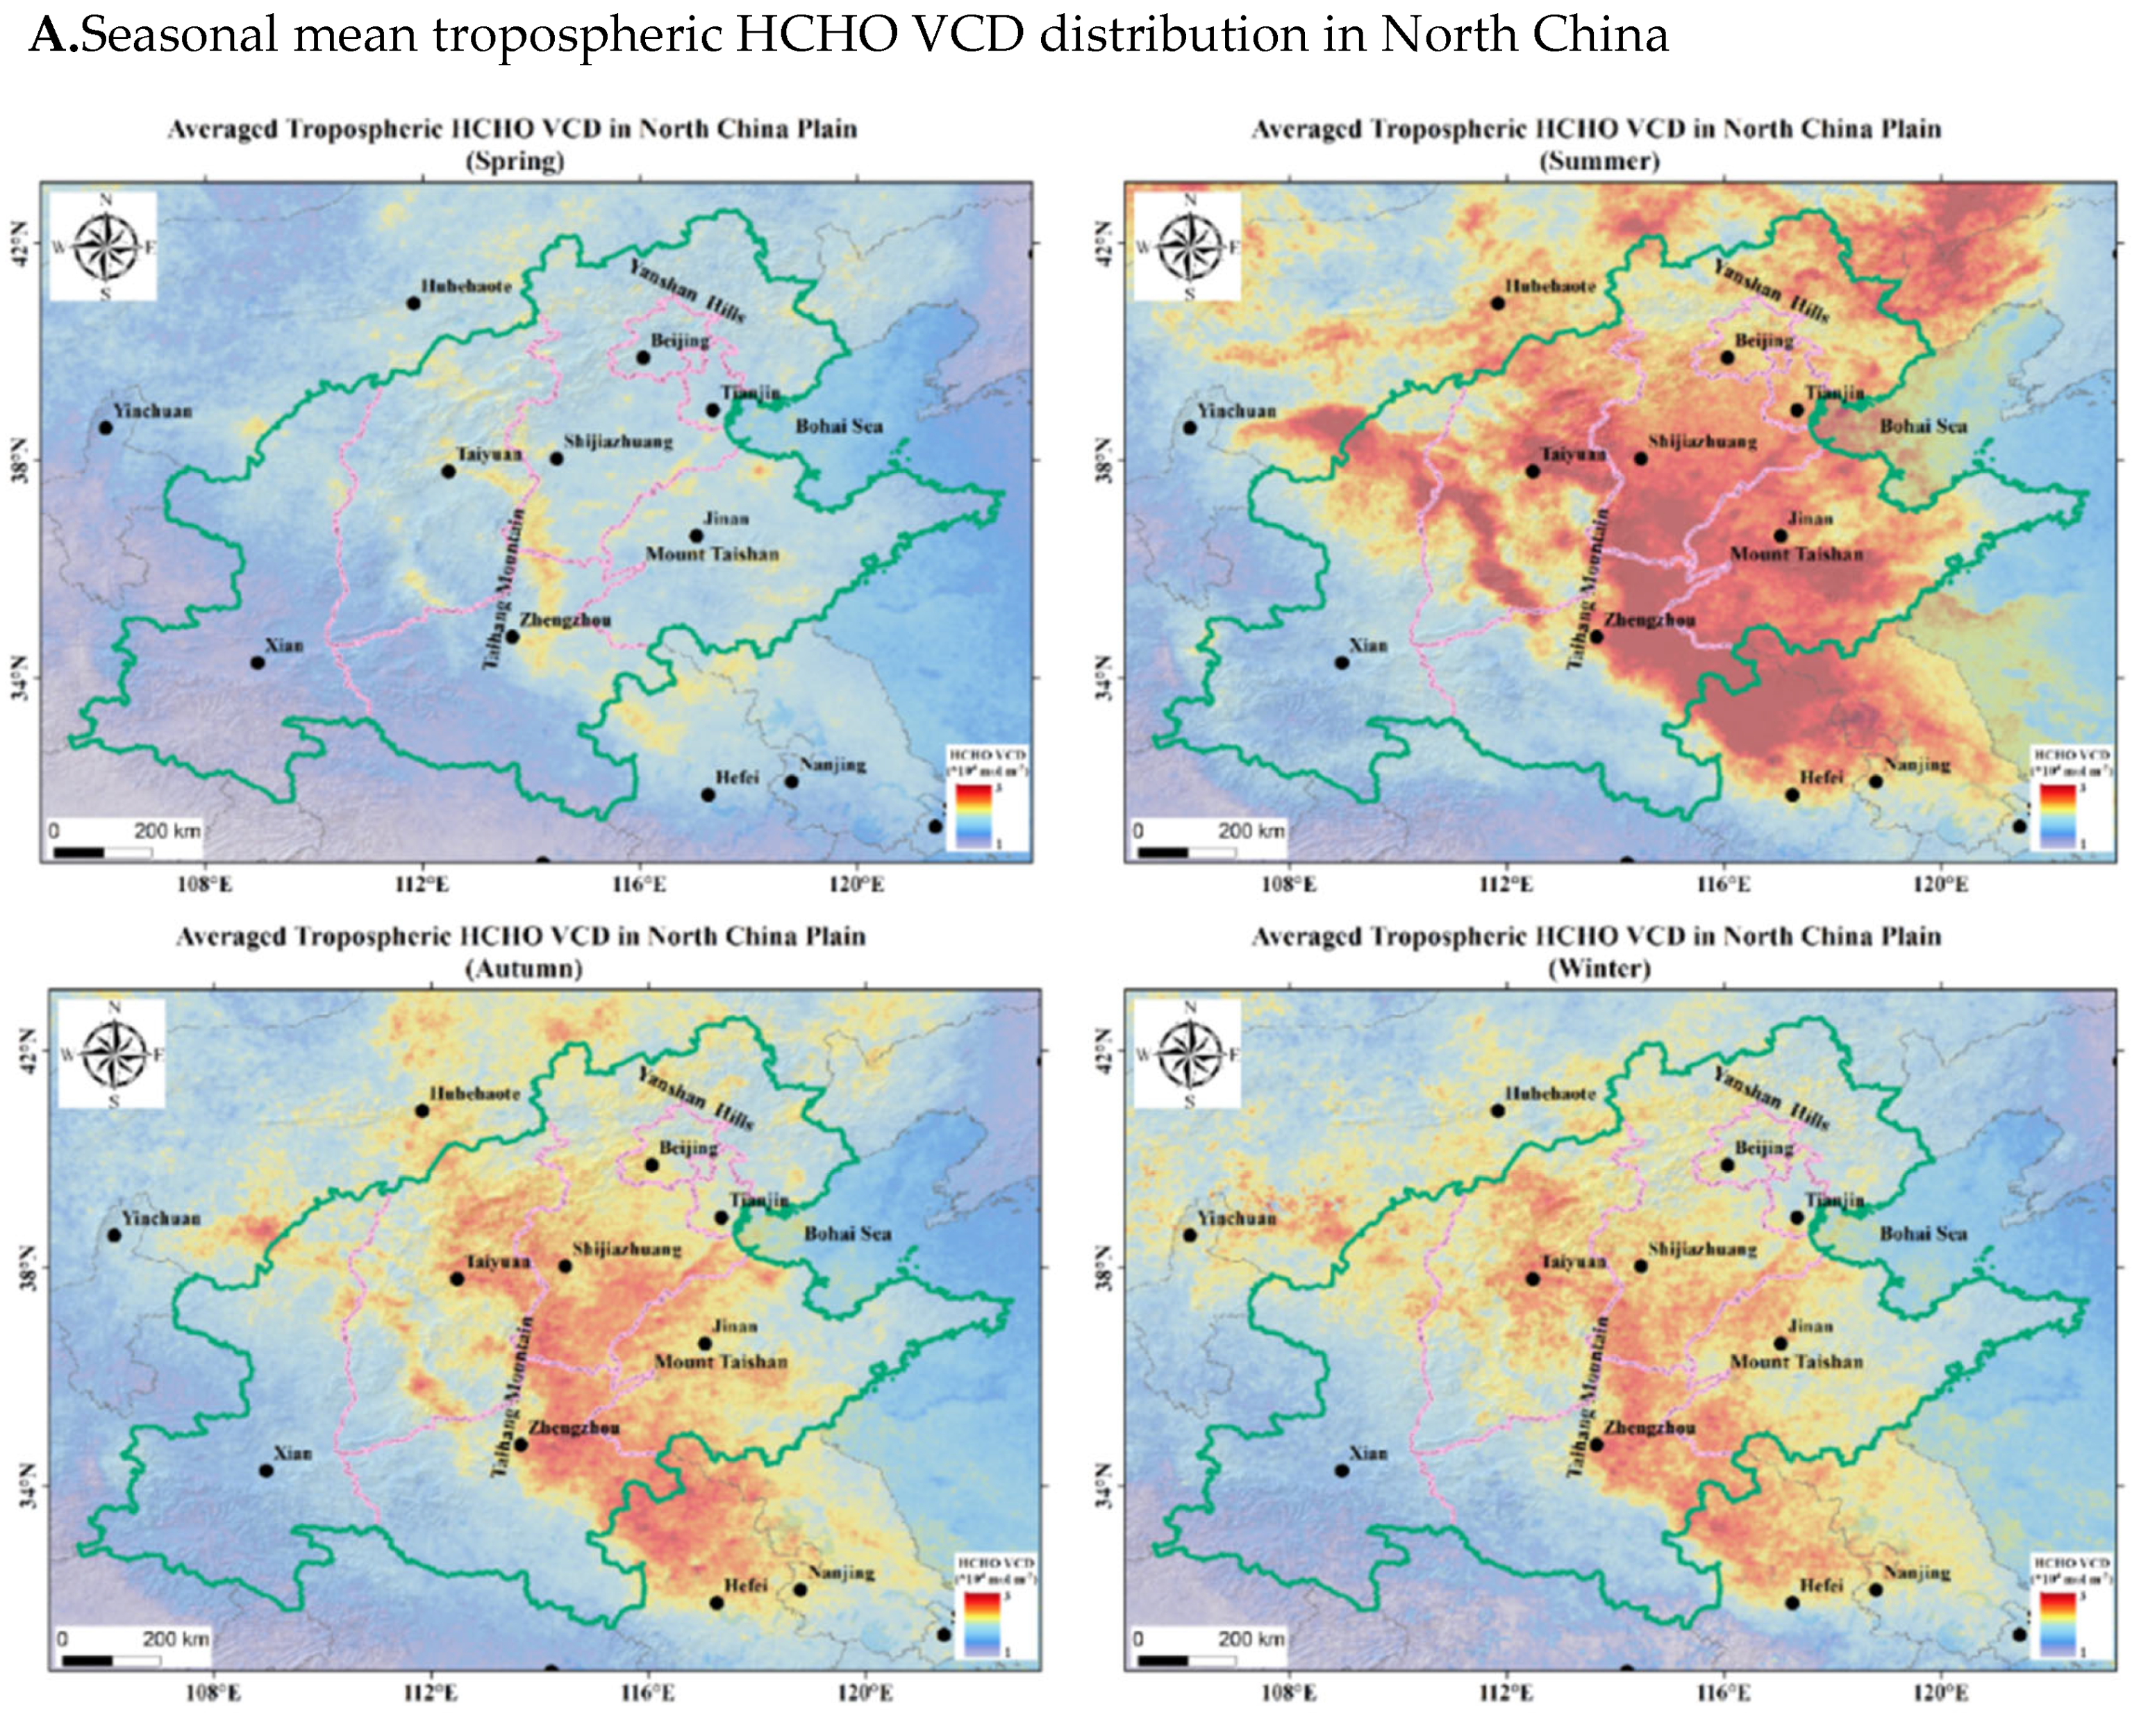
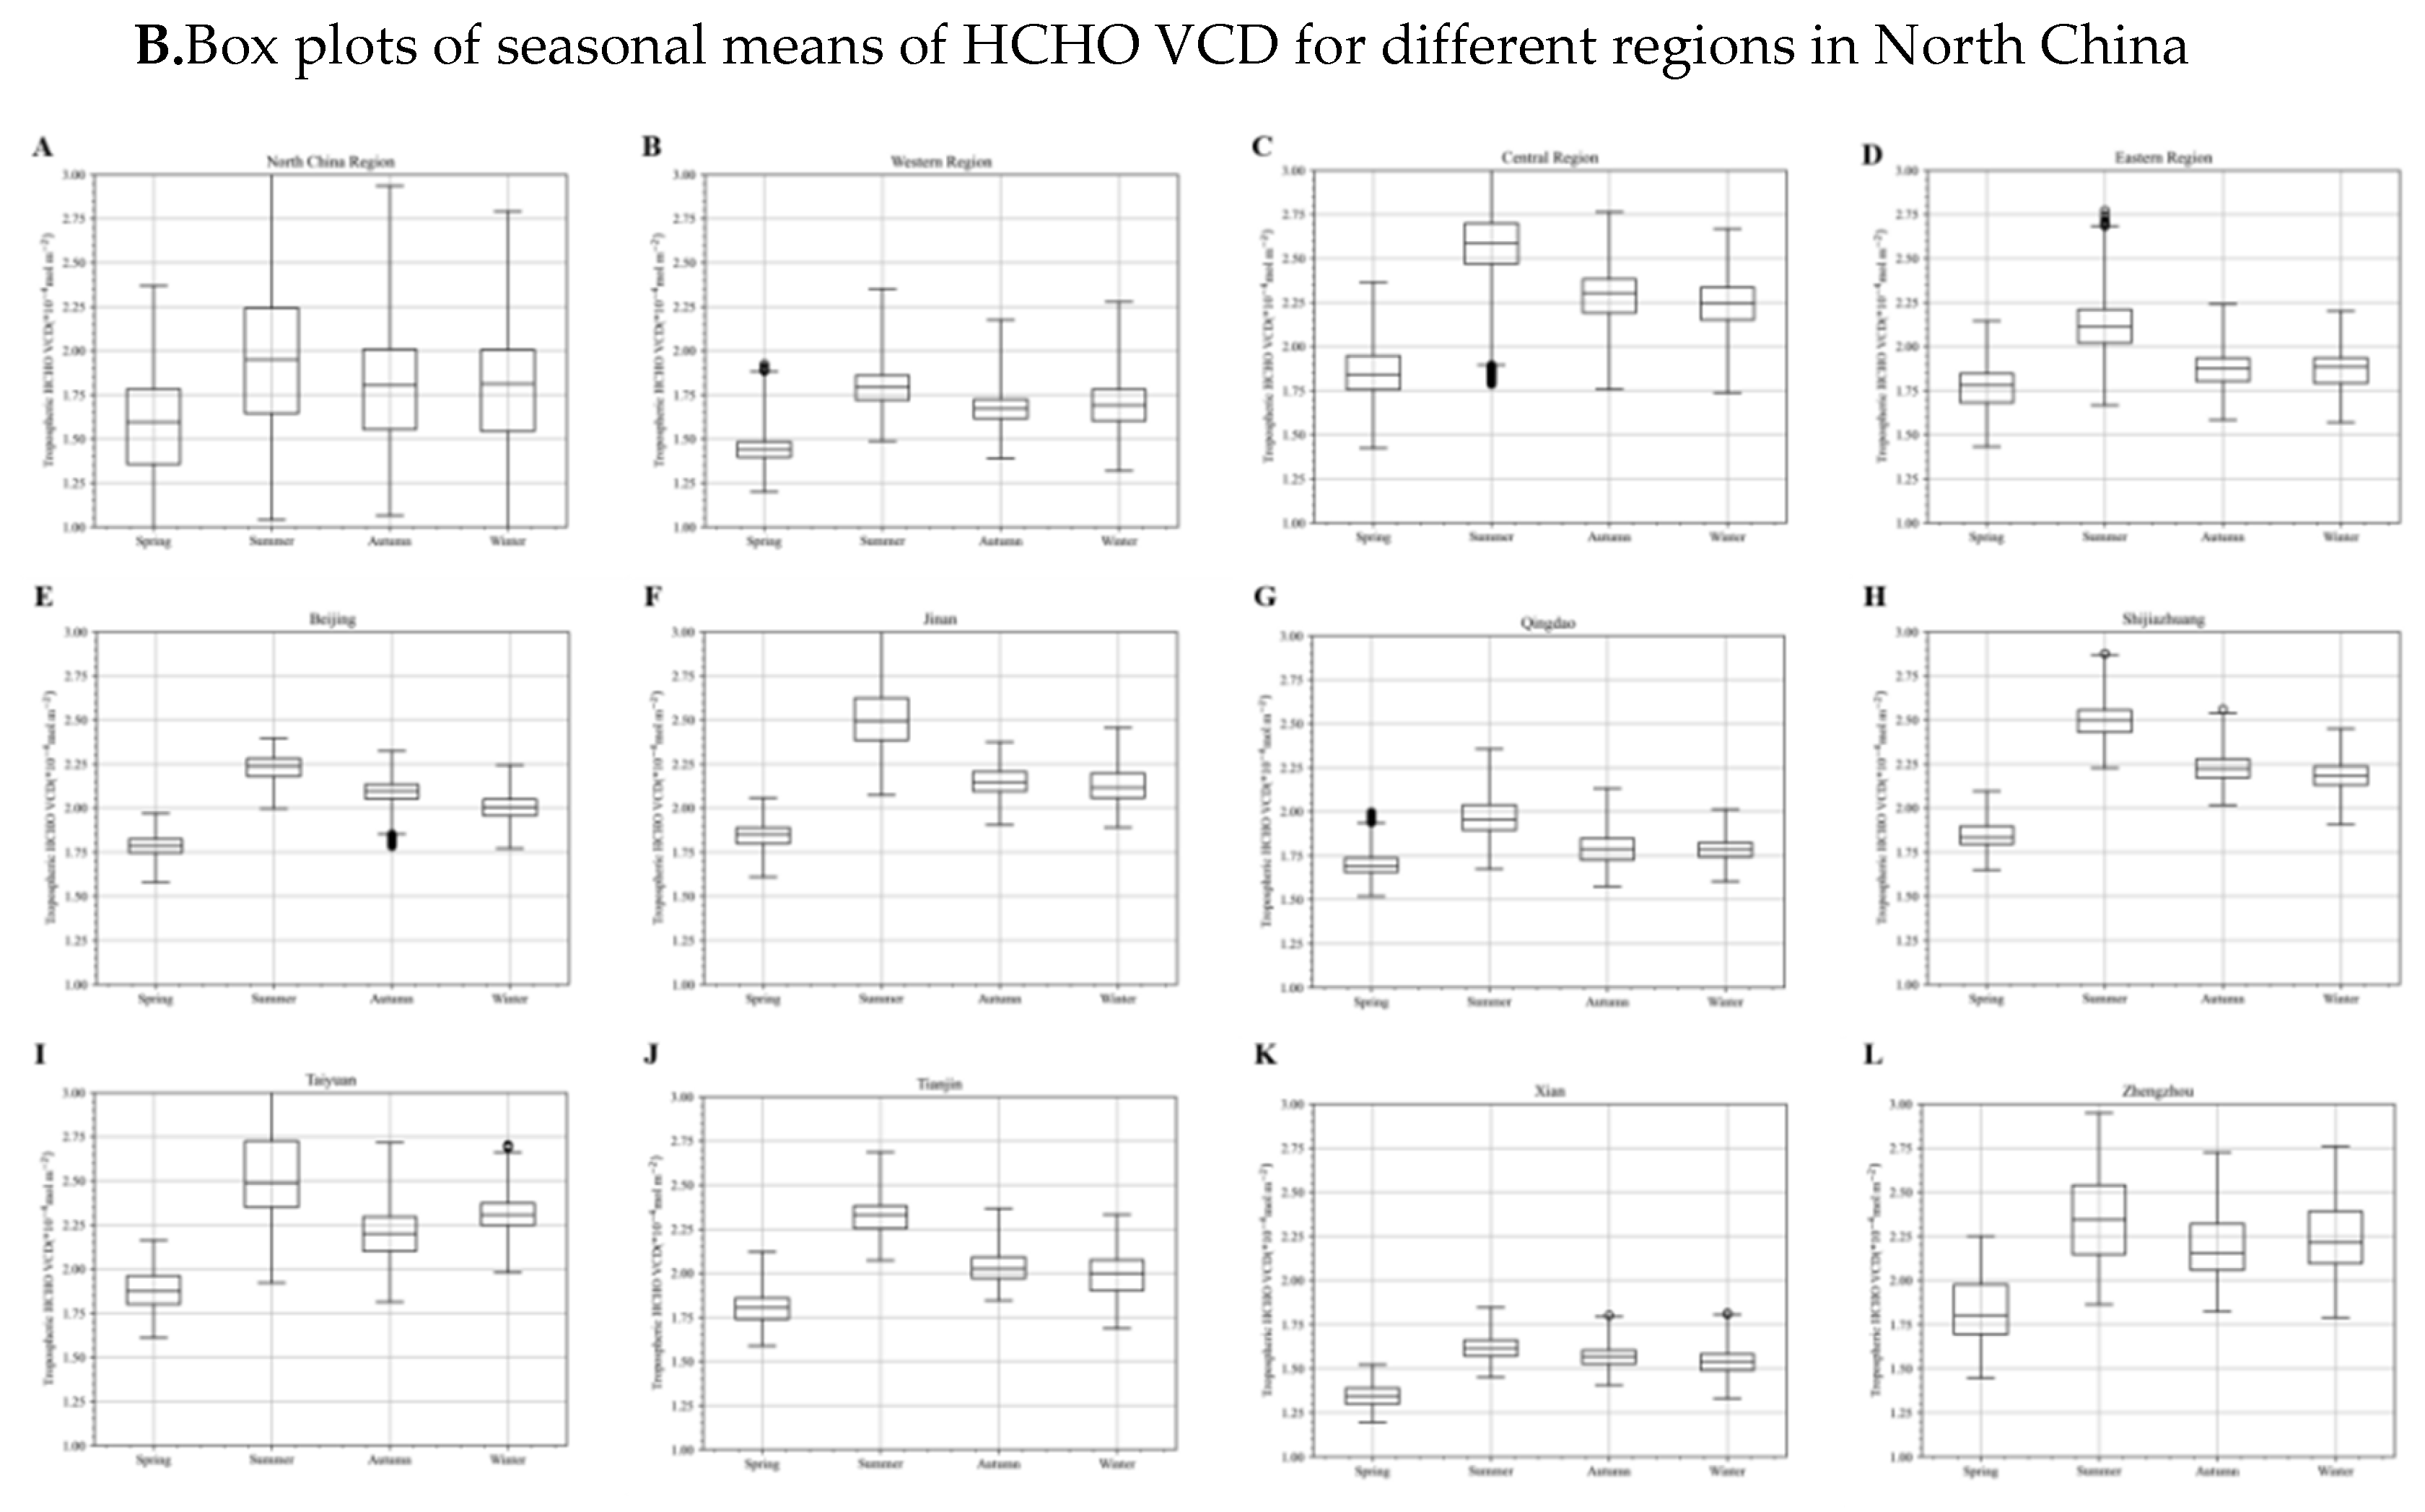
Figure 6.
Spatial distribution of tropospheric HCHO VCD and temperature dependence in North China during the growing season (a) and non-growing season(b),2019-2023.
Figure 6.
Spatial distribution of tropospheric HCHO VCD and temperature dependence in North China during the growing season (a) and non-growing season(b),2019-2023.
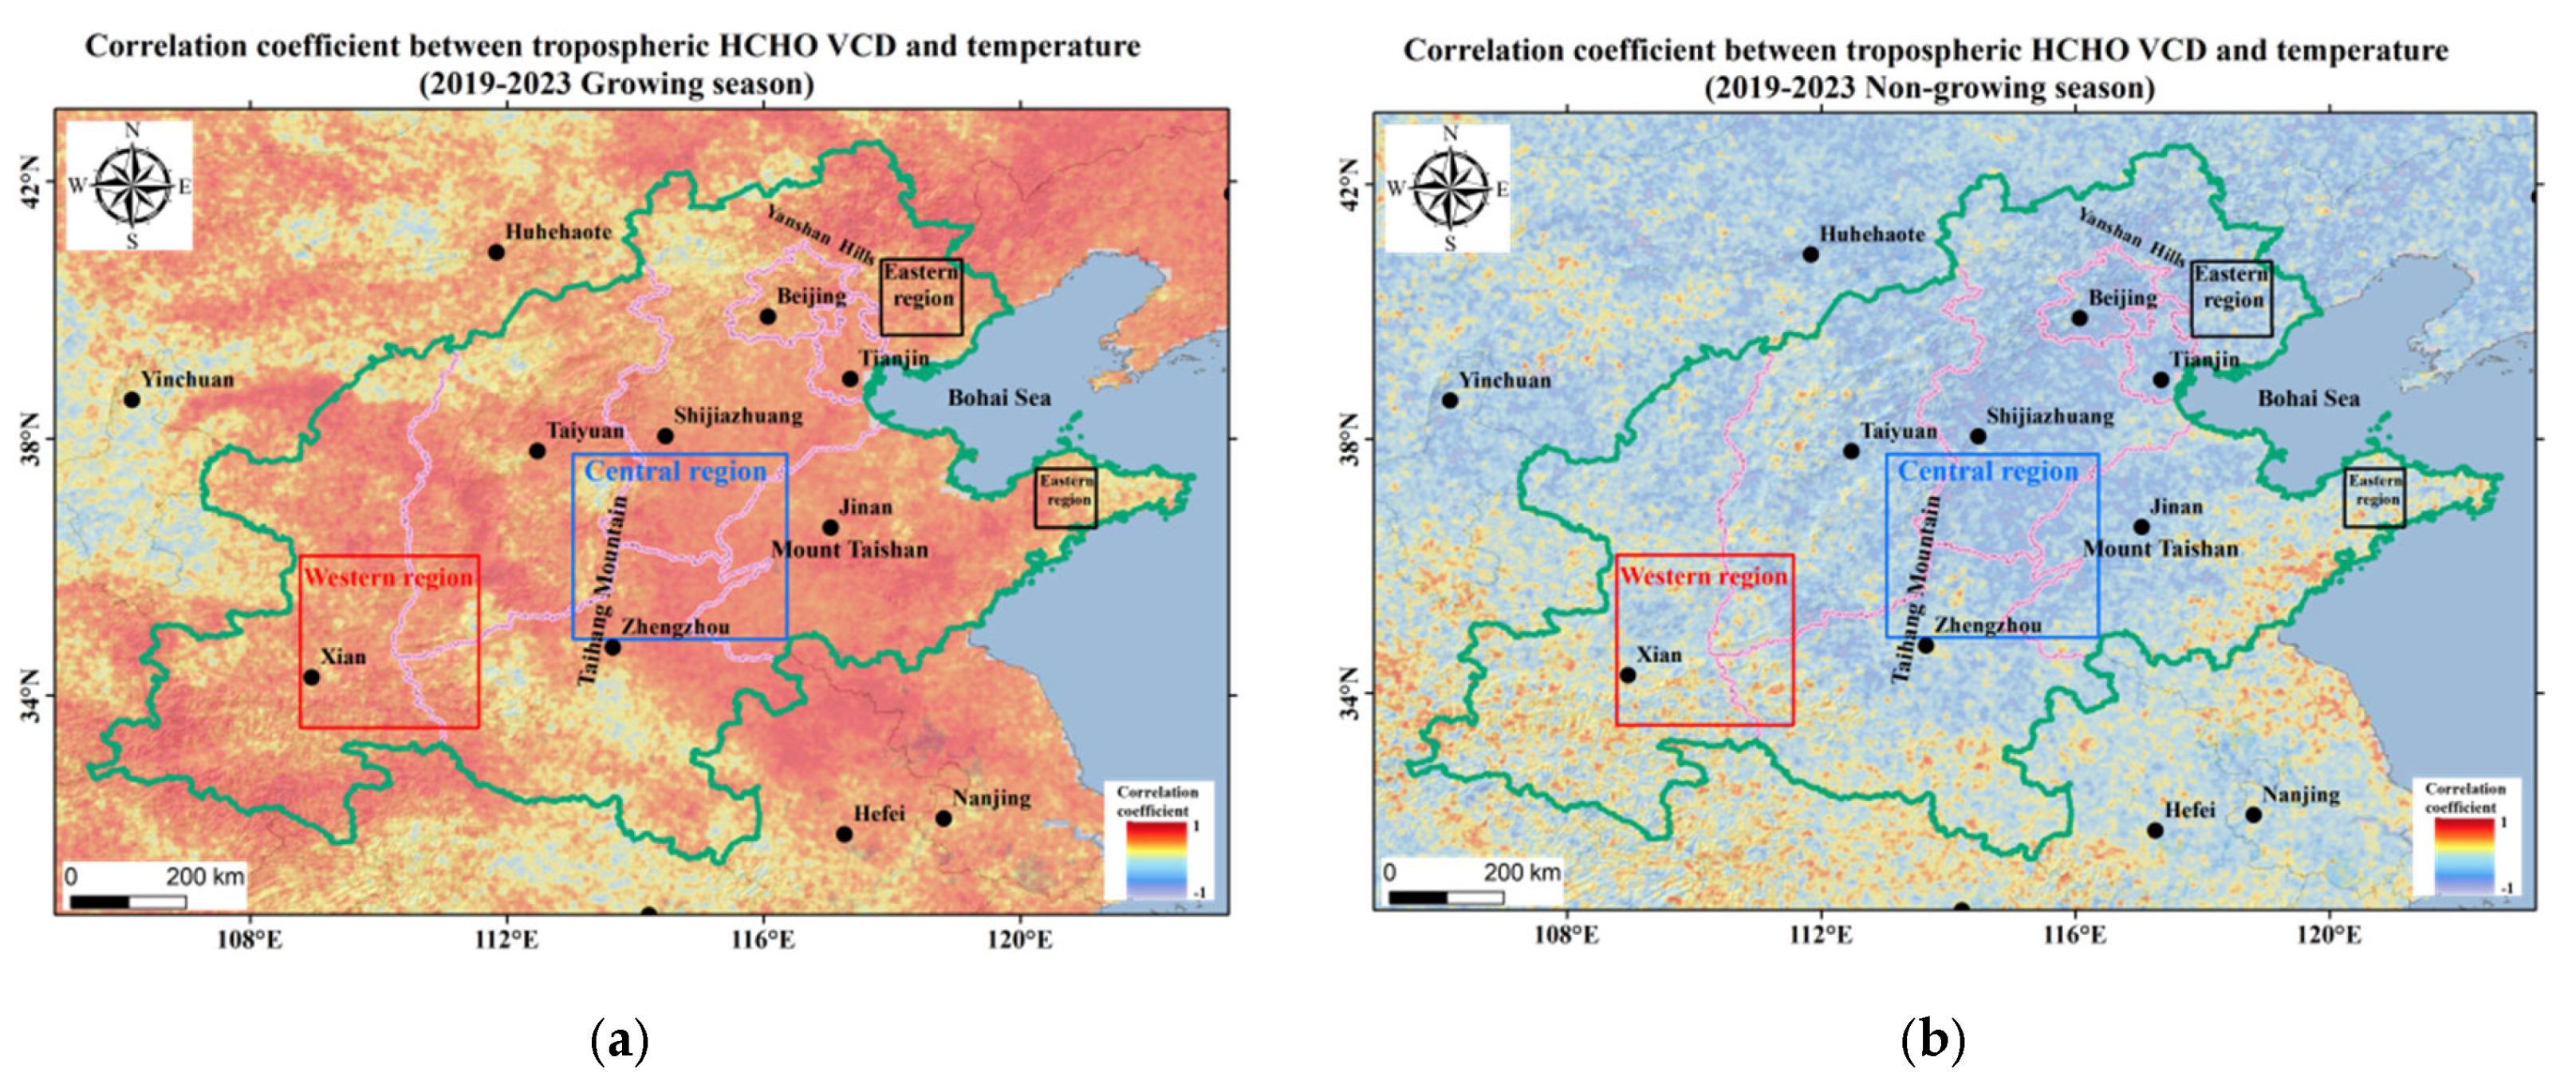
Figure 7.
Spatial distribution of tropospheric HCHO VCD and its relationship with precipitation during the growing season (a) and non-growing season (b) in North China, 2019-2023.
Figure 7.
Spatial distribution of tropospheric HCHO VCD and its relationship with precipitation during the growing season (a) and non-growing season (b) in North China, 2019-2023.
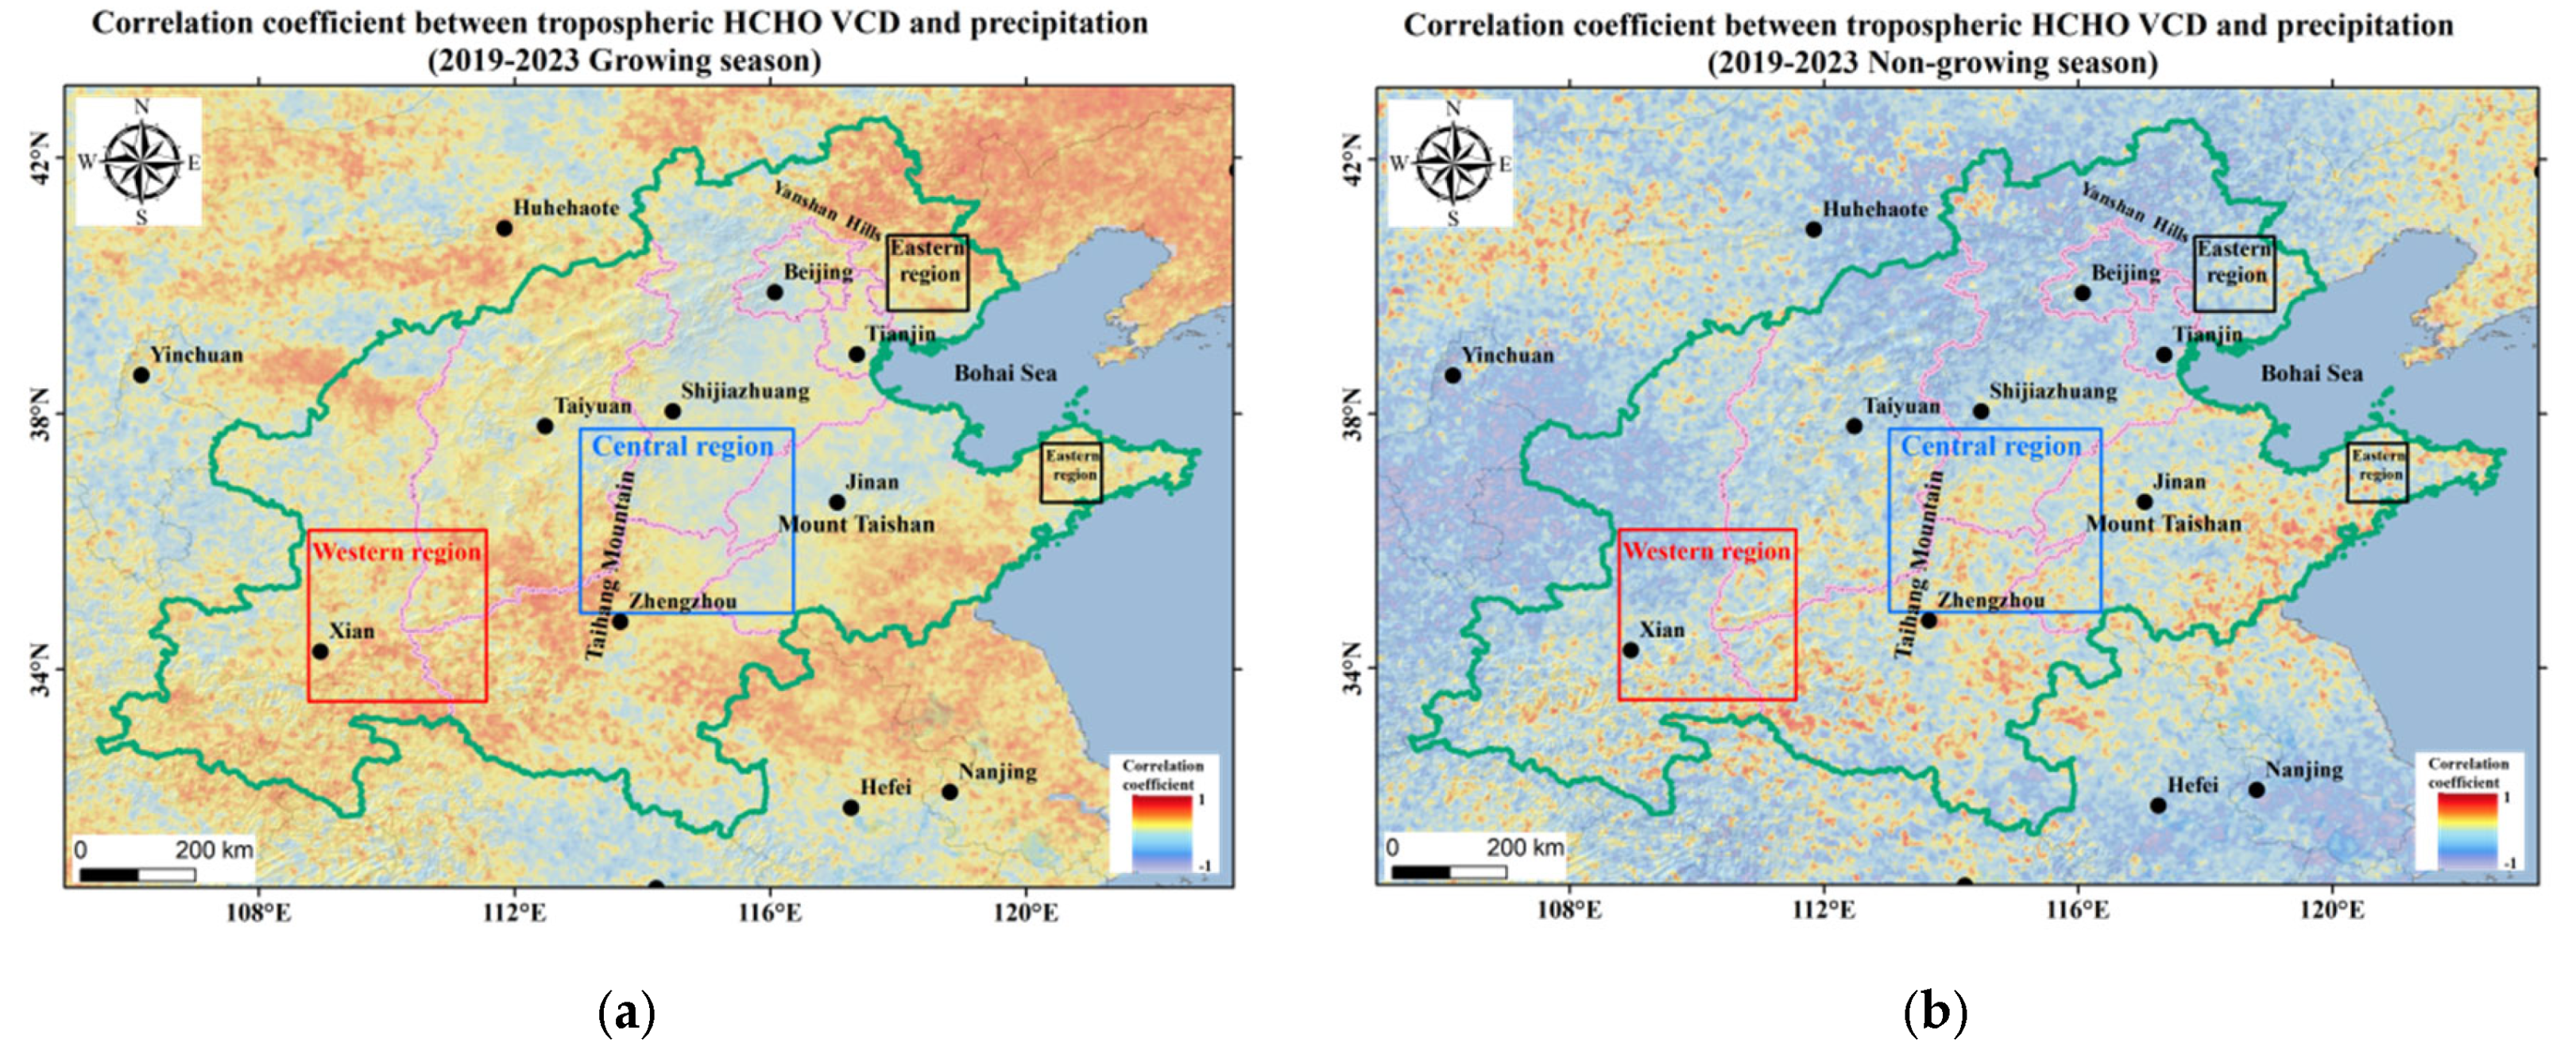
Figure 8.
Spatial distribution of tropospheric HCHO VCD and its relationship with wind speed during the growing season (a) and non-growing season (b) in North China, 2019-2023.
Figure 8.
Spatial distribution of tropospheric HCHO VCD and its relationship with wind speed during the growing season (a) and non-growing season (b) in North China, 2019-2023.
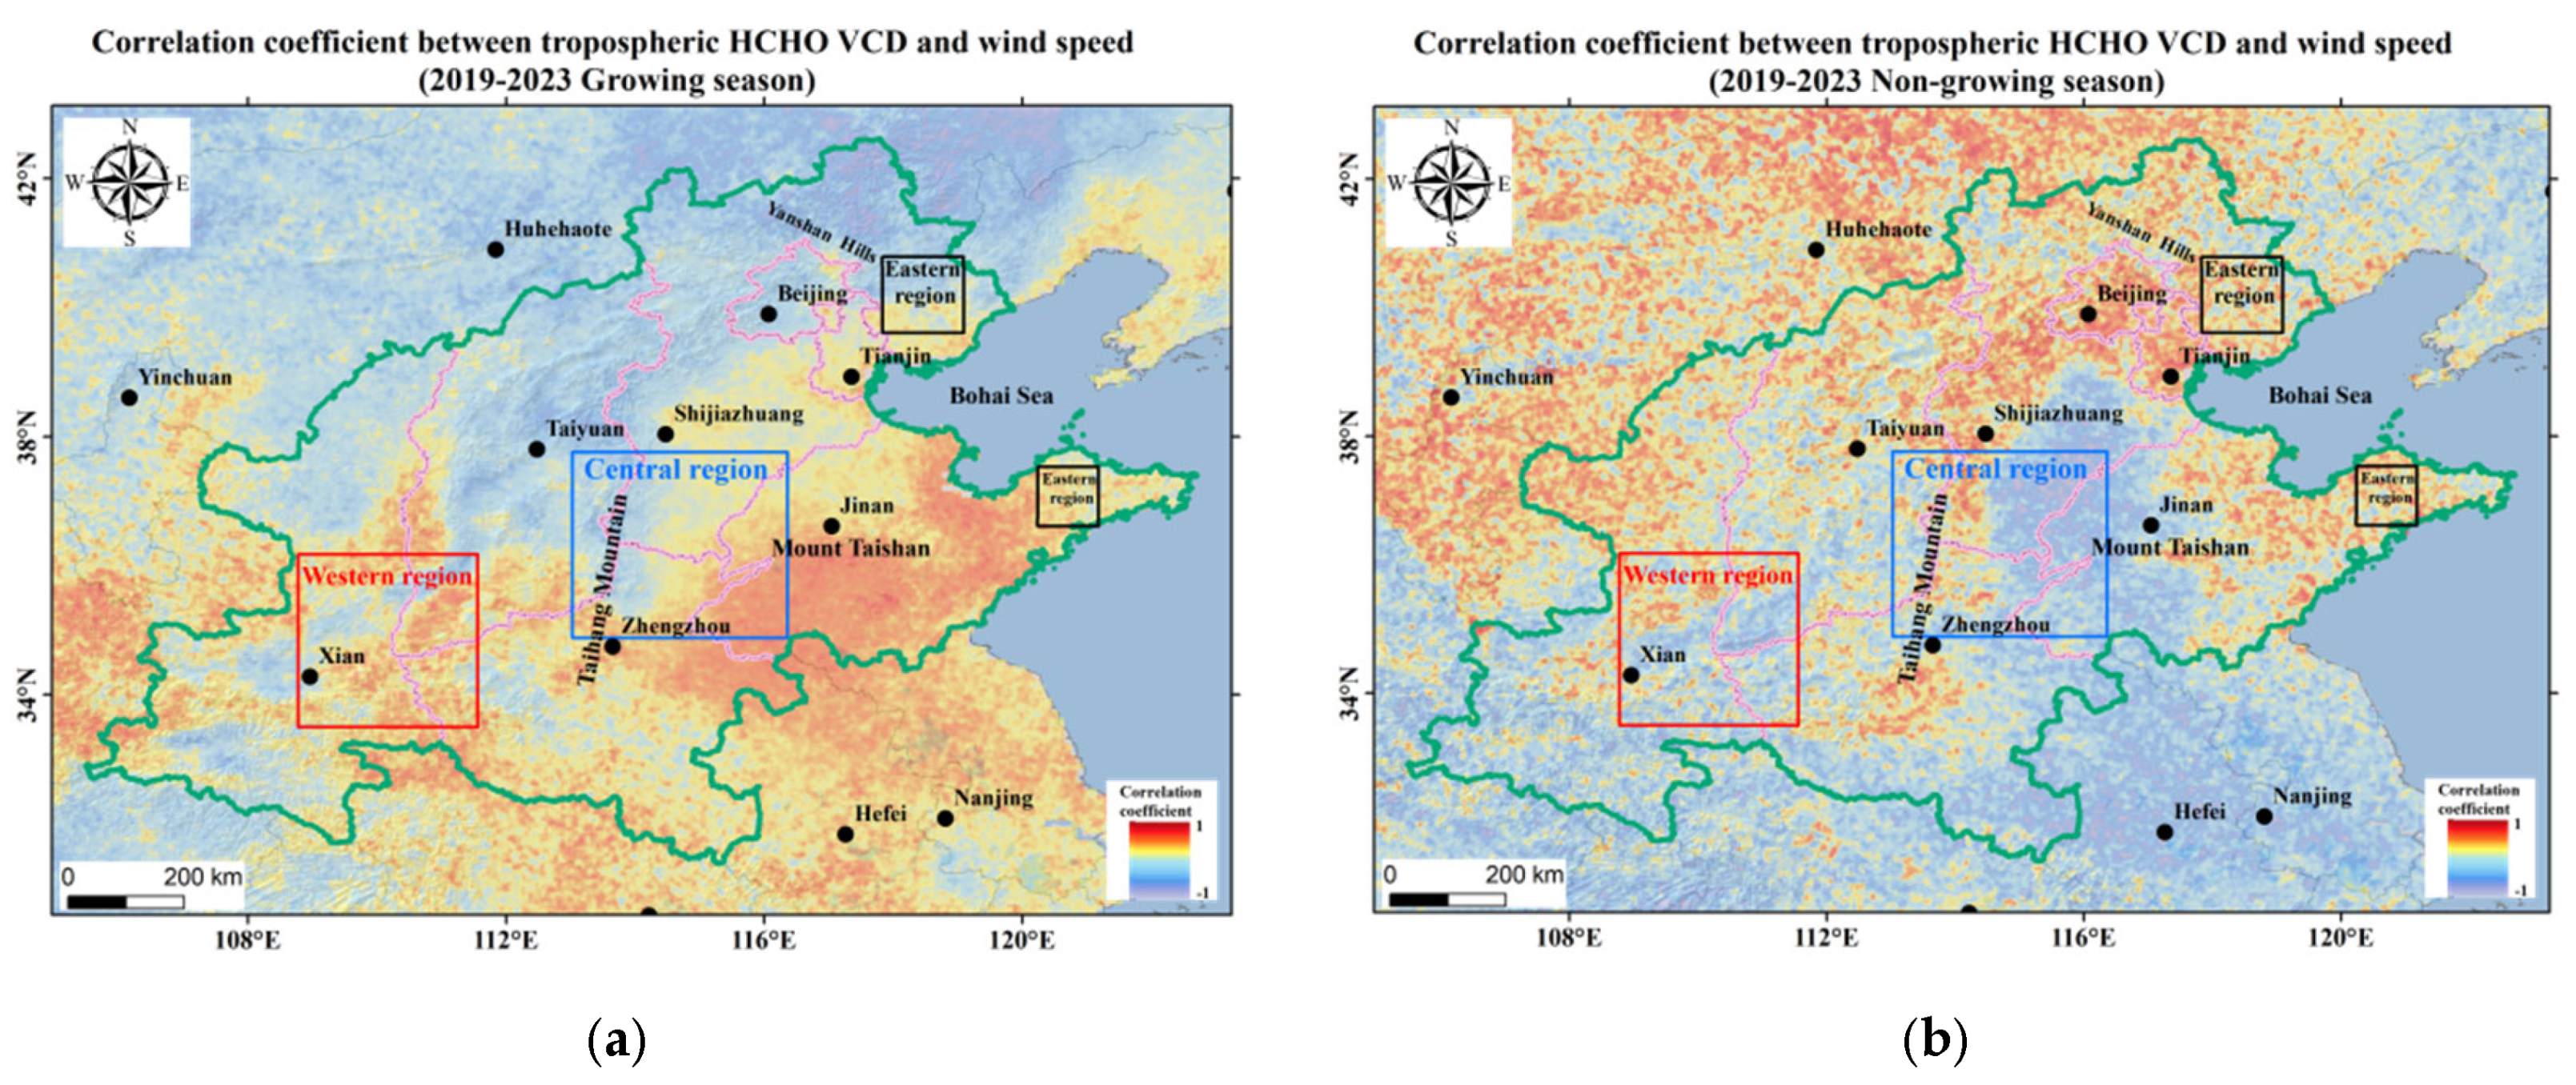
Figure 9.
Spatial distribution of tropospheric HCHO VCD and its relationship with net surface solar radiation during the growing season (a) and non-growing season (b) in North China, 2019-2023.
Figure 9.
Spatial distribution of tropospheric HCHO VCD and its relationship with net surface solar radiation during the growing season (a) and non-growing season (b) in North China, 2019-2023.
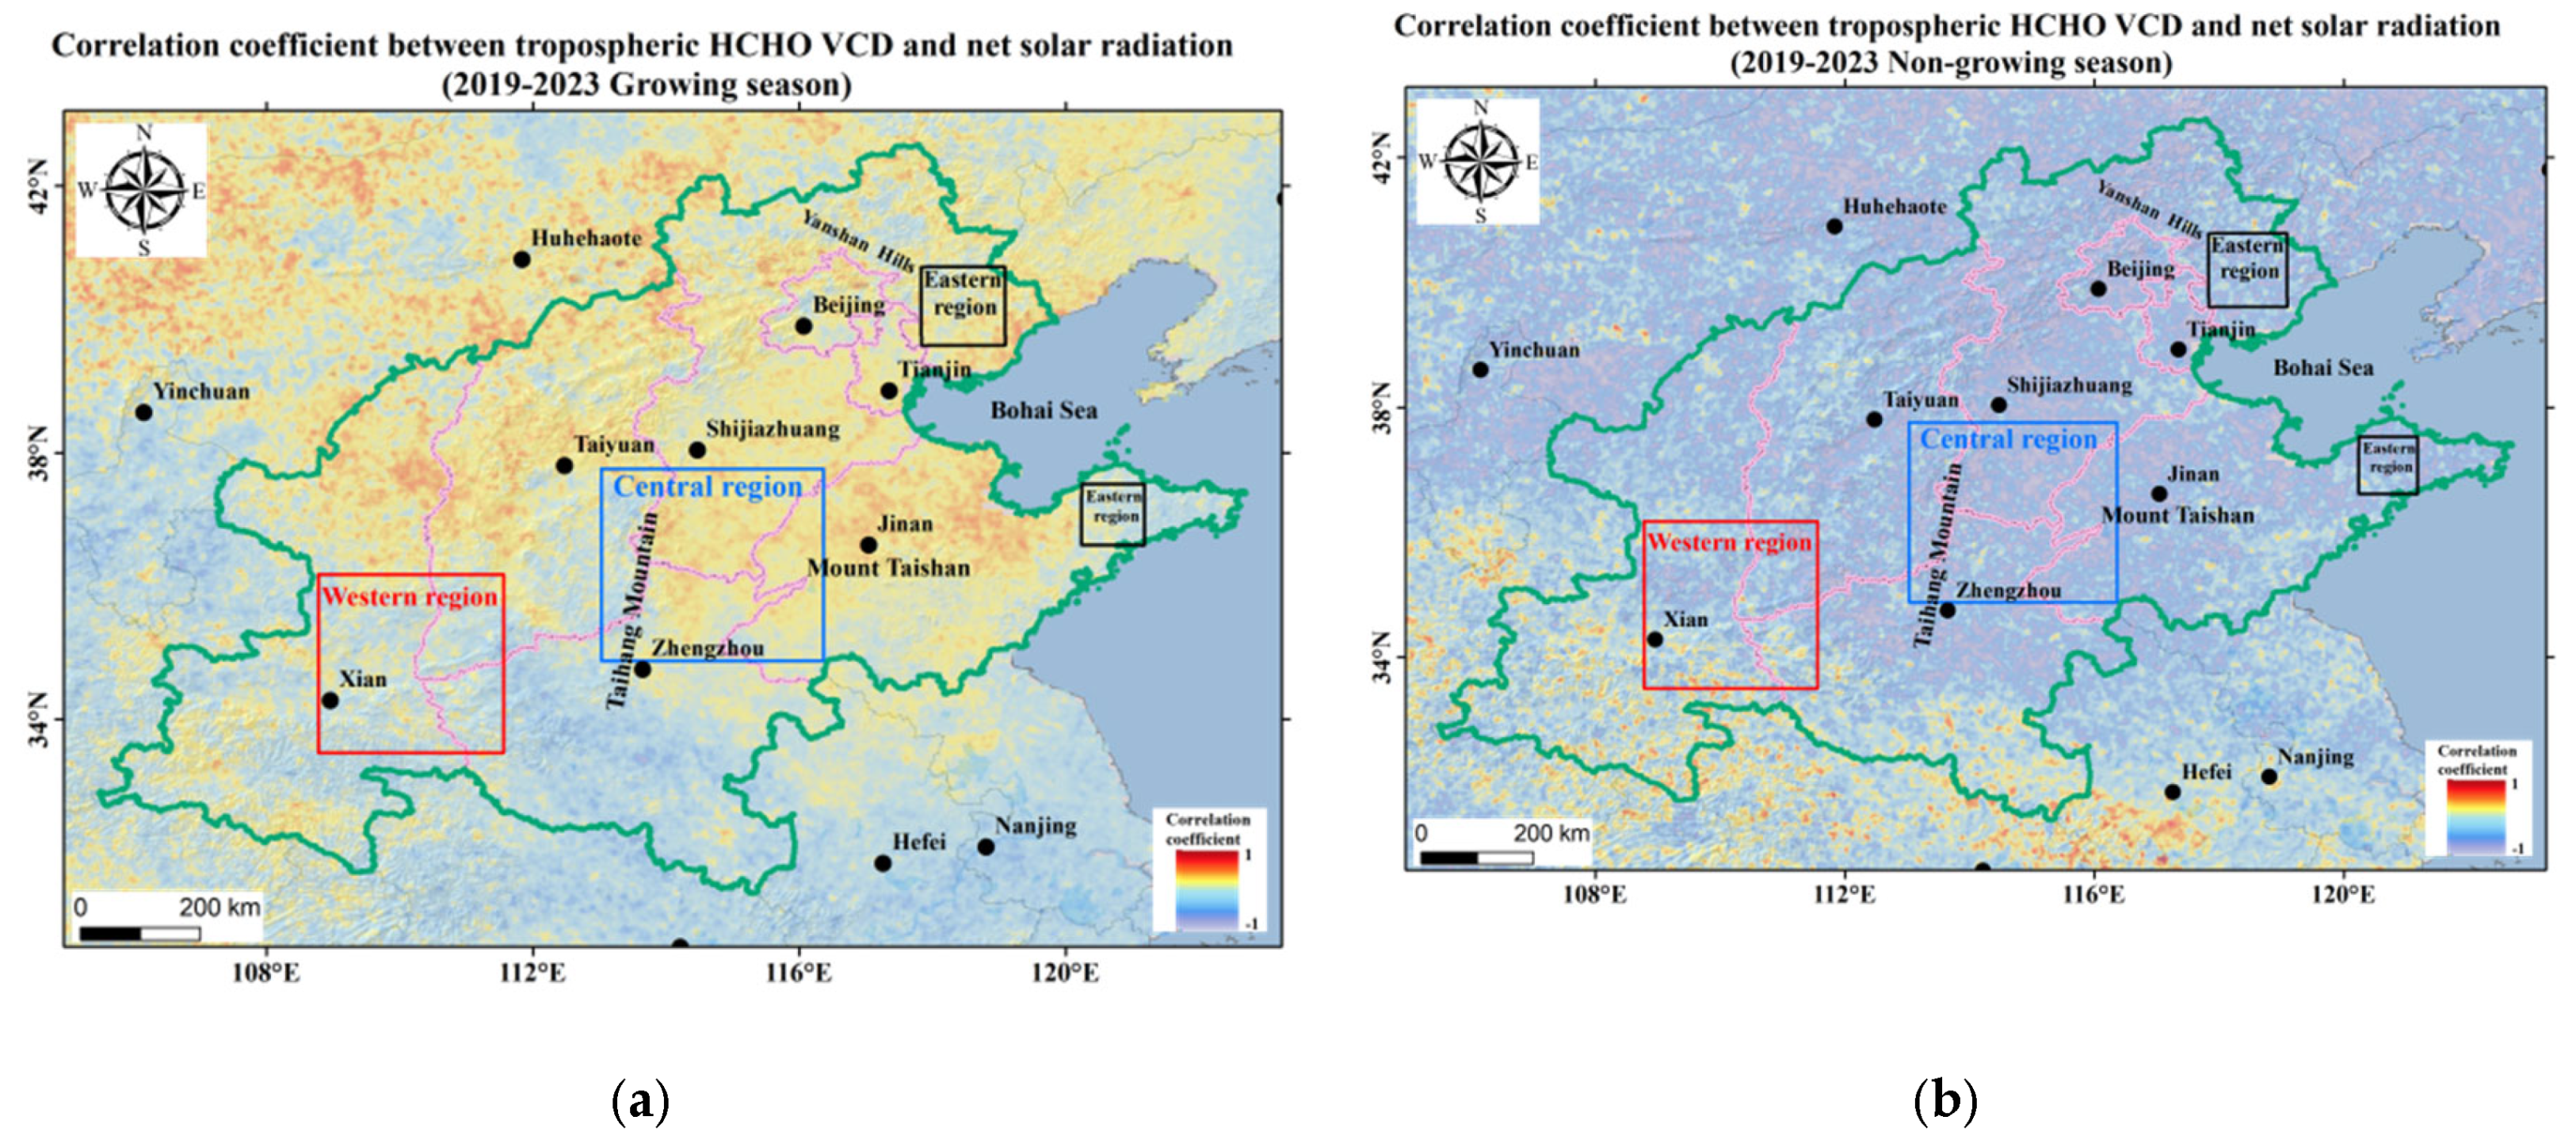
Figure 10.
Spatial distribution of tropospheric HCHO VCD and its relationship with NDVI during the growing season (a) and non-growing season (b) in North China, 2019-2023.
Figure 10.
Spatial distribution of tropospheric HCHO VCD and its relationship with NDVI during the growing season (a) and non-growing season (b) in North China, 2019-2023.
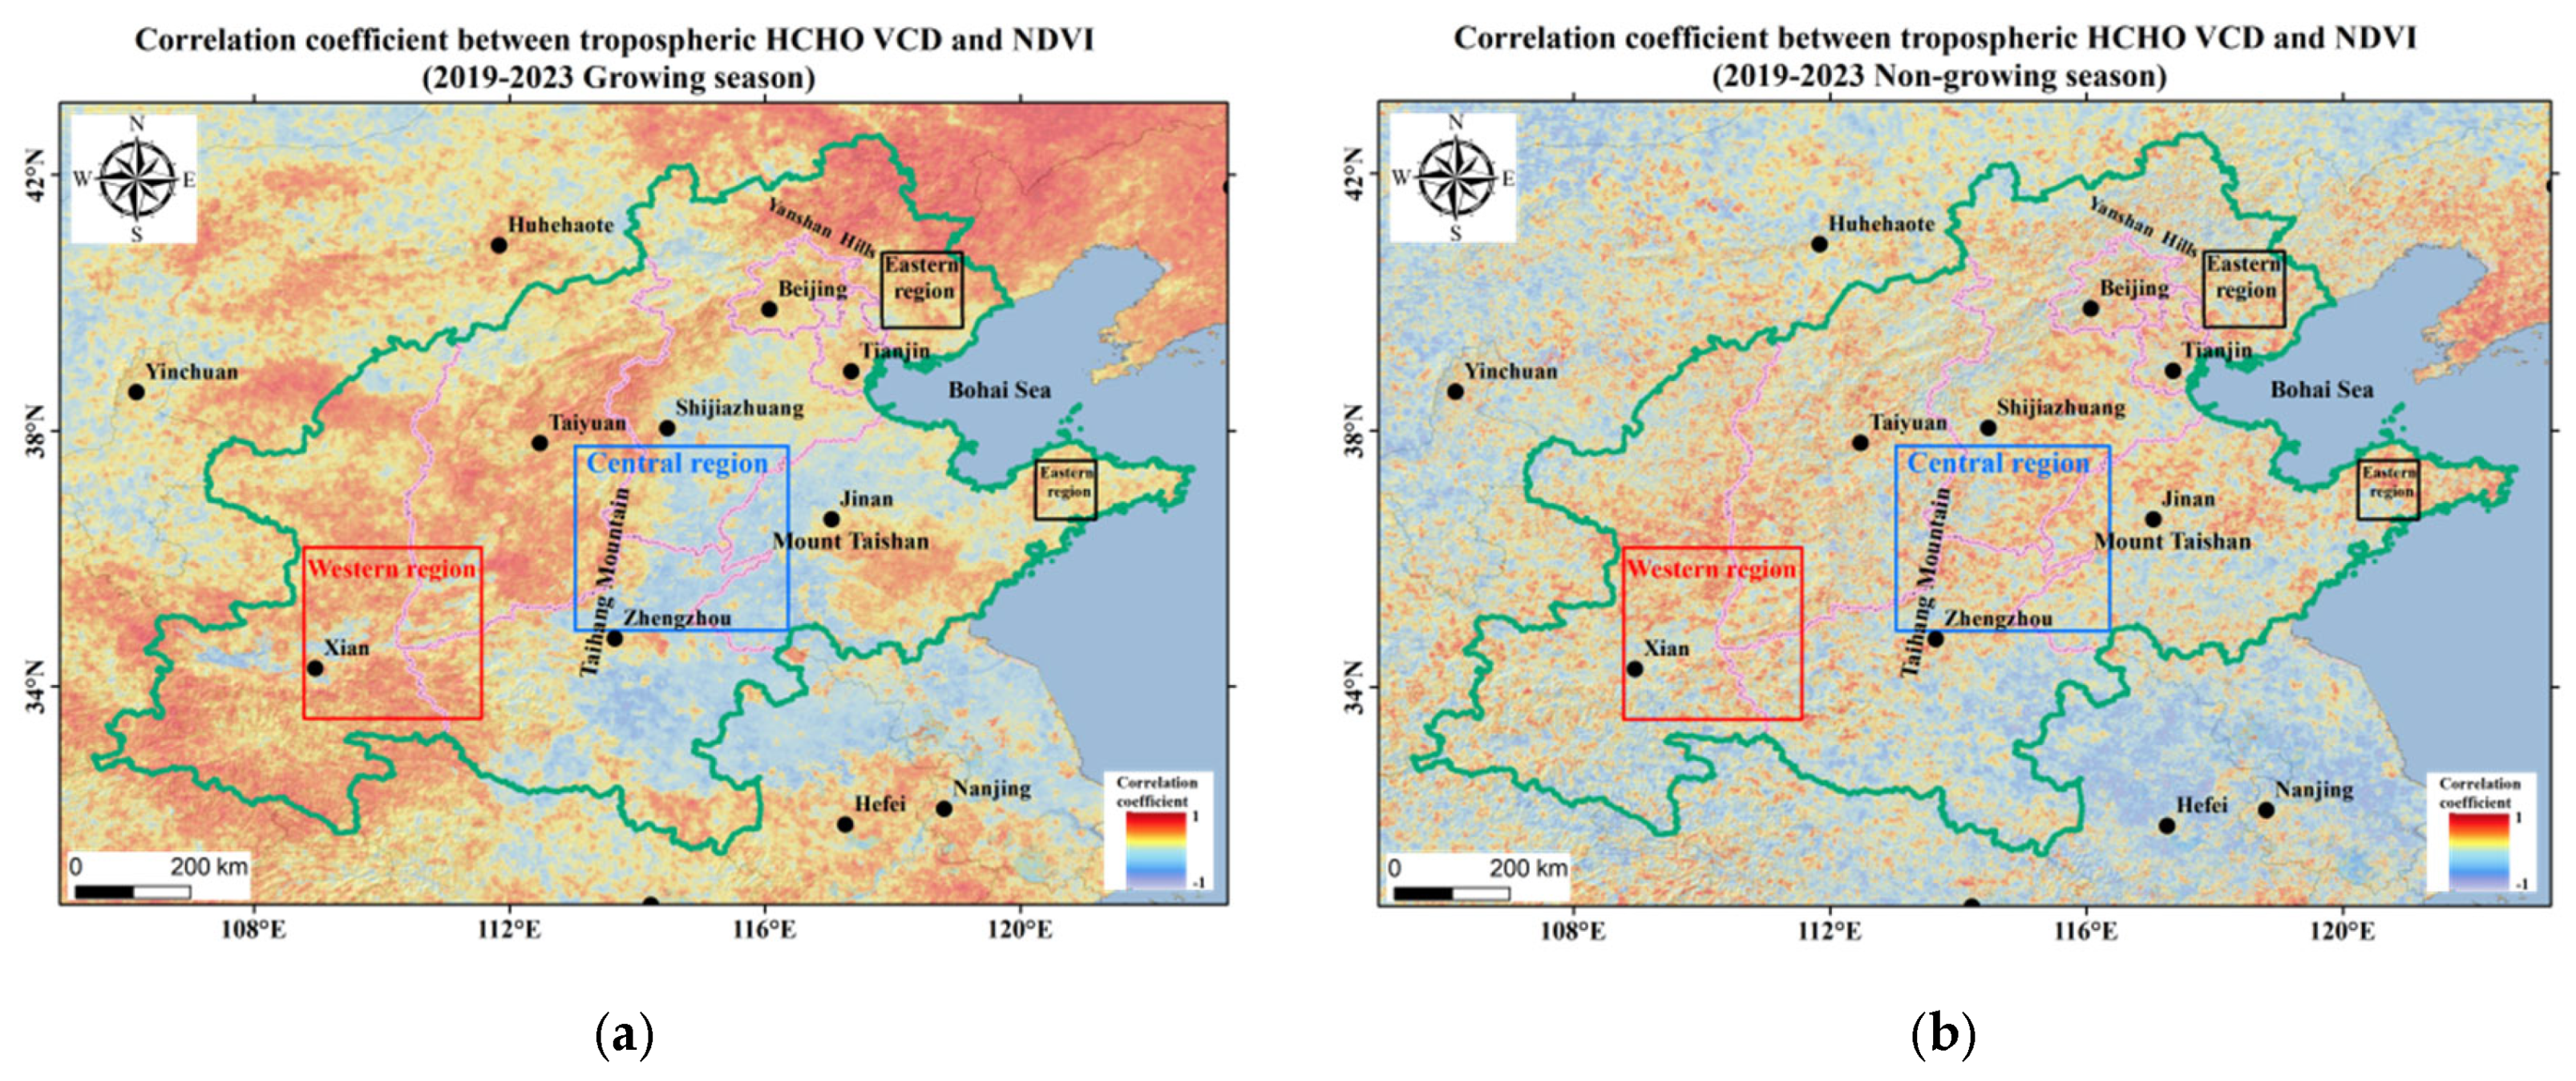
Figure 11.
Relationship between Population Density and Mean Tropospheric HCHO Column Concentration in Major Regions and Cities in North China, 2019-2023.
Figure 11.
Relationship between Population Density and Mean Tropospheric HCHO Column Concentration in Major Regions and Cities in North China, 2019-2023.
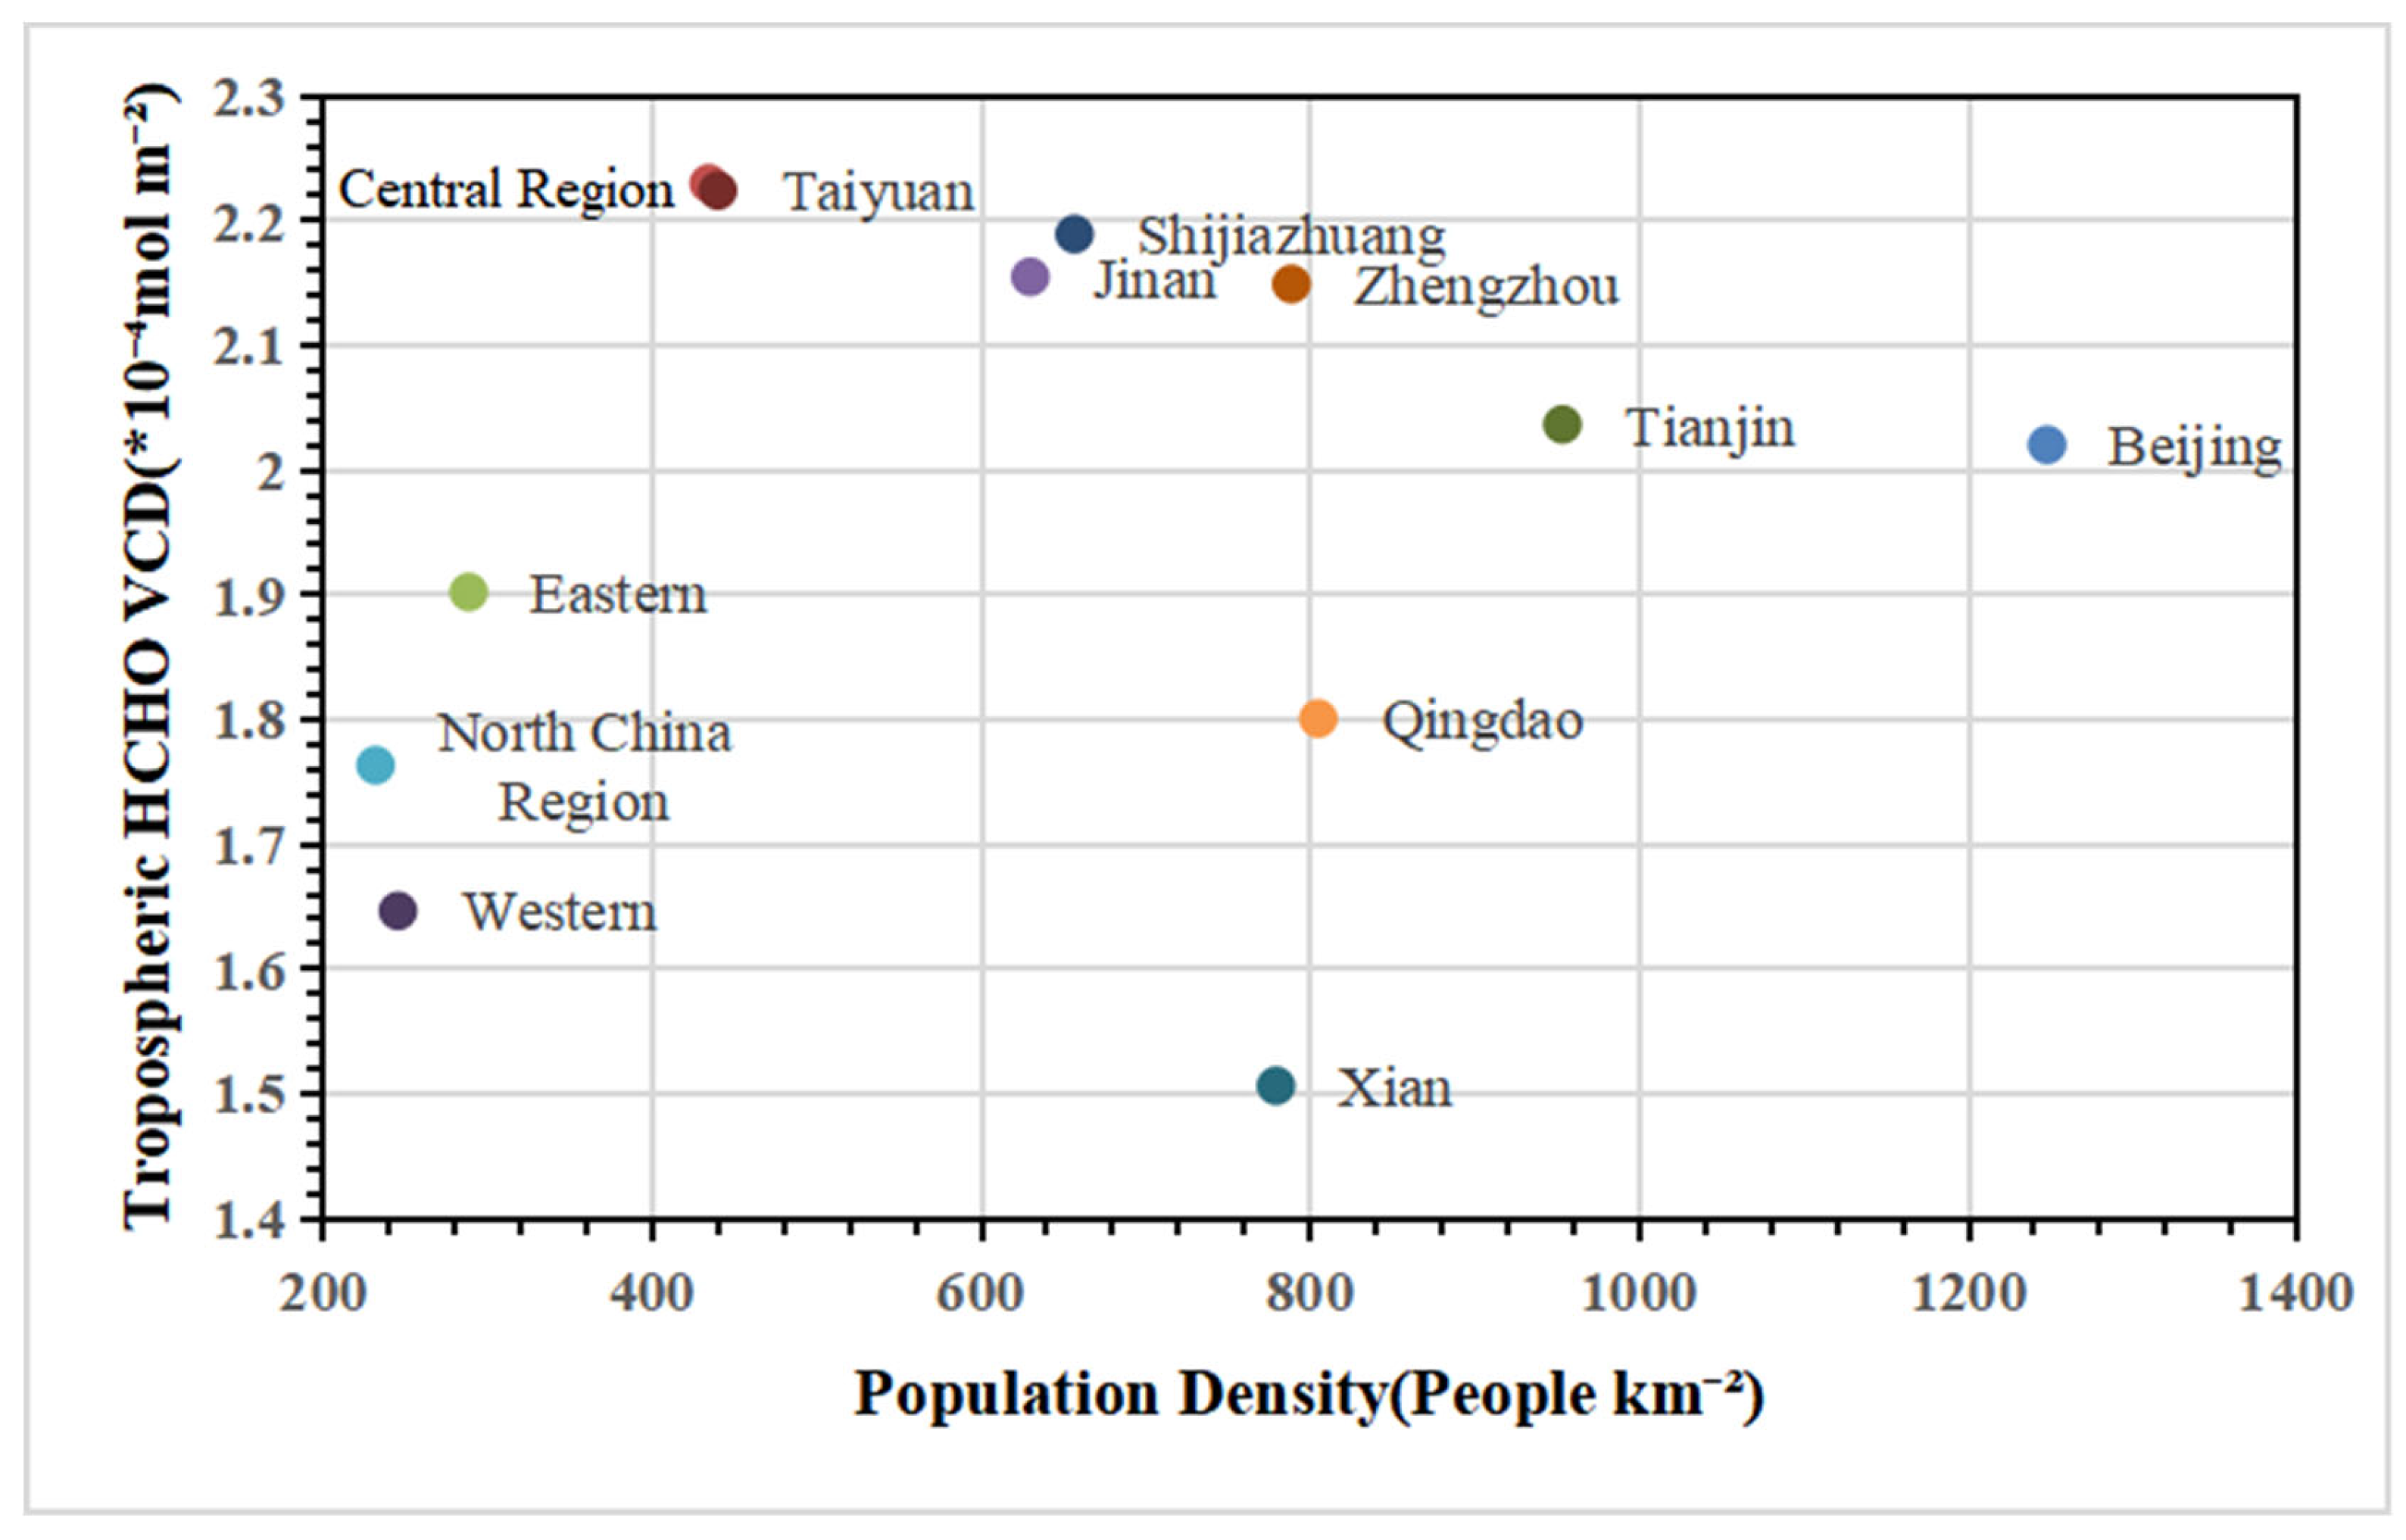

Table 1.
Mean tropospheric HCHO column concentrations, annual growth rates, and direct correlation coefficients (R) between measured and modeled HCHO data for eight typical cities in North China and its three regions, 2019-2023.
Table 1.
Mean tropospheric HCHO column concentrations, annual growth rates, and direct correlation coefficients (R) between measured and modeled HCHO data for eight typical cities in North China and its three regions, 2019-2023.
| Region and city name | Mean tropospheric HCHO VCD(10-4mol m−2) | Annual growth rate of tropospheric HCHO VCD(10-6 mol m−2 yr−1) | R | RMSE(10-4 mol m−2) |
|---|---|---|---|---|
| North China Region | 1.76 | 1.37 | 0.90 | 0.08 |
| Western Region | 1.65 | 1.93 | 0.89 | 0.08 |
| Central Region | 2.23 | -1.22 | 0.87 | 0.18 |
| Eastern Region | 1.90 | 0.15 | 0.76 | 0.13 |
| Beijing | 2.02 | 0.61 | 0.79 | 0.20 |
| Jinan | 2.15 | -0.55 | 0.83 | 0.21 |
| Qingdao | 1.80 | 1.63 | 0.73 | 0.13 |
| Shijiazhuang | 2.19 | 0.14 | 0.84 | 0.20 |
| Taiyuan | 2.22 | 0.35 | 0.87 | 0.17 |
| Tianjin | 2.04 | -0.94 | 0.80 | 0.20 |
| Xian | 1.51 | 2.13 | 0.80 | 0.09 |
| Zhengzhou | 2.15 | -1.59 | 0.86 | 0.14 |
All correlation coefficient (R) is significant (p < 0.01).
Disclaimer/Publisher’s Note: The statements, opinions and data contained in all publications are solely those of the individual author(s) and contributor(s) and not of MDPI and/or the editor(s). MDPI and/or the editor(s) disclaim responsibility for any injury to people or property resulting from any ideas, methods, instructions or products referred to in the content. |
© 2025 by the authors. Licensee MDPI, Basel, Switzerland. This article is an open access article distributed under the terms and conditions of the Creative Commons Attribution (CC BY) license (http://creativecommons.org/licenses/by/4.0/).
Copyright: This open access article is published under a Creative Commons CC BY 4.0 license, which permit the free download, distribution, and reuse, provided that the author and preprint are cited in any reuse.


