Submitted:
28 February 2025
Posted:
03 March 2025
You are already at the latest version
Abstract
The quality of biomedical signals collected by wearable devices is crucial for accurate physiological monitoring and detecting potential deviations. This study evaluates the effectiveness of various filtering algorithms for photoplethysmographic (PPG) signals, including low-pass, moving average, weighted average, and Kalman filters, to determine the optimal method for noise reduction while preserving key parameters such as heart rate (HR) and blood oxygen saturation (SpO₂). Data were collected using an ESP32 microcontroller and MAX30102 sensor in stationary and motion conditions. Noise levels were analyzed over 20-second intervals with high artifact presence. The results indicate that the Kalman filter achieves the best balance between noise suppression and signal integrity, preserving peak components and ensuring accurate physiological readings (HR: 87.06 bpm, SpO₂: 85.37%). In contrast, the low-pass filter excessively smooths peaks, affecting accuracy, while the moving and weighted average filters offer moderate noise reduction with varying adaptability. The findings highlight the importance of selecting appropriate filtering techniques based on computational constraints and noise levels. The Kalman filter is preferred for real-time monitoring in dynamic conditions, while simpler filters may suffice in lower-noise environments. Future research could explore machine learning-driven adaptive filtering for enhanced diagnostic accuracy and real-time medical applications.
Keywords:
photoplethysmography (PPG)
; biomedical signal filtering
; wearable devices
; Kalman filter
; low-pass filter
; moving average
; weighted average filter
; medical monitoring
1. Introduction
With the development of technology, wearable medical devices have become an important component of modern preventive and personalized medicine. These devices provide continuous monitoring of physiological parameters, such as heart rate, blood oxygen saturation, respiratory rate, and other critical indicators. The accumulated data opens up new opportunities for timely detection of pathological changes in the body, including cardiovascular and respiratory disorders. However, the effectiveness of these devices depends not only on the accuracy of the sensor modules, but also on the ability to process the received biosignals in the face of significant external interference [1].
One of the main challenges in processing biomedical signals is their susceptibility to noise and artifacts resulting from user movement [2], external electromagnetic interference, and changing environmental conditions. Even a slight movement of the hand or a change in body position can cause significant distortion of the photoplethysmography (PPG) or electrocardiogram (ECG) signals [3], which leads to erroneous interpretations of biophysiological processes. Reducing the impact of these artifacts is a prerequisite for ensuring reliable diagnostics and improving the accuracy of disease prognosis.
Modern signal processing methods are focused on the use of various filtering algorithms that allow for effective noise removal and preservation of the informative part of the signal. These algorithms include low-pass and high-pass filters, moving average filters [4], weighted average methods, and adaptive algorithms, such as the Kalman filter [5]. The choice of the optimal approach depends on several factors: the type of noise, the dynamic characteristics of the signal, and the limitations of the hardware platform on which the processing is performed.
In the context of wearables, the main problem is the limited computing resources of microcontrollers used for local data processing [6]. Unlike cloud platforms, where large amounts of memory and high computing power are available, microcontrollers have limited RAM and relatively slow processors. This creates additional challenges in the development of real-time systems, where each algorithm must not only be efficient but also optimally adapted to hardware limitations. In addition, it is critical to minimize power consumption to ensure long battery life of devices.
This article aims to investigate different algorithms for filtering biomedical signals and evaluate their effectiveness in the context of using them on microcontrollers with limited resources. We will consider both classical approaches and modern adaptive methods that can be implemented on portable devices with minimal performance loss. Particular attention is paid to analyzing the impact of filtering on signal quality and real-time processing delay. The results of the study will allow us to formulate recommendations for developers of portable medical devices on the optimal choice of data processing algorithms depending on the specifics of the application and technical limitations.
Thus, the reasonable implementation of effective filtering algorithms at the microcontroller level can provide a significant improvement in the quality of diagnostic data, increase the reliability of real-time systems, and extend the battery life of wearable devices. This opens up new opportunities for the use of personalized medical systems in everyday life, in particular for monitoring the health status of patients outside of medical institutions.
2. Materials and Methods
2.1. PPG Signal Data Collection
To conduct an experiment to evaluate the effectiveness of the filtering algorithms, a set of photoplethysmographic (PPG) signals was collected using a hardware platform that included an ESP32 microcontroller and a MAX30102 optical sensor. This combination was chosen due to its availability, energy efficiency, and widespread use in portable biomedical devices. The MAX30102 provides high sensitivity to changes in blood circulation by measuring infrared and red light absorption, which allows for accurate heart rate (HR) and blood oxygen saturation (SpO₂) readings.
The data was collected at a sampling rate of 100 Hz, which meets the standards for biomedical signal processing and provides sufficient detail to detect artifacts and eliminate them using filtering methods. This choice is based on Kotelnikov’s theorem (the counting theorem), which states that for accurate signal reproduction, the sampling rate must be at least twice the maximum signal frequency. Since the human heart rate usually does not exceed 3 Hz (180 beats per minute), a sampling rate of 100 Hz is sufficient for accurate reproduction of PPG signals. This is also consistent with practice, where 100 Hz sampling rate is often used to collect PPG signals in wearable devices. The data was stored on a memory card for further processing. To avoid data loss, a signal buffering mechanism was implemented at the microcontroller level, which allowed us to maintain a sequence of values without gaps when writing to the memory card.
2.2. Data Collection Conditions
To ensure the reliability of the results, the data was collected in two different experimental conditions that maximally approximate real-world scenarios of wearable device use:
- Resting state: The patient was in a sitting or lying position with minimal motor activity. In this condition, signals with a minimum level of artifacts were expected to be obtained, which allows them to be used as a benchmark for comparison. This mode is important for testing filters for their ability to preserve signal information without excessive smoothing of its key components, such as peaks and minimum fluctuations.
- Condition in motion: The patient performed moderate physical activity, which included arm movements, walking, and changes in body position. This condition simulated typical scenarios of using wearable devices in everyday life, where motion noise is often observed, which significantly affects signal quality. The data obtained in this condition is key to testing filters for their ability to effectively eliminate artifacts while preserving important biomedical signal features.
For each of the two conditions, 5 independent signal recording cycles were performed, each lasting 5 minutes. This approach provided a significant amount of data for statistical analysis and comparison of different filtering algorithms.
2.3. Selecting Segments for Analysis
The collected signals were characterized by various noise levels that varied depending on the intensity of motor activity. To investigate the effectiveness of the filtering algorithms in the most difficult conditions, a 20-second segment (Figure 1) with the maximum level of artifacts was selected from each recording. The choice of this interval was based on visual analysis of the signal and automatic detection of areas with the largest deviations from the baseline, which are usually associated with movement or electromagnetic interference.
The graph (Figure 1) shows the raw photoplethysmography (PPG) signals collected using the MAX30102 sensor and the ESP32 microcontroller under controlled experimental conditions. The signals reflect two main channels: the infrared channel (IR) and the red channel (Red), which are used to determine the heart rate (BPM) and blood oxygen saturation (SpO₂). In addition, the graph shows peak points that correspond to moments of systolic blood pressure.
- Blue curve (Raw IR Data): Displays the raw signal received from the infrared channel. This signal is the main one for estimating heart rate because it is sensitive to changes in blood volume in tissues.
- Green curve (Raw Red Data): Shows data from the red channel used to calculate SpO₂. This channel reflects the amplitude fluctuations caused by the oxygen saturation of the blood.
- Orange marks (Peaks): Indicates the peak values of systolic waves that correspond to the moments of maximum blood filling of the vessels. These peaks are critical for calculating BPM.
The signals collected during the user’s motor activity are characterized by a significant level of noise and artifacts, which is a typical problem for wearable devices in real-world use cases. During the experiment, the data was collected in a moderate motion mode that simulated walking, hand movements, or changes in body position. This resulted in significant distortions in the signal amplitude, in particular in the form of sudden spikes or oscillations that went beyond the characteristic fluctuations of the heart rate.
The graph (Figure 2) shows the raw signals collected during the user’s motor activity, illustrating the typical artifacts characteristic of this condition. The signals are obtained from two main channels: infrared (IR) and red (Red), which are the basis for calculating biomedical indicators, such as heart rate (BPM) and blood oxygen saturation (SpO₂).
The graph shows several key features:
- Unstable amplitude: Both the IR and Red channels show significant fluctuations due to the movement of the sensor on the skin or slight changes in body position.
- Sudden peaks and dips: The signal occasionally contains sudden spikes in amplitude that may be due to slippage of the sensor or short-term loss of skin contact.
- Low frequency noise: Smooth changes in the baseline of the signal indicate drift caused by slow movements or uneven pressure on the skin.
These features demonstrate the complexity of processing raw signals while in motion. Without proper filtering, such artifacts can lead to erroneous heart rate and SpO₂ values, which critically affects the reliability of measurements. The selected data segments (Figure 2) are ideal for testing filtering algorithms because they contain typical distortions encountered in real-world wearable device use.
2.4. Methodological Foundations and Implementation of Filtering Algorithms
Signal filtering is an integral part of biomedical data processing, especially when it comes to real-time wearable devices. Biomedical signals, such as photoplethysmography (PPG) and electrocardiogram (ECG), are prone to a variety of noise and artifacts that can be caused by the user’s motor activity, external electromagnetic interference, or unstable contact between the sensor and the skin. High noise levels make it difficult to detect important physiological events, such as heart rate peaks or blood oxygen saturation. To ensure the reliability of such measurements, efficient filtering algorithms adapted to the conditions of operation on microcontrollers with limited resources are needed.
The study examined four main types of filters used to process biomedical signals: low-pass filter, moving average filter, weighted average filter, and Kalman filter. Time series, especially biomedical signals such as PPG or ECG, are sequences of values ordered in time, which have a complex structure due to the natural variability of physiological processes and external factors. The selected filters are highly effective in processing such signals due to their ability to take into account the time sequence of the data and adapt to different types of noise.
2.4.1. Low Pass Filter
A low-pass filter is one of the most common and easy-to-implement methods of processing biomedical signals. Its main function is to pass low-frequency signal components and suppress high-frequency noise, which often occurs due to patient movements or external interference [7,8]. Mathematically, this filter is described digitally by the convolutional equation:
where M determines the size of the averaging window. The larger the value of M, the more the signal is smoothed. For biomedical signals, such as photoplethysmography (PPG), the window size is usually chosen to average short-term noise but not to smooth systolic wave peaks.
The main advantage of this filter is its simplicity and low computational complexity, which makes it suitable for signal processing on microcontrollers. However, its limitation is the lack of adaptability to signals with variable frequency and amplitude, which can lead to smoothing of peaks and loss of important information.
This filter works effectively with time series because it passes low-frequency components that correspond to slow changes in the signal and blocks high-frequency interference that is characteristic of noise. In biomedical data, useful information is usually contained in the lower frequency range: heart rate or heart rate variability occupies a spectrum of up to 3 Hz. This makes a low-pass filter ideal for eliminating fast artifacts while preserving the underlying signal dynamics.
2.4.2. Moving Average Filter
A moving average filter is one of the simplest and most popular approaches to smoothing biomedical signals. It is based on averaging signal values in a certain time window, which helps to reduce random fluctuations and noise. Mathematically, it can be described as:
where M determines the size of the averaging window. The larger the value of M, the more the signal is smoothed. For biomedical signals, such as photoplethysmography (PPG), the window size is usually chosen to average short-term noise but not to smooth out systolic wave peaks [9,10]. The main advantage of this filter is its simplicity and low computational complexity, which makes it suitable for signal processing on microcontrollers. However, its limitation is the lack of adaptability to signals with variable frequency and amplitude, which can lead to smoothing of peaks and loss of important information.
2.4.3. Weighted Moving Average Filter
The weighted average filter is an advanced version of the moving average filter. Its feature is to assign a weight to each signal value, which determines its influence on the average value. The output signal is calculated as:
where is a weighting factor that usually gives more weight to values closer to the center of the window[11,12]. This filter provides better adaptation to signal changes than a conventional moving average and reduces the likelihood of losing peak characteristics. Due to its adaptability, it is widely used for filtering biomedical signals, in particular for eliminating motion artifacts. The main limitation is that it requires more computing resources than a simple moving average filter, but on wearable devices with limited power, its performance can be optimized by choosing the right weights.
This filter is a modification of the moving average filter and is even better adapted for working with time series due to the use of weighting coefficients. Greater weight is assigned to the most recent signal values, allowing real-time consideration of current changes. This is particularly important for biomedical signals, where even a minor variation over a short time interval can indicate significant physiological events. Thanks to its ability to respond quickly to changes, the filter maintains a balance between noise smoothing and the preservation of informative signal components.
2.4.4. Kalman Filter
The Kalman filter is a dynamic algorithm used to recursively estimate the current state of a system in the presence of noise. Its advantage is that it combines information about previous signal states with current measurements, allowing for adaptive noise reduction. State prediction equation:
where is the predicted state value, A is the state transition matrix, P is the prediction error matrix, and Q is the covariance noise matrix. The Kalman filter can effectively eliminate both low- and high-frequency noise while preserving key signal characteristics, such as systolic peaks. Its use is appropriate for processing PPG and ECG signals with significant motion artifacts [13,14].
The low-pass filter was chosen because of its ability to effectively eliminate high-frequency noise that typically occurs during movement. It is simple to implement and can be customized to suit different types of signals. The moving average filter smooths the signal by averaging its values within a specified window, providing a simple and fast way to reduce noise. The weighted average filter, being a modification of the previous one, provides flexible adaptation due to the dynamic selection of weighting coefficients, which allows you to more effectively preserve the peak characteristics of the signal.
The Kalman filter deserves special attention because of its ability to adapt dynamically. By predicting the state of the signal based on previous measurements, this filter can eliminate both high-frequency and low-frequency noise, making it one of the most powerful tools for processing biomedical data. However, its implementation requires more computing resources, which imposes certain limitations for use on wearable devices.
3. Results
The results of the experiments demonstrate the effectiveness of various filtering algorithms for improving the quality of biomedical signals in real time. The main focus was on comparing the ability of filters to reduce noise, preserve key amplitude-time characteristics of signals, and provide reliable calculations of heart rate (HR) and blood oxygen saturation (SpO₂). Experiments were conducted on samples of PPG signals collected at rest and while users were moving to evaluate the filtering performance under different noise and artifact levels.
This section presents quantitative and qualitative evaluations of each filter based on defined criteria such as mean square error (MSE), peak preservation, and processing delay. Comparison of the results allows us to highlight the advantages and limitations of each filtering method, as well as to formulate recommendations for their use in monitoring systems based on microcontrollers with limited resources. The presented results serve as a basis for optimizing the process of biomedical data processing and improving the accuracy of diagnostic conclusions.
Each of the applied filters demonstrated different levels of effectiveness in terms of noise reduction, systolic peak detection accuracy, and signal smoothing, which allowed us not only to determine their advantages but also to identify limitations for specific conditions of use. Low-pass filters showed a high ability to suppress high-frequency interference, but showed a tendency to smooth out peak values, which can negatively affect the accuracy of heart rate calculations.
By comparing the raw data with different filters at rest (Figure 3) and during movement (Figure 4), each of which aimed to provide accurate heart rate (HR) and blood oxygen saturation (SpO₂), the methods used demonstrated different efficiencies in noise reduction, peak preservation, and signal smoothing, which allowed us to assess their advantages and possible limitations.
- The Low Pass Filter provided an average HR of 82.26 bpm and SpO₂ of 84.95%. Visual analysis of the processed signal indicated that it was smoothed, but there were some dips and residual noise that could lead to inaccuracies in peak detection. The filter effectively identified the main peak components of the signal, but due to smoothing, some peaks were less pronounced, which could affect the overall accuracy of the calculations.
- The High Pass Filter demonstrated average HR values of 91.39 bpm and SpO₂ of 105.40%, but the processed signal remained significantly noisy with numerous artifacts. This led to an overestimation of SpO₂ values and difficulties in correctly identifying peaks. Due to excessive noise and artifacts, the high-pass filter was less suitable for accurate calculation of physiological parameters.
- The Moving Average Filter showed results of HR of 84.73 bpm and SpO₂ of 85.15%. The signal after processing was well smoothed with well-defined peaks and minimal dips. This makes the moving average filter a reliable tool for determining basic physiological parameters. The minimal level of residual noise ensured high stability and accuracy of calculations, which allows this method to be used in real-time systems.
- The Kalman Filter showed the best results among all the methods considered, providing HR values of 87.06 bpm and SpO₂ - 85.37%. The signal after processing was almost completely cleaned of noise, with clearly defined peaks and virtually no dips. Thanks to its ability to adaptively smooth and dynamically compensate for artifacts, the Kalman filter provided high signal stability and calculation accuracy, making it ideal for use in conditions with high noise levels or motion artifacts.
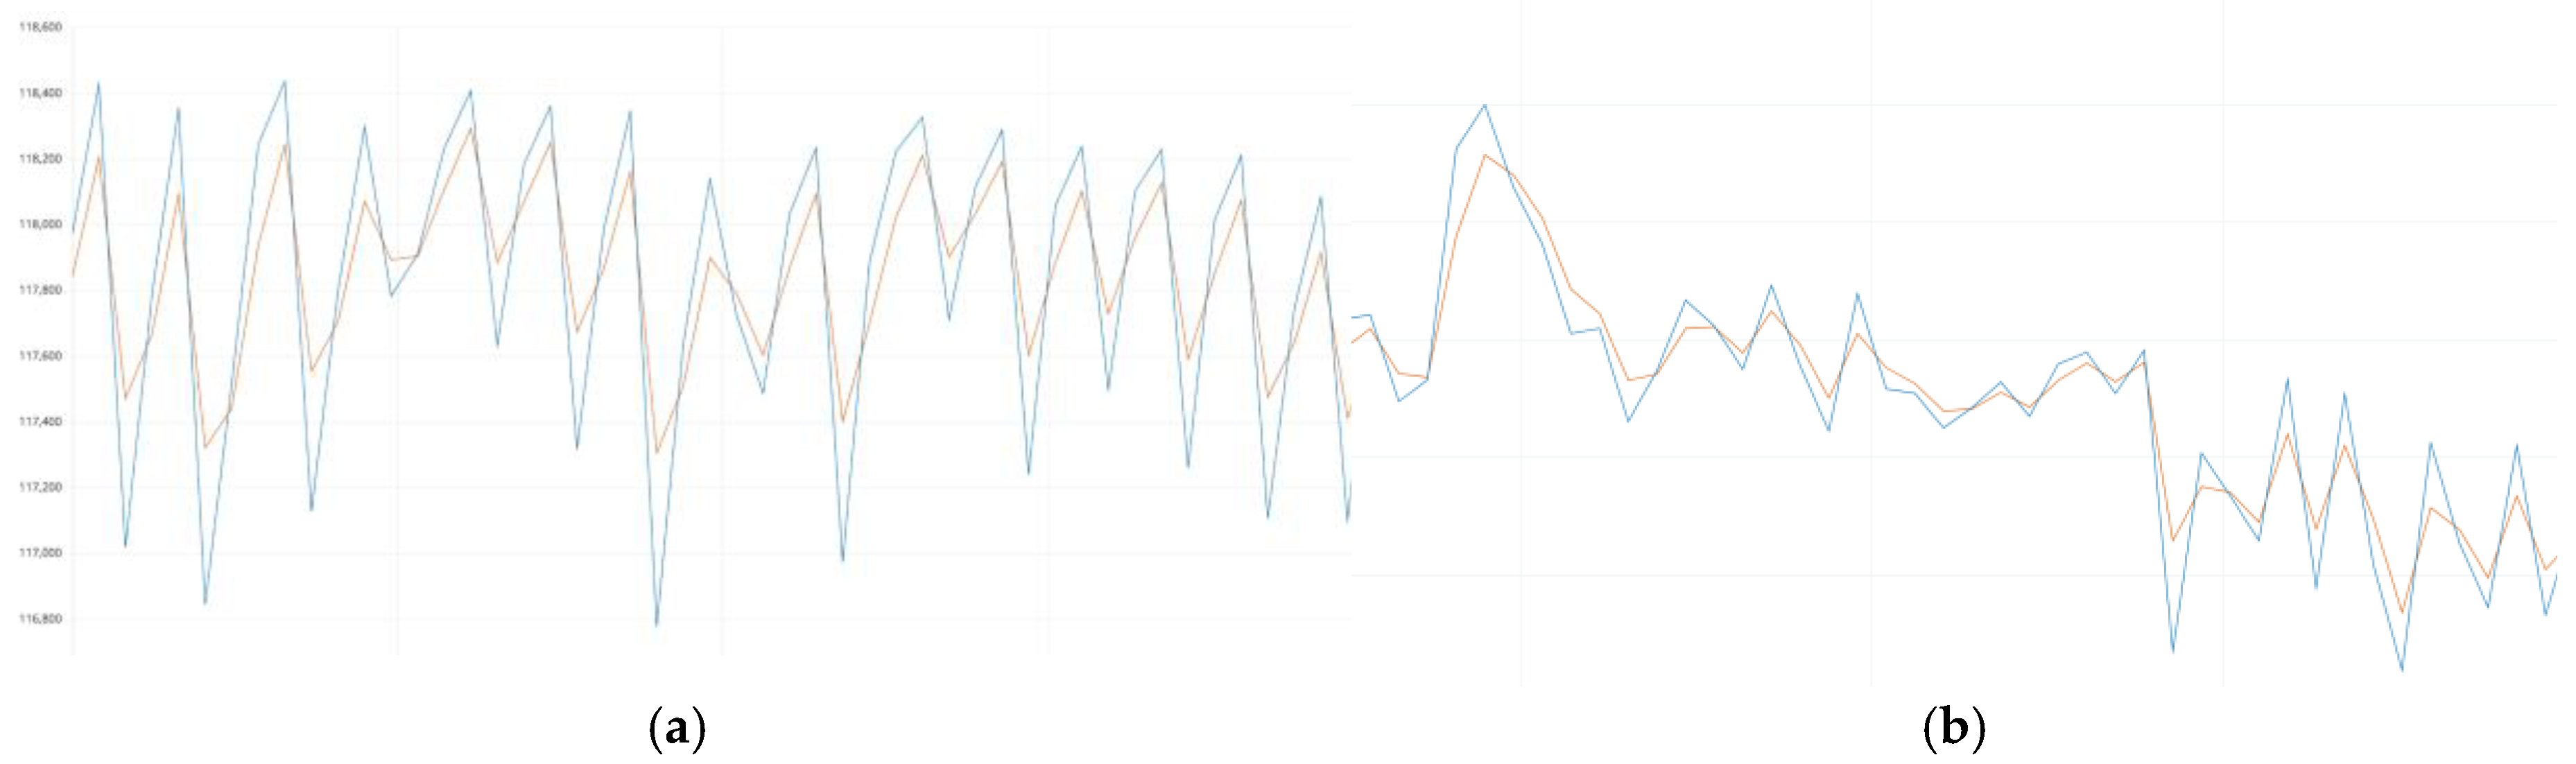
To evaluate the quality of the Kalman filter, the original raw signal (blue curve) and the signal after filtering (orange curve) were superimposed (Figure 5a and Figure 5b), which allowed us to visually and quantitatively analyze its effectiveness. The filtered signal demonstrated a high correspondence to the original data in terms of the main amplitude and time characteristics. The Kalman filter ensured the accurate preservation of key peak components and periodic oscillations, which are critical for calculating heart rate (HR) and blood oxygen saturation (SpO₂).
The analysis of the superimposed curves revealed that the Kalman filter does not cause significant phase shifts or smoothing of peak points, which could lead to the loss of important physiological characteristics of the signal. Instead, it effectively eliminates high-frequency noise and short-term artifacts caused by user movements or external interference. The preservation of the natural shape of the fundamental signal oscillations confirms that the filter works adaptively and dynamically compensates for interference without distorting useful information.
The results obtained indicate that the Kalman filter is the optimal choice for filtering biomedical time series, as it ensures high signal quality, preserving its natural dynamics and eliminating interference that could negatively affect the accuracy of calculations.
4. Discussion
The results of this study confirm the critical role of signal filtering in improving the accuracy and reliability of biomedical data obtained from wearable devices [15]. The comparison of various filtering techniques demonstrates that while all methods contribute to noise reduction, their effectiveness varies depending on the nature and level of artifacts present in the signal. The Kalman filter emerged as the most effective approach, maintaining the integrity of the original signal while minimizing high-frequency noise and motion-induced artifacts.
The observed superiority of the Kalman filter can be attributed to its ability to dynamically adjust to variations in the signal [14], compensating for transient distortions without significantly altering the underlying physiological patterns. This adaptability makes it particularly well-suited for applications where signal fluctuations due to motion artifacts are prevalent, such as ambulatory monitoring and fitness tracking. In contrast, while low-pass filtering was effective in removing high-frequency noise, it also introduced excessive smoothing, potentially distorting key features such as systolic peaks. Similarly, the moving average and weighted moving average filters provided moderate improvements in signal stability but lacked the adaptability required to maintain precise peak detection in dynamic conditions.
The practical implications of these findings extend to the development of more reliable wearable health monitoring systems [16,17]. Accurate heart rate (HR) and blood oxygen saturation (SpO₂) measurements are essential for early diagnosis and continuous monitoring of cardiovascular and respiratory conditions. By integrating adaptive filtering techniques, future wearable devices could achieve higher precision in real-time physiological monitoring, reducing false readings and improving user experience. Moreover, optimizing computational efficiency remains a crucial factor, as complex filtering algorithms must operate within the resource constraints of embedded systems [18].
While this study provides valuable insights into the comparative performance of different filtering techniques, further research is needed to refine these approaches. Future investigations could focus on hybrid filtering strategies that combine the computational simplicity of traditional filters with the adaptability of machine learning-based models. Additionally, expanding the dataset to include a broader range of physiological conditions and user activities would enhance the generalizability of the findings. The integration of deep learning models for noise detection and signal reconstruction also presents an exciting avenue for exploration, potentially leading to self-adjusting filtering frameworks capable of optimizing signal quality in real-time.
5. Conclusions
The experiments showed that the correct choice of filtering algorithms is a key factor for high-quality processing of biomedical signals, especially in the case of wearable devices, where the level of noise and artifacts varies significantly depending on the user’s motor activity. The applied filters showed different levels of efficiency at rest and during movement, which allowed us to determine their advantages and limitations.
The Kalman filter has proven its effectiveness in biomedical data processing. It not only preserved the natural dynamics of the signal but also effectively eliminated most artifacts and noise, ensuring high accuracy in heart rate (HR) and blood oxygen saturation (SpO₂) calculations. This ability to adaptively respond to signal variations makes it an optimal choice for use in wearable devices.
These results have practical significance for developers of wearable devices and monitoring systems, as they help balance computational efficiency and data quality. In the future, the integration of adaptive machine learning-based algorithms could be considered to allow automatic adjustment of filtering parameters depending on noise levels and usage conditions. This approach will open new horizons for the development of intelligent health monitoring systems with even greater accuracy and reliability.
References
- Shovlin, A.; Ghen, M.; Simpson, P.; Mehta, K. Challenges facing medical data digitization in low-resource contexts. 2013 IEEE Global Humanitarian Technology Conference (GHTC); pp. 365–371.
- Kawala-Janik, A.; Pelc, M.; Podpora, M. Method for EEG Signals Pattern Recognition in Embedded Systems. Elektronika ir Elektrotechnika 2015, 21, 3–9. [Google Scholar] [CrossRef]
- Aziz, R.; Jawed, F.; Khan, S.A.; Sundus, H. Wearable IoT Devices in Rehabilitation: Enabling Personalized Precision Medicine. 10.4018/979-8-3693-2105-8.
- Ferdi, Y. Fractional order calculus-based filters for biomedical signal processing. 2011 1st Middle East Conference on Biomedical Engineering (MECBME); pp. 73–76.
- Lazazzera, R.; Belhaj, Y.; Carrault, G. A New Wearable Device for Blood Pressure Estimation Using Photoplethysmogram. Sensors 2019, 19, 2557. [Google Scholar] [CrossRef] [PubMed]
- ANDERSON, Brian DO; MOORE, John B. Optimal filtering. Courier Corporation, 2005.
- Smith, Steven W. The Scientist and Engineer’s Guide to Digital Signal Processing. 1st ed, California Technical Publishing, 1997.
- Gao, Y.; Tian, D.; Wang, Y. Fuzzy Self-tuning Tracking Differentiator for Motion Measurement Sensors and Application in Wide-Bandwidth High-accuracy Servo Control. Sensors 2020, 20, 948. [Google Scholar] [CrossRef] [PubMed]
- Proakis, J.G. & Manolakis, Dimitris. (1992). Digital Signal Processing.
- Chen, Y.; Li, D.; Li, Y.; Ma, X.; Wei, J. Use Moving Average Filter to Reduce Noises in Wearable PPG During Continuous Monitoring. 181. 193-203. 10.1007/978-3-319-49655-9_26.
- Lyons, Richard. (2001). Understanding Digital Signal Processing’s Frequency Domain. RF Design Magazine.
- Lee, J. Motion artifacts reduction from PPG using cyclic moving average filter. Technol. Heal. Care 2014, 22, 409–417. [Google Scholar] [CrossRef] [PubMed]
- Eilers, P.H.C. A Perfect Smoother. Anal. Chem. 2003, 75, 3631–3636. [Google Scholar] [CrossRef] [PubMed]
- Tamura, T.; Maeda, Y.; Sekine, M.; Yoshida, M. Wearable Photoplethysmographic Sensors—Past and Present. Electronics 2014, 3, 282–302. [Google Scholar] [CrossRef]
- Kawala-Janik, A.; Pelc, M.; Podpora, M. Method for EEG Signals Pattern Recognition in Embedded Systems. Elektronika ir Elektrotechnika 2015, 21, 3–9. [Google Scholar] [CrossRef]
- Wang, Y.-J.; Chen, C.-H.; Sue, C.-Y.; Lu, W.-H.; Chiou, Y.-H. Estimation of Blood Pressure in the Radial Artery Using Strain-Based Pulse Wave and Photoplethysmography Sensors. Micromachines 2018, 9, 556. [Google Scholar] [CrossRef] [PubMed]
- Lee, Y.-K.; Jo, J.; Lee, Y.; Shin, H.S.; Kwon, O.-W. Particle filter-based noise reduction of PPG signals for robust emotion recognition. In Proceedings of the 2012 IEEE International Conference on Consumer Electronics (ICCE); pp. 598–599.
- Lee, B.; Han, J.; Baek, H.J.; Shin, J.H.; Park, K.S.; Yi, W.J. Improved elimination of motion artifacts from a photoplethysmographic signal using a Kalman smoother with simultaneous accelerometry. Physiol. Meas. 2010, 31, 1585–1603. [Google Scholar] [CrossRef] [PubMed]
Figure 1.
Raw photoplethysmographic (PPG) signal at rest.
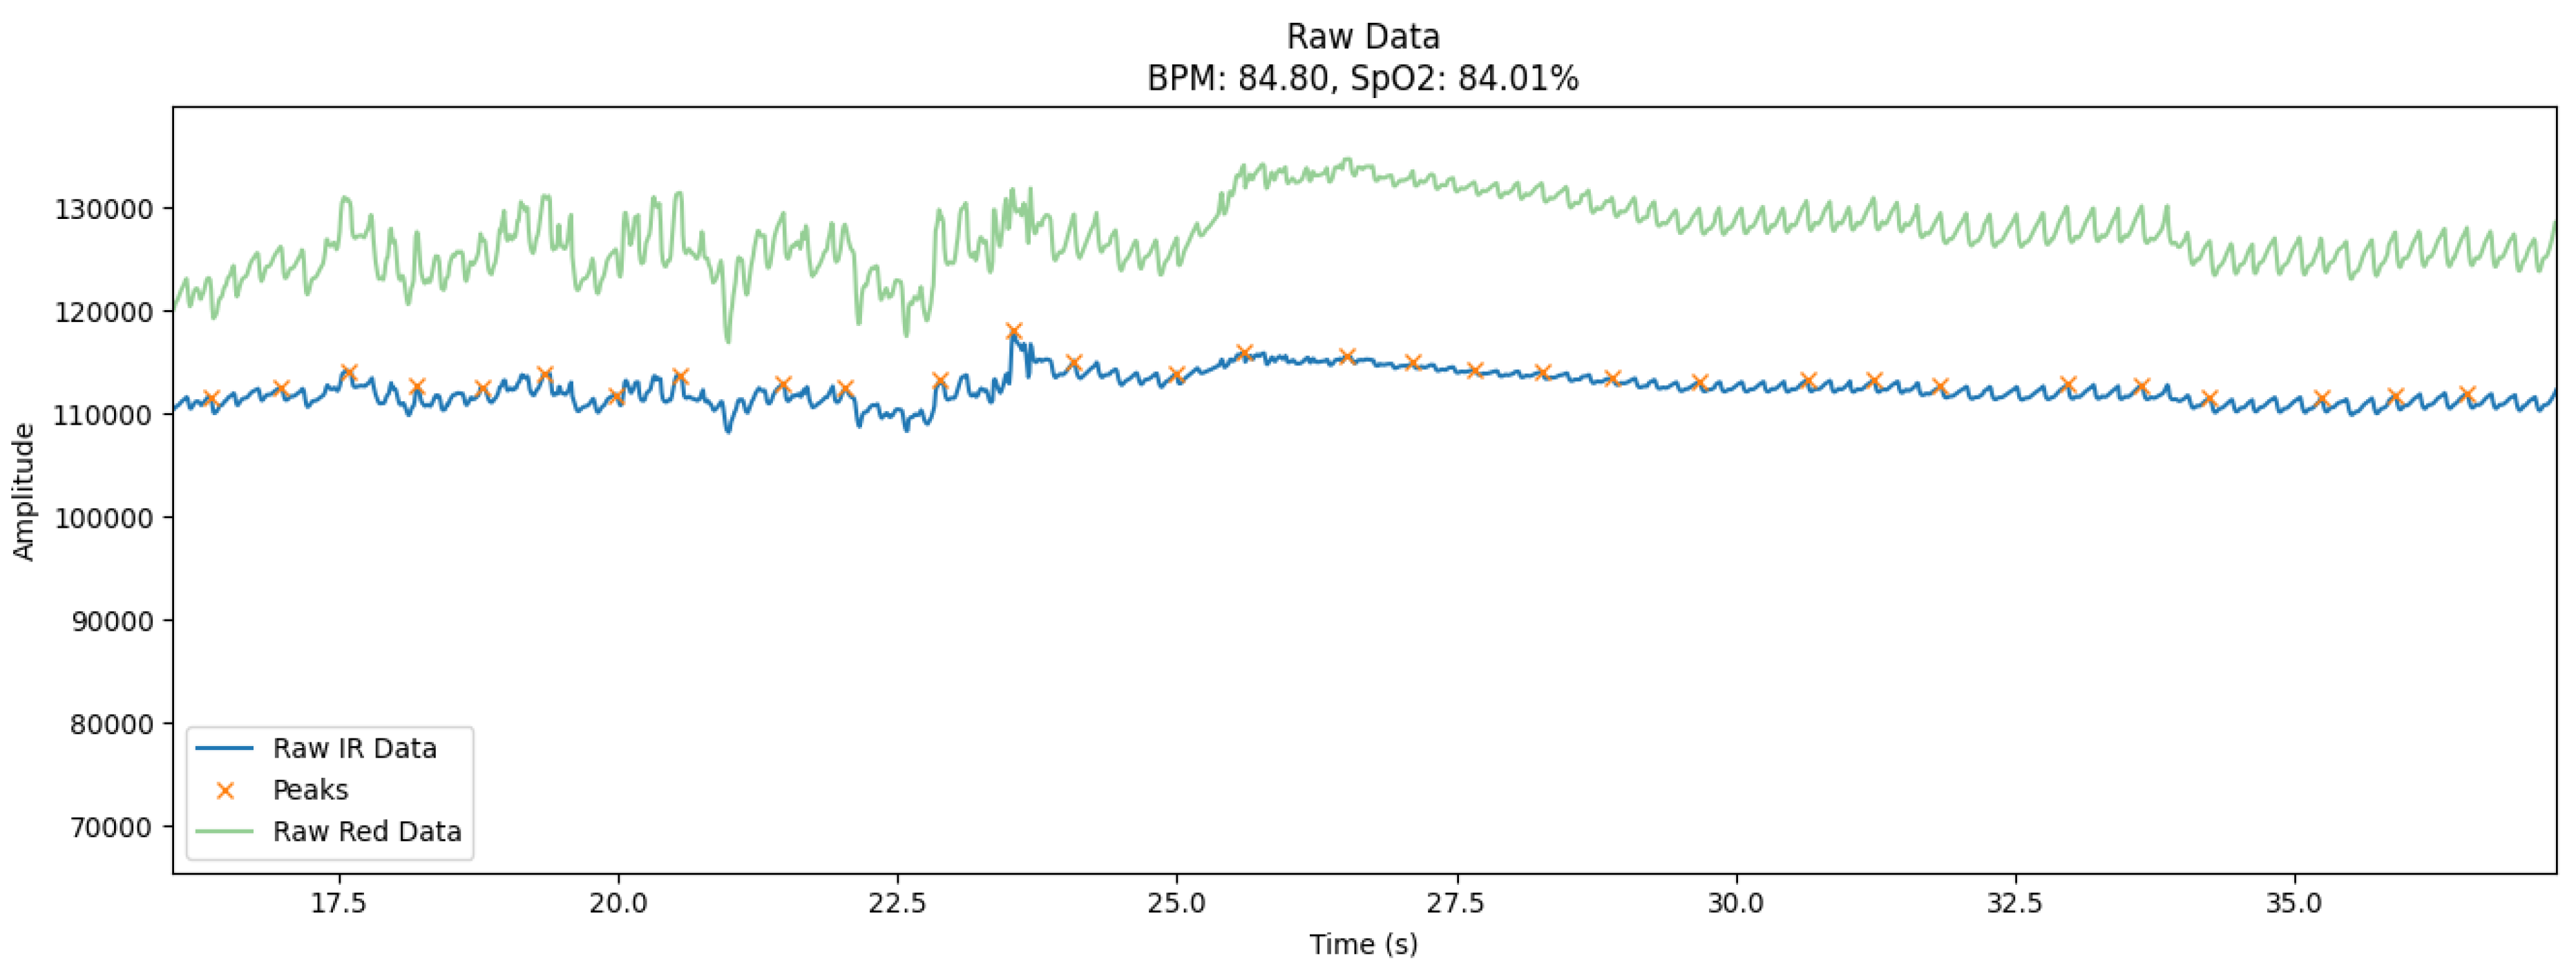
Figure 2.
Raw photoplethysmographic (PPG) signal during the user’s motor activity.
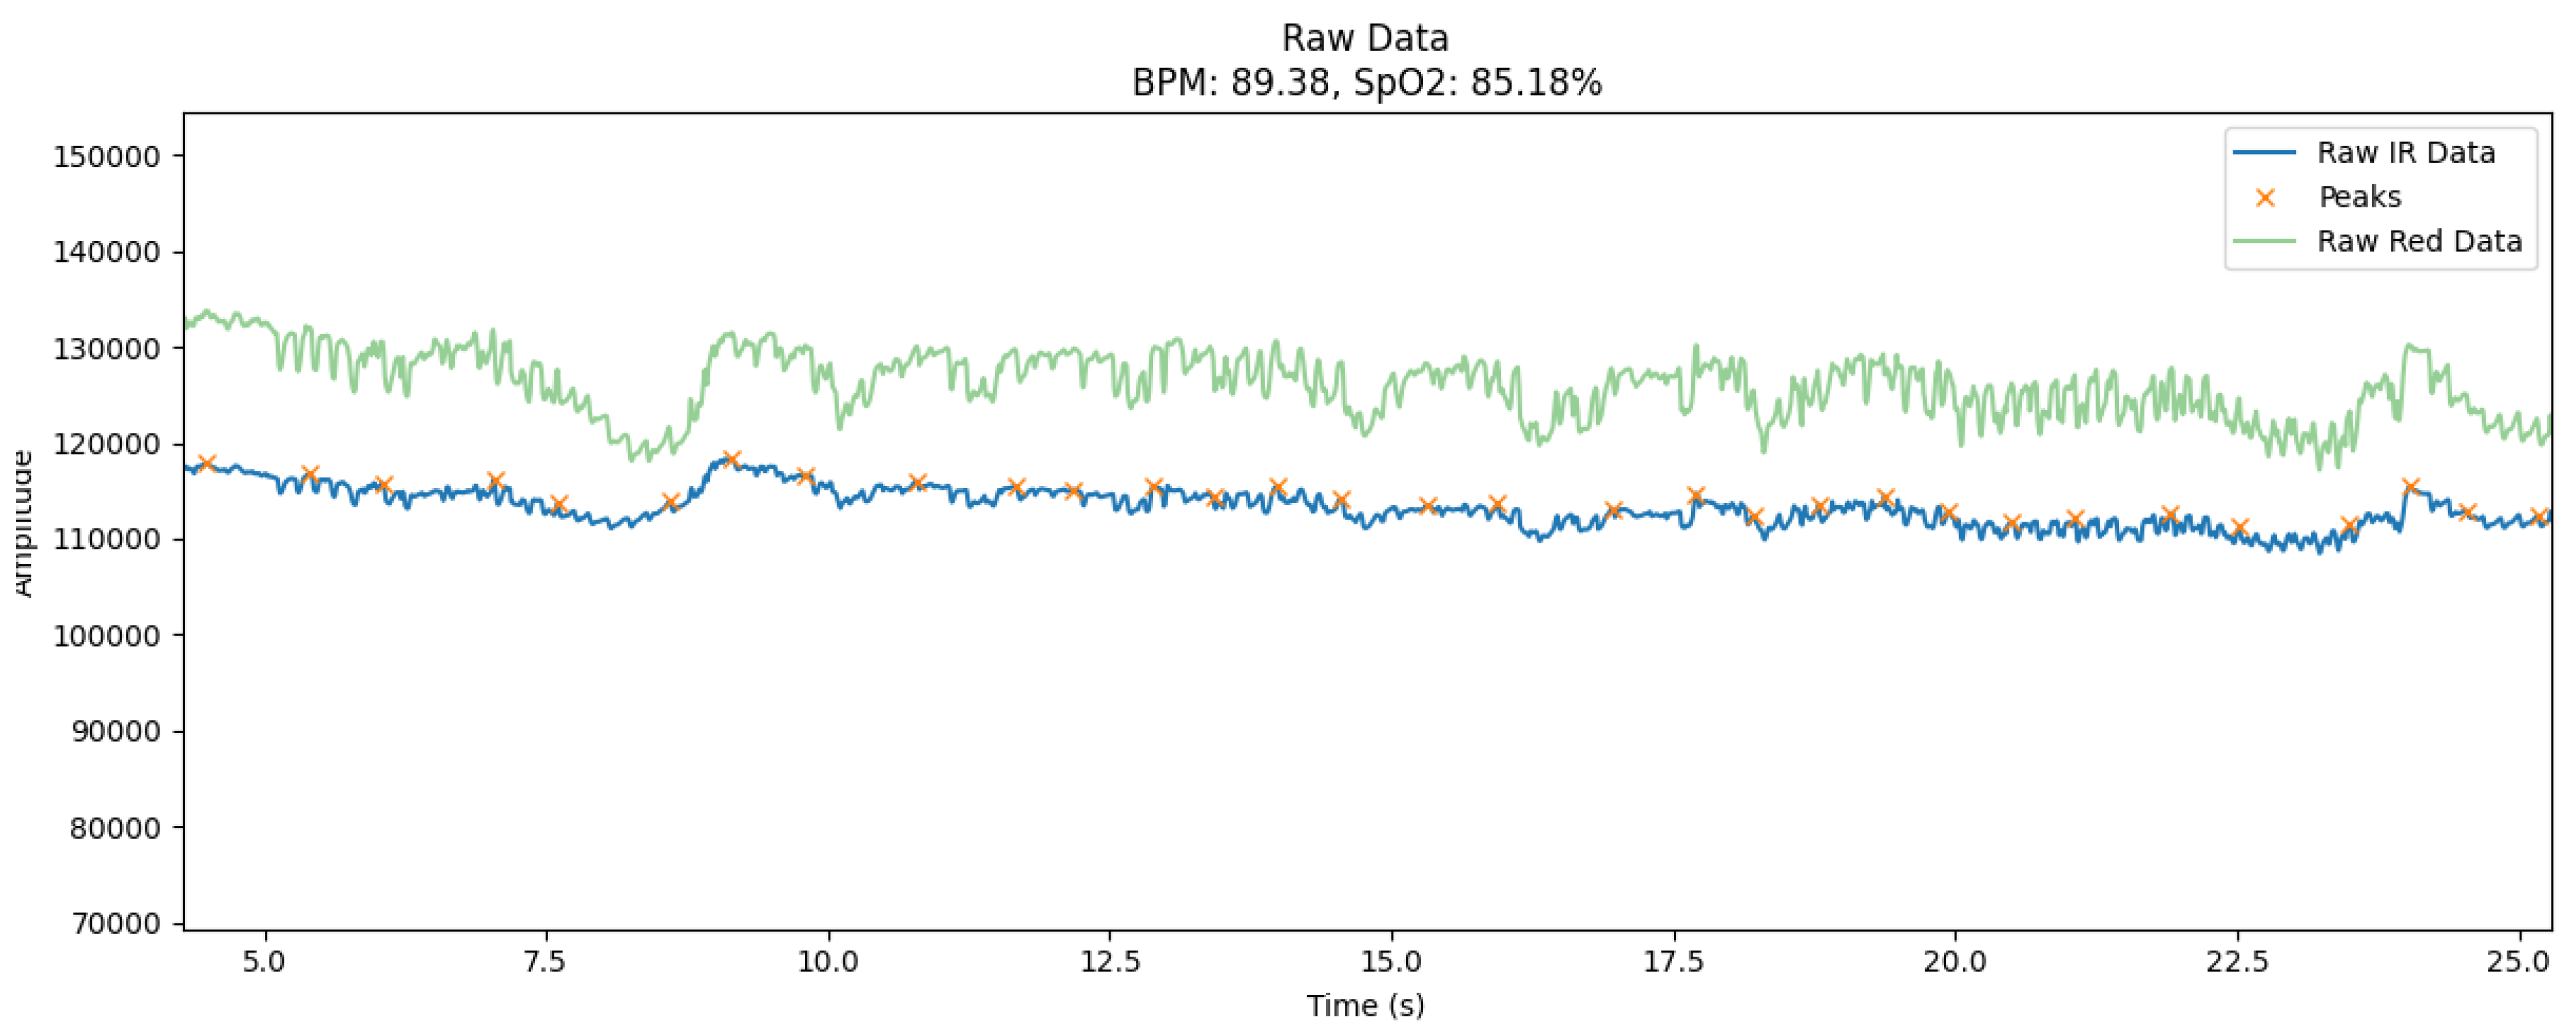
Figure 3.
Using filters on PPG data at rest.
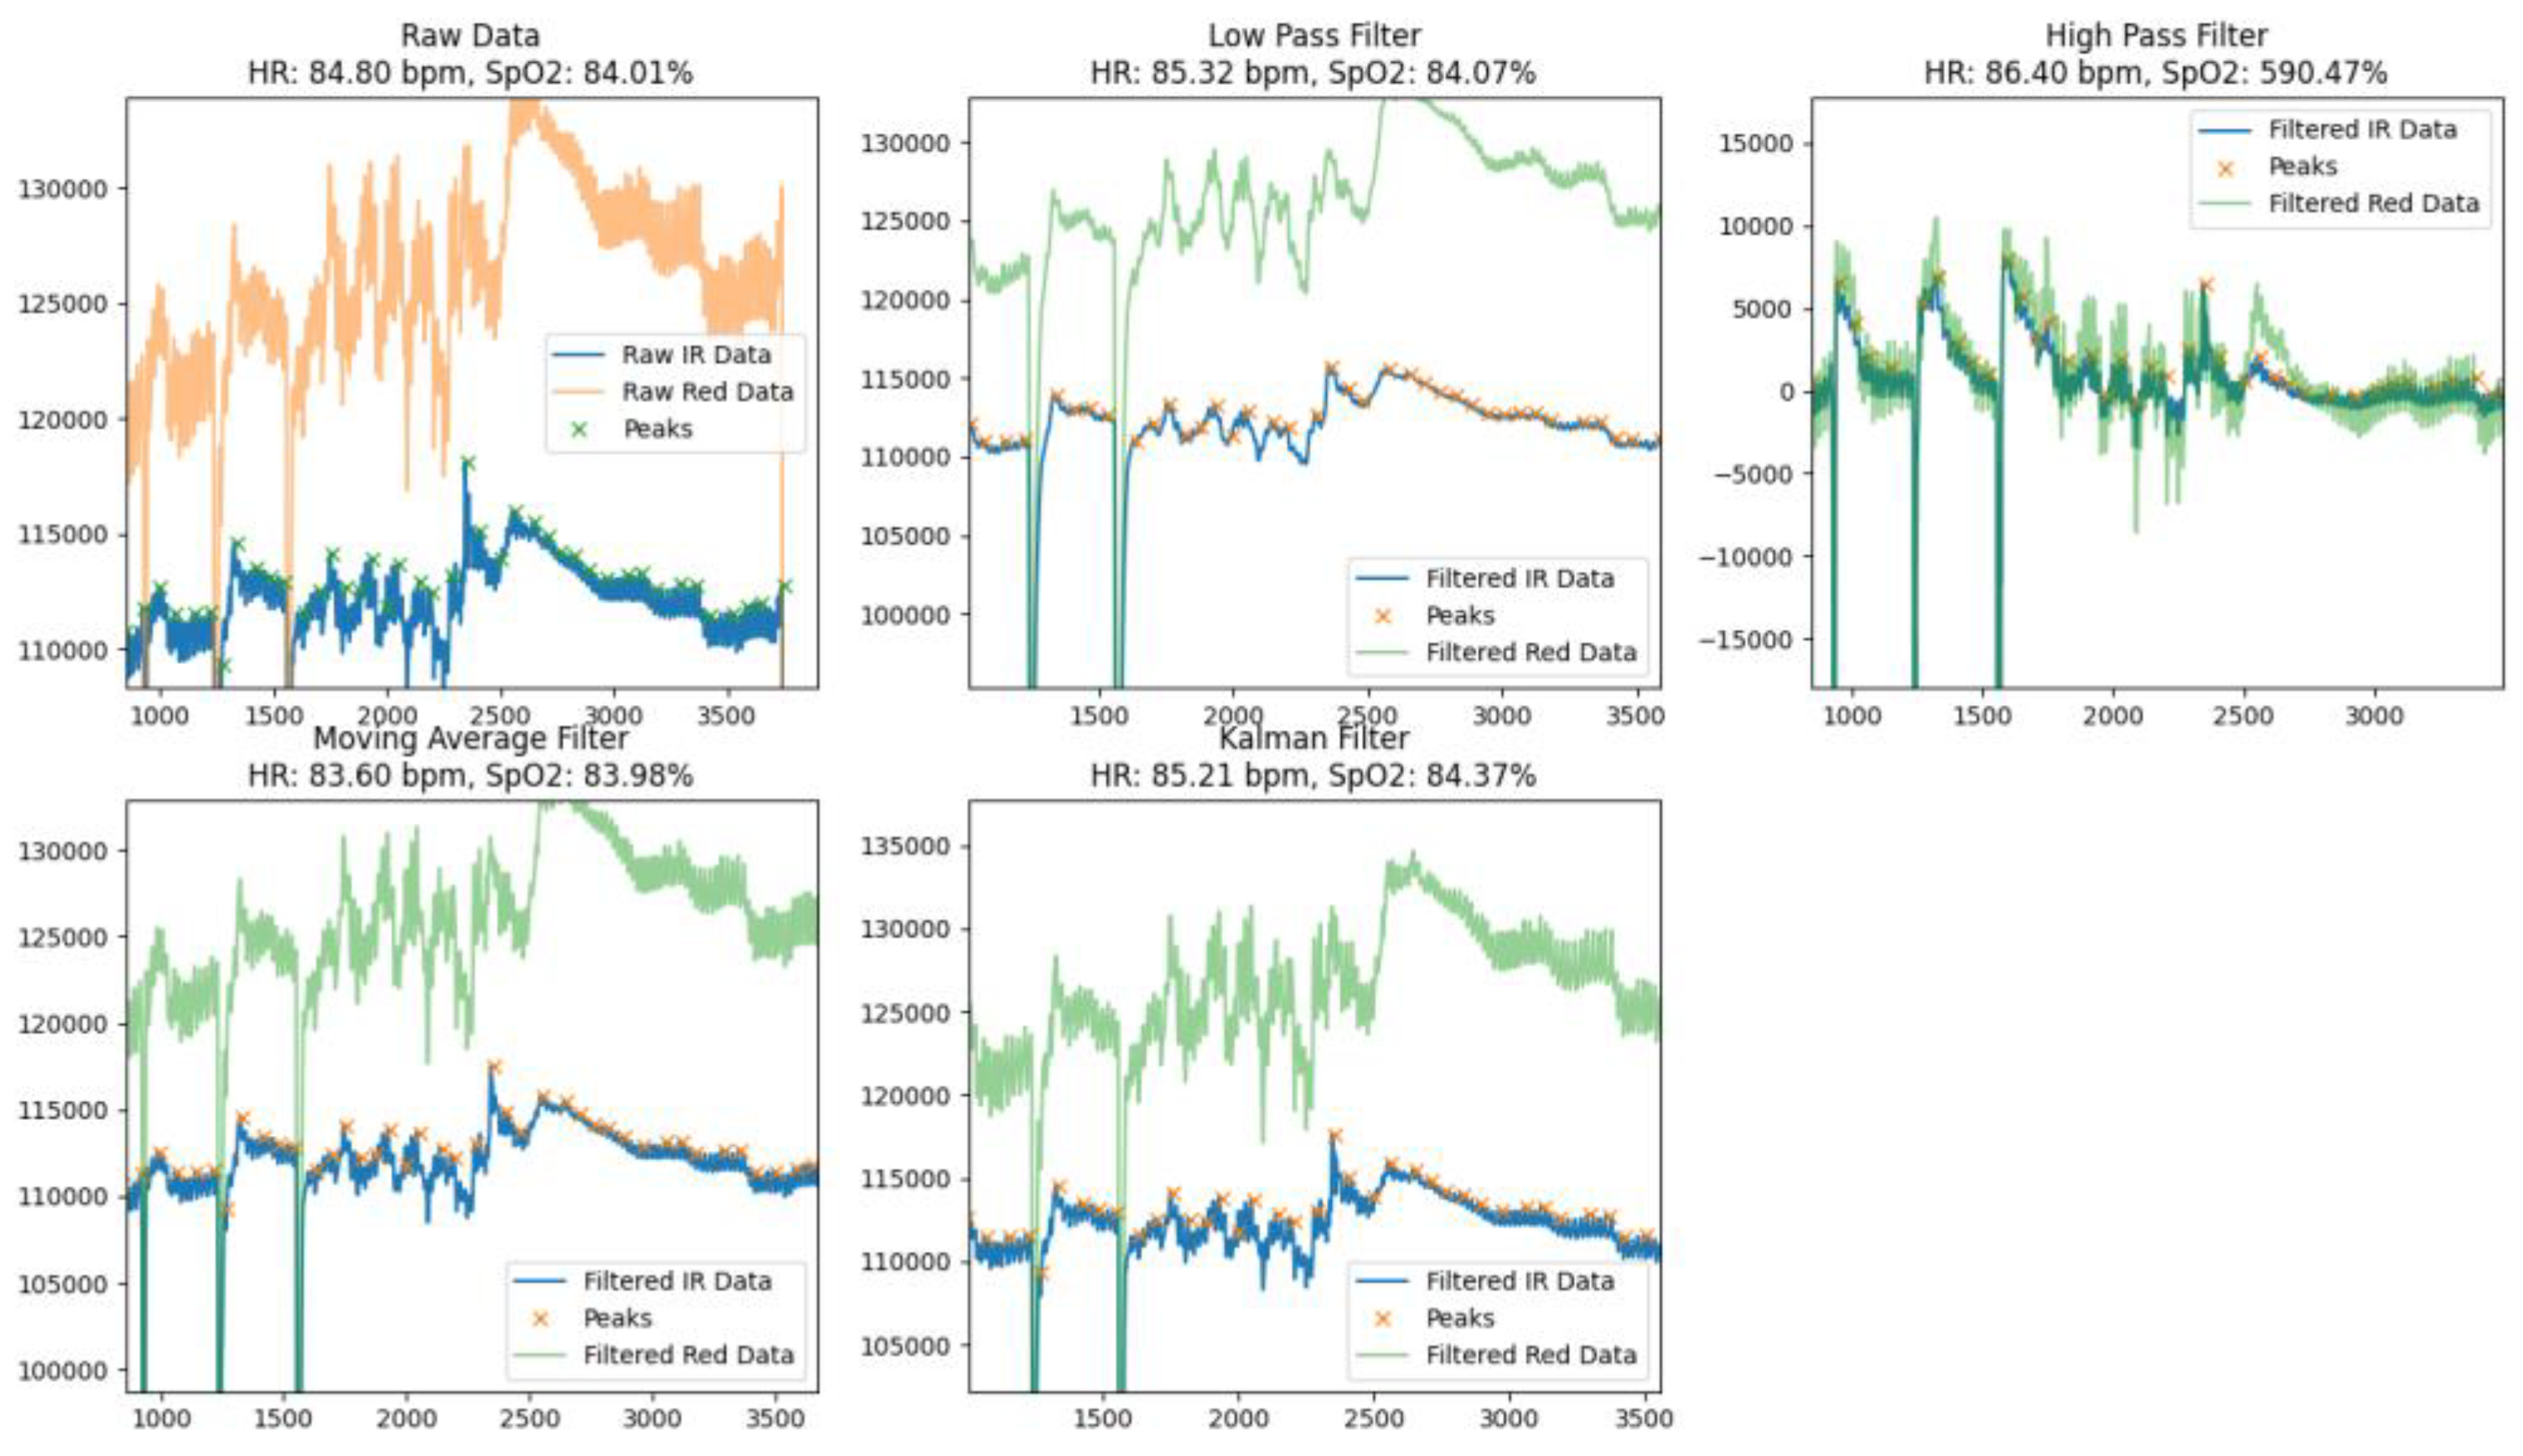
Figure 4.
Using filters on PPG data during body movements.
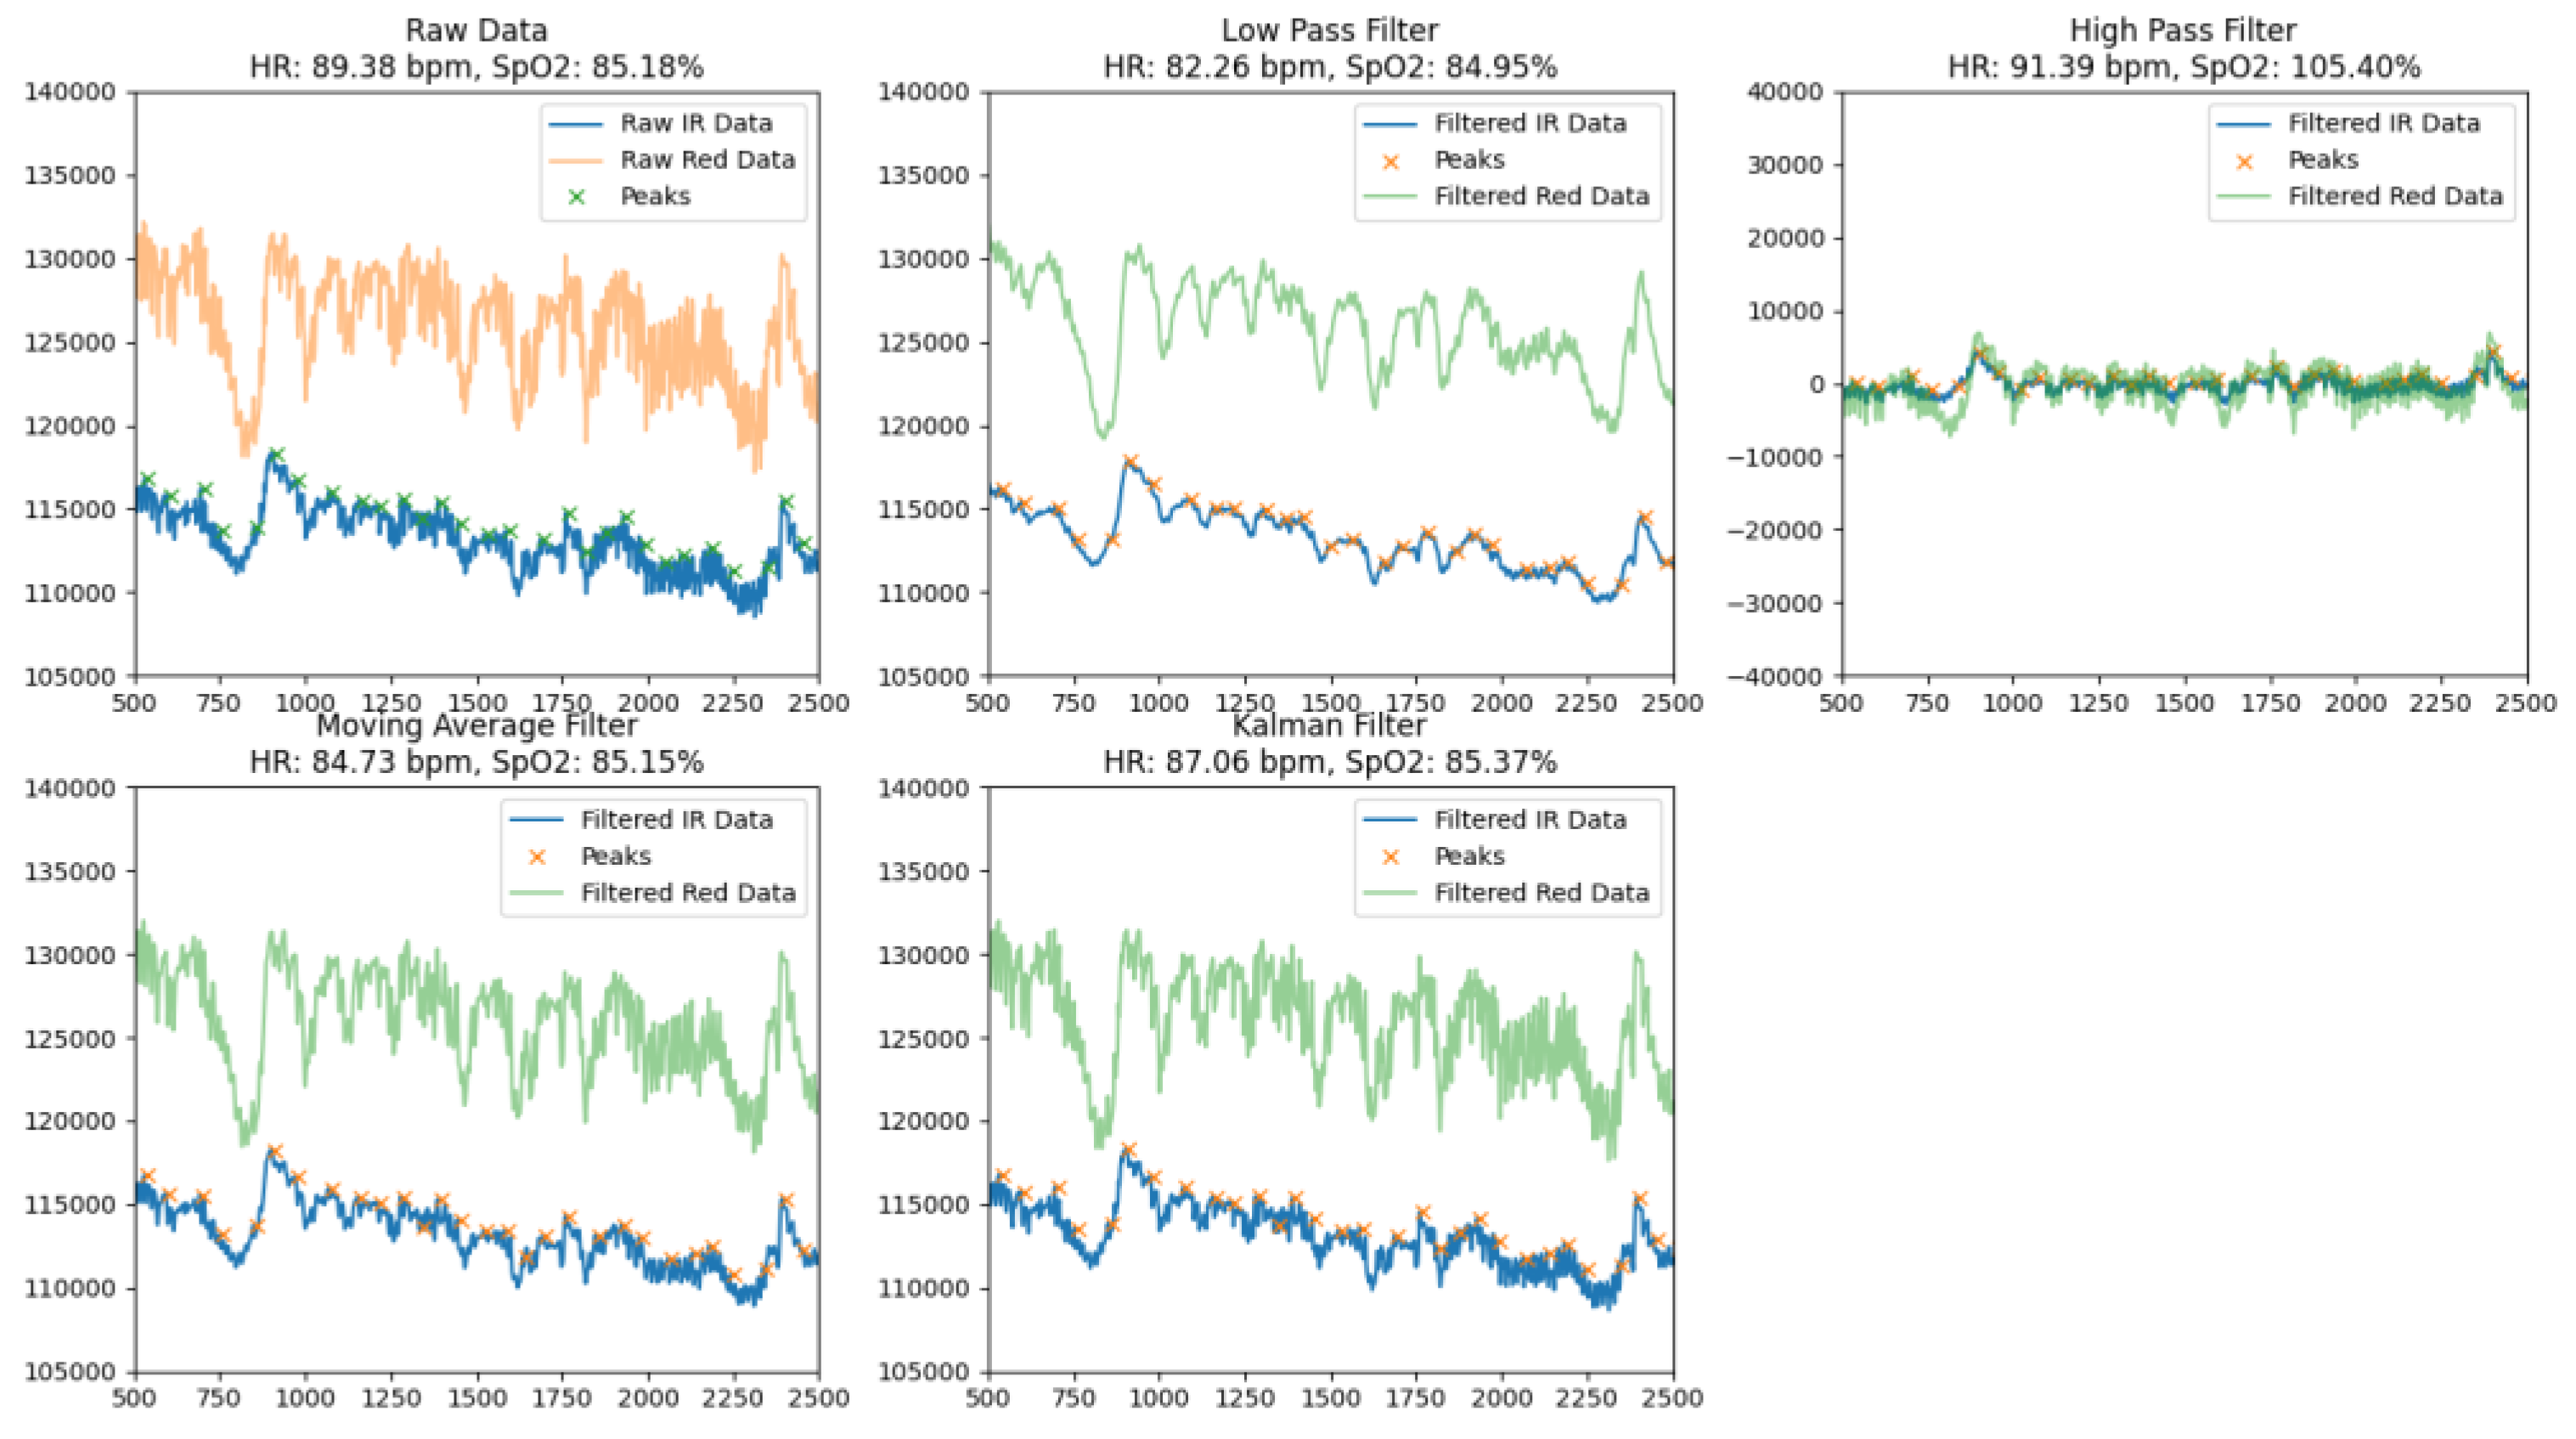
Figure 5.
Comparison of the infrared (IR) signal before filtering (blue curve) and the signal processed by the Kalman filter (orange curve): (a) at rest; (b) during physical activity.
Figure 5.
Comparison of the infrared (IR) signal before filtering (blue curve) and the signal processed by the Kalman filter (orange curve): (a) at rest; (b) during physical activity.
Disclaimer/Publisher’s Note: The statements, opinions and data contained in all publications are solely those of the individual author(s) and contributor(s) and not of MDPI and/or the editor(s). MDPI and/or the editor(s) disclaim responsibility for any injury to people or property resulting from any ideas, methods, instructions or products referred to in the content. |
© 2025 by the authors. Licensee MDPI, Basel, Switzerland. This article is an open access article distributed under the terms and conditions of the Creative Commons Attribution (CC BY) license (http://creativecommons.org/licenses/by/4.0/).
Copyright: This open access article is published under a Creative Commons CC BY 4.0 license, which permit the free download, distribution, and reuse, provided that the author and preprint are cited in any reuse.


