List of tables and plots:
| |
Page No. |
| Bar Plot of Average Female Child Sex Ratio in India in 1991, 2001, and 2011 |
8 |
| Density Plot of Average Female Child Sex Ratios in India for 1991, 2001, and 2011 |
9 |
| Density Plot of Average Female Child Sex Ratios in Tamil Nadu for 1991, 2001, and 2011 |
10 |
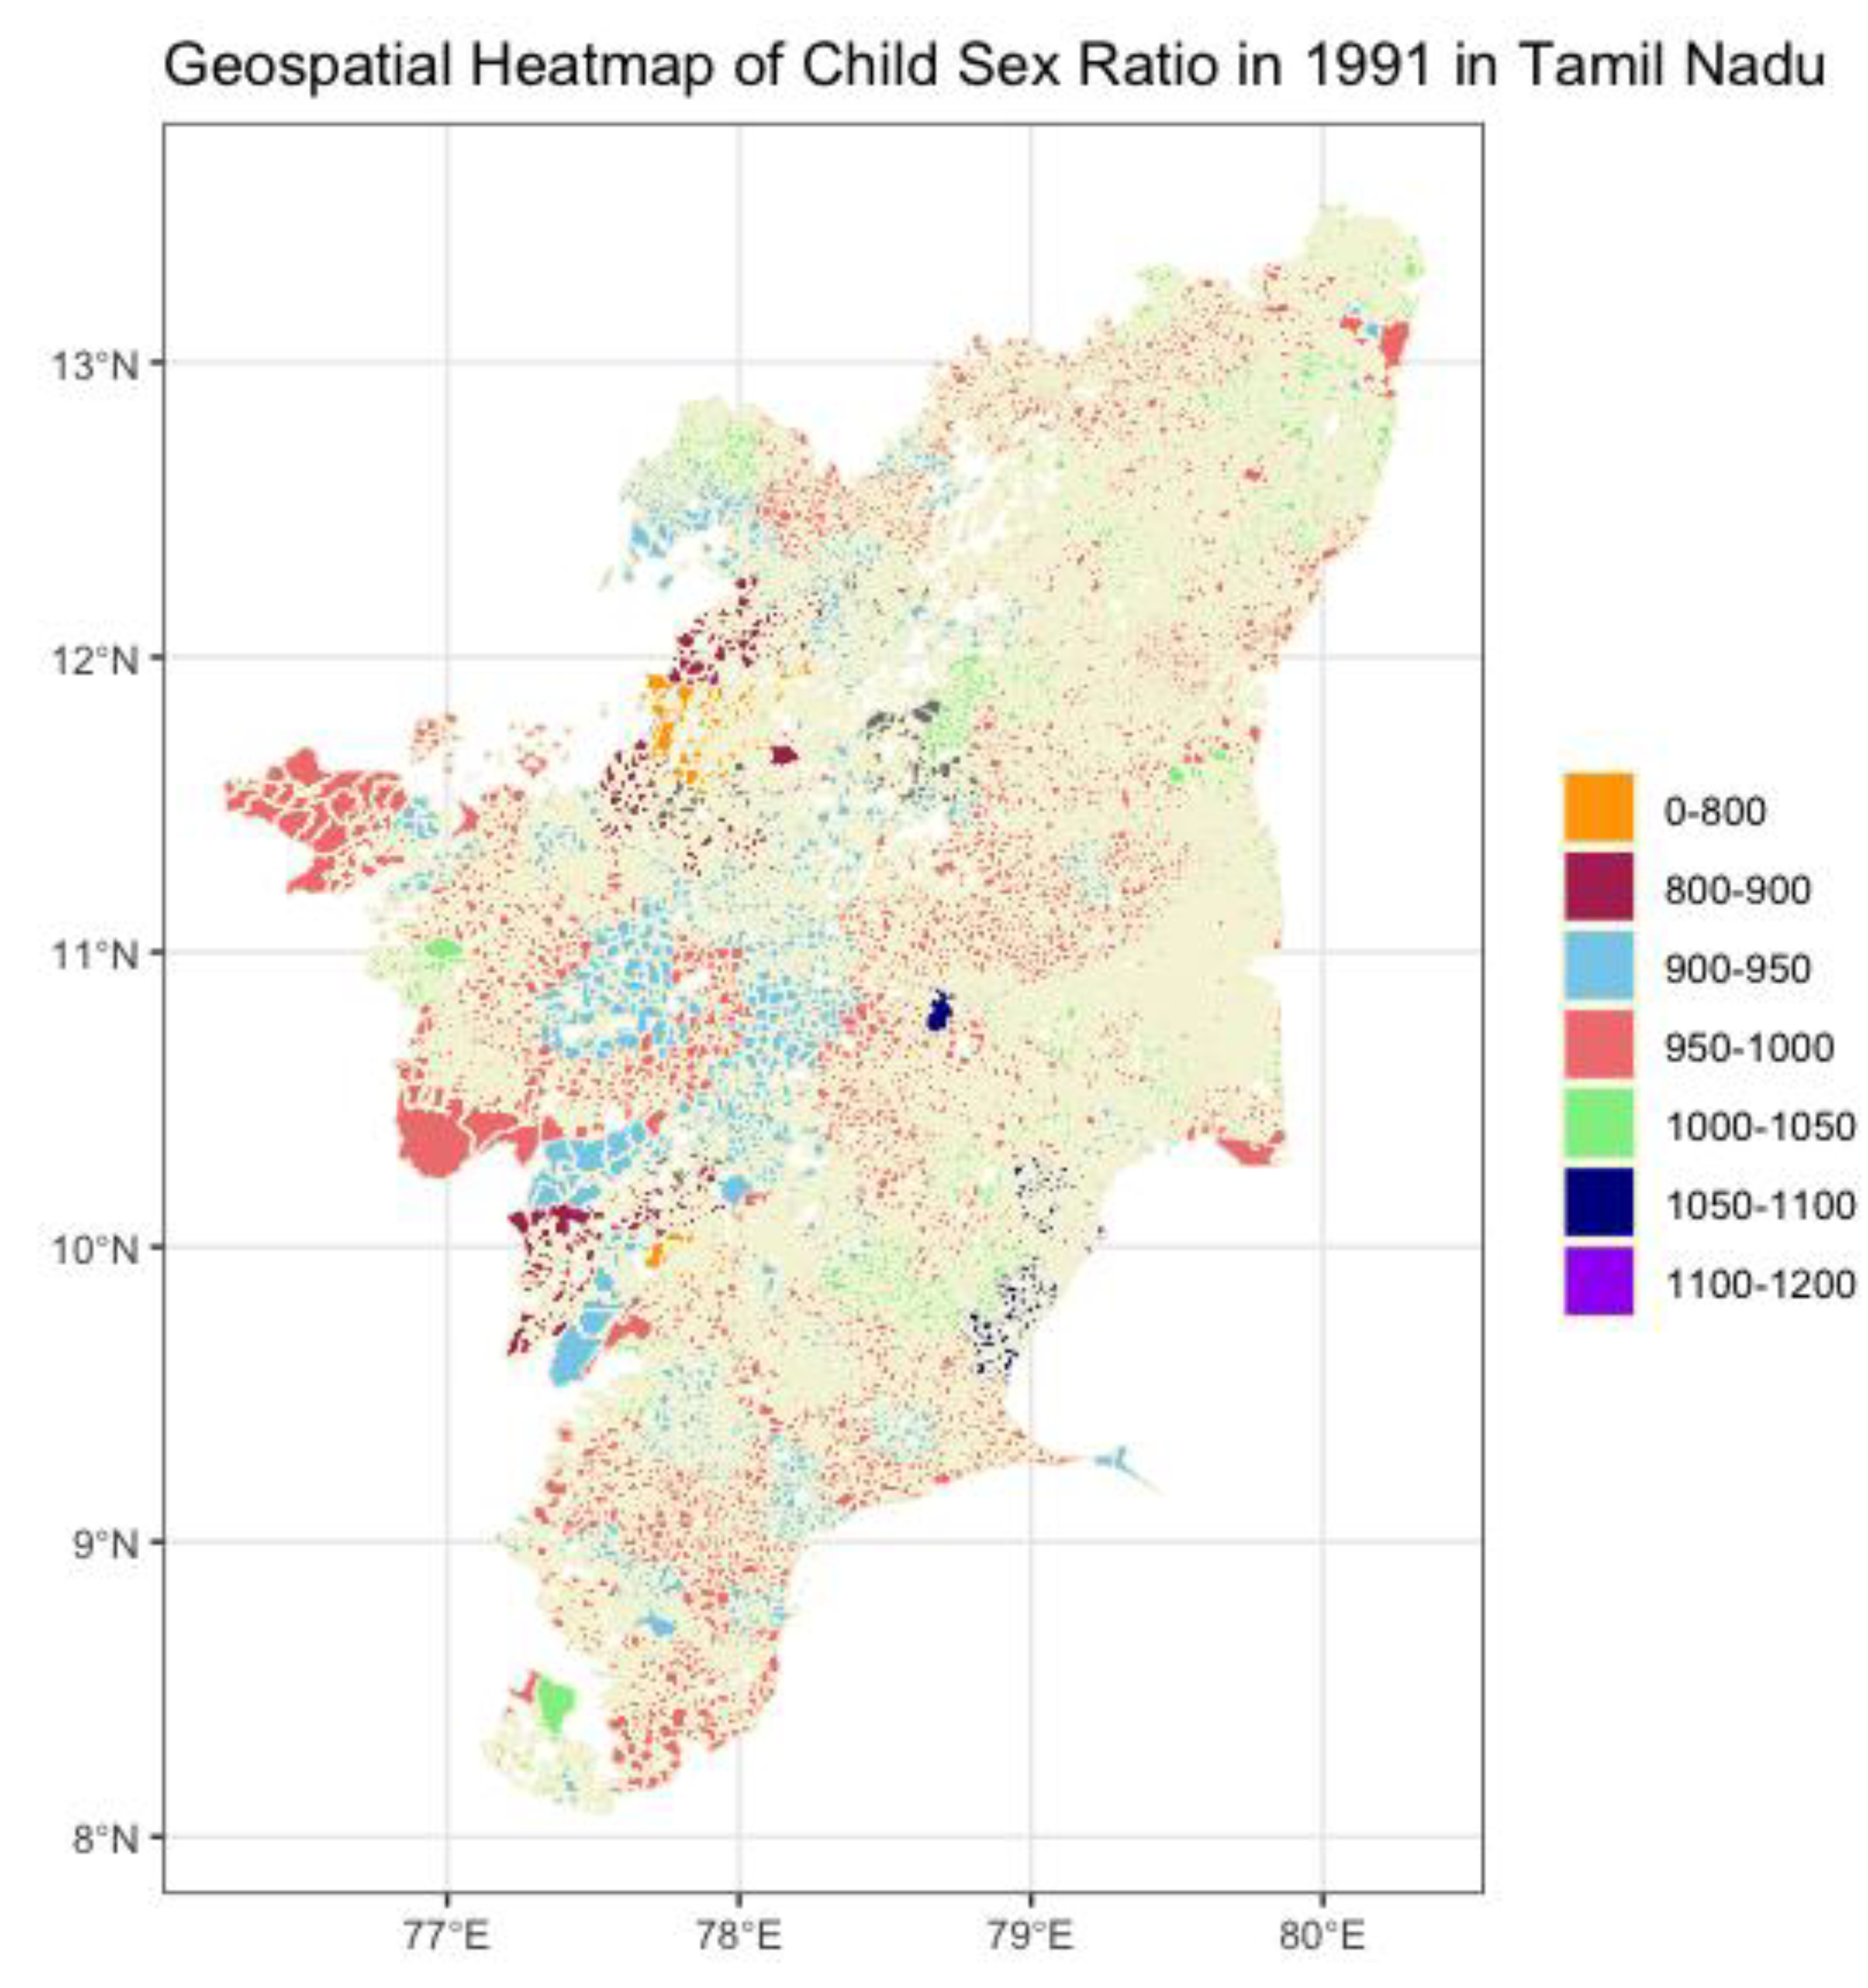
| Geospatial Heatmap of Tamil Nadu plotting the average child sex ratio across districts in 1991 |
12 |
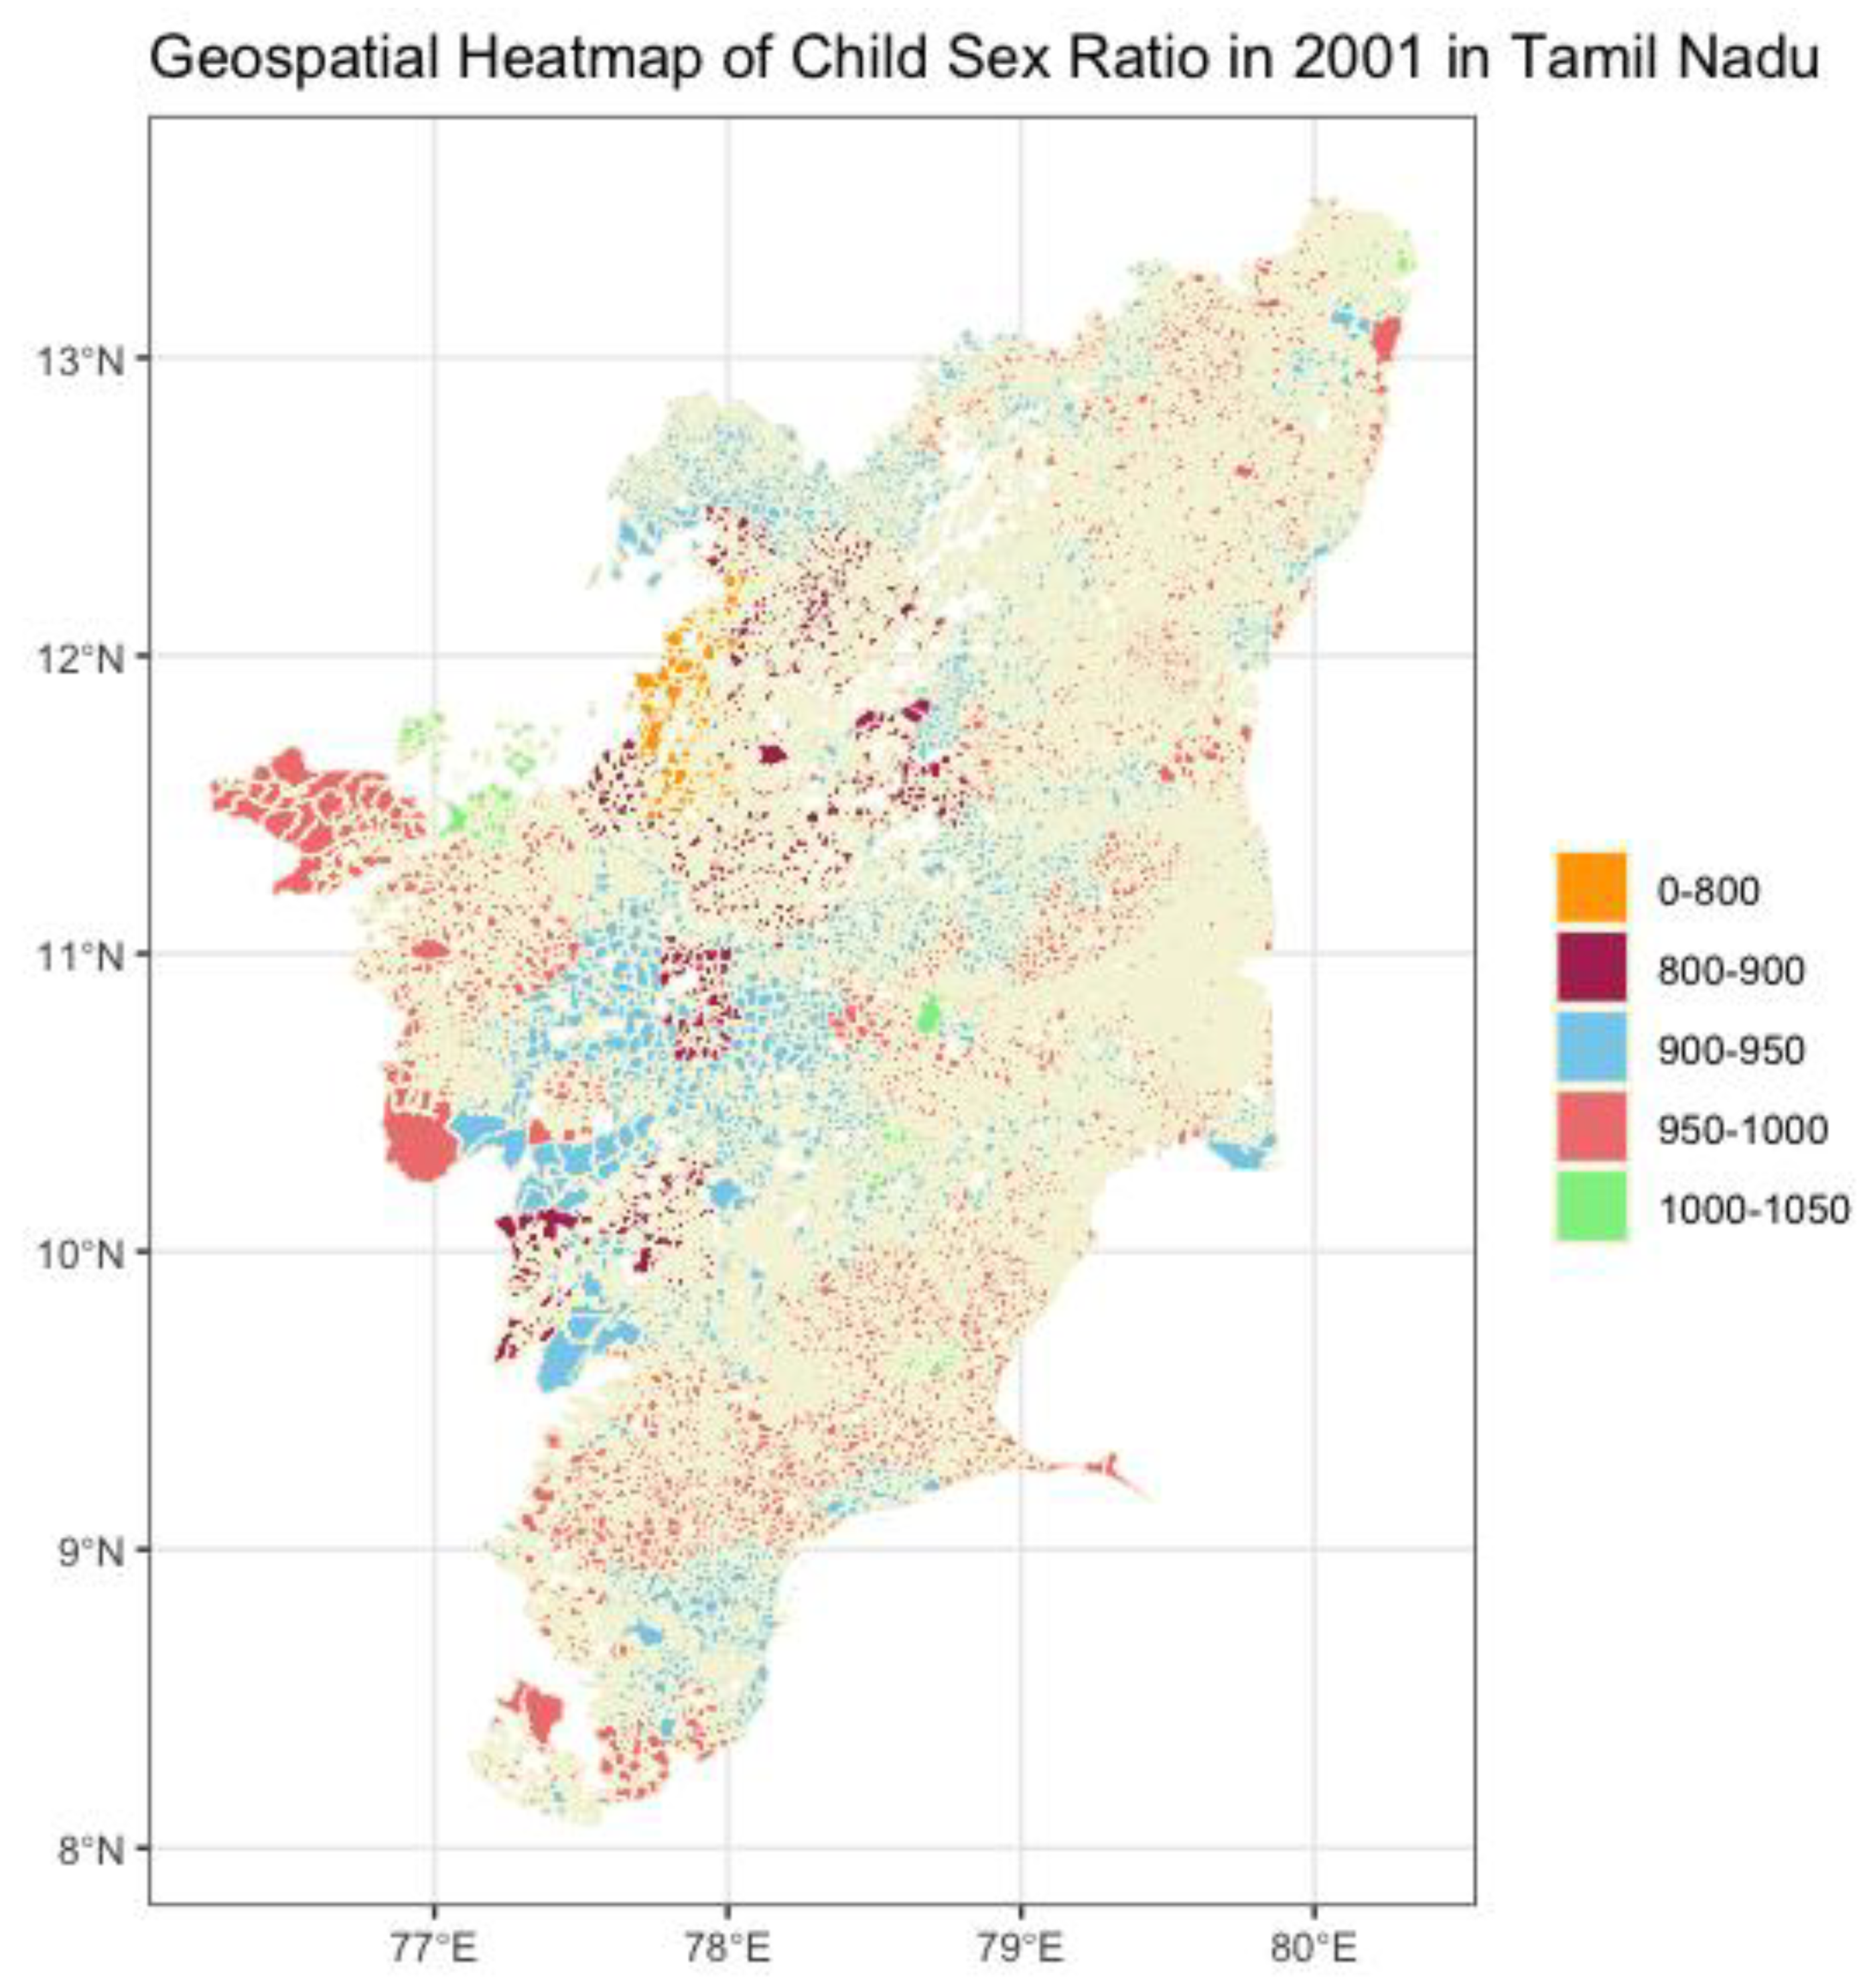
| Geospatial Heatmap of Tamil Nadu plotting the average child sex ratio across districts in 2001 |
13 |
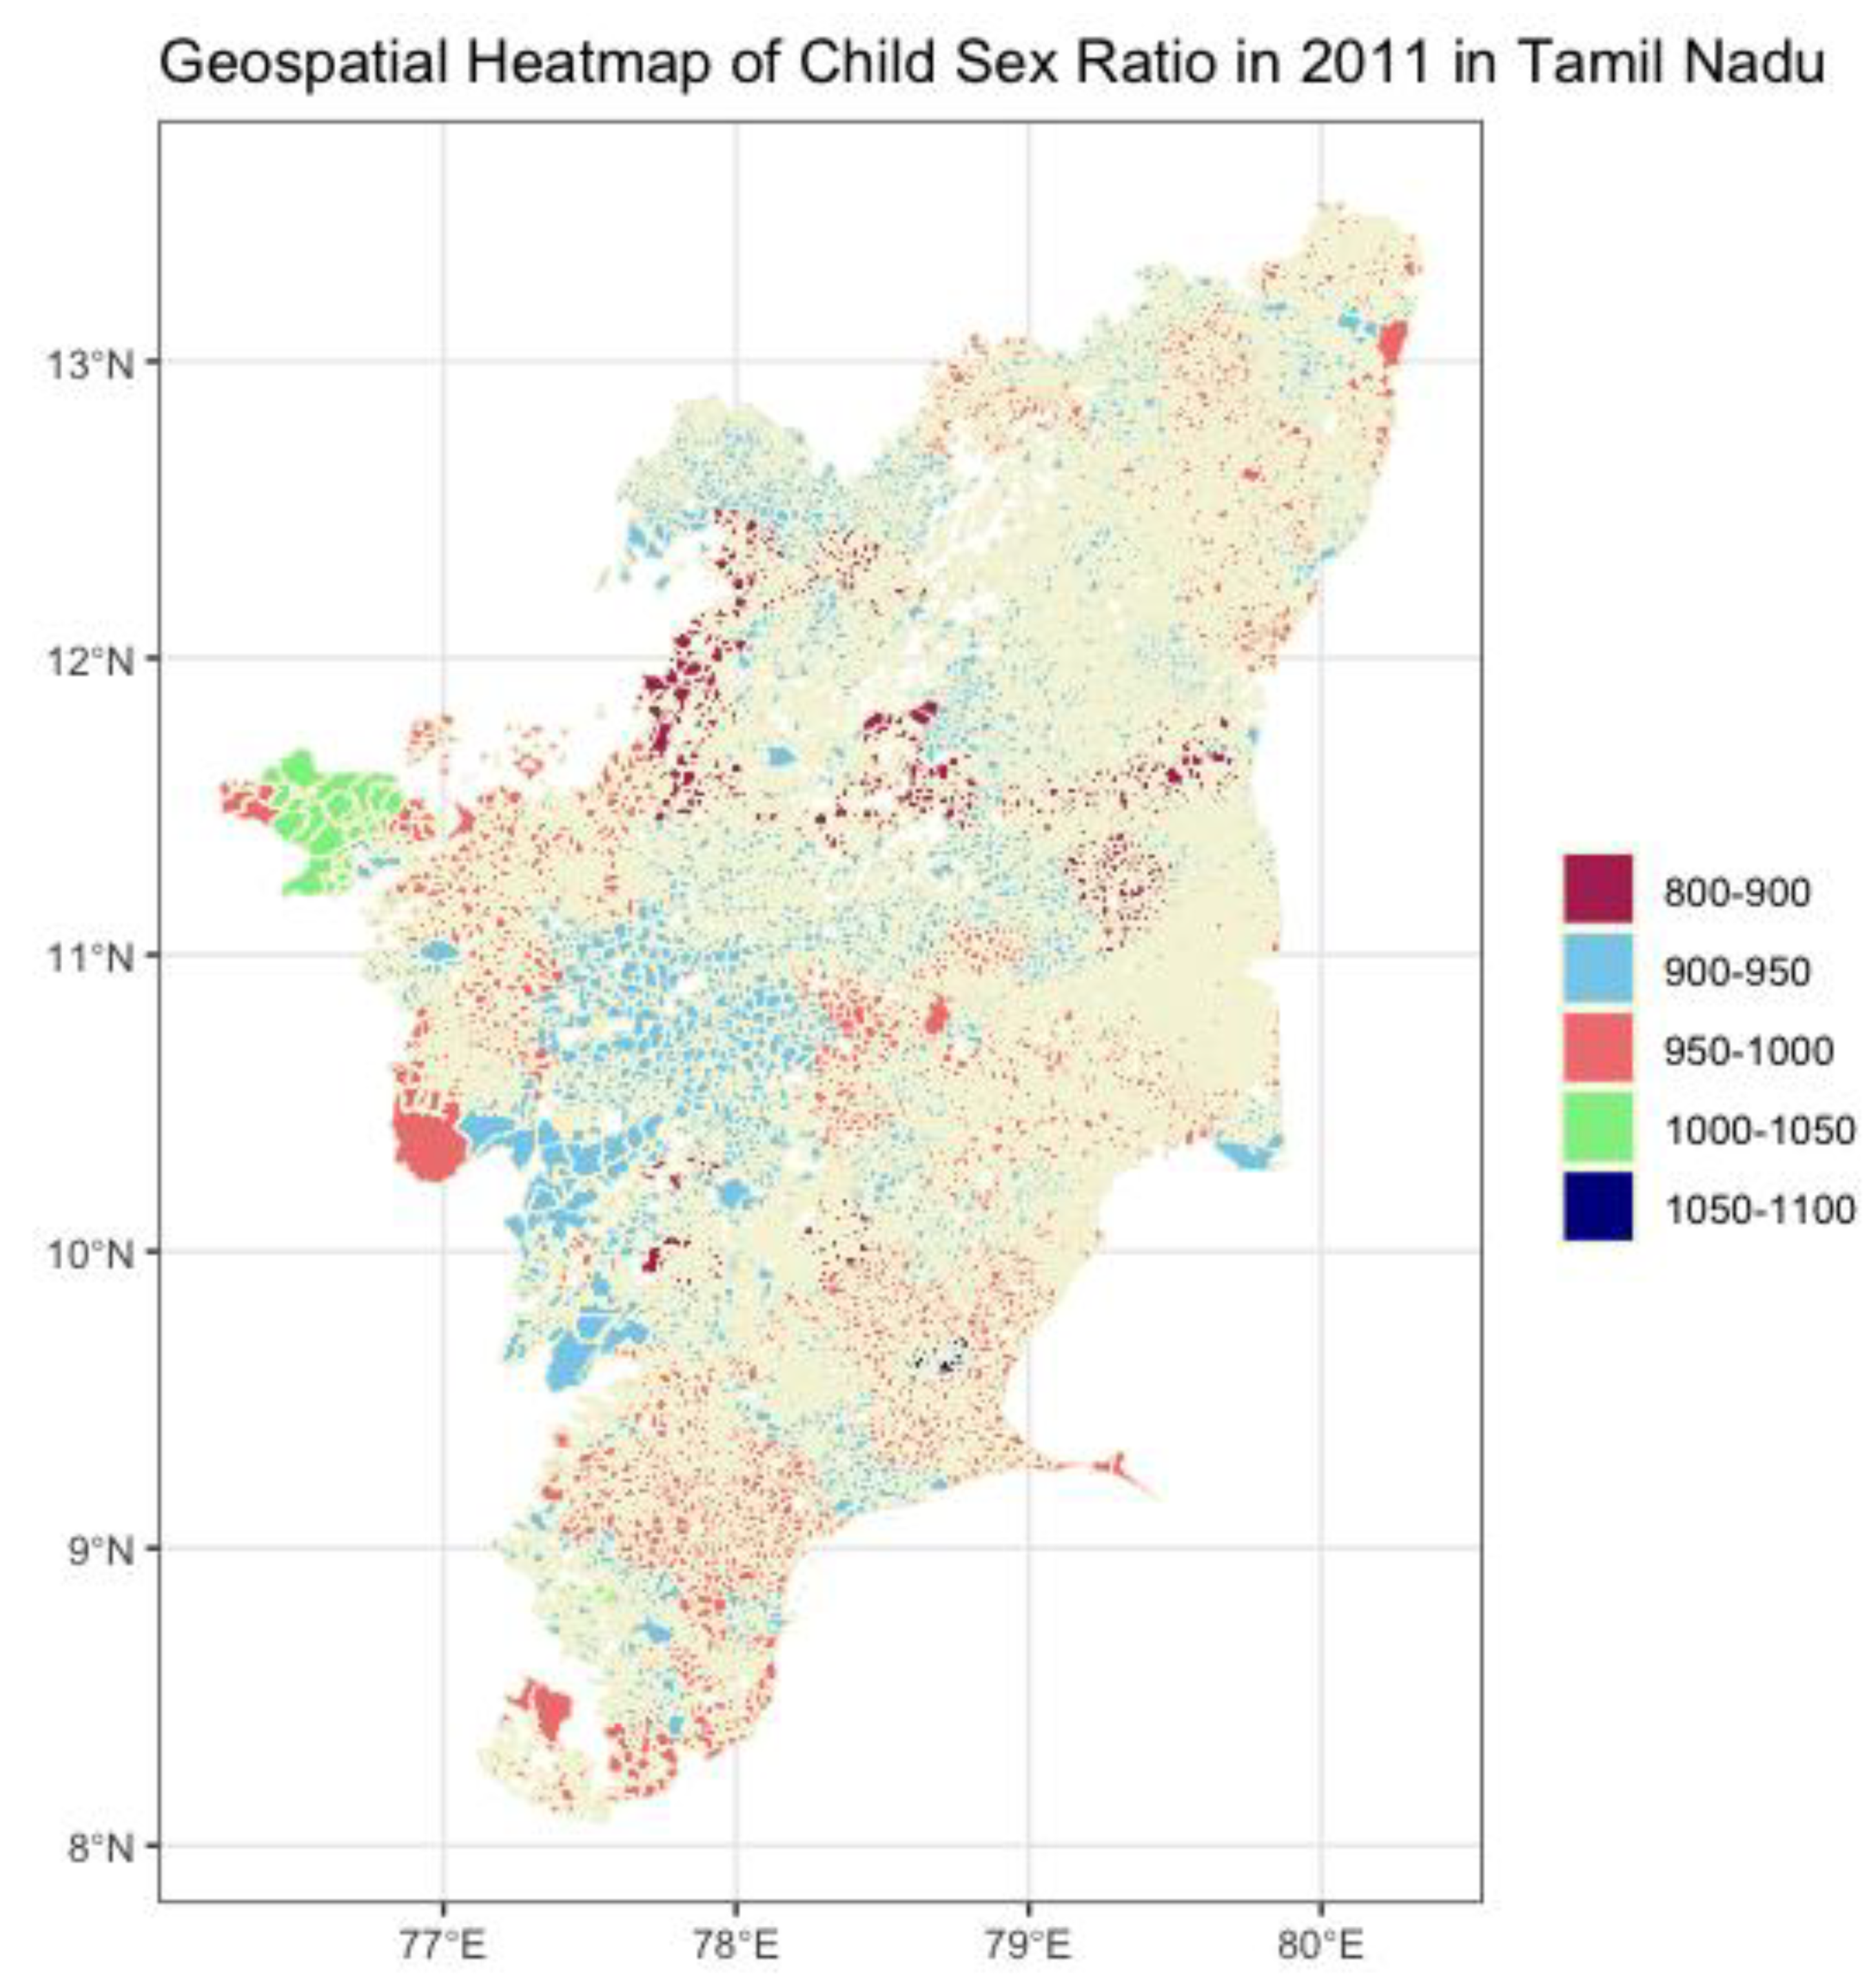
| Geospatial Heatmap of Tamil Nadu plotting the average child sex ratio across districts in 2011 |
14 |
| Average Change in Female Child Sex Ratio by District between 1991-01 and 2001-11 |
16 |
| Scatter Plot of Female Child Ratio 1991 v/s the Change in Sex between 1991 and 2001 |
17 |
| Scatter Plot of Female Child Ratio 2001 v/s the Change in Sex between 2001 and 2011 |
17 |
| Density Plot of Average Female Child Sex Ratios in Ariyalur for 1991, 2001, and 2011 |
18 |
| Density Plot of Average Female Child Sex Ratios in Dharmapuri for 1991, 2001, and 2011 |
19 |
| Density Plot of Average Female Child Sex Ratios in Salem for 1991, 2001, and 2011 |
20 |
| Density Plot of Average Female Child Sex Ratios in The Nilgiris for 1991, 2001, and 2011 |
21 |
| Bar Plot of Average Female Child Sex Ratio in Tamil Nadu Districts for 1991, 2001, and 2011 |
22 |
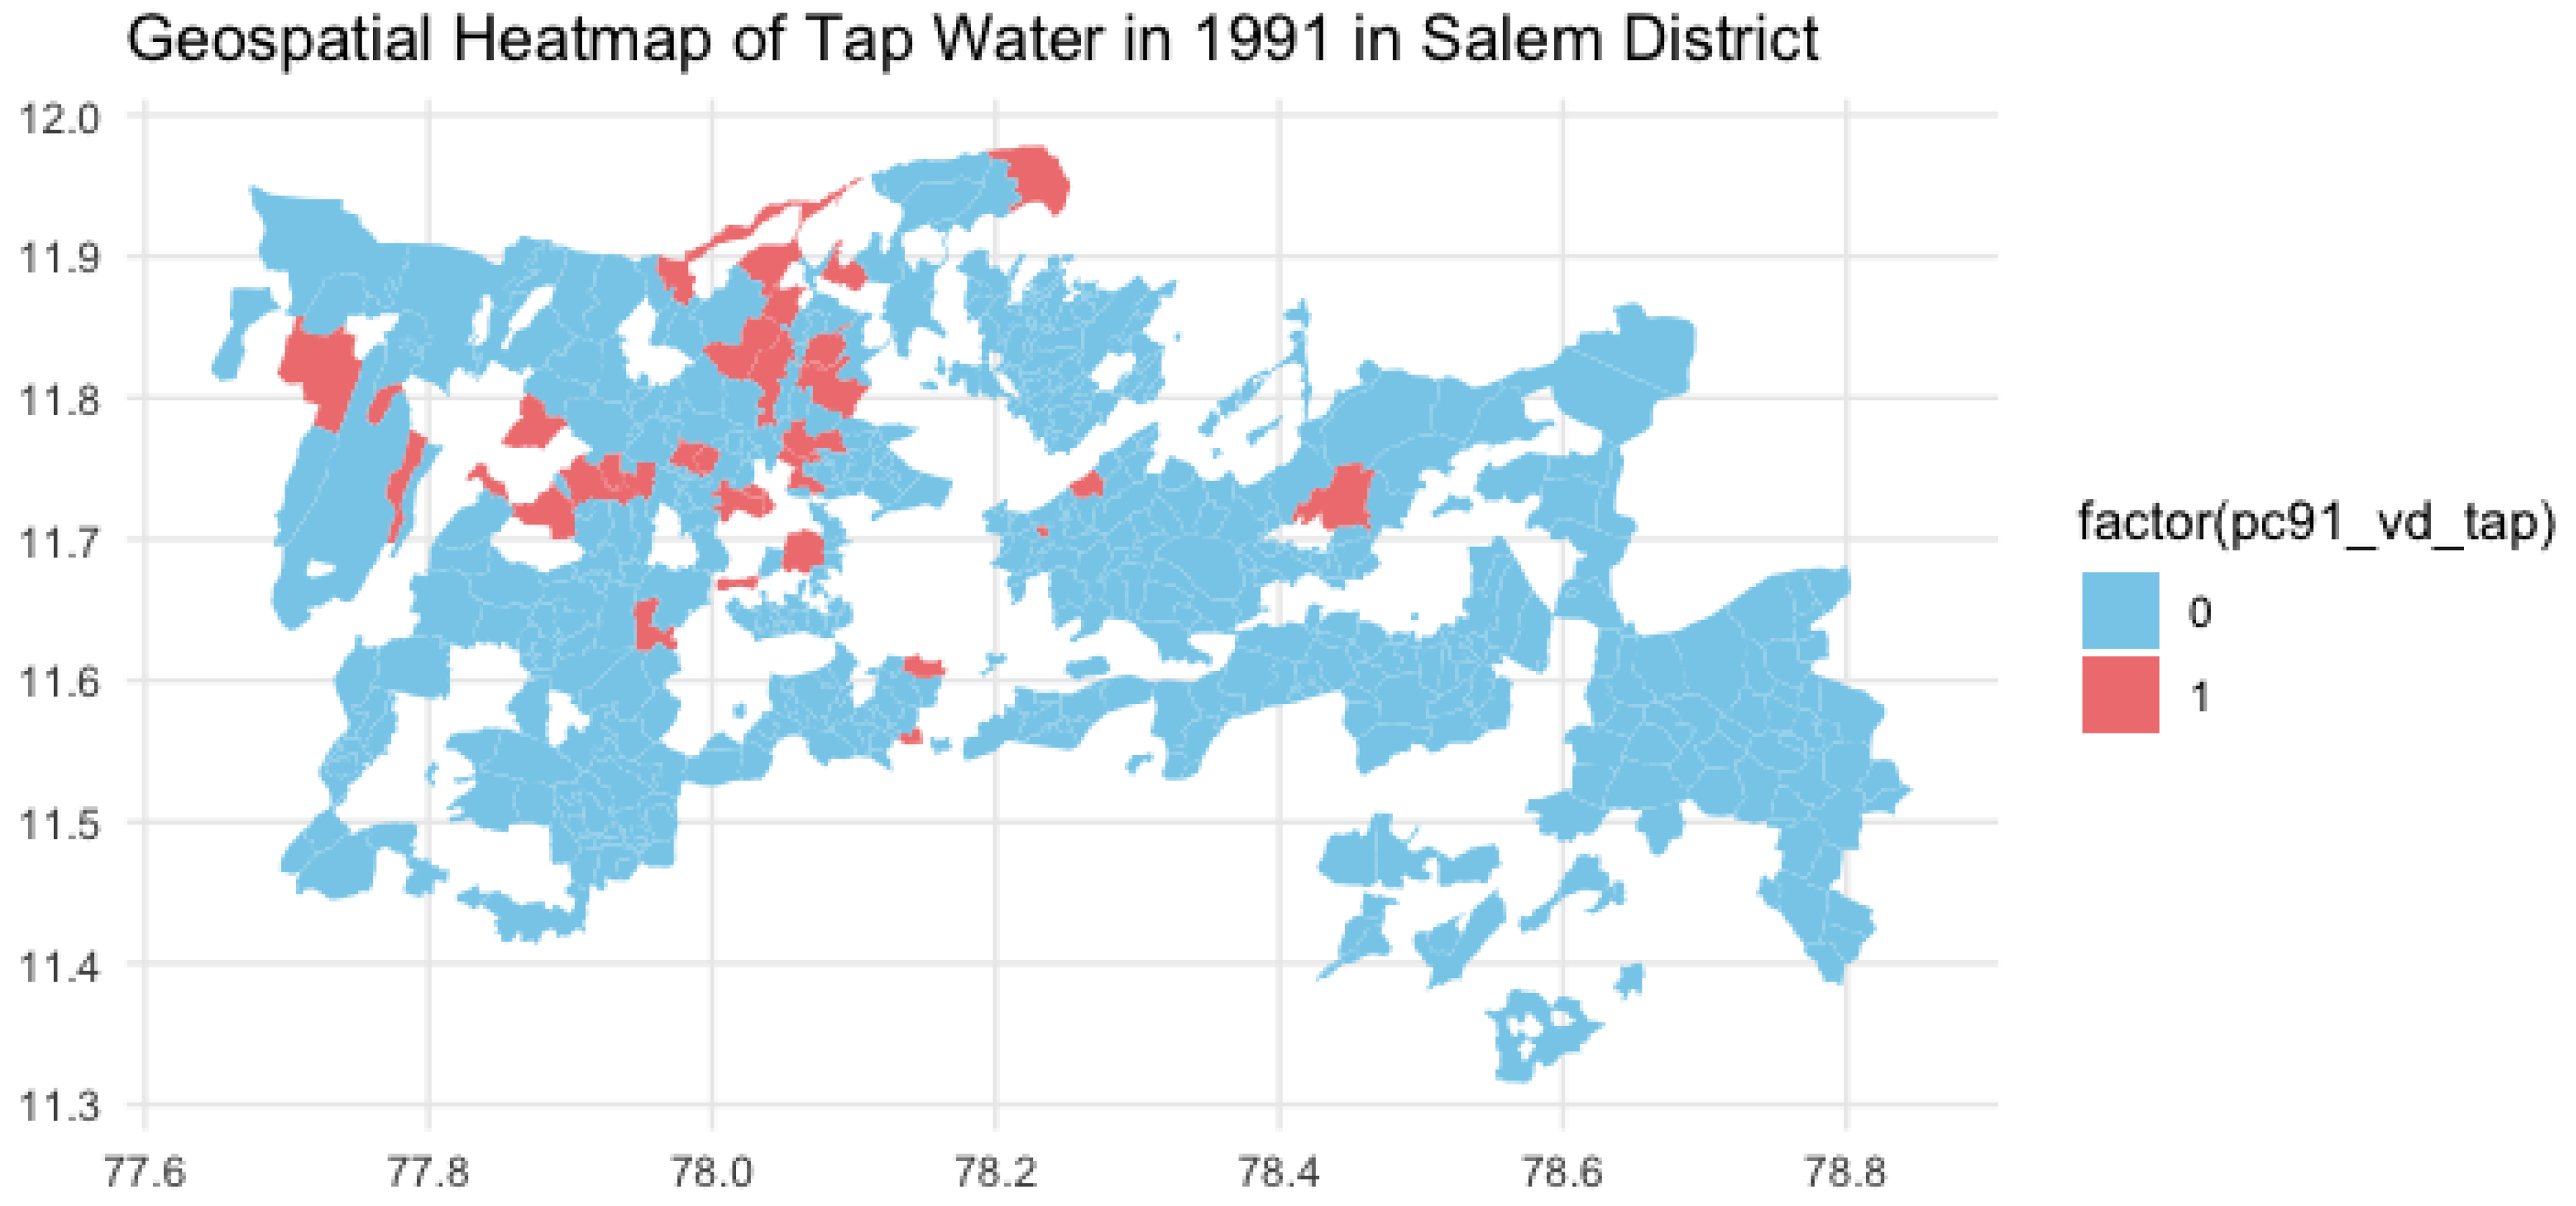
| Availability of Tap Water in Salem in 1991 |
23 |
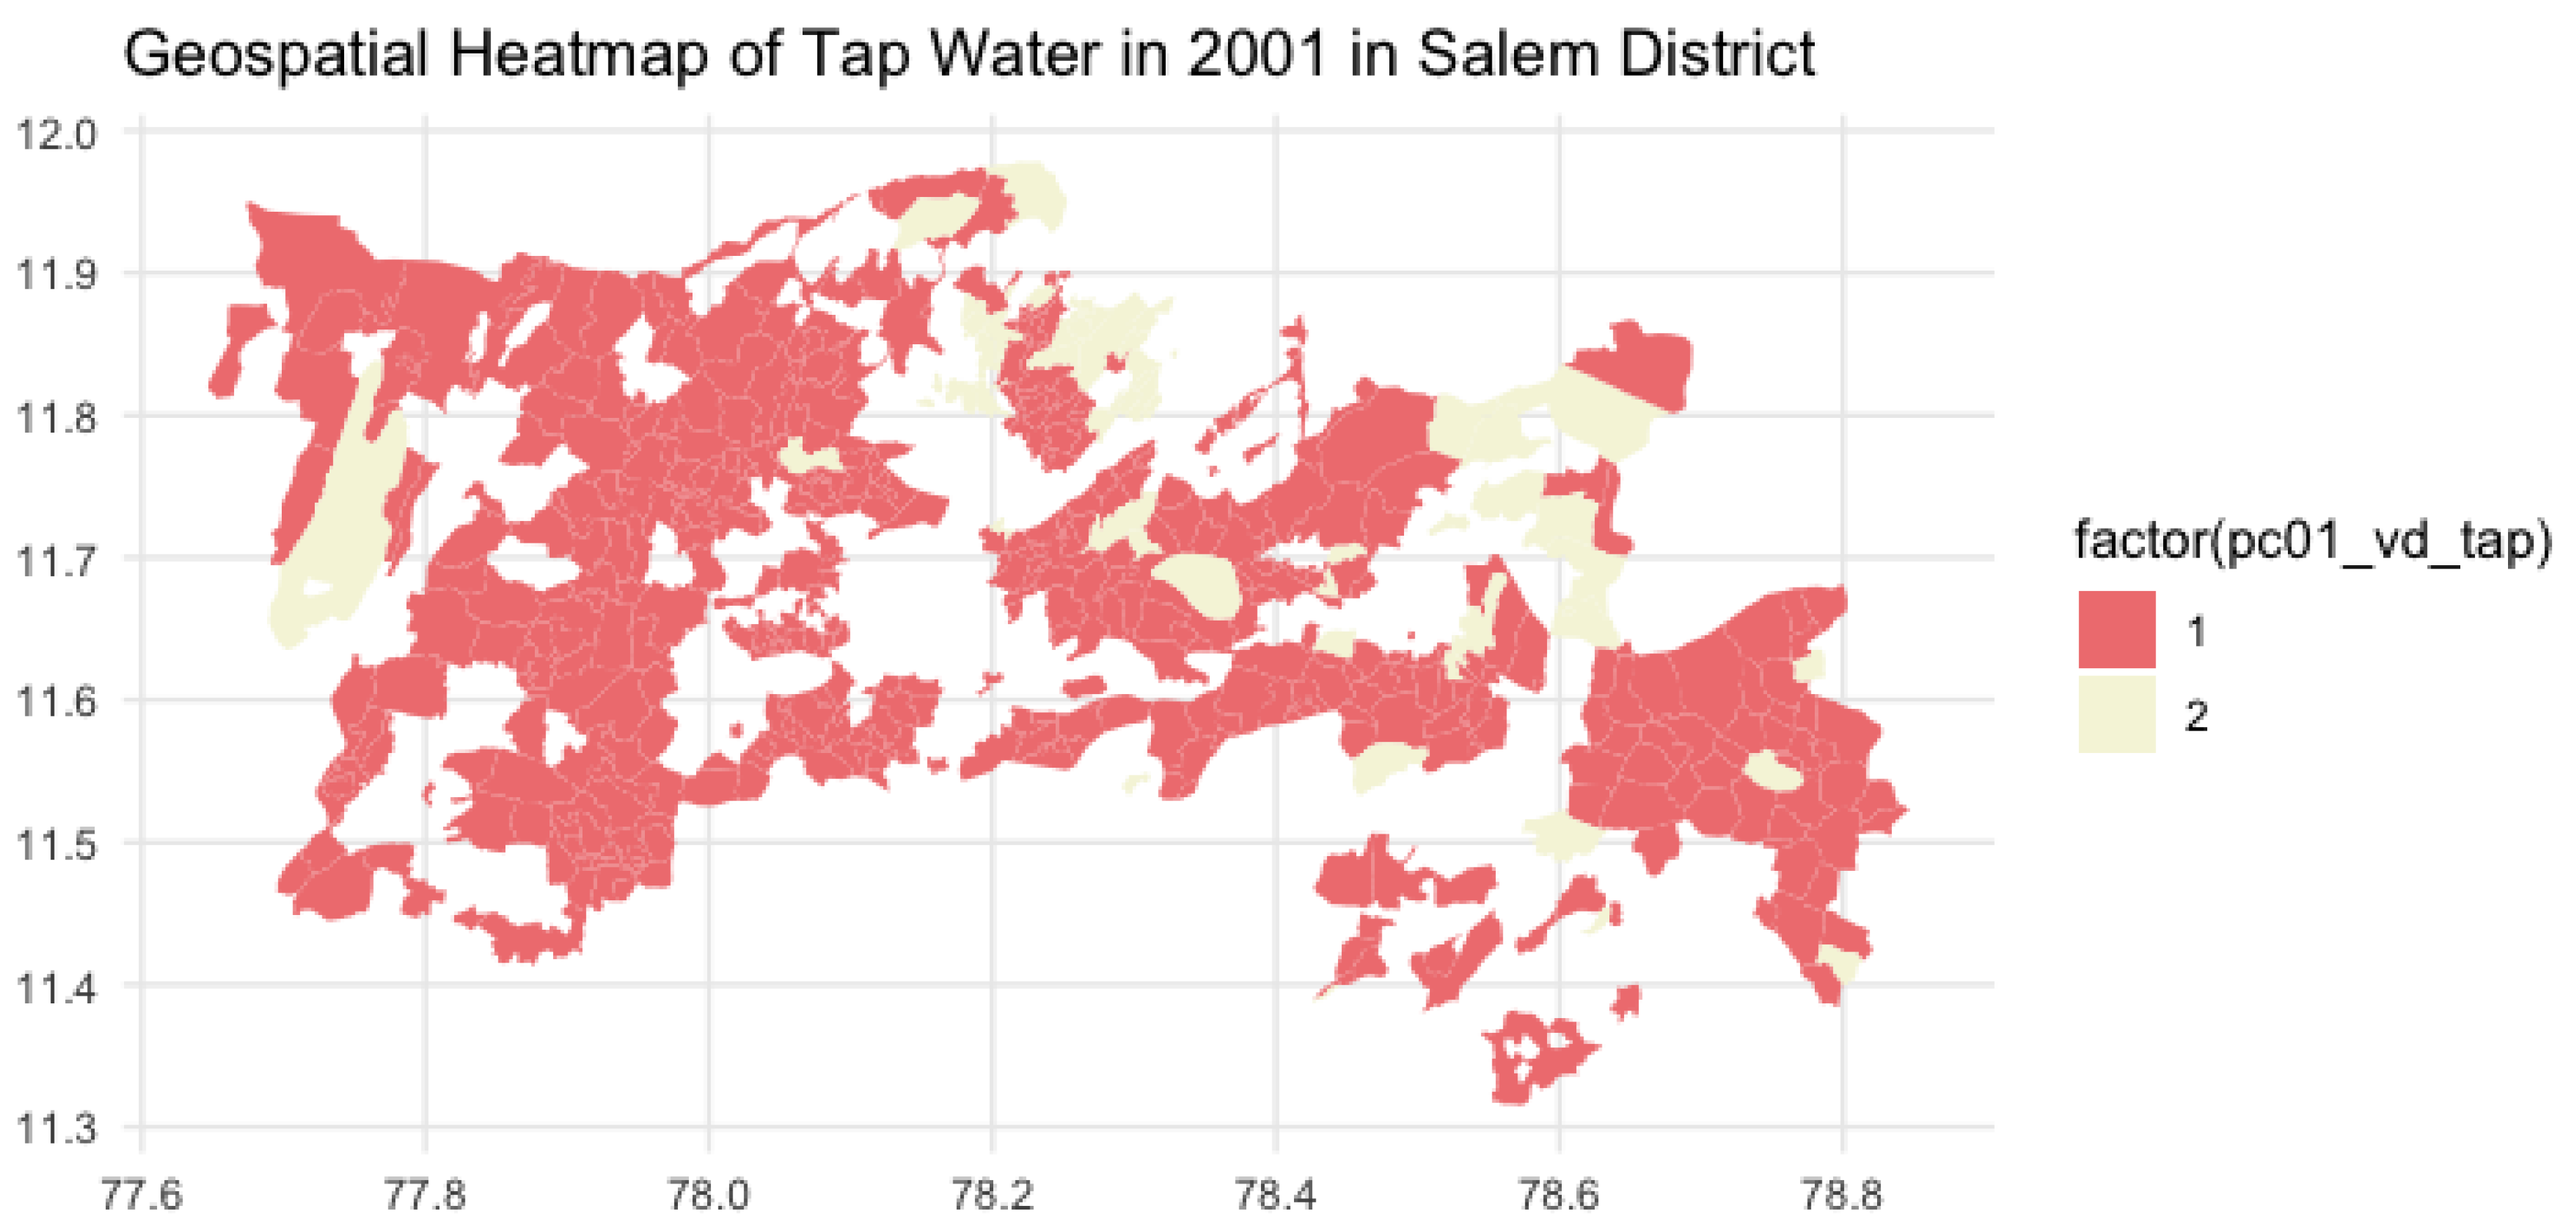
| Availability of Tap Water in Salem in 2001 |
24 |
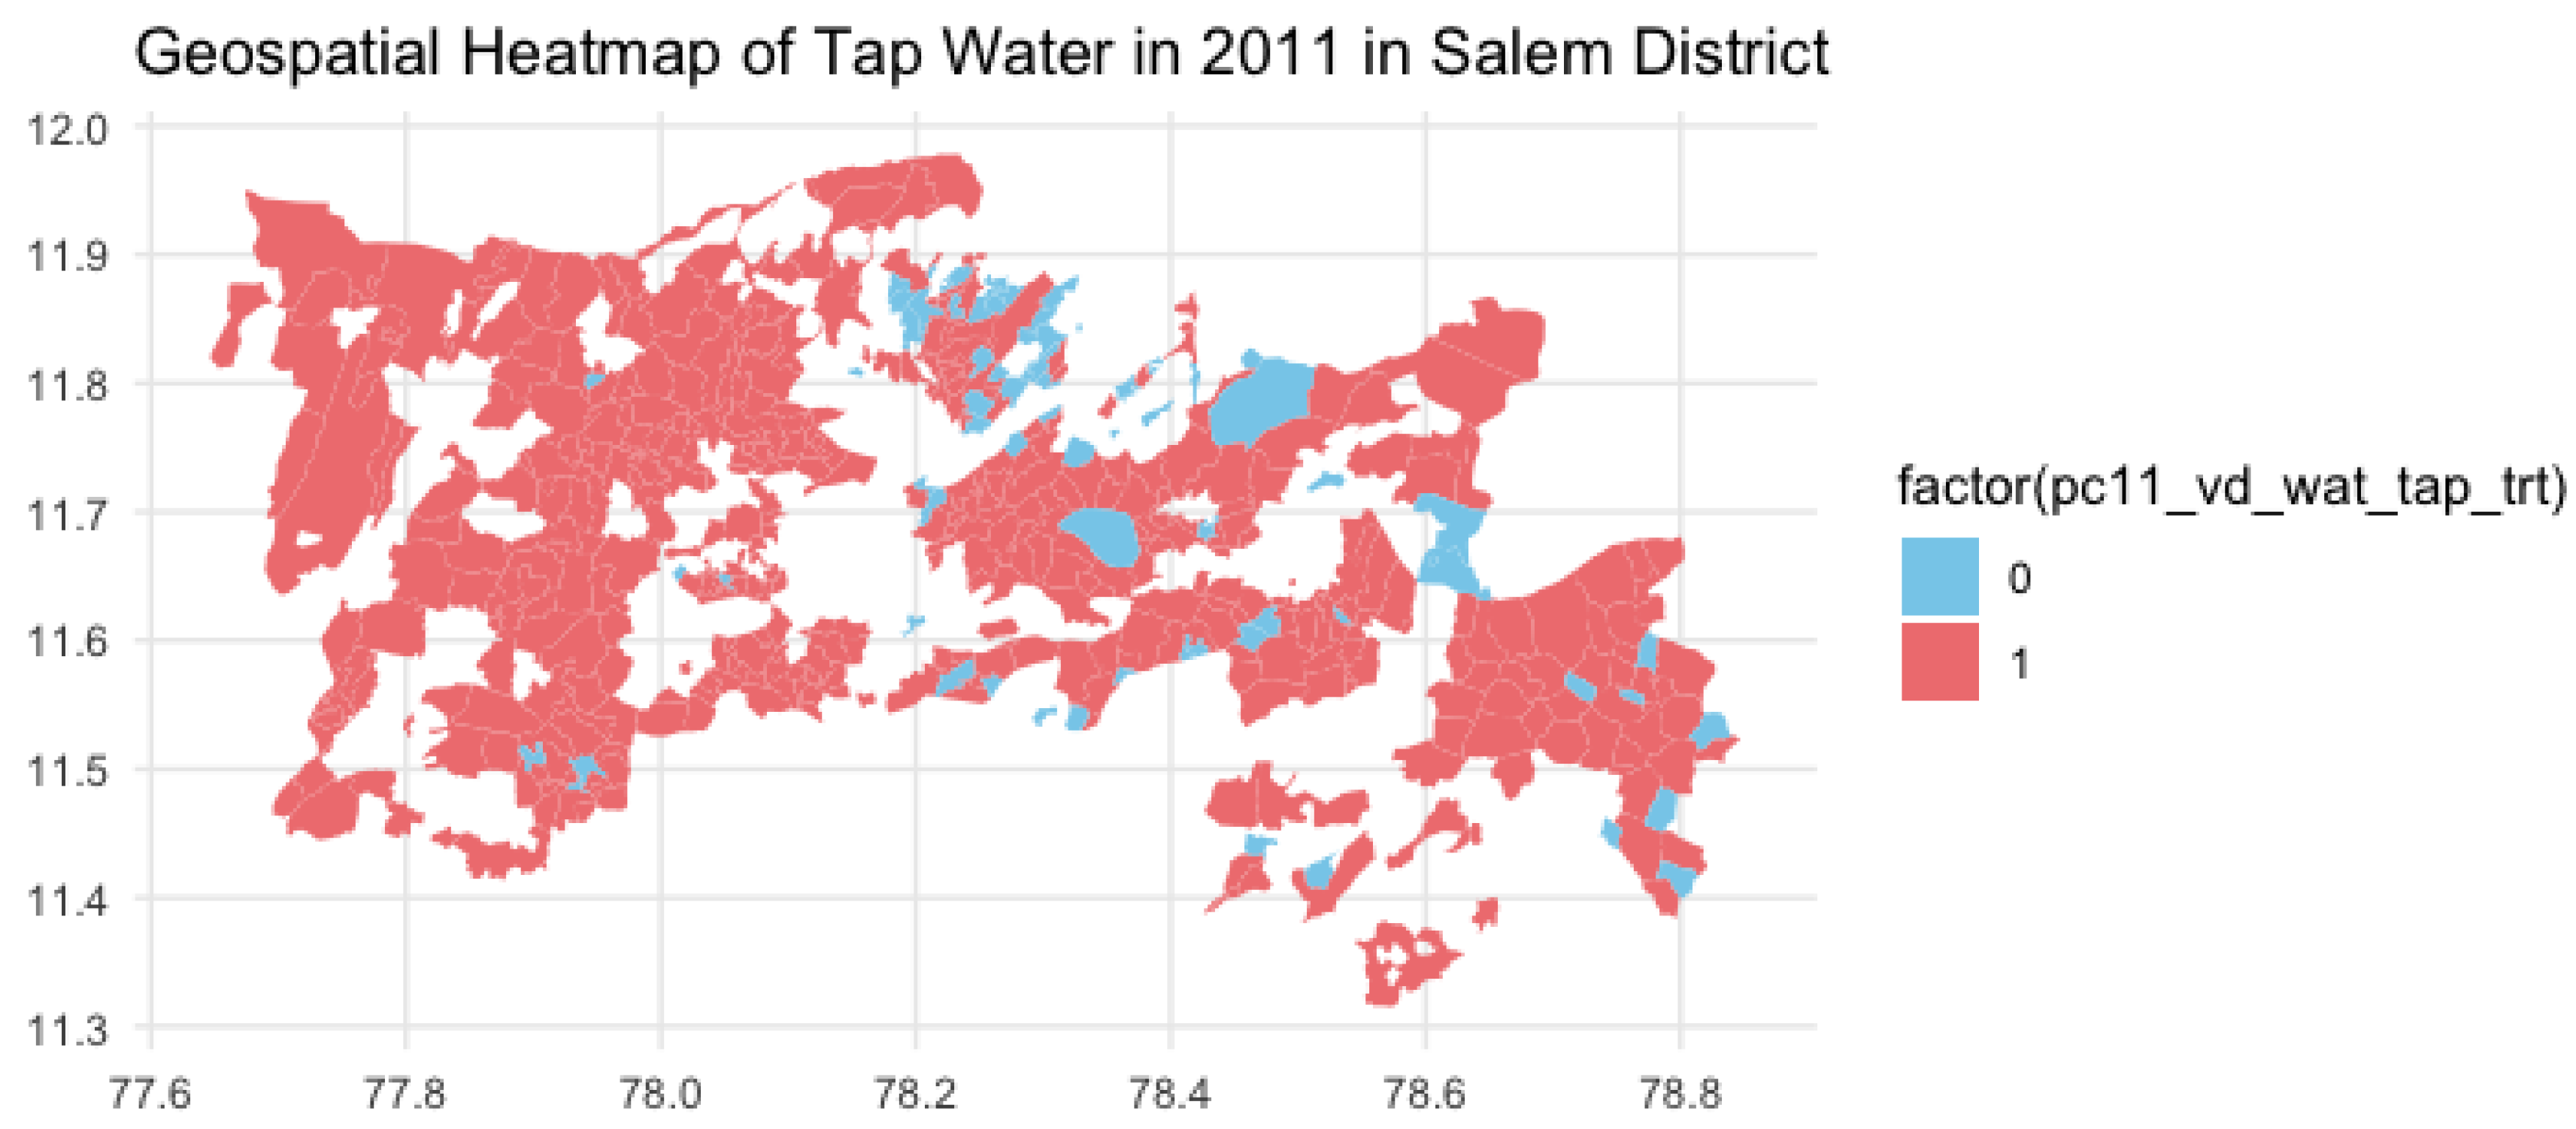
| Availability of Tap Water in Salem in 2011 |
24 |
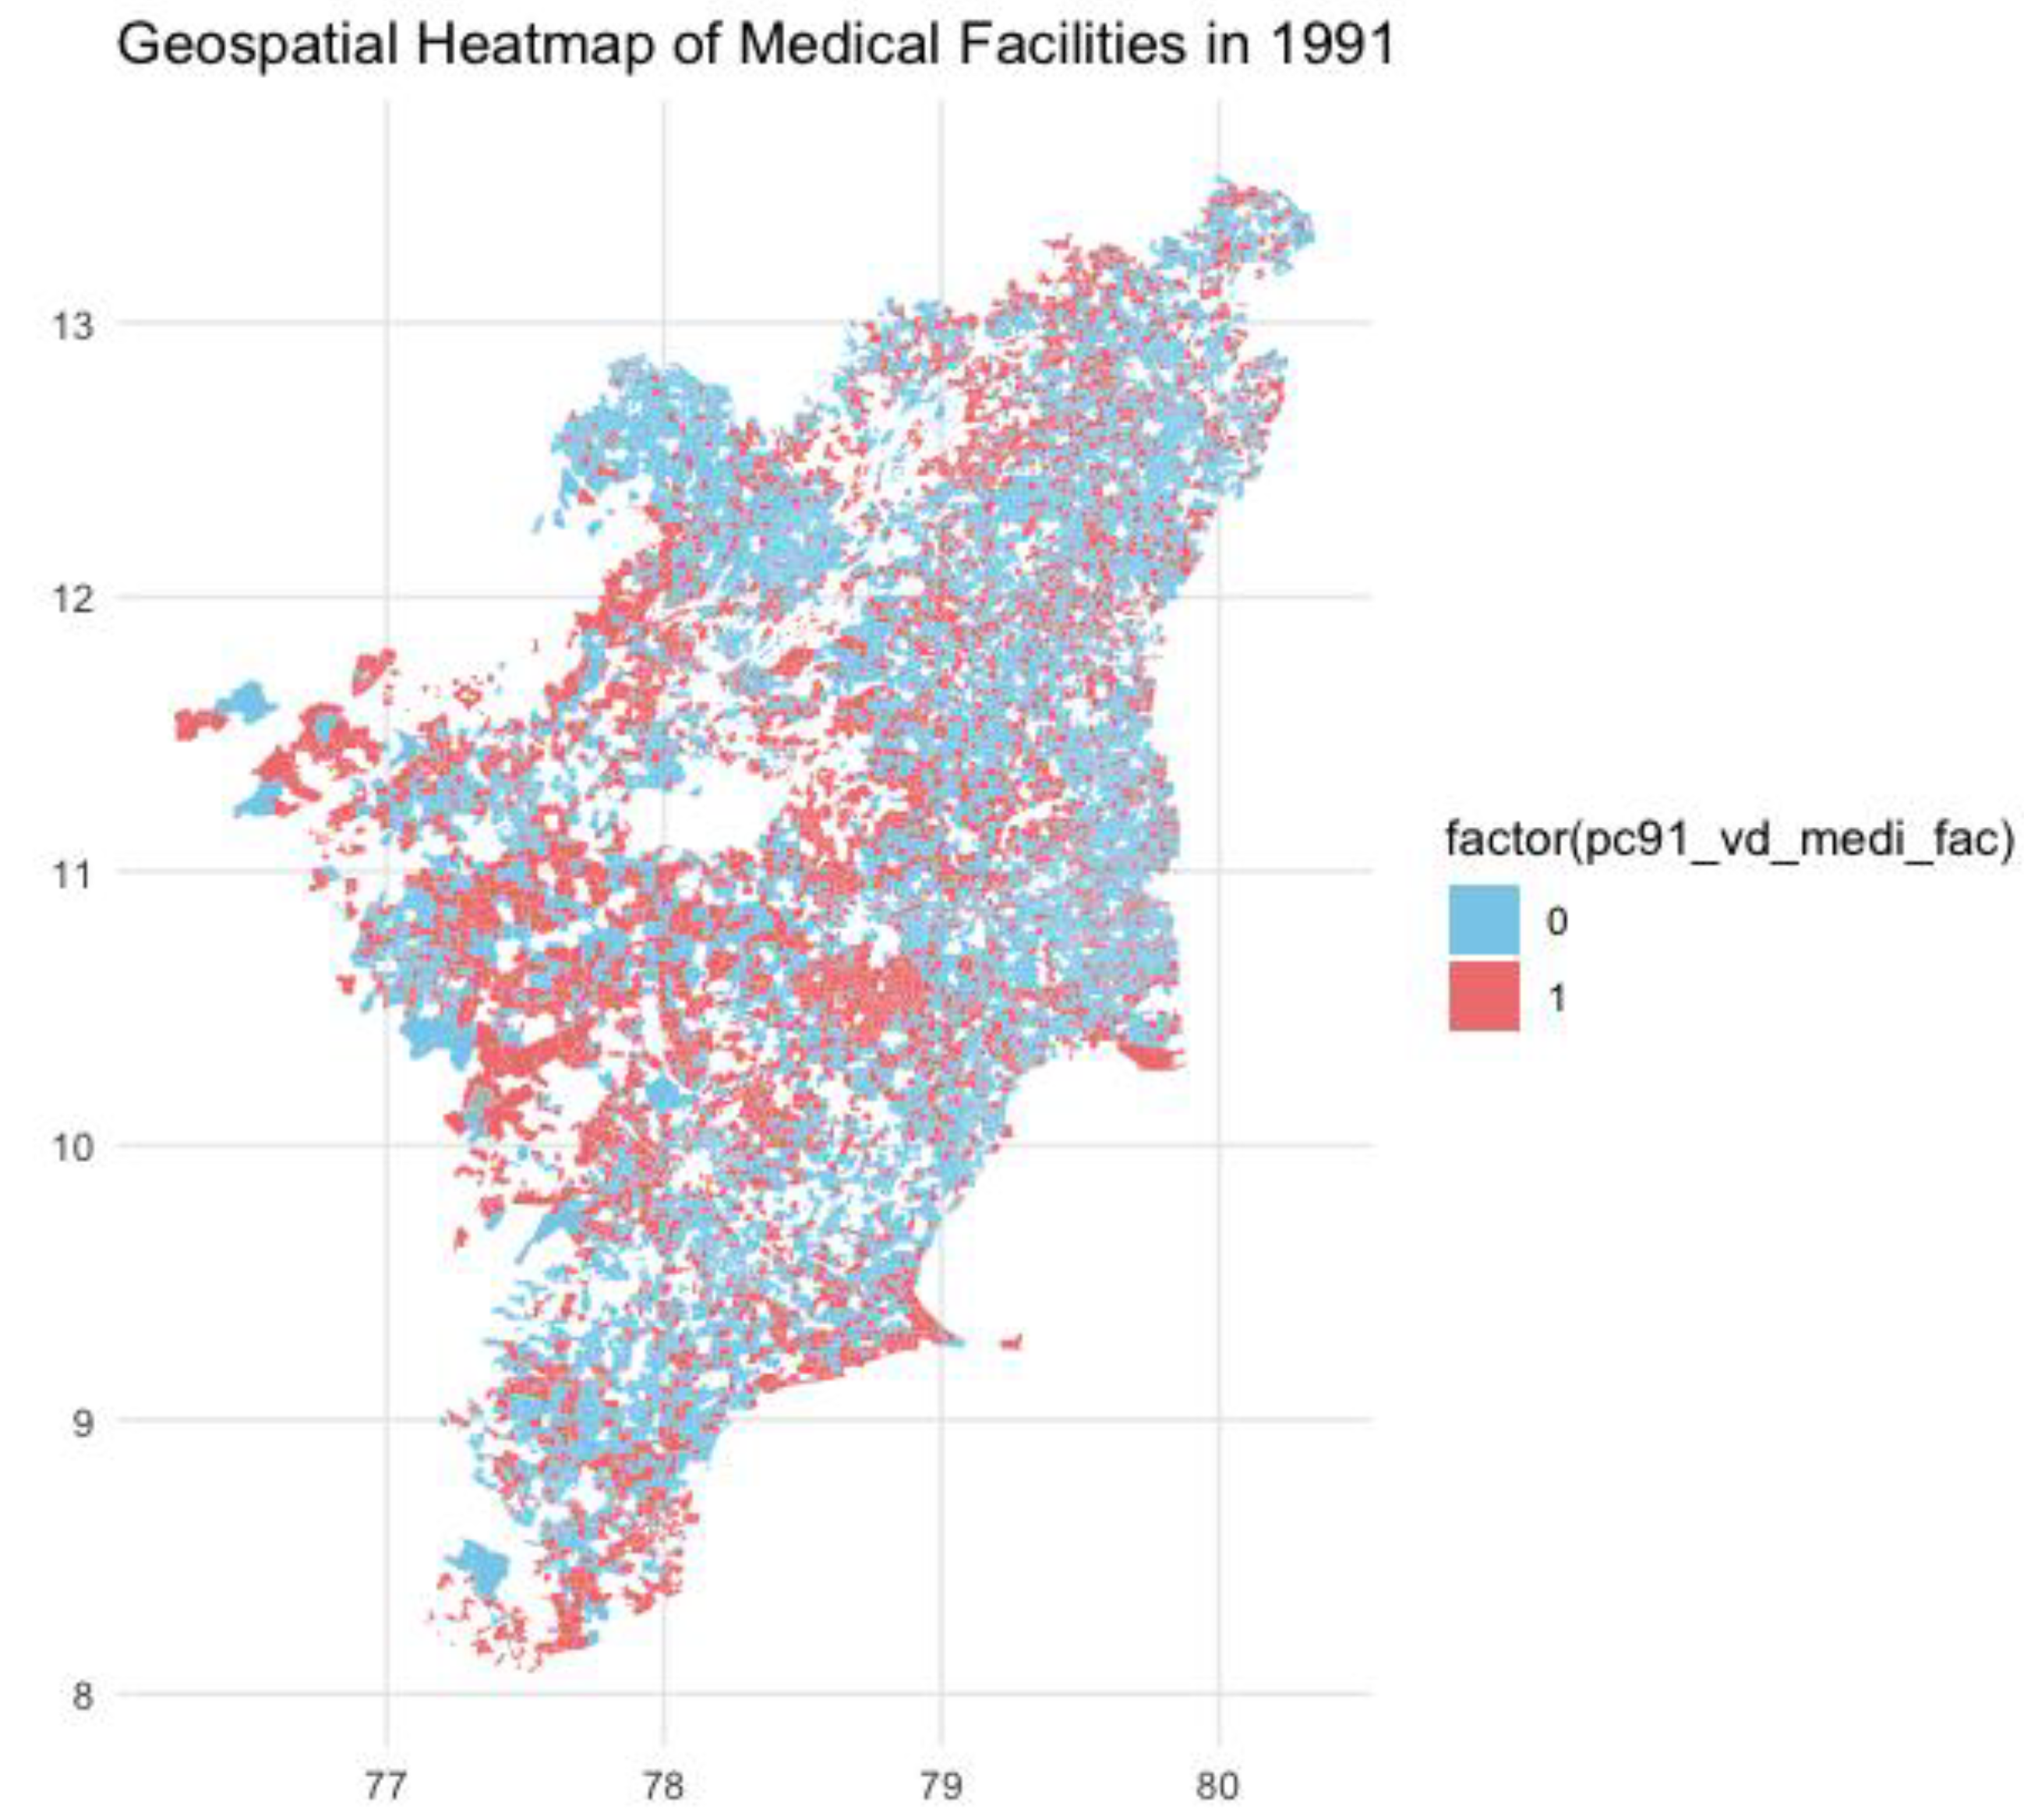
| Availability of Medical Facility in Tamil Nadu in 1991 |
25 |
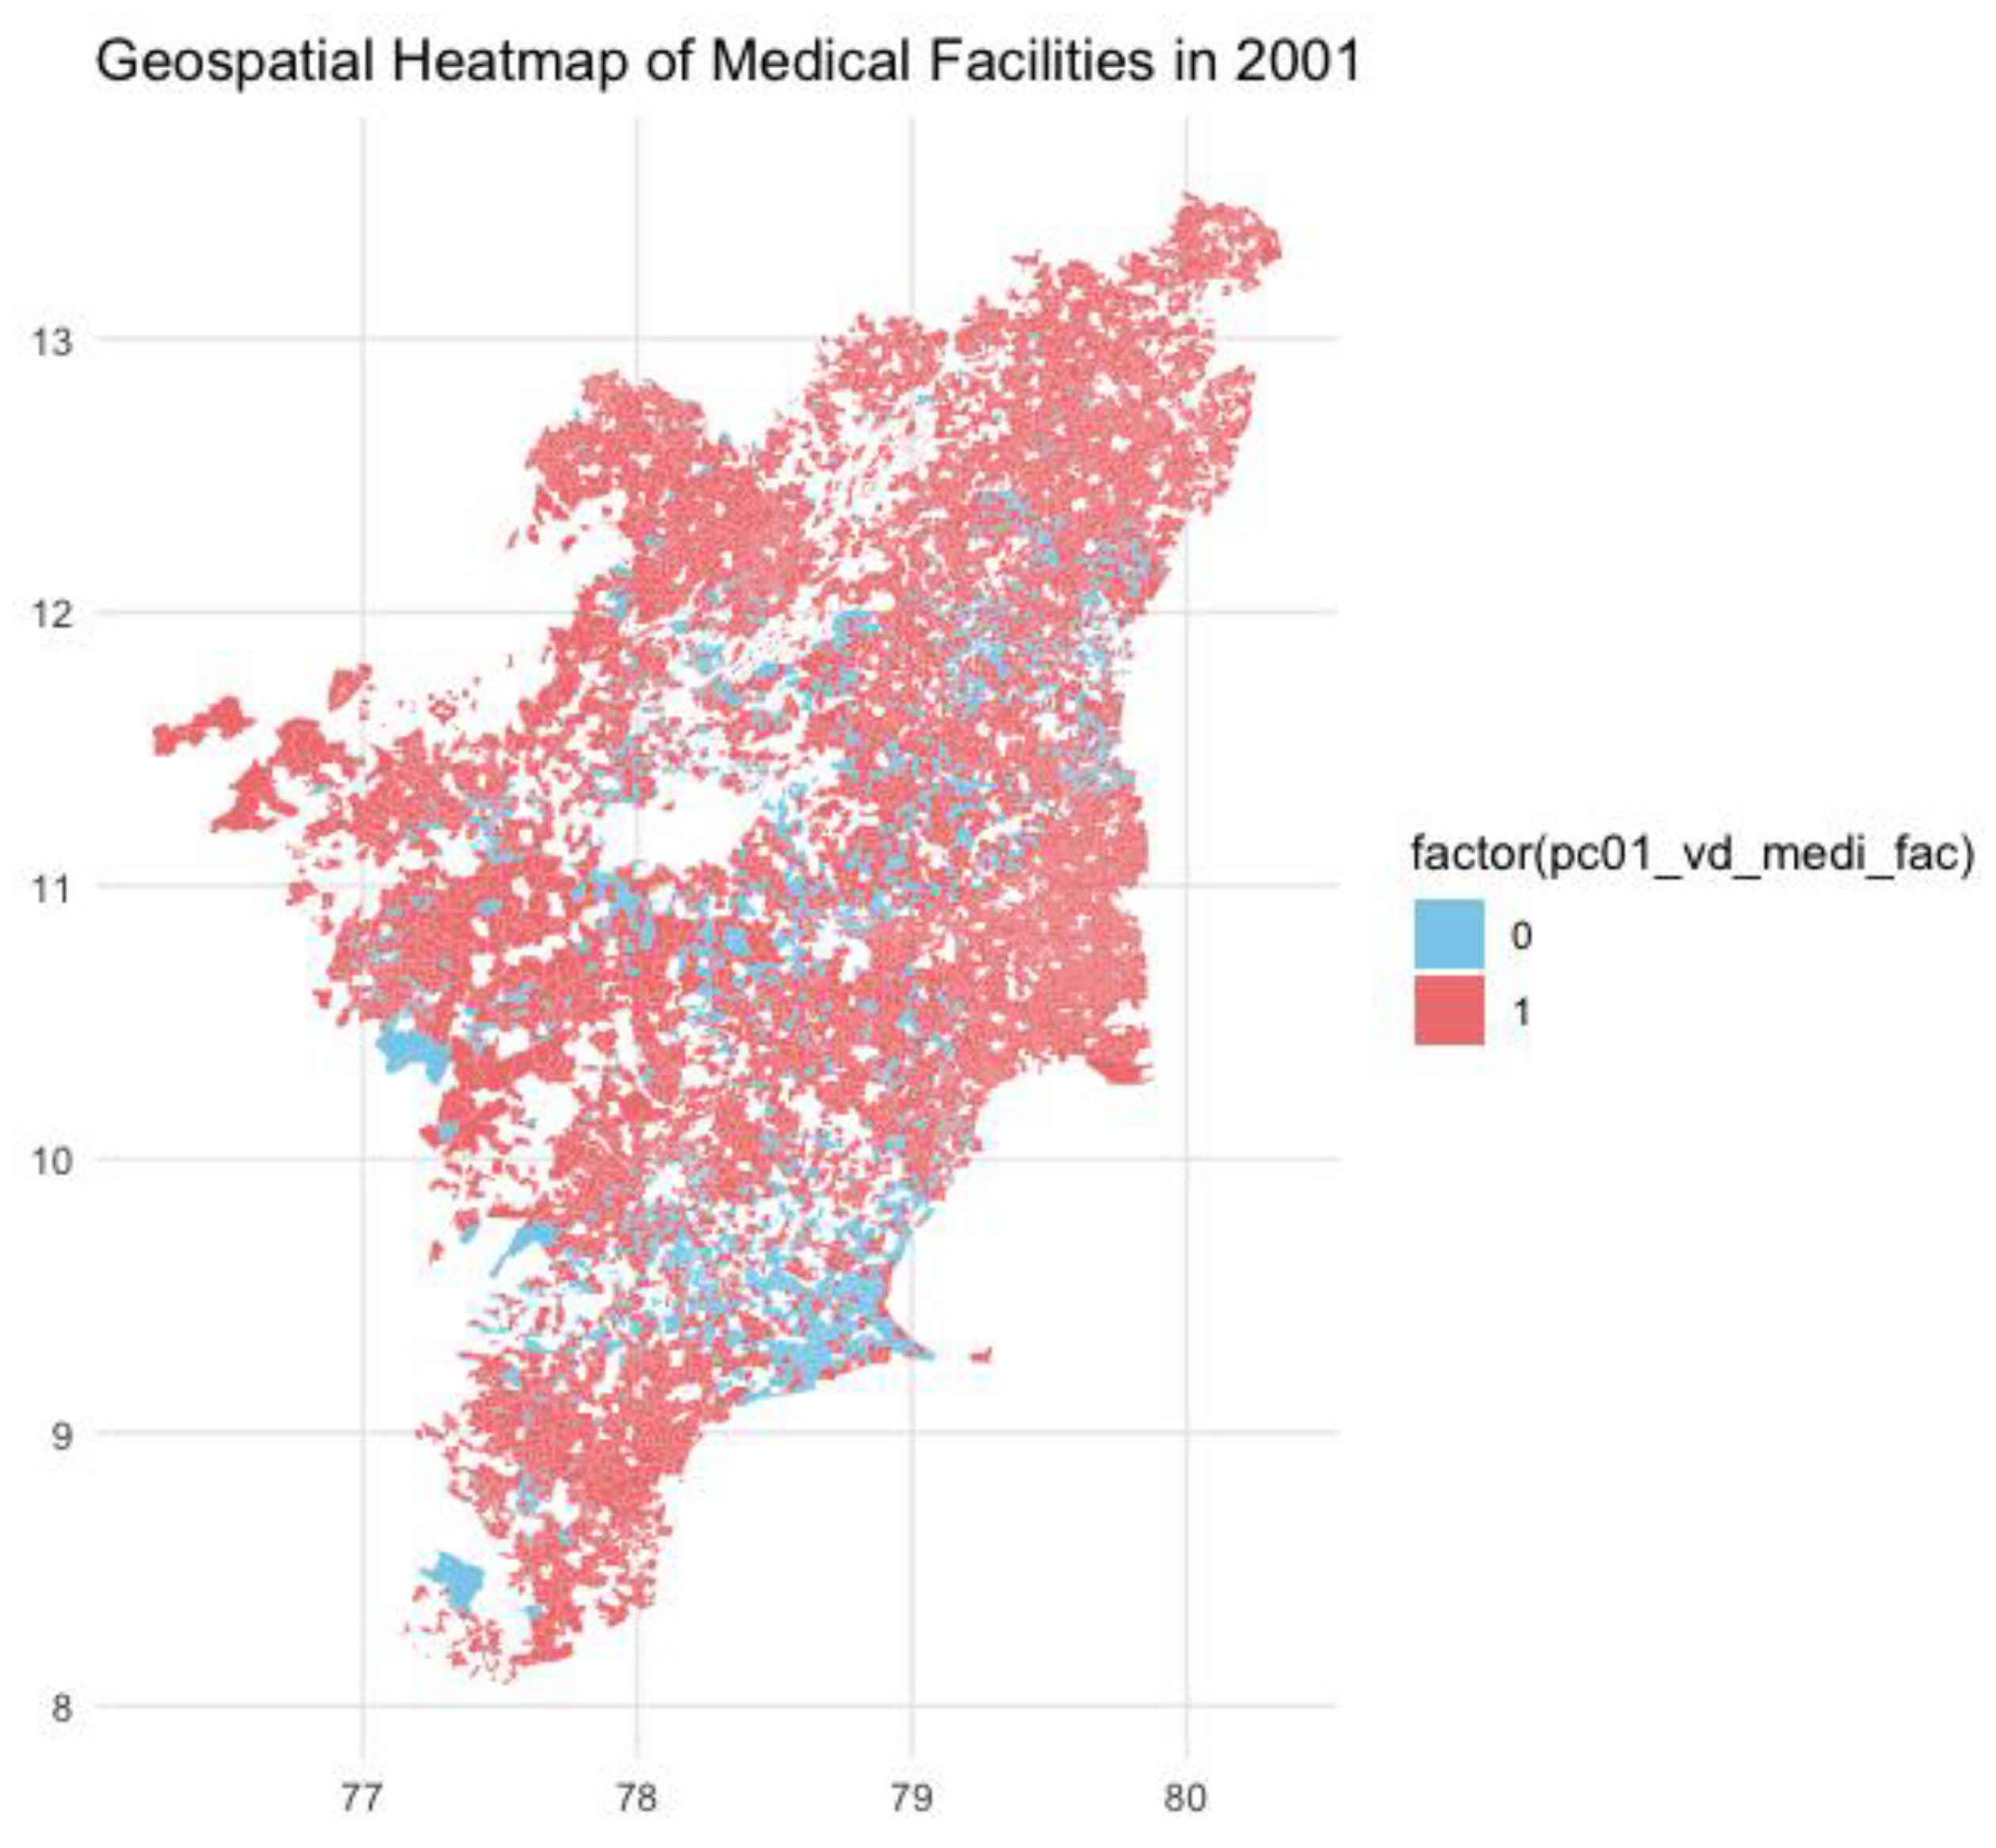
| Availability of Medical Facility in Tamil Nadu in 2001 |
26 |
| OLS Regressions of the Child Sex Ratio in Tamil Nadu Villages in 1991, 2001 and 2011 |
27 |
Introduction:
India has a long standing history of societal preference for male progeny as opposed to wanting more girls in their families. This gender bias has led to 100 million ‘missing women’, a term coined by Amartya Sen in 1990, as a result of sex selective abortion given the rise of prenatal sex selective technologies, lower female wages, and societal stigma regarding women being seen as a burden on the family due to the dowry system. Some parts of the country like Haryana, Punjab, and Delhi fare worse in terms of the ratio of females to males between the ages 0-6, whereas in South Indian states like Andhra Pradesh, Telangana, and Tamil Nadu the child sex ratio is closer to the national mean value. However, despite progressive policies like the Hindu Succession Act in 2015 that allow women to inherit their ancestral property and protect their own property, in recent years in Tamil Nadu the average female child sex ratio has fallen from 954 in 2015-16 to 878 in 2019-21. From a policy perspective, it is imperative to aim to equalize sex ratios in Tamil Nadu to avoid South Indian states turning into male-forward economies like states in Northern India. The effects of an imbalanced gender ratio leads to a marriage market crisis, rise of female abductions, and higher rates of poor health in women and infants due to neglect etc. This paper seeks to explore how female child sex ratio has been developing over two decades, between 1991 to 2011, to understand what policies can be implemented to equalize the gender balance.
In previous research, it has been identified that proper medical institutions and drinking water are two factors that can be implemented through appropriate policies and improve the health of newborn infants leading to lesser infant mortality rates and predicts a reduction in the number of missing girls (Deolalikar, Anil B et al.). The equalization in child sex ratio cannot reach an optimal rate of 1000 girls for 1000 boys, since biological factors support more male infants being born than female children due to there being a higher instance of male infant mortality. Therefore, a normal sex ratio is considered to be a higher ratio of males to girls at birth. However, the decline in child sex ratios in Tamil Nadu over the years suggests that fewer girls are surviving up to the age of 6. A skewed gender ratio in the economy leads to higher crime rates and violence, lower economic productivity since some productive outcomes like garment production rely on women employees, societal attitudes rewarding males more, and lower rates of reproduction. Equalization over a period between two decades can take place naturally due to environmental factors, however, the shift in child sex ratios between two census periods showed a significant correlation with several factors, notably the fertility rate, female literacy, total literacy rate, and the proportion of the population categorized as Scheduled Tribe. Various expressions of son preference were identified, including unequal investment in children based on gender. For instance, boys receive more prolonged schooling, earlier healthcare, and better nutrition compared to girls. Such practices, classified as discriminatory against girls, were linked to elevated mortality rates, resulting in uneven sex ratios post-birth (Arnold et al., 1998, Mishra et al., 2004). Moreover, looking into varying factors that might explain an unaccounted 50% factors leading to imbalanced female child sex ratio it is identified that vaccination rates, malnutrition, respiratory infections and diarrhea account for sex selective imbalance. Other factors like size of family may exacerbate poor health, especially for girls in India who have older sisters (Arnold et al, 2008). This paper seeks to address other factors that influence imbalanced gender ratios, in particular women’s employment, literacy, and presence of scheduled castes and scheduled tribes between 1991 and 2011 to understand three important questions: Should we equalize sex ratios in Tamil Nadu? Does it make sense from a policy perspective, or is it more ideal to wait for equalization to take place naturally? If it is wiser to look at supportive policies, in what ways can we achieve equalized sex ratios?
Data
The data has been collected from Development Data Labs’ SHRUG database. Information on Population Census has been extracted from district and village directories to gather data on child population in age groups of 0-6 males, females, and total, along with literates, scheduled castes and scheduled tribes, workers, medical facilities, and drinking water. The data has been taken for the years 1991, 2001, and 2011.
Methodology
Data for all relevant variables was downloaded and extracted for the years 1991, 2001, and 2011. Information on location and spatial stats were joined with the variables using the shrid2 key, on R. The collated information was further joined with shapefiles to generate geospatial heatmaps, bar graphs, and density plots based on district level and sub-district level data to be able to analyze information and judge the pattern of equalization of sex ratios across two decades. For computing averages, the 5th to 95th percentile of the data was taken into account and mean values were derived by grouping and averaging sex ratios at district and sub-district level.
Due to extensive research on equalizing child sex ratios done earlier, it is a known fact that measures must be taken to equalize child sex ratio to stabilize fluctuations due to environmental factors, hence the predictive OLS estimates in this paper analyze how factors like literacy, employment, and population of scheduled castes and scheduled tribes affect the gender balance from early childhood.
Hypothesis
It is hypothesized that equalization of child sex ratios takes place progressively over decades given that there is better literacy and more workers in the economy.
Results
As per the Census of India, the child sex ratio is defined as the number of girls per 1,000 boys in the 0–6 age group. The child sex ratio in India has witnessed a significant decline over the years. Census data reveals a steeper decline in the proportion of girls to boys in early childhood, dropping from 964 in 1971 to 933 in 2022-23. However, it must be noted that this ratio has probably started to equalize since it was at 913 in 2014-15, lower than the present rate. Yet, the persistently low and decreasing female child sex ratio in India raises serious policy concerns due to its infringement upon the right to live of unborn and infant girls and decline in social contributions of these “missing women.”
Table 1 below is a representation of the average child sex ratio in the years 1991, 2001, and 2011 across all states in India:
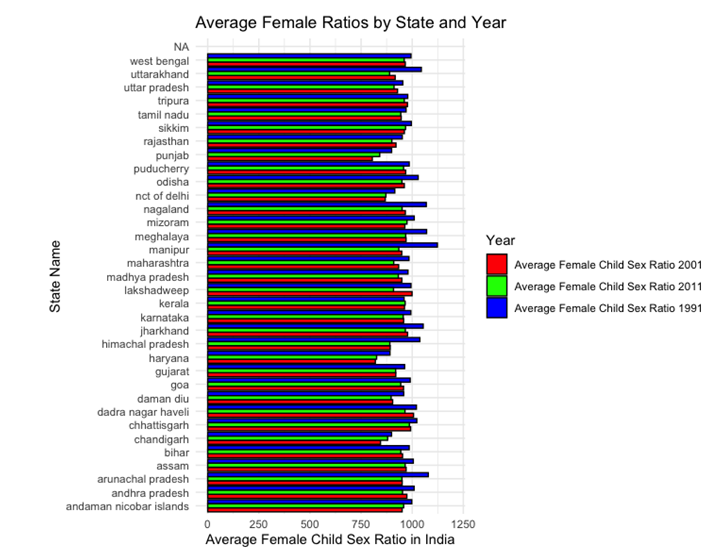
Plot 1: Bar Plot of Average Female Child Sex Ratio in India in 1991, 2001, and 2011.
Based on the averages in the bar plot Chandigarh, Haryana, NCT of Delhi, and Punjab have the lowest averages across all states in 1991, as opposed to West Bengal, Manipur, Meghalaya, Nagaland, Odisha, Arunachal Pradesh, and Uttarakhand boasting an average of almost 1:1 female to male child sex ratio in 1991. On the other hand, the averages of the Eastern states steeply declined in the following decades, coming closer to the national average. This can also be seen through the density plot in Plot 2. The average sex ratios across the nation get concentrated towards the mean value, whereas in 1991 there was more variation in the data. The curves are normally distributed, slightly taking on a bimodal distribution suggesting that although the child sex ratios are concentrated along the mean value, yet the data contains two modes or clusters that the concentration of the gender ratio falls under. This suggests that the gender parity isn’t as straightforward as seen in the bar plot, and requires a deeper analysis. For instance, in 1991, the density increased around 900 and then again at around 980, and in 2011 the density concentrated around 850, 900, and 950, implying that strong preferences and underlying factors are influencing the gender balance.

Plot 2: Density Plot of Average Female Child Sex Ratios in India for 1991, 2001, and 2011.
Similarly, in the case of Tamil Nadu, the average has remained stable with lesser reduction than other states in the period between 1991 and 2011. However the density plot shows a clearer picture of there being a concentration in multiple means, suggesting that there are multiple preferences which affect the early childhood gender parity. The effect could be due to various factors, like increase in sex selective abortion, migration, lower economic opportunities for women, etc. Additionally, although the pattern of multiple preferences has not changed between 1991 and 2011, the average ratio of girls to boys between the ages of 0-6 has gradually declined over the years. In 1991, the mean is closer to 1000 implying an almost equal child sex ratio, and by 2001 the mean is around 950, and further closer to 900 by 2011, suggesting that policy interventions must be designed to boost and equalise the sex ratios in early childhood.
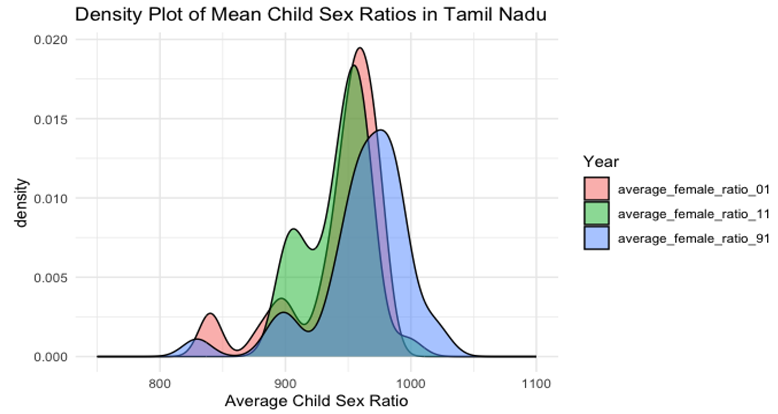
Plot 3: Density Plot of Average Female Child Sex Ratios in Tamil Nadu for 1991, 2001, and 2011.
Examining Child Sex Ratios in Tamil Nadu: A Detailed Analysis
Tamil Nadu, the 11th largest state in India by land area, ranks as the seventh most populous in the country. Its primary language, Tamil, traces its origins back to 500 BC. According to the 2011 census, Tamil Nadu’s population reached approximately 72 million, with 36,137,975 males and 36,009,055 females. In 2001, the total population was 62,405,679, comprising 31,400,909 males and 31,004,770 females. The state has witnessed an upward trend in literacy rates, reaching 80.09 percent in the 2011 population census. Male literacy stands at 86.77 percent, while female literacy is at 73.14 percent. In 2001, the literacy rate was 73.45 percent, with male and female literacy rates at 83.28 percent and 64.91 percent, respectively. Tamil Nadu has 32 districts.
Examining gender differences in infant mortality on a nationwide scale, it can be noted that in Tamil Nadu policy interventions, such as the Cradle Baby Scheme, the Girl Child Protection Scheme (GCPS), legal actions against female infanticide, and targeted social awareness campaigns, have played a pioneering role in reducing gender disparities in infant mortality. Tamil Nadu’s experience offers valuable insights for policy responses to address the gender imbalance. In addition, various NGOs, particularly in Madurai (including Theni), Salem (including Namakkal), and Dharmapuri, have been actively involved in these efforts. Therefore, contrary to the national trend, Tamil Nadu’s child sex ratio experienced an increase for the first time since 1961, rising from 942 in 2001 to 946 in 2011. This shift may be attributed to increases in specific districts and/or population movements across districts (Srinivasan, Sharada et al., 2012). The changes in child sex ratio across districts therefore paint a different picture than the national average, as can be seen in
Figure 1,
Figure 2, and
Figure 3.
Based on the Heatmaps, it can be seen that Theni district showcases a gradual change in child sex ratio, where in 1991 the parts of the district fell in the average range of 800-900 and in 2001 some sub-districts improved to a 900-950 range, and in 2011 all of Theni district fell into the average range of 900-950. On the other hand, Dindigul district in 1991 was one of the districts showcasing gender balanced ratios at a range between 950-1000 on average, however in the following two decades in 2001 and 2011 the average fell in range between 900-950. It is to be noted that although the district average was between 900-950 in 2001, many sub-districts in Dindigul fell drastically in the range of 800-900 in the same year. By 2011, these sub districts equalized to 900-950. In the same vein, Salem district fell in the average range of 800-850 in 1991 and 2001, but by 2011 the district reached an average of 900-950. The Nilgiris in 1991 had strong gender balance, where on average the female child sex ratio was between 1000-1050, then in 2001 it dropped to an average range of 950-1000, and again in 2011 rose to an average range of 1000-1050. Virudhunagar and Thoothukudi district have stayed at an average range of 950-1000 across both decades, from 1991 to 2011. Ariyalur District on average was in the 950-1000 range in 1991 and 2000, and later in 2011 fell to the 900-950 range. Its neighboring district Perambalur was in the 950-1000 range in 1991, but fell to 900-950 range in 2001 and stayed on in the range in 2011. The change in sex ratios over decades has been plotted in Plot 2, to showcase the negative or positive change in female child sex ratio in between 1991-2001 and 2001-2011 for all 32 districts of Tamil Nadu.
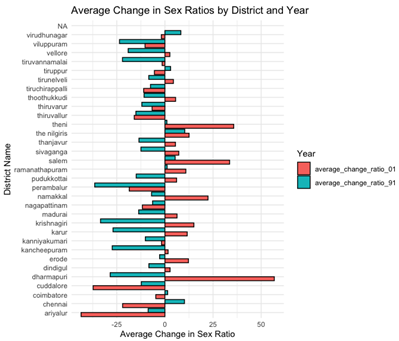
Plot 4: Average Change in Female Child Sex Ratio by District between 1991-01 and 2001-11.
The average change ratio is the difference in the ratio of average female child sex ratio between 1991-2001, and 2001-2011. It must be noted that on average there is more negative change in sex ratios than positive change. On a further deeper analysis, it is more interesting to find the correlation between the average female sex ratios in 1991 and the change in female child sex ratios between 1991 and 2001, and later between the average female sex ratios in 2001 and the change in sex ratios from 2001 to 2011. (Diamond-Smith, Nadia G) The relation can be visualised through a scatter plot, where the y-axis is the change in sex ratios, and the x-axis is the child sex ratio for all districts, sub-districts, and villages in Tamil Nadu. Only 1% of the outliers have been removed from the data, to look at the real relationship between base year female sex ratio and the change. The relations have been plotted on the scatter plots below:
Plot 5 and Plot 6 have data points from raw female to male child sex ratios in Tamil Nadu, where female child population below the age of 6 was divided by male population below the age of 6 and multiplied by 1000 to understand how many girls were born for every 1000 males. From the scatter plots there is a strong, linear, and negative correlation, further confirming that over the years, on an average, as time has passed the female child ratio to male child ratio has declined. On the other hand, it can be seen that between 2001-11, the gender ratios are clustered around 500-1500, and the change in gender ratios is between -500 to 500. This again suggests that there are multiple preferences at play, including differences in preferences between districts, which could explain the null relationship as can be seen on the plot.
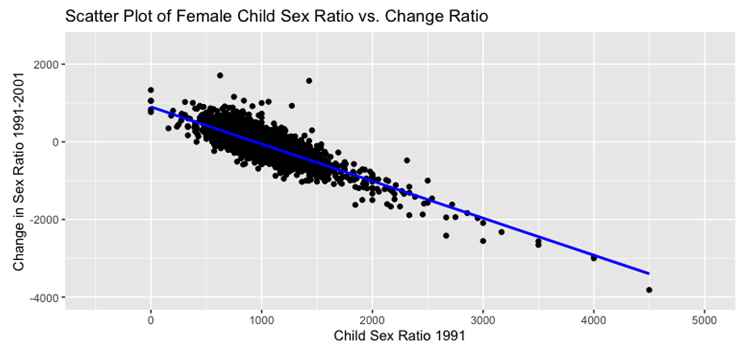
Plot 5: Scatter Plot of Female Child Ratio 1991 v/s the Change in Sex between 1991 and 2001.
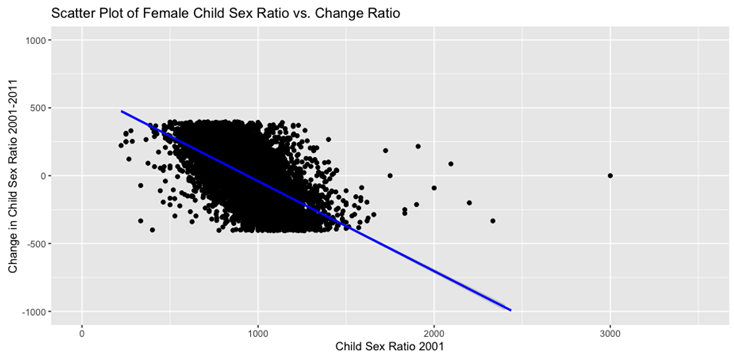
Plot 6: Scatter Plot of Female Child Ratio 2001 v/s the Change in Sex between 2001 and 2011.
District-Wide Results to Understand the Patterns of Child Sex Ratios in Tamil Nadu:
A district level analysis could further explain the negative correlation and to understand the variation in the patterns of child sex ratios in Tamil Nadu. To conduct this analysis, values between the 95th and 5th percentile were taken into account, while removing 1% of the outliers from the data.
Based on Plot 7, the average early childhood gender ratios in sub-districts within Ariyalur district are densely concentrated above the mean value and at the same time showcasing a bimodal distribution in 1991 and 2001. It is implied that although there are gender based preferences, they are not influencing the sex ratio. However, in the same district in 2011, there is a uniformly distributed curve suggesting that the probability of the mean sex ratio falling between 800 to 1000 has an almost equal chance of occurring. In such a case, policies promoting gender balance need to be set in place in Ariyalur district to ensure the sex ratio does not skew to the left of the mean.
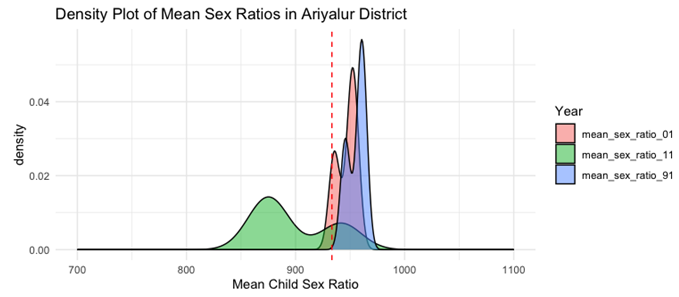
Plot 7: Density Plot of Average Female Child Sex Ratios in Ariyalur for 1991, 2001, and 2011.
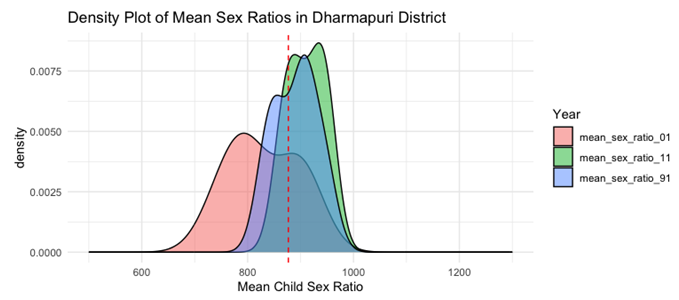
Plot 8: Density Plot of Average Female Child Sex Ratios in Dharmapuri for 1991, 2001, and 2011.
In Dharmapuri, the mean child sex ratio in 1991 is concentrated to the right of the mean, suggesting that there aren’t strong environmental or social factors causing a skew in gender balance. However, within the next 10 years a drastic change occurs where the graph begins to take the shape of a uniformly distributed curve, suggesting protective policies need to be implemented to ensure the gender balance remains normal. In 2011, the gender ratio returned to a normally distributed curve to the right of the mean. As stated earlier, various NGOs in districts like Dharmapuri and Salem have been working to equalise the gender balance in early childhood, and could be one of the reasons for the return to a healthy correlation from 2001 to 2011 for this district.
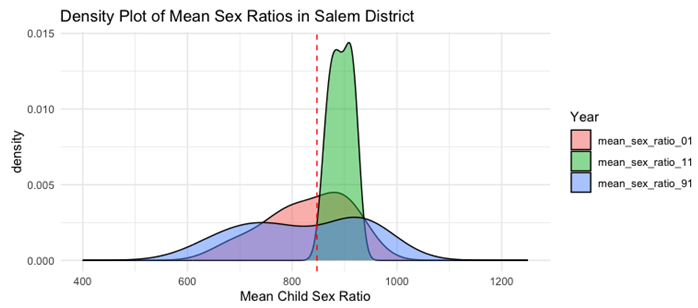
Plot 9: Density Plot of Average Female Child Sex Ratios in Salem for 1991, 2001, and 2011.
This contention is further solidified by taking a look at the density plot of Salem district. The plot has transformed positively from a uniformly distributed curve from 1991, to a curve that is taking the shape of a normally distributed bell curve in 2001, to a concentrated curve to the right of the mean in 2011. The total literacy rate in Salem district was 84.42% in 2011, higher than the Tamil Nadu average of 80.09%. Other factors like increase in medical facilities and provision of tap water could also affect the progress in child sex ratio. Ideally, in other districts, protective and promotive policies can have a similar linear growth effect.
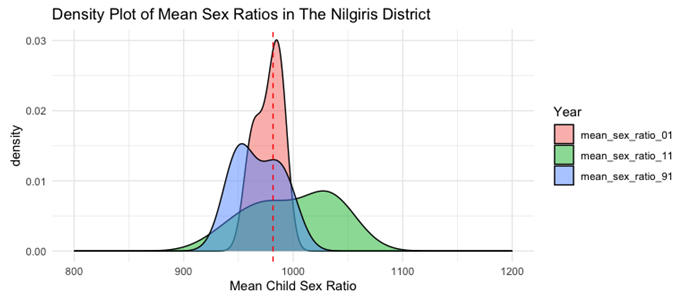
Plot 10: Density Plot of Average Female Child Sex Ratios in The Nilgiris for 1991, 2001, and 2011.
Taking another district into consideration, The Nilgiris, in 1991 was a binomial distributed curve across the mean, where the child sex ratio was densely populated to the left of the mean. In 2001, the curve implies that the sex ratios were equalized to the average value across all districts. Over the next 10 years, by 2011, the curve transformed to a uniformly distributed curve, suggesting that every outcome has an equal chance of occurring and further proving the null relationship in the child sex ratios between the sub-districts within the Nilgiris. The possible factors affecting such change are most likely environmental causes, and is a possible argument for what can take place over time despite a lack of policy intervention on a larger scale in all of Tamil Nadu over a longer period of time. The null relationship, paired with a negative correlation, is an opportunity to identify the particular areas where policy interventions need to be implemented to bring about a positive correlation and ideally equalised child sex ratios across Tamil Nadu. To begin with, all average child sex ratios across Tamil Nadu must be taken into account-
As seen in the bar plot in Plot 11, Theni and Ariyalur have the lowest average female sex ratio across all districts in Tamil Nadu. Although it has been contended that sex ratios tend to equalize over time, it is not a completely natural occurrence as can be seen from the differences in results of the density plots from only 4 districts within Tamil Nadu. Beyond equalization, it is imperative to also have a stable rate of average sex ratios. Some of the factors that systematically affect child sex ratios have been identified as literacy rate, working population, presence of medical facilities, population of scheduled castes and scheduled tribes, and proper water channels.
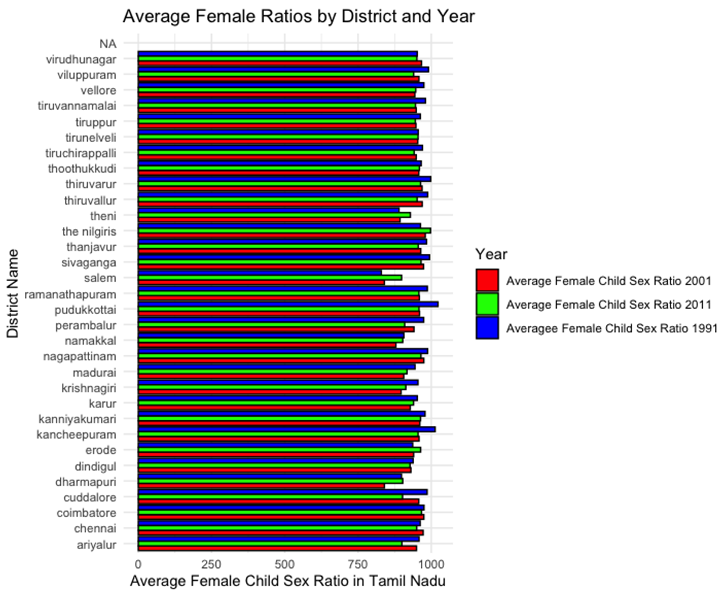
Plot 11: Bar Plot of Average Female Child Sex Ratio in Tamil Nadu Districts for 1991, 2001, and 2011.
One factor which can be used to judge predictive outcomes is tap water. To what extent does availability of tap water explain gender imbalance? In the case of Salem, where there has been positive growth in average child sex ratios, there was a lack of proper tap water in almost all sub-districts in 1991. In 2001, tap water was available across all districts, and by 2011 treated tap water was available all over (Refer to
Figure 4,
Figure 5, and
Figure 6). A similar pattern of availability of tap water is seen in The Nilgiris, and Dharmapuri.
On the other hand, in the case of Ariyalur, where the mean child sex ratio was skewed, the availability of tap water followed the same pattern as in Salem. Therefore, it might not be the best predictor for preferences or causes of child sex ratios. Similar patterns have emerged in the case of medical facilities. Despite a growth in the availability of medical facilities in districts and sub-districts in Tamil Nadu, the average sex ratio emerges in varying densities.
Figure 7 and 8 portray the significant improvement in availability of medical infrastructure across all villages between 1991 and 2001 in Tamil Nadu.
Therefore, the availability of tap water and medical facilities can be seen as conditions that are conducive to achieve equalised child sex ratios, however, they do not influence the sex ratio directly.
Predictive Analysis:
Other factors that could affect gender ratios in early childhood are: literacy rates, worker population, and the population of scheduled castes and scheduled tribes. To understand the effects of these variables on the child sex ratios, a simple Ordinary Least Square (OLS) estimate regression test can be used in the following form:
CSRvst = αvst + βvst + Lvst + Wpvst + Scvst + Stvst + Zvst + μvst,
Where, v, s and t, refer to villages, states, and time. L is the literate population, Wp is the worker population, Sc is scheduled castes, St is scheduled tribes, and Z is a control variable for total village population, access to paved roads, availability of electricity, and μ is the disturbance term.
As per
Table 1, the p-values for all three years are lesser than 0.05, and therefore we can reject the null hypothesis. Literate population and Total Workers have a strong significant effect on Child Sex Ratios in 1991, 2001, and 2011. Scheduled castes and scheduled tribes have a value above 0.05 for all three years and therefore they don’t influence the child sex ratios. R-squared, the measure of the proportion of the variation in the dependent variable that is explained by the independent variables in the model, is highest in 1991. Therefore, the literate population and total workers had a marginally higher effect on child sex ratios in 1991 as opposed to in 2001 or 2011.
The Way Forward: Policy Recommendations
Since the effect of environmental conditions and availability of basic amenities on child sex ratios is indeterminable yet, and there is a positive effect of literate population and worker population on child sex ratios across villages in Tamil Nadu, the way forward is to shape policies at state and national levels to make sure environmental factors are not the only determining factor in restoring the gender balance in early childhood. Along with aiming for equalised gender ratios, it is also imperative to maintain a stable child sex ratio across districts, and ensure proper policies are drafted and implemented to provide access to quality education and employment opportunities to all.
Shaping effective policies at the state and national levels to improve education and employment opportunities would require confidence and consistency of views for accurate drafting, and the implementation must be specific to geographic location, meaning that implementation must take place at a state level, if not at a district level.
The labour market in India is complex, where although the unemployment rate is low, the wages are also extremely low. Along with this, the majority of the worker population is self employed, where they do not have job security and benefits that the formally employed have, and thus they experience income insecurity. (Dev, S.M.) To overcome the heightened vulnerability of the workers and the dominance of the informal sector, trade policies need to be shaped where there needs to be a reduction in taxation on trade between states in India. Additionally, the implementation of the Goods and Services Tax (GST) has reduced the tax autonomy of states because it has centralised various indirect taxes under a single tax framework. (Joumard, I., A. Thomas and H. Morgavi (2017) Drafting policies that will reduce taxation on trade between states, along with allowing state governments to collect taxation on income and revenue would encourage merchants to trade more, leading to higher levels of economic activities, which will create newer jobs in the trade sector, along with encouraging entrepreneurship. Further, since most workers are in self employed sectors, protectionist policies that provide non taxable income to workers straight from the state government would reduce vulnerabilities in the informal economy. Additionally, to increase employment in the formal sector, taxes need to be levied on resources instead of taxing labour. The high levels of tax companies pay on labour discourages them from employing more workers, but a lower tax on labour would lead companies to invest in innovation and hiring more workers, and therefore also spurring economic development. (Raworth, Kate)
The dowry system is a more complex challenge that cannot be solved simply by banning the act, or passing legislation on women being allowed to inherit property. There needs to be a shift in attitude, along with the nature of money itself, since the dowry system is not just a traditional and religious practice but more importantly it is a means of attaining property and increasing savings. The solution is three fold: a) Invest in public marketing for a positive shift in attitudes towards protecting the girl child from female infanticides, b) make income redistributive to reduce income inequalities, c) change the nature of money and who holds wealth. First, investing in public marketing through virtual campaigns where celebrities and politicians promote the importance of protecting the girl child can be immensely effective on a large scale. Other methods of improving awareness is through community engagement initiatives and collaboration with NGOs and the private sector. (Sadh, Ashish et. al.) Secondly, to make income more redistributive, policies need to be shaped to place income ceilings, where after a certain level of income, the rest must be given away. Additionally, changing the nature of money itself, where money cannot be saved in banks forever, but instead after a certain period of time, the money deteriorates and loses some or all of its value. This would incentivise people to invest in innovation and public development, and the focus would shift away from hoarding money. Thirdly, changing the value of GDP itself, from measuring income from all sources to measuring the many sources of wealth- human, social, ecological, cultural, and physical- would change not only attitudes among people, but would lead to higher levels of satisfaction and happiness among the population. But, how do we offset the effect of AI on employment? By taxing technology, and providing base income from the state directly for the jobs that have been lost to technology. Additionally, when it comes to education, public investments must be directed towards quality education, where educational curriculums are enhanced to teach human, social, ecological, and cultural values. (Raworth, Kate)
Conclusion
In conclusion, the findings of this study highlight the complex interplay of socioeconomic factors influencing child sex ratios in Tamil Nadu. While improvements in medical infrastructure and tap water availability create a conducive environment for gender parity, they do not directly affect child sex ratios. Instead, literacy rates and worker population exhibit a significant relationship with these ratios, underscoring the importance of education and employment opportunities in addressing gender imbalances. However, achieving a stable and equalized child sex ratio requires a multifaceted approach that goes into reshaping structural dynamics of the economy.
Policy efforts should focus on improving access to education and employment opportunities while ensuring that economic vulnerabilities in the informal sector are addressed through tax reforms, income redistribution, and worker protection measures. Additionally, tackling deep-rooted socio-cultural issues like the dowry system demands a shift in societal attitudes, income structures, and the very nature of wealth accumulation. Investing in public awareness campaigns, restructuring taxation to favor labour and innovation, and promoting redistributive economic policies can collectively contribute to a more equitable society.
Ultimately, the challenge of equalizing child sex ratios is not just about demographic balancing but about fostering a society that values gender equity at all levels—social, economic, and cultural. By aligning policy interventions with broader systemic reforms, we can create an environment where gender disparities are actively minimized, ensuring a more just and sustainable future for all.
Acknowledgements
This paper could not have been conceptualized and completed without the dedicated, patient, and generous guidance of Prof. Sumit Mishra and Prof. Karthik Rao Cavale from Krea University. I am deeply grateful for their unwavering support, insightful feedback, and encouragement throughout this process. Their expertise not only helped shape the conceptual framework of this research but also provided invaluable guidance as I navigated the complexities of R programming. Their patience and mentorship have been instrumental in refining my approach and strengthening the analytical rigor of this paper.
References
- Deolalikar, Anil B.; Hasan, Rana; Somanathan, Rohini (2009) : Public Goods Access and Juvenile Sex Ratios in Rural India: Evidence from the 1991 and 2001 Village Census Data, ADB Economics Working Paper Series, No. 167, Asian Development Bank (ADB), Manila. Available online: https://hdl.handle.net/11540/1818.
- ARNOLD, F., CHOE, M. K. & ROY, T. K. 1998. Son Preference, the Family-building Process and Child Mortality in India. Population Studies: A Journal of Demography, 52, 301-315.
- Srinivasan, Sharada and Arjun S. Bedi. “Census 2011 and Child Sex Ratios in Tamil Nadu.” Labor: Demographics & Economics of the Family eJournal (2011): n. Pag.
- Diamond-Smith, N.G. (2014). EQUALIZING CHILD SEX RATIOS IN INDIA: UNDERSTANDING THE TRENDS, DISTRIBUTION, COMPOSITION, AND POTENTIAL DRIVERS.
- Dev, S. M. (2018). Labour Market Inequalities in India: Dimensions and Policies. Indian Journal of Human Development, 12(2), 217-235. (Original work published 2018). [CrossRef]
- Joumard, I., A. Thomas and H. Morgavi (2017), “Making income and property taxes more growth-friendly and redistributive in India”, OECD Economics Department Working Papers, No. 1389, OECD Publishing, Paris. [CrossRef]
- Raworth, Kate. Doughnut Economics: Seven Ways to Think like a 21st-Century Economist. Chelsea Green Publishing, 2023.
- Sadh, Ashish, and Payal S Kapoor. “Save the Girl Child Initiatives in India- A Social Marketing Perspective.” IIM Indore, Available online: https://iimidr.ac.in/wp-content/uploads/2019/12/v2012-v4issue3-Save-the-Girl-Child-Initiatives-in-India.pdf.
|
Disclaimer/Publisher’s Note: The statements, opinions and data contained in all publications are solely those of the individual author(s) and contributor(s) and not of MDPI and/or the editor(s). MDPI and/or the editor(s) disclaim responsibility for any injury to people or property resulting from any ideas, methods, instructions or products referred to in the content. |
© 2025 by the author. Licensee MDPI, Basel, Switzerland. This article is an open access article distributed under the terms and conditions of the Creative Commons Attribution (CC BY) license (https://creativecommons.org/licenses/by/4.0/).