Submitted:
27 February 2025
Posted:
28 February 2025
You are already at the latest version
Abstract
Comprehending the dynamics of risk spillover across the value chain is indispensable for effective risk management, especially amid increasing economic and geopolitical uncertainty. This study investigates the mechanics of risk transmission within the value chain of Chinese hospitality industry, employs a (TVP-VAR) model, using daily data from January 2015 to December 2023. The research identifies key sub-sectors, hotel resort and luxury cruise, film and entertainment, mall and supermarket, environmental and facilities services, air freight and logistics, and road transportation, as significant risk transmitters that affect the overall stability of the industry. Conversely, sectors such as restaurant, liquor and wine, leisure services and railway transport are designated as risk receivers. The results offer critical insights for stakeholders, emphasizing the necessity of comprehensive risk management strategies to reduce negative spillover effects, particularly in the context of economic shocks like the COVID-19 pandemic and geopolitical events like the Russia-Ukraine conflict.
Keywords:
1. Introduction
2. Background and Literature Review
3. Research Design and Sample
3.1. Sample
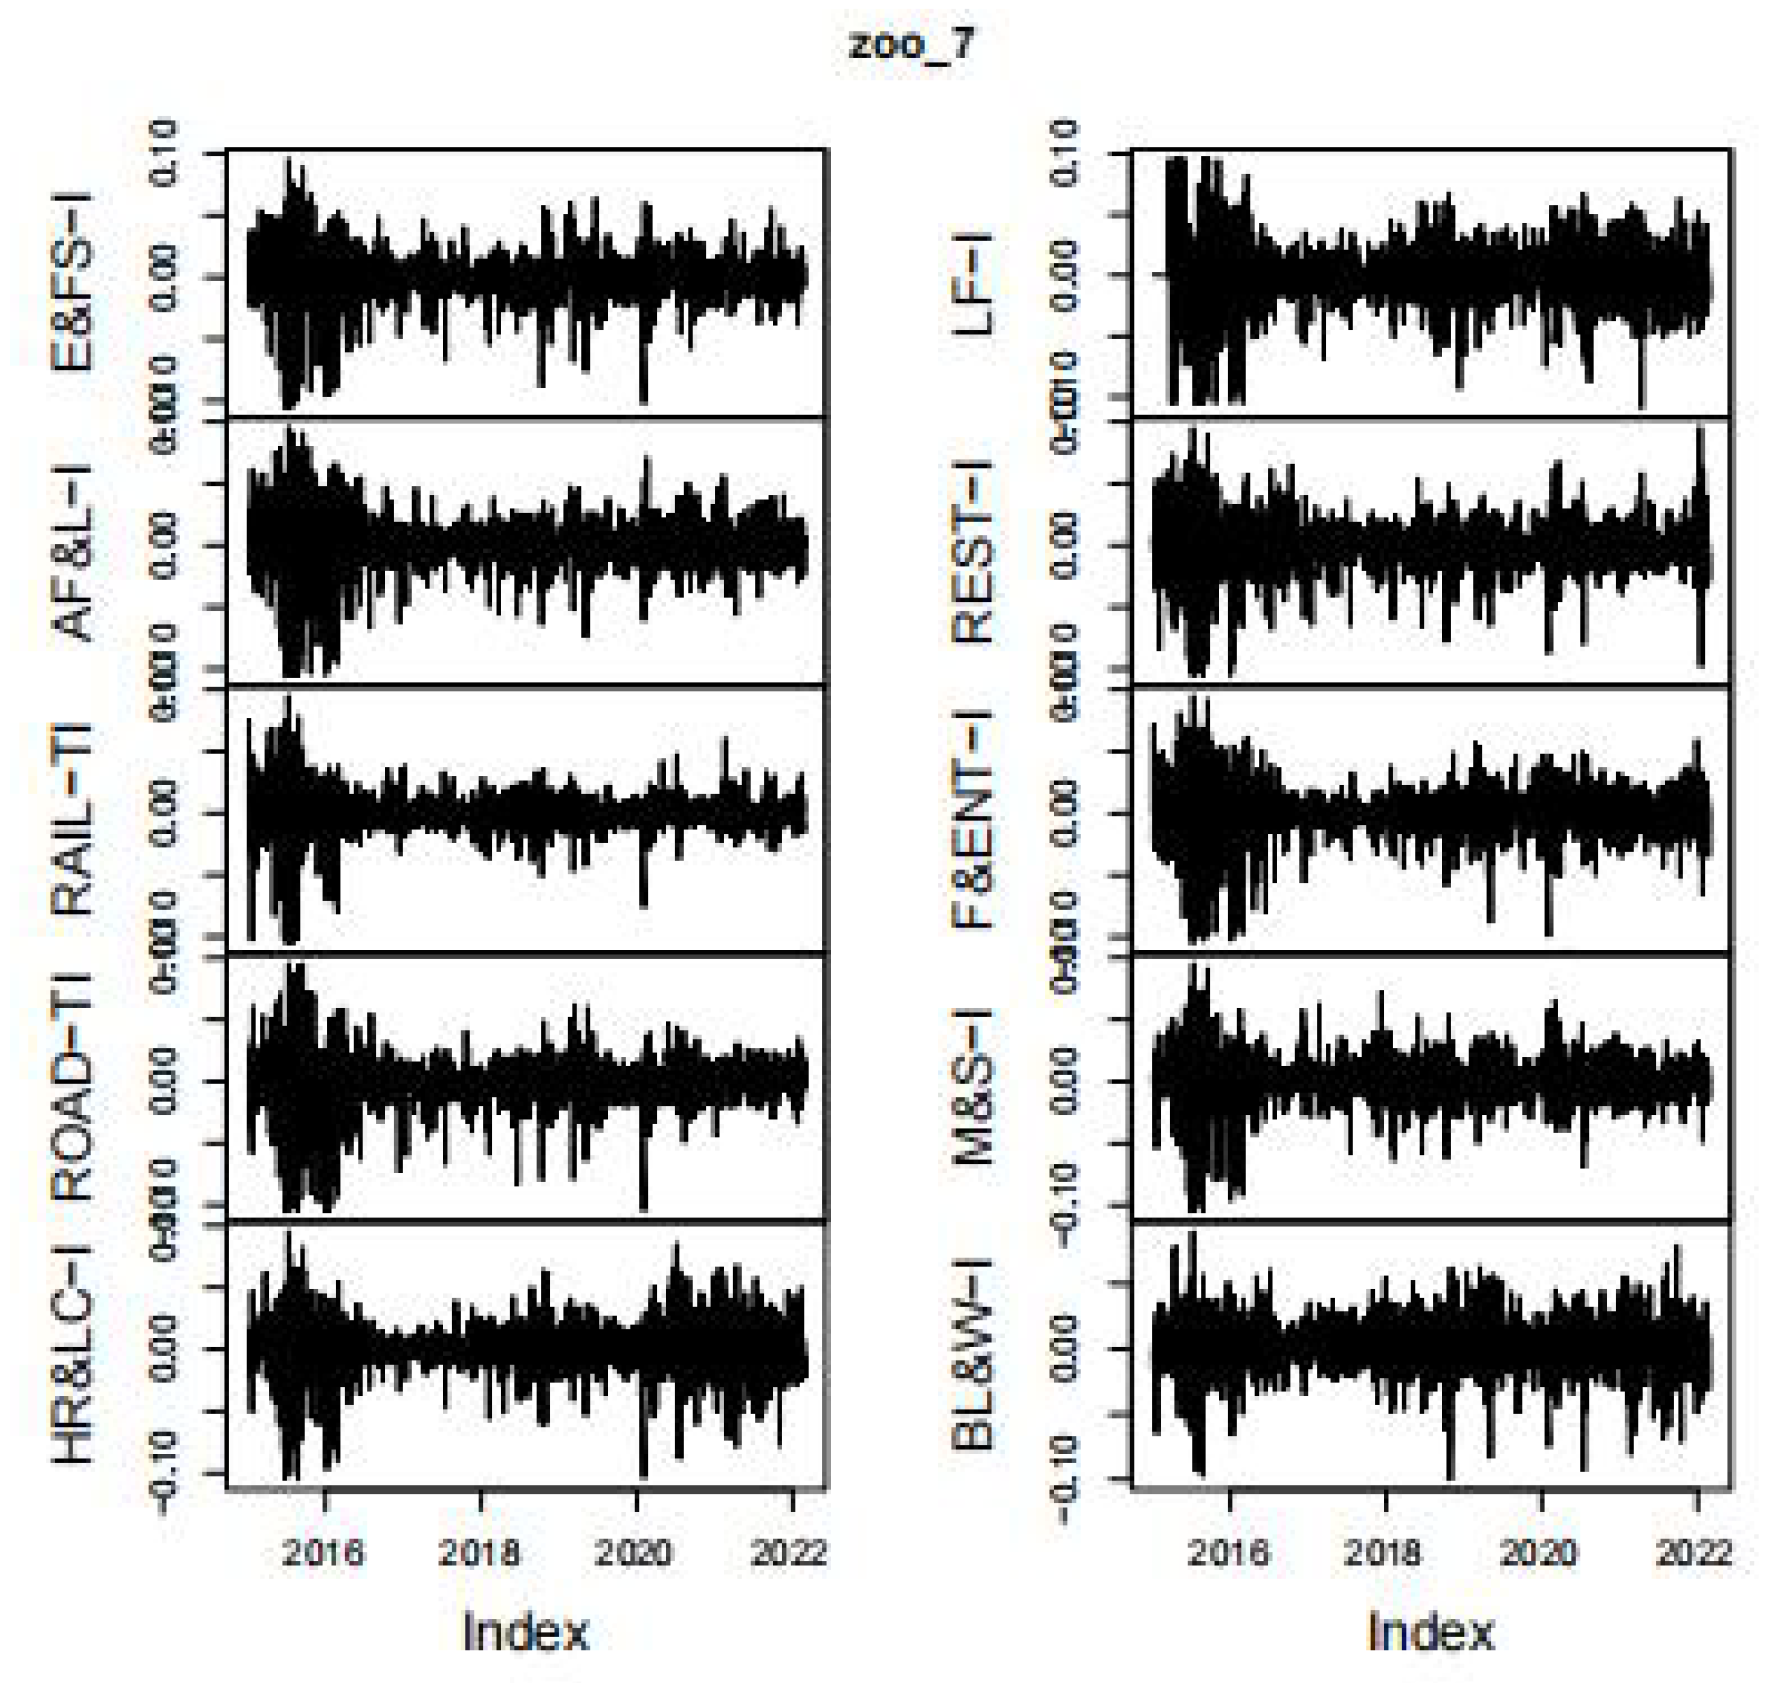
3.2. Descriptive Statistics
3.3. Correlation Analysis
3.4. Research Design and Methodology
- (a)
- These models are not appropriate for estimating time-varying spillovers.
- (b)
- Estimations through these models can be challenging due to convergence concerns [51].
4. Empirical Results and Discussion
4.1. Detail Discussion
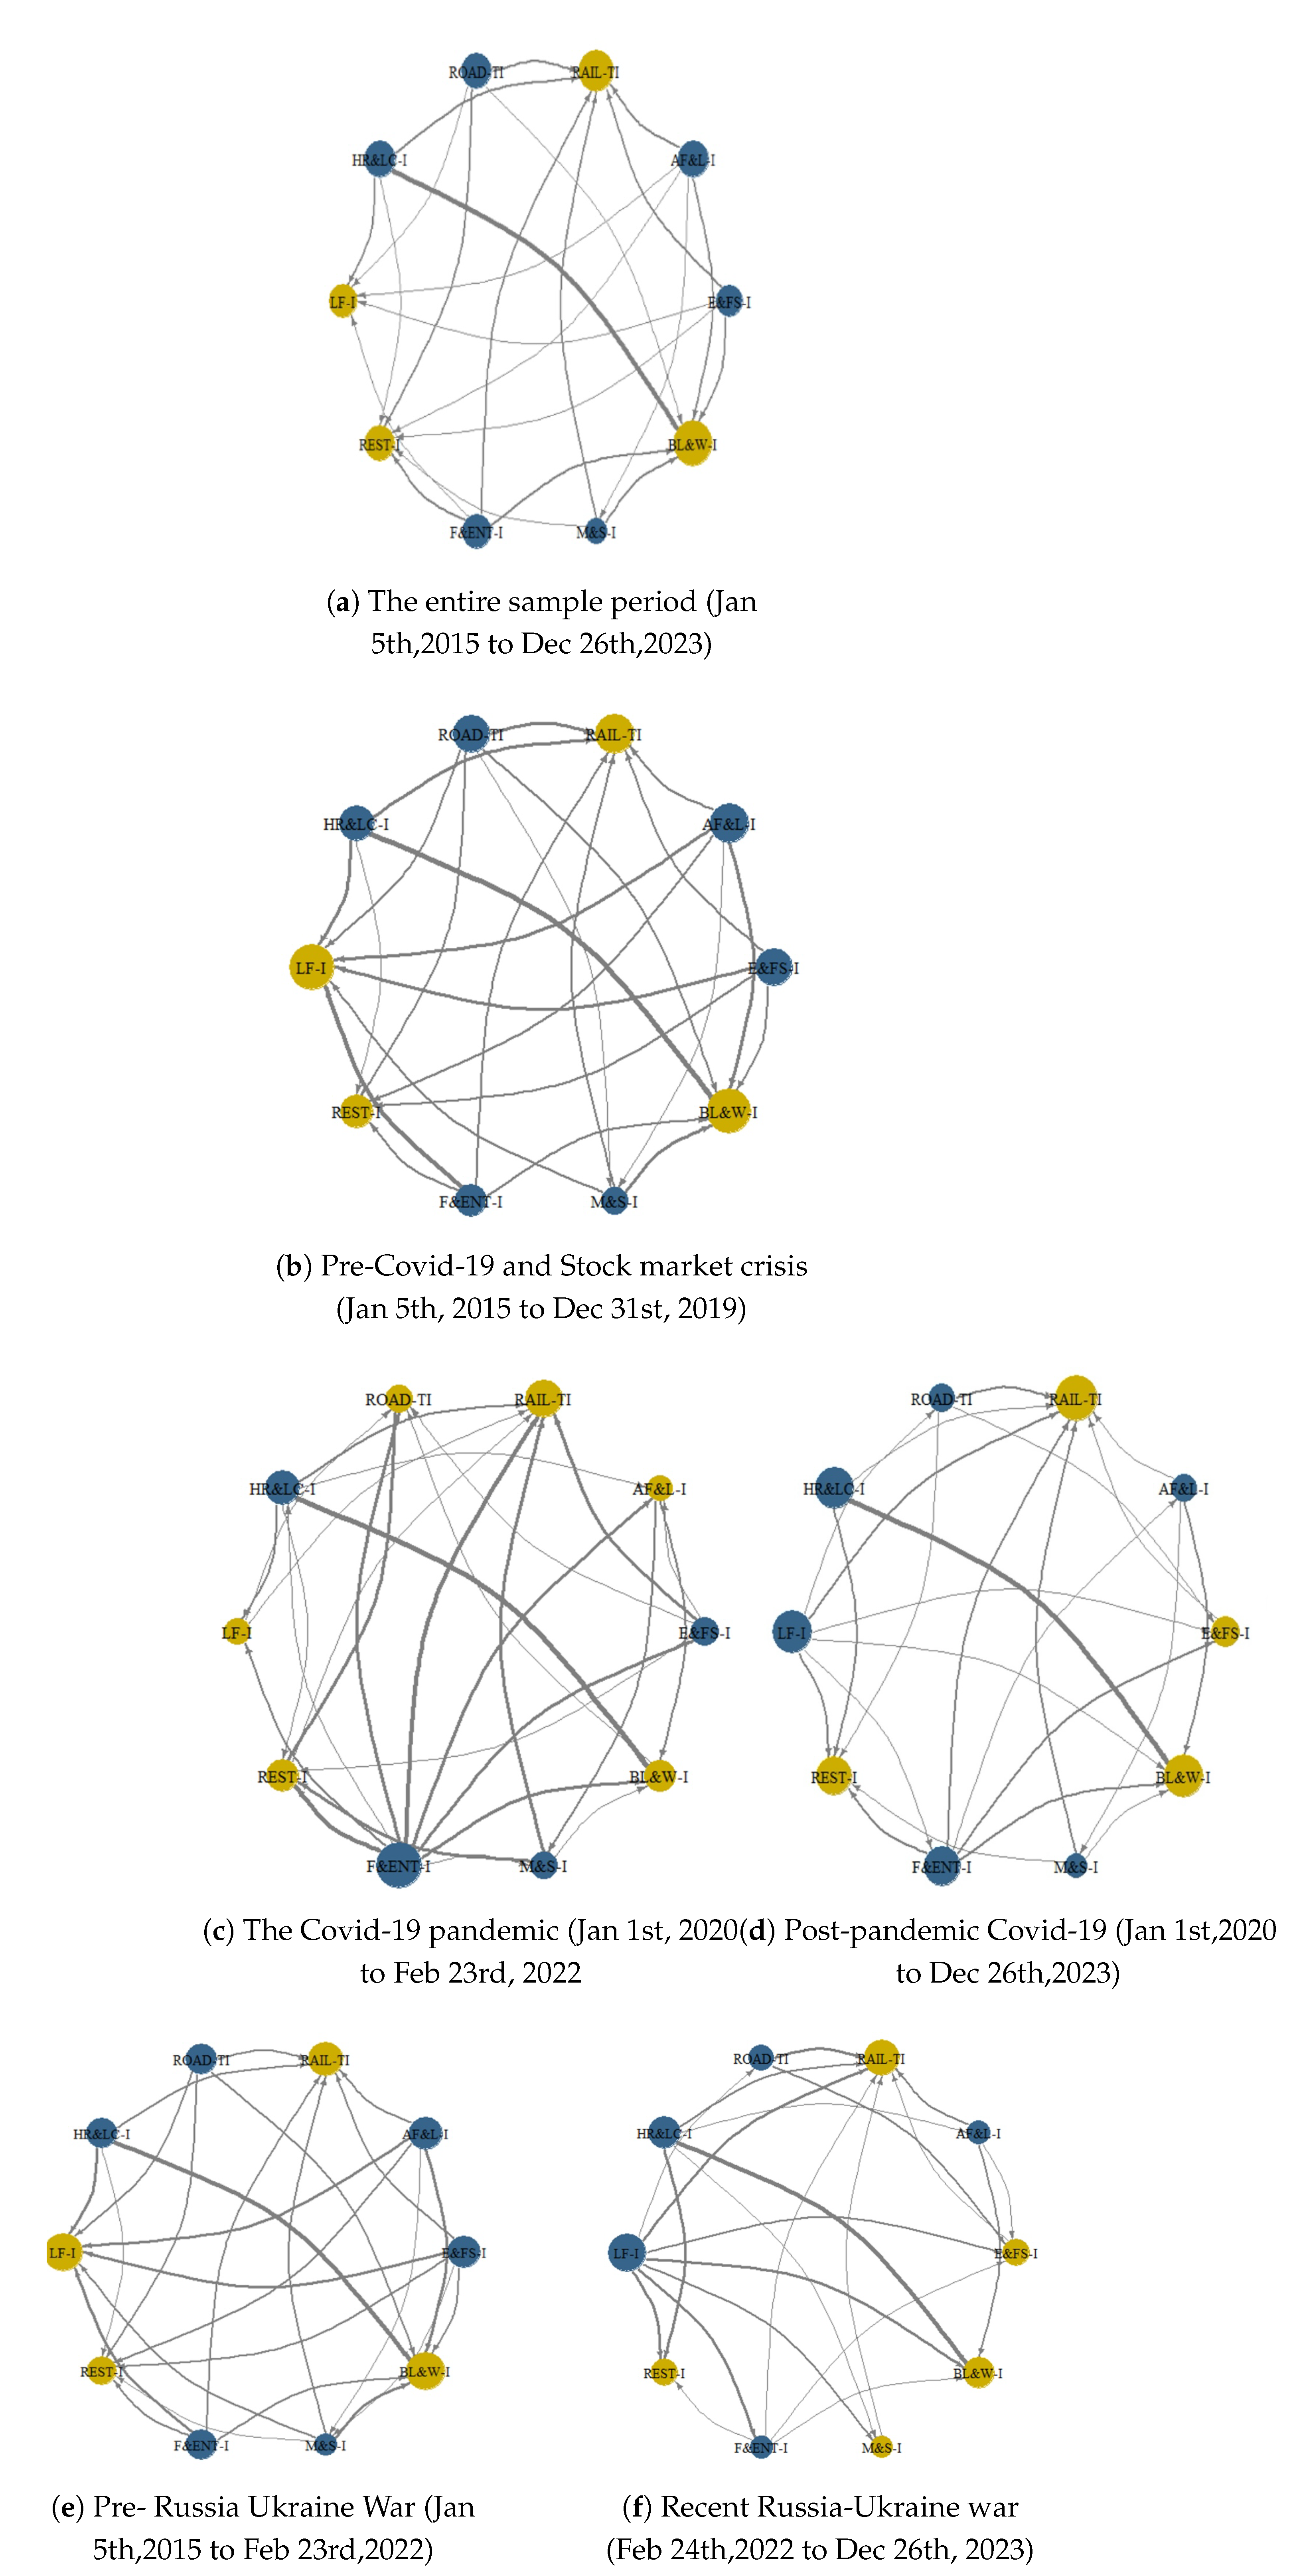
4.2. Network Diagram
- (a)
- The entire sample period (January 05,2015 to December 26,2023);
- (b)
- Pre-Covid-19 and Stock market crisis (January 05, 2015 to December 31, 2019);
- (c)
- The Covid-19 pandemic (January 01, 2020 to February 23, 2022);
- (d)
- Post-pandemic Covid-19 (January 01,2020 to December 26,2023);
- (e)
- Pre- Russia Ukraine War (January 05,2015 to February 23,2022);
- (f)
- Recent Russia-Ukraine war (February 24,2022 to December 26, 2023);
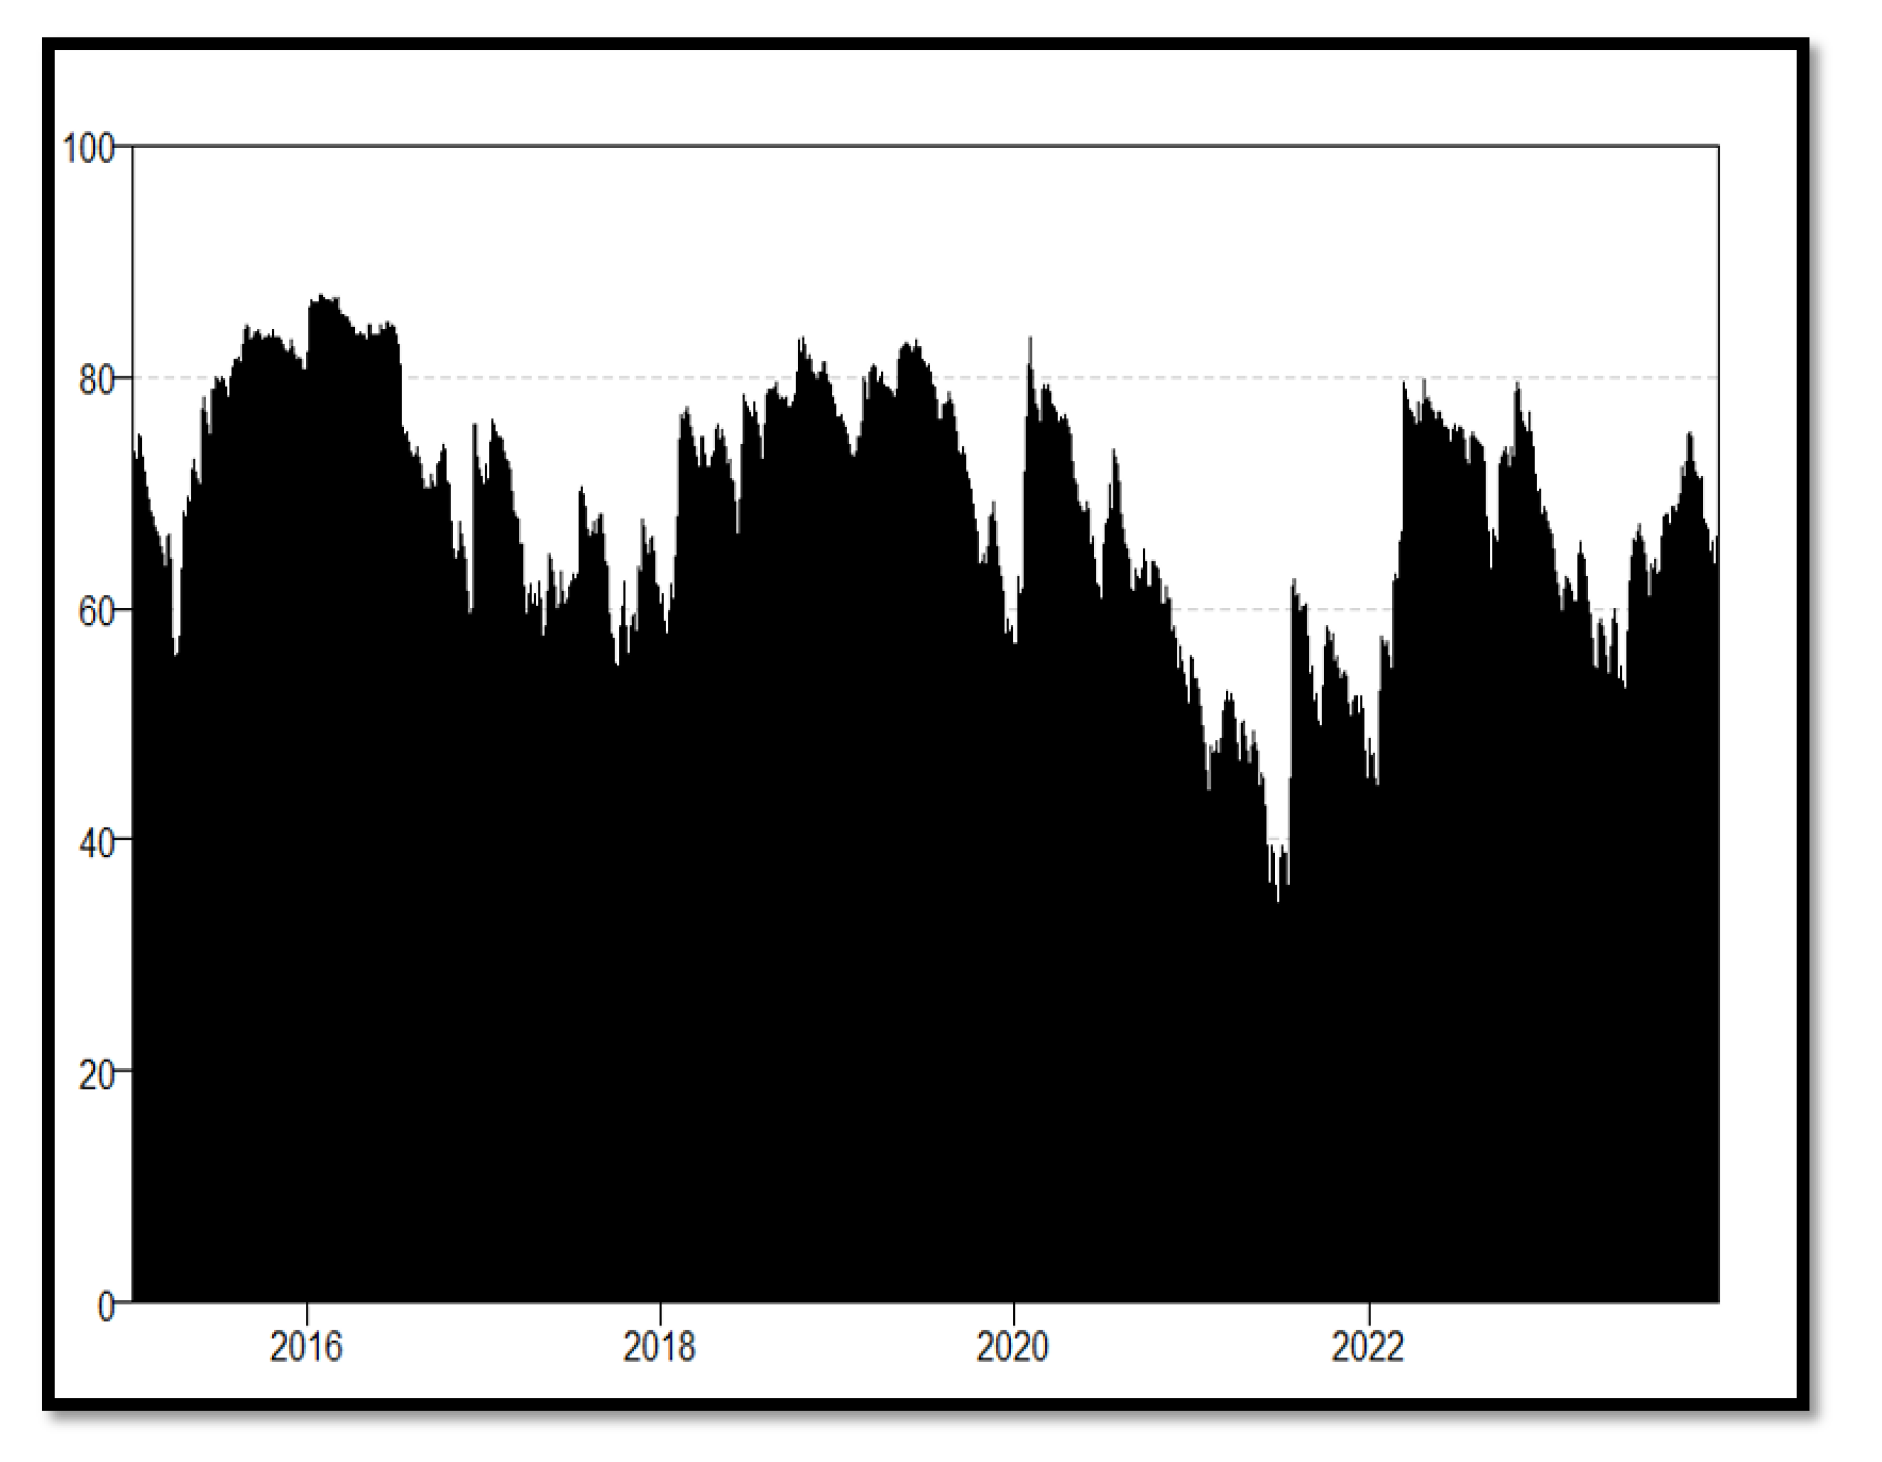
4.3. The concept of Dynamic Total Connectivity
4.4. Time Varying Connectedness
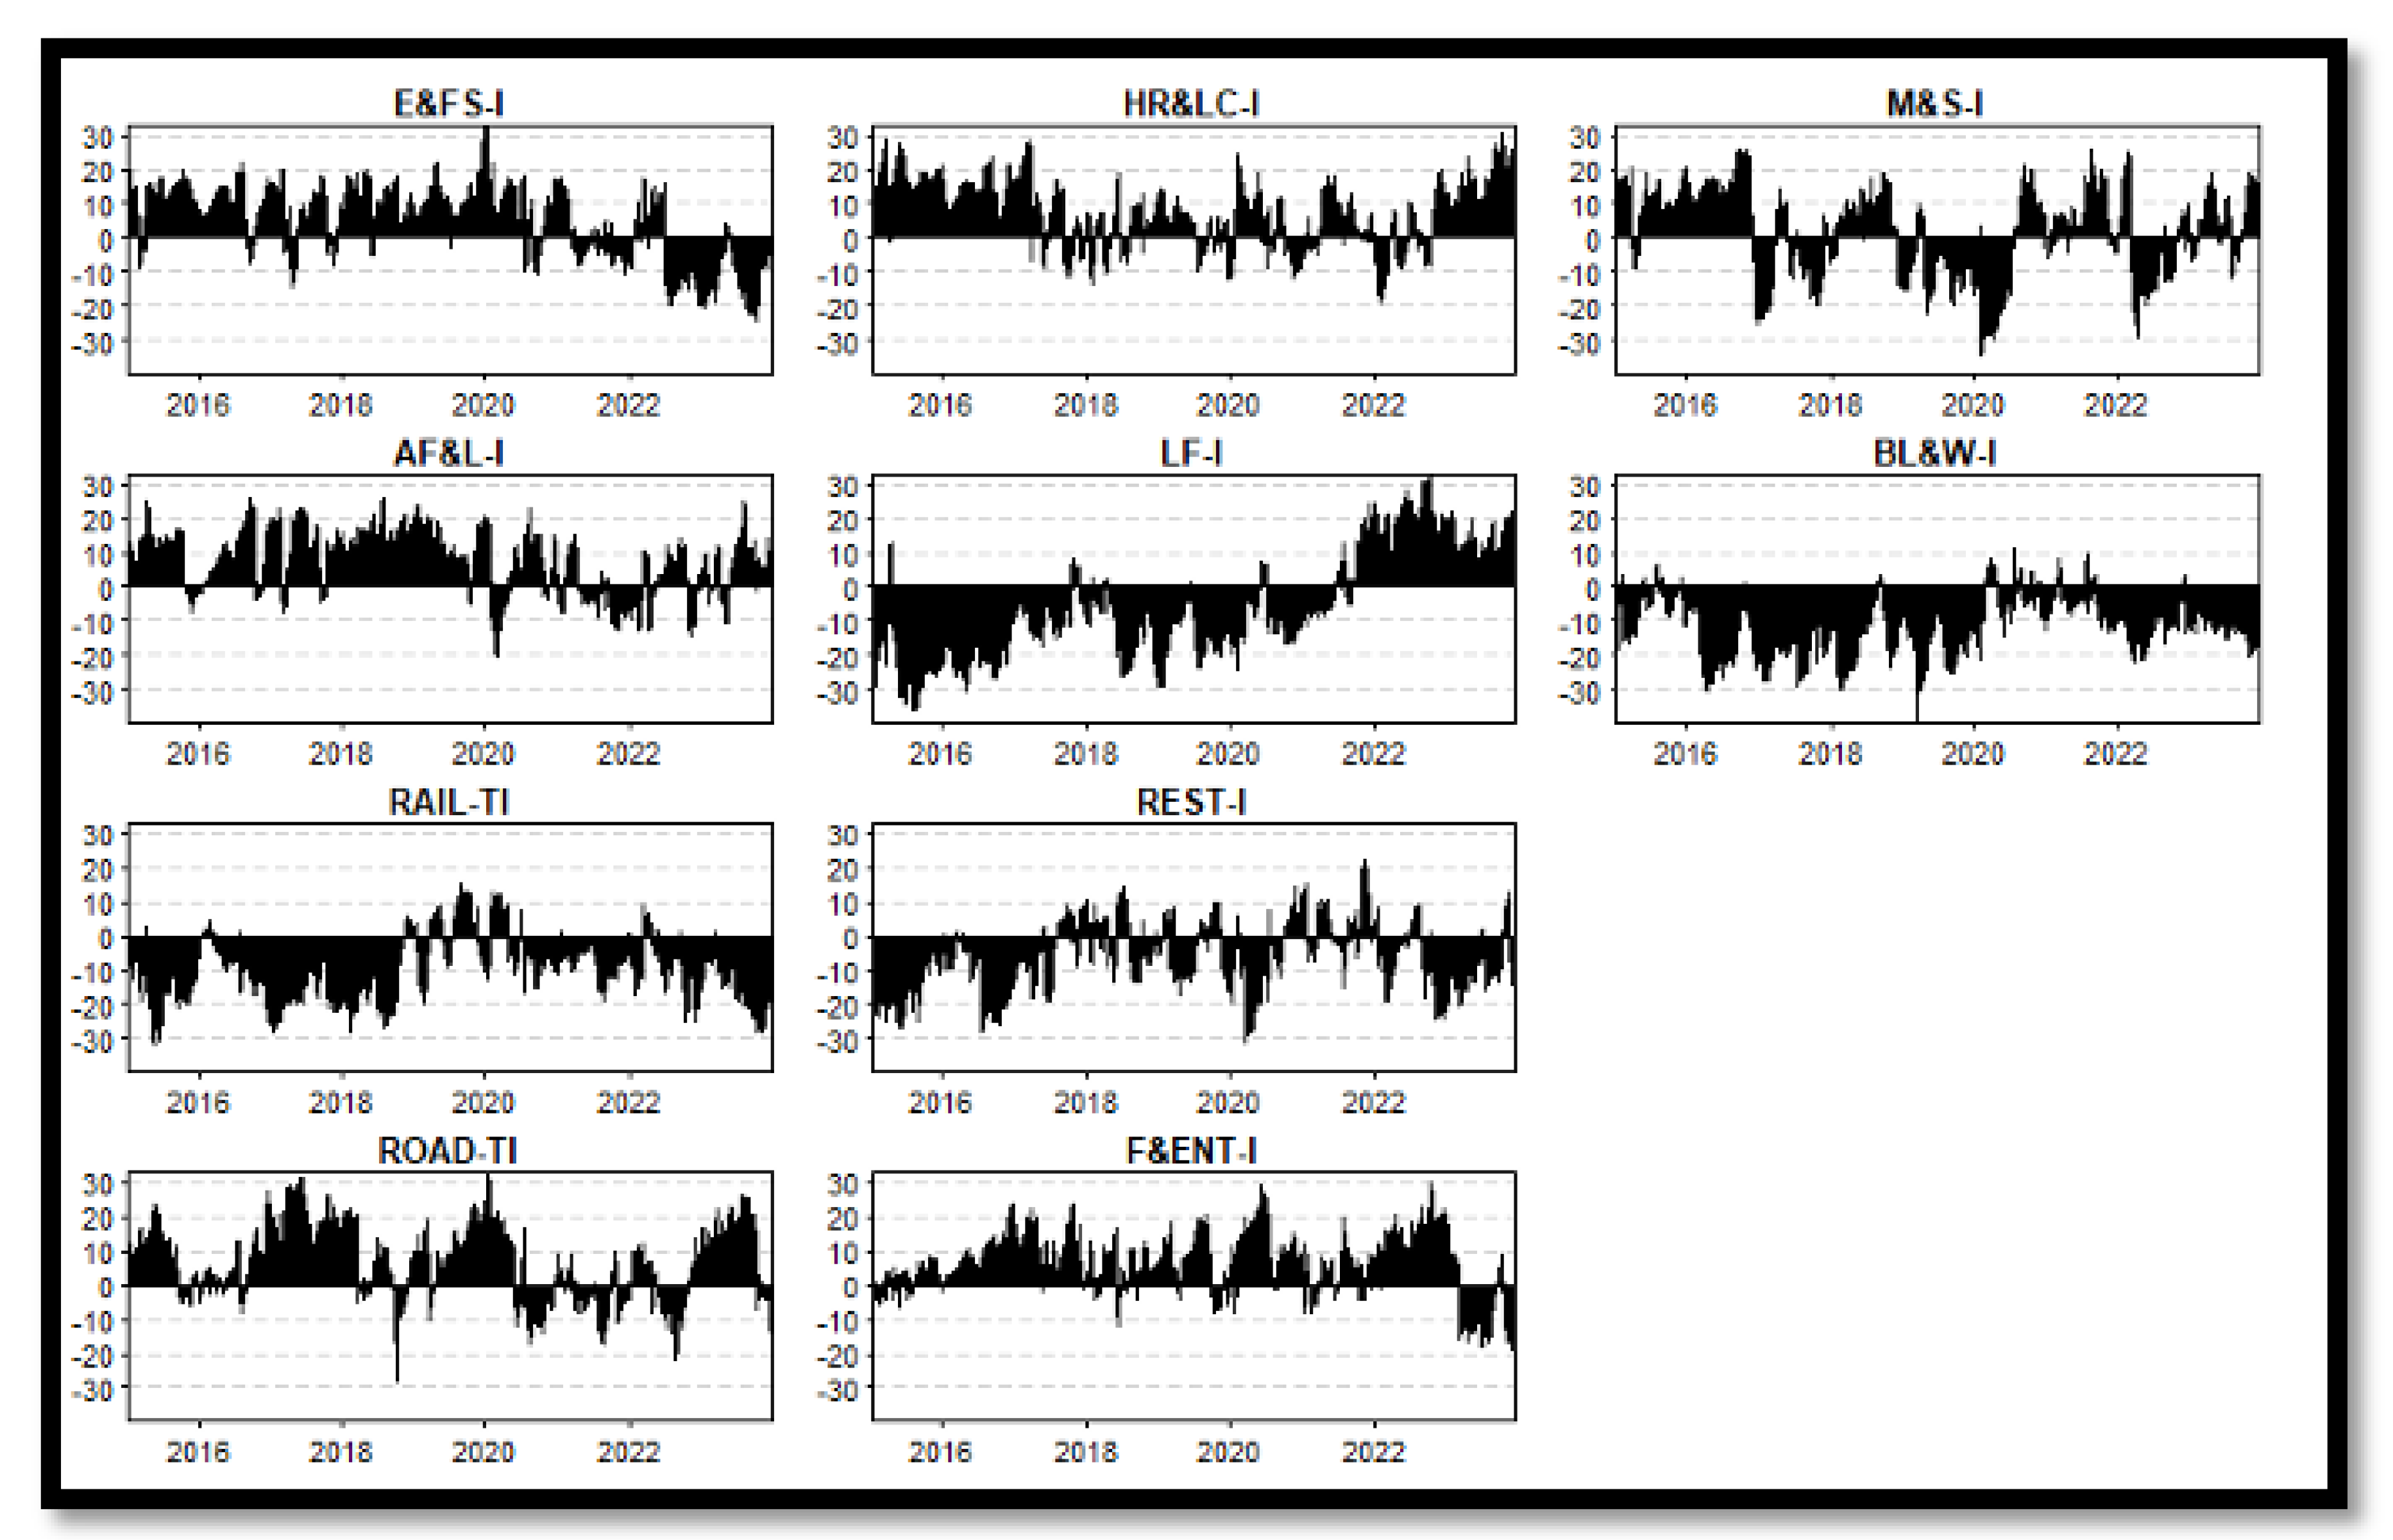
4.5. Directional Connectivity
4.6. Robustness Tests
5. Conclusions
References
- Benoit, S.; Colliard, J.E.; Hurlin, C.; Pérignon, C. Where the risks lie: A survey on systemic risk. Review of Finance 2017, 21, 109–152. [Google Scholar] [CrossRef]
- Diebold, F.X.; Yılmaz, K. On the network topology of variance decompositions: Measuring the connectedness of financial firms. Journal of Econometrics 2014, 182, 119–134. [Google Scholar] [CrossRef]
- Yu, H.; Fang, L.; Sun, W. Forecasting performance of global economic policy uncertainty for volatility of Chinese stock market. Physica A: Statistical Mechanics and its Applications 2018, 505, 931–940. [Google Scholar] [CrossRef]
- Markowitz, H. PORTFOLIO SELECTION. The Journal of Finance 1952, 7, 77–91. [Google Scholar] [CrossRef]
- Barunik, J.; Kocenda, E.; Vacha, L. Asymmetric connectedness on the U.S. stock market: Bad and good volatility spillovers. Journal of Financial Markets 2016, 27, 55–78. [Google Scholar] [CrossRef]
- Chen, W.; Hou, X.; Jiang, M.; Jiang, C. Identifying systemically important financial institutions in complex network: A case study of Chinese stock market. Emerging Markets Review 2022, 50, 100836. [Google Scholar] [CrossRef]
- Barunik, J.; Krehlik, T. Measuring the Frequency Dynamics of Financial Connectedness and Systemic Risk. Journal of Financial Econometrics 2018, 16, 271–296. [Google Scholar] [CrossRef]
- Gabauer, D.; Gupta, R. On the transmission mechanism of country-specific and international economic uncertainty spillovers: Evidence from a TVP-VAR connectedness decomposition approach. Economics Letters 2018, 171, 63–71. [Google Scholar] [CrossRef]
- Lin, A.J.; Chang, H.Y.; Hsiao, J.L. Does the Baltic Dry Index drive volatility spillovers in the commodities, currency, or stock markets? Transportation Research Part E: Logistics and Transportation Review 2019, 127, 265–283. [Google Scholar] [CrossRef]
- Hadi, D.M.; Naeem, M.A.; Karim, S. The exposure of the US tourism subsector stocks to global volatility and uncertainty factors. Current Issues in Tourism 2023, 26, 603–616. [Google Scholar] [CrossRef]
- Hadi, D.M.; Naeem, M.A.; Karim, S. Impact of COVID-19 on the connectedness across global hospitality stocks. International journal of hospitality management 2022, 104, 103243. [Google Scholar] [CrossRef] [PubMed]
- Aharon, D.Y.; Demir, E.; Ersan, O. Where do tourism tokens travel to and from? Current Issues in Tourism 2023, 27, 2561–2583. [Google Scholar] [CrossRef]
- Carter, D.; Mazumder, S.; Simkins, B.; Sisneros, E. The stock price reaction of the COVID-19 pandemic on the airline, hotel, and tourism industries. Finance Research Letters 2022, 44, 102047. [Google Scholar] [CrossRef] [PubMed]
- El Rifai, O.; Ozatac, N.; Taspinar, N. Volatility spillovers among major tourism stock indices during Covid 19 pandemic. Current Issues in Tourism 2022, 26, 2075–2082. [Google Scholar] [CrossRef]
- Kumar, D. European travel and leisure sector and uncertainties: A risk spillover analysis. Tourism Economics 2023, 29, 48–67. [Google Scholar] [CrossRef]
- Shahzad, S.J.H.; Hoang, T.H.V.; Bouri, E. From pandemic to systemic risk: contagion in the US tourism sector. Current Issues in Tourism 2022, 25, 34–40. [Google Scholar] [CrossRef]
- Hadi, D.M. Travel and leisure stocks exposure to exchange rates. Annals of Tourism Research Empirical Insights 2023, 4, 100111. [Google Scholar] [CrossRef]
- Abdelsalam, O.; Aysan, A.F.; Cepni, O.; Disli, M. The spillover effects of the COVID-19 pandemic: Which subsectors of tourism have been affected more? Tourism Economics 2023, 29, 559–567. [Google Scholar] [CrossRef]
- Hu, Y.; Lang, C.; Corbet, S.; Wang, J. The impact of COVID 19 on the volatility connectedness of the Chinese tourism sector. Research in International Business and Finance 2024, 68, 102192. [Google Scholar] [CrossRef]
- Antonakakis, N.; Chatziantoniou, I.; Gabauer, D. Refined Measures of Dynamic Connectedness based on Time-Varying Parameter Vector Autoregressions. Journal of Risk and Financial Management 2020, 13, 84. [Google Scholar] [CrossRef]
- Goyal, K.; Kumar, S. Financial literacy: A systematic review and bibliometric analysis. International Journal of Consumer Studies 2021, 45, 80–105. [Google Scholar] [CrossRef]
- Kaufman, G.G.; Scott, K.E. What is systemic risk, and do bank regulators retard or contribute to it? The independent review 2003, 7, 371–391. [Google Scholar]
- Lin, S.L. Conditional risk and return in Asian emerging markets: evidence from the banking sector. Applied Economics 2008, 40, 3173–3183. [Google Scholar] [CrossRef]
- Avesani, R.; Garcia Pascual, A.I. A New Risk Indicator and Stress Testing Tool: A Multifactor Nth-to-Default CDS Basket. SSRN Electronic Journal 2006. [Google Scholar] [CrossRef]
- Adrian, T.; Brunnermeier, M. CoVaR: Measuring systemic risk contribution. In Proceedings of the Proc. 3rd Unicredit Group conf. on banking and finance (Rome, 2009., 17–18 Dec. 2009). URL: https://www. unicreditgroup. eu/content/dam/unicreditgroup/documents/inc/press-and-media/Session4_Adrian. pdf (accessed 11.06. 2017). [Google Scholar]
- Smaga, P. The concept of systemic risk. Systemic Risk Centre Special Paper 2014. [Google Scholar]
- Primiceri, G.E. Time Varying Structural Vector Autoregressions and Monetary Policy. The Review of Economic Studies 2005, 72, 821–852. [Google Scholar] [CrossRef]
- Ratcliffe, A.; Taylor, K. Who cares about stock market booms and busts? Evidence from data on mental health. Oxford Economic Papers 2015, 67, 826–845. [Google Scholar] [CrossRef]
- Hartwell, C.A. The impact of institutional volatility on financial volatility in transition economies. Journal of Comparative Economics 2018, 46, 598–615. [Google Scholar] [CrossRef]
- Diebold, F.X.; Yilmaz, K. Measuring financial asset return and volatility spillovers, with application to global equity markets. The Economic Journal 2009, 119, 158–171. [Google Scholar] [CrossRef]
- Goyal, P.; Soni, P. Stock markets volatility during crises periods: a bibliometric analysis. Qualitative Research in Financial Markets 2024. [Google Scholar] [CrossRef]
- Brida, J.G.; Cortes-Jimenez, I.; Pulina, M. Has the tourism-led growth hypothesis been validated? A literature review. Current Issues in Tourism 2016, 19, 394–430. [Google Scholar] [CrossRef]
- Nguyen, C.P.; Schinckus, C.; Su, T.D. Economic policy uncertainty and demand for international tourism: An empirical study. Tourism Economics 2020, 26, 1415–1430. [Google Scholar] [CrossRef]
- Chen, M.H.; Jang, S.S.; Kim, W.G. The impact of the SARS outbreak on Taiwanese hotel stock performance: An event-study approach. International Journal of Hospitality Management 2007, 26, 200–212. [Google Scholar] [CrossRef]
- Seraphin, H. COVID 19: an opportunity to review existing grounded theories in event studies. Journal of Convention amp; Event Tourism 2020, 22, 3–35. [Google Scholar] [CrossRef]
- Reichel, A.; Fuchs, G.; Uriely, N. Perceived Risk and the Non Institutionalized Tourist Role: The Case of Israeli Student Ex Backpackers. Journal of Travel Research 2007, 46, 217–226. [Google Scholar] [CrossRef]
- Akhtaruzzaman, M.; Boubaker, S.; Sensoy, A. Financial contagion during COVID–19 crisis. Finance Research Letters 2021, 38, 101604. [Google Scholar] [CrossRef]
- Albulescu, C.T. COVID-19 and the United States financial markets’ volatility. Finance Research Letters 2021, 38, 101699. [Google Scholar] [CrossRef] [PubMed]
- Wen, J.; Kozak, M.; Yang, S.; Liu, F. COVID-19: potential effects on Chinese citizens’ lifestyle and travel. Tourism Review 2021, 76, 74–87. [Google Scholar] [CrossRef]
- Gössling, S.; Higham, J. The low-carbon imperative: Destination management under urgent climate change. Journal of Travel Research 2021, 60, 1167–1179. [Google Scholar] [CrossRef]
- Tsionas, M.G. COVID-19 and gradual adjustment in the tourism, hospitality, and related industries. Tourism Economics 2021, 27, 1828–1832. [Google Scholar] [CrossRef]
- Dolnicar, S.; Zare, S. COVID19 and Airbnb Disrupting the Disruptor. Annals of Tourism Research 2020, 83, 102961. [Google Scholar] [CrossRef]
- Najaf, K.; Chin, A. The impact of the China stock market on global financial markets during COVID 19. International Journal of Public Sector Performance Management 2024, 13, 100–114. [Google Scholar] [CrossRef]
- Abbas, J.; Mubeen, R.; Iorember, P.T.; Raza, S.; Mamirkulova, G. Exploring the impact of COVID-19 on tourism: transformational potential and implications for a sustainable recovery of the travel and leisure industry. Current Research in Behavioral Sciences 2021, 2, 100033. [Google Scholar] [CrossRef]
- D AGOSTINO, R.B. Transformation to normality of the null distribution of g1. Biometrika 1970, 57, 679–681. [Google Scholar] [CrossRef]
- Anscombe, F.J.; Glynn, W.J. Distribution of the Kurtosis Statistic b 2 for Normal Samples. Biometrika 1983, 70, 227. [Google Scholar] [CrossRef]
- Jarque, C.M.; Bera, A.K. Efficient tests for normality, homoscedasticity and serial independence of regression residuals. Economics Letters 1980, 6, 255–259. [Google Scholar] [CrossRef]
- Elliott, G.; Rothenberg, T.J.; Stock, J.H. Efficient Tests for an Autoregressive Unit Root. Econometrica 1996, 64, 813. [Google Scholar] [CrossRef]
- Fisher, T.J.; Gallagher, C.M. New Weighted Portmanteau Statistics for Time Series Goodness of Fit Testing. Journal of the American Statistical Association 2012, 107, 777–787. [Google Scholar] [CrossRef]
- Koop, G.; Korobilis, D. A new index of financial conditions. European Economic Review 2014, 71, 101–116. [Google Scholar] [CrossRef]
- Arouri, M.E.H.; Jouini, J.; Nguyen, D.K. On the impacts of oil price fluctuations on European equity markets: Volatility spillover and hedging effectiveness. Energy Economics 2012, 34, 611–617. [Google Scholar] [CrossRef]
- Antonakakis, N.; Cunado, J.; Filis, G.; Gabauer, D.; Perez de Gracia, F. Oil volatility, oil and gas firms and portfolio diversification. Energy Economics 2018, 70, 499–515. [Google Scholar] [CrossRef]
- Yousaf, I.; Yarovaya, L. Herding behavior in conventional cryptocurrency market, non fungible tokens, and DeFi assets. Finance Research Letters 2022, 50, 103299. [Google Scholar] [CrossRef]
- Koop, G.; Pesaran, M.; Potter, S.M. Impulse response analysis in nonlinear multivariate models. Journal of Econometrics 1996, 74, 119–147. [Google Scholar] [CrossRef]
- Pesaran, H.; Shin, Y. Generalized impulse response analysis in linear multivariate models. Economics Letters 1998, 58, 17–29. [Google Scholar] [CrossRef]
- Gil-Alana, L.A.; Poza, C. The impact of COVID-19 on the Spanish tourism sector. Tourism Economics 2022, 28, 646–653. [Google Scholar] [CrossRef]
- Diebold, F.X.; Yilmaz, K. Better to give than to receive: Predictive directional measurement of volatility spillovers. International Journal of Forecasting 2012, 28, 57–66. [Google Scholar] [CrossRef]

| Sr.No | Name | Abbreviation |
|---|---|---|
| 1 | Environmental and Facilities Services Industry Index | E&FS-I |
| 2 | Air Freight and Logistics Industry Index | AF&L-I |
| 3 | Railway Transport Industry Index | RAIL-TI |
| 4 | Road Transportation Industry Index | ROAD-TI |
| 5 | Hotel Resort and Luxury Cruise Industry Index | HR&LC-I |
| 6 | Leisure Facilities Industry Index | LF-I |
| 7 | Restaurant Industry Index | REST-I |
| 8 | Film and Entertainment Industry Index | F&ENT-I |
| 9 | Mall and Supermarket Industry Index | M&S-I |
| 10 | Baijiu Liquor and Wine Industry Index | BL&W-I |
| E&FS-I | AF&L-I | RAIL-TI | ROAD-TI | HR&LC-I | LF-I | REST-I | F&ENT-I | M&S-I | BL&W-I | |
|---|---|---|---|---|---|---|---|---|---|---|
| Mean | 0 | 0 | 0 | 0 | 0 | 0 | 0 | 0 | 0 | 0.001 ** |
| 0.447 | 0.847 | 0.576 | 0.894 | 0.674 | -0.82 | 0.929 | 0.701 | 0.832 | 0.047 | |
| Variance | 0.000 *** |
0.000 *** |
0.000 *** |
0.000 *** |
0.000 *** |
0.001 *** |
0.001 *** |
0.001 *** |
0.000 *** |
0.000 *** |
| skewness | 0.764 *** |
0.516 *** |
0.760 *** |
0.762 *** |
0.305 *** |
0.012 *** |
0.278 *** |
0.417 *** |
0.504 *** |
0.250 *** |
| 0 | 0 | 0 | 0 | 0 | 0.811 | 0 | 0 | 0 | 0 | |
| kurtosis | 5.933 *** |
5.057 *** |
9.035 *** |
6.211 *** |
3.368 *** |
3.719 *** |
3.080 *** |
3.442 *** |
5.333 *** |
2.431 *** |
| 0 | 0 | 0 | 0 | 0 | 0 | 0 | 0 | 0 | 0 | |
| JB | 3418.549 *** |
2426.014 *** |
7645.428 *** |
3725.244 *** |
1067.003 *** |
1259.770 *** |
891.987 *** |
1142.351 *** |
2683.589 *** |
561.230 *** |
| 0 | 0 | 0 | 0 | 0 | 0 | 0 | 0 | 0 | 0 | |
| ERS | 19.617 *** |
18.987 *** |
22.871 *** |
18.358 *** |
20.120 *** |
20.269 *** |
20.072 *** |
20.002 *** |
20.061 *** |
20.939 *** |
| 0 | 0 | 0 | 0 | 0 | 0 | 0 | 0 | 0 | 0 | |
| Q(20) | 62.369 *** |
90.460 *** |
55.559 *** |
89.541 *** |
35.205 *** |
12.256 | 49.497 *** |
52.847 *** |
40.098 *** |
14.534 *** |
| 0 | 0 | 0 | 0 | 0 | 0.288 | 0 | 0 | 0 | 0.142 | |
| (20) | 1958.242 *** |
2993.411 *** |
1805.277 *** |
3637.350 *** |
1312.271 *** |
1452.744 *** |
1113.669 *** |
1890.041 *** |
2262.129 *** |
250.180 *** |
| 0 | 0 | 0 | 0 | 0 | 0 | 0 | 0 | 0 | 0 |
| Kendall | E&FS-I | AF&L-I | RAIL-TI | ROAD-TI | HR&LC-I | LF-I | REST-I | F&ENT-I | M&S-I | BL&W-I |
|---|---|---|---|---|---|---|---|---|---|---|
| E&FS-I | 1.000 *** |
0.465 *** |
0.319 *** |
0.472 *** |
0.342 *** |
0.318 *** |
0.332 *** |
0.466 *** |
0.401 *** |
0.224 *** |
| AF&L-I | 0.465 *** |
1.000 *** |
0.311 *** |
0.449 *** |
0.416 *** |
0.318 *** |
0.325 *** |
0.442 *** |
0.421 *** |
0.308 *** |
| RAIL-TI | 0.319 *** |
0.311 *** |
1.000 *** |
0.339 *** |
0.318 *** |
0.243 *** |
0.259 *** |
0.299 *** |
0.332 *** |
0.281 *** |
| ROAD-TI | 0.472 *** |
0.449 *** |
0.339 *** |
1.000 *** |
0.364 *** |
0.304 *** |
0.369 *** |
0.415 *** |
0.430 *** |
0.234 *** |
| HR&LC-I | 0.342 *** |
0.416 *** |
0.318 *** |
0.364 *** |
1.000 *** |
0.367 *** |
0.355 *** |
0.390 *** |
0.391 *** |
0.439 *** |
| LF-I | 0.318 *** |
0.318 *** |
0.243 *** |
0.304 *** |
0.367 *** |
1.000 *** |
0.297 *** |
0.396 *** |
0.305 *** |
0.237 *** |
| REST-I | 0.332 *** |
0.325 *** |
0.259 *** |
0.369 *** |
0.355 *** |
0.297 *** |
1.000 *** |
0.362 *** |
0.351 *** |
0.226 *** |
| F&ENT-I | 0.466 *** |
0.442 *** |
0.299 *** |
0.415 *** |
0.390 *** |
0.396 *** |
0.362 *** |
1.000 *** |
0.401 *** |
0.260 *** |
| M&S-I | 0.401 *** |
0.421 *** |
0.332 *** |
0.430 *** |
0.391 *** |
0.305 *** |
0.351 *** |
0.401 *** |
1.000 *** |
0.303 *** |
| BL&W-I | 0.224 *** |
0.308 *** |
0.281 *** |
0.234 *** |
0.439 *** |
0.237 *** |
0.226 *** |
0.260 *** |
0.303 *** |
1.000 *** |
| E&FS-I | AF&L-I | RAIL-TI | ROAD-TI | HR&LC-I | LF-I | REST-I | F&ENT-I | M&S-I | BL&W-I | FROM | |
|---|---|---|---|---|---|---|---|---|---|---|---|
| E&FS-I | 29.4 | 10.22 | 6.25 | 11.62 | 6.92 | 6.39 | 6.53 | 10.54 | 8.17 | 3.95 | 70.6 |
| AF&L-I | 9.97 | 28.37 | 5.44 | 10.27 | 9.11 | 5.94 | 6.11 | 9.76 | 8.7 | 6.33 | 71.63 |
| RAIL-TI | 7.72 | 6.94 | 37.93 | 8.33 | 7.82 | 5.3 | 5.66 | 6.68 | 7.57 | 6.06 | 62.07 |
| ROAD-TI | 11.28 | 10.31 | 6.55 | 28.21 | 7.18 | 6.45 | 7.69 | 9.31 | 8.94 | 4.09 | 71.79 |
| HR&LC-I | 6.97 | 9.21 | 6.21 | 7.22 | 28.31 | 8.41 | 7.18 | 8.06 | 8.03 | 10.4 | 71.69 |
| LF-I | 7.39 | 7.1 | 5.1 | 7.31 | 9.64 | 34.95 | 6.85 | 10.24 | 6.64 | 4.79 | 65.05 |
| REST-I | 7.65 | 7.29 | 5.28 | 9.13 | 8.32 | 6.95 | 33.77 | 8.81 | 8.34 | 4.46 | 66.23 |
| F&ENT-I | 10.34 | 9.89 | 5.38 | 9.35 | 7.93 | 9.03 | 7.52 | 27.73 | 8.19 | 4.63 | 72.27 |
| M&S-I | 8.57 | 9.62 | 6.28 | 9.6 | 8.46 | 5.92 | 7.5 | 8.74 | 29.73 | 5.57 | 70.27 |
| BL&W-I | 5.18 | 8.15 | 6.11 | 5.28 | 13.44 | 5.13 | 4.96 | 5.98 | 7.09 | 38.69 | 61.31 |
| TO | 75.06 | 78.72 | 52.62 | 78.12 | 78.82 | 59.52 | 59.99 | 78.12 | 71.67 | 50.27 | 682.91 |
| Inc.Own | 104.46 | 107.09 | 90.55 | 106.32 | 107.14 | 94.47 | 93.76 | 105.86 | 101.39 | 88.96 | cTCI/TCI |
| NET | 4.46 | 7.09 | -9.45 | 6.32 | 7.14 | -5.53 | -6.24 | 5.86 | 1.39 | -11.04 | 75.88/68.29 |
| NPT | 6 | 9 | 1 | 8 | 5 | 3 | 2 | 7 | 4 | 0 |
| E&FS-I | AF&L-I | RAIL-TI | ROAD-TI | HR&LC-I | LF-I | REST-I | F&ENT-I | M&S-I | BL&W-I | FROM | |
|---|---|---|---|---|---|---|---|---|---|---|---|
| E&FS-I | 22.02 | 12.44 | 7.09 | 12.72 | 7.26 | 5.66 | 6.29 | 11.78 | 10.49 | 4.26 | 77.98 |
| AF&L-I | 12.32 | 21.5 | 6.97 | 11.79 | 9.15 | 5.21 | 5.97 | 10.91 | 10.45 | 5.74 | 78.5 |
| RAIL-TI | 9.4 | 9.14 | 28.02 | 10.5 | 8.82 | 3.82 | 5.66 | 7.72 | 9.87 | 7.06 | 71.98 |
| ROAD-TI | 13.01 | 12.17 | 7.98 | 21.4 | 7.87 | 4.8 | 6.95 | 10.18 | 11.11 | 4.54 | 78.6 |
| HR&LC-I | 7.98 | 10.13 | 7.36 | 8.61 | 23.68 | 6.73 | 7.1 | 8.99 | 9.22 | 10.2 | 76.32 |
| LF-I | 8.6 | 8.15 | 4.4 | 7.4 | 9.46 | 33.16 | 6.3 | 10.45 | 7.54 | 4.53 | 66.84 |
| REST-I | 8.73 | 8.4 | 5.79 | 9.71 | 8.96 | 5.64 | 29.8 | 9.14 | 9.34 | 4.47 | 70.2 |
| F&ENT-I | 12.28 | 11.63 | 5.95 | 10.56 | 8.55 | 7.1 | 6.98 | 22.59 | 9.84 | 4.52 | 77.41 |
| M&S-I | 10.88 | 11.02 | 7.81 | 11.47 | 8.77 | 5.09 | 7.09 | 9.78 | 22.38 | 5.72 | 77.62 |
| BL&W-I | 6.12 | 8.64 | 7.96 | 6.65 | 13.93 | 4.51 | 4.88 | 6.43 | 8.26 | 32.62 | 67.38 |
| TO | 89.33 | 91.72 | 61.32 | 89.42 | 82.76 | 48.56 | 57.21 | 85.37 | 86.12 | 51.04 | 742.84 |
| Inc.Own | 111.34 | 113.22 | 89.33 | 110.82 | 106.44 | 81.72 | 87.01 | 107.96 | 108.5 | 83.66 | cTCI/TCI |
| NET | 11.34 | 13.22 | -10.67 | 10.82 | 6.44 | -18.28 | -12.99 | 7.96 | 8.5 | -16.34 | 82.54/74.28 |
| NPT | 8 | 9 | 3 | 7 | 4 | 0 | 2 | 5 | 6 | 1 |
Disclaimer/Publisher’s Note: The statements, opinions and data contained in all publications are solely those of the individual author(s) and contributor(s) and not of MDPI and/or the editor(s). MDPI and/or the editor(s) disclaim responsibility for any injury to people or property resulting from any ideas, methods, instructions or products referred to in the content. |
© 2025 by the authors. Licensee MDPI, Basel, Switzerland. This article is an open access article distributed under the terms and conditions of the Creative Commons Attribution (CC BY) license (http://creativecommons.org/licenses/by/4.0/).


