Submitted:
27 February 2025
Posted:
27 February 2025
You are already at the latest version
Abstract
Background/objectives: Most individuals who have a familial or clinical risk to develop psychosis remain free from psychopathology. Identifying neural markers of resilience in these at-risk individuals may help clarify underlying mechanisms and yield novel targets for (early) intervention. However, in contrast to studies on risk biomarkers, studies on neural markers of resilience to psychosis are scarce. The current study aims to identify potential brain markers of resilience to psychosis. Methods: A systematic review of the literature yielded a total of 43 MRI studies reporting resilience-associated brain changes in individuals with elevated risk for psychosis. Label-based meta-analysis was used to synthesize findings across MRI modalities. Results: Resilience-associated brain changes were significantly overreported among regions of the default mode and language network, and among highly connected and central brain regions. Conclusions: These findings suggest that DMN and language-associated brain regions and central brain hubs may be hotspots for resilience-associated brain changes. These neural systems are thus of key interest as targets of inquiry and, possibly, intervention in at-risk populations.
Keywords:
Resilience
; Psychosis
; High-Risk
; Clinical High-Risk
; Familial High-Risk
; Neuroimag-ing
; MRI
; Multimodal
; Brain Markers
1. Introduction
Resilience has been defined as “the human ability to adapt in the face of tragedy, trauma, adversity, hardship, and ongoing significant life stressors” [1] (p. 227). Although various other definitions exist in the literature, the common thread among them is the ability to adapt to adversity in a such a manner that psychological and societal functioning are preserved [2,3,4,5,6,7].
Resilience is an important concept to early-psychosis research, as most individuals (nearly 90%) who have a familial high risk (FHR) for psychosis never develop a psychotic episode [8]. Similarly, the majority of individuals (70-80%) who meet criteria for clinical high risk (CHR) for psychosis (i.e., subthreshold psychotic symptoms combined with functional decline) do not progress to full psychosis [9,10]. While research efforts in the field tend to focus on establishing psychosis risk markers, identifying markers of resilience, and e.g. incorporating them in psychosis-prediction tools [11] or combined with AI [12], may promote early recognition [13] and thereby improve prognosis. Moreover, identifying neural systems associated with resilience to psychosis may guide efforts to develop novel interventions to target these systems for therapeutic or preventive benefit [14].
In the social sciences, there is a long history of research on resilience in the face of adversity including familial predisposition to psychosis [15,16,17,18,19,20,21]. In fact, some of the earliest of these studies were conducted with children from parents diagnosed with schizophrenia [21]. These studies, pioneered by Garmezy in the 1970s [22], suggested that “many of these children were “stress-resistant” or “resilient” and capable of living productive lives and adapting to life stressors, despite having a heightened risk for developing a serious mental illness” [2] More recent work developed a dynamic model of resilience in the presence of (risk for) mental illness as a multifaceted process with interacting internal and external dimensions, as well as continuously evolving life circumstances (see [2]). Internal factors in this model include stress levels, coping skills, and problem-solving abilities. In addition to (and perhaps partly underlying) these psychological and cognitive factors, there may also be neural characteristics that confer increased resilience to mental ill health. For example, studies in so-called “superagers”, who show excellent memory capacity in advanced age (which may reflect resilience to conventional pathways of aging), have identified specific regions of cortical preservation, alongside preserved cognitive performance and better overall mental health [23,24].
To explore the hypothesis that individuals who are resilient to the development of psychosis despite an at-risk profile may show specific neural characteristics that set them apart from both patients and healthy (i.e., non at-risk) controls, we performed a systematic review of the literature to identify MRI studies in FHR or CHR individuals reporting markers of resilience to psychosis. Because of the sparsity of such research, we included all imaging studies regardless of MRI modality, adapting our analytic methods to synthesize findings across modalities. To this end, we used label-based meta-analysis, an ROI-based type of meta-analysis [25,26,27] that relies on tallying the number of times a brain region is reported in literature as being associated with a specific finding, here being “not developing psychosis despite being at FHR or CHR to psychosis”. This approach allowed us to pool multimodal MRI findings in order to determine whether specific brain regions or networks are statistically overrepresented among reported markers of resilience to psychosis across modalities. In addition, to assess putative underlying mechanisms, we incorporated methods from graph analysis to explore whether topological factors (i.e., organizational properties of the brain network) relate to the spatial distribution of resilience markers across the brain.
By identifying putative brain markers of resilience to psychosis we aim to provide a reference for future resilience studies. Our overall goal is to foster new hypotheses on neural factors that may confer increased resilience to psychosis and contribute to the discovery of novel targets for early intervention in at-risk individuals.
2. Materials and Methods
2.1. Systematic Review
This systematic review was performed according to guidance from the Preferred Reporting Items for Systematic Reviews and Meta-analysis (PRISMA) [28]. The review was not pre-registered. Two investigators (GC, JEG) independently performed systematic search and selection and critical evaluation procedures. Disagreements were discussed and resolved by consensus. Figure 1 shows the flow diagram depicting the search and selection procedure.
2.1.1. Search and Selection Procedure
A comprehensive search was conducted in PubMed and Scopus databases up to January 2020, using the following search terms: [“relatives” OR “siblings” OR “risk”] AND [“psychosis” OR “schizophrenia” OR “bipolar”] AND [“neuroimaging” OR “MRI” OR “imaging”] AND [“resilience” OR “compensatory” OR “protective”]. Retrieved records were supplemented with studies referenced by included studies or relevant review articles or as found by manual search.
Studies meeting the following inclusion criteria were included: i) original research papers written in English; ii) neuroimaging studies using structural MRI (sMRI), diffusion-MRI, and task-related or resting-state fMRI (task-fMRI; rs-fMRI); iii) studies including a high-risk (HR) group, including either CHR [29], At-Risk Mental State [30], or Ultra High-Risk [31], or FHR individuals including first-degree relatives (FDR) of patients with a schizophrenia spectrum or type 1 (i.e., manic-psychotic) bipolar disorder; iv) studies reporting neuroimaging markers of resilience to psychosis. Resilience-associated neuroimaging markers were operationalized as MRI markers showing either significant differences in HR (i.e., either CHR or FHR) as compared to both patients and healthy controls (HC) (Figure 2A) or an association with positive outcomes (e.g., improved function) in HR samples (Figure 2B). Additional inclusion criteria for label-based meta-analysis included: i) studies reporting ROI-based findings, ii) studies reporting results in standardized coordinate (e.g., MNI) space.
2.1.2. Data Extraction
Data were extracted systematically for each publication: sample details including sample size, type of high-risk group, and demographics; experimental procedures including MRI acquisition and analysis, statistical methods including multiple comparison correction; main findings including regional localization based on atlas or MNI coordinates, as applicable. Only results reported as significant were considered.
2.1.3. Critical Evaluation
Critical evaluation was performed on the following reliability criteria: i) sample size over 20 participants per group (i.e., > 60 participants in total); ii) adequate motion correction [32,33,34]; and iii) appropriate multiple comparison correction. Additional information on the critical evaluation procedure are provided in the Supplementary Materials and Table S1 provides details on the quality-assessment of each included study. Given the paucity of neuroimaging findings on resilience to psychosis, studies with quality concerns were not simply excluded. Rather, their findings were weighted according to the number of putative quality issues, assigning less weight to findings from studies with quality concerns. To this end, findings from studies with one or two concerns were weighted 0.67 and 0.33 respectively. Quality-weighted results went into regional and system-level tallies of resilience effects, as specified below.
2.2. Label-Based Meta-Analysis
2.2.1. Regional Analysis
A region-wise analysis was used to assess whether multimodal markers of resilience to psychosis converged on specific brain regions. To this end, quality-adjusted findings across imaging modalities were mapped to the Desikan-Killiany (DK) atlas (for details, see Table S4) and tallied per DK region (Supplementary material, Table S2).
2.2.2. Network-Level Analysis
To assess whether specific brain networks are associated with resilience to psychosis, DK regions were assigned to one of seven networks defined by Yeo et al. (2011), including default mode, frontoparietal control, somatomotor, visual, limbic, ventral attention, and dorsal attention networks [35] and tallied per network. In a follow-up analysis, the Yeo et al. parcellation was adapted to include a language network, resulting in an eight-network parcellation that was separately analyzed (Supplementary Material; Figure S1).
2.2.3. Graph Theoretical Analysis
To assess whether a brain region’s involvement in resilience relates to their topological role in the overall brain network, we tested regional tallies of resilience-related effects for associations with metrics of brain network organization. To compute these metrics, structural brain networks were reconstructed from an independent sample of healthy controls [36], with connections weighted according to the number of diffusion-MRI derived tractography streamlines, and used to compute regional strength, path length, clustering, betweenness centrality, and rich club membership. These metrics provide a measure of a region’s overall connectivity (strength), communication efficiency (path length), local cliquishness (clustering), centrality in the network (betweenness centrality), and whether they pertain to a central core of densely connected brain hubs (rich club membership) [37,38]. No standardization or normalization was applied to these metrics.
2.3. Statistical Analysis
2.3.1. Regional and Network-Level Analysis
Permutation analysis was used to test the statistical significance of regional and network-level findings. For each of 10,000 iterations, empirical findings were randomly redistributed across regions of the DK-atlas (as shown in Table S2) and tallied per region in each iteration, creating a regional null distribution of findings under the hypothesis that their localization is driven by chance. For each brain region, the sum of empirical findings was compared to the regional null-distribution and assigned a p-value as the proportion of random iterations resulting a sum equal to, or greater than, the empirical result. No smoothing techniques were applied. The same method was used to assess the statistical significance of network-level results. FDR-correction was applied to all results to correct for multiple comparisons.
2.3.2. Graph Theoretical Meta-Analysis
Pearson’s correlation analysis was used to assess associations between regional tallies of resilience-related effects and regional metrics of brain network organization. The distribution of resilience findings in rich club versus non-rich club regions was tested for statistical significance using permutation analysis following the same procedures specified in 2.3.1.
3. Results
3.1. Systematic Review
The literature search yielded a total of 336 records including 117 duplicates. The remaining 219 records were combined with 9 records from manual search and cross-checking reference lists of eligible articles and review papers, yielding a total of 228 records. Screening title and abstract yielded 69 papers for full-text evaluation. Of these, 26 publications did not meet inclusion criteria (details in Figure 1), leaving 43 papers that were selected for this review.
The 43 selected studies included 16 sMRI, 5 diffusion-MRI, 16 task-fMRI, and 6 rs-fMRI studies (study details and main findings per imaging modality in Appendix A, Table A1 –A4), comprising a total of 4732 participants including 1455 HR individuals, 1434 patients with established psychotic illness, and 1843 HC. Out of the 43 studies, 14 reported resilience-associated increases in regional volume (N = 9) and/or cortical thickness (N = 5) or surface area (N = 1) (Table A1) and 5 reported increases in structural connectivity (Table A2). No studies reported resilience-associated decreases in cortical volume, thickness or surface area or structural connectivity. Resilience-associated changes in functional activity or connectivity were reported by 14 (Table A3) and 6 (Table A4) studies respectively and involved mainly increases in activation or connectivity (N = 17). Finally, 6 studies reported other resilience-related effects, including changes in regional shape (N = 1), structural covariance (N = 1) (Table A1), or global network connectivity / topology (N = 4) (Table A4).
3.2. Label-Based Meta-Analysis
3.2.1. Regional Results
Regionally specific results were reported by 35 studies comprising a total of 3111 participants (i.e., 1018 HR, 881 patients, 1212 HC). Figure 3 shows a pooled aggregate of regional resilience-associated effects across MRI modalities. In regional permutation analysis, MRI markers of resilience were overreported among the left and right precuneus (p = .008 and p = .009 respectively), right superior frontal gyrus (p = .007), left fusiform gyrus (FG) (p = .028), and left inferior frontal gyrus (IFG), orbital part (p = .046). However, these effects did not survive FDR-correction.
3.2.2. Network-Level Results
Brain regions were assigned to functional networks as defined by Yeo et al (Figure 4A, B). Permutation analysis showed that the DMN was significantly overrepresented among reported resilience findings (p < .001, permutation testing) (Figure 4C, D). Adapting the Yeo et al. parcellation to include a language-network yielded significant results for both DMN (p < .001) and language network (p = .006). These findings all survived FDR-correction.
3.2.3. Graph Theoretical Results
Regional tallies of resilience findings were positively correlated with regional connectivity strength (r = 0.42, p < .001) and betweenness centrality (r = 0.31, p = .009), and negatively correlated with path length (r = -0.29, p = .015), suggesting that more highly connected, central, and efficient brain regions more commonly show resilience-related effects (Figure 5). Moreover, resilience-related findings were found to be significantly overreported among rich club hubs relative to non-rich club regions (p = .018). These findings also survived FDR-correction.
4. Discussion
This systematic review and label-based meta-analysis aimed to identify spatially consistent brain markers of resilience to psychosis across structural and functional MRI studies in (clinical and familial) high-risk cohorts and to assess potential underlying mechanisms. To the best of our knowledge, this is the first meta-analytical assessment of the neuroimaging literature on resilience to psychosis.
Our systematic review yielded a total of 43 neuroimaging studies, comprising almost five thousand participants, that reported structural and functional brain changes associated with resilience to psychosis in at-risk individuals. Among 35 studies reporting regionally specific findings, resilience-associated brain changes were found to be significantly overreported among the DMN and language network and central brain hubs. Although regional findings did not survive multiple comparison correction, overrepresented areas including precuneus and (medial) superior frontal gyrus, fusiform gyrus, and left IFG converged largely on the same systems. Reported resilience-associated effects in these regions included increases in volume, cortical thickness, or structural connectivity, and changes in functional activation and connectivity. It remains to be determined how such brain changes would promote resilience to psychosis.
Two potential mechanisms promoting healthy brain and cognitive functioning include a higher brain reserve and compensatory neuroplasticity. Brain reserve has been defined as a higher quantity of neural resources acting as a buffer to subsequent pathological changes and thereby preserving normal functioning [39]. Often operationalized as higher brain volume, brain reserve has been associated with slower clinical deterioration in dementia [40,41], preserved cognition in SuperAgers [42], and gains in cognitive performance after cognitive enhancement therapy in schizophrenia [43]. In the context of high-risk for psychosis, higher premorbid brain volume – globally or in specific regions – or ‘super-normal’ levels of cortical thickness or structural connectivity may buffer an overshoot in synaptic pruning in adolescence, which is thought to contribute to the pathophysiology of psychotic illness [44] and thereby mitigate the disease process. In addition, compensatory neuroplasticity, may perhaps underlie some of the resilience-related fMRI results reported in literature. Changes in functional activation or functional connectivity may, for example, result from brain regions actively rewiring through synaptic plasticity or inherent neuron excitability as a reciprocal response to changes in other areas [45,46]. Alone or in concert, these processes may play a role in shaping an individual’s capacity for resilience by buffering or offsetting risk-associated brain changes and thereby averting progression to full psychosis in at-risk youth.
The results of our label-based meta-analysis suggest that compensatory or adaptive changes of the DMN may be particularly beneficial to resilience. Our regional analysis yielded significant results for the precuneus and superior frontal gyrus, two important nodes of the DMN, with ten out of 35 studies with region-specific results (28.6%) implicating either or both regions. Moreover, in our network-level analysis, the DMN was found to be significantly overrepresented among resilience-related results reported in literature. The DMN’s involvement in psychosis is emphasized by studies showing abnormalities in task-activation and functional connectivity of the DMN in patients with schizophrenia, bipolar disorder, and CHR individuals [47,48,49,50,51,52]. In addition, DMN connectivity has been related to clinical outcome in the at-risk stage [53,54]. Indeed, a PET study has shown that adaptive plasticity of the MPFC, a key part of the DMN, may protect against psychosis development in the context of childhood trauma [55]. In all, these findings suggest a central role for the DMN in both risk and resilience to psychosis. Interestingly, there is evidence that mindfulness-based interventions reduce connectivity within the DMN [56]. These interventions may thus build resilience by ameliorating aberrant DMN connectivity associated with psychosis [57]. Indeed, there is recent preliminary evidence that mindfulness-based resiliency training is effective in reducing symptoms among at-risk individuals [58]. Moreover, mindfulness-based real-time fMRI neurofeedback aimed at downregulating DMN has shown promise as reducing auditory hallucinations in schizophrenia patients [59]. Finally, preliminary preclinical evidence suggests that targeted early-stage neuromodulation of medial prefrontal cortex may prevent brain and behavioral abnormalities associated with psychosis development [60], again suggesting that mPFC may be a valuable target for early intervention.
In addition to the DMN, the label-based meta-analysis suggested that the left IFG and larger language network may play a role in promoting resilience to psychosis. The IFG consists of an orbital, triangular, and opercular part and encompasses Broca’s speech area in the dominant (typically left) hemisphere. In regional analysis, a significant effect was found for the left orbital part of the IFG specifically, but eleven out of 35 studies with region-specific results (31.4%) reported any part of IFG to show resilience-related effects. In addition, a DWI study (Table 2) reported increased fractional anisotropy (FA) of the arcuate fasciculus in unaffected siblings of schizophrenia patients, while their affected relatives showed an association between arcuate fasciculus FA and symptom severity [61]. Connecting Broca’s area in IFG to Wernicke’s area in the temporal cortex, the arcuate fasciculus is involved in speech and language processing [62,63,64] and has been implicated in auditory hallucinations [65]. Taken together, these findings suggest that increases in cortical thickness of the IFG and/or increases in structural connectivity of the arcuate fasciculus connecting IFG to other language areas may attenuate risk for psychotic symptom development. This hypothesis is in line with evidence that language learning and bilingualism can build cognitive reserve and thereby protect against neuropsychiatric disorders [66,67].
Finally, graph-theoretical analysis showed that brain regions with high connectivity and efficiency (i.e., low pathlength), and topological centrality were more likely to be reported in literature as showing resilience-related effects. In line with this observation, resilience markers were found to be overreported among rich club hubs. These graph theoretical findings are consistent with our regional and network-level results, as rich club hubs including precuneus, superior frontal gyrus, and superior parietal gyrus [68] show significant overlap with the DMN [69]. Moreover, the network results extend our regional findings by providing an additional mechanistic hypothesis on why these regions in particular may be beneficial to resilience: given their central role in global brain communication [70,71,72] and the disproportionate impairment of hub-to-hub connectivity observed in schizophrenia [36,73,74], brain hubs may be particularly well positioned to buffer risk-associated brain changes and thereby promote resilience to psychosis.
A number of possible limitations should be considered when interpreting the current results. First, our findings are based on a sparse literature that includes studies with modest sample sizes. We attempted to control for this issue by reducing the relative influence of findings from studies with small sample size or quality concerns, but well-powered, methodologically robust studies are needed to confirm our results. In addition, because of the paucity of literature on the neurobiology of resilience, all MRI studies regardless of imaging modality and at-risk definition, were included. An advantage of this approach is likely an increased sensitivity to detect putative resilience markers, as different at-risk groups may share risk and resilience-related characteristics, and such changes may show up in different imaging modalities. A disadvantage is that including such a diverse set of studies precluded a more standard meta-analytical approach which could have yielded more robust findings. Moreover, although they largely matched with network and graph theoretical results, regional findings did not survive multiple comparison correction and should thus be interpreted with caution. Therefore, we suggest that our findings are primarily used to generate novel hypotheses to be confirmed in future studies. In addition, the literature search that formed the basis for the current analysis was performed in January 2020, after which the study was unfortunately interrupted by the pandemic. Because of ensuing clinical obligations, it was not feasible for the research team to update the search to include studies up to 2024. As a result, the current findings may omit important studies that came out after 2020. Another potential limitation is that selected studies included mainly medicated patients, which may obscure the natural biology of the illness. As medication-effects in patients can mimic resilience-related effects in high-risk individuals – lithium treatment, for example, has been linked to increased brain volumes, particularly in mood regulatory areas [75,76] – this could hinder the identification of brain markers of resilience. Antipsychotics have been shown to mainly influence basal ganglia [77,78]. Given that we focused on cortical effects and on contrasts between high-risk individuals and both patients and healthy controls, it is unlikely that currently reported results are confounded by effects of antipsychotic medication. Moreover, given that the label-based analysis relies on tallying results from prior studies in which participant groups were mostly well-matched and scanned on the same magnet, factors such as age, sex and scanner differences are not expected to drive current results although they were not separately assessed in the current study. Finally, our review is based largely on cross-sectional studies. Longitudinal studies are needed to confirm our findings and distinguish between static protective (i.e., brain reserve) and dynamic (i.e., compensatory neuroplastic) processes promoting resilience to psychosis.
5. Conclusions
In conclusion, the current results suggest that protective or adaptive changes in a specific set of neural systems, including DMN-related brain regions, language areas, the fusiform gyrus, and rich club hubs, may have a central role in resilience to psychosis. These observations are of interest as individual differences in these systems may help understand why some at-risk youth develop psychosis while others remain healthy. Moreover, identifying neural systems associated with resilience to psychosis may promote therapeutic innovation in early-psychosis and the high-risk state; for example, by identifying novel targets for intervention such as non-invasive brain stimulation or fMRI-assisted neurofeedback [79,80,81]. If such targeted intervention can induce resilience-associated brain changes, this may slow or prevent progression to psychosis in HR youth. “In the hope that, by doing so, they can perhaps be inoculated against disorder” [82].
Supplementary Materials
The following supporting information can be downloaded at the website of this paper posted on Preprints.org., Supplementary materials, Figure S1: Language network definition; Supplementary results; List of Abbreviations (for Tables A1-4); Table S1: Critical evaluation; Table S2. Mapped results cortical; Table S3. Mapped results – subcortical. Table S4. DK-atlas mapping de-tails, Table S5. Studies excluded after full-text assessment, with rationale.
Author Contributions
Conceptualization, G.C., W.S.S., M.S.K. and M.E.S..; methodology, G.C. and X.C..; software, G.C. and X.C..; validation, G.C., J.E.G. and X.C., formal analysis, G.C., J.E.G., and X.C..; investigation, G.C. and J.E.G..; resources, G.C., W.C. and M.E.S..; data curation, G.C. and J.E.G..; writing—original draft preparation, G.C..; writing—review and editing, G.C., X.C., Z.Q., S.W.G., W.C., J.W., W.S.S., M.S.K., M.E.S..; visualization, G.C. and X.C..; supervision, M.S.K. and M.E.S.; project administration, N/A.; funding acquisition, G.C., S.W.G., J.W., W.S.S., M.S.K., M.E.S. All authors have read and agreed to the published version of the manuscript.
Funding
This research was supported by the European Union’s Horizon 2020 research and innovation program under the Marie Sklodowska-Curie grant agreement No. 749201, the Brain and Behavior Research Foundation (BBRF; Grant number 29875) and the Netherlands Organization for Health Research and Development (ZonMw; Grant number 636320016) (to GC), the National Institute of Mental Health (R01MH111448 to SWG, JW, WSS, MES; R01MH64023 to MSK; 5U01MH081928 to WSS), and a VA Merit Award (to MES).
Data Availability Statement
No new data was created. The tables and supplementary materials included in this publication contain all data referenced in the study.
Conflicts of Interest
The authors declare no conflicts of interest.
Abbreviations
The following abbreviations are used in this manuscript:
| CHR | Clinical High Risk |
| DK DMN |
Desikan Killiany (atlas) Default Mode Network |
| FHR FG HC HR IFG MNI MRI |
Familial High Risk Fusiform Gyrus Healthy Controls High Risk Inferior Frontal Gyrus Montreal Neurological Institute Magnetic Resonance Imaging |
| PRISMA Rs-fMRI |
Preferred Reporting Items for Systematic Reviews and Meta-analysis Resting-state functional MRI |
Appendix A

Table A1.
Anatomical MRI studies.
| Paper | Participants details | MRI acquisition | MRI analysis | Statistical analysis | Main resilience findings |
|---|---|---|---|---|---|
| Fornito et al., 2008 [83] | 35 resilient CHR (UHR-NP, 20y, 57% M) 35 non-resilient CHR (UHR-P, 19y, 60% M) 33 HC (21y, 64% M) |
1.5T GE Signa: spoiled-GRE recoil sequence, TR 14.3ms, TE 3.3ms, FA 30°, FOV 24cm, voxel size 0.938mm2 x 1.5mm) | Skull-stripping and alignment to N27 template with FSL; FreeSurfer for segmentation and cortical surface reconstruction. | ANOVA to test regional GM volume, SA, CT; Bonferroni-adjusted α of p < .0167 (α/3) for 3 pairwise comparisons (i.e., HC, resilient CHR, and non-resilient CHR). | Resilient CHR showed increased cortical thickness of dorsal limbic ACC and a trend-level increase in the rostral limbic ACC compared to HC, and increased thickness of rostral limbic ACC and subcallosal paralimbic ACC (trend-level), compared to non-resilient CHR. |
| Habets et al., 2008 [84] | 32 FHR (FDR, 36y, 44% M) 31 SCZ (31y, 48% M) 27 HC (36y, 44% M) |
1.5T Philips Gyro-scan NT-I1: T2- and proton-density (PD)-weighted images (dual-echo FSE sequence, TR 4s, TE1 20ms, TE2 100ms, FOV 22cm, 60 slices, 3mm thick, interleaved, with 0.3mm gap) | Brain mask generated from PD-images, proportion of different tissues were determined for voxels within mask, transformation of maps into standard space using AFNI. | ANCOVAs modeling the effect of cognitive scores on GM volumes fitted for each voxel; permutation testing with β/SE(β) > 2 voxel threshold; and cluster thresholds limiting false-positive tests to < 1 per map. | In addition to risk-associated cerebellar gray matter deficits shared with SCZ, FHR showed increased gray matter density of a cortical region, specifically the SFG. However, FHR showed a correlation between poorer executive performance and density of SFG, cingulate gyrus, and cerebellum. |
| Kempton et al., 2009 [85] | 50 FHR (FDR, 34y, 48% M, incl 14 with MDD, 31y, 36% M) 30 BD (39y, 50% M) 52 HC (35.2y, 52% M) |
1.5T GE Signa: T1-images (3D spoiled GRE sequence, TR 18ms, TE 5.1ms, FA 20°, voxel size 0.94mm2 x 1.5mm) | SMP5 for VBM with unified segmentation. |
Regional GM volumes were assessed for group-effect using ANCOVA with ICV as covariate, using a voxel-threshold of p < .001 (uncorrected) and cluster threshold ≥ 5. | BD patients, healthy FHR, and FHR with MDD all showed increased left insula volume (i.e., marker of BD risk); only healthy FHR showed increased left cerebellar (vermal) volume compared to HC and BD, suggestive of association with resilience. |
| Greenstein et al., 2011 [86] | 80 FHR (sibs, 17y, 46% M) 94 COS (17y, 54% M) 110 HC (17y, 58% M) |
1.5T GE Signa: T1- images (spoiled GRE sequence, TR 24ms, TE 5ms, FA 45°, FOV 24cm, contiguous 1.5mm axial slices; in coronal plane 2.0mm) | MR images registered to standard space using linear transformation, BRAINS2 software package to parcellate the cerebellum. | Polynomial mixed model regression to assess cerebellar development; t-tests at two time points (mean age; last scan after age 20) to assess group-effects (alpha p < .01). | FHR and COS showed divergent trajectory of total cerebellar volume; only adolescent FHR had greater superior vermis volume. Across follow-up (2yr intervals up to 12 years), the developmental trajectory of the superior vermis in FHR converged with HC. |
| Frangou, 2012$ [87] | 48 FHR (FDR, 37y, 50% M) 47 BD (46y, 45% M) 71 HC (40y, 51% M) |
1.5T GE Neuro-optimized Signa: T1 scan (TR 1.8s, TE 5.1ms, TI 450ms, FOV 4x18cm, FA 20°, voxel size 0.9mm2 x 1.5mm) | SPM5 for voxel-based morphometry using unified segmentation. | An ANCOVA model was used to assess the effect of group on regional GM volumes, correcting for ICV, with an uncorrected p < .001 voxel threshold and cluster threshold of 5. | In addition to putative risk-markers (e.g., increased insula volume), FHR showed unique changes (relative to patients and HC) including higher cerebellar vermis volume. Functional MRI findings from this study were also reported by Pompei et al., 2011, as listed in eTable 6. |
| van Erp et al., 2012 [88] | 14 FHR (co-twins, 44y, 36% M) 18 BD (44y, 44% M, incl 10 lithium-treated, 8 non-treated) 32 HC (twins, 47y, 53% M) |
1.0T Siemens: T1-images (MPRAGE sequence, TR 11.4ms, TE 4.4ms, FOV 25cm, voxel size 0.98mm2 x 1.2mm) | Preprocessing using MNI tools (mritotal, N3). MultiTracer for hippocampal tracing; 3D radial distance mapping for hippocampal shape analysis and group-comparison. | Mixed model regression to assess hippocampal volume, SA, length, and thickness for group effects, using permutation to assess the significance of statistical maps and correct for multiple comparisons. | Compared to controls, FHR co-twins showed larger hippocampal thickness than controls along border of the cornu ammonis and anterior subiculum, especially in the right hemisphere. These regions overlapped partly with areas showing increased thickening in BD patients, possibly secondary to lithium-treatment mimicking resilience-effects. |
| Eker et al., 2014 [89] | 28 FHR (sibs, 35y, 40% M) 28 BD (36y, 58% M) 30 HC (35y, 33% M) |
3.0T Siemens Magnetom Verio: T1-images (MPRAGE sequence, TR 1.6s, TE 221ms, TI 900ms, FA 9°, FOV 25.6 cm, voxel size = 1mm3 mm). FLAIR and T2- scan to exclude brain lesions. | SPM8 for preprocessing and VBM analyses using DARTEL. | ANCOVA to assess group-effects, correcting for age, sex, and ICV. Main analysis with FWE-corrected p < .05 and cluster > 5; exploratory analyses with uncorrected p < .001, cluster > 50 in a priori selected areas. | In exploratory analyses, FHR had more gray matter in left DLPFC than HC and BD. As this effect was unique to FHR and observed in the context of reduced gray matter in the left OFC in both FHR and BD, increased DLPFC gray matter density in FHR may reflect a compensatory response. |
| Chakravarty et al., 2015 [90] | 71 FHR (sibs, 19y, 48% M) 86 COS (18y, 58% M) 81 HC (17y, 67% M) |
1.5T GE Signa: T1-images (spoiled GRE sequence, TR 24ms, TE 5ms, FA 45°, FOV 24cm, axial contiguous 1.5mm thick slices) | Striatum segmen-tation with MAGeT Brain algorithm; marching cubes method for surface reconstruction. | Shape measurements (vertex-wise) analyzed using mixed-model regression, adjusting for family ties, using an FDR-corrected alpha. | FHR and COS both showed striatal shape changes, with outward displacement of ventral striatum and inward displacement along anterior head; in FHR these striatal shape abnormalities normalized in early adulthood. |
| Goghari et al., 2015 [91] | 26 FHR (FDR, 41y, 35% M) 25 SCZ (41y, 52% M) 23 HC (40y, 48% M) |
3T GE Discovery MR750: T1-images (MPRAGE, TR 7.4ms, TE 3.1ms, FA 11°, FOV 25.6cm, 236 1mm thick coronal slices) | FreeSurfer v5.1.0 for cortical reconstruction and parcellation (acc. to DK-atlas). | ANCOVAs to assess group-effects; univariate tests for lobes showing significant effects, without further multiple comparison correction. | FHR showed greater cortical thickness of the bilateral caudal MFG, IFG (opercular and triangular part), STG, isthmus-cingulate gyrus, precuneus, cuneus, LG, and left FG and lateral OFC compared to HC and SCZ. |
| Sariçiçek et al., 2015 [92] | 25 FHR (FDR, 32y, 46% M) 28 BD (36y, 26% M) 29 HC (34y, 28% M) |
1.5T Philips Achieva: T1-images (FFE sequence, TR 25ms, TE 6ms, FA 8°, FOV 24cm, axial slices, 1mm thickness) | VBM analyses in SPM8 using DARTEL. | ANCOVA for VBM group-comparisons, with ICV and education as covariates; thresholds: cluster p < .05, voxel p < .01, cluster size > 205. | Relative to HC, both FHR and BD had reduced volume of the cerebellum (incl vermis) and increased volume of bilateral IFG, but only FHR showed increased gray matter volume of left SMG and parahippocampal gyrus. |
| Zalesky et al., 2015 [93] | 86 FHR (sibs, 49% M) 109 COS (57% M) 102 HC (59% M) (ages between 12 and 24 years, mean baseline age not reported) |
1.5T GE Signa: T1-images (spoiled GRE sequence, TR 24ms, TE 5ms, FA 45°, FOV 24cm, contiguous 1.5mm thick axial slices) | Neural net classifier to segment registered and corrected images, surface deformation algorithm, cortical thickness measured in native space, network mapping on lobar and regional level (DK-atlas). | Initial broad analysis to identify lobes with connectivity deficits, followed by localized approach focused on significant regions from the broad analysis. No further multiple comparison correction. | Risk-associated (i.e., shared with COS) deficits in CT correlations between left occipital (pericalcarine gyrus and FG) and temporal (STG) lobe, normalized by mid-adolescence in FHR. Protracted adult-onset normalization in COS correlated with symptom improvement. In addition, FHR showed increased correlations between the right cingulate and right temporal and parietal lobe. |
| Chang et al., 2016 [94] | 31 FHR (offspr, 18y, 68% M) 60 SCZ (18y, 48% M) 71 HC (21y, 38% M) |
3.0T GE Signa HDX: T1-images (FSPGR sequence, TR 7.2ms, TE 3.2ms, FA 13°, FOV 24cm, 176 slices, voxels 1mm3) | DARTEL in SPM8 for preprocessing including segmentation, registration, and normalization to MNI template. | GM comparisons full-factorial design, age and sex as covariates, using voxel threshold p < .01 AlphaSim corrected (cluster > 444 voxels), post-hoc 2-sample t-tests. | FHR showed increased gray matter volumes of the right cerebellum (anterior and posterior lobe), FG, ITG, SMG, and precentral gyrus, compared to both HC and SCZ (according to Table and Figure 2, text states differently). |
| de Wit et al., 2016# [95] | 16 resilient CHR (UHR-remitted, 15 y, 76% M) 19 non-resilient CHR (UHR-non-remitted, 16y, 56% M) 48 HC (16y, 60% M) (ages at baseline, with 6 year follow-up) |
1.5T Philips: T1-images (FFE sequence, TR 30ms, TE 4.6ms, FA 30°, FOV 25.6cm, contiguous coronal slices of 1.5mm) | FreeSurfer v5.1.0 for preprocessing and to compute gray matter volume, CT, SA, and gyrification. Longitudinal FreeSurfer pipeline for between-session comparisons. | Effects of age, group, and their interaction were assessed using a linear mixed model; multiple comparison correction was not specified. | Resilient CHR showed increased CT of bilateral caudal MFG and FG, left SFG, rostral MFG, orbital IFG, lateral OFC, MTG, banks of the STS, SMG, SPG, and precuneus, and right ITG and parahippocampal gyrus and large volumes of left precuneus lateral OFC, and pallidum; and smaller decrease over time in CT and volume of several areas. |
| Katagiri et al., 2018 [96] | 37 resilient CHR (ARMS-N, 24y, 30% M, incl. 14 med-naive) 5 non-resilient CHR (ARMS-P, 18y, 20% M) 16 HC (23y, 50% M) |
1.5T Toshiba Excelart Vantage: T1-images (TR 24.4ms, TE 5.5ms, FA 35°, FOV 25cm, 35 sagittal slices of 2mm) | FreeSurfer v5.2.0 with default processing settings for computing longitudinal corpus callosum volumes. | ANOVA testing CC sub-volumes group-effects; linear regression between longitudinal volume changes and symptoms (all p < .05, uncorrected). | While resilient CHR showed a reduction in mid-anterior, central, and mid-posterior CC at baseline, subsequent volume increases of the central CC were associated with improvements in negative symptoms over follow-up. |
| Katagiri et al., 2019 [97] | 37 resilient CHR (ARMS-N, 24y, 30% M, incl. 14 med-naive) 5 non-resilient CHR (ARMS-P, 18y, 20% M) 16 HC (23y, 50% M) |
1.5T Toshiba Excelart Vantage: T1-images (TR 24.4ms, TE 5.5ms, FA 35°, FOV 25cm, 35 sagittal slices of 2mm) | FreeSurfer v5.2.0 for preprocessing with standard settings for computing longitudinal striatal volumes. | ANOVAs testing striatal volume for group-effects, multiple regression to correlate volume changes with symptoms (all p < .05, uncorrected). | There were no group-differences in baseline striatal volumes in resilient versus non-resilient CHR. Improvements in positive symptoms were correlated with increased right nucleus accumbens volume in resilient CHR. |
| Yalin et al., 2019 [98] | 24 FHR (FDR, 32y, 46% M) 27 BD (36y, 37% M) 29 HC (33y, 38% M) |
1.5T Philips Tesla Achieva: T1-images (FFE sequence, TR 8.7ms, TE 4ms, FA 8°, FOV 23 x 22cm, 1mm-thick slices) | FreeSurfer v5.3.0 for preprocessing and computing regional cortical thickness and surface area (DK-atlas). | Regional CT and SA group-effects testedwith GEE model to account for family ties, covarying for age, sex, and ICV (for SA), with Bonferroni-correction. | Exploratory analyses showed a significant increase in right STG SA in FHR-siblings relative to HC, whereas BD showed a trend-level increase in SA of the STG (and a significant increase in SA of the left IFG, triangular part). |
* Anatomical MRI studies reporting resilience-associated effects. Familial High-Risk (FHR) individuals are first-degree relatives (FDR) of schizophrenia (SCZ) or bipolar disorder (BD) patients; if the FHR group comprised offspring (offspr) or siblings (sibs) only, this is noted as such. For Clinical High-Risk (CHR) groups, the specific risk-syndrome (i.e., CHR, ARMS, UHR) is noted. $ Frangou, 2012 results shown in this table include only sMRI findings; task-fMRI results were also reported by Pompei et al., 2011 and can be found in Table S6. # de Wit et al., 2016 used two separate definitions of resilience; results reported here are from the definition based on the criteria of remission defined by McGlashan et al. (2001)[99] to facilitate comparison with other literature. In the column ‘main resilience findings’, regions showing resilience-related effects are noted in bold print. UHR-P/NP = UHR who developed/did not develop psychosis; ARMS-P/N = ARMS who developed / did not develop psychosis. ICV = intracranial volume. Other abbreviations in ‘List of Abbreviations’ in supplement.
Table A2.
Diffusion-MRI studies.
| Paper | Participants details | MRI acquisition | MRI analysis | Statistical analysis | Main resilience findings |
|---|---|---|---|---|---|
| Hoptman et al., 2008 [100] | 22 FHR (FDR, 20y, 32% M) 23 SCZ (37y, 70% M) 37 HC (23y, 46% M) |
1.5T Siemens Vision: T1-scan (MRPAGE, TR 11.6ms, TE 4.9ms, FA 8°, FOV 30.7cm, 172 slices, voxels 1.2mm3); DWI-scan (TR 6s, TE 100ms, FOV 32cm, b-value = 1000 s/mm2, 8 non-collinear gradients, NEX 7, voxels 2.5mm2, 19 slices of 5mm, no gap) | FA calculated with in-house developed software. T1-scans skull-stripped with FreeSurfer, registered to distortion corrected b=0 images; b=0 and FA maps transformed to Talairach space. | Voxelwise ANOVA with age and sex as covariates, extracting clusters of > 100 contiguous voxels with p < .05 (incl at least 1 voxel with p < .001). A lower threshold of 50 contiguous voxels was used in follow-up analysis. | FHR showed increased FA in left subgenual ACC, right MFG and SFG, and pontine tegmental white matter, which may represent areas that offer protection against disease onset in those at familial high risk for psychosis. |
| Kim et al., 2012 [101] | 22 FHR (FDR$, 23y, 36% M) 15 SCZ (23y, 53% M) 26 HC (22y, 50% M) |
1.5T Siemens Avanto: DWI-scan (TR 5.9s, TE 96ms, FOV 23cm, axial slices of 2mm, no gap, voxels 1.8mm2 x 4mm, b-value 1000s/mm2, 12 non-collinear directions) | FSL preprocessing. Callosal boundaries traced with Moore-Neighbor algorithm, CC segmented into 200 equidistance surface points, FA extracted from each. | FA of each surface point assessed for group-effects with ANOVA, using age and sex as covariates, using random permutation with p < .01 to control type 1 error rate. | While SCZ showed decreased FA of CC splenium and genu (trend), FHR had increased FA of the genu, which may reflect compensatory WM changes counteracting the influence of genetic vulnerability to psychosis. |
| Boos et al., 2013 [61] | 123 FHR (sibs, 27y, 46% M) 126 SCZ (27y, 80% M) 109 HC (27y, 50% M) |
1.5T Philips Achieva: T1-scan (SPGR sequence, TR 30ms, TE 4.6ms, FA 30°, FOV 25.6cm, 160-180 contiguous slices, voxels 1mm2 x 1.2mm); DWI-scan (32 diffusion-weighted volumes, b-factor 1000 s/mm2, and 8 b=0 volumes, TR 9.8s, TE 88ms, FA 90°, FOV 24cm, 60 slices of 2.5mm, no gap) | DTI scans realigned, distortion-corrected, transformed with ANIMAL software. Fiber reconstruction with FACT algorithm, mean FA extracted per tract. | Mixed models to test 8 WM bundles for group-effects in FA, covarying for age, sex, handedness, interactions, and family ties; exploratory study without multiple comparison correction (results not significant after correction). | FHR showed higher FA of the bilateral arcuate fascicles relative to HC and SCZ; while arcuate FA was negatively associated with symptom severity in SCZ. Together, these effects are suggestive of compensatory changes of the arcuate in FHR, which may guard against symptoms. |
| Goghari et al., 2014 [102] |
24 FHR (FDR, 40y, 42% M) 25 SCZ (41y, 52% M) 27 HC (41y, 48% M) |
3T GE: DWI-scan (HARDI, 60 gradient directions with b-value 1300 s/mm2, no other details provided) | ExploreDTI for preprocessing and deterministic tractography; seed-based tracking of fornix, in-house software for along-tract analysis. | Multiple ANCOVAs to assess effects of group on FA, MD, RD, and AD separately for fornix body and fimbria, without multiple comparison correction; along-tract analyses FDR corrected. | Along-tract analyses showed local increases in FA in the right fimbria of the fornix in FHR compared to HC and SCZ, which may represent a compensatory mechanism to guard against psychosis. |
| Katagiri et al., 2015 [103] | 34 resilient CHR (ARMS-N, 24y, 26% M, incl 11 untreated) 7 non-resilient CHR (ARMS-P, 21y, 14% M) 16 HC (23y, 50% M) |
1.5T Toshiba Excelart Vantage: DWI-scan (single-shot EPI, TR 7.7s, TE 100ms, FOV 26cm, voxels 1.02mm2 x 5mm, 30 axial slices along 6 gradient directions, b-value 1000 s/mm2 and unweighted b = 0 images) | Preprocessing in FSL including distortion-correction, masking, tensor-fitting, registration to standard space. TBSS for between-group FA analysis. | Group-comparisons with t-tests using randomize function in FSL and threshold-free cluster-enhancement method, with p < .05, with FWE correction for multiple comparisons. | At baseline, CHR (relative to HC) showed reduced FA of the left anterior CC. Resilient CHR showed improved subthreshold positive symptoms at one-year follow-up, in association with an increase in FA in the left anterior CC (genu). |
* Diffusion-MRI studies reporting resilience-related effects. See Table 1 legend for FHR and CHR criteria and abbreviations. In the column ‘main resilience findings’, regions showing putative resilience-effects are in bold print. $ In Kim et al. (2012), FDR had ≥ two third-degree relatives including one first-degree relative with SCZ. Other abbreviations in ‘List of Abbreviations’ in supplement.
Table A3.
Task-based fMRI studies.
| Paper | Participants details | Task | MRI acquisition | MRI analysis | Statistical analysis | Main resilience findings |
|---|---|---|---|---|---|---|
| Working Memory (WM) | ||||||
| Fusar-Poli et al., 2010 [104] | 15 CHR (ARMS, 24y, 53% M, incl. 13 resilient CHR) 15 HC (25y, 60% M) |
Paired associate learning task | 1.5T Signa (GE): T2*-scan (no MR sequence reported, TR 2s, TE 40ms, FA 90°, 14 axial planes, 38 slices of 3mm, 0.3mm gap); and high-res IR-prepped dataset (TR 1.6s, TE 80ms, TI 180ms) | Processing in SPM5; Functional volumes realigned to the first volume and corrected for motion artifacts (no further details). | Full factorial model 2nd-level analysis to assess cognitive load, group, and interaction effects. Pairwise t-tests to assess longitudinal changes with voxel-wise threshold p < .05, FWE-corrected. | At baseline, hypoactivation of left precuneus, SPF, and MTG was observed in CHR as well as a failure to activate parietal areas with increasing task-difficulty. Improved clinical status at follow-up correlated with a longitudinal compensatory activation increase in left LG and SPL. |
| Fusar-Poli et al., 2011 [105] | 15 CHR (ARMS, 24y, 53% M, incl. 13 resilient CHR) 15 HC (25y, 60% M) |
N-back task (0, 1, or 2 back) |
1.5T Signa (GE): T2*-scan (GRE sequence, TR 2s, TE 40ms, FA 90°, 14 axial slices of 3mm, 0.3mm gap); high resolution inversion recovery dataset (TR 1.6s, TE 80ms, TI 180ms); T1-scan (SPGR sequence, TR 0.3s, FA 20°, 128 axial slices of 1.5mm) | Functional images with SPM5; T1-scan with VBM5. Biological Para-metric Mapping for VBM-fMRI inte-gration. Volumes corrected for motion artifacts, no further details. |
2nd-level analysis to test group-effects in task-activation using independent sample t-test, with whole-brain voxel-wise p < .05, FWE-corrected. Pairwise t-tests to explore longitudinal change, assessing effect of functional outcome. | At baseline, CHR showed reduced task-related activation of MFG, SMG and IPL and lower GM volume of middle and medial frontal gyri, insula and ACC. Between baseline and follow-up, CHR showed longitudinal increase in activation of right parahippocampal gyrus and ACC, which was correlated with functional improvement. |
| Choi et al., 2012 [106] | 17 FHR (FDR#, 21y, 53% M) 21 CHR (UHR, 22y, 57% M) 15 SCZ (23y, 53% M) 16 HC (21y, 56% M) |
Spatial delayed-response task | 1.5T Siemens Avanto: functional images (multi-slice EPI, TR 2.34s, TE 41ms, FA 90°, FOV 21cm, 25 axial interleaved slices); T1 scan for co-registration and anatomical localization (176 contiguous axial slices, no other details). | Preprocessing in SPM2; Volumes realigned to correct for interscan movement and stereotactically normalized. |
2-sample t-test for between-group analysis with uncorrected voxel threshold p < .001; cluster size > 15; Correlation analysis with behavioral performance and clinical variables. | FHR showed higher activity of DLPFC (BA9), VLPFC (BA 44) and left thalamus during WM encoding and maintenance. CHR showed a negative correlation between thalamus activity and symptoms. Increased WM-related activation of PFC and thalamus may constitute compensatory mechanism in FHR. |
| Smieskova et al., 2012 [107] | 16 resilient CHR (ARMS-LT, 25y, 69% M) 17 non-resilient CHR (ARMS-ST, 25y, 77% M) 21 SCZ (29y, 76% M) 20 HC (27y, 50% M) |
N-back task (0, 1, and 2-back) | 3T Siemens Magnetom Verio: functional images (EPI sequence, TR 2.5s, TE 28ms, FOV 22.8cm, voxels 3 mm3, 38 slices, 0.5 mm gap; 126 volumes) and T1-scan (MPRAGE, TR 2s, TE 3.4ms, voxels 1mm3, TI 1s) | Processing in SPM8 for functional and VBM8 for structural images; Functional volumes realigned to the first volume and corrected for motion artifacts. | ANCOVA to assess effect of group on task-activation, covarying for age, sex, and voxel-wise GMV; assessing significance as the cluster level using random-field theory (threshold p < .05, FWE-corrected). | Resilient CHR (i.e., CHR-LT) had higher activation of bilateral precuneus and right IFG / insula than SCZ and CHR-ST, with intact N-back performance and reaction times. Insular and IFG activation were associated with GM volumes in these regions in CHR-LT and may thus reflect resilience-related processes. |
| Stäblein et al., 2018 [108] | 22 FHR (FDR, 43y, 36% M) 25 SCZ (37y, 68% M) 25 HC (35y, 48% M) |
Masked change detection task | 3T Siemens Magnetom: T2*-scan (GRE-EPI, TR 2s, TE 30ms, FA 90°, FOV 19.2cm, voxels 3mm3, 30 slices with 0.6mm gap; 456 volumes in 2 runs during 1 session); and T1-scan for co-registration (MPRAGE, 160 sagittal slices, TR 2.25s, TE 2.6ms; FA 9°, FOV 25.6cm, voxels 1mm3) | BrainVoyager QX v2.8.4; 3D head motion correction; datasets with motion exceeding 3 mm in each direction were discarded. | 2nd-level random effects repeated measures ANOVA; statistical maps FDR-corrected with cluster size > 160. voxel threshold p < .01; Monte-Carlo simulation to assess cluster-level type-1 errors with p < .05 false positive rate. |
FHR showed increased right insula and precentral gyrus activity without behavioral deficits and a shift from decreased frontal activity at short intervals to increased activity at longer intervals, suggesting that WM consolidation may be slowed in FHR allowing the deployment of compensatory neuronal resources during encoding to support WM performance. |
| Cognitive Control | ||||||
| Pompei et al., 2011 [109] | 25 healthy FHR (FDR, 35y, 52% M) 14 depressed FHR (FDR, 31y, 36% M) 39 BD (39y, 49% M) 48 HC (36y, 52% M) |
Stroop Color Word Test (SCWT) | 1.5T GE Neuro-optimized Signa: T2* (EPI sequence, TR 3.5s, TE 40ms, FA 90°, voxels 3.75mm2 x 7mm, 18 non-contiguous axial slices, 0.7mm gap); T1 scan (TR 1.8s, TE 5.1ms, TI 450ms, FOV 4x18cm, FA 20°, vox-els 0.9mm2 x 1.5mm) | SPM 5 for preprocessing and PPI analysis during SCWT; motion correction methods not reported. | One-sample t-test random effects analysis (p < .0001 voxel- and p < .05 cluster-thresholds) to compute contrast images from within-group PPI analysis. Interaction between PPI and group to test group-effects. | Alongside putative risk-markers, resilient FHR showed increased decoupling between right VLPFC and bilateral insula and additional coupling between right VLPFC and bilateral DLPFC, hypothesized to reflect adaptive functional change associated with resilience to BD. |
| Emotion recognition / processing | ||||||
| Spilka et al., 2015 [110] | 27 FHR (FDR, 41y, 37% M) 28 SCZ (41y, 54% M) 27 HC (41y, 48% M) |
Passive facial emotion perception task | 3T GE Discovery MR750: fMRI (EPI sequence, TR 2.5s, TE 30ms, FA 77°, FOV 22cm, 40 slices of 3.4mm); T1 scan (TR 7.4ms, TE 3.1ms, TI 650ms, FOV 25.6cm, 236 1mm slices) | FSL v5.0.6 for preprocessing and analysis; motion parameters included as regressors of non-interest. | Subject-specific effects into mixed-effects model, using unpaired t-tests for between-group comparisons, with voxel threshold of z > 2.3 and cluster p < .05, RFT-corrected. | In addition to hypoactivation of face processing areas, FHR showed hyperactivation of frontal emotion processing areas (left triangular IFG and OFC), possibly reflecting compensatory cortical recruitment to maintain intact facial emotion perception. |
| Sepede et al., 2015 [111] | 22 FHR (FDR, 32y, 32% M) 23 BD (35y, 39% M) 24 HC (33y, 33% M) |
IAPS-based emotional task (identifying vegetable items inside neutral or negative pictures) | 1.5T Philips Achieva: T2* (EPI sequence, TR 3s, TE 50ms, FA 90°, voxel size 4mm3, 30 transaxial slices, no gap); T1-scan (3D sequence, TR 25ms, TE 4.7ms, FA 30°, voxels 1mm3) | BrainVoyager QX 2.2 for processing; Motion correction as part of pre-processing, no details provided. |
Group-effects tested with random effect GLM, controlling for performance and mood symptoms, using voxel p < .001 and cluster > 4 to account for multiple comparisons. | BD patients showed reduced accuracy in target detection, while FHR performed similar to HC. Compared to both HC and BD, FHR showed hyperactivation of right LG and reduced activation of right SFG and pre-SMA; may reflect resilience markers. |
| Tseng et al., 2015 [112] | 13 FHR (FDR, 14y, 62% M) 27 BD (14y, 56% M) 37 HC (15y, 43% M) |
Face encoding task | 3T GE: T2* (single-shot EPI-GRE, TR 2s, TE 40ms, FOV 24cm, voxels 3.75mm2, 23 contiguous slices of 5mm); T1 (MPRAGE, TR 11.4ms, TE 4.4ms, TI 300ms, FOV 25.6cm, 180 1-mm sagittal slices) | Preprocessing using SPM8 including motion (no details provided) and slice timing correction, and normalization to MNI space. | Whole-brain ANOVA with group as between-subject variable, using p < .001 (uncorrected) and cluster size > 10; without further mention of multiple comparison. | Both BD and FHR showed hypo-activation of left MFG during correctly vs. incorrectly recognized faces, but BD showed additional hypoactivation while FHR showed hyperactivation of the right parahippocampal gyrus, suggesting a possible compensatory process. |
| Dima et al., 2016 [113] | 25 FHR (FDR, 40y, 54% M) 41 BD (44y, 52% M) 46 HC (40y, 49% M) |
Facial affect-recognition paradigm | 1.5T GE Sigma: T2*-images (no MR sequence reported, TR 2s, TE 40ms, FA 70°, voxels 3.75mm2 x 7.7mm, 450 volumes) and T1-scan (IR-prepped SPGR sequence, TR 18ms, TE 5.1ms, FA 20°, voxels 0.94mm2 x 1.5mm) | SPM8 for preprocessing, conventional fMRI analysis and DCM analysis; no motion correction reported. |
Group-effects tested using ANOVA with symptoms score as covariate, using , FWE-corrected p < .05 and cluster size > 20; ANOVA or Kruskal-Wallis to test DCM output. | During face affect recognition, both BD and FHR showed higher fronto-limbic connectivity, but only FHR showed additional hyperconnectivity between FG and IOG, suggesting additional recruitment in affect-processing network as an adaptive neural response to emotional faces. |
| Welge et al., 2016 [114] | 32 healthy FHR (offspr, 15y, 28% M) 32 depressed FHR (offspr, 14y, 19% M) 32 BD (16y, 41% M) 32 HC (15y, 34% M) |
Continuous performance task with emotional and neutral distractors (CPT-END) | 4.0T Varian Unity INOVA: T2*-images (GRE-EPI, TR 3s, TE 29ms, FOV 20.8cm, FA 75°, 5mm thick slices) and T1-scan for anatomical localization (30 contiguous axial slices of 5mm, no further details) | Preprocessing and analysis in AFNI; small movement corrected via realignment; excessive motion or warped volumes removed. | A Bayesian hierarchical model was used to limit type-1 errors for pairwise comparisons between 4 clinical groups in 16 predefined ROIs. | All FHR showed greater task-related activation in left BA 44 (IFG, opercular part) relative to HC and healthy FHR showed higher activation in right BA 10 (FP) relative to BD and depressed FHR, possibly reflecting a compensatory response relevant to resilience to BD. |
| Spilka and Goghari, 2017 [115] | 27 FHR (FDR, 41y, 37% M) 28 SCZ (41y, 54% M) 27 HC (41y, 48% M) |
Facial emotion discrimination under a target emotion condition; age discrimination task | 3T GE Discovery MR750: T2* (GRE sequence, TR 2.5s, TE 30ms, FOV 22cm, voxels 3.4mm3, 40 interleaved slices, 206 vols); T1 (MPRAGE, TR 7.4ms, TE 3.1ms, FOV 25.6cm, 236 1mm slices) | Preprocessing and analysis in FSL v5.0.6; Time-series plots of estimated head motion were inspected, >3.5 mm excluded. | Between-group comparisons using unpaired non-parametric t-tests, with voxel p < .001 threshold and FWE-corrected p < .05 cluster threshold. | FHR showed higher deactivation of bilateral precuneus and right PCC during age discrimination and of left cuneus during emotion discrimination, possibly reflecting inhibition of internally generated thought to maximize external attention toward task stimuli. |
| Wiggins et al., 2017 [116] | 22 FHR (FDR, 16y, 59% M) 36 BD (18y, 58% M) 41 HC (17y, 51% M) |
Face Emotion Labeling Task (identifying emotions on faces with different intensities of emotions) | 3T GE MR750: fMRI (single-shot EPI-GRE, TR 2.3s, TE 25ms, FA 50°, FOV 24cm, voxel size 2.5mm2 x 2.6mm, 47 contiguous axial slices); T1 scan for spatial normalization (FA 15°, FOV 24cm, 124 axial slices of 1.2mm) | AFNI for processing and mixed model analysis. Motion parameters included in baseline model. TR pairs with >1 mm frame-wise displacement censored. | Whole-brain linear mixed-model with group as between-subjects factor and emotion / intensity as within-subject factors, using voxel p < .005 threshold and cluster ≥ 39, equivalent to FDR-corrected p < .05. | In addition to changes shared with BD (risk markers), FHR showed hyperactivation of bilateral PCC/precuneus, IFG, SFG, temporo-parietal areas, TP/insula and left FG and hypoactivation of left angular gyrus; may reflect increased neural sensitivity to social cues compensating for deficits in executive areas. |
| Nimarko et al., 2019 [117] | 27 resilient FHR (BD offspr, 13y, 56% M) 23 non-resilient FHR (BD offspring, 14y, 30% M) 24 HC (15y, 42% M) |
Implicit emotion perception task (viewing images of happy, fearful, or calm expressions) | 3T GE Signa: fMRI (spiral in-out pulse sequence, TR 2s, TE 30ms, FA 80°, FOV 22cm, 30 axial slices of 4mm, 1 mm gap); T1-scan for normalization (FSPGR sequence, TR 8.5ms, TE 3.32ms, TI 400ms, FA 15°, FOV 25.6cm, 186 axial slices of 1 mm) | FSL Feat; motion correction with MCFLIRT. If mean displacements > 2mm or more than 1/3 of volumes had DVARS values > 75th percentile plus 1.5 times the interquartile range. | Group-effects tested with whole-brain voxel-wise t-tests correcting for age and sex, using voxel threshold z > 2.3 and cluster p < .05, corrected for multiple comparisons. |
Resilient FHR showed right precuneus and left IFG hypoactivation relative to non-resilient FHR, and higher connectivity between left IFG and left MFG, MTG, and insula for fear>calm contrast, and between left IPL and left precuneus/LG, and right SMG and left FG for happy>calm, associated with improved pro-social behavior and functioning. |
| Theory of Mind | ||||||
| Brüne et al., 2011 [118] | 10 CHR$ (26y, 70% M, incl. 1 converter at 1yr follow-up) 22 SCZ (27y, 68% M) 26 HC (29y, 64% M) |
Theory of mind task | 1.5T Siemens Magnetom Symphony: functional images (single-shot EPI, TR 3s, TE 60ms, FOV 22cm, voxels 3.5 x 3mm3, FA 90°, 30 trans-axial slices, 0.3mm gap, 157 scans; T1-scan (MPRAGE, TR 1.8s, TE 3.87ms, FOV 25.6cm, voxels 1mm3, 160 sagittal slices) | Preprocessing and analysis in SPM5, using MarsBaR toolbox to derive ROIs; no motion correction reported. | Second-level analysis to locate ToM regions with uncorrected p < .05 and cluster size > 10. Group-effects in ToM-area activation assessed with two-sample t-test with p < .05 and cluster size > 10. | CHR activated the ToM network (PFC, PCC, and temporoparietal cortex) more strongly than SCZ and (in part) HC. Specifically, CHR showed increased activation of the left IFG, bilateral STG and SMG, left MTG and HG. This may suggest a compensatory overactivation of brain regions critical for empathic responses during mental state attribution. |
| Willert et al., 2015 [119] | 21 FHR (FDR, 31y, 33% M) 24 BD (45y, 50% M) 81 HC (36y, 49% M) |
Theory of mind task | 3T Siemens Trio: functional images (EPI sequence, TR 2s, TE 30ms, FA 80°, FOV 19.2cm, 28 slices of 4mm, 240 volumes) |
Preprocessing in SPM8 with gPPI (generalized form of context-dependent PPI); with 6 regressors modeling head motion included in 1st-level analyses. | ANCOVAs to test activation and connectivity of 4 predefined ROIs corrected for age, sex, education, and task-response, with FWE-correction for number of ROIs. | BD patients showed reduced TPJ activation and reduced fronto-TPJ connectivity, while FHR showed increased activation of right MTG and stronger connectivity between right MTG and MPFC, suggesting compensatory MTG recruitment during mental state attribution in FHR. |
* Reported resilience effects from task-fMRI studies, organized according to task-paradigm. See Table 1 legend for FHR and CHR criteria and abbreviations. The ‘main resilience findings’ column lists regions with putative resilience-effects in bold print. # FHR in Choi et al. (2012) had one first-degree or two second-degree relatives with SCZ. $ The specific risk syndrome in Brüne et al. (2011) was unclear. ARMS-LT/ST = ARMS-Long Term/Short Term, MDD = Major Depressive Disorder. Other abbreviations in supplement.
Table A4.
Resting-state fMRI studies.
| Paper | Participants details | MRI acquisition | MRI analysis | Statistical analysis | Main resilience findings |
|---|---|---|---|---|---|
| Anticevic et al., 2014 [120] | 21 FHR (offspr, 20y, 47% M) 48 SCZ (28y, 44% M, incl. 20 chronic and 28 early-course) 96 HC (29y, 45 % M) |
3T GE Signa HDX: T2*-images (GRE-EPI, TR 2s, TE 30ms, FOV 24cm, 35 axial slices of 3mm, 200 volumes) and T1-scan (FSPGR, TR 7.1ms, TE 3.2ms, FA 13°, FOV 24cm, 176 slices of 1mm, no gap) | FreeSurfer to segment amygdala seed; group comparisons of connectivity seed maps with FSL; rigid-body motion correction, volumes with a single FD > 1 functional voxel were excluded. | 2nd-level ANOVA to assess effects of group, with whole-brain type-1 error correction via threshold-free cluster enhancement using 10000 permutations. | While SCZ patients showed reduced amygdala connectivity with the OFC, FHR showed increased connectivity between the amygdala and a brainstem region around noradrenergic arousal nuclei implicated in stress response, which may reflect either a risk or resilience mechanism in young FHR. |
| Guo et al., 2014 [121] | 28 FHR (sibs, 26y, 54 % M) 28 SCZ (23y, 54% M) 60 HC (27y, 58% M) |
1.5T GE Signa Twinspeed: functional images (GRE-EPI, TR 2s, TE 40ms, FA 90°, FOV 24 cm, 20 transverse slices of 5mm, resolution of 3.75mm2) | Preprocessing using SPM8 and DPARSF; functional scans realigned to the middle volume; head motion parameters were regressed out of the data. | One-way ANOVA for group effects in mean connectivity and distance; connectivity strength of 4005 node-pairs tested using Bonferroni-corrected independent t-tests to localize strongest effects. | FHR and SCZ showed proportional decrease in long-range relative to short-range connectivity, but only FHR showed strengthening of existing long-range links, suggestive of compensatory process. Moreover, FHR showed higher strength of short and long-range salience network, short-range subcortical, and long-range frontal network (trend-level) connections. |
| Doucet et al., 2017 [122] | 64 FHR (sibs, 32y, 42% M) 78 BD (34y, 33% M) 41 HC (33y, 32% M) |
3T Siemens Allegra: T2*-images (single shot GRE-EPI, TR 1.5s, TE 27ms, FOV 24cm, FA 60°, 3.43 x 5mm3 voxel size); T1-scan (MPRAGE, TR 2.2s, TE 4.13ms, TI 766ms, FA 13°, voxel 0.8 mm3) | Preprocessing with SPM12 and REST toolbox; graph analyses with Brain Connectivity Toolbox; average motion regressed from graph metrics. | Permutation analysis to assess group-effects in global connectivity and modularity metrics at FDR-corrected p < .05 and regional degree and participation using p < .05 following permutation testing. | BD and FHR showed lower cohesiveness of sensorimotor network, with associated reduction in integration of DMN regions (MPFC, hippocampus) in BD, while FHR showed increased participation coefficients of ventral ACC, angular gyrus, and SMA and nodal degree of L IFG (orbital part) suggesting possible resilience markers. |
| Duan et al., 2019 [123] | 89 FHR (FDR, 25y, 58% M) 137 SCZ (24y, 39% M) 210 HC (26y, 38% M) |
3T GE Signa HD: functional images (GRE-EPI, TR 2s, TE 30ms, FA 90°, FOV 24cm, 35 slices of 3mm, no gap) | Preprocessing SPM12 and DPARFS; PAGANI toolkit for network reconstruction and analyses; removing subjects with excessive motion (> 3mm or 3°). | ANCOVA to test group-effects, age and sex as covariates, with FDR-corrected p < .05 or voxel-wise p < .001 and p < .05 cluster threshold, with RFT-correction. | SCZ showed increased medium and long-range distance strength of the orbital IFG, while FHR showed reduced distance strength of this region, possibly representing an adaptive response to maintain segregation/integration balance of the functional brain network in FHR. |
| Ganella et al., 2018 [124] | 16 FHR (FDR, 58y, 13% M) 42 SCZ (41y, 70% M, i.e., treatment resistant) 42 HC (39y, 59% M) |
3T Siemens Avanto Magnetom TIM Trio: T2*-images (EPI sequence, TR 2.4s, TE 40ms, voxel size 3.3 x 3.5mm3) and T1-scan (MPRAGE, TR 1.98s, TE 4.3ms, FA 15°, FOV 25cm, 176 sagittal slices of 1mm) | Preprocessing using FSL and SPM8; head motion controlled with Friston 24-parameter model; rs-volumes with FD > 0.5mm excluded. | ANCOVA analysis with age and sex as covariates was used to test each pairwise connection for group-effects, with NBS analysis using a p < .01 primary threshold, and FWE-corrected p < .05 sub-network threshold. | Functional connections showing group-differences were classified as resilience, risk, or illness-related. A minority (~5%) of connections classified as resilience involved mainly reduced connectivity among temporal (i.e., TP) and subcortical regions (posterior cingulum). |
| Guo et al., 2020 [125] | 28 FHR (FDR, 26y, 54% M) 28 SCZ (25y, 54% M) 60 HC (27y, 58% M) |
1.5T GE Signa Twinspeed: functional images (GRE-EPI, TR 2s, TE 40ms, FA 90°, FOV 24cm) and T1-scan (20 contiguous 5-mm thick transverse slices with 1-mm gap) | Preprocessing with SPM8 and DPARSF; variance explained by head-motion differences was removed in primary and secondary correlation analyses. | ANOVA was used to assess group-effects on connectivity and graph metrics, using FDR-correction; with post-hoc pairwise t-tests, correcting for age, sex, and motion effects. | FHR demonstrated greater global functional connectivity diversity than HCs and SCZ, and a higher level of global degree, clustering coefficient, and global efficiency compared to the other groups. |
* Resting-state fMRI studies reporting resilience-associated effects. See Table 1 legend for FHR and CHR criteria. In the ‘main resilience findings’ column, regions associated with putative resilience-effects are in bold print. Other abbreviations in supplement.
Appendix B
Summary of resilience-associated findings in subcortical structures
Multiple studies reported putative resilience-related effects of subcortical areas. These results were not further assessed statistically but are summarized below. Details on individual studies can be found in Tables A1 – A4.
Cerebellum
Several papers implicated the cerebellum in relation to resilience to psychosis. Chang et al. (2016) found increased cerebellar gray matter density, specifically of the anterior and posterior lobes in resilient FHR as compared to HC and schizophrenia patients [94]. In addition, three studies reported larger volumes of the cerebellar vermis in resilient FHR compared to patients and HC [87,88,89].
Corpus Callosum
In addition, resilience-associated changes of the corpus callosum (CC) were observed in two high-risk cohorts: Kim et al. (2012) found increased FA of the genu in first-degree relatives of schizophrenia patients, while patients showed reduced FA of the splenium [103]. Katagiri et al. (2015) reported that resilient CHR individuals showed an increase in FA of the anterior CC from baseline to one-year follow-up that was correlated with improved subthreshold symptoms [103]. In another study in the same cohort, volume increases in the central CC were found to correlate with improvements in negative symptoms [96].
Basal ganglia, thalamus, hippocampus, and amygdala
Appendix C
Figure 1.
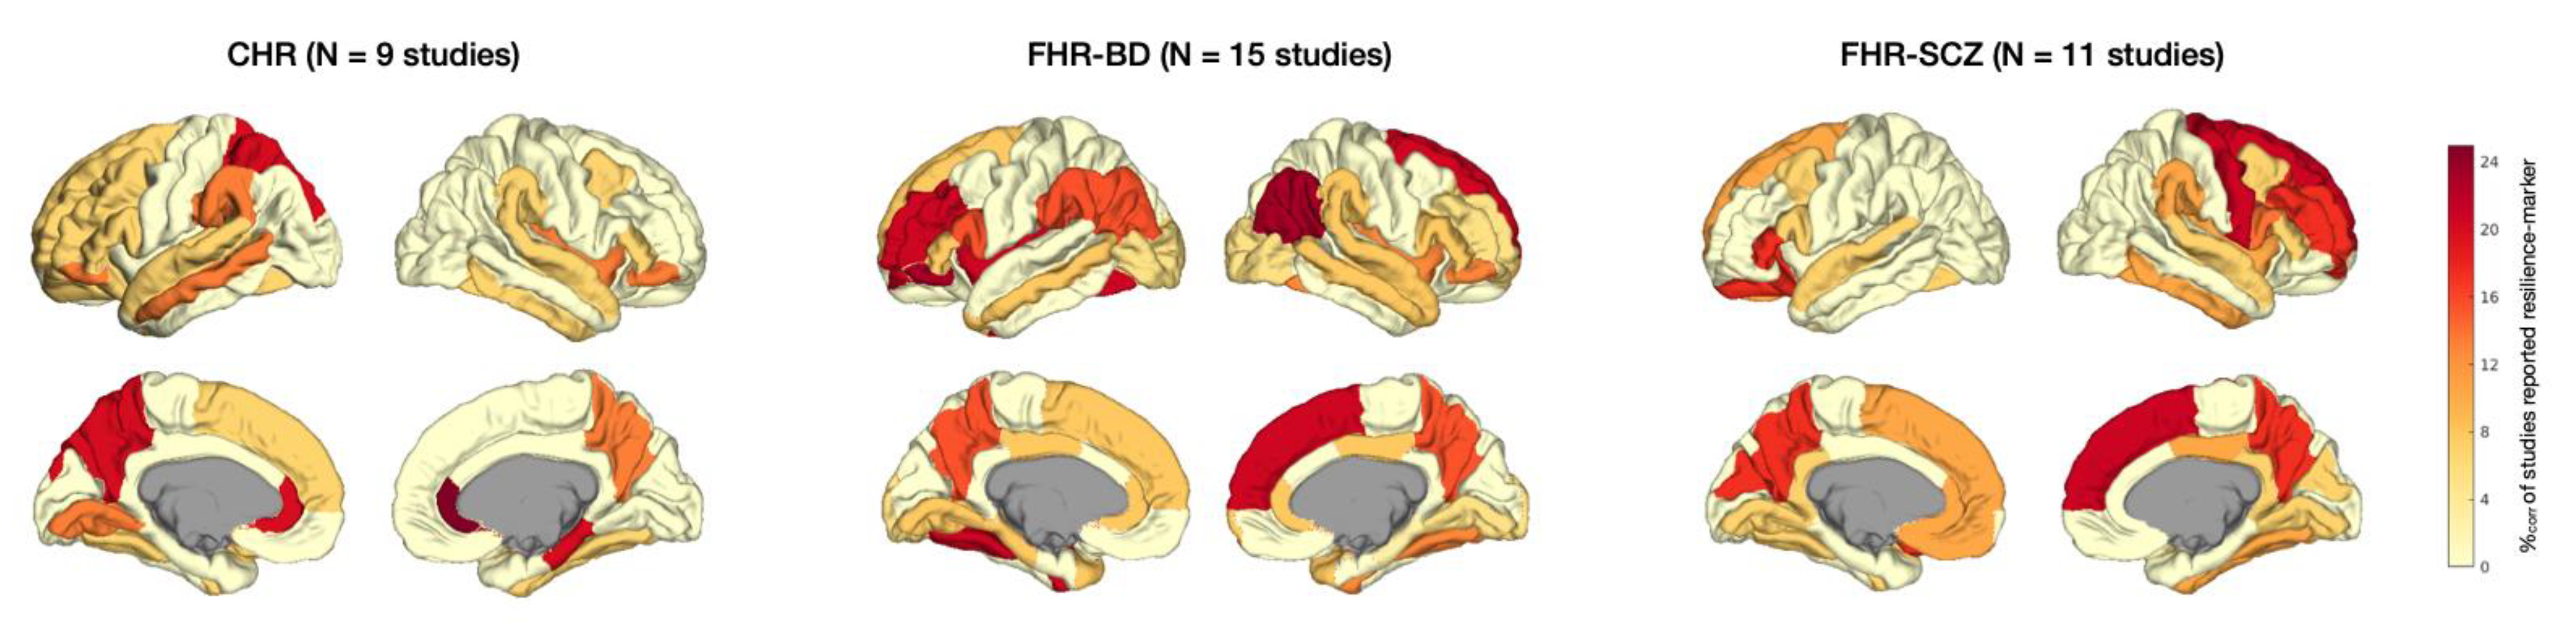
Patterns of resilience-associated finding per type of high-risk group. Cortical plots depicting localization of resilience markers per type of high-risk group: CHR versus FHR for bipolar disorder (FHR-BD) or FHR for schizophrenia (FHR-SCZ). Darker colors indicate more frequent reporting of resilience-associated effects within studies on this high-risk group. %corr = Corrected percentage of studies reporting resilience-associated effects.
Figure 1.
Patterns of resilience-associated finding per type of high-risk group. Cortical plots depicting localization of resilience markers per type of high-risk group: CHR versus FHR for bipolar disorder (FHR-BD) or FHR for schizophrenia (FHR-SCZ). Darker colors indicate more frequent reporting of resilience-associated effects within studies on this high-risk group. %corr = Corrected percentage of studies reporting resilience-associated effects.
References
- R. Newman, “APA’s Resilience Initiative,” Prof Psychol Res Pr, vol. 36, no. 3, pp. 227–229, 2005.
- Psychosis-like experiences and resilience: A systematic and critical review of the literature, “DeLuca JS, Rakhshan Rouhakhtar P, Klaunig MJ, Akouri-Shan L, Jay SY, Todd TL, Sarac C, Andorko ND, Herrera SN, Dobbs MF, Bilgrami ZR, Kline E, Brodsky A, Jespersen R, Landa Y, Corcoran C, Schiffman J,” Psychol Serv, vol. 19, no. Suppl 1, pp. 120–138, 2022.
- G. A. Bonanno, “Loss, Trauma, and Human Resilience: Have We Underestimated the Human Capacity to Thrive After Extremely Aversive Events?,” American Psychologist, vol. 59, no. 1, pp. 20–28, 2004. [CrossRef]
- E. Brodsky and L. B. Cattaneo, “A Transconceptual Model of Empowerment and Resilience: Divergence, Convergence and Interactions in Kindred Community Concepts,” Am J Community Psychol, vol. 52, no. 3–4, pp. 333–346, Dec. 2013. [CrossRef]
- S. S. Luthar, D. Cicchetti, and B. Becker, “The Construct of Resilience: A Critical Evaluation and Guidelines for Future Work,” Child Dev, vol. 71, no. 3, pp. 543–562, 2000.
- S. Masten, “Resilience in individual development: Successful adaptation despite risk and adversity.,” in Educational resilience in inner-city America: Challenges and prospects, M. C. Wang and E. W. Gordon, Eds., Lawrence Erlbaum Associates, Inc., 1994, pp. 3–25.
- M. Ungar and L. Liebenberg, “Assessing Resilience Across Cultures Using Mixed Methods: Construction of the Child and Youth Resilience Measure,” J Mix Methods Res, vol. 5, no. 2, pp. 126–149, Apr. 2011. [CrossRef]
- S. Guimond, S. S. Mothi, C. Makowski, M. M. Chakravarty, and M. S. Keshavan, “Altered amygdala shape trajectories and emotion recognition in youth at familial high risk of schizophrenia who develop psychosis,” Transl Psychiatry, vol. 12, no. 1, p. 202, May 2022. [CrossRef]
- S. Frangou, “Neuroimaging Markers of Risk, Disease Expression, and Resilience to Bipolar Disorder,” Curr Psychiatry Rep, vol. 21:52, 2019.
- T. D. Cannon, “How Schizophrenia Develops: Cognitive and Brain Mechanisms Underlying Onset of Psychosis,” Trends Cogn Sci, vol. 19, no. 12, pp. 744–756, 2015.
- T. D. Cannon et al., “An Individualized Risk Calculator for Research in Prodromal Psychosis,” American Journal of Psychiatry, vol. 173, no. 10, pp. 980–988, Oct. 2016. [CrossRef]
- V. Di Stefano et al., “Decoding Schizophrenia: How AI-Enhanced fMRI Unlocks New Pathways for Precision Psychiatry,” Brain Sci, vol. 14, no. 12, p. 1196, Nov. 2024. [CrossRef]
- N. Caballero, S. Machiraju, A. Diomino, L. Kennedy, A. Kadivar, and K. S. Cadenhead, “Recent Updates on Predicting Conversion in Youth at Clinical High Risk for Psychosis,” Curr Psychiatry Rep, vol. 25, no. 11, pp. 683–698, Nov. 2023. [CrossRef]
- T. Vargas et al., “Neuroimaging Markers of Resiliency in Youth at Clinical High Risk for Psychosis: A Qualitative Review,” Biol Psychiatry Cogn Neurosci Neuroimaging, vol. 6, no. 2, pp. 166–177, Feb. 2021. [CrossRef]
- S. S. Luthar, D. Cicchetti, and B. Becker, “The Construct of Resilience: A Critical Evaluation and Guidelines for Future Work,” Child Dev, vol. 71, no. 3, pp. 543–562, 2000.
- Masten, K. Best, and N. Garmezy, “Resilience and development: Contributions from the study of children who overcome adversity.,” Dev Psychopathol, vol. 2, pp. 425–444, 1990.
- M. Rutter, “Resilience as a dynamic concept,” Dev Psychopathol, vol. 24, pp. 335–344, 2012.
- S. Masten and D. Cicchetti, “Resilience in development: Progress and transformation.,” in Developmental psychopathology. Vol 4., Third Edit., Hoboken, New Jersey: John Wiley & Sons, Inc, 2016, pp. 271–333.
- N. Garmezy, A. S. Masten, and A. Tellegen, “The Study of Stress and Competence in Children: A Building Block for Developmental Psychopathology,” Child Dev, vol. 55, pp. 97–111, 1984.
- M. Rutter, “Resilience in the Face of Adversity. Protective Factors and Resistance to Psychiatric Disorder,” British Journal of Psychiatry, vol. 147, pp. 598–611, 1985.
- S. S. Luthar, E. L. Lyman, and E. J. Crossman, “Resilience and Positive Psychology,” in Handbook of Developmental Psychopathology, Boston, MA: Springer US, 2014, pp. 125–140. [CrossRef]
- N. Garmezy, “Stress, Competence, and Development: Continuities in the Study of Schizophrenic Adults, Children Vulnerable to Psychopathology, and the Search for Stress-Resistant Children,” Am J Orthopsychiatry, vol. 57, no. 2, pp. 159–174, 1987.
- L. L. de Godoy et al., “Understanding brain resilience in superagers: a systematic review,” Neuroradiology, vol. 63, no. 5, pp. 663–683, May 2021. [CrossRef]
- M. Garo-Pascual, C. Gaser, L. Zhang, J. Tohka, M. Medina, and B. A. Strange, “Brain structure and phenotypic profile of superagers compared with age-matched older adults: a longitudinal analysis from the Vallecas Project,” Lancet Healthy Longev, vol. 4, no. 8, pp. e374–e385, Aug. 2023. [CrossRef]
- J. Radua and D. Mataix-Cols, “Meta-analytic methods for neuroimaging data explained,” Biol Mood Anxiety Disord, vol. 2, p. 6, 2012.
- R. Laird et al., “A comparison of label-based review and ALE meta-analysis in the stroop task,” Hum Brain Mapp, vol. 25, no. 1, pp. 6–21, 2005.
- Scarpazza et al., “Systematic review and multi-modal meta-analysis of magnetic resonance imaging findings in 22q11.2 deletion syndrome: Is more evidence needed?,” Neurosci Biobehav Rev, vol. 107, pp. 143–153, 2019.
- Moher, A. Liberati, J. Tetzlaff, and D. G. Altman, “Preferred reporting items for systematic reviews and meta-analyses: the PRISMA statement,” BMJ, vol. 339, p. b2535, 2009.
- T. McGlashan, B. Walsh, and S. Woods, The Psychosis-Risk Syndrome: Handbook for Diagnosis and Follow-up. New York: Oxford University Press, 2010.
- R. Yung et al., “Mapping the onset of psychosis: The Comprehensive Assessment of At-Risk Mental States,” Aust N Z J Psychiatry, vol. 39, pp. 964–971, 2005.
- R. Yung, P. D. McGorry, C. A. McFarlane, H. J. Jackson, G. C. Patton, and A. Rakkar, “Monitoring and Care of Young People at Incipient Risk of Psychosis,” Schizophr Bull, vol. 22, pp. 283–303, 1996.
- J. D. Power, K. A. Barnes, A. Z. Snyder, B. L. Schlaggar, and S. E. Petersen, “Spurious but systematic correlations in functional connectivity MRI networks arise from subject motion,” Neuroimage, vol. 59, pp. 2142–2154, 2012.
- T. D. Satterthwaite et al., “Impact of in-scanner head motion on multiple measures of functional connectivity: Relevance for studies of neurodevelopment in youth,” Neuroimage, vol. 60, pp. 623–632, 2012.
- J. D. Power, B. L. Schlaggar, and S. E. Petersen, “Recent progress and outstanding issues in motion correction in resting state fMRI,” Neuroimage, vol. 15, pp. 536–551, 2015.
- T. B. T. Yeo et al., “The organization of the human cerebral cortex estimated by intrinsic functional connectivity,” J Neurophysiol, vol. 106, no. 3, pp. 1125–1165, Sep. 2011.
- G. Collin, R. Kahn, M. de Reus, W. Cahn, and M. van den Heuvel, “Impaired rich club connectivity in unaffected siblings of schizophrenia patients.,” Schizophr Bull, vol. 40, pp. 438–48, Mar. 2014.
- M. P. Van den Heuvel and O. Sporns, “Rich-club organization of the human connectome.,” J Neurosci, vol. 31, no. 44, pp. 15775–86, Nov. 2011.
- G. Collin, R. Kahn, M. de Reus, W. Cahn, and M. van den Heuvel, “Impaired rich club connectivity in unaffected siblings of schizophrenia patients.,” Schizophr Bull, vol. 40, pp. 438–48, Mar. 2014.
- Groot et al., “Differential effects of cognitive reserve and brain reserve on cognition in Alzheimer disease,” Neurology, vol. 90, pp. e149-156, 2018.
- L.-H. Guo, P. Alexopoulos, S. Wagenpfeil, A. Kurz, and R. Pernecky, “Brain size and the compensation of Alzheimer’s disease symptoms: A longitudinal cohort study,” Alzheimer’s and Dementia, vol. 9, pp. 580–586, 2013.
- S. Negash et al., “Cognitive and functional resilience despite molecular evidence of Alzheimer’s disease pathology,” Alzheimer’s and Dementia, vol. 9, pp. e89-95, 2013.
- E. J. Rogalski et al., “Youthful Memory Capacity in Old Brains: Anatomic and Genetic Clues from the Northwestern SuperAging Project,” J Cogn Neurosci, vol. 25, no. 1, pp. 29–36, 2013.
- M. S. Keshavan et al., “A broad cortical reserve accelerates response to cognitive enhancement therapy in early course schizophrenia,” Schizophr Res, vol. 130, no. 1–3, pp. 123–129, 2011.
- L. D. Selemon and N. Zecevic, “Schizophrenia: a tale of two critical periods for prefrontal cortical development,” Transl Psychiatry, vol. 5, pp. e623-11, 2015.
- M. S. Keshavan, U. M. Mehta, J. L. Padmanabhan, and J. Shah, “Dysplasticity, metaplasticity, and schizophrenia: Implications for risk, illness, and novel interventions,” Dev Psychopathol, vol. 27, pp. 615–635, 2015.
- J. Grafman, “Conceptualizing functional neuroplasticity,” J Commun Disord, vol. 33, no. 4, pp. 345–356, 2000.
- S. Whitfield-Gabrieli et al., “Hyperactivity and hyperconnectivity of the default network in schizophrenia and in first-degree relatives of persons with schizophrenia,” PNAS, vol. 106, pp. 1279–1284, 2009.
- S. Whitfield-Gabrieli and J. M. Ford, “Default mode network activity and connectivity in psychopathology,” Annu Rev Clin Psychol, vol. 8, pp. 49–76, 2012.
- S. L. Fryer et al., “Deficient suppression of default mode regions during working memory in individuals with early psychosis and at clinical high-risk for psychosis,” Front Psychiatry, vol. 4, pp. 1–17, 2013.
- H. Wang, L. L. Zeng, Y. Chen, H. Yin, Q. Tan, and D. Hu, “Evidence of a dissociation pattern in default mode subnetwork functional connectivity in schizophrenia,” Sci Rep, vol. 5, p. 14655, 2015.
- M. L. Hu et al., “A Review of the Functional and Anatomical Default Mode Network in Schizophrenia,” Neurosci Bull, vol. 33, pp. 73–84, 2017.
- E. Rodríguez-Cano et al., “Differential failure to deactivate the default mode network in unipolar and bipolar depression,” Bipolar Disord, vol. 19, pp. 386–395, 2017.
- H. Lee, D. Lee, K. Park, C. Kim, and S. Ryu, “Default mode network connectivity is associated with long-term clinical outcome in patients with schizophrenia,” NeuroImage Clin, vol. 22, p. 101805, 2019.
- G. Collin et al., “Brain Functional Connectivity Data Enhance Prediction of Clinical Outcome in Youth at Risk for Psychosis.,” Neuroimage Clin, vol. 26, p. 102108, 2020.
- Z. Kasanova et al., “Early-Life Stress Affects Stress-Related Prefrontal Dopamine Activity in Healthy Adults, but Not in Individuals with Psychotic Disorder,” PLoS One, vol. 11, no. 3, p. e0150746, 2016.
- R. S. Prakash et al., “Mindfulness Meditation and Network Neuroscience: Review, Synthesis, and Future Directions,” Biol Psychiatry Cogn Neurosci Neuroimaging, Nov. 2024. [CrossRef]
- S. Whitfield-Gabrieli et al., “Hyperactivity and hyperconnectivity of the default network in schizophrenia and in first-degree relatives of persons with schizophrenia,” PNAS, vol. 106, pp. 1279–1284, 2009.
- N. R. DeTore et al., “Efficacy of a transdiagnostic, prevention-focused program for at-risk young adults: a waitlist-controlled trial,” Psychol Med, vol. 53, no. 8, pp. 3490–3499, Jun. 2023. [CrossRef]
- C. C. Bauer et al., “Real-time fMRI neurofeedback reduces auditory hallucinations and modulates resting state connectivity of involved brain regions: Part 2: Default mode network -preliminary evidence,” Psychiatry Res, vol. 284, p. 112770, 2020.
- R. Hadar et al., “Early neuromodulation prevents the development of brain and behavioral abnormalities in a rodent model of schizophrenia,” Mol Psychiatry, vol. 23, no. 4, pp. 943–951, Apr. 2018. [CrossRef]
- H. B. M. Boos et al., “Tract-based diffusion tensor imaging in patients with schizophrenia and their non-psychotic siblings,” Eur Neuropsychopharmacol, vol. 23, pp. 295–304, 2013.
- M. Catani and M. Mesulam, “The arcuate fasciculus and the disconnection theme in language and aphasia: History and current state.,” Cortex, vol. 44, pp. 953–961, 2009.
- M. A. Skeide, J. Brauer, and A. D. Friederici, “Brain Functional and Structural Predictors of Language Performance,” Cereb Cortex, vol. 26, pp. 2127–2139, 2016.
- M. F. Glasser and J. K. Rilling, “DTI Tractography of the Human Brain’s Language Pathways,” Cereb Cortex, vol. 18, pp. 2471–2482, 2008.
- Hubl et al., “Pathways that make voices: White matter changes in auditory hallucinations,” Arch Gen Psychiatry, vol. 61, no. 7, pp. 658–668, Jul. 2004.
- L. Q. Uddin, “Cognitive and behavioural flexibility: neural mechanisms and clinical considerations,” Nat Rev Neurosci, vol. 22, no. 3, pp. 167–179, Mar. 2021. [CrossRef]
- N. Calvo, J. A. E. Anderson, M. Berkes, M. Freedman, F. I. M. Craik, and E. Bialystok, “Gray Matter Volume as Evidence for Cognitive Reserve in Bilinguals With Mild Cognitive Impairment,” Alzheimer Dis Assoc Disord, vol. 37, no. 1, pp. 7–12, Jan. 2023. [CrossRef]
- M. P. van den Heuvel and O. Sporns, “Rich-Club Organization of the Human Connectome,” J. Neurosci., vol. 31, pp. 15775–15786, Nov. 2011.
- G. Collin and M. S. Keshavan, “Connectome development and a novel extension to the neurodevelopmental model of schizophrenia,” Dialogues Clin Neurosci, vol. 20, no. 2, pp. 101–110, 2018.
- M. P. van den Heuvel, R. S. Kahn, J. Goñi, and O. Sporns, “High-cost, high-capacity backbone for global brain communication,” PNAS, vol. 109, no. 28, pp. 11372–11377, Jul. 2012.
- M. P. van den Heuvel and O. Sporns, “An Anatomical Substrate for Integration among Functional Networks in Human Cortex,” J. Neurosci., vol. 33, no. 36, pp. 14489–14500, Sep. 2013.
- M. A. de Reus and M. P. van den Heuvel, “Simulated rich club lesioning in brain networks: a scaffold for communication and integration?,” Front Hum Neurosci, vol. 8, pp. 1–5, Aug. 2014.
- M. P. Van den Heuvel et al., “Abnormal rich club organization and functional brain dynamics in schizophrenia.,” JAMA Psychiatry, vol. 70, pp. 783–92, Aug. 2013.
- G. Collin, L. H. Scholtens, R. S. Kahn, M. H. J. Hillegers, and M. P. van den Heuvel, “Affected Anatomical Rich Club and Structural-Functional Coupling in Young Offspring of Schizophrenia and Bipolar Disorder Patients,” Biol Psychiatry, vol. 82, pp. 746–755, 2017.
- M. Hafeman, K. D. Chang, A. S. Garrett, E. M. Sanders, and M. L. Phillips, “Effects of medication on neuroimaging findings in bipolar disorder: an updated review,” Bipolar Disord, vol. 14, no. 4, pp. 375–410, Jun. 2012. [CrossRef]
- R. B. Sassi et al., “Increased gray matter volume in lithium-treated bipolar disorder patients,” Neurosci Lett, vol. 329, no. 2, pp. 243–245, Aug. 2002. [CrossRef]
- M. Keshavan, S. Anderson, and J. Pettegrew, “Changes in caudate volume with neuroleptic treatment,” The Lancet, vol. 344, no. 8934, p. 1434, Nov. 1994. [CrossRef]
- S. Chopra et al., “Differentiating the effect of antipsychotic medication and illness on brain volume reductions in first-episode psychosis: A Longitudinal, Randomised, Triple-blind, Placebo-controlled MRI Study,” Neuropsychopharmacology, vol. 46, no. 8, pp. 1494–1501, Jul. 2021. [CrossRef]
- N. D. Orlov et al., “Real-time fMRI neurofeedback to down- regulate superior temporal gyrus activity in patients with schizophrenia and auditory hallucinations: a proof-of-concept study,” Transl Psychiatry, vol. 4, p. 46, 2018.
- C. C. C. Bauer et al., “Real-time fMRI neurofeedback reduces auditory hallucinations and modulates resting state connectivity of involved brain regions: Part 2: Default mode network -preliminary evidence,” Psychiatry Res, vol. 284, p. 112770, 2020.
- T. Gupta, N. J. Kelley, A. Pelletier-baldelli, and V. A. Mittal, “Transcranial Direct Current Stimulation, Symptomatology, and Cognition in Psychosis: A Qualitative Review,” Front Behav Neurosci, vol. 12, pp. 1–10, 2018.
- N. Garmezy, “Children at risk: the search for the antecedents of schizophrenia, part II: Ongoing research programs, issues, and intervention,” Schizophr Bull, vol. 1, no. 9, pp. 55–125, 1974.
- Fornito et al., “Anatomic Abnormalities of the Anterior Cingulate Cortex Before Psychosis Onset: An MRI Study of Ultra-High-Risk Individuals,” Biol Psychiatry, vol. 64, no. 9, pp. 758–765, Nov. 2008.
- P. Habets et al., “Cognitive Performance and Grey Matter Density in Psychosis: Functional Relevance of a Structural Endophenotype,” Neuropsychobiol, vol. 58, pp. 128–137, 2008.
- M. J. Kempton, M. Haldane, J. Jogia, P. M. Grasby, D. Collier, and S. Frangou, “Dissociable Brain Structural Changes Associated with Predisposition, Resilience, and Disease Expression in Bipolar Disorder,” J Neurosci, vol. 29, no. 35, pp. 10863–10868, 2009.
- D. Greenstein et al., “Cerebellar development in childhood onset schizophrenia and non-psychotic siblings,” Psychiatry Res Neuroimaging, vol. 193, no. 3, pp. 131–137, Sep. 2011.
- S. Frangou, “Brain structural and functional correlates of resilience to Bipolar Disorder,” Front Hum Neurosci, vol. 5, p. Article 184, 2012.
- T. G. M. van Erp et al., “Hippocampal morphology in lithium and non-lithium-treated bipolar I disorder patients, non-bipolar co-twins, and control twins,” Hum Brain Mapp, vol. 33, no. 3, pp. 501–510, Mar. 2012.
- C. Eker et al., “Brain regions associated with risk and resistance for bipolar I disorder: a voxel-based MRI study of patients with bipolar disorder and their healthy siblings.,” Bipolar Disord, vol. 16, pp. 249–61, 14. 20 May.
- M. M. Chakravarty et al., “Striatal Shape Abnormalities as Novel Neurodevelopmental Endophenotypes in Schizophrenia : A Longitudinal Study,” Hum Brain Mapp, vol. 1469, pp. 1458–1469, 2015.
- V. M. Goghari, W. Truong, and M. J. Spilka, “A magnetic resonance imaging family study of cortical thickness in schizophrenia.,” American journal of medical genetics. Part B, Neuropsychiatric genetics, vol. 168, no. 8, pp. 660–8, Dec. 2015.
- Sariçiçek et al., “Neuroanatomical correlates of genetic risk for bipolar disorder: A voxel-based morphometry study in bipolar type I patients and healthy first degree relatives,” J Affect Disord, vol. 186, pp. 110–118, 2015.
- Zalesky et al., “Delayed Development of Brain Connectivity in Adolescents With Schizophrenia and Their Unaffected Siblings,” JAMA Psychiatry, vol. 72, pp. 900–908, 2015.
- M. Chang et al., “Voxel-based morphometry in individuals at genetic high risk for schizophrenia and patients with schizophrenia during their first episode of psychosis,” PLoS One, vol. 11, no. 10, Oct. 2016.
- S. de Wit et al., “Brain development in adolescents at ultra-high risk for psychosis: Longitudinal changes related to resilience,” Neuroimage Clin, vol. 12, pp. 542–549, 2016.
- N. Katagiri et al., “Symptom recovery and relationship to structure of corpus callosum in individuals with an ‘at risk mental state,’” Psychiatry Res Neuroimaging, vol. 272, pp. 1–6, Feb. 2018.
- N. Katagiri et al., “A longitudinal study investigating sub-threshold symptoms and white matter changes in individuals with an ‘at risk mental state’ (ARMS),” Schizophr Res, vol. 162, no. 1–3, pp. 7–13, Mar. 2015.
- N. Yalin et al., “Clinical Cortical thickness and surface area as an endophenotype in bipolar disorder type I patients and their first-degree relatives,” NeuroImage Clin, vol. 22, p. 101695, 2019.
- S. W. McGlashan, T.H., Miller, T.J., Woods, “Structured Interview for Prodromal Syn- dromes (SIPS) — Version 3.0.,” PRIME Research Clinic, Yale School of Medicine, New Haven., 2001.
- M. J. Hoptman et al., “A DTI study of white matter microstructure in individuals at high genetic risk for schizophrenia.,” Schizophr Res, vol. 106, no. 2–3, pp. 115–24, Dec. 2008.
- S. N. Kim et al., “Increased white matter integrity in the corpus callosum in subjects with high genetic loading for schizophrenia,” Prog Neuropsychopharmacol Biol Psychiatry, vol. 37, no. 1, pp. 50–55, Apr. 2012.
- V. M. Goghari, T. Billiet, S. Sunaert, and L. Emsell, “A diffusion tensor imaging family study of the fornix in schizophrenia,” Schizophr Res, vol. 159, no. 2–3, pp. 435–440, Nov. 2014.
- N. Katagiri et al., “A longitudinal study investigating sub-threshold symptoms and white matter changes in individuals with an ‘at risk mental state’ (ARMS),” Schizophr Res, vol. 162, no. 1–3, pp. 7–13, 2015.
- P. Fusar-Poli et al., “Spatial working memory in individuals at high risk for psychosis: Longitudinal fMRI study,” Schizophr Res, vol. 123, no. 1, pp. 45–52, 2010.
- P. Fusar-Poli et al., “Altered brain function directly related to structural abnormalities in people at ultra high risk of psychosis: longitudinal VBM-fMRI study.,” J Psychiatr Res, vol. 45, no. 2, pp. 190–8, Feb. 2011.
- J. S. Choi et al., “Phase-specific brain change of spatial working memory processing in genetic and ultra-high risk groups of schizophrenia,” Schizophr Bull, vol. 38, no. 6, pp. 1189–1199, 2012.
- R. Smieskova et al., “Different duration of at-risk mental state associated with neurofunctional abnormalities. A multimodal imaging study,” Hum Brain Mapp, vol. 33, no. 10, pp. 2281–2294, Oct. 2012.
- M. Stäblein et al., “Visual working memory encoding in schizophrenia and first-degree relatives: neurofunctional abnormalities and impaired consolidation,” Psychol Med, vol. 49, no. 01, pp. 75–83, 2018.
- Dima, K. Rubia, V. Kumari, and S. Frangou, “Dissociable functional connectivity changes during the Stroop task relating to risk, resilience and disease expression in bipolar disorder,” Neuroimage, vol. 57, no. 2, pp. 576–582, 2011.
- M. J. Spilka, A. E. Arnold, and V. M. Goghari, “Functional activation abnormalities during facial emotion perception in schizophrenia patients and nonpsychotic relatives,” Schizophr Res, vol. 168, no. 1–2, pp. 330–337, 2015.
- Sepede et al., “Neural correlates of negative emotion processing in bipolar disorder,” Prog Neuro-Psychopharmacol Biol Psychiatry, vol. 60, pp. 1–10, 2015.
- W. Tseng et al., “An fMRI study of emotional face encoding in youth at risk for bipolar disorder,” European Psychiatry, vol. 30, no. 1, pp. 94–98, 2015.
- D. Dima, R. E. Roberts, and S. Frangou, “Connectomic markers of disease expression, genetic risk and resilience in bipolar disorder,” Transl Psychiatry, vol. 6, no. 1, pp. e706-7, 2016.
- J. A. Welge et al., “Neurofunctional Differences Among Youth With and at Varying Risk for Developing Mania,” J Am Acad Child Adolesc Psychiatry, vol. 55, no. 11, pp. 980–989, 2016.
- M. J. Spilka and V. M. Goghari, “Similar patterns of brain activation abnormalities during emotional and non-emotional judgments of faces in a schizophrenia family study,” Neuropsychologia, vol. 96, pp. 164–174, 2017.
- J. L. Wiggins et al., “Neural Markers in Pediatric Bipolar Disorder and Familial Risk for Bipolar Disorder,” J Am Acad Child Adolesc Psychiatry, vol. 56, no. 1, pp. 67–78, 2017.
- F. Nimarko, A. S. Garrett, G. A. Carlson, and M. K. Singh, “Neural correlates of emotion processing predict resilience in youth at familial risk for mood disorders,” Dev Psychopathol, vol. 31, pp. 1037–1052, 19. 20 May.
- M. Brüne et al., “An fMRI study of ‘theory of mind’ in at-risk states of psychosis: comparison with manifest schizophrenia and healthy controls.,” Neuroimage, vol. 55, no. 1, pp. 329–37, Mar. 2011.
- Willert et al., “Alterations in neural Theory of Mind processing in euthymic patients with bipolar disorder and unaffected relatives.,” Bipolar Disord, vol. 17, no. 8, pp. 880–91, Dec. 2015.
- Anticevic et al., “Amygdala connectivity differs among chronic, early course, and individuals at risk for developing schizophrenia.,” Schizophr Bull, vol. 40, no. 5, pp. 1105–16, Sep. 2014.
- S. Guo, L. Palaniyappan, B. Yang, Z. Liu, Z. Xue, and J. Feng, “Anatomical distance affects functional connectivity in patients with schizophrenia and their siblings.,” Schizophr Bull, vol. 40, no. 2, pp. 449–59, Mar. 2014.
- E. Doucet, D. S. Bassett, N. Yao, D. C. Glahn, and S. Frangou, “The Role of Intrinsic Brain Functional Connectivity in Vulnerability and Resilience to Bipolar Disorder,” Am J Psychiatry, vol. 174, pp. 1214–1222, 2017.
- Duan et al., “Dynamic changes of functional segregation and integration in vulnerability and resilience to schizophrenia,” Hum Brain Mapp, vol. 40, no. 7, pp. 2200–2211, May 2019.
- E. P. Ganella et al., “Risk and resilience brain networks in treatment-resistant schizophrenia,” Schizophr Res, vol. 193, pp. 284–292, 2018.
- S. Guo, N. He, Z. Liu, Z. Linli, H. Tao, and L. Palaniyappan, “Brain-Wide Functional Dysconnectivity in Schizophrenia: Parsing Diathesis, Resilience, and the Effects of Clinical Expression,” The Canadian Journal of Psychiatry, vol. 65, pp. 21–29, 2020.
Figure 1.
Flow chart. Flowchart of systematic search and selection procedure. Records excluded after full-text evaluation are listed in Supplementary Materials (Table S5).
Figure 1.
Flow chart. Flowchart of systematic search and selection procedure. Records excluded after full-text evaluation are listed in Supplementary Materials (Table S5).
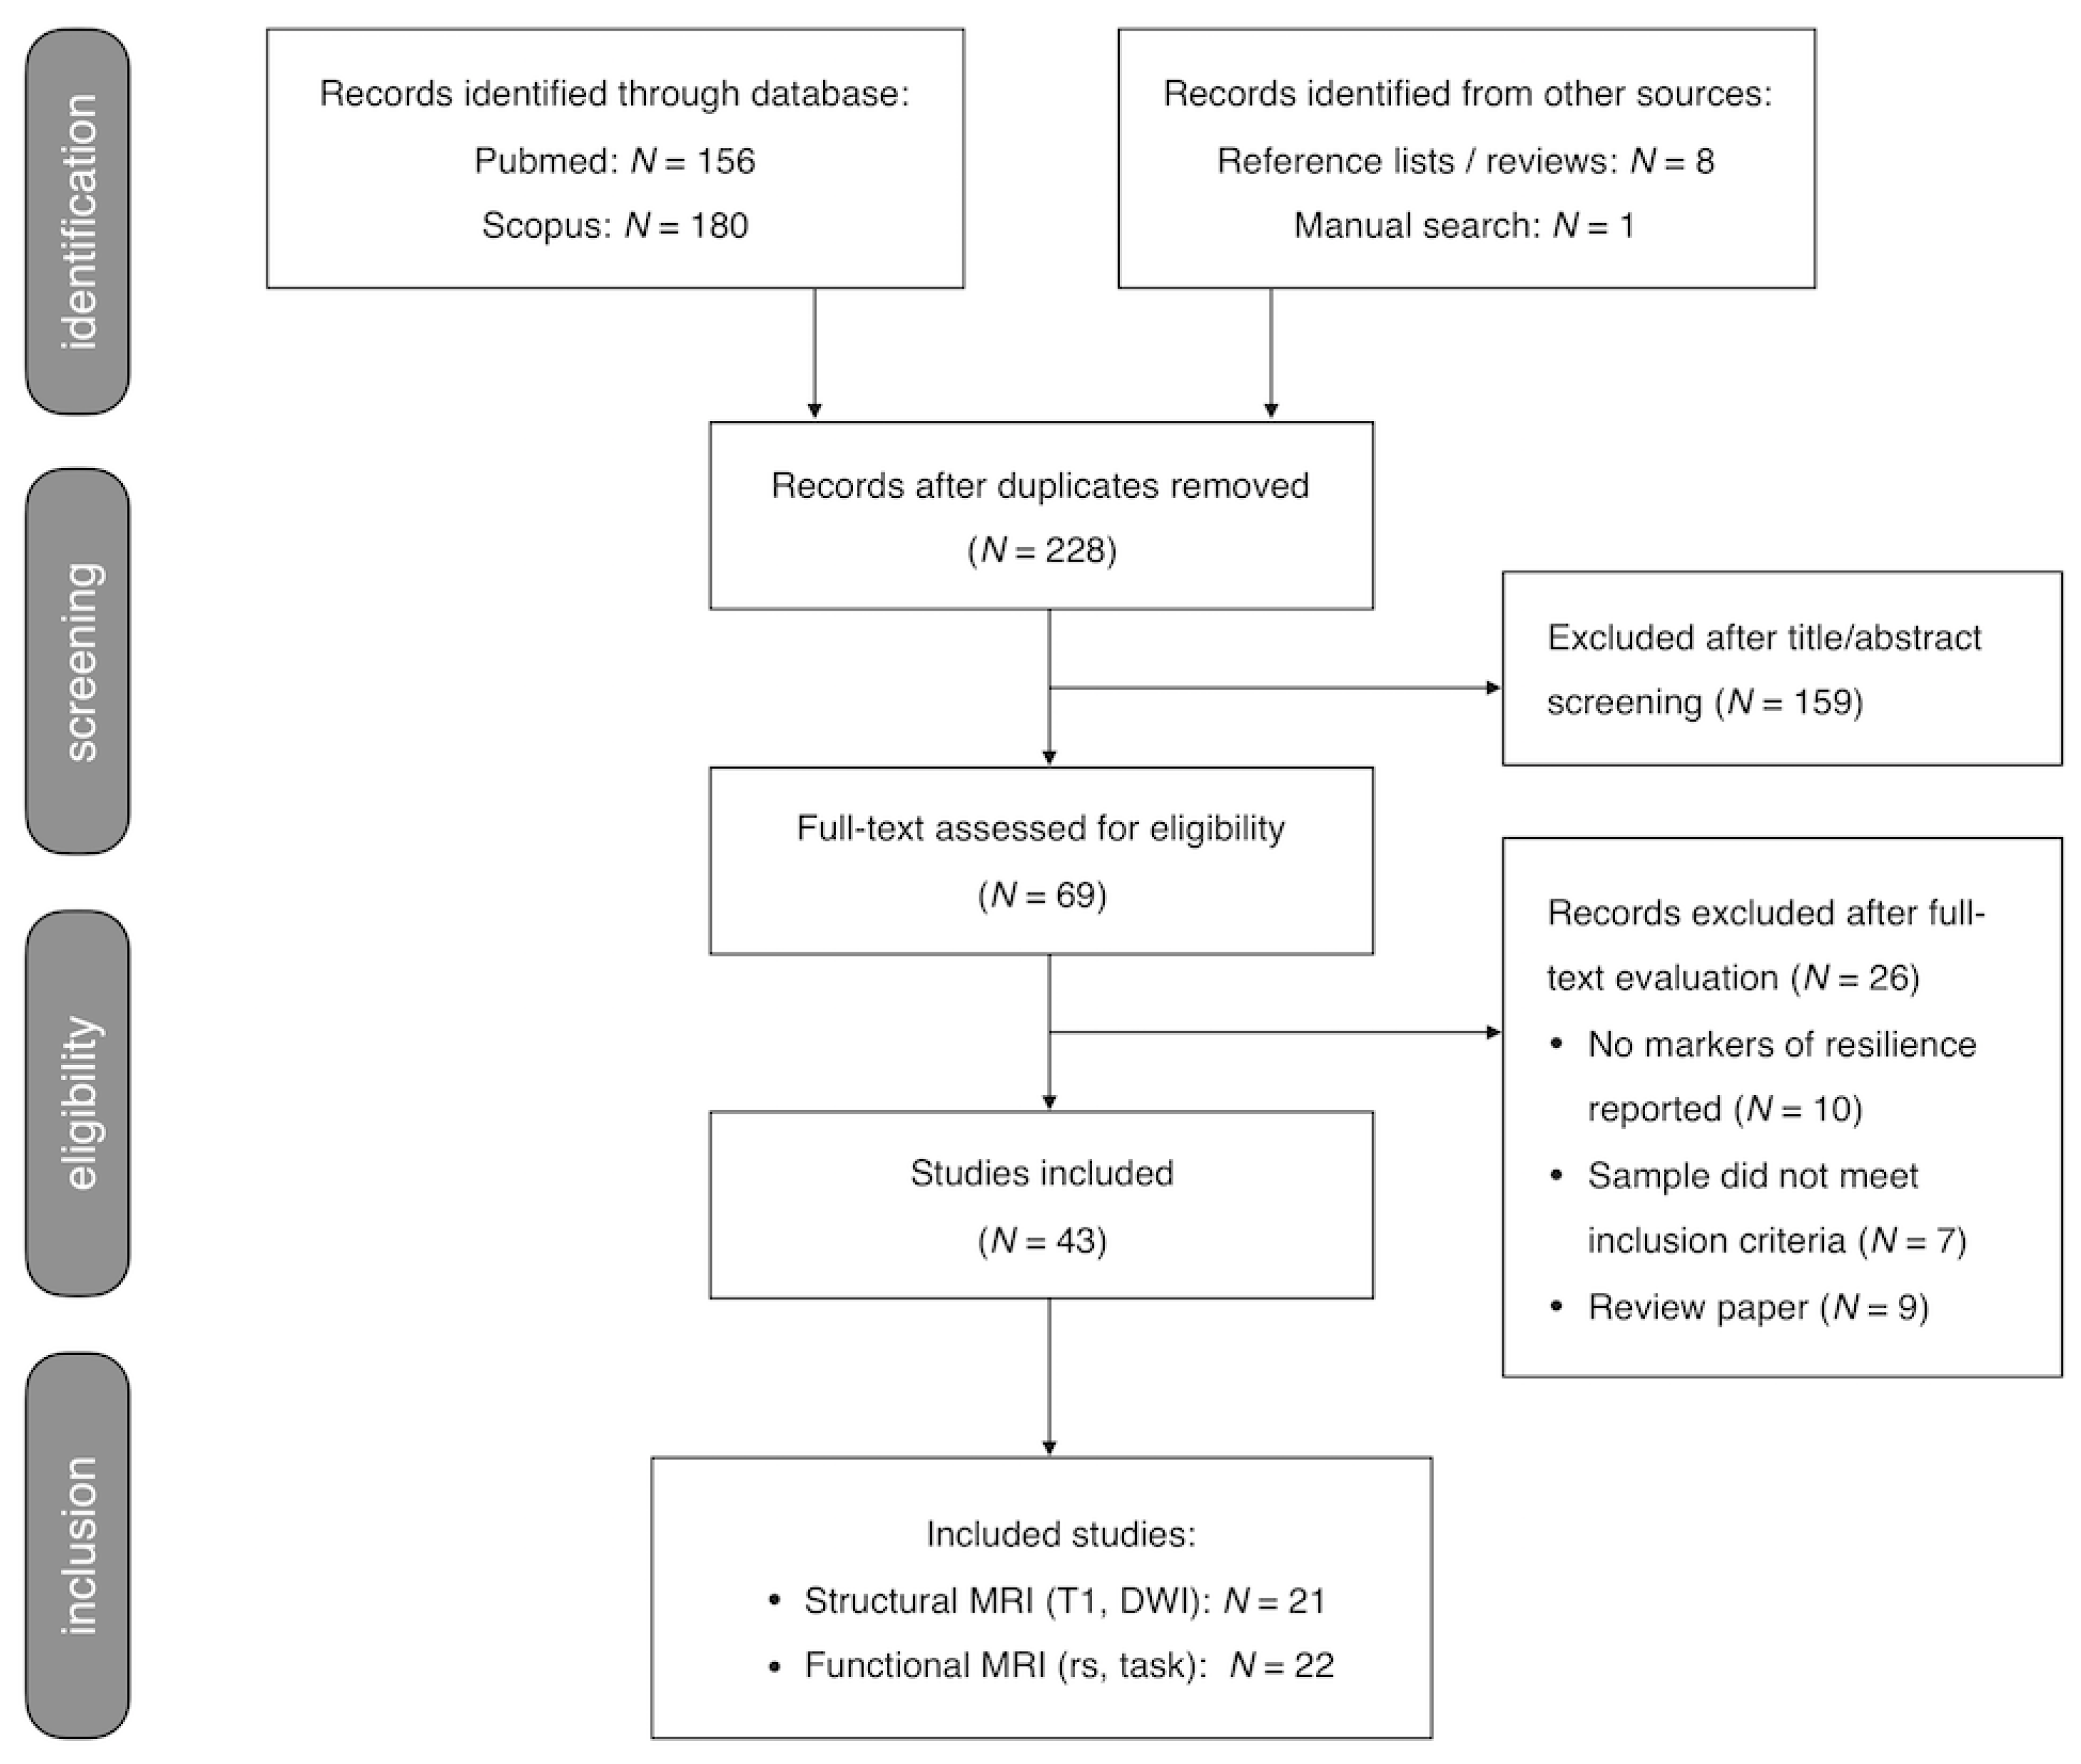
Figure 2.
Definition of resilience markers. Resilience markers were operationalized as MRI markers showing unique differences in HR individuals as compared to patients and HC (A) (as opposed to MRI changes shared between patients and HR or between HC and HR) or showing correlations with positive outcomes such as improvements in symptoms and functioning in HR cohorts (B). HR includes both CHR and FHR individuals; HC = Healthy Controls; HR = High-Risk (i.e., either CHR or FHR); PAT = Patients.
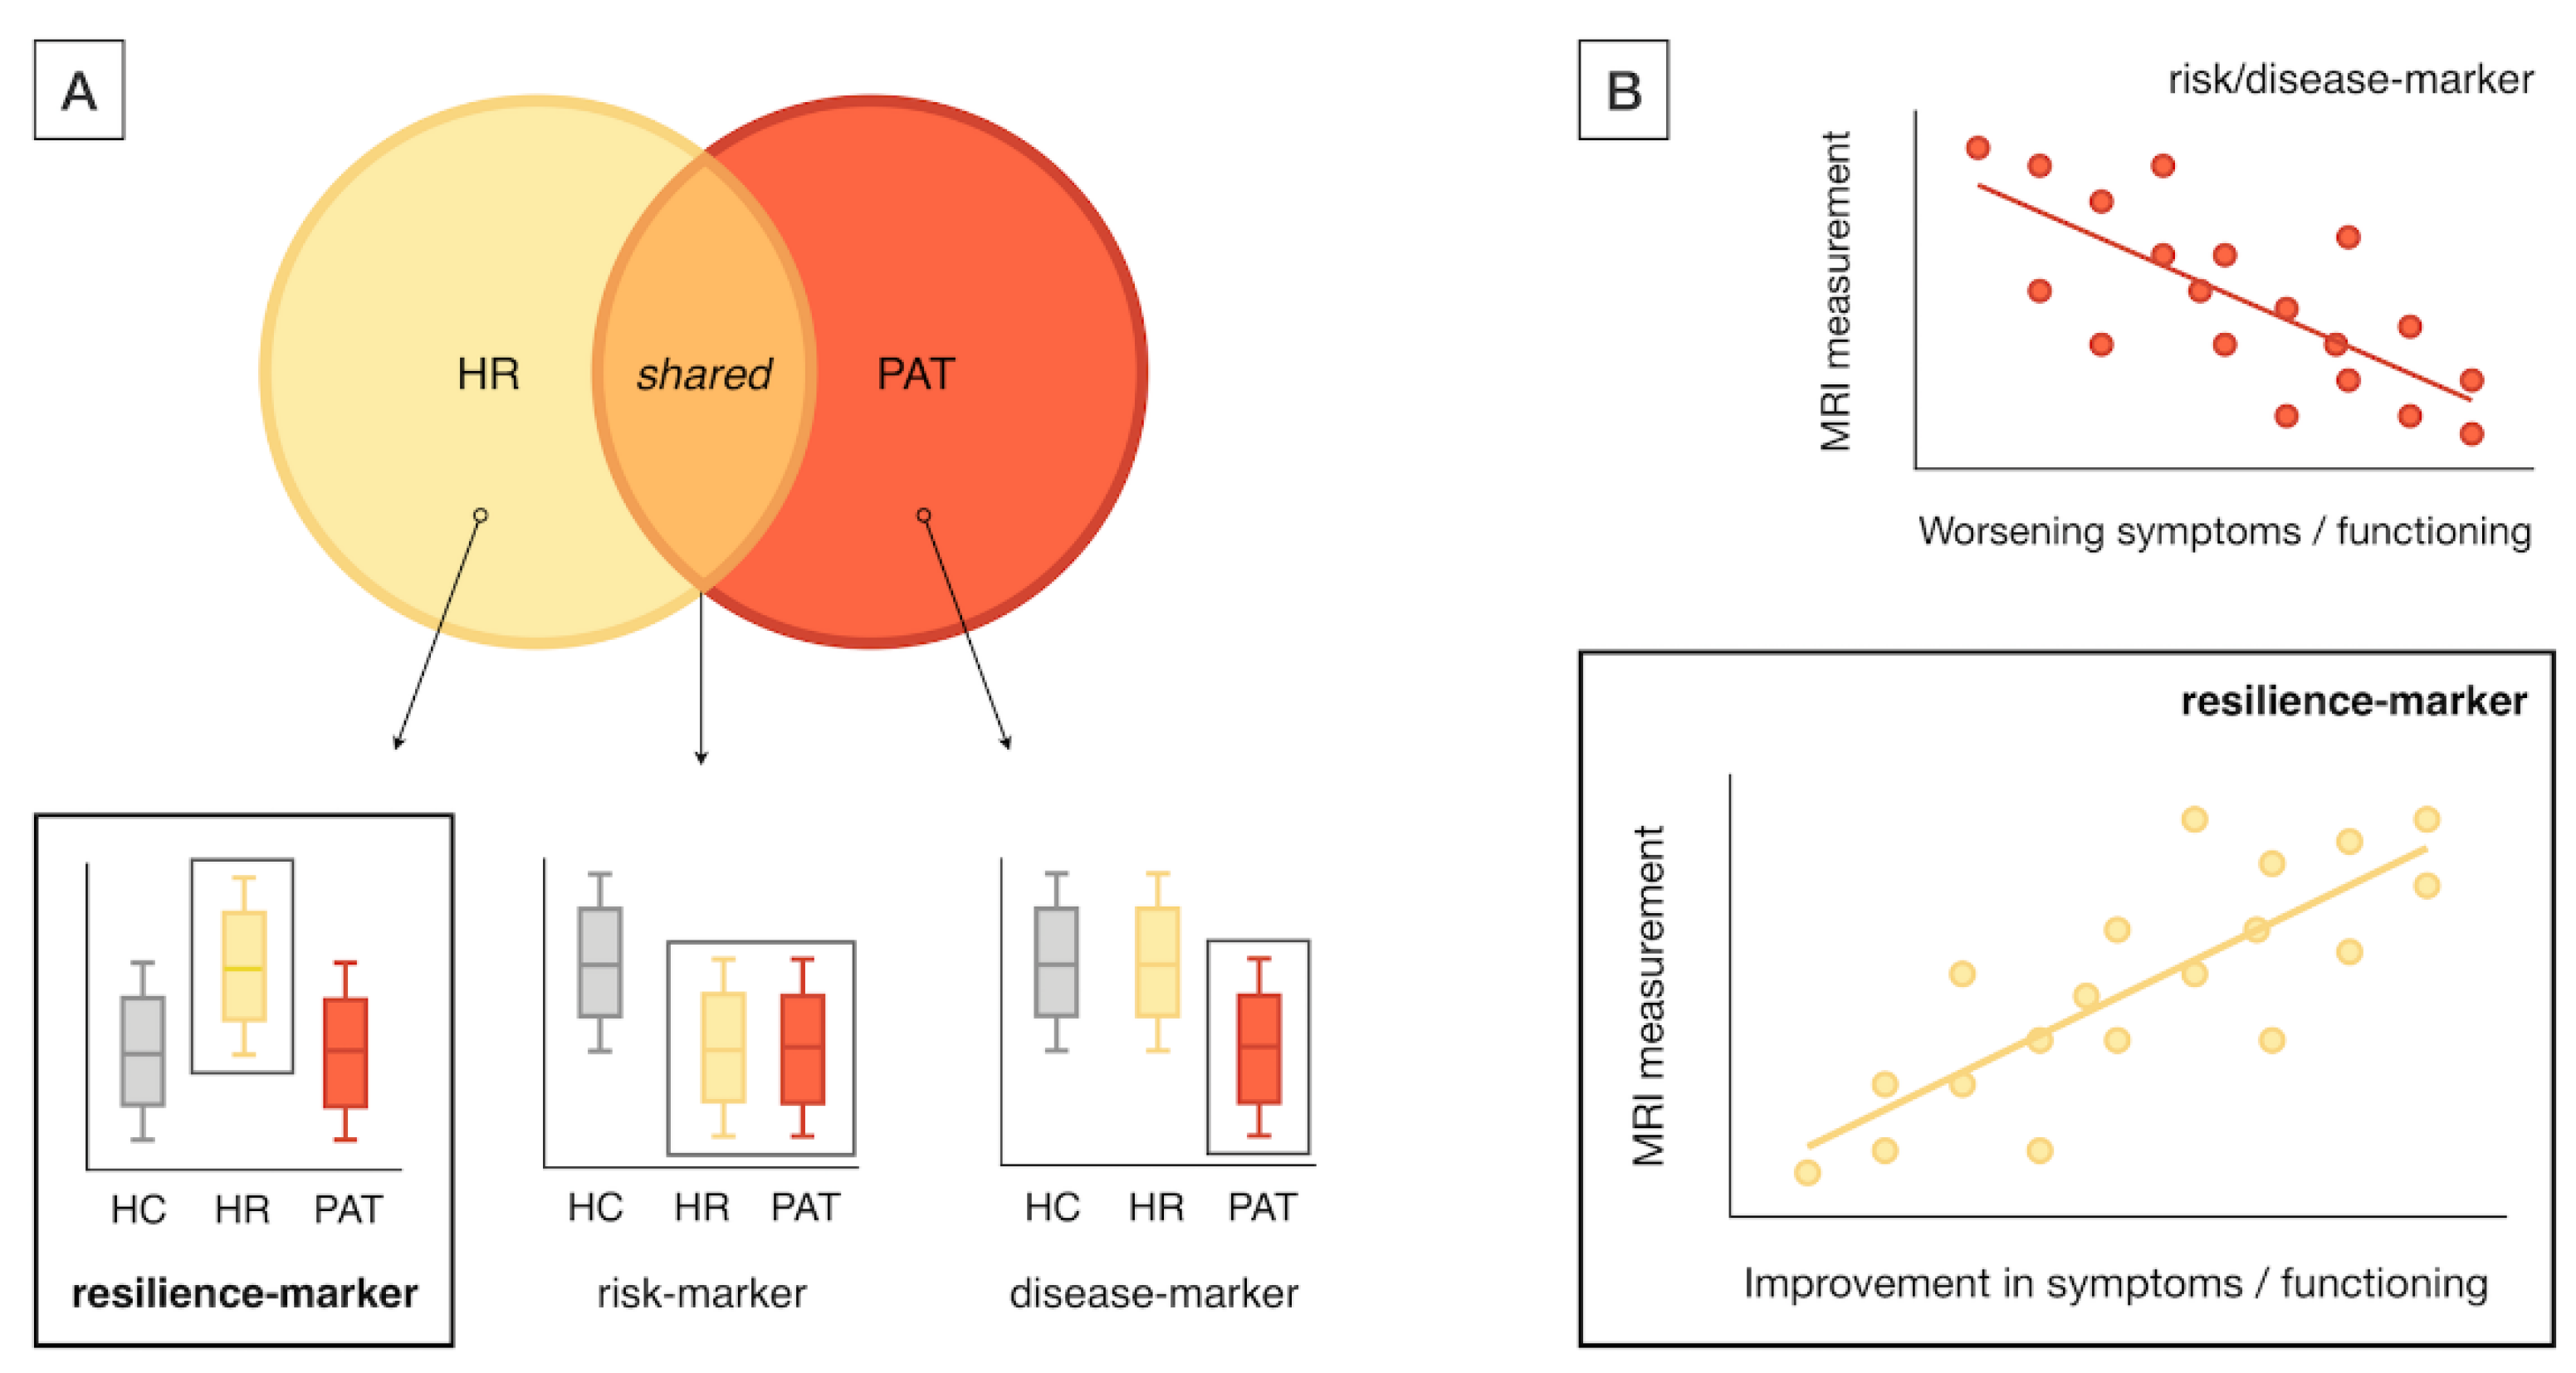
Figure 3.
Regional localization of multimodal MRI markers of resilience. Cortical plots depicting localization of resilience markers, across all included studies. Darker colors indicate more frequent reporting in literature as showing resilience-related effects. Regions marked by name were overrepresented among resilience effects (p < .05, permutation-testing, non-FDR significant). %corr = Corrected percentage of studies reporting region-specific effects; IFG = Inferior Frontal Gyrus.
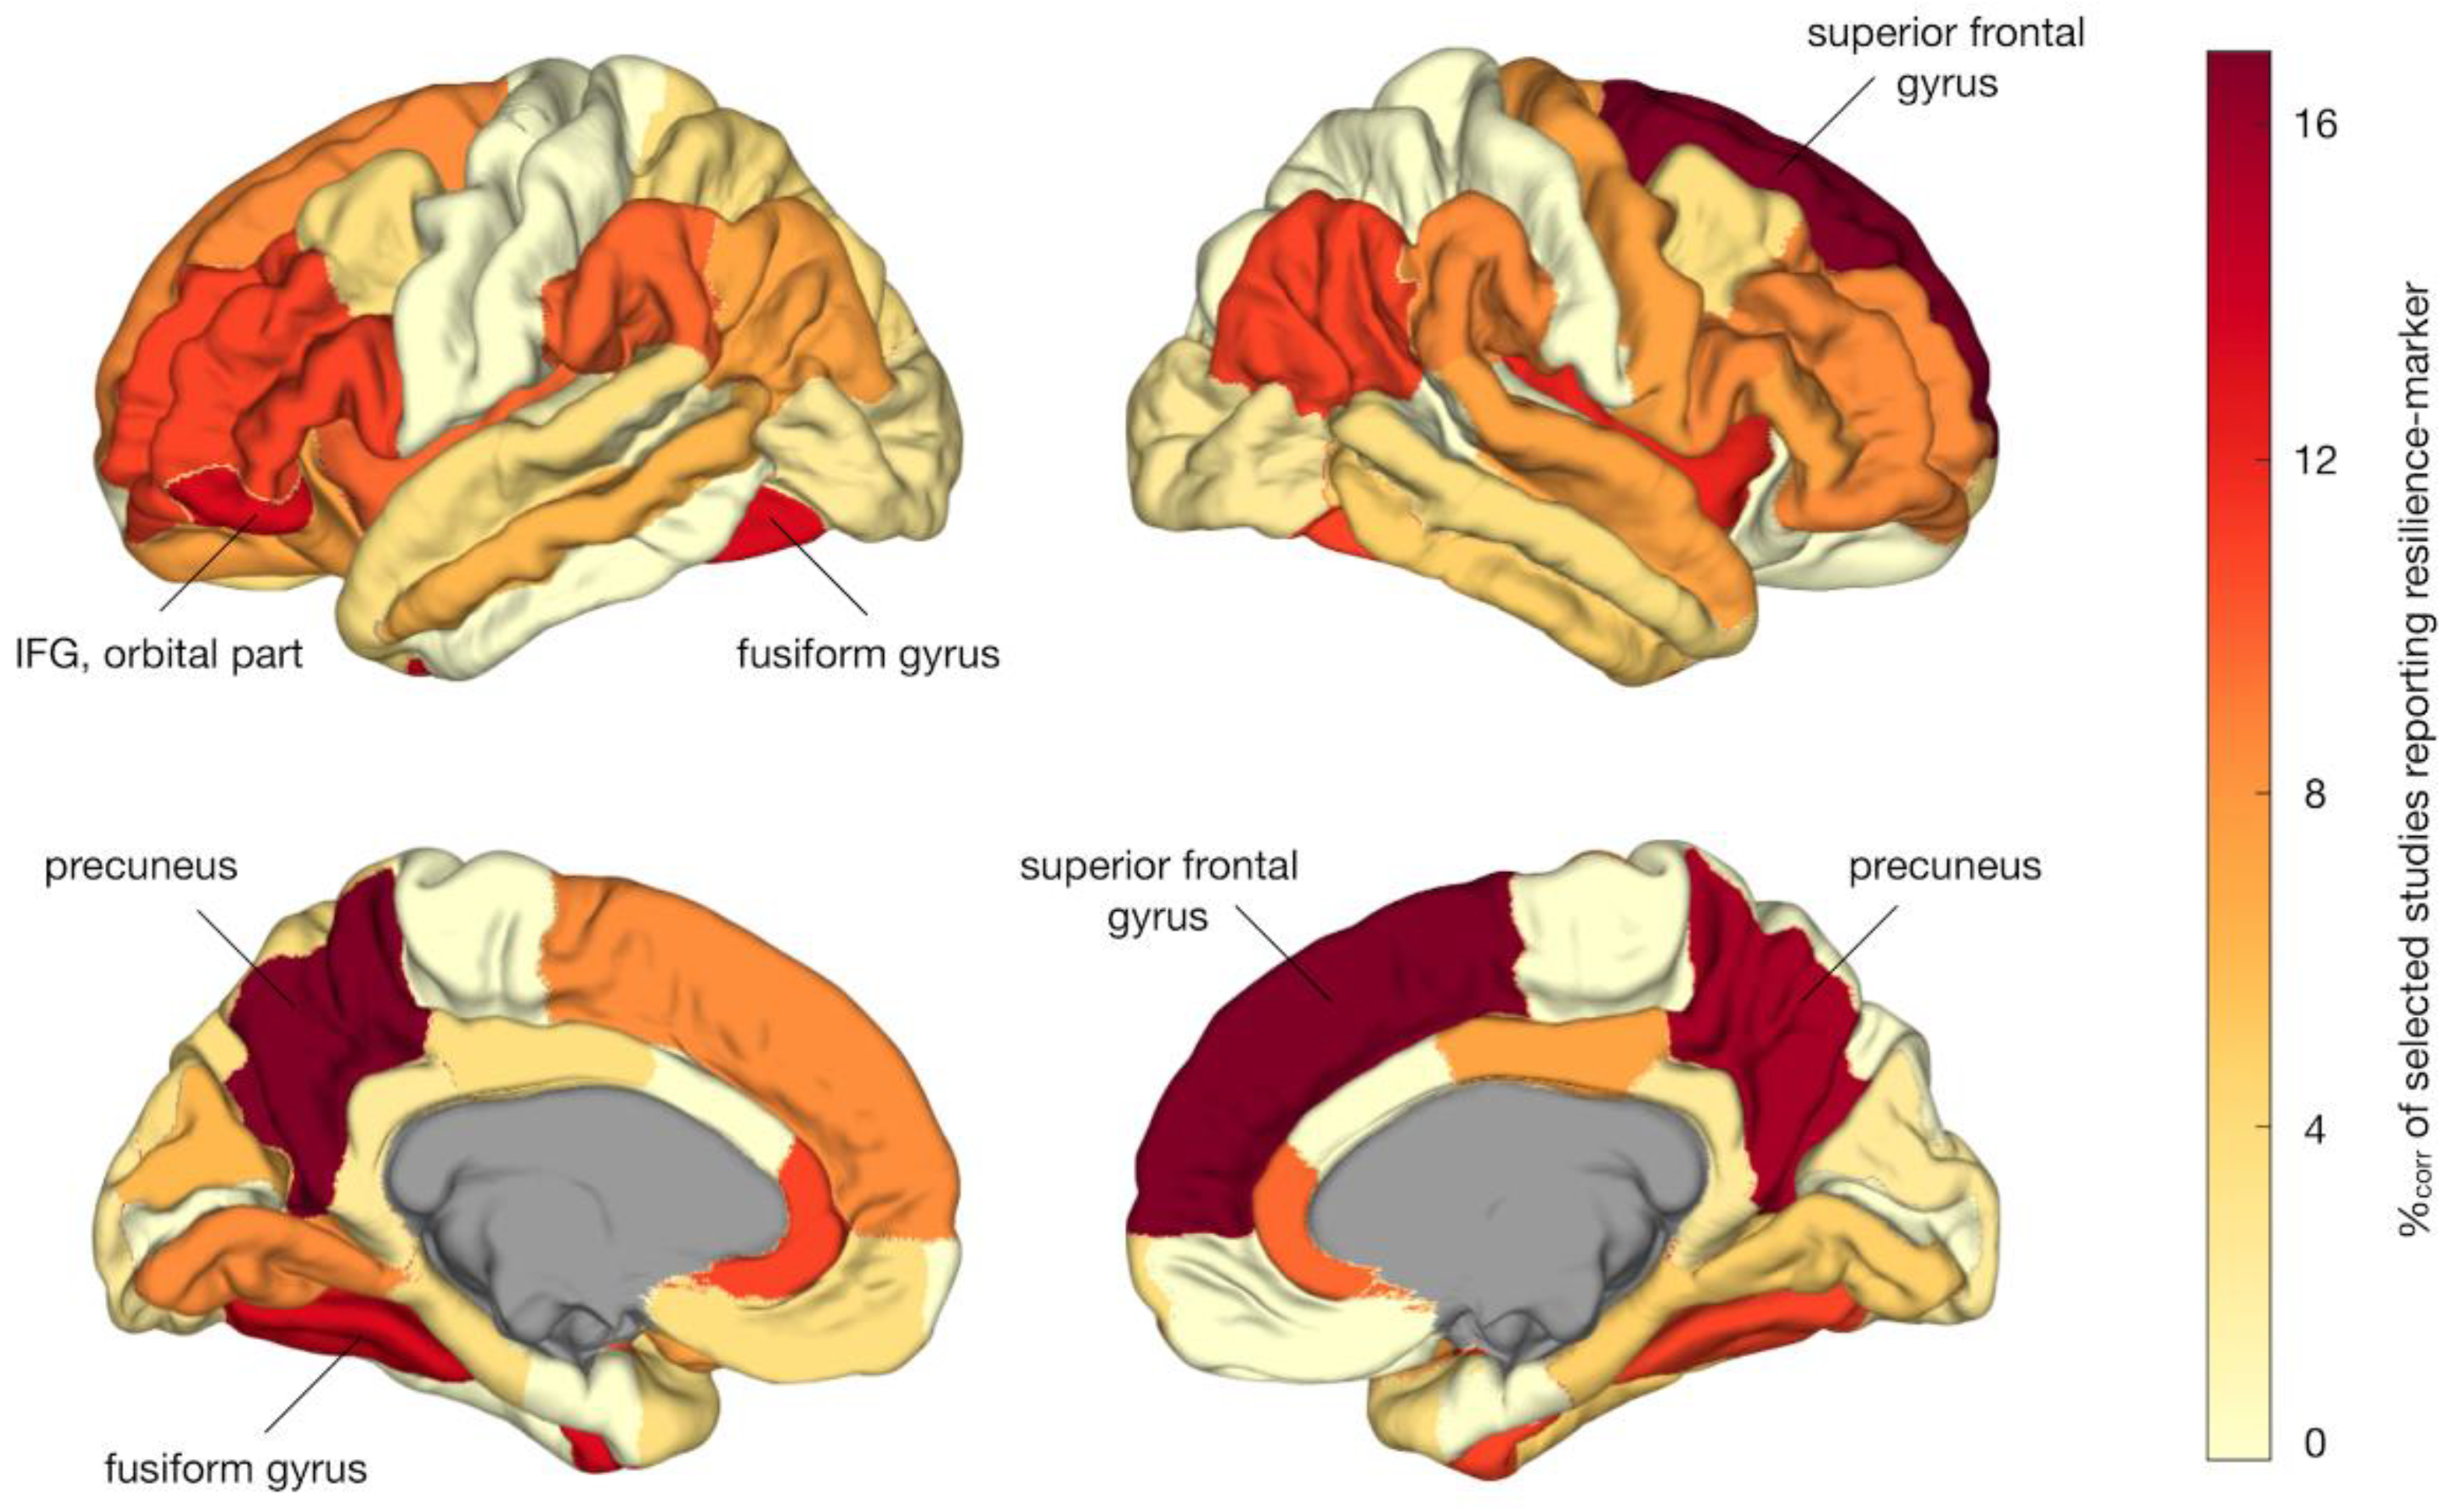
Figure 4.
Network-level analysis of resilience markers. Methods (upper panel) and results (lower panel) of systems-level analysis. DK-atlas regions were assigned to one of seven functional networks as defined by Yeo et al. (A), resulting in a seven-network parcellation of the DK-atlas (B). Well over a third of all resilience findings were found to be reported among DMN regions (C) and the overrepresentation of the DMN among reported resilience findings was statistically significant in permutation analysis (D). DMN = default mode network; FPC = frontoparietal control network; SMN = somatomotor network; VIS = visual network; LIM = limbic network; VAN = ventral attention network; DAN = dorsal attention network.
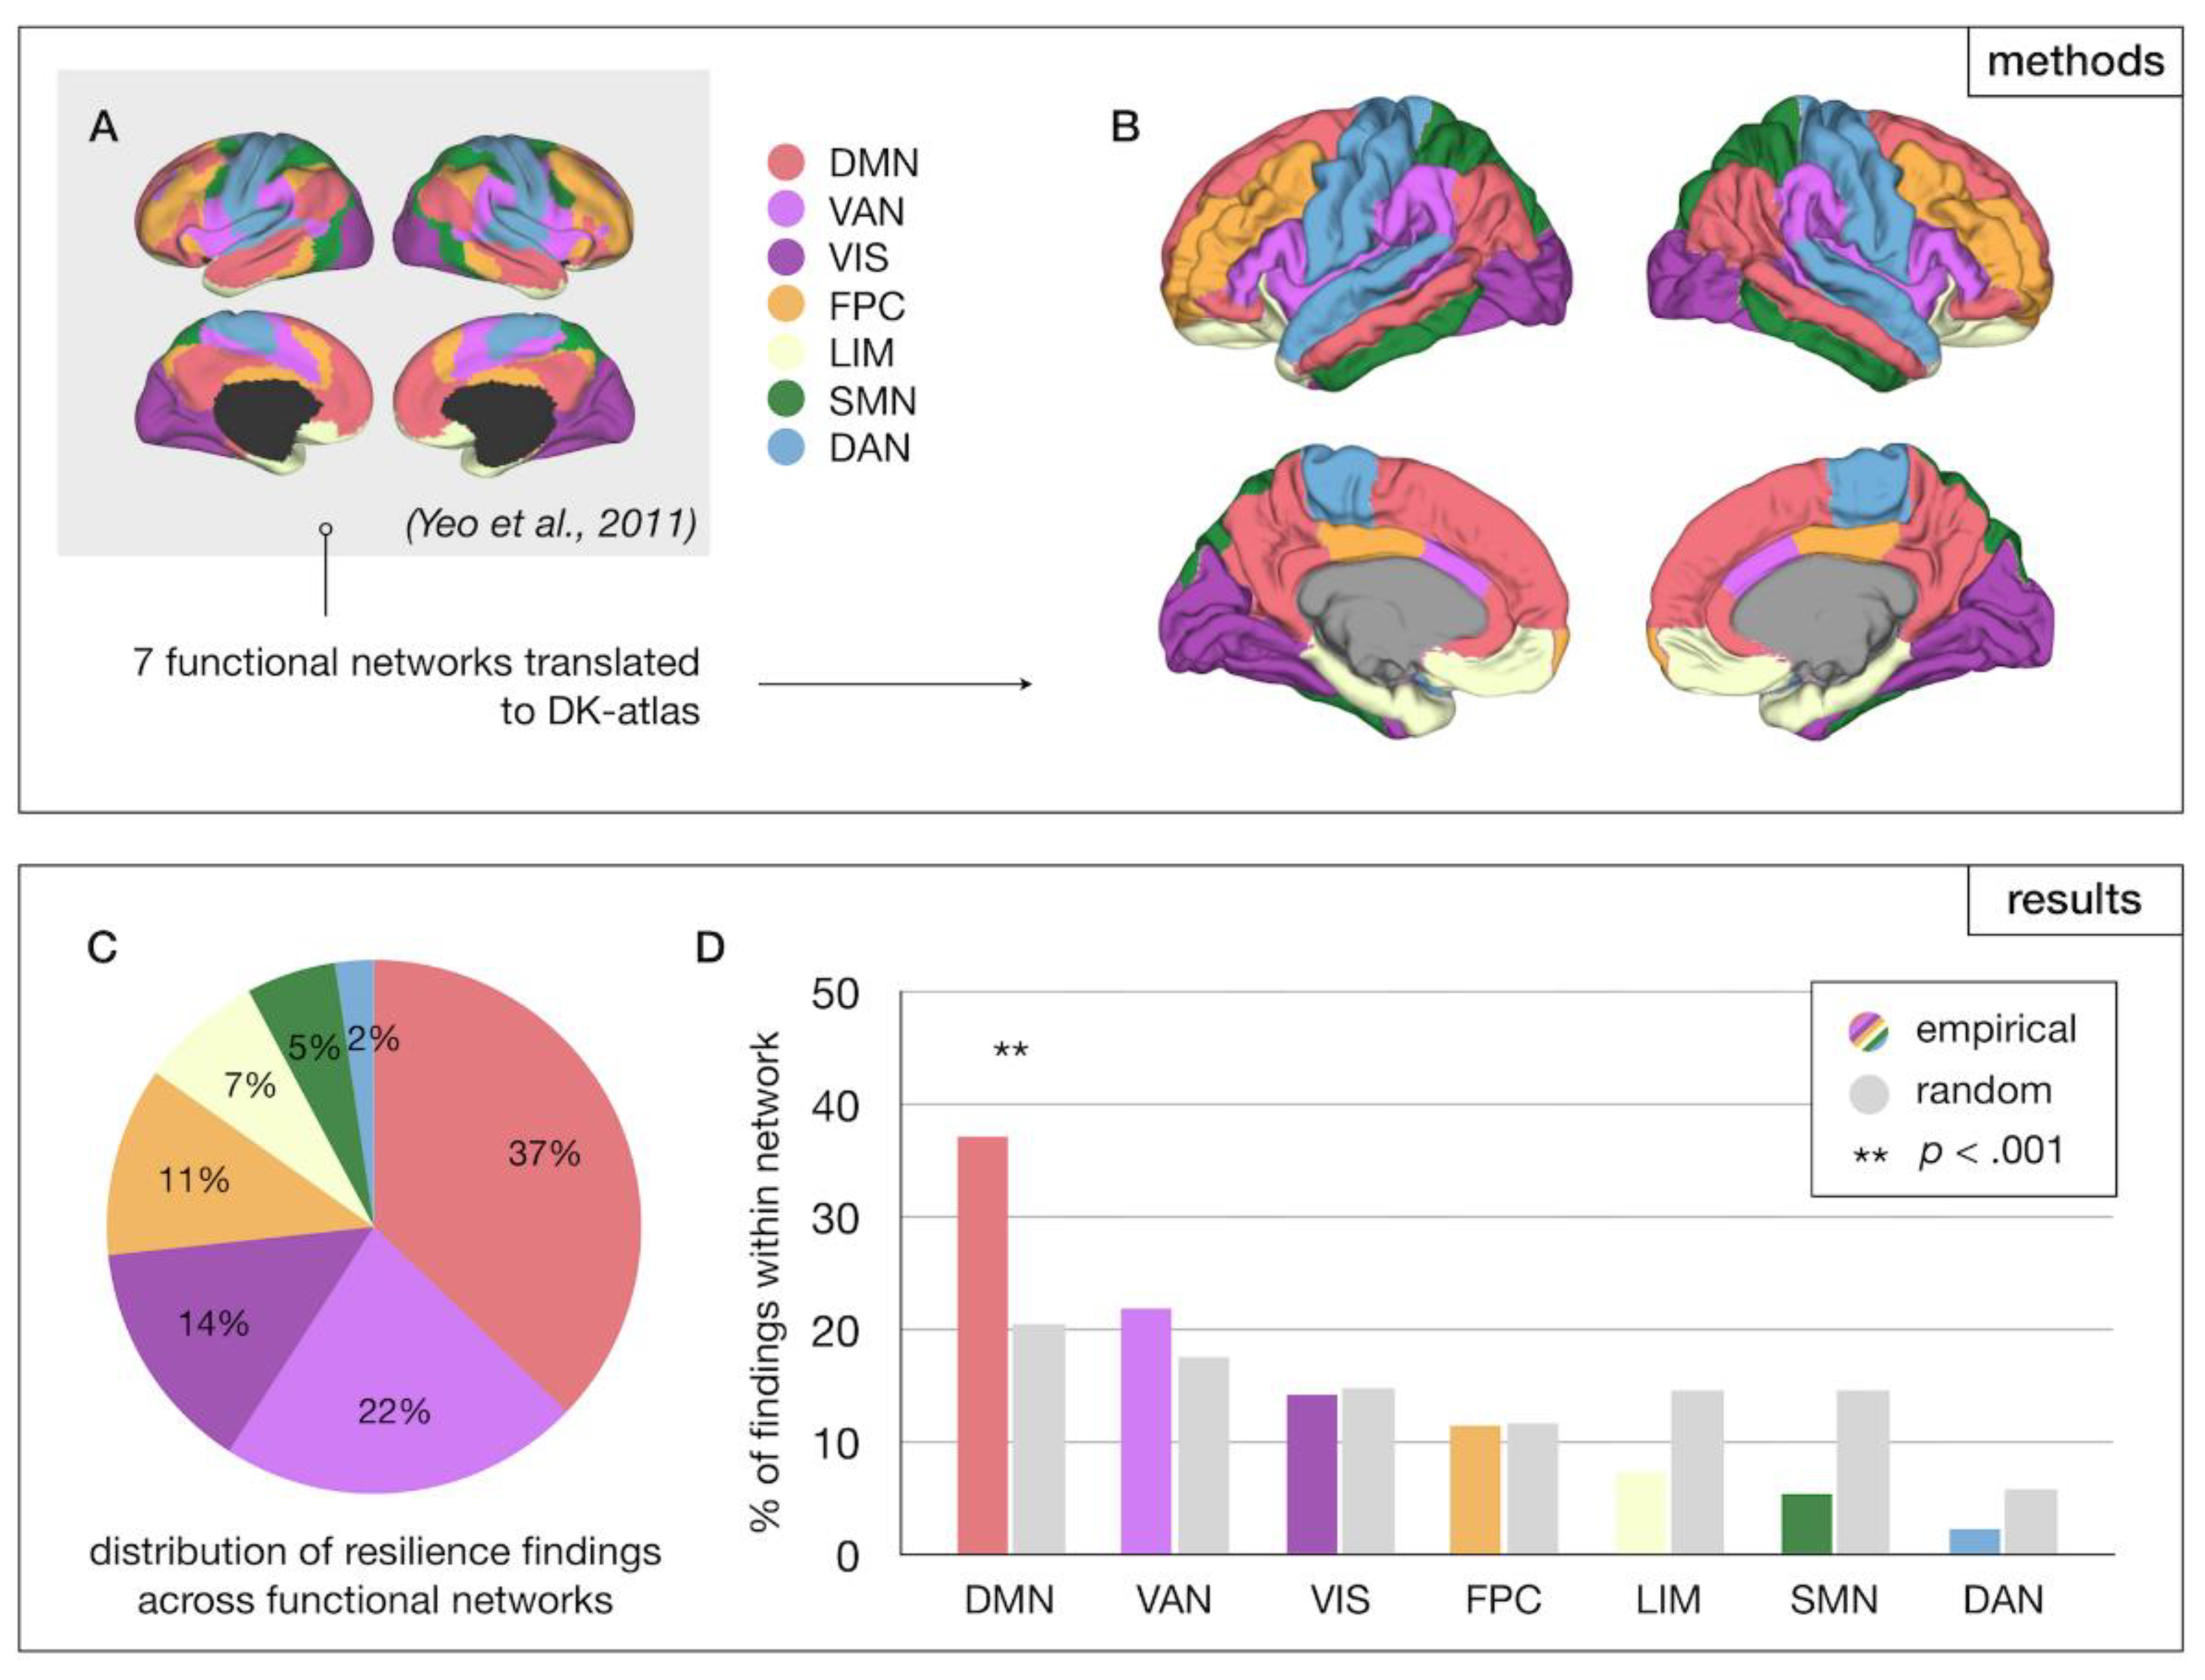
Figure 5.
Graph theoretical meta-regression of resilience markers. Regional tallies of resilience-findings were examined for correlations with metrics of brain network organization, including strength, reflecting the total sum of connectivity of a given node i (A), path length, computed as the average number of steps from any node i to any node j (B), clustering, signifying the average likelihood that two neighboring nodes of any node j are mutually connected (C), and betweenness centrality, reflecting the fraction of shortest paths in the network that contain a given node h (D). Network metrics were computed from weighted structural connectome reconstructions from a cohort of healthy controls from an independent study [36] and normalized between 0 and 1 for visualization purposes.
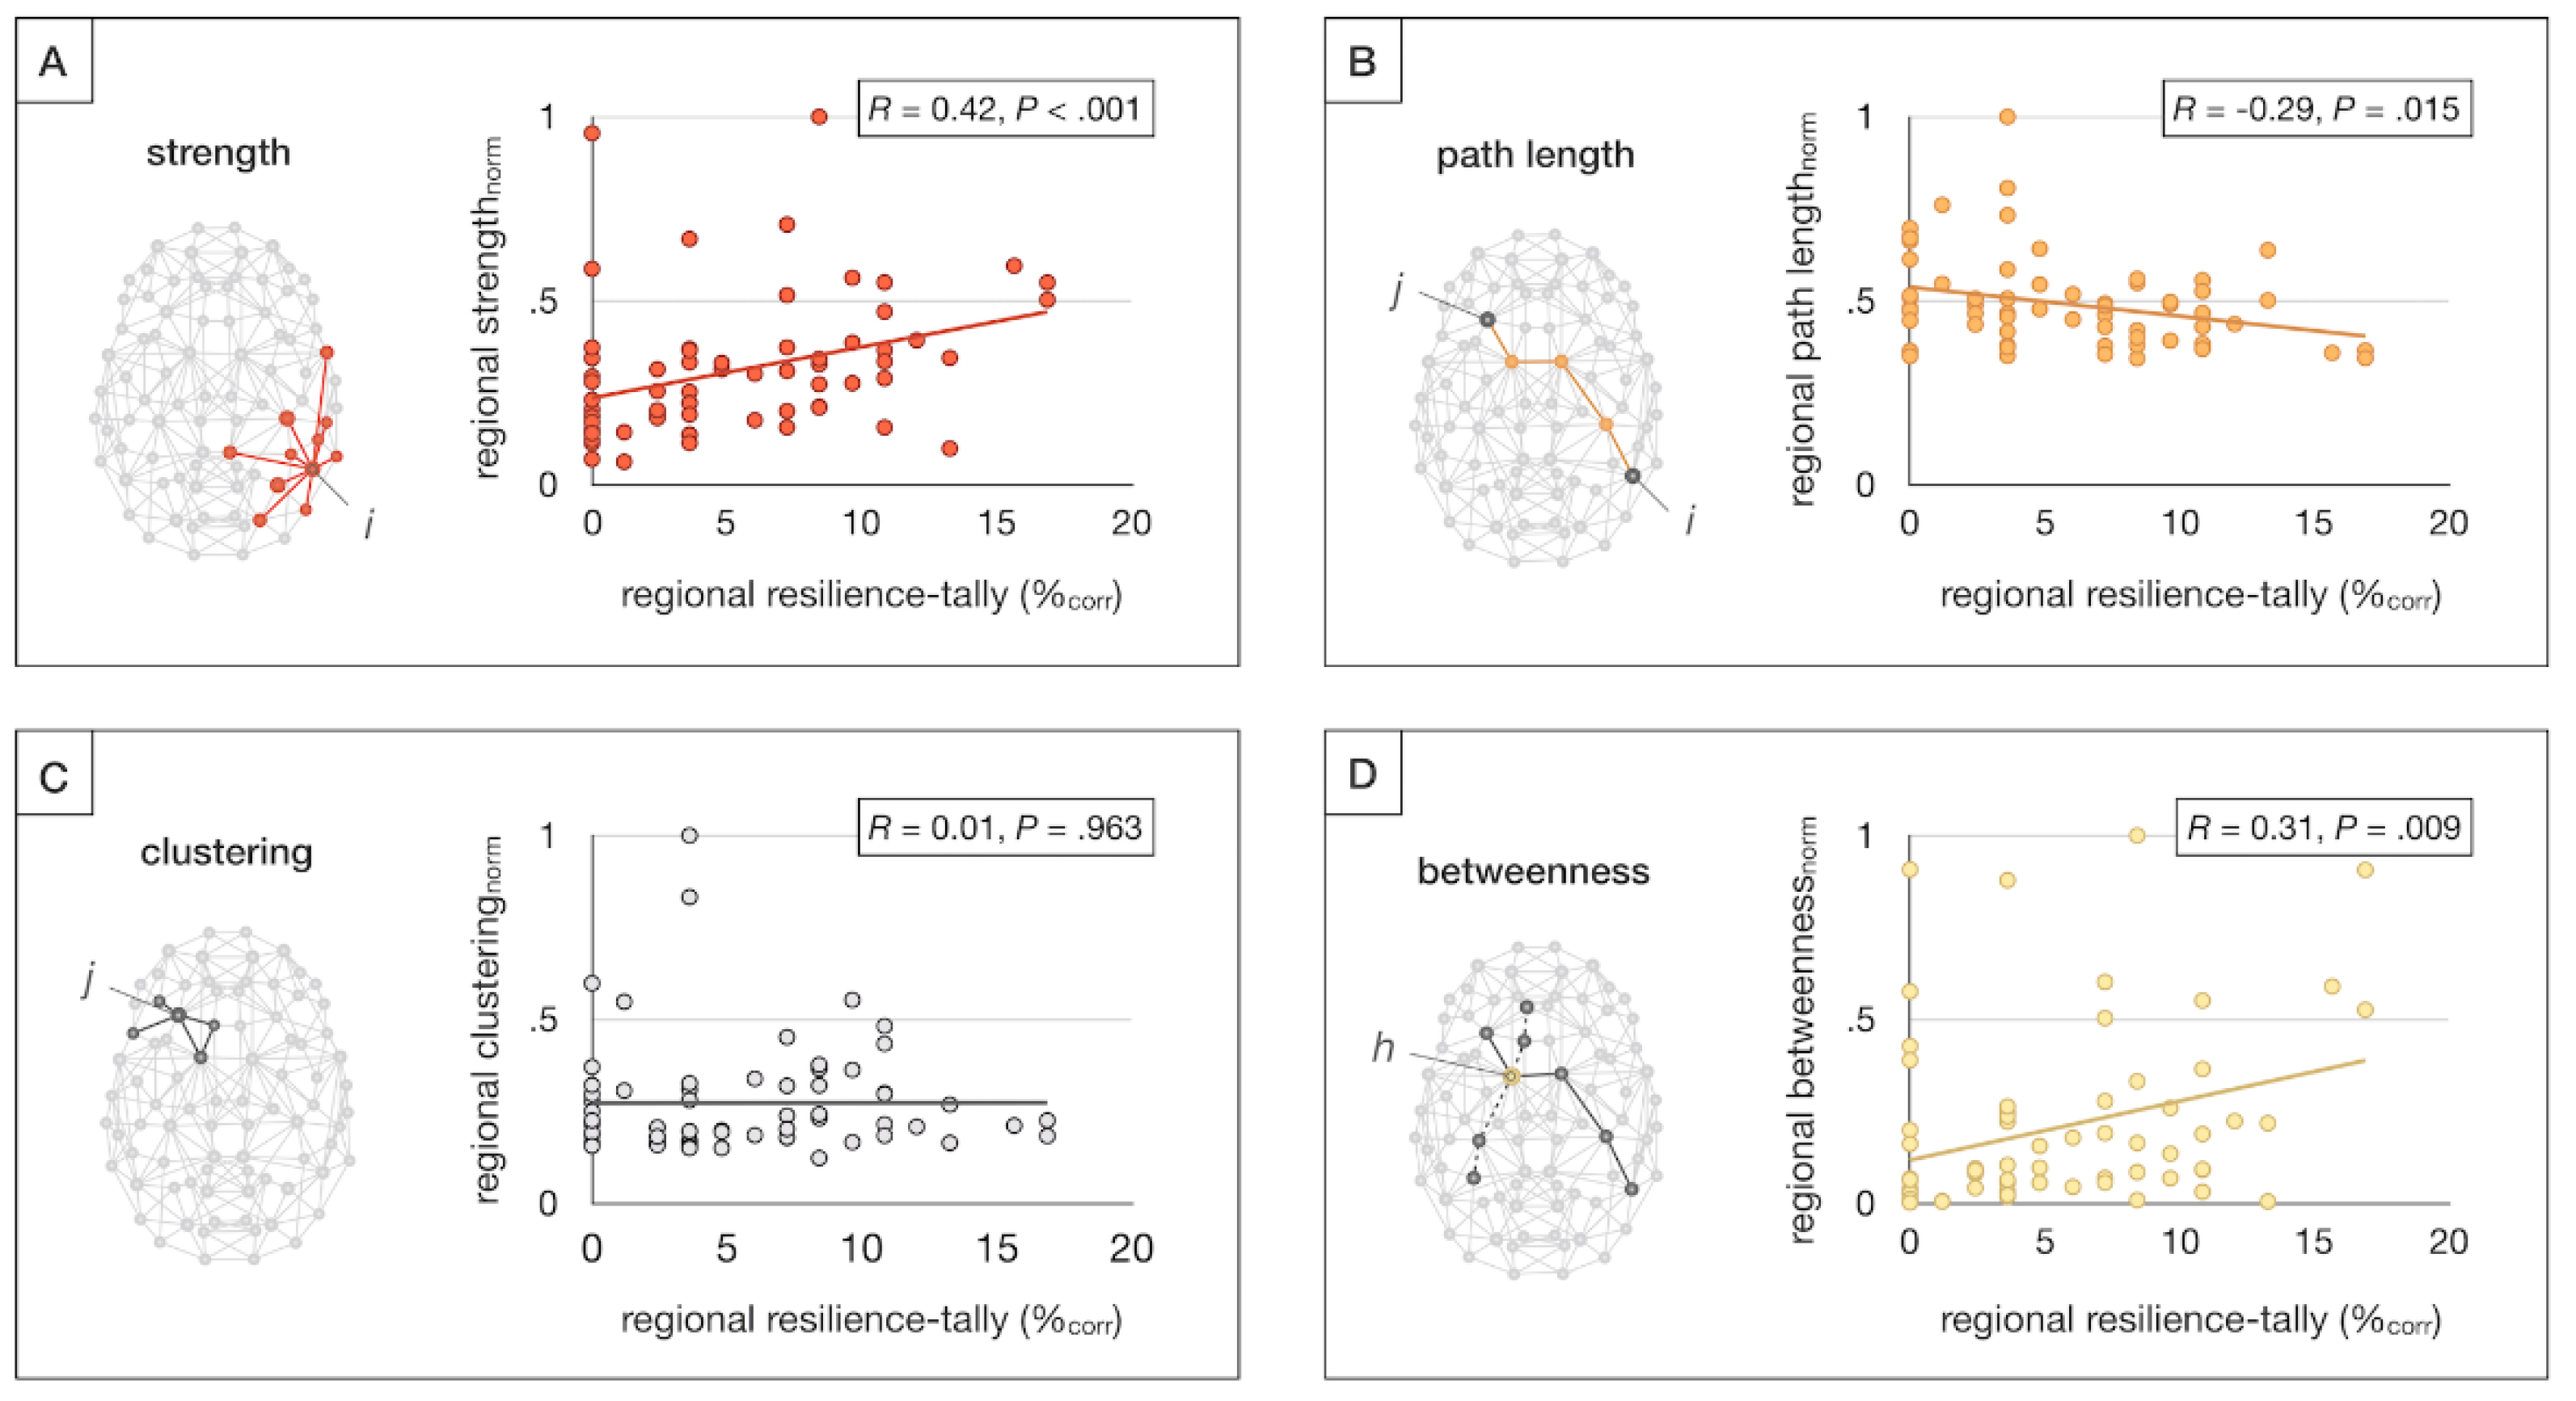
Disclaimer/Publisher’s Note: The statements, opinions and data contained in all publications are solely those of the individual author(s) and contributor(s) and not of MDPI and/or the editor(s). MDPI and/or the editor(s) disclaim responsibility for any injury to people or property resulting from any ideas, methods, instructions or products referred to in the content. |
© 2025 by the authors. Licensee MDPI, Basel, Switzerland. This article is an open access article distributed under the terms and conditions of the Creative Commons Attribution (CC BY) license (http://creativecommons.org/licenses/by/4.0/).
Copyright: This open access article is published under a Creative Commons CC BY 4.0 license, which permit the free download, distribution, and reuse, provided that the author and preprint are cited in any reuse.


