Submitted:
21 February 2025
Posted:
24 February 2025
You are already at the latest version
Abstract
Rapid urbanization has greatly altered urban ecological spaces and habitat quality functions, threatening regional biodiversity and the sustainability of landscapes. Therefore, constructing a comprehensive ecological network and ecological safety patterns is crucial for ecosystem management and regional development. However, simple quantification of ecological networks fails to meet the construction needs of ecological safety patterns, and most studies focus solely on network quantification analysis, thus overlooking the importance of spatial analysis. This study proposes a method of ecological network quantification assessment combined with hotspot analysis and coupled with standard deviational ellipse spatial analysis, which not only satisfies quantitative analysis but also adds spatial analysis methods, facilitating a more comprehensive construction of safety patterns. Firstly, through Morphological Spatial Pattern Analysis (MSPA) and landscape connectivity indices, ecological source areas in the main urban area of Kunming were identified, integrating various resistance factors and corrective factors to construct an ecological resistance surface. The Minimum Cumulative Resistance (MCR) model was used to identify potential ecological corridors, and their importance was evaluated using the gravity model, thus establishing an ecological network. Secondly, based on network structure indices, the ecological network was assessed and optimized. On this basis, combined with hotspot analysis coupled with standard deviational ellipse spatial analysis, an ecological safety pattern was constructed. The results show: the core area of the study region is 2402.28 km², accounting for 52.07% of the total area; there are 13 ecological source areas totaling 2102.89 km², accounting for 45.58% of the total area; there are 178 potential ecological corridors, including 15 level one ecological corridors and 19 level two ecological corridors; 103 ecological nodes, 70 'stepping stones', and 48 ecological breakpoints were identified. In terms of ecological network optimization, 6 new ecological source areas were added, covering an area of 16.22 km², and the potential ecological corridors increased to 324, including 11 new level two ecological corridors, 51 new ecological nodes, 15 'stepping stones', and 24 major ecological breakpoints. After optimization, the network closure index (α), network connectivity index (β), and network connectivity rate index (γ) improved by 15.16%, 24.56%, and 17.79%, respectively. Based on the network structure quantitative analysis and hotspot analysis coupled with the standard deviational ellipse's spatial analysis, an 'one axis, two belts, five zones' ecological safety pattern was constructed.
Keywords:
MSPA-MCR model
; ecological network;hot spot analysis;ecological security pattern;main urban area of Kunming
1. Introduction
As urbanization accelerates, profound changes in land use patterns have led to land degradation, loss of biodiversity, decline in ecosystem services, and increased environmental health risks, causing ecological security issues[1]. These problems not only threaten human living environments but also pose serious challenges to the sustainable development of society and the economy. The continuous increase in human activities has led to a reduction and high fragmentation of urban ecological landscape spaces, thus reducing landscape connectivity and the stability of ecosystemsError! Reference source not found.-Error! Reference source not found.. Therefore, ensuring regional ecological security has become an urgent issue for sustainable development today. The construction of ecological networks is fundamental to achieving ecological safety patterns. Building ecological corridors and biodiversity conservation networks helps enhance the stability of ecological service systems and improves habitat qualityError! Reference source not found.Error! Reference source not found.. As awareness of environmental protection and sustainable development increases, the construction of ecological networks and ecological safety patterns is receiving more and more attention[1841]. A large body of research on ecological networks and safety patterns, such as 'ecological corridors[8],' 'ecological network construction[9],' 'ecological safety assessments[10],' 'ecological footprints[11],' 'PSR models[12-13],' and the Minimum Cumulative Resistance (MCR) model[13-15], provides theoretical support for the construction and assessment of ecological safety patterns. Especially for ecological safety assessments at different regional scales, such as the Yellow River Basin, Yangtze River Basin, Beijing-Tianjin-Hebei region, Jiaozhou Peninsula, Wenchuan County, and Three Gorges Reservoir Area[16-20]. Among these, 'source identification - resistance surface construction - corridor extraction' is one of the main methods for constructing ecological safety patterns[17,19]. The MSPA model is used to identify and quantify core areas in the landscape and their edges, bridges, and other structural features, helping to deepen the understanding of landscape functional structure[20]. The MCR model simulates the optimal flow paths for species or resources, reflecting the resistance characteristics of ecological corridors[21]. The combination of these two models can comprehensively analyze the spatial structure and function of ecological networks. MSPA provides a structural basis for identifying core areas and corridor potential, while MCR optimizes corridor design and path calculation, further improving the connected structure identified by MSPA30. Ultimately, this leads to the construction of an overall ecological safety pattern, ensuring the sustainability of ecosystems and regional ecological safety3132. The current study area's ecological network connectivity is insufficient, resulting in limited ecological corridor functionality, obstructed species migration, and declining biodiversity, thereby affecting regional ecological safety[25]. Network Structure Indices are a set of metrics used to quantitatively assess the topological structure, connectivity, and stability of ecological networks. By calculating network connectivity, closure, and connectivity parameters, they can effectively evaluate the robustness of ecological networks, the feasibility of biological migration, and optimize the ecological safety pattern[26]. This model can effectively assess the integrity of the ecological safety pattern, providing important references for ecological planning, ecological restoration, and landscape connectivity optimization.
Nevertheless, a large amount of research focuses on network quantification, with few studies delving into spatial characteristics in the construction of ecological security, which may lead to decision-making errors or poor ecological protection outcomes[27]. Traditional ecological network quantification methods (such as the minimum cost path, graph theory analysis, etc.) can be used to identify key ecological corridors and nodes, but relying solely on network topological structures cannot fully reflect the true spatial characteristics of ecosystems, thus requiring the incorporation of spatial analysis[28]. Spatial analysis can reveal the spatial distribution features, interrelationships, and dynamic changes of ecological elements, making it an important tool for optimizing ecological safety patterns[29]. Hotspot Analysis (HSA) and Standard Deviational Ellipse (SDE), as main tools for spatial analysis, can effectively identify the spatial distribution characteristics, aggregation trends, and directional features of ecological elements, providing scientific basis for optimizing ecological connectivity. The combination of the former and the latter can better accomplish the construction of ecological networks and ecological safety patterns33320. Hotspot analysis helps identify key areas within ecological networks, such as ecological hotspots (regions with high species richness) or ecological cold spots (regions with low biodiversity), thus providing a basis for protecting key areas and planning ecological corridors. In ecological network optimization and ecological safety pattern construction, ecological resistance (Ecological Resistance) and habitat quality (HQ) are key variables. By combining Hotspot Analysis (HSA) and Standard Deviational Ellipse ecological key areas can be more precisely identified, improving ecological network connectivity and stability. The Standard Deviational Ellipse analyzes the directional characteristics of ecological resistance and habitat quality, and these directional features significantly influence the structure, function, and layout of ecological corridors43. The Habitat Quality module in the InVEST model is a core tool in ecological safety pattern research, capable of quantifying habitat quality and its degree of stress. However, the results from InVEST are typically raster data, lacking refined spatial pattern recognition and directional analysis. By combining Hotspot Analysis and Standard Deviational Ellipse , the accuracy of habitat quality assessments can be further improved, optimizing the spatial layout of ecological safety patterns. Ecological resistance measures the spatial barriers to biological migration or the flow of ecological elements and is a core parameter in constructing ecological networks and ecological safety patterns43. Hotspot Analysis and Standard Deviational Ellipse can enhance the spatial analytical capabilities of ecological resistance, optimizing ecological network connectivity and improving the scientific basis of ecological safety patterns. Ecological resistance and habitat quality are the core elements in constructing ecological safety patterns. Ecological resistance determines the feasibility of biological migration and ecological corridors, while habitat quality reflects the health of ecosystems43. Traditional analysis methods struggle to accurately identify the spatial patterns and directional features of both, but combining Hotspot Analysis (HSA) and Standard Deviational Ellipse (SDE) can enhance the spatial analysis of ecological resistance and habitat quality, improving species migration paths, ecological corridor layouts, and the connectivity and stability of ecosystems, thereby optimizing ecological networks and safety patterns
However, ecological safety research on plateau mountain cities is relatively scarce. The rapid development of plateau cities has had a huge impact on ecological networks, habitat quality, landscape patterns, and biodiversity, and these changes seriously threaten ecosystem services and human health43. Kunming, as an important plateau city in southwest China, is a radiating center facing South Asia and Southeast Asia, with its main urban area being the core of Kunming and the entire Yunnan Province’s development. However, the increase in construction land in the main urban area has led to the occupation of a large amount of ecological land, resulting in landscape fragmentation and a decline in ecosystem services, while also facing a continuous reduction in urban green spaces and a weakened ability of the ecological environment to self-repair43. Therefore, the construction of ecological networks and the establishment of ecological safety patterns in the main urban area of Kunming are urgent. This study uses the MSPA-MCR model and gravity model to identify ecological source areas and extract ecological corridors, constructing an ecological network, and optimizing it through network connectivity models. At the same time, based on the quantification of the ecological network, it proposes combining hotspot analysis with the Standard Deviational Ellipse model to conduct spatial analysis of the ecological resistance surface and habitat quality, ultimately constructing the ecological safety pattern of Kunming's main urban area. This research provides reliable recommendations for ecological protection and sustainable development in Kunming’s main urban area and has significant theoretical and practical implications.
2. Overview of the Study Area and Data Sources
2.1. Overview of the Study Area
The main urban area of Kunming is located in the central part of the Yunnan-Guizhou Plateau in southwest China (102°19´—103°04´E,24°38´—25°46´N). It is the core area of Kunming city in Yunnan Province (Figure 1). This area holds significant political, economic, cultural, and transportation importance, especially as the gateway of China to Southeast Asia and South Asia. The main urban area of Kunming is not only the economic center of Yunnan Province but also serves as a hub for radiating to surrounding areas. The main urban area includes Wuhua District, Panlong District, Guandu District, Xishan District, Chenggong District, and Jinning District, covering a total area of 4,614 km², which accounts for approximately 21.5% of the total area of Kunming city. By the end of 2022, the population was 5.8285 million, accounting for 67.8% of the total population of the city, with an urbanization rate of 93.58%. The GDP was 598.621 billion yuan, accounting for 76.12% of the total GDP of Kunming city, making it the economic engine of Yunnan Province. The main urban area is connected to domestic and international destinations through Kunming Changshui International Airport and Kunming South Station. The area has an extensive railway and highway network, serving as a transportation hub for radiating to the western, southern, and northeastern regions of Yunnan. Kunming has a pleasant climate, with the smallest annual temperature difference in the country. The vegetation is mainly composed of subtropical evergreen broadleaf forests and shrublands, making it an important ecological barrier in the region. The biodiversity is rich, and it has significant ecological value. While promoting the socioeconomic development of Yunnan Province, the main urban area of Kunming also plays an important ecological and environmental role.
2.2. Data Sources and Processing
This study uses 30m resolution land use type data, road data, and water body data from the Resource and Environmental Science and Data Center of the Institute of Geographic Sciences and Natural Resources Research, Chinese Academy of Sciences (https://www.resdc.cn/); slope data was derived from DEM data; vegetation coverage (Fractional Vegetation Cover, FVC) data was calculated using the GEE platform (https://code.earthengine.google.com/); the Built-up Index (IBI) was calculated based on 30m resolution Sentinel-2 satellite data bands (https://code.earthengine.google.com/). Species distribution data comes from the Resource and Environmental Science and Data Center of the Institute of Geographic Sciences and Natural Resources Research, Chinese Academy of Sciences (https://www.resdc.cn/). All spatial data were preprocessed using ArcGIS 10.2 software, including projection transformation, clipping, and masking extraction, ensuring that the data is unified to the 2020 administrative boundaries and projection coordinate system, with a spatial resolution of 30m. Other related research data and sources are referenced in Table 1 below.
2.3. Study Area Framework
The framework of the study area is divided into four parts (Figure 2), and the specific analysis process is as follows: Step 1: Connectivity Analysis and Ecological Network Construction Based on MSPA.First, MSPA (Morphological Spatial Pattern Analysis) is used to conduct connectivity analysis in the study area and identify key ecological source areas. Next, resistance factors (such as land use, Digital Elevation Model (DEM), slope, etc.) are used to construct the ecological resistance surface, and potential ecological corridors are extracted based on the Minimum Cumulative Resistance (MCR) model. By combining source areas, resistance surfaces, and corridors, an initial ecological network framework is constructed. Step 2: Ecological Network Optimization.After establishing the initial network, the next step is to optimize the existing ecological network. Through topological analysis and network structure index models, new patches, corridors, and nodes are integrated into the network, enhancing its connectivity and optimizing their layout within the network to improve the network’s stability and functionality. Step 3: Spatial Analysis and Support for Ecological Safety Pattern Construction Hotspot analysis and Standard Deviational Ellipse (SDE) models are used for spatial analysis, providing in-depth analysis of the spatial distribution characteristics of ecological resistance and habitat quality. Spatial analysis reveals key areas and ecological bottlenecks in the ecological network, further supporting the construction of the ecological safety pattern. Step 4: Ecological Safety Pattern Construction.Finally, all the information from the previous three steps is integrated. Based on ecological source areas, corridor optimization, node layout, and the results of spatial analysis, the "One Axis, Two Belts, Five Zones" ecological safety pattern is constructed.
3. Research Methods
3.1. Method for Selecting Ecological Source Areas
MSPA is a tool that processes raster images using mathematical methods, capable of accurately distinguishing the structure and types of landscapes and evaluating the importance of individual landscape patches43. In this study, based on land cover data, forest, grassland, wetland, and water body land use types were extracted as foreground data in ArcGIS 10.8 and assigned a value of 1, while other land use types were treated as background data and assigned a value of 2. Then, using the Guidos Toolbox 3.2 software, seven types of landscape feature data were generated, including core areas, island areas, bridge areas, corridor areas, edge areas, gaps, and branch lines. Finally, patches with a core area greater than 13 km² were selected as candidate patches for ecological source areas for subsequent landscape connectivity analysis. Landscape connectivity reflects the ease or difficulty of material and information exchange and migration between ecological patches. Good connectivity is important for maintaining ecosystem stability and protecting biodiversity. The overall connectivity index (IIC), potential connectivity index (PC), and patch importance index (dPC) can comprehensively assess landscape connectivity. Using the Conefor2.6 software, the connectivity threshold was set to 2500m, and the connectivity probability to 0.5, to evaluate landscape connectivity and obtain the importance ranking of core area patches, further extracting ecological source areas43. The calculation formula is as follows:
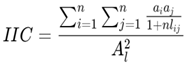
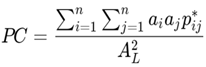
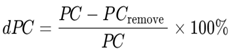
In the formula, IIC represents the overall connectivity index, PC represents the connectivity index, and dPC represents the patch importance value. αi and αj represent the area of patches i and j, respectively. nlij represents the number of connections between patches i and j, AL is the total area, and Pij represents the maximum likelihood of biological diffusion between patches i and j. PCremove represents the value of the landscape connectivity index after the removal of patch α.
3.2. Resistance Surface Construction
Ecological resistance surfaces are constructed by considering the various factors that hinder and interfere with species movement and migration. Therefore, a comprehensive resistance surface must be constructed by combining the resistance values of different landscape types43. Resistance factors are environmental variables that influence ecosystem or species distribution. Based on previous research43, this study selected six basic influencing factors: land cover, slope, DEM, IBI, distance to roads, and distance to railways. Additionally, two correction factors, FVC and species distribution distance, were introduced and assigned values. The Analytic Hierarchy Process (AHP) and Entropy Weighting Method were used to evaluate the weights of natural factors (such as elevation, aspect, slope, and FVC) and human factors (land use types, distance to roads, distance to railways, and IBI). A resistance surface model for both natural and human factors was constructed. Table 2 shows the impact assessments of different factors on ecological networks or species migration. The resistance factors are classified according to grading standards and assigned corresponding resistance values and weights to quantify the extent of influence from different environmental factors. Each resistance factor is classified based on its specific characteristics, with resistance values generally ranging from 1 (lowest resistance) to 5 (highest resistance). The weight reflects the relative importance of each factor in the overall system. Land use type has the highest weight (0.3059), indicating its greatest influence on the system's resistance, while distance to roads and railways have relatively low weights (both 0.0688), suggesting their smaller impact. As shown in Figure 3, factors with higher weights (such as land use type and slope) have a significant influence on the overall system and should receive more attention. The gradient classification of distance factors helps further refine the extent of the impact of distance on the ecosystem.
3.3. Ecological Network Construction
3.3.1. Ecological Corridor Identification and Classification Based on the MCR Model
The Minimum Cumulative Resistance (MCR) model is an important method for identifying potential ecological corridors. By calculating the resistance values between each source area in the ecological resistance surface, the minimum cost path can be obtained, thereby constructing the ecological network43. The formula is as follows:
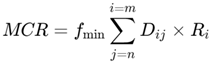
In the formula: MCR represents the minimum cumulative resistance value, fmin is a function positively correlated with spatial distance and resistance coefficient variables, Dij refers to the spatial distance of ecological source j passing through landscape base i, and Ri represents the resistance coefficient of ecological source i when moving in a certain direction.
The gravity model can extract important ecological corridors by calculating the mutual attraction between patches. In this study, the gravity model was applied, and 19 paths with a gravity threshold greater than 70 were selected as important ecological corridors, while the remaining 26 paths were classified as general ecological corridors. The formula is as follows:
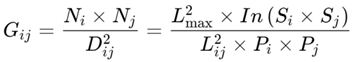
In the formula, Gij represents the mutual interaction force between patches i and j; Si is the area of patch i; Ni and Nj represent the weight values of patches i and j, respectively; Pi and Pj represent the resistance values of patches i and j, respectively; Lij represents the cumulative resistance value between patch i and patch j, and Lmax represents the maximum resistance value of the potential corridor.
3.3.2. Ecological Corridor Network Structure Index Evaluation
Network Structure Indices are a set of metrics used to quantitatively assess the topological structure, connectivity, and stability of ecological networks. By calculating parameters such as network connectivity, closure, and connectivity, the strength, stability, and ability of the ecological network to resist external disturbances can be effectively evaluated43. The Network Closure Index (α index) measures the proportion of actual closed loops (closed paths) in the network. The higher the value, the stronger the closure of the network and the more complex its structure [Formula (6)]. The Network Connectivity Index (β index) represents the average number of corridors each ecological node possesses, reflecting the connectivity level of the network. The higher the β index, the stronger the connectivity of the network and the higher the interaction between nodes. When β > 1, it indicates that the network structure is more complex and the diversity of node connections is enhanced. The Network Connectivity Rate Index (γ index) measures the ratio of actual connected corridors to the theoretical maximum number of connections in the network, reflecting the overall connectivity efficiency of the network. It comprehensively evaluates the connectivity of the network and represents the overall efficiency of the ecological network. The calculation formula is as follows:
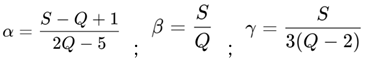
In the formula, S represents the number of potential ecological corridors, and Q represents the number of ecological patches.
3.4. Spatial Analysis Based on Hotspot Analysis Coupled with the Standard Deviational Ellipse Model
Habitat Quality (HQ) and Ecological Resistance Surface (Cold Island Resistance Surface, CIRS) are crucial in the construction of ecological safety patterns. Habitat quality provides good living and breeding conditions for biodiversity and is the core foundation for constructing a stable ecological safety pattern. Conducting dynamic assessments of habitat quality helps identify ecological degradation trends early, allowing for timely intervention and the implementation of effective measures to reduce ecological safety risks[43-44]. Habitat quality evaluation provides scientific support for ecological restoration, ensuring that restoration measures effectively enhance regional ecological safety and biodiversity. The ecological resistance surface is a core element in the construction of ecological safety patterns. By quantifying the resistance of different land surface types to ecological elements (such as species migration and ecological flow), it guides the layout of ecological corridors and source areas, ensuring the scientific and sustainable nature of the ecological safety pattern. With the acceleration of climate change and urbanization, the ecological effects in certain areas may be suppressed or weakened, and the resistance surface plays a decisive role. Using hotspot analysis of the ecological network and Standard Deviational Ellipse for spatial analysis of HQ and CIRS can optimize the ecological network and improve ecological safety.
Hotspot analysis can identify areas in the ecosystem with high environmental pressure and high biodiversity concentration, thus determining key areas for ecological protection. By analyzing human activity intensity, land use changes, etc., it reveals potential threats to the ecosystem, providing the basis for optimizing the ecological safety pattern[45]. High-value hotspot areas (Hot spots) need to be prioritized for protection, such as wetlands, parks, and water bodies; low-value cold spot areas (Cold spots) need to be prioritized for restoration, such as bare land and urban centers. By combining HQ and CIRS to calculate the distribution of ecological hotspot areas, a "ecology-hotspot-ecological corridor" network is constructed to optimize ecological connectivity. Standard Deviational Ellipse can be used to analyze the spatial directionality and morphological characteristics of ecological distribution, providing scientific support for ecological optimization[46]. The SDE can determine the direction of ecological distribution, identify the main spatial expansion trends of ecosystems, optimize the design of ecological corridors, and compare the SDE of different periods to assess the expansion, contraction, or shift of ecosystems. The axis length of the standard deviational ellipse can quantify the diffusivity and coverage of the ecological safety pattern, helping to assess the coverage and effectiveness of the ecological safety pattern.
This study uses the spatial characteristics of habitat quality and ecological resistance to analyze the environmental quality and various ecological issues in different areas of the main urban area of Kunming, in order to construct a targeted ecological safety pattern. The habitat quality module of the InVEST model was used to calculate the habitat quality of the main urban area of Kunming, with model parameters set based on relevant previous studies [47]. Using ecological resistance and habitat quality as basic data, hotspot analysis coupled with standard deviation analysis was applied to determine the spatial characteristics of ecological resistance and habitat quality in the main urban area of Kunming. The hotspot analysis equation is as follows:
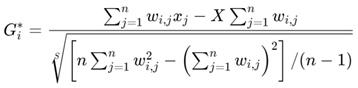
In the formula, xj is the coefficient of variation of the spatial unit, wi and wj are the binary spatial weight matrix, and n is the number of spatial cells.
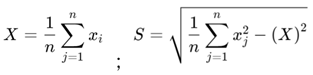
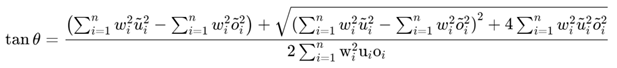
Standard Deviational Ellipse (SDE) analyzes the directional characteristics of ecological resistance and habitat quality. SDE quantifies the centrality, diffusivity, and spatial distribution of the morphological characteristics of ecological resistance and habitat quality from both global and spatial perspectives. SDE describes the general characteristics of spatial distribution determined by basic parameters such as the center, major axis, minor axis, and orientation, including the mean center, azimuth, and the variance formulas for the x and y axes.
The formula for the mean center is as follows:
Azimuth formula:
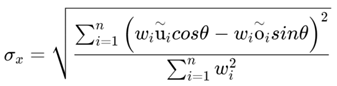
Variance of the x-axis:
Variance of the y-axis:
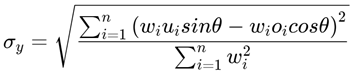
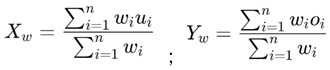
In the formula, ( õ , ũ ) represents the spatial position of the entity, Wi represents the weight, and XW-YW represents the weighted mean center. θ is the azimuth of the ellipse, representing the angle formed by the counterclockwise rotation towards the north with the major axis of the ellipse. õ , ũ represent the coordinate deviations from the target location to the mean center. σx and σy represent the variances of the x and y axes, respectively.
4. Results
4.1. Analysis and Selection of Ecological Source Areas
Based on the MSPA analysis results, 31 core patches with an area greater than 3 km² were identified. These core patches have low human activity intensity and high landscape ecological value, making them the best choice for potential ecological source areas. On this basis, to reduce landscape fragmentation, 13 core patches with a dPC value greater than 3 were selected as ecological source areas through landscape connectivity calculations. These ecological source areas have large areas, good habitat quality, high importance, and connectivity, effectively promoting species migration and exchange. The total area of ecological source areas is 2102.89 km², accounting for 45.58% of the total area of the study area. These ecological source areas are mainly distributed in the northern, northwestern, and other regions of the main urban area of Kunming. Forests, water bodies, and grasslands are the primary land use types of ecological source areas. Among them, the forest area is 1684.49 km², accounting for 80.14% of the total area of ecological source areas; the water area is 284.23 km², accounting for 13.54% of the total area of ecological source areas; the grassland area is 194.23 km², accounting for 9.23% of the total area of ecological source areas.
4.2. Ecological Network Construction
4.2.1. Ecological Resistance Surface
High resistance areas (red areas, resistance value 8.34) are mainly distributed in the core regions of the main urban area of Kunming, such as Wuhua District, Panlong District, Guandu District, etc (Figure 4). This indicates that these areas have dense urban construction, high human activity intensity, and high ecological resistance, which are unfavorable for species migration and the circulation of ecological elements. Moderate resistance areas (yellow to orange areas) are mostly located in the semi-urbanized areas on the outskirts of the main urban area, such as the northern part of Chenggong District and some areas of Jinning District. Urban expansion and agricultural activities have caused some disturbances to the ecosystem, but ecological connectivity is still acceptable. Low resistance areas (blue areas, resistance value 1.44) are mainly distributed in ecological protection zones and natural areas in the western, northern, and eastern parts of Kunming, such as the western hills of Dianchi Lake, the northern mountainous areas of Kunming, and Dongchuan District. These areas have good vegetation coverage and favorable ecological conditions, making them priority areas for the layout of ecological corridors and ecological source areas. From the main urban area outward, the resistance values show a gradient change from "high to low," with severe ecological fragmentation in the urban center and relatively intact ecology in the surrounding areas. The resistance values around Dianchi Lake are low, indicating that water body areas have better ecological circulation. The Songhuaba Water Source Protection Area in the northern part of the study area and the Xishan National Forest Park in the western part, as low resistance areas, have high ecological protection value and are suitable as important components of ecological source areas and ecological corridors.
4.2.2. Ecological Corridor Extraction and Classification
This study used the gravity model to identify the intensity of interactions between ecological source areas (Figure 5) and extracted ecological corridors, classifying them accordingly. A total of 91 potential ecological corridors were identified in the study area. Among these, ecological corridors with an interaction force greater than 70 between ecological source areas were classified as level 1 corridors, while those with an interaction force greater than 24 but less than 70 were classified as level 2 corridors. Among them, there are 15 level 1 ecological corridors, with a total length of 386.38 km, and 19 level 2 ecological corridors, with a total length of 817.75 km. The patches connected by level 1 and level 2 ecological corridors have higher habitat quality and greater potential for species migration and exchange. Therefore, particular attention should be paid to the protection and maintenance of these corridors in spatial planning to ensure the connectivity of important patches.
In the specific analysis, the interaction force between Source 7 and Source 8 is 545.56, showing the strongest connection between them, indicating their geographical proximity or very effective ecological passage. The interaction force between Source 9 and Source 10 is 620.07, also indicating a strong connection. The interaction between Source 6 and Source 9 is 149.29, and the interaction between Source 8 and Source 9 is 382.59. The low values near the main diagonal reflect greater distances between the source areas, causing ecological connectivity to be blocked. The ecological connectivity between Sources 7, 8, and 9 is significant, and their geographical adjacency is advantageous for the construction of ecological corridors. For source areas with lower interaction values (such as Source 1 and Source 12, with an interaction value of 5.08), their ecological connectivity is blocked due to terrain barriers or human interference. It is recommended to take measures to improve the connection between these sources. Source 9 shows strong interaction force, indicating its central position in the regional ecological network, and therefore it should be prioritized for protection and its ecological connectivity optimized.
4.3. Ecological Network Optimization
4.3.1. New Ecological Patch Analysis
Considering the integrity and functional deficiencies of the existing ecological network, this study selected 6 areas larger than 1000m² with potential ecological source connectivity greater than 0.1, based on the original 13 ecological patches. According to the size of the 19 ecological source patches, ArcGIS tools were used to generate four circles with radii of 20 km, 15 km, 10 km, and 5 km, with the patch's geometric center as the circle's center. The larger the patch area, the larger its radiation range (Figure 5). Using ArcGIS's neighborhood analysis tool, the radiation gaps in the ecological network space were identified. The ecological network was then optimized by adding new ecological patches and ecological corridors, based on the ecological corridor network connectivity model. Figure 7 shows the newly added ecological source points and the newly added ecological patches after optimization. These patches are important nodes in the ecological network, providing habitats and ecological functions. The buffer zone around the new ecological source points indicates its influence range or ecological service radiation area, marking the potential impact range of new habitats or ecological corridors. Through the addition of layout and source point design, the coverage of the ecological network was significantly expanded, filling ecological gaps in some areas, and contributing to the optimization of the ecological network. The optimized network's connectivity was enhanced, the number of isolated nodes was reduced, and a more robust ecosystem was constructed.
This optimization improved the connectivity strength of ecological corridors across the entire study area, providing more potential paths for species migration. The newly added distribution is mainly concentrated in ecologically sensitive areas and the gaps of existing ecological nodes. These optimization measures made a significant contribution to the coverage of the ecological network and the construction of the ecological safety pattern. The newly added buffer zones expanded the service range of the ecosystem, providing ecological services such as water source conservation, climate regulation, and biodiversity protection.
4.3.2. New Ecological Corridor Analysis
This study used the MCR model and cost distance method to identify 15 level 1 ecological corridors and 19 level 2 ecological corridors. At the same time, 103 ecological nodes and 285 potential ecological corridors were identified, including 11 newly added level 2 ecological corridors. Additionally, 70 potential corridors were selected, connecting existing ecological source areas with potential ecological source areas. Furthermore, by applying the gravity model, 56 ecological corridors with strong interaction forces were selected.
After removing 13 duplicate corridors, we ultimately established the ecological network for the main urban area of Kunming, identifying 15 level 1 ecological corridors and 30 level 2 ecological corridors (Fig.6). This optimized network can effectively enhance regional ecological connectivity, promote species migration and exchange, and provide scientific support for future ecological protection and territorial spatial planning (Figure 8).
4.3.3. New Ecological Node, Stepping Stone, and Fracture Point Analysis
Ecological nodes are areas with a key role in the ecological network, typically characterized by high biodiversity, important ecological functions, or strategic geographical locations. They are core components of ecosystems. Nodes are located at the intersections of ecological corridors, connecting different habitats, and are crucial for maintaining ecosystem stability. They facilitate species migration and gene flow, thereby enhancing the overall stability of the ecological network. 'Stepping stones' are small patches within the ecological network, located between larger habitats, acting as temporary habitats or refueling stations for species during migration. Although small in size, their position is extremely important as they serve as bridges between isolated habitats, effectively reducing the habitat island effect and enhancing species dispersal and survival opportunities. Fracture points are areas where connections within the ecological network are broken or fail, usually due to human activities or natural destruction, causing fragmentation of ecological corridors or habitats and leading to the disruption of ecological functions. These points cannot support species migration or gene flow. In this study, fracture points were extracted at the junctions of roads and ecological corridors, in preparation for subsequent planning and construction. Figure 9
Figure 7 shows the identified 103 ecological nodes, 70 'stepping stones', and 48 ecological fracture points. In terms of ecological network optimization, this study added 6 ecological source areas, with a total area of 16.22 km². A total of 285 potential ecological corridors were identified, including 11 newly added level 2 ecological corridors, 51 ecological nodes, and 15 'stepping stones'. At the same time, the optimized network made breakthroughs in ecological fracture points, identifying 24 major ecological fracture points. Through these optimization measures, it is expected to significantly improve the connectivity and stability of the ecological network, providing more effective protection for species migration and the smooth operation of ecological processes.
4.3.4. Based on the network structure index, quantitative evaluation and analysis of the ecological network
We used the network structure index to quantitatively analyze the ecological corridor network before and after optimization. Table 3 shows the changes in key ecological network indicators before and after optimization. First, the number of ecological patches significantly increased, indicating that the optimization measures enhanced the node density of the ecological network. The network closure index (α) was 8.524 before optimization and 9.818 after optimization, with a percentage change of 15.16%. The increase in the closure index suggests that more closed loops (i.e., circular paths) were formed in the network after optimization. The increase in these closed loops improved the complexity and robustness of the network, meaning that even if some corridors are damaged, the network can still maintain a certain level of functionality. The network connectivity index (β) was 13.692 before optimization and 17.052 after optimization, with a percentage change of 24.56%. The improvement in the connectivity index indicates that the average number of connected corridors per ecological patch increased, enhancing the overall connectivity of the network after optimization. This change helps increase the frequency of interactions between nodes, making species migration and ecological processes smoother. The network connectivity rate index (γ) was 5.394 before optimization and 6.353 after optimization, with a percentage change of 17.79%. The increase in the connectivity rate index indicates that the actual connectivity of the optimized ecological network is close to the theoretical maximum connectivity, further improving the overall efficiency of the network.
By comparing the various indicators before and after optimization, the results show that the optimized ecological network has significantly enhanced connectivity, complexity, and redundancy. The improvement in closure (α) and connectivity (β, γ) has strengthened the network's robustness and resilience, enabling it to better withstand external environmental disturbances. Therefore, the optimized ecological corridor network not only better supports the healthy operation of the regional ecosystem, but also provides strong support for species conservation, ecological service function improvement, and regional sustainable development.
4.4. Spatial analysis through hotspot analysis coupled with the Standard Deviational Ellipse model
This study used the spatial characteristics of habitat quality and ecological resistance to analyze the environmental quality and ecological issues in different areas of the main urban area of Kunming, thereby constructing a targeted and focused ecological safety network. To achieve this goal, the habitat quality module of the InVEST model was used to calculate the habitat quality in the main urban area of Kunming. Based on the data of ecological resistance and habitat quality, hotspot analysis was applied to determine the spatial characteristics of ecological resistance and habitat quality in the study area(Figure 10).
First, a fishing net was created in ArcGIS, dividing the entire main urban area of Kunming into 500m ×500 km grids, and the average resistance value for each grid was spatially analyzed. As shown in Figure a, the spatial resistance hotspots in the main urban area of Kunming are mainly distributed in a planar manner, concentrated in the built-up areas of the city, particularly in Wuhua District, Panlong District, and Xishan District. These areas have relatively fragile ecological environments, higher resistance values, and are obstructed in terms of ecological processes. In contrast, the centers of cold spot areas are mostly distributed in large forest areas in the northern, western, and southern parts of the study area, where ecological resistance is low and the ecological environment is better. Further application of the Standard Deviational Ellipse analysis (Figure b) provides a detailed analysis of the directional distribution of ecological resistance, revealing that the ecological resistance hotspots in the main urban area of Kunming have significant spatial directionality. These directional characteristics help identify major ecological resistance corridors and optimize the layout of ecological corridors.
In terms of habitat quality, Figures c and d show the spatial distribution characteristics of habitat quality in the main urban area of Kunming. Habitat quality reflects the integrity of habitat types and their resistance to external disturbances. From Figure d, it can be seen that the distribution of habitat quality in the main urban area of Kunming exhibits significant spatial variability, with particularly high-quality habitats in the northern and western forest areas and the Dianchi wetland in the central-southern part. High-quality habitats are mainly found in the northern and western forest regions of the main urban area and the Dianchi wetland. However, in the ecological source areas around Dianchi Lake, habitat quality is poor in areas surrounding the lake, except for the lake itself. Large-scale urban construction and development activities around Dianchi have weakened the ecological environment, resulting in lower habitat quality in these areas. In contrast, Dianchi Lake itself, as a scenic tourist area, has received relatively effective ecological protection, with its habitat quality value close to 1, reflecting a high level of ecological protection.
In summary, this study analyzes the spatial characteristics of ecological resistance and habitat quality in the main urban area of Kunming, revealing both the advantageous and vulnerable ecological areas. This provides important guidance for the construction and optimization of the ecological safety pattern in the main urban area of Kunming, particularly in future ecological network planning, where governance of high-resistance areas and protection of high-quality habitats should be prioritized to achieve continuous improvement of the ecological environment and long-term ecological safety.
4.3. Construction of Ecological Safety Pattern
This study proposes enhancing the ecological network connectivity and stability of the main urban area of Kunming by optimizing ecological corridors, selecting key ecological nodes, and integrating ecological function areas during the construction of the ecological safety pattern. The core content of constructing the ecological safety pattern mainly includes the following three aspects:
(1) Enhancing landscape connectivity: By reasonably arranging ecological corridors to connect scattered ecological nodes, a coherent ecological network can be formed. This increases the likelihood of species migration and gene flow, reduces the negative impact of habitat fragmentation, and strengthens the stability and functionality of the regional ecosystem.
(2) Protecting biodiversity: Through zoning protection and effective connectivity of ecological corridors, biodiversity protection in Kunming and its surrounding areas is promoted. It also provides suitable habitats for various species, especially playing a bridging role in species migration and gene exchange.
(3) Coordinating urban development and ecological protection: When planning the ecological network, it is necessary not only to meet the demands of ecological protection but also to consider the potential for future urban expansion. Through the reasonable planning and reservation of ecological spaces, ecological space can be provided for urban expansion, while ensuring that ecosystems maintain healthy and stable operations during the urbanization process.
Figure 11 shows the layout of different ecological function zones, where the circles represent ecological areas with different functions. These areas are closely connected by major ecological corridors, forming a regional-level ecological network. The connection strength between ecological source areas is calculated based on their interaction values (e.g., Source 9 is located in the area with the strongest connection). This layout not only provides spatial support for the optimization of the ecological network in the main urban area of Kunming but also clarifies the specific roles of each functional zone in regional ecological protection. Based on the ecological network optimization results, and combining hotspot analysis with the Standard Deviational Ellipse model, the "One Axis, Two Belts, Five Zones" ecological safety pattern for the main urban area of Kunming was constructed, which specifically includes:
"One Axis" refers to the Kunming Built-up Area - Dianchi Ecological Control Axis. This area forms a north-south ecological restoration axis centered around Dianchi Lake, running through the main urban area of Kunming, from the northern Songhuaba Reservoir and Changchong Mountain, along the northern shore of Dianchi, the central urban area, and extending to the southern shore of Dianchi Lake and the Caohai and Baofeng areas. Dianchi Lake, as the largest freshwater lake on the Yunnan-Guizhou Plateau, holds significant ecological value. The ecological control axis connects Kunming's important water sources, wetlands, and mountainous ecological resources, forming an ecological framework that enhances the overall stability of the ecosystem and ensures water quality safety for Dianchi Lake. Based on the existing ecological protection lines in Kunming's built-up area, further strengthening the construction of ecological restoration zones should optimize the water ecosystem centered around Dianchi Lake and improve wetland ecological services. Kunming's built-up area should play a core role in the regional ecological safety pattern by planning and improving the ecological corridor network, enhancing connectivity with other ecological corridors, and integrating lakes, riverbanks, and urban greenways into high-quality urban plateau lake ecosystems.
"Two Belts" refers to the Western Ecological Conservation Belt and the Eastern Ecological Restoration Belt. (1) The Eastern Ecological Restoration Belt is located on the eastern side of the main urban area of Kunming, between the city and ecological protection zones. It connects Guandu, Chenggong, and Jinning districts and is the main area for Kunming’s future urban expansion. The region includes important forest ecological sources such as Panlong Mountain, Mushroom Mountain, Yingpan Mountain, Zhaojiashan, Naitoushan, and Zhiguoshan, with a large vertical span. It is a potential important ecological source area, but due to urban expansion and industrial impact, the existing ecological connectivity is weak, requiring key restoration and protection. The high-intensity urban development in this area leads to poor ecological connectivity. There is a need to add green corridors and parks, while the isolation effect from Kunming Changshui International Airport, the Eastern Expressway, railway construction, and major transportation routes exacerbates the serious ecological fragmentation issues. In the future, by restoring damaged ecological environments, restoring biodiversity, improving regional ecological connectivity, and constructing ecological transition zones, the pressure of urban expansion on the ecology can be alleviated, and an ecological corridor network can be planned to improve regional ecological connectivity. (2) The Western Ecological Conservation Belt includes important mountain forest ecological sources such as Jin’er Mountain, Zizi Mountain, Qipan Mountain, Yaofeng Mountain, Jiayou Park, and Sanhua Mountain, as well as water ecological sources like Sanjia Village Reservoir and Minglang Reservoir. Together, they form an important ecological barrier in the west, providing high-quality ecological services for the main urban area of Kunming, especially in terms of water conservation, climate regulation, and maintaining biodiversity. Due to high development difficulty, lower human activity, and relatively complete ecological environments, this area has better ecological conditions. In the future, by establishing ecological greenways and corridor networks, the ecological connectivity of this area can be further enhanced, improving overall ecological service functions.
"Five Zones" include the Ecological Conservation Area (ECA), Biodiversity Conservation Area (BCA), Ecological Control Area (ECTA), Water Source Conservation Area (WCA), and Ecological Restoration Area (ERA). (1) The Ecological Conservation Area includes the Northern Ecological Conservation Area (ECA-I), Northwestern Ecological Conservation Area (ECA-II), and Southern Ecological Conservation Area (ECA-III), distributed on the western side of Xishan and Qipan Mountains, as well as the southern side of Jining District and Lopashan Mountains. The environment is mainly composed of mountain forests and includes important forest ecological sources such as Changzishan and Shiyangquan Mountain, as well as water ecological sources like Songhua Lake Reservoir and Panlong River. This area is an important urban water source for Kunming. However, due to frequent human activities in Wuhua, Xishan, Panlong, and Guandu districts, the connection to other areas of the main urban area is weak, and ecological corridor construction faces challenges. In the future, this will be a key area for urban ecological greenway construction and regional ecological protection. (2) The Biodiversity Conservation Area includes the Northern Biodiversity Conservation Area (BCA-I) and Southern Biodiversity Conservation Area (BCA-II), located in areas such as Dianchi, Songhuaba Reservoir, Xishan, and Changchong Mountain. As the core area for biodiversity conservation, these regions are less impacted by development and construction, resulting in higher ecological quality and lower ecological fragmentation. (3) The Ecological Control Area (ECTA, I-IV) mainly includes the northern Songhuaba Reservoir and surrounding mountains, the Xishan Mountain Range, Dianchi Lake and surrounding wetlands, lakeshores, and ecological restoration areas in Chenggong, Yiliang, and other areas. With urban expansion, this area has been fragmented by high-intensity human activity, resulting in reduced ecological connectivity, decreased biodiversity, and threats to water quality. As Kunming's "mother lake," Dianchi Lake has long been threatened by agricultural pollution, domestic sewage, and industrial pollution, with water quality improvement still facing significant challenges. There are spatial conflicts between urban construction and ecological protection, and some ecological control areas have been encroached upon, weakening ecological functions. Limited investments in ecological restoration have caused delays in restoration progress, and some areas remain degraded. It is necessary to use landscape connectivity analysis to plan and build ecological corridors, connect fragmented ecological control areas, promote species migration and gene exchange, and enhance ecosystem stability. Based on ecological sensitivity, core protection areas, ecological buffer zones, and areas for reasonable development should be delineated, with differentiated management strategies to ensure the continuous functioning of ecological functions, strengthening wetland restoration, vegetation recovery, and water environment management, thus enhancing the ecological service functions of ecological control areas. Ecological control areas like Songhuaba Reservoir and Dianchi Lake, as core areas of ecological protection, effectively maintain biodiversity and ecosystem stability.
(4) The Water Source Conservation Area (WCA), located in the southern part of Kunming, mainly around Dianchi Lake and its surrounding areas, is an important ecological area for water conservation. This region plays a crucial role in the stable supply and quality assurance of water resources in Kunming. Its vegetation and soil help conserve water, stabilize river flows, reduce water resource loss, protect ecological diversity, and provide a good habitat for wildlife. The government should clearly define the protection area boundaries, prohibit destructive development, implement vegetation restoration and soil and water conservation projects to ensure the ecological safety of water sources, conserve water, purify water quality, and reduce human activity interference in the protected area.(5) The Ecological Restoration Area (ERA, I-IV) is mainly distributed along the eastern shore of Dianchi Lake, Luolong River, and the Jinma Mountain - Changpo Mountain range, forming several ecological nodes in Guandu District and Chenggong District. This area serves as the "core area" of the ecological network. By combining the Jinma Mountain ecological restoration area and the eastern Dianchi Lake restoration area, ecological corridors are formed, connecting the biodiversity conservation areas and water source conservation areas. From the northern Hongshan-Changpo Mountain area to the southern Dianchi Lake East Shore-Luolong area, the ecological restoration area forms an important ecological restoration axis, improving the connectivity between the main urban area of Kunming and the eastern natural ecosystems.
In conclusion, the construction of the "One Axis, Two Belts, Five Zones" ecological safety pattern aims to enhance the stability of Kunming's overall ecosystem, ensure water source safety, promote biodiversity protection, improve the quality of life for urban residents, and improve the scientific and sustainable nature of the ecological safety pattern through a reasonable ecological space layout.
5. Discussion
The research conclusion indicates that based on the ecological network quantitative evaluation, combined with topological analysis, hotspot analysis, and standard deviation ellipse spatial analysis, a more scientific assessment of the feasibility and accessibility of ecological corridors can be made, resulting in a more refined research framework for the safety pattern. Ecological network optimization not only requires attention to connectivity but also needs to consider the impact of habitat quality on ecological functions. However, traditional research often focuses solely on quantitative studies, neglecting spatial heterogeneity, which leads to ecological network optimization being limited to a theoretical level and difficult to directly guide regional ecological management and safety pattern construction. This study, combining GIS and spatial analysis (such as hotspot analysis and spatial autocorrelation), can more intuitively present the spatial patterns of ecological connectivity and habitat quality, optimize ecological safety models, and simultaneously couple ecological network quantification, resistance surface analysis, and habitat quality assessment, making the ecological safety pattern more comprehensive and precise. It considers both the connectivity of ecological elements and incorporates spatial heterogeneity, thus enhancing the guiding value for regional ecological management. Future case studies (such as the Yangtze River Basin) will verify the effectiveness of the method and explore its applicability in different regions. Overall, this method is highly feasible and can provide scientific evidence for ecosystem management and regional development. However, this study also has limitations, such as the ecological resistance model (e.g., MCR) being primarily used for static analysis, which cannot reflect dynamic environmental changes. There is uncertainty in setting resistance weights, and different weight combinations lead to different ecological corridor optimization results. Future research could use machine learning methods (such as random forests, deep learning) to automatically optimize resistance assignment and improve accuracy. Moreover, ecological networks, ecological resistance, and habitat quality are three relatively independent analysis modules, lacking a unified optimization framework, resulting in insufficient integration in spatial analysis. The existing GIS and spatial analysis methods are mostly used for static analysis and are difficult to update in real time or dynamically optimize. Ecological network connectivity analysis often overlooks the impact of human activities (such as urban expansion and transportation networks). The optimization of ecological safety patterns remains at the theoretical level and lacks integration with actual policies and planning. Future research should comprehensively consider socio-economic factors (such as land development and policy constraints) to improve the practical applicability of ecological safety patterns. Additionally, combining policy simulations and scenario analyses (such as ecological redline assessments and land space planning) will enhance policy applicability. Using multi-party collaborative decision-making models (such as AHP, Bayesian networks) to integrate ecological and economic benefits will optimize ecological safety strategies and design dynamic adaptive management frameworks, adjusting the ecological safety pattern based on real-time environmental data.
References
- Wang, Y.; Li, X.; Zhang, F.; Wang, W.; Xiao, R. Effects of rapid urbanization on ecological functional vulnerability of the land system in Wuhan, China: A flow and stock perspective. J. Clean. Prod. 2020, 248, 119284. [Google Scholar] [CrossRef]
- Li, J.; Gong, J.; Guldmann, J.-M.; Yang, J. Assessment of Urban Ecological Quality and Spatial Heterogeneity Based on Remote Sensing: A Case Study of the Rapid Urbanization of Wuhan City. Remote. Sens. 2021, 13, 4440. [Google Scholar] [CrossRef]
- Xu, Y.; Liu, Y.; Sun, Q.; Qi, W. Construction of Cultivated Land Ecological Network Based on Supply and Demand of Ecosystem Services and MCR Model: A Case Study of Shandong Province, China. Sustainability 2024, 16, 3745. [Google Scholar] [CrossRef]
- Tang, F.; Wang, L.; Guo, Y.; Fu, M.; Huang, N.; Duan, W.; Luo, M.; Zhang, J.; Li, W.; Song, W. Spatio-temporal variation and coupling coordination relationship between urbanisation and habitat quality in the Grand Canal, China. Land Use Policy 2022, 117, 106119. [Google Scholar] [CrossRef]
- He, H.; Yu, X.; Yu, H.; Ma, Z.; Luo, Y.; Liu, T.; Rong, Z.; Xu, J.; Chen, D.; Li, P.; et al. Suitable habitat evaluation and ecological security pattern optimization for the ecological restoration of Giant Panda habitat based on nonstationary factors and MCR model. Ecol. Model. 2024, 494. [Google Scholar] [CrossRef]
- Wei, W.; Liu, C.; Ma, L.; Zhang, X.; Xie, B. Ecological Land Suitability for Arid Region at River Basin Scale: Framework and Application Based on Minmum Cumulative Resistance (MCR) Model. Chin. Geogr. Sci. 2022, 32, 312–323. [Google Scholar] [CrossRef]
- Liu, P.-X.; Liu, Y.; Li, T.-N.; Guo, W.-W.; Yang, A.-L.; Yang, X.; Li, E.-Z.; Wang, Z.-J. Identification and Trend Analysis of Ecological Security Pattern in Mudanjiang City Based on MSPA-MCR-PLUS Model. Sustainability 2024, 16, 9690. [Google Scholar] [CrossRef]
- Feng, M.; Zhao, W.; Zhang, T. Construction and Optimization Strategy of County Ecological Infrastructure Network Based on MCR and Gravity Model—A Case Study of Langzhong County in Sichuan Province. Sustainability 2023, 15, 8478. [Google Scholar] [CrossRef]
- Liu, J.; Chen, J.; Yang, Y.; You, H.; Han, X. Construction and Optimization of an Ecological Network in the Yellow River Source Region Based on MSPA and MCR Modelling. Int. J. Environ. Res. Public Heal. 2023, 20, 3724. [Google Scholar] [CrossRef]
- Yan, Y.; Ju, H.; Zhang, S.; Chen, G. The Construction of Ecological Security Patterns in Coastal Areas Based on Landscape Ecological Risk Assessment—A Case Study of Jiaodong Peninsula, China. Int. J. Environ. Res. Public Heal. 2021, 18, 12249. [Google Scholar] [CrossRef]
- Li, X.; Xiao, L.; Tian, C.; Zhu, B.; Chevallier, J. Impacts of the ecological footprint on sustainable development: Evidence from China. J. Clean. Prod. 2022, 352. [Google Scholar] [CrossRef]
- Lai, S.; Sha, J.; Eladawy, A.; Li, X.; Wang, J.; Kurbanov, E.; Lin, Z.; Wu, L.; Han, R.; Su, Y.-C. Evaluation of ecological security and ecological maintenance based on pressure-state-response (PSR) model, case study: Fuzhou city, China. Hum. Ecol. Risk Assessment: Int. J. 2022, 28, 734–761. [Google Scholar] [CrossRef]
- Zhang, Y.; Zang, P.; Guo, H.; Yang, G. Wetlands ecological security assessment in lower reaches of Taoerhe river connected with Nenjiang river using modified PSR model. HydroResearch 2023, 6, 156–165. [Google Scholar] [CrossRef]
- Guo, Z.; Zhu, C.; Fan, X.; Li, M.; Xu, N.; Yuan, Y.; Guan, Y.; Lyu, C.; Bai, Z. Analysis of ecological network evolution in an ecological restoration area with the MSPA-MCR model: A case study from Ningwu County, China. Ecol. Indic. 2025, 170. [Google Scholar] [CrossRef]
- Feng, X.; Du, Z.; Tao, P.; Liang, H.; Wang, Y.; Wang, X. Construction of Green Space Ecological Network in Xiongan New Area Based on the MSPA–InVEST–MCR Model. Appl. Sci. 2024, 14, 10760. [Google Scholar] [CrossRef]
- Wei, H.; Zhu, H.; Chen, J.; Jiao, H.; Li, P.; Xiong, L. Construction and Optimization of Ecological Security Pattern in the Loess Plateau of China Based on the Minimum Cumulative Resistance (MCR) Model. Remote. Sens. 2022, 14, 5906. [Google Scholar] [CrossRef]
- Wei, Q.; Halike, A.; Yao, K.; Chen, L.; Balati, M. Construction and optimization of ecological security pattern in Ebinur Lake Basin based on MSPA-MCR models. Ecol. Indic. 2022, 138, 108857. [Google Scholar] [CrossRef]
- Wang, S.; Li, W.; Li, Q.; Wang, J. Ecological Security Pattern Construction in Beijing-Tianjin-Hebei Region Based on Hotspots of Multiple Ecosystem Services. Sustainability 2022, 14, 699. [Google Scholar] [CrossRef]
- Xu, J.; Fan, F.; Liu, Y.; Dong, J.; Chen, J. Construction of Ecological Security Patterns in Nature Reserves Based on Ecosystem Services and Circuit Theory: A Case Study in Wenchuan, China. Int. J. Environ. Res. Public Heal. 2019, 16, 3220. [Google Scholar] [CrossRef]
- Sun, D.; Wu, X.; Wen, H.; Ma, X.; Zhang, F.; Ji, Q.; Zhang, J. Ecological Security Pattern based on XGBoost-MCR model: A case study of the Three Gorges Reservoir Region. J. Clean. Prod. 2024, 470. [Google Scholar] [CrossRef]
- Wu, Y.; Han, Z.; Meng, J.; Zhu, L. Circuit theory-based ecological security pattern could promote ecological protection in the Heihe River Basin of China. Environ. Sci. Pollut. Res. 2023, 30, 27340–27356. [Google Scholar] [CrossRef] [PubMed]
- Zhang, Y.; Zhao, Z.; Fu, B.; Ma, R.; Yang, Y.; Lü, Y.; Wu, X. Identifying ecological security patterns based on the supply, demand and sensitivity of ecosystem service: A case study in the Yellow River Basin, China. J. Environ. Manag. 2022, 315, 115158. [Google Scholar] [CrossRef]
- Wang, J.; Zhou, W.; Pickett, S.T.; Yu, W.; Li, W. A multiscale analysis of urbanization effects on ecosystem services supply in an urban megaregion. Sci. Total. Environ. 2019, 662, 824–833. [Google Scholar] [CrossRef]
- Xu, W.; Wang, J.; Zhang, M.; Li, S. Construction of landscape ecological network based on landscape ecological risk assessment in a large-scale opencast coal mine area. J. Clean. Prod. 2021, 286. [Google Scholar] [CrossRef]
- Liu, Y.; Lu, Y.; Xu, D.; Zhou, H.; Zhang, S. Enhancing the MSPA Method to Incorporate Ecological Sensitivity: Construction of Ecological Security Patterns in Harbin City. Sustainability 2024, 16, 2875. [Google Scholar] [CrossRef]
- Yang, S. Evaluation of urban ecological security model based on GIS sensing and MCR model. Meas. Sensors 2024, 33. [Google Scholar] [CrossRef]
- Guan, J.; Hu, J.; Li, B. How to restore ecological impacts from wind energy? An assessment of Zhongying Wind Farm through MSPA-MCR model and circuit theory. Ecol. Indic. 2024, 163. [Google Scholar] [CrossRef]
- Luo, J.; Zhu, L.; Fu, H. Construction of wetland ecological network based on MSPA-Conefor-MCR: A case study of Haikou City. Ecol. Indic. 2024, 166. [Google Scholar] [CrossRef]
- Feng, X.; Du, Z.; Tao, P.; Liang, H.; Wang, Y.; Wang, X. Construction of Green Space Ecological Network in Xiongan New Area Based on the MSPA–InVEST–MCR Model. Appl. Sci. 2024, 14, 10760. [Google Scholar] [CrossRef]
- Qin, J.-Z.; Dai, J.-P.; Li, S.-H.; Zhang, J.-Z.; Peng, J.-S. Construction of ecological network in Qujing city based on MSPA and MCR models. Sci. Rep. 2024, 14, 9800. [Google Scholar] [CrossRef]
- Liu, P.-X.; Liu, Y.; Li, T.-N.; Guo, W.-W.; Yang, A.-L.; Yang, X.; Li, E.-Z.; Wang, Z.-J. Identification and Trend Analysis of Ecological Security Pattern in Mudanjiang City Based on MSPA-MCR-PLUS Model. Sustainability 2024, 16, 9690. [Google Scholar] [CrossRef]
- Chen, W.; Liu, H.; Wang, J. Construction and optimization of regional ecological security patterns based on MSPA-MCR-GA Model: A case study of Dongting Lake Basin in China. Ecol. Indic. 2024, 165, 112169. [Google Scholar] [CrossRef]
- Yan, Y.; Ju, H.; Zhang, S.; Chen, G. The Construction of Ecological Security Patterns in Coastal Areas Based on Landscape Ecological Risk Assessment—A Case Study of Jiaodong Peninsula, China. Int. J. Environ. Res. Public Heal. 2021, 18, 12249. [Google Scholar] [CrossRef] [PubMed]
- Cui, L.; Wang, J.; Sun, L.; Lv, C. Construction and optimization of green space ecological networks in urban fringe areas: A case study with the urban fringe area of Tongzhou district in Beijing. J. Clean. Prod. 2020, 276. [Google Scholar] [CrossRef]
- Wu, B.; Bao, Y.; Wang, Z.; Chen, X.; Wei, W. Multi-temporal evaluation and optimization of ecological network in multi-mountainous city. Ecol. Indic. 2023, 146, 109794. [Google Scholar] [CrossRef]
- Huang, X.; Wang, H.; Shan, L.; Xiao, F. Constructing and optimizing urban ecological network in the context of rapid urbanization for improving landscape connectivity. Ecol. Indic. 2021, 132, 108319. [Google Scholar] [CrossRef]
- Chen, X.; Yang, Z.; Wang, T.; Han, F. Landscape Ecological Risk and Ecological Security Pattern Construction in World Natural Heritage Sites: A Case Study of Bayinbuluke, Xinjiang, China. ISPRS Int. J. Geo-Information 2022, 11, 328. [Google Scholar] [CrossRef]
- LIU, Y.Y.; Meng, G.A.O. Mesh-connected rings topology for network-on-chip. The Journal of China Universities of Posts and Telecommunications 2013, 20, 30–36. [Google Scholar] [CrossRef]
- Aminzadeh, B.; Khansefid, M. A case study of urban ecological networks and a sustainable city: Tehran’s metropolitan area. Urban Ecosyst. 2010, 13, 23–36. [Google Scholar] [CrossRef]
- Wang, S.; Song, Q.; Zhao, J.; Lu, Z.; Zhang, H. Identification of Key Areas and Early-Warning Points for Ecological Protection and Restoration in the Yellow River Source Area Based on Ecological Security Pattern. Land 2023, 12, 1643. [Google Scholar] [CrossRef]
- He, P.; Chen, K. Analysis of Blue Infrastructure Network Pattern in the Hanjiang Ecological Economic Zone in China. Water 2022, 14, 1234. [Google Scholar] [CrossRef]
- Zhang, F.; Jia, Y.; Liu, X.; Li, T.; Gao, Q. Application of MSPA-MCR models to construct ecological security pattern in the basin: A case study of Dawen River basin. Ecol. Indic. 2024, 160, 111887. [Google Scholar] [CrossRef]
- Zhao, Y.; Qu, Z.; Zhang, Y.; Ao, Y.; Han, L.; Kang, S.; Sun, Y. Effects of human activity intensity on habitat quality based on nighttime light remote sensing: A case study of Northern Shaanxi, China. Sci. Total. Environ. 2022, 851, 158037. [Google Scholar] [CrossRef] [PubMed]
- Tang, F.; Zhou, X.; Wang, L.; Zhang, Y.; Fu, M.; Zhang, P. Linking Ecosystem Service and MSPA to Construct Landscape Ecological Network of the Huaiyang Section of the Grand Canal. Land 2021, 10, 919. [Google Scholar] [CrossRef]
- Zhang, J.; Zhu, H.; Zhang, P.; Song, Y.; Zhang, Y.; Li, Y.; Rong, T.; Liu, Z.; Yang, D.; Lou, Y. Construction of GI Network Based on MSPA and PLUS Model in the Main Urban Area of Zhengzhou: A Case Study. Front. Environ. Sci. 2022, 10, 878656. [Google Scholar] [CrossRef]
- Huang, M.-Y.; Yue, W.-Z.; Feng, S.-R.; Cai, J.-J. Analysis of spatial heterogeneity of ecological security based on MCR model and ecological pattern optimization in the Yuexi county of the Dabie Mountain Area. J. Nat. Resour. 2019, 34, 771–784. [Google Scholar] [CrossRef]
- Hu, C.; Wang, Z.; Wang, Y.; Sun, D.; Zhang, J. Combining MSPA-MCR Model to Evaluate the Ecological Network in Wuhan, China. Land 2022, 11, 213. [Google Scholar] [CrossRef]
Figure 1.
Geographical Location of the Study Area.
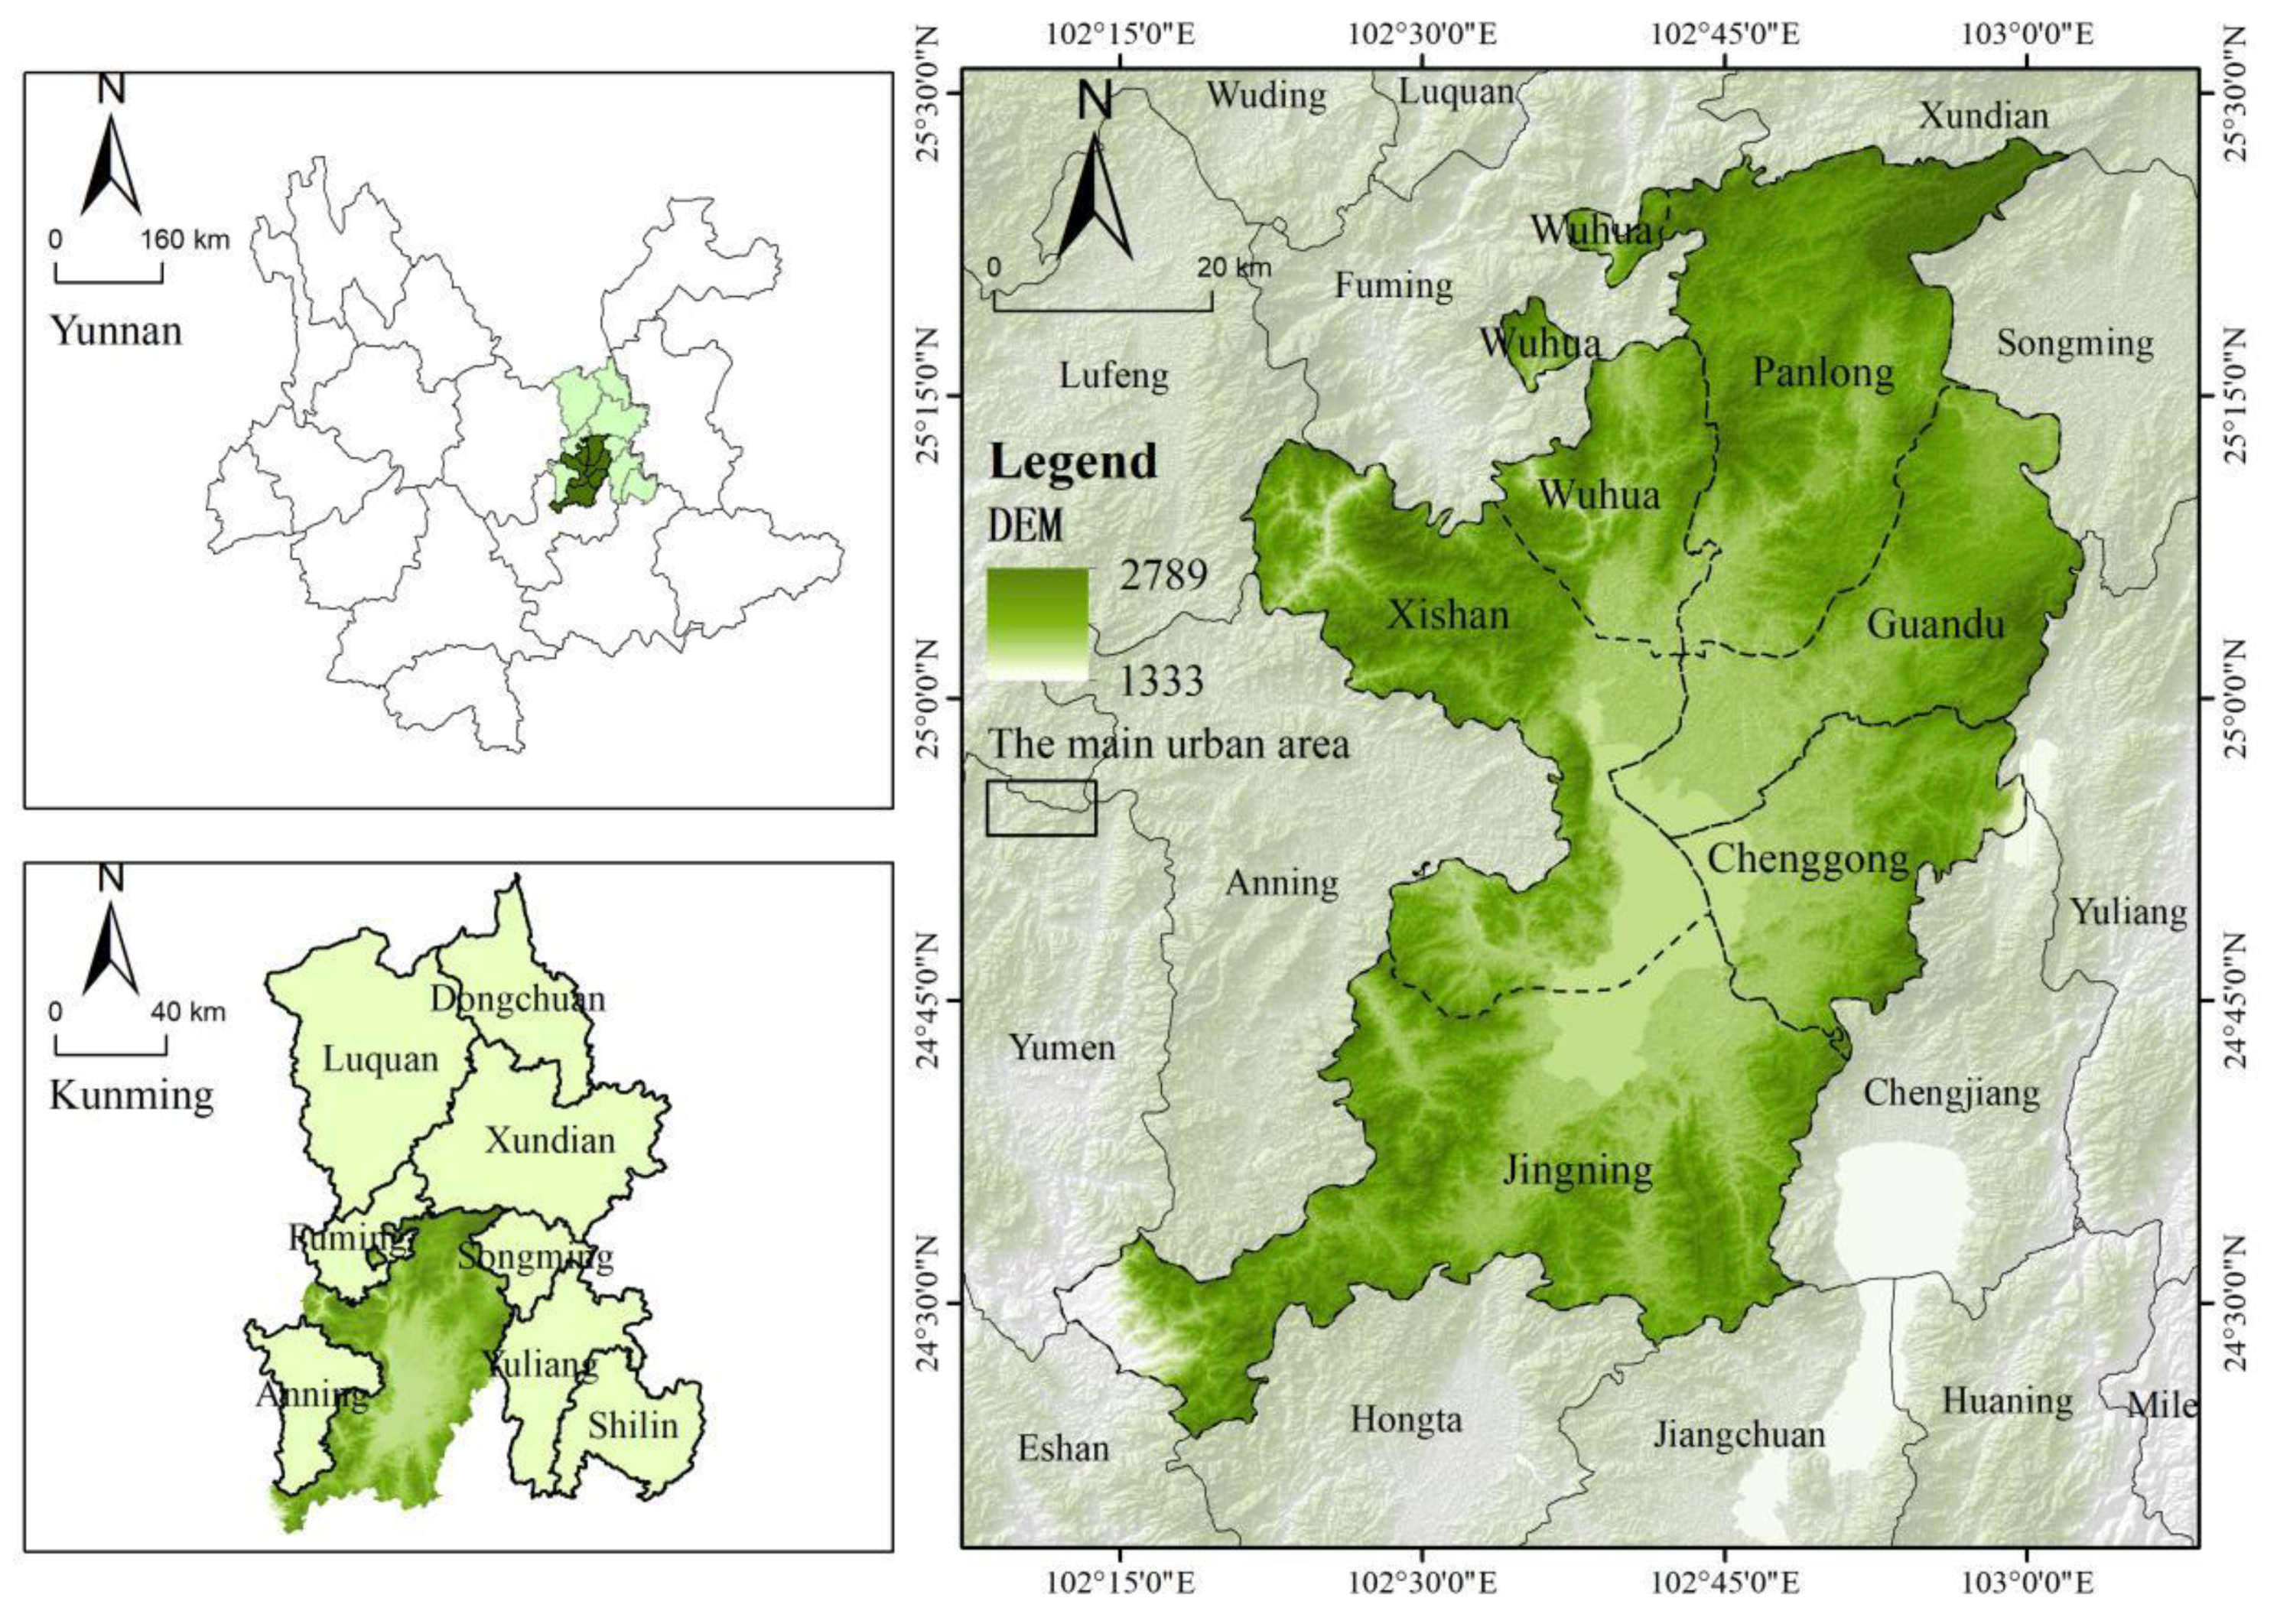
Figure 2.
diagram of the study.
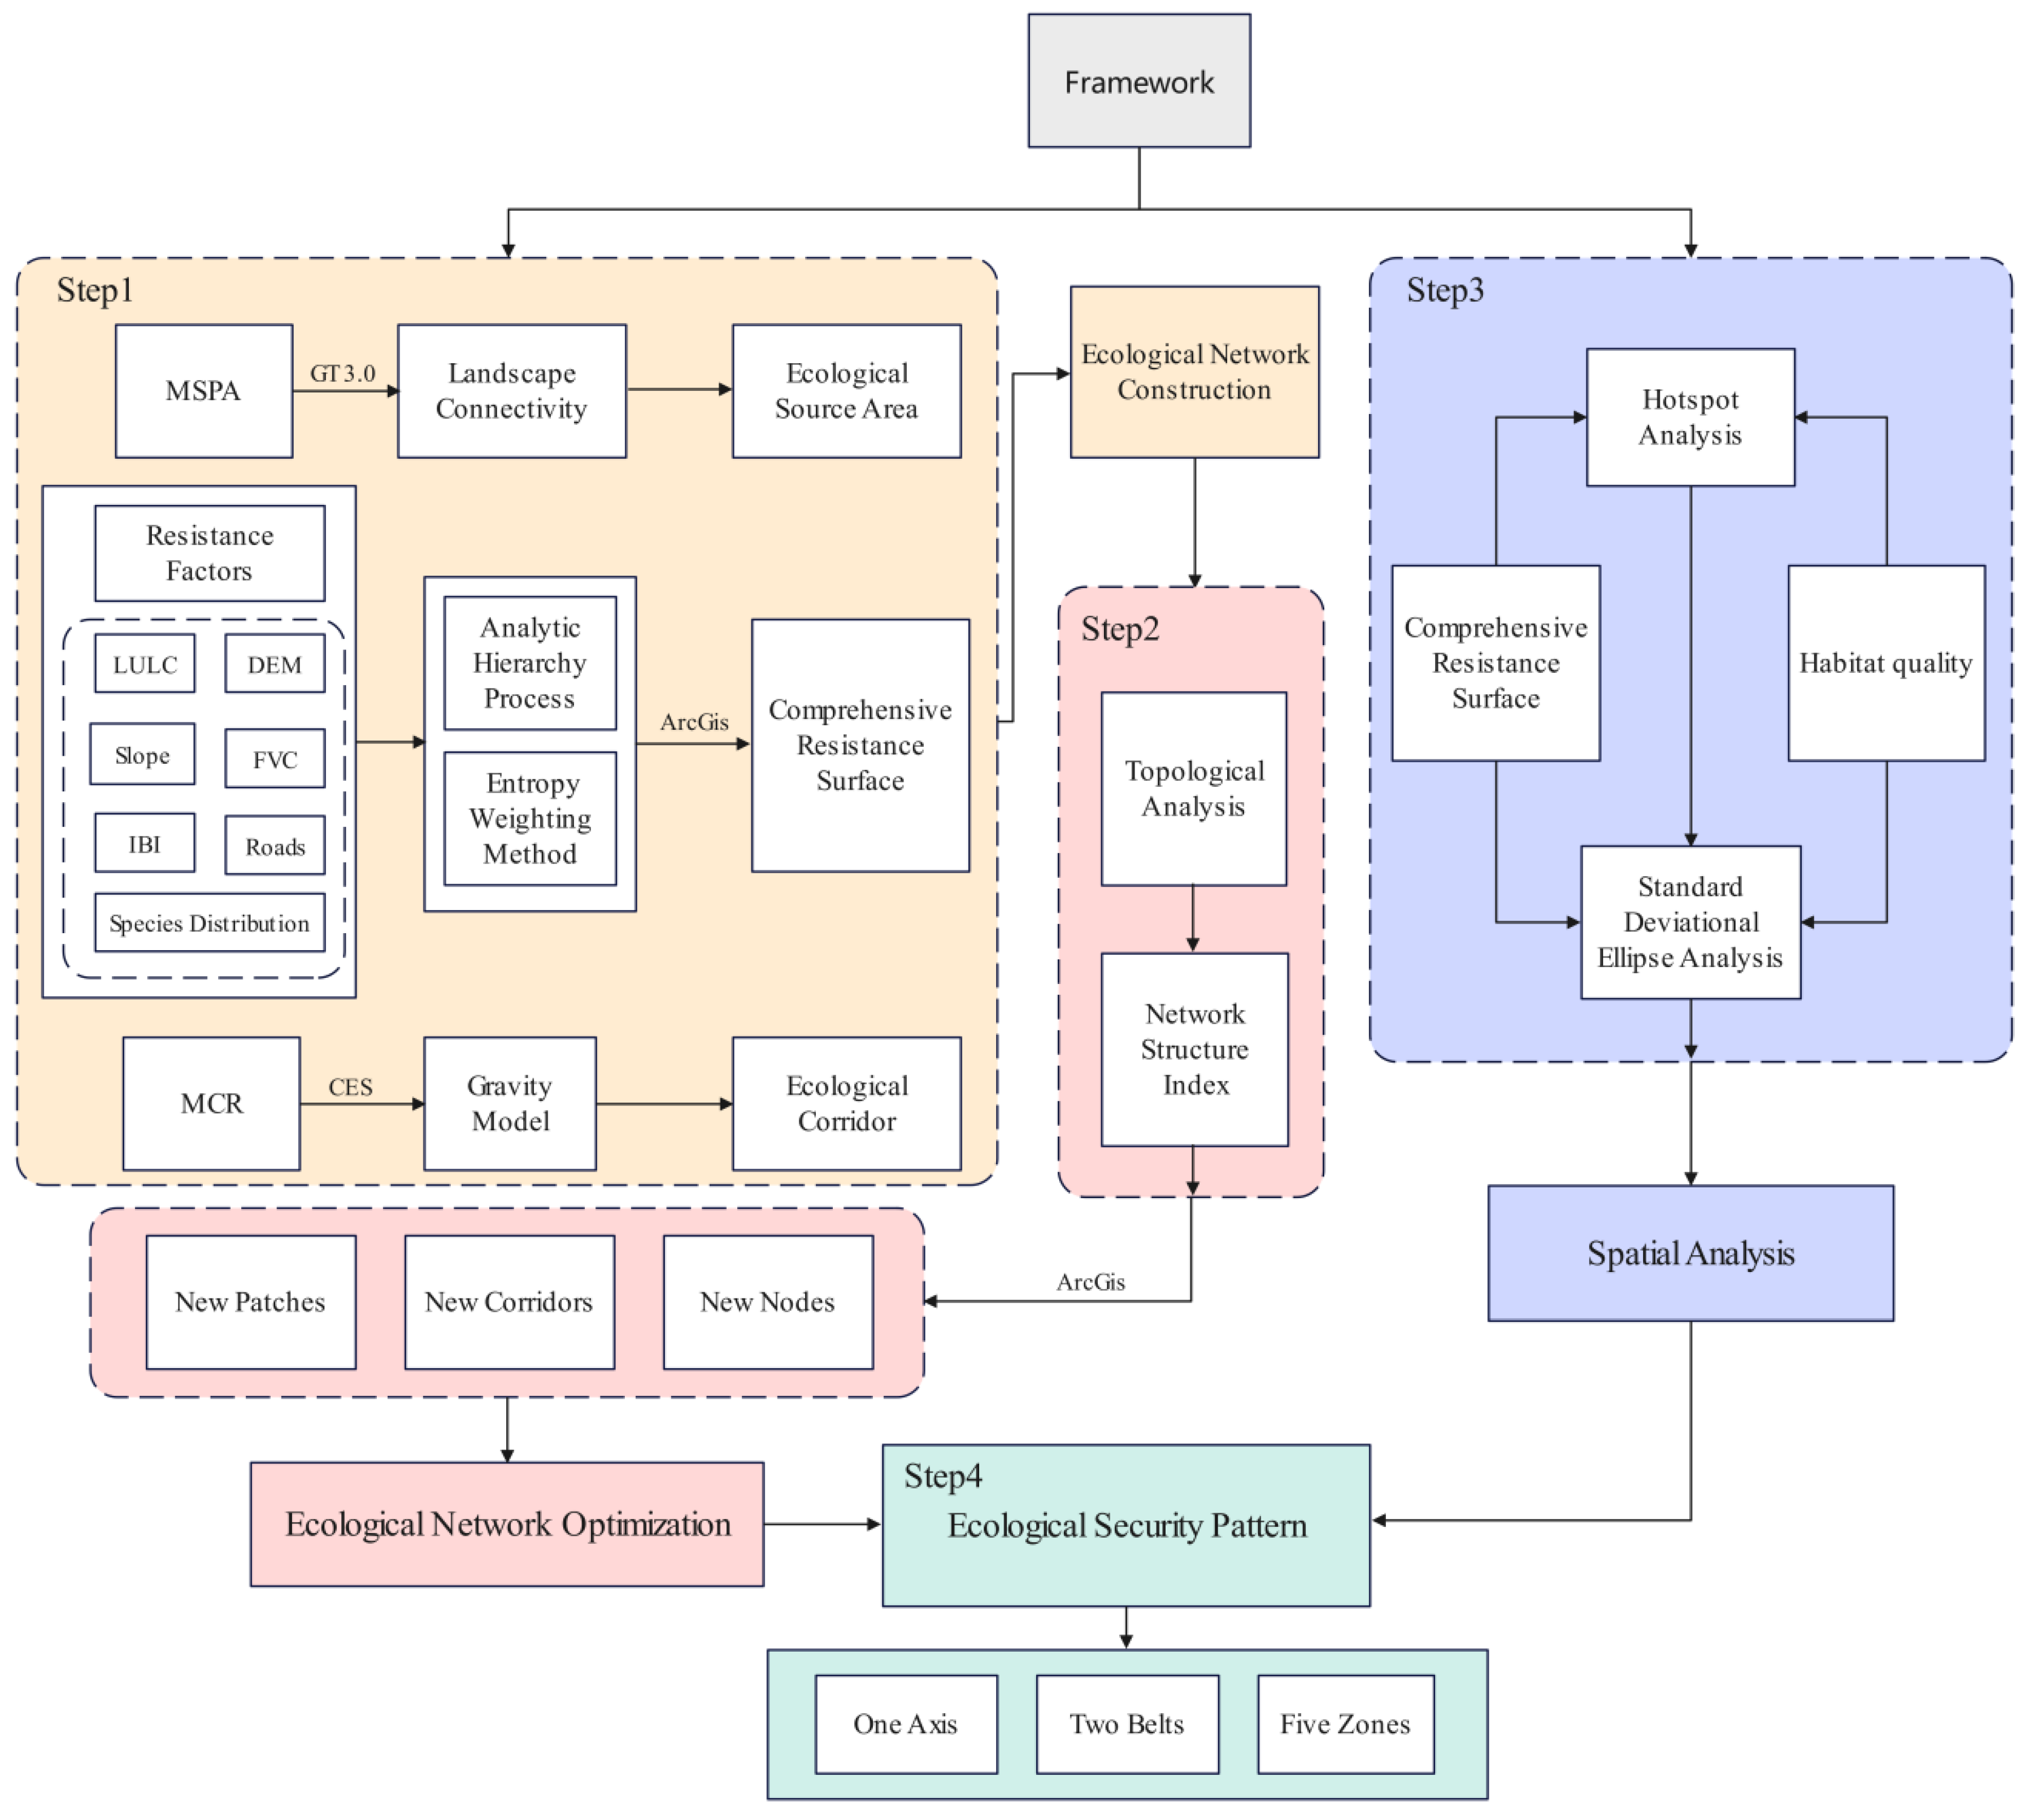
Figure 3.
(a), (b), (c), and (d) represent the resistance values of CLCD, Slope, IBI, and DEM, respectively; (e), (f), (g), and (h) represent the resistance values of FVC, Distance to Species Distribution, Distance to Roads, and Distance to Railways, respectively.
Figure 3.
(a), (b), (c), and (d) represent the resistance values of CLCD, Slope, IBI, and DEM, respectively; (e), (f), (g), and (h) represent the resistance values of FVC, Distance to Species Distribution, Distance to Roads, and Distance to Railways, respectively.
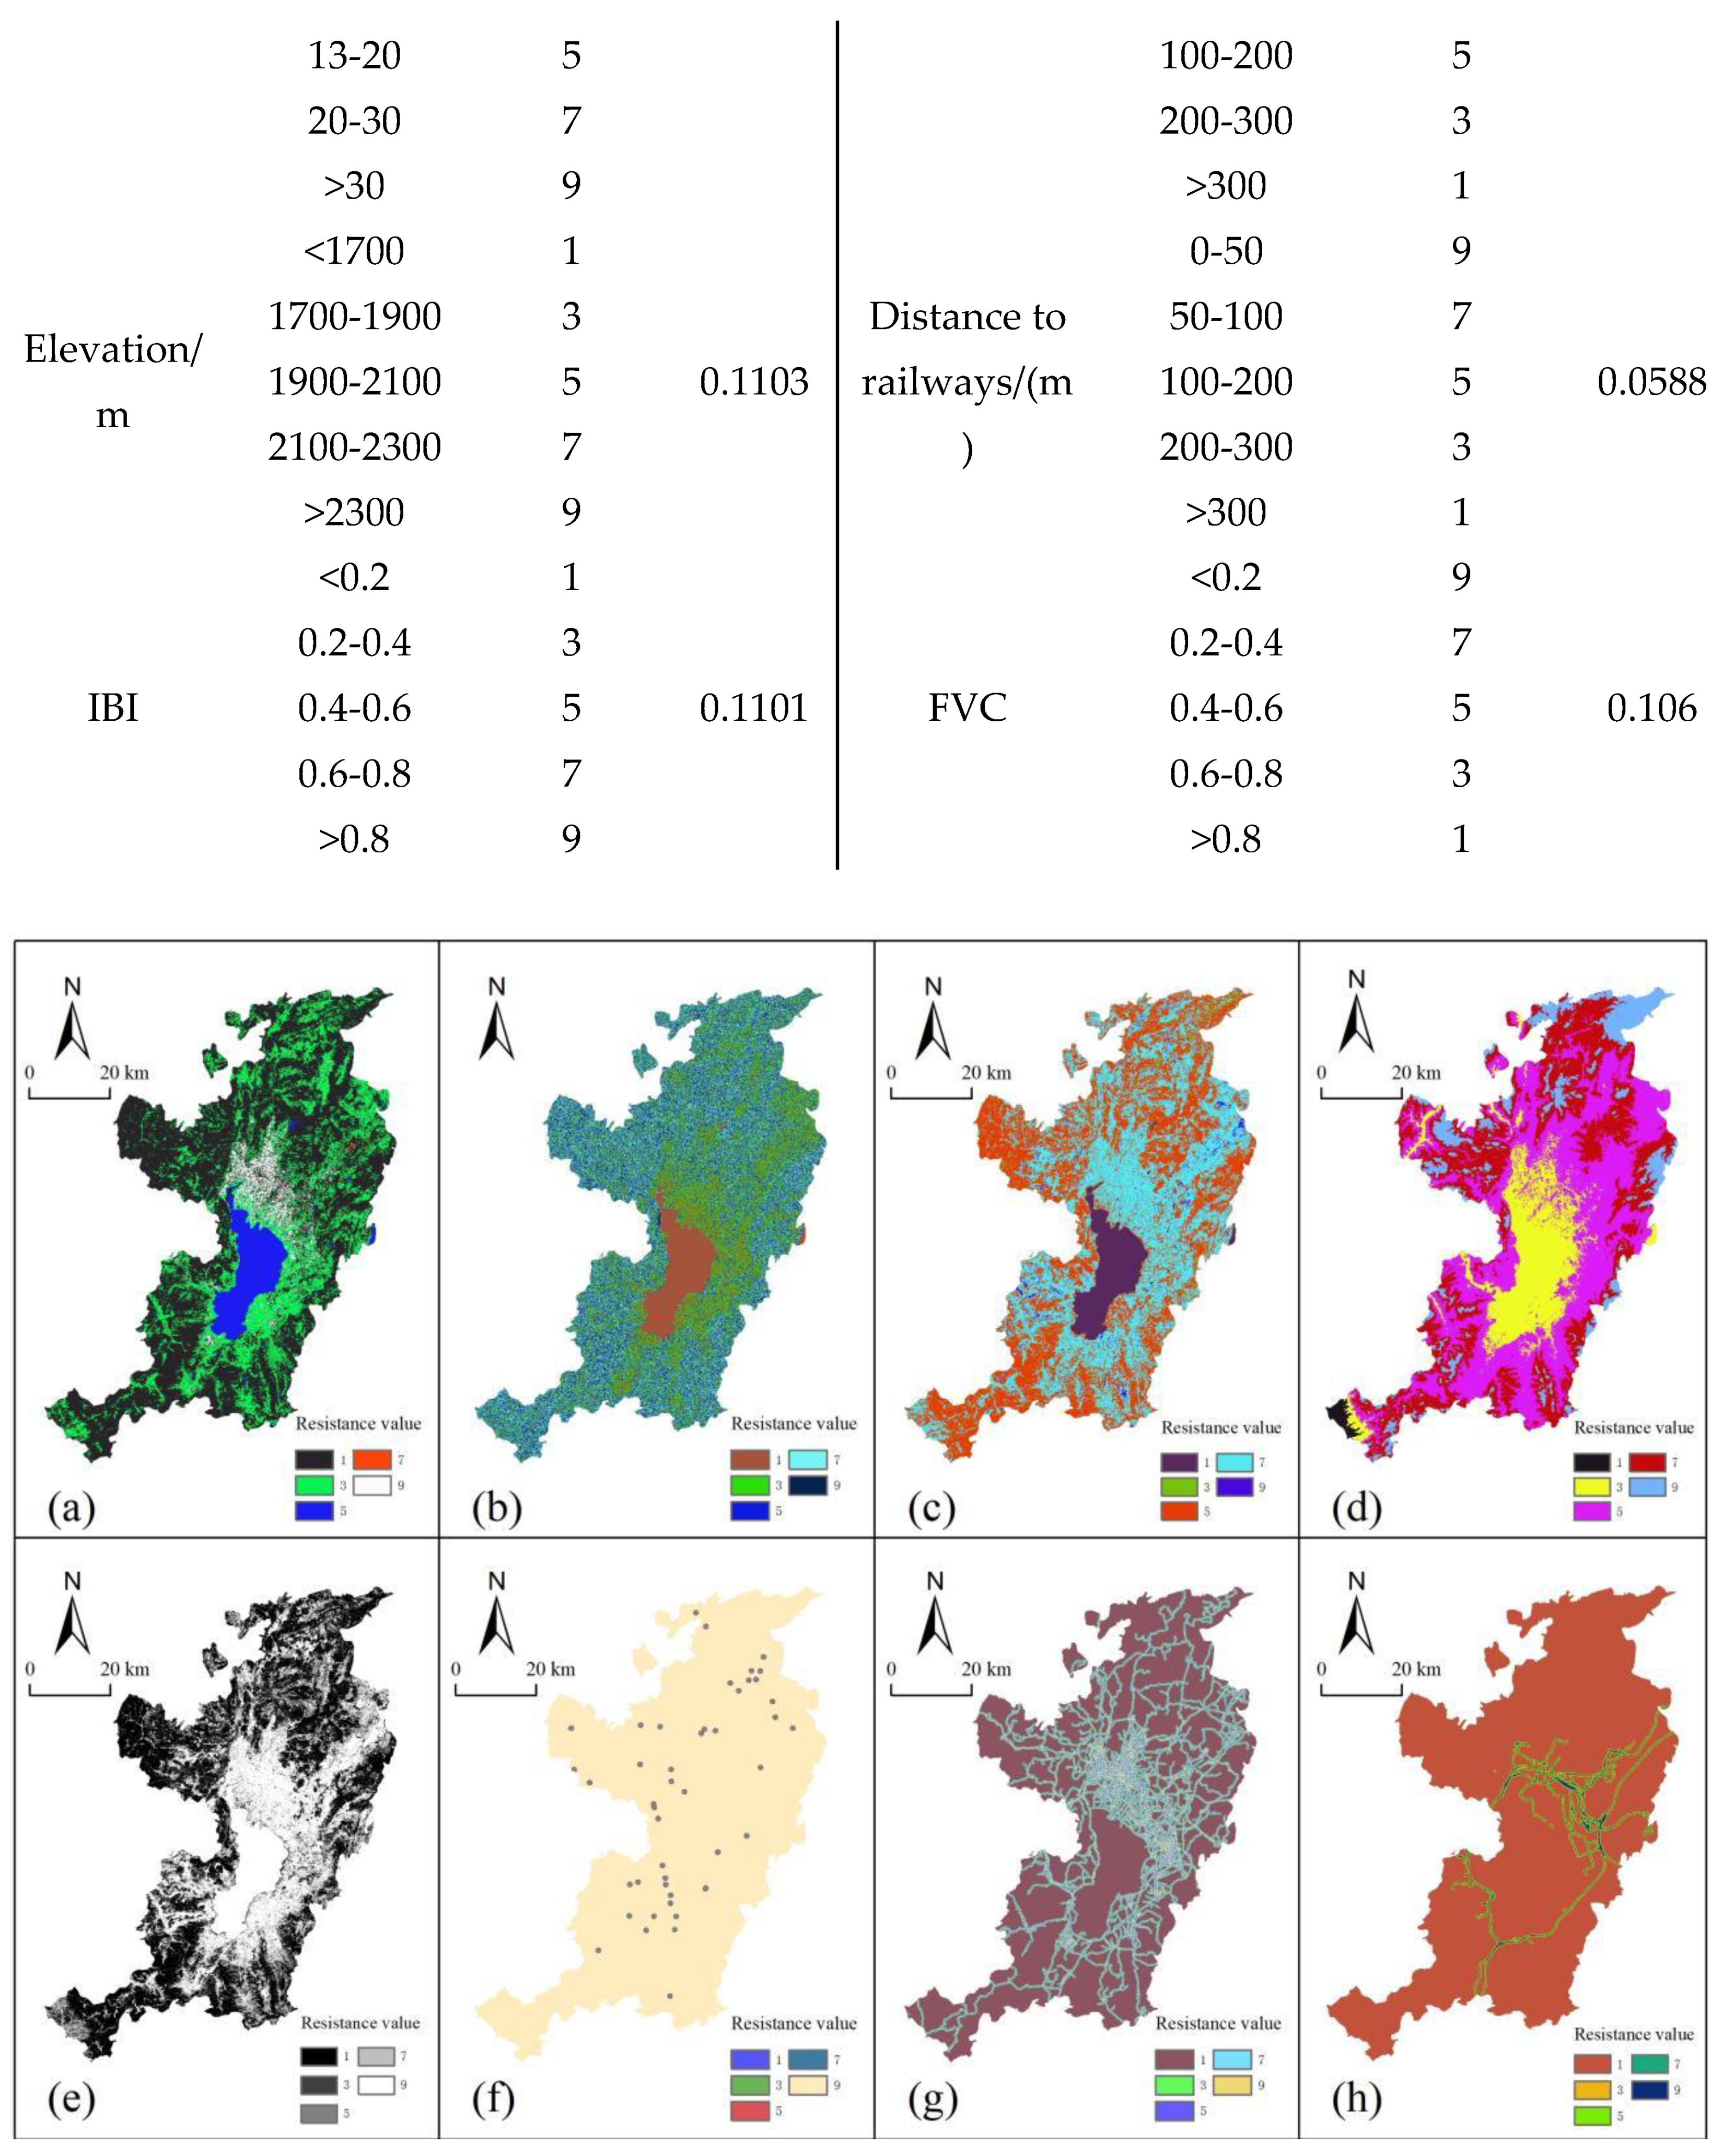
Figure 4.
Compositel resistance surface in the study area.
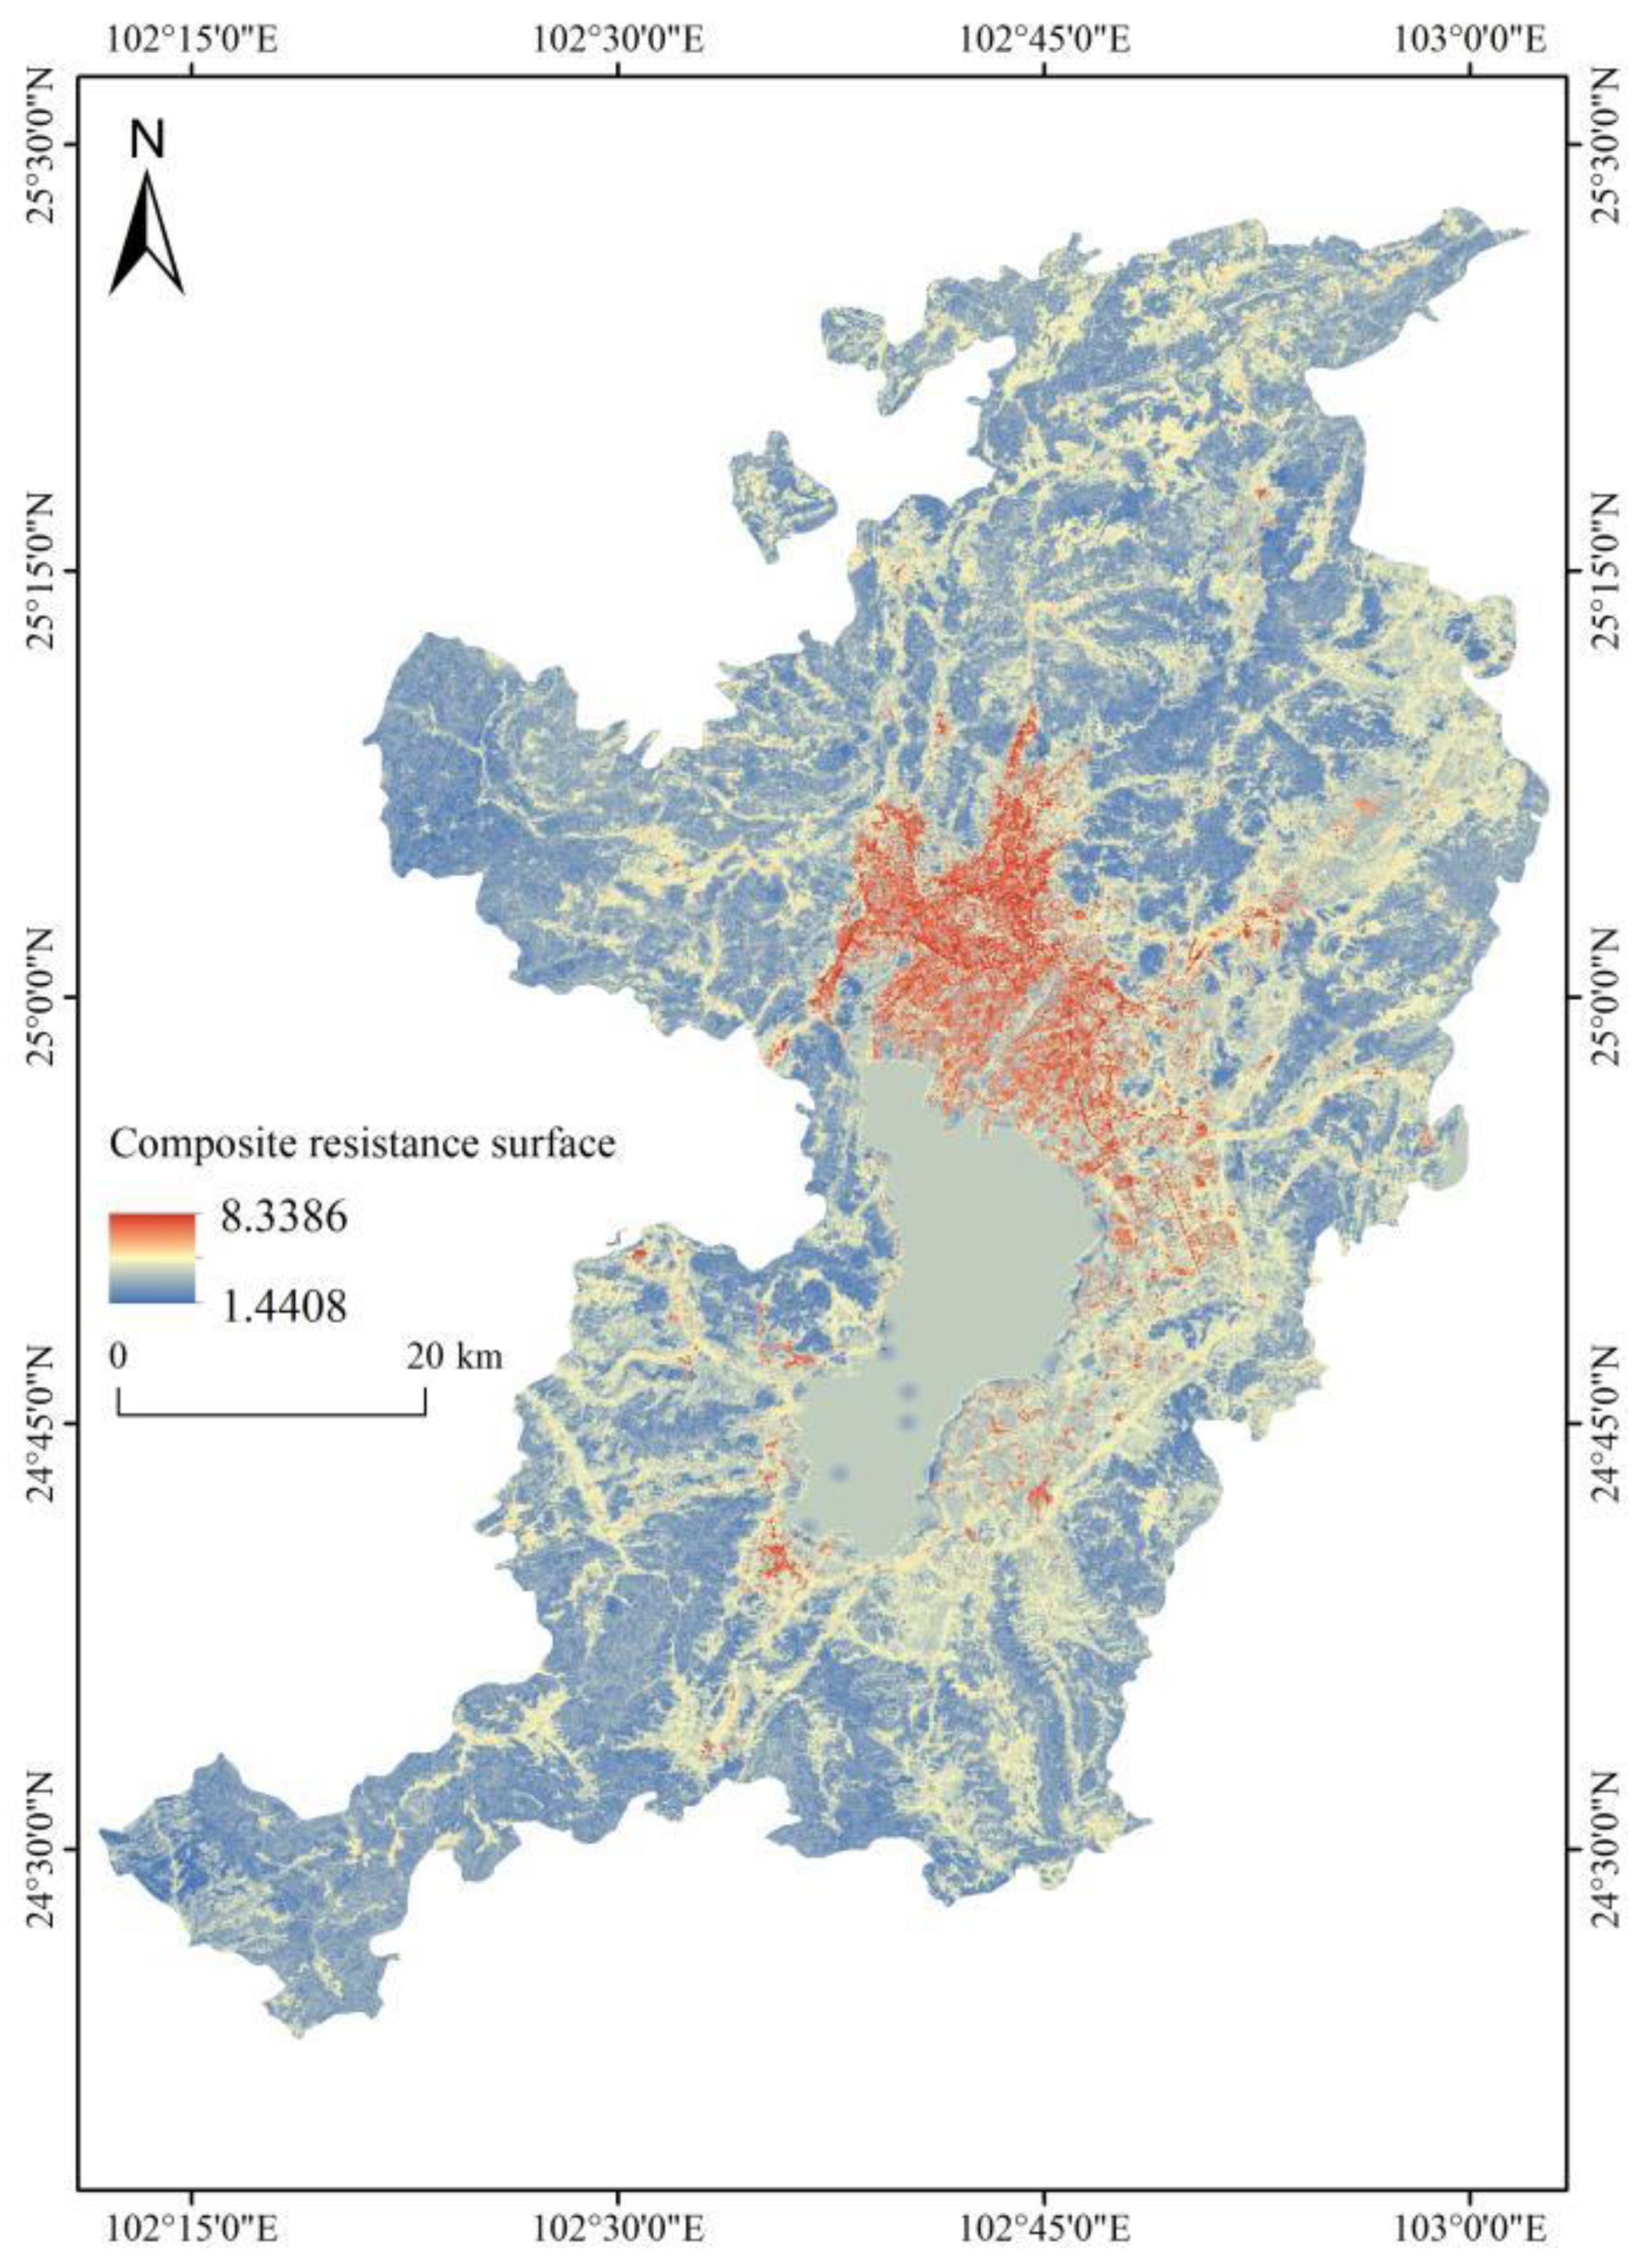
Figure 5.
Interaction Force Heatmap Based on the Gravity Model.
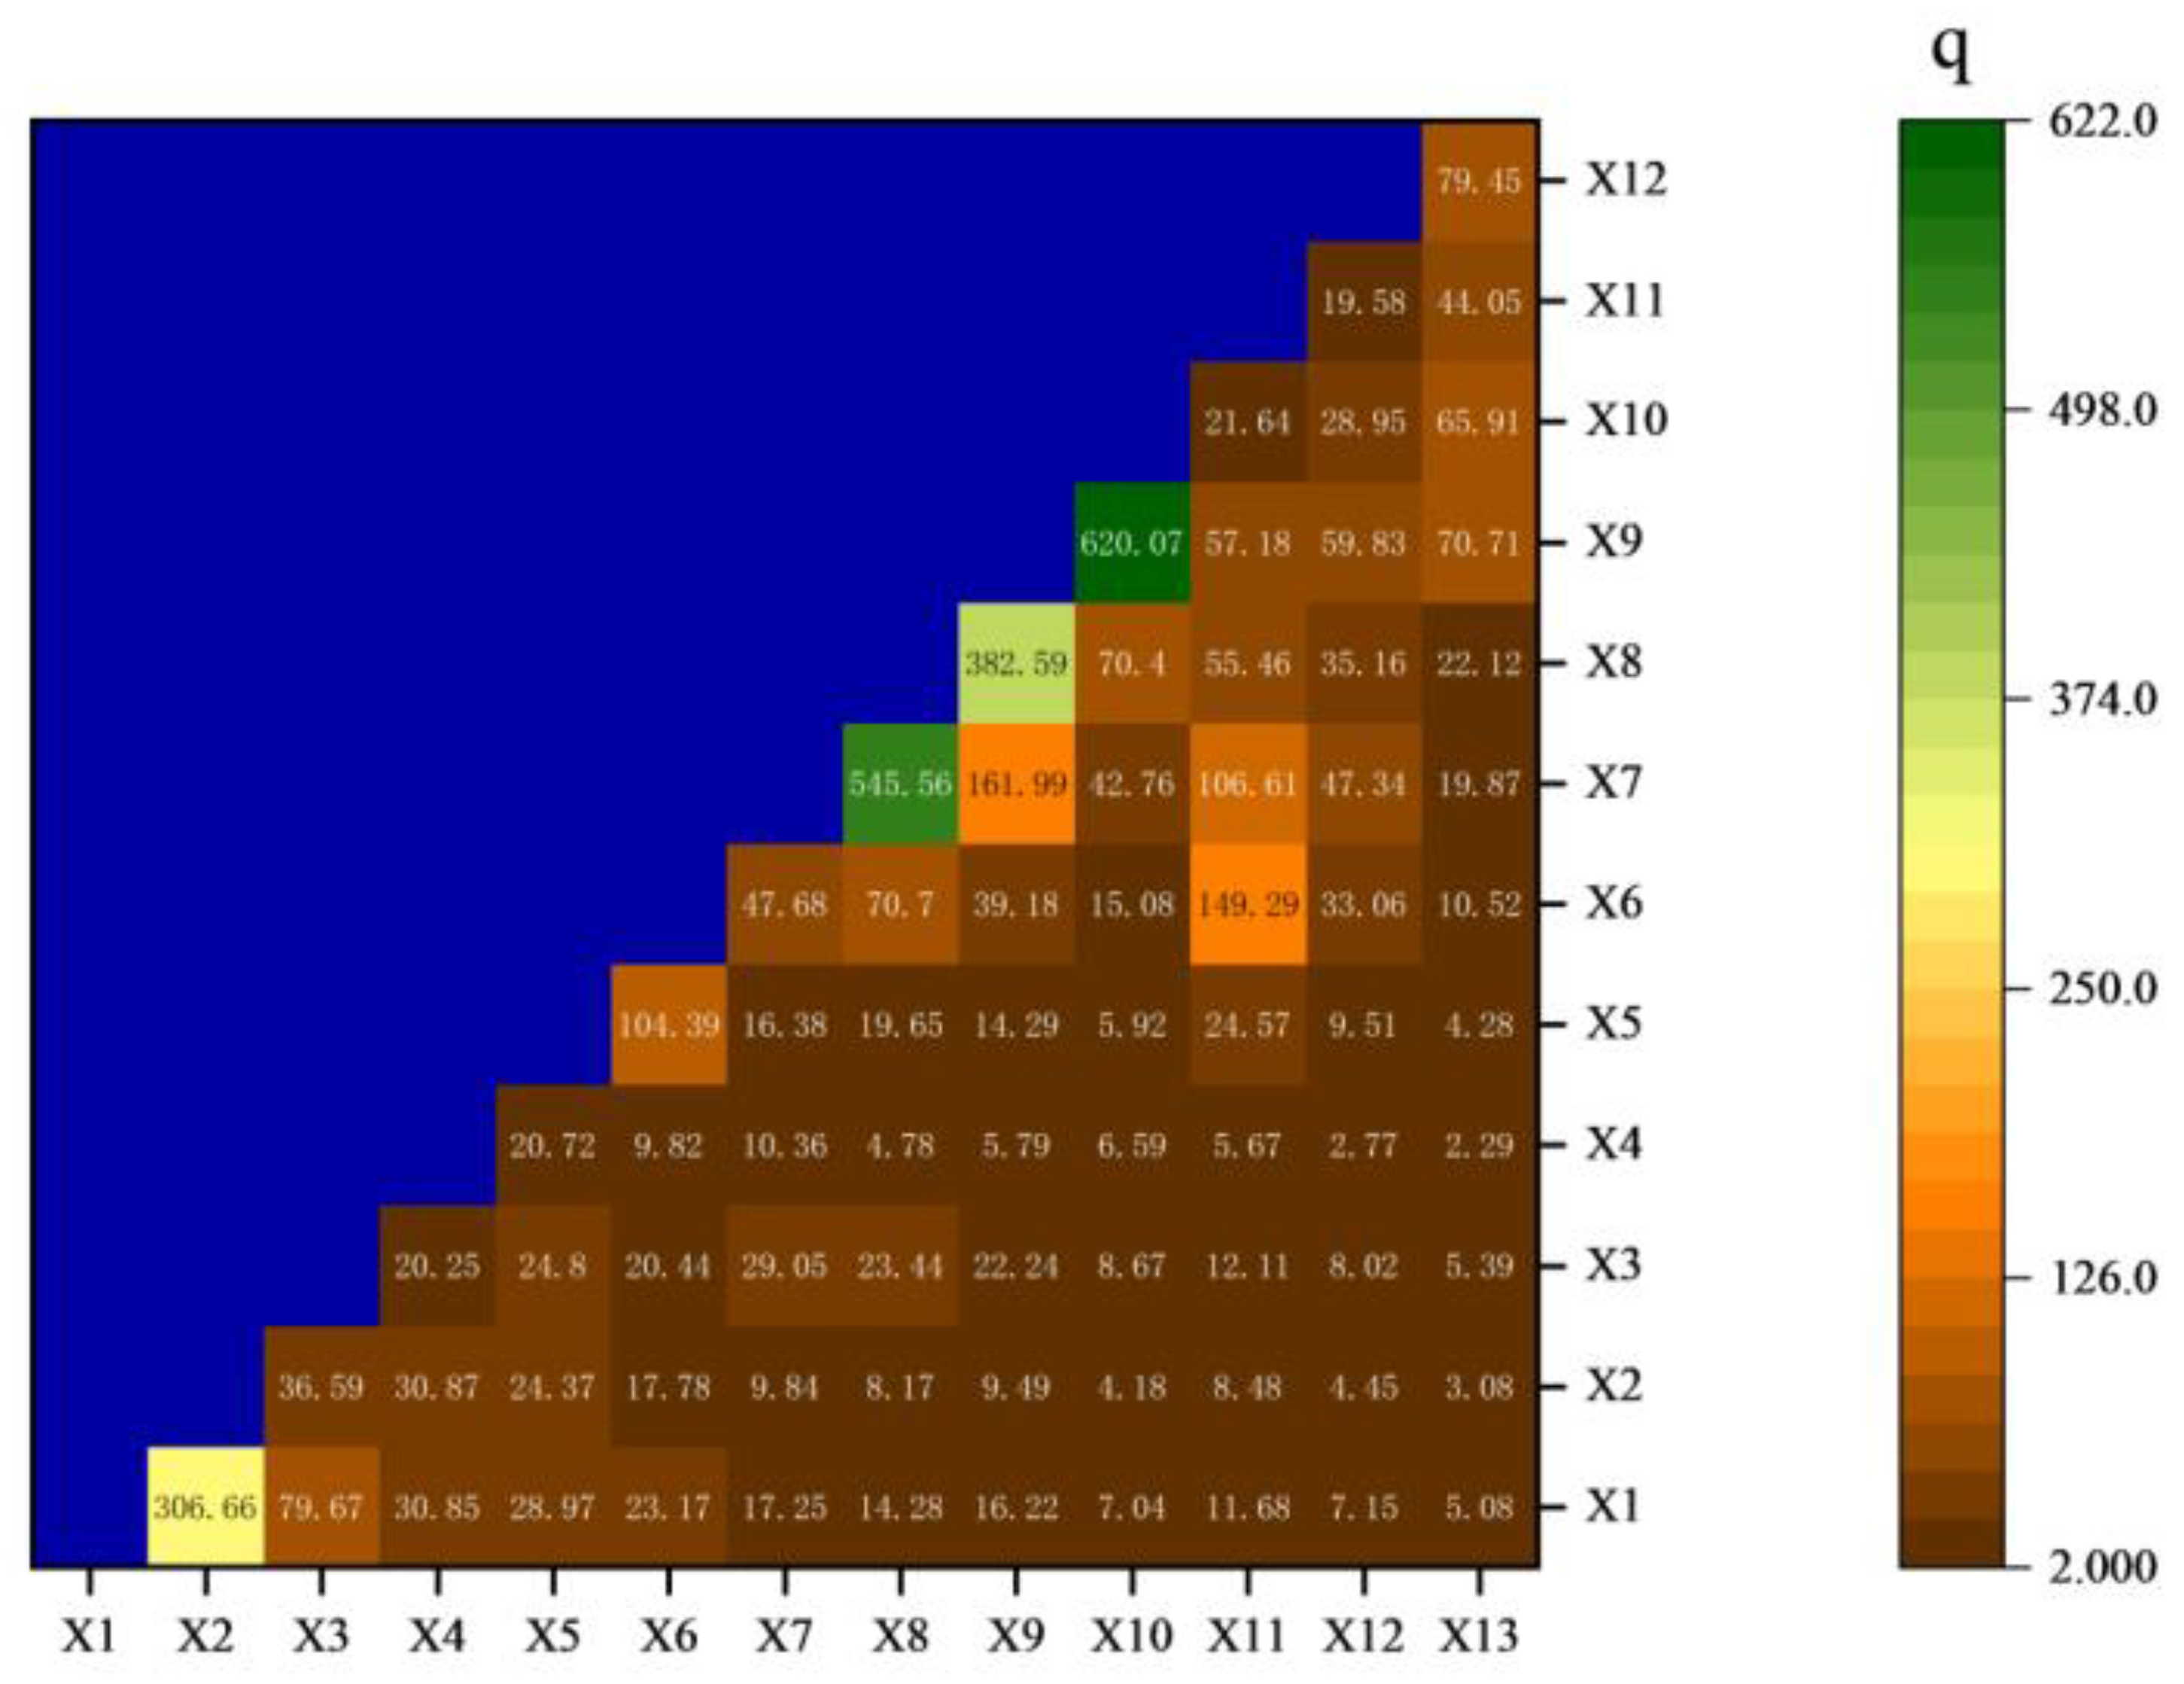
Figure 6.
shows the radiation range of ecological source areas in the study area and the non-radiated areas.
Figure 6.
shows the radiation range of ecological source areas in the study area and the non-radiated areas.
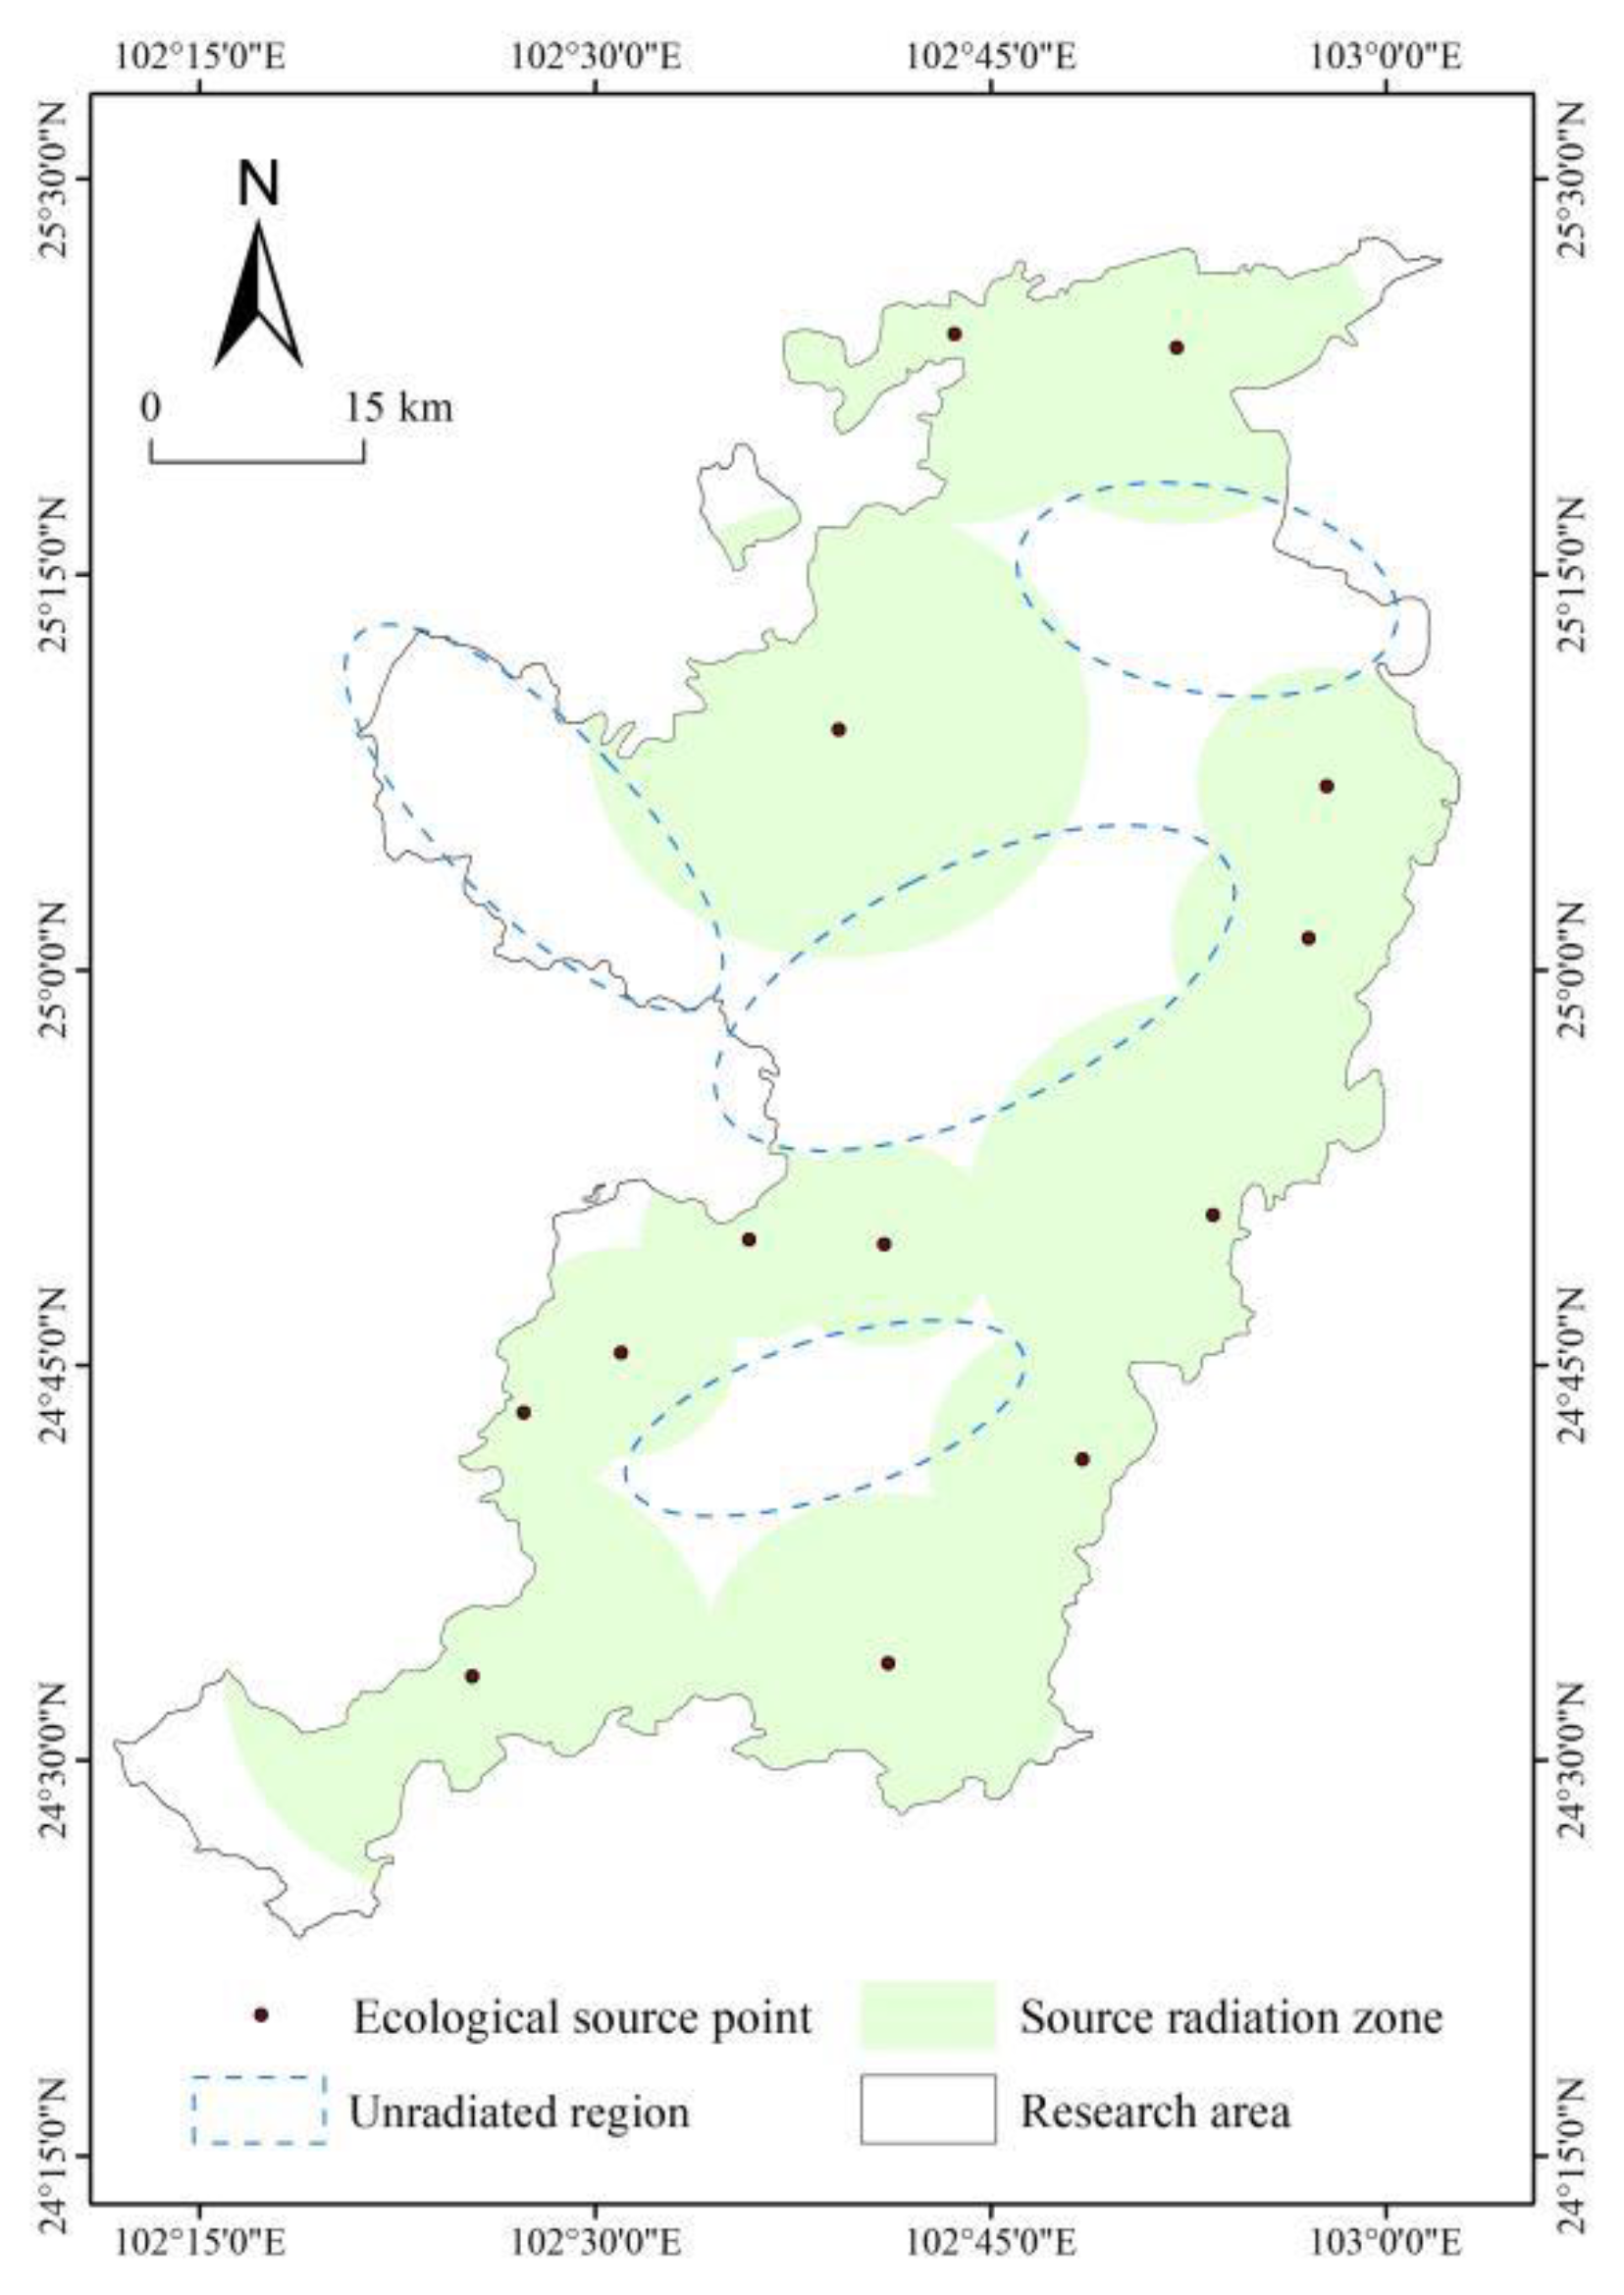
Figure 7.
Newly added ecological patches in the study area.
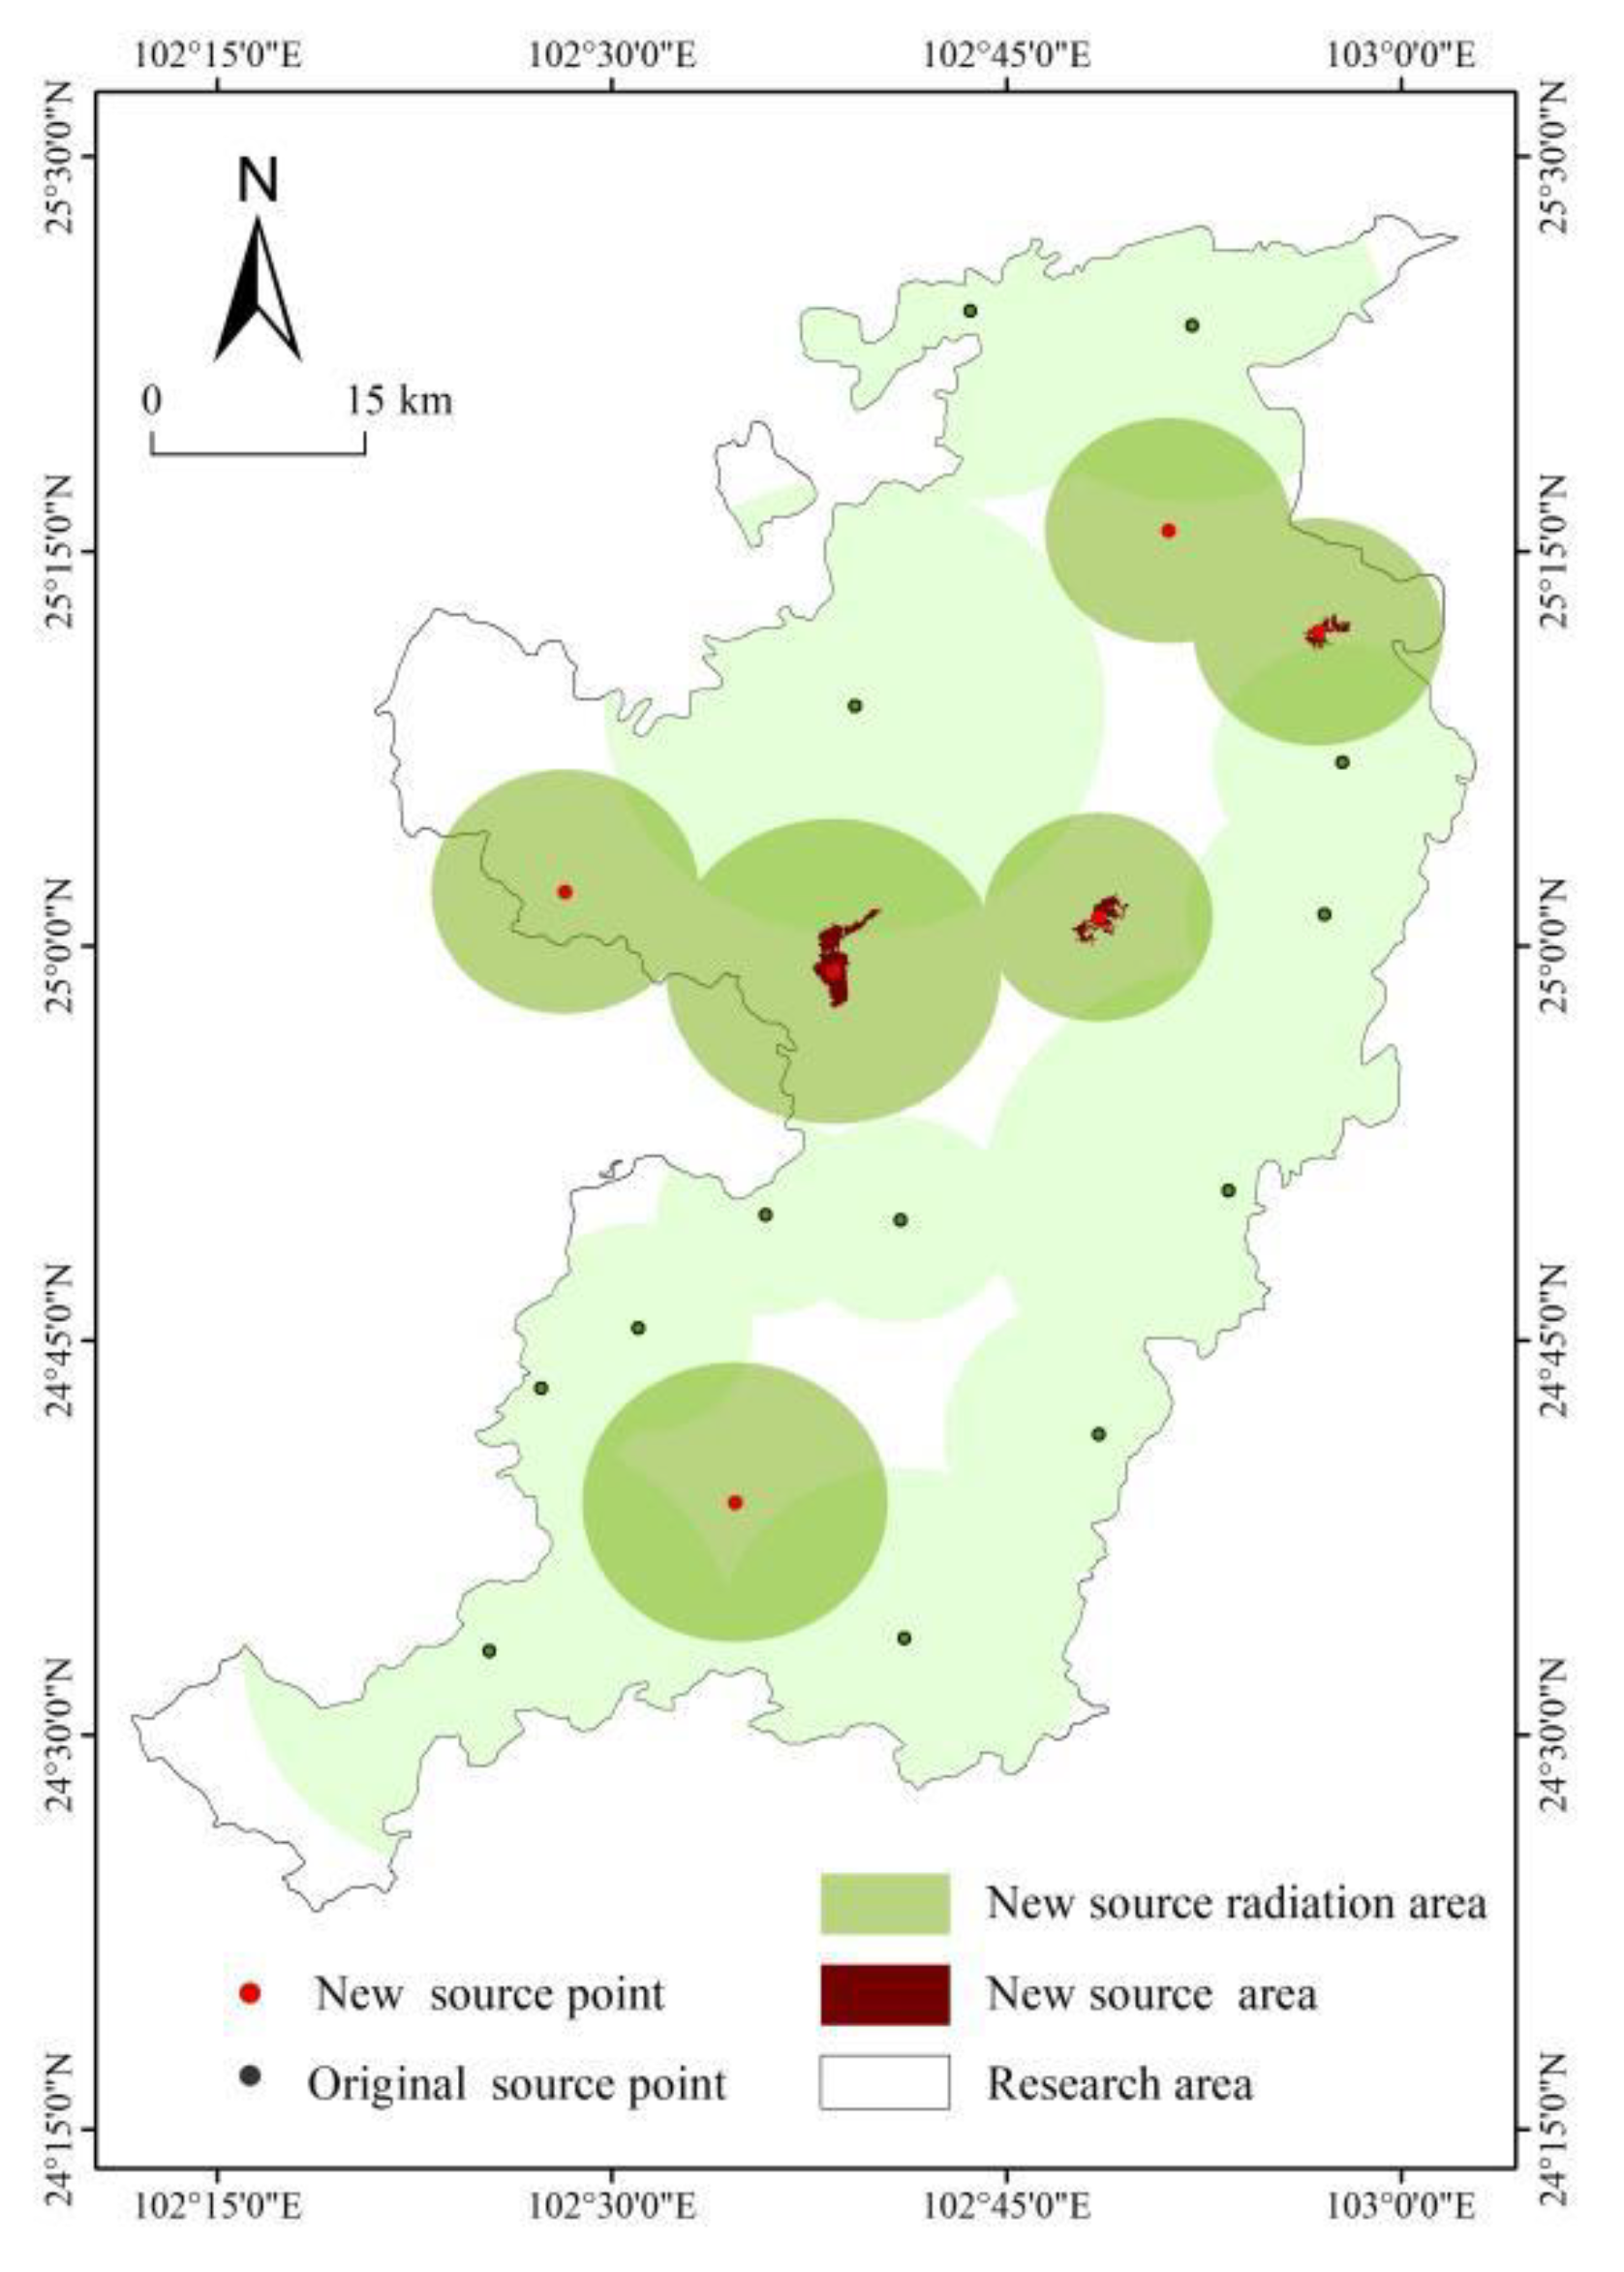
Figure 8.
a and b show the spatial distribution of newly added ecological corridors and ecological patches in the study area.
Figure 8.
a and b show the spatial distribution of newly added ecological corridors and ecological patches in the study area.
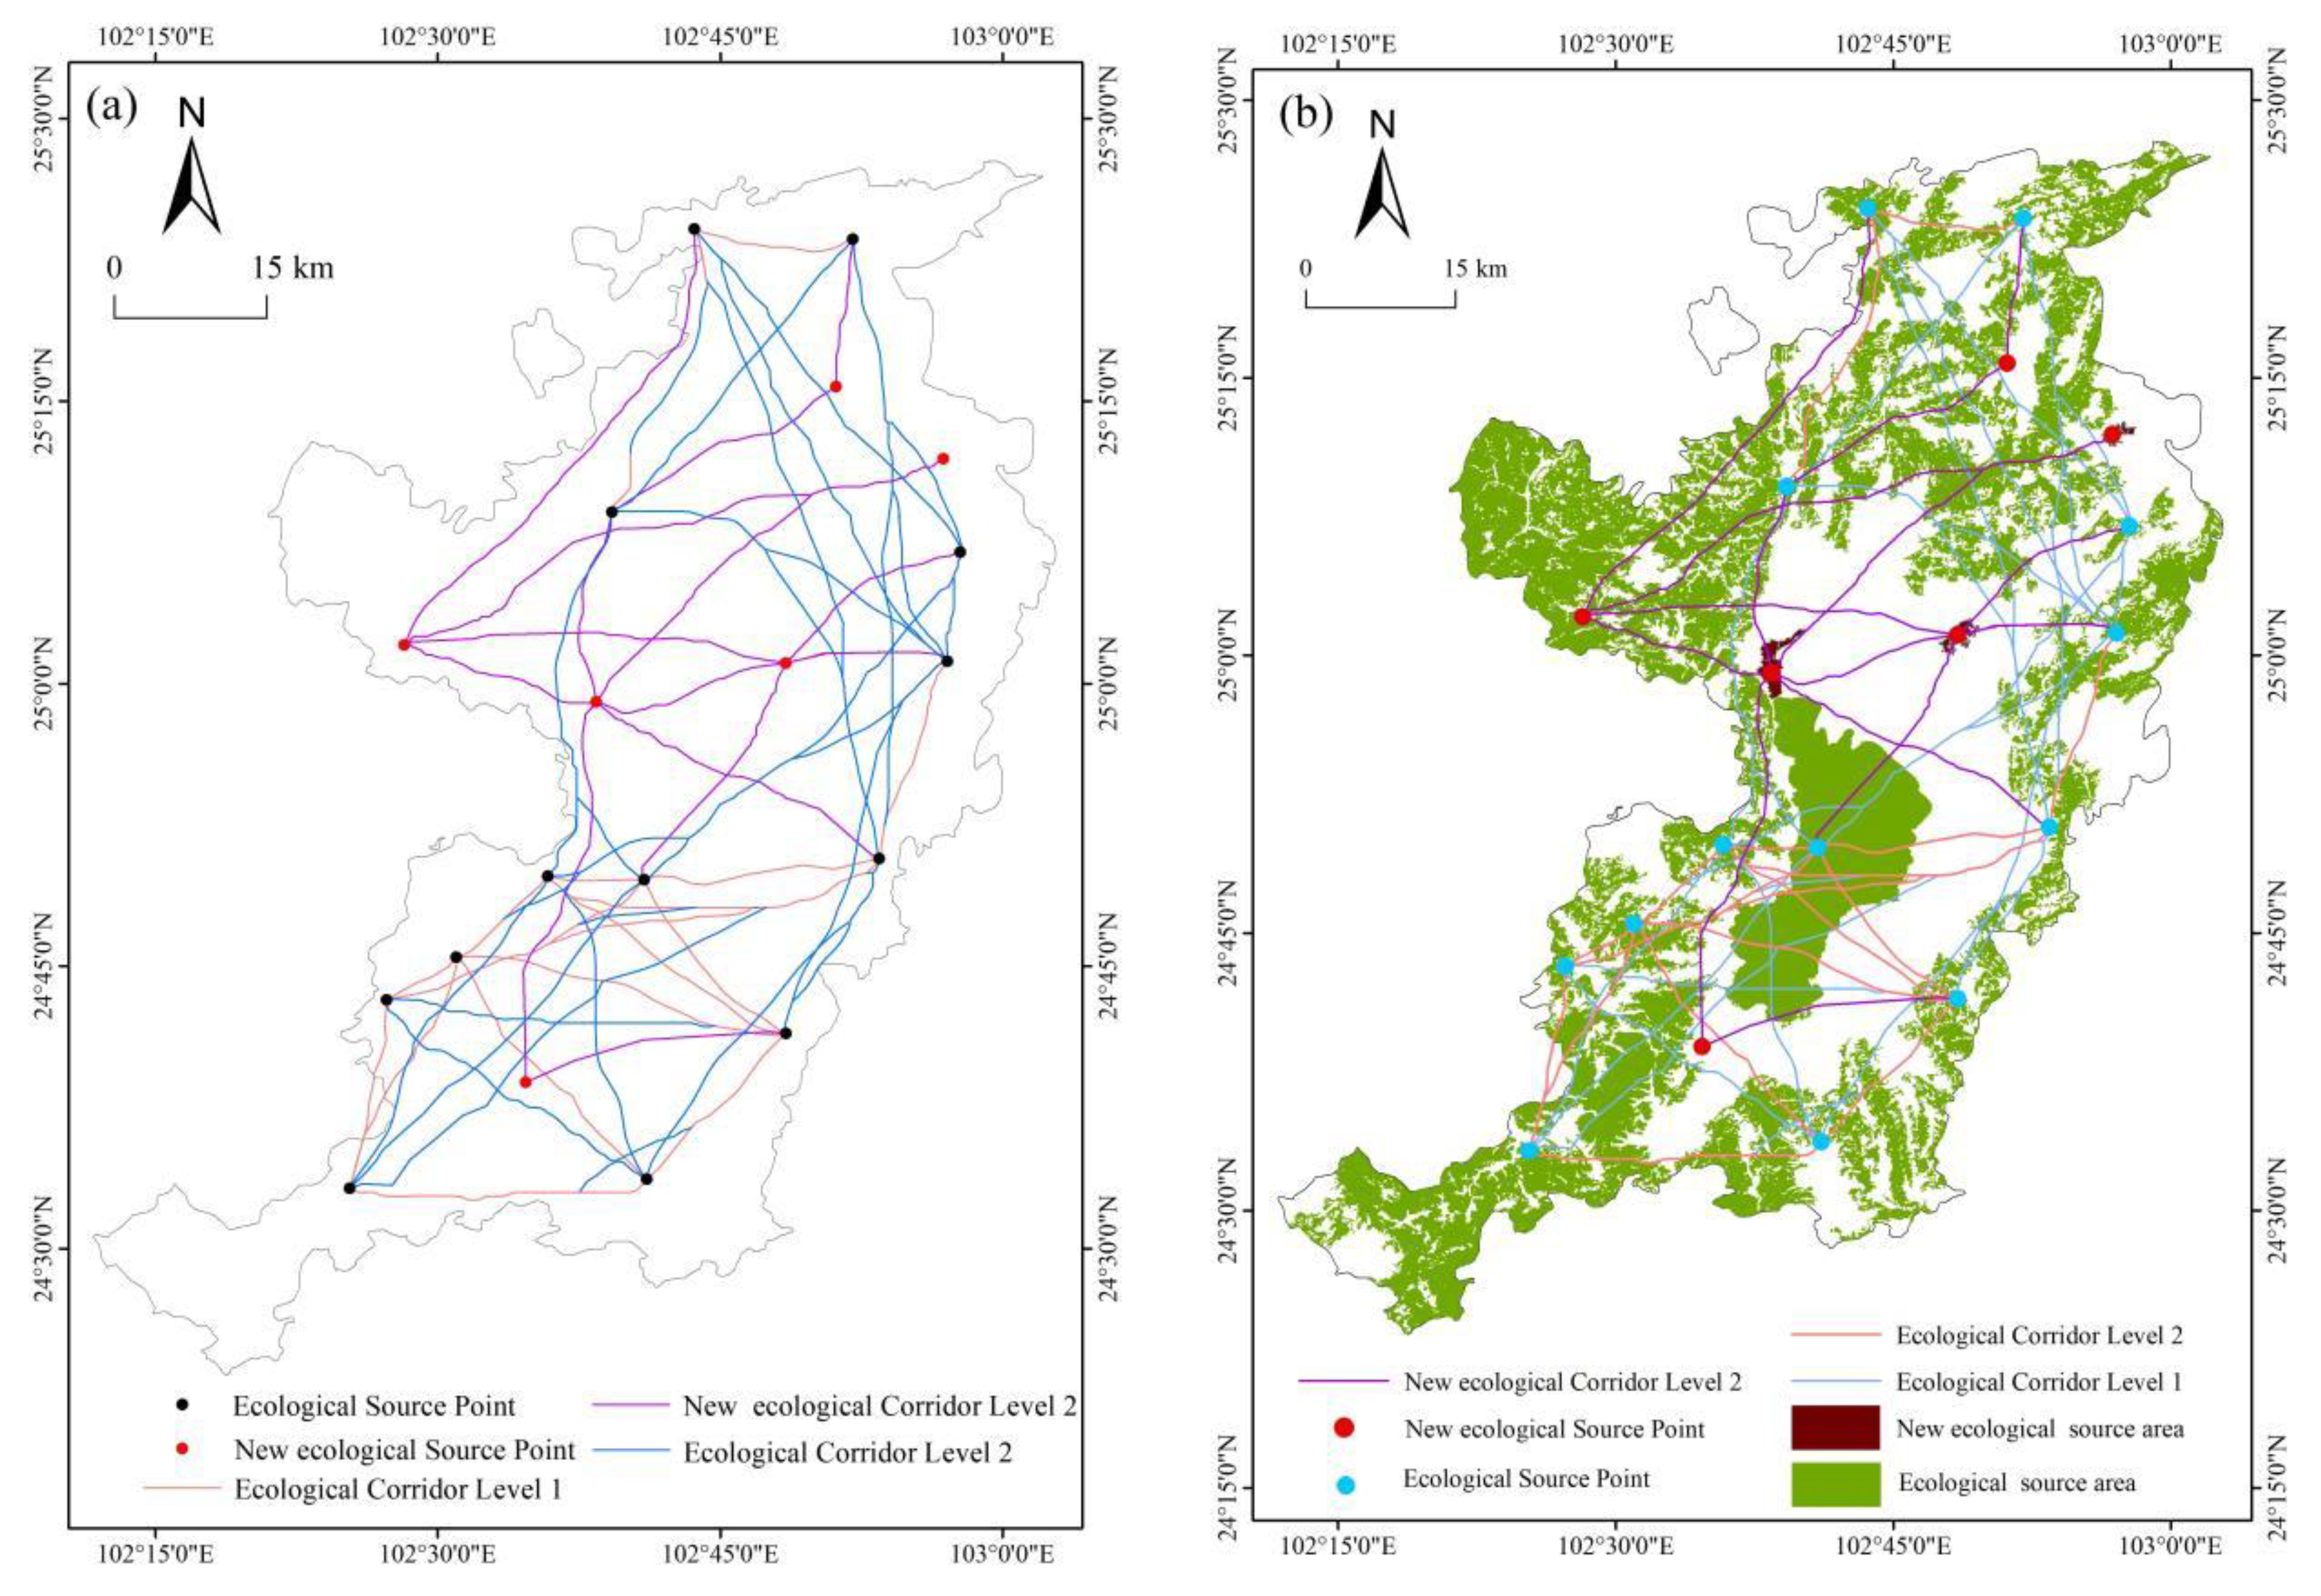
Figure 9.
New ecological nodes, stepping stones and breakpoints in the study area.
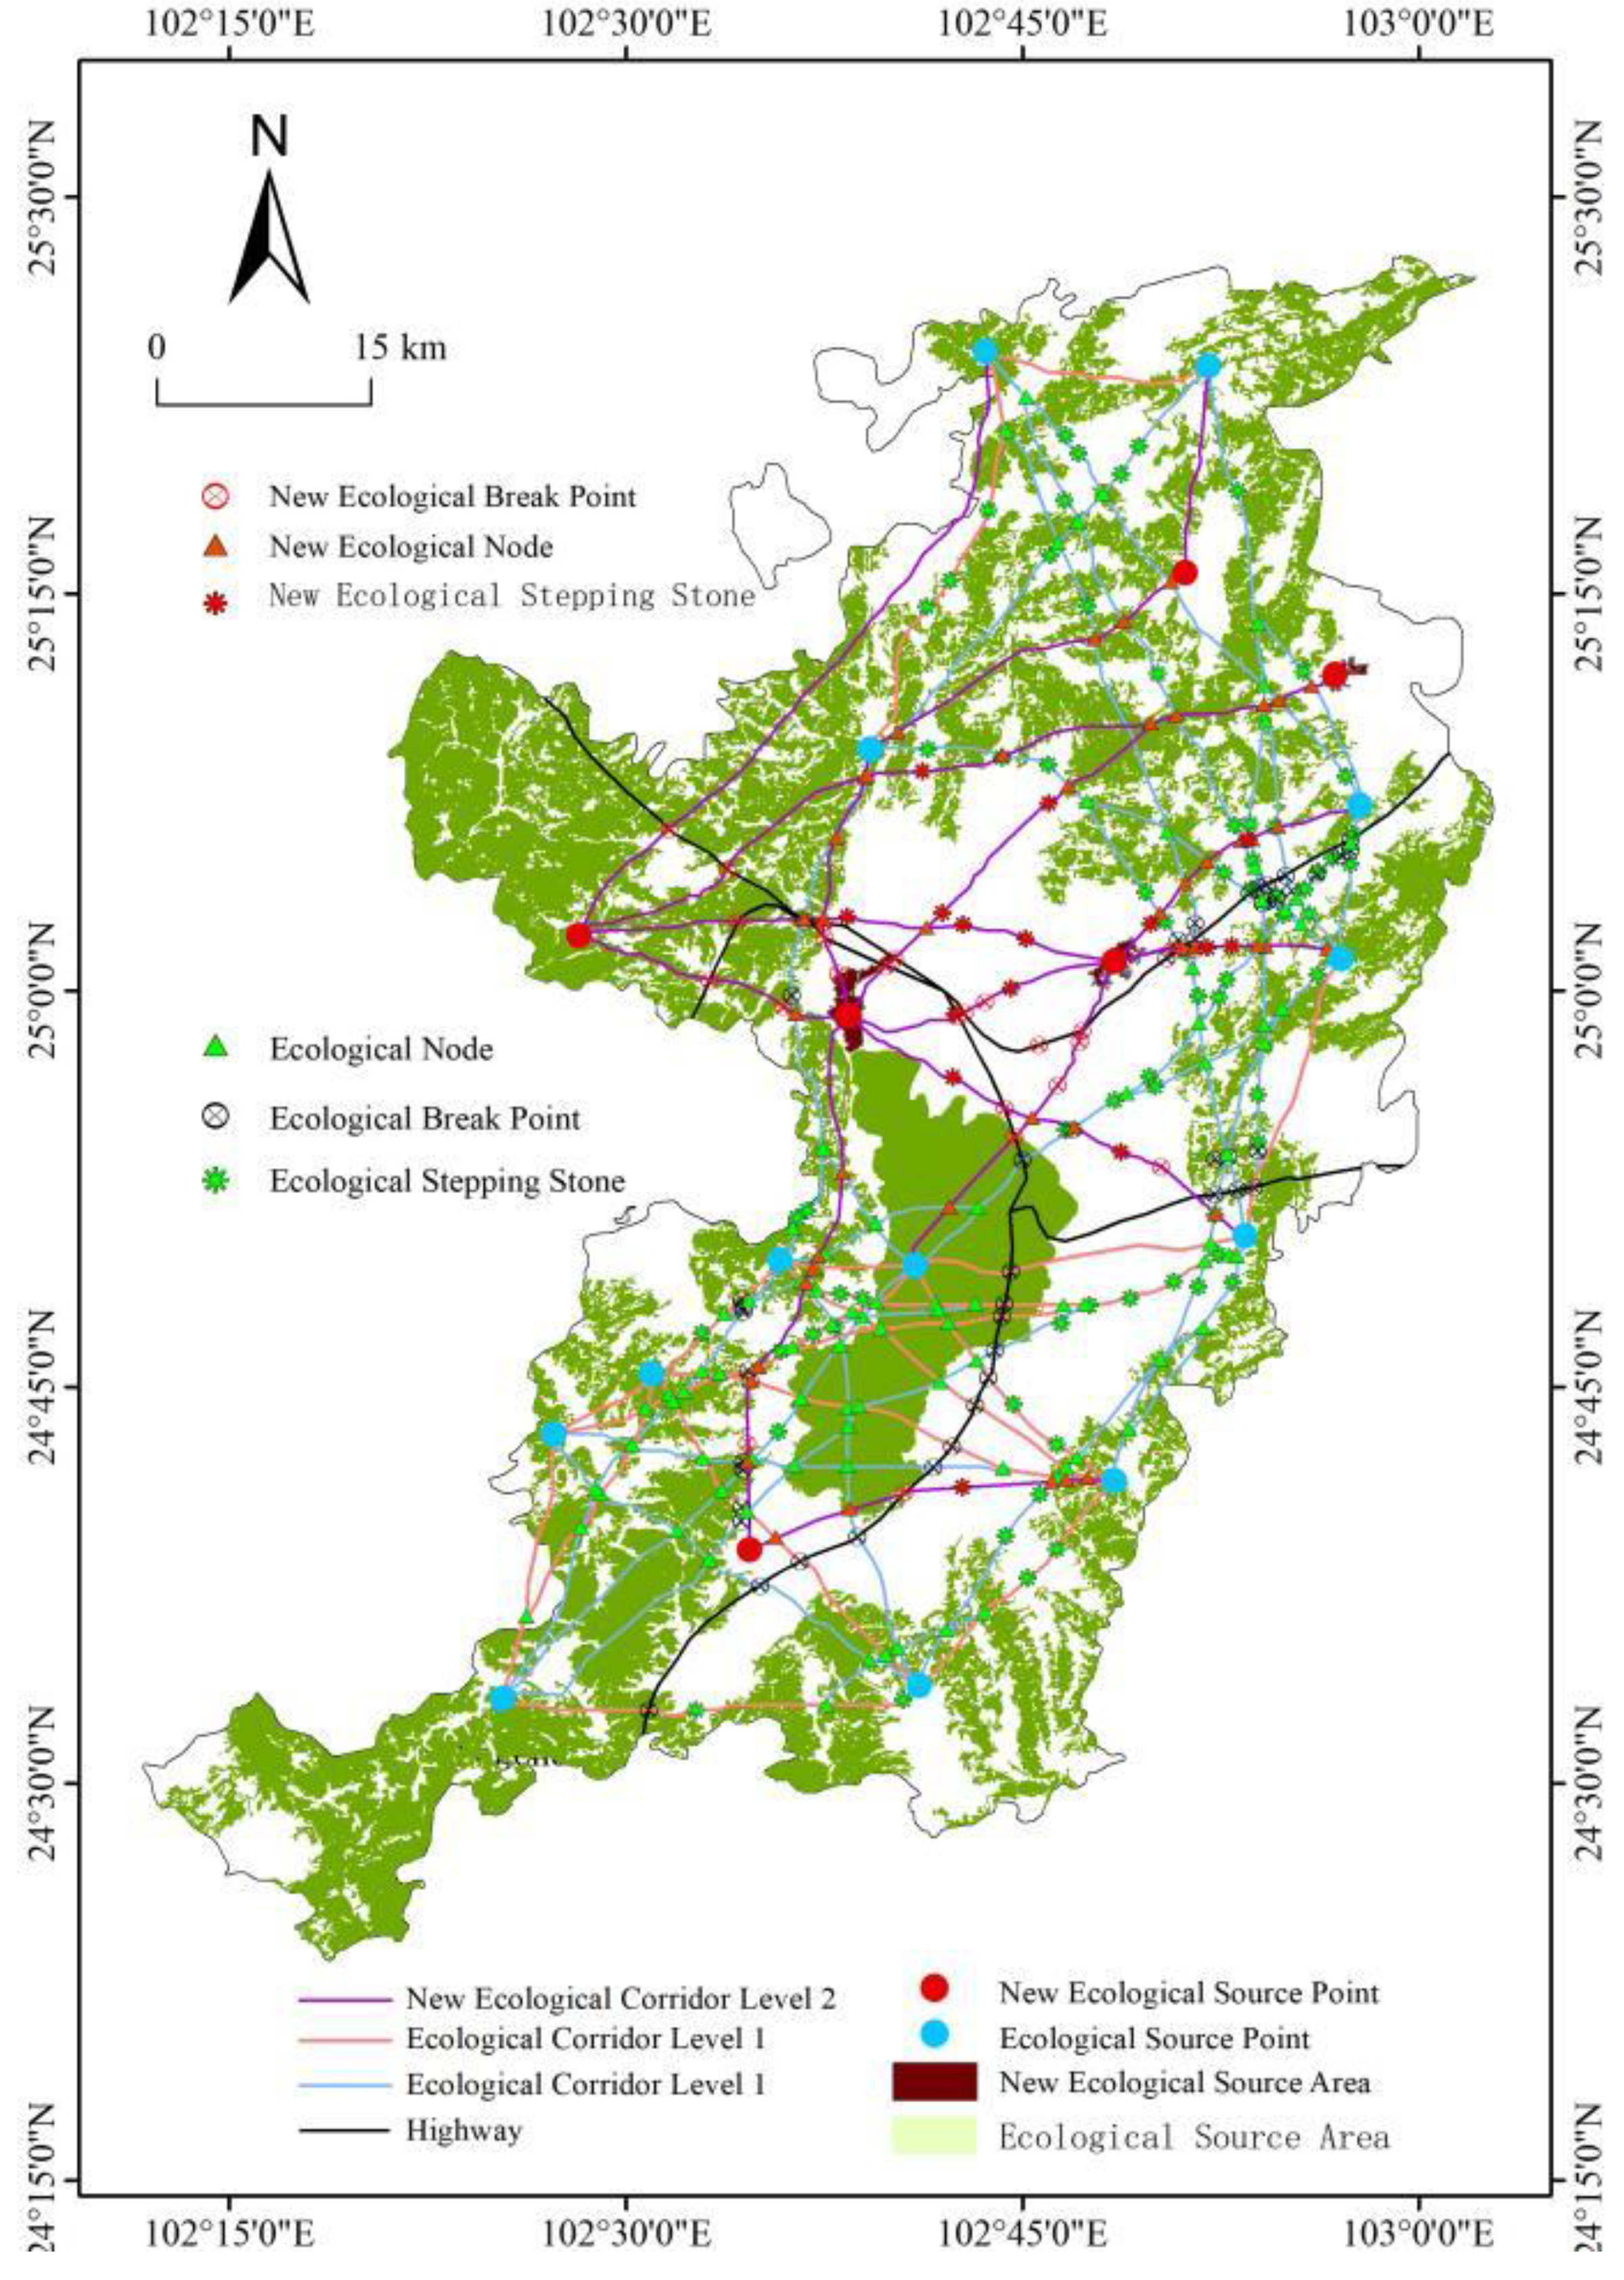
Figure 10.
a and c respectively represent the hot spot analysis of resistance surface and habitat quality, while fig b and d respectively represent the direction distribution of resistance surface and habitat quality.
Figure 10.
a and c respectively represent the hot spot analysis of resistance surface and habitat quality, while fig b and d respectively represent the direction distribution of resistance surface and habitat quality.
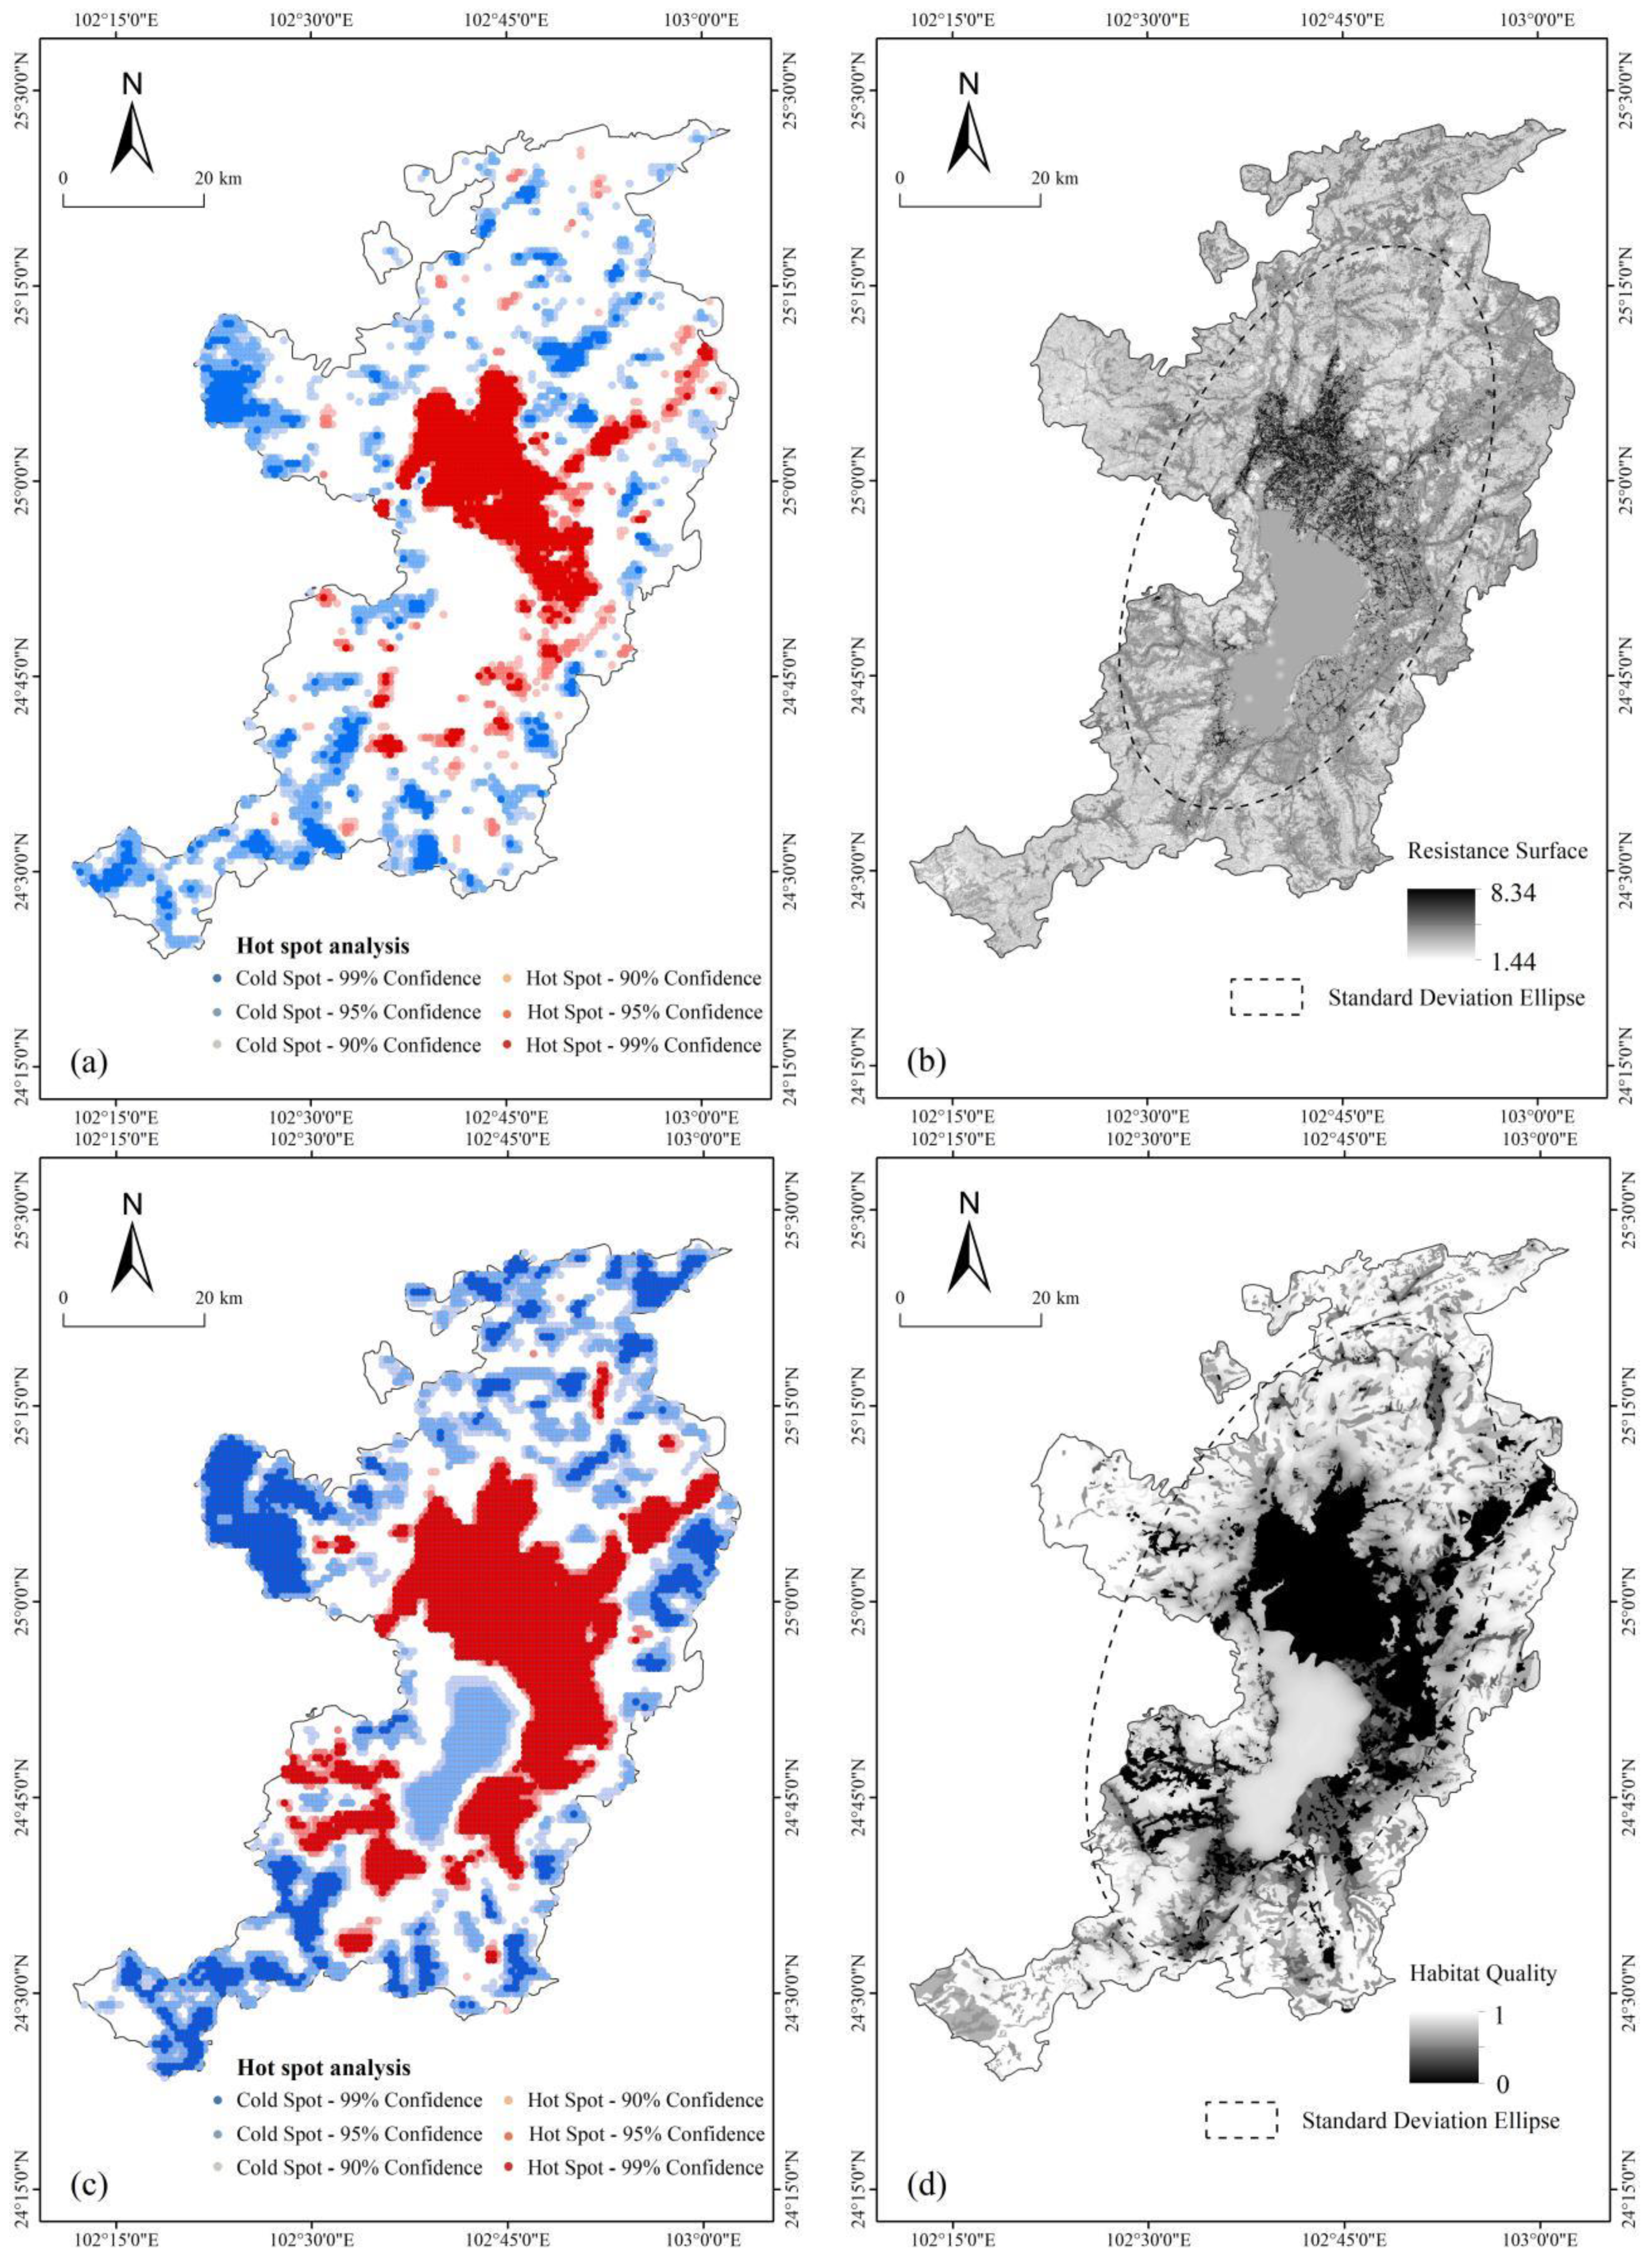
Figure 11.
Ecological security pattern in the main urban area of Kunming.
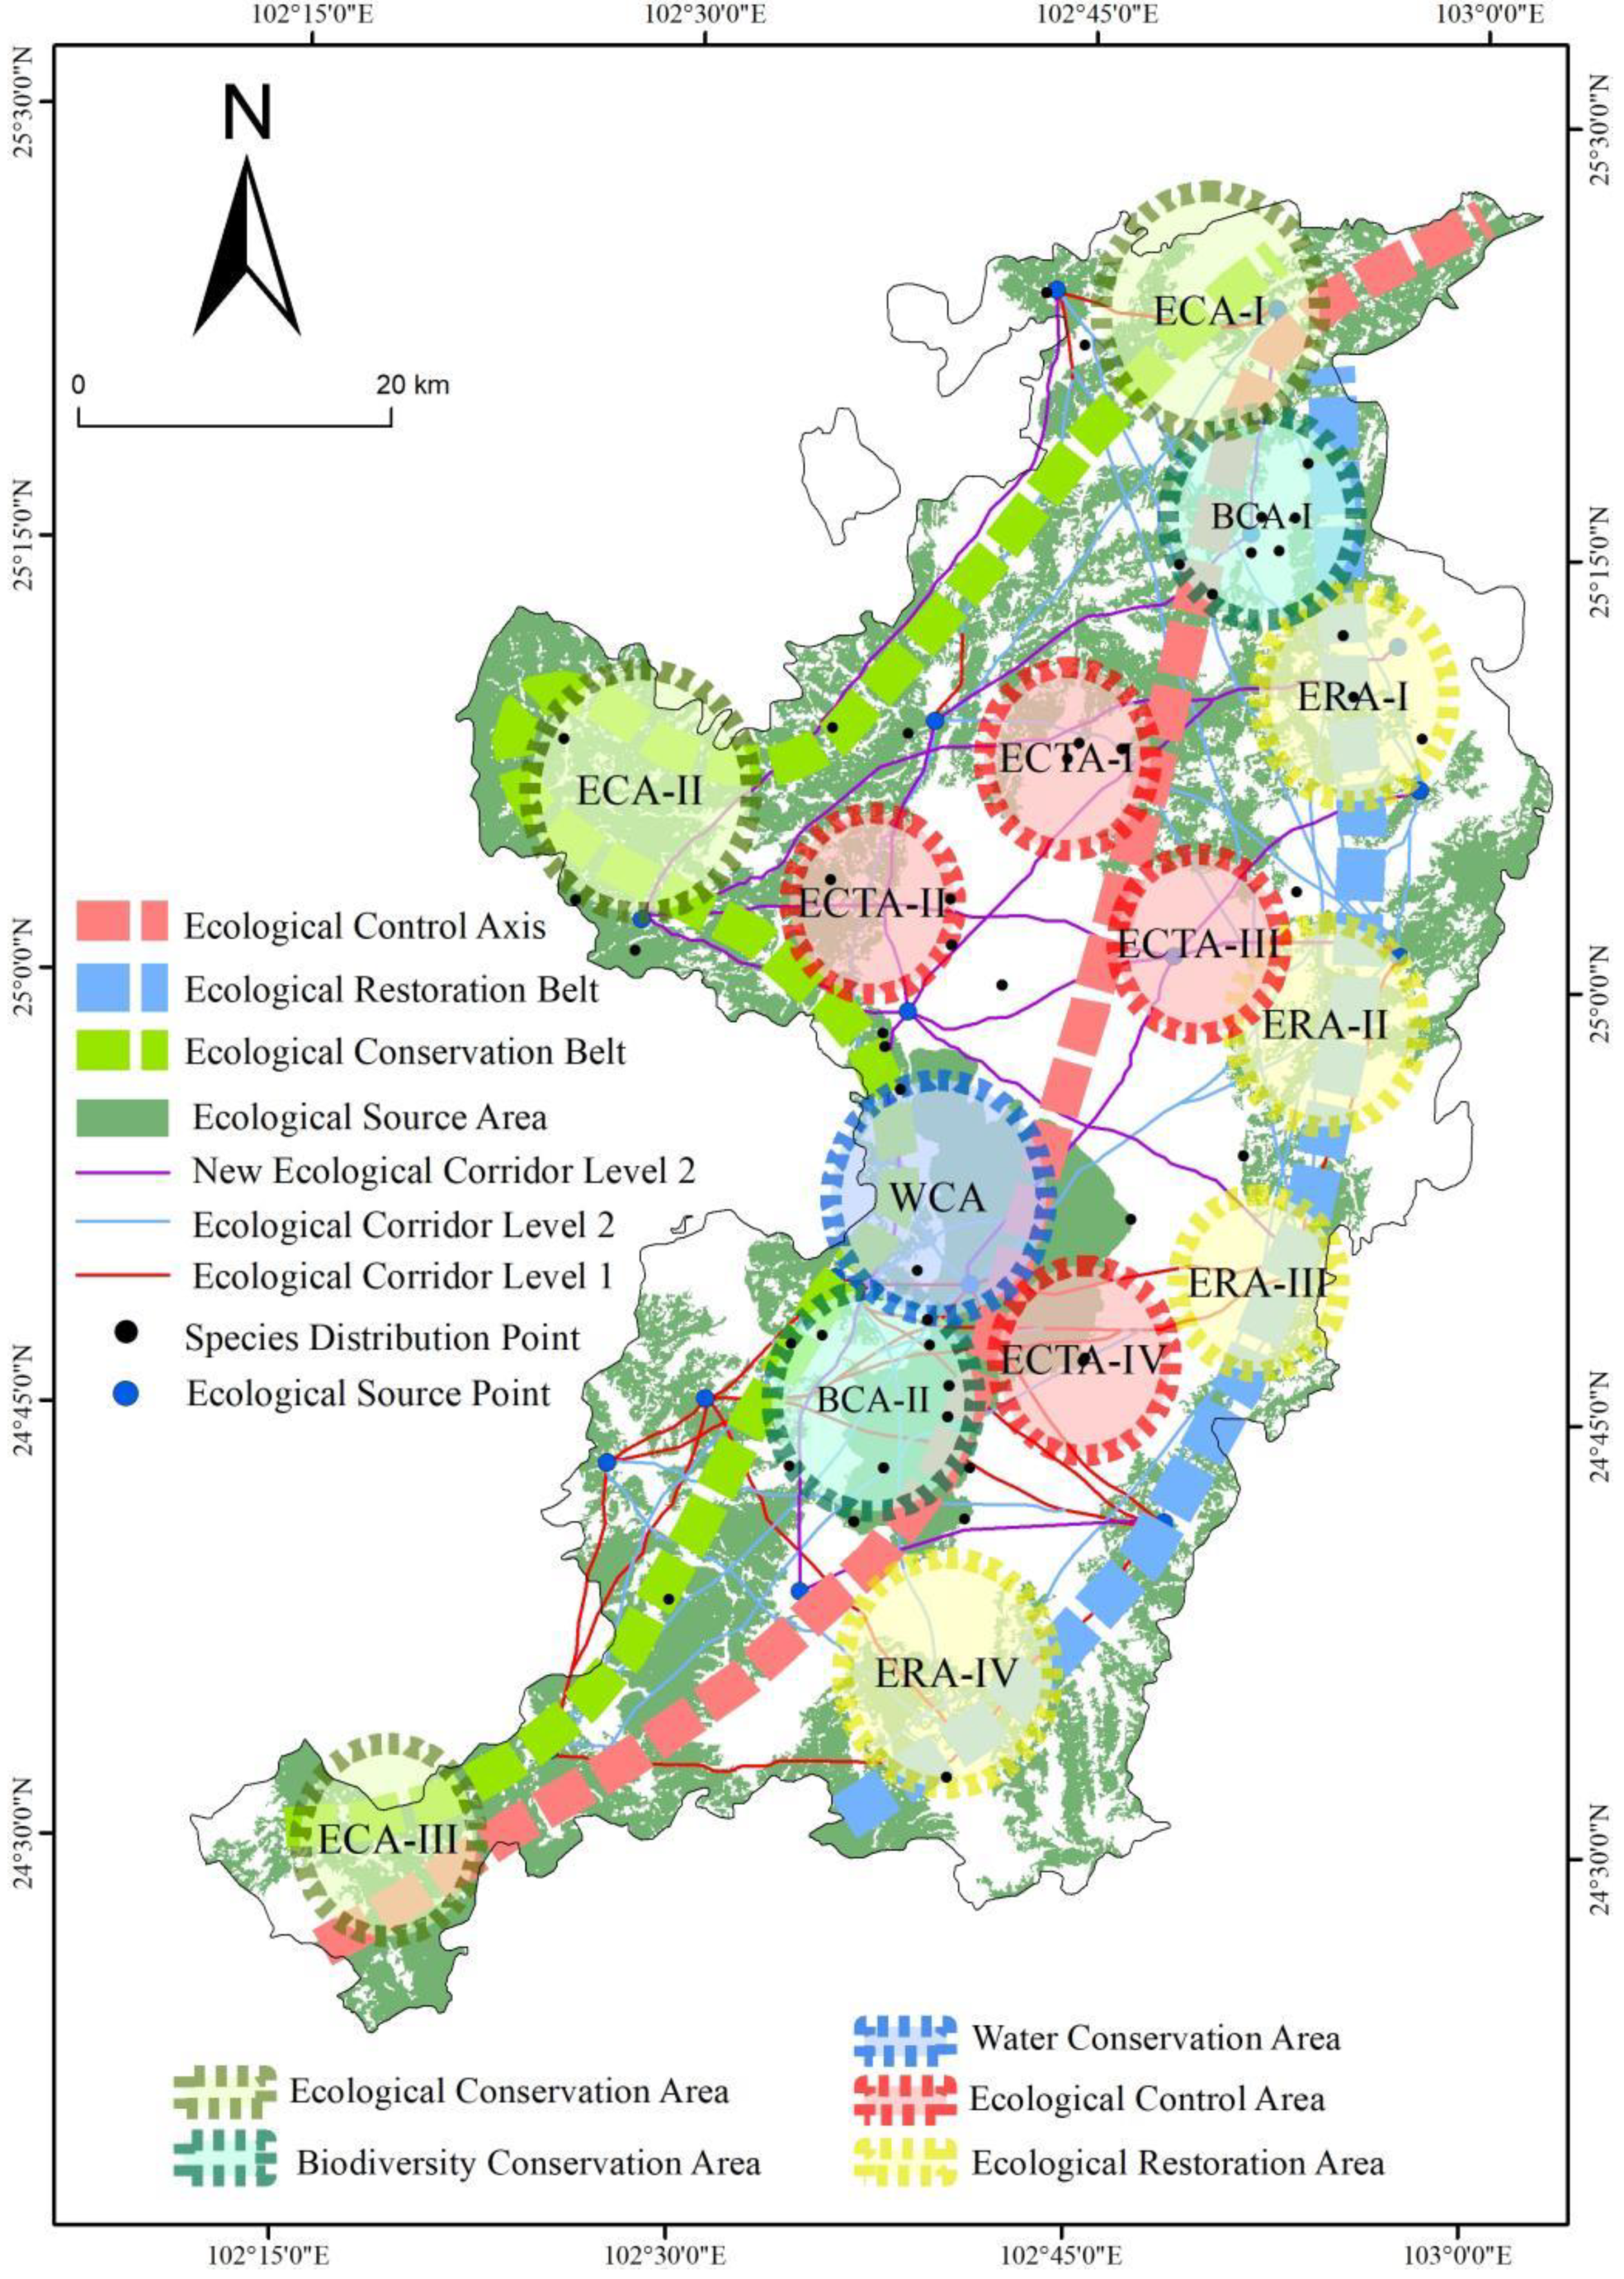

Table 1.
General information on data sets used in this study.
| Data | Reference year | Spatial resolution | Source |
| IBI | 2020 | 30m | Google Earth Engine (https://code.earthengine.google.com/) |
| FVC | 2020 | 30m | Google Earth Engine https://code.earthengine.google.com/ |
| Land cover | 2020 | 30m | Resource and Environment Data Center, Chinese Academy of Sciences (http://www.resdc.cn/) |
| DEM | 2020 | 30m | Geospatial Data Cloud (http://www.gscloud.cn/) |
| Slope | 2020 | 30m | Calculated using DEM data in ArcMap software |
| Species distribution | 2020 | 30m | Resource and Environment Data Center, Chinese Academy of Sciences (http://www.resdc.cn/) |
| roads | 2020 | 30m | Open Street Map (http://www.openstreetmap.org) |
| rivers | 2020 | 30m |
Table 2.
Evaluation system of resistance factor assignment.
| Resistance factor |
Classifcation criteia |
Resistance value |
Weight | Resistance factor |
Classifcation criteia |
Resistance value |
Weight |
| Land use type | Forest, Grassland | 1 | 0.3459 | Distance to Species distribution/(m) | 0-100 | 1 | 0.0892 |
| Arable land | 3 | 100-300 | 3 | ||||
| Water | 5 | 300-500 | 5 | ||||
| Bare land | 7 | 500-700 | 7 | ||||
| Impervious surface | 9 | >700 | 9 | ||||
| Slope/(°) | 0-6 | 1 | 0.1209 | Distance to roads/(m) | 0-50 | 9 | 0.0588 |
| 6-13 | 3 | 50-100 | 7 | ||||
| 13-20 | 5 | 100-200 | 5 | ||||
| 20-30 | 7 | 200-300 | 3 | ||||
| >30 | 9 | >300 | 1 | ||||
| Elevation/m | <1700 | 1 | 0.1103 | Distance to railways/(m) | 0-50 | 9 | 0.0588 |
| 1700-1900 | 3 | 50-100 | 7 | ||||
| 1900-2100 | 5 | 100-200 | 5 | ||||
| 2100-2300 | 7 | 200-300 | 3 | ||||
| >2300 | 9 | >300 | 1 | ||||
| IBI | <0.2 | 1 | 0.1101 | FVC | <0.2 | 9 | 0.106 |
| 0.2-0.4 | 3 | 0.2-0.4 | 7 | ||||
| 0.4-0.6 | 5 | 0.4-0.6 | 5 | ||||
| 0.6-0.8 | 7 | 0.6-0.8 | 3 | ||||
| >0.8 | 9 | >0.8 | 1 |
Table 3.
Ecological Network Structure Indices.
| Ecological Network | Number of Ecological Patches (Q) | Number of Potential Ecological Corridors (S) | Network Closure Index (α) | Network Connectivity Index (β) | Network Connectivity Rate Index (γ) |
| Before Optimization | 13 | 178 | 8.524 | 13.692 | 5.394 |
| After Optimization | 19 | 324 | 9.818 | 17.052 | 6.353 |
| Percentage Change | +46.15% | +82.02% | +15.16% | +24.56% | +17.79% |
Disclaimer/Publisher’s Note: The statements, opinions and data contained in all publications are solely those of the individual author(s) and contributor(s) and not of MDPI and/or the editor(s). MDPI and/or the editor(s) disclaim responsibility for any injury to people or property resulting from any ideas, methods, instructions or products referred to in the content. |
© 2025 by the authors. Licensee MDPI, Basel, Switzerland. This article is an open access article distributed under the terms and conditions of the Creative Commons Attribution (CC BY) license (http://creativecommons.org/licenses/by/4.0/).
Copyright: This open access article is published under a Creative Commons CC BY 4.0 license, which permit the free download, distribution, and reuse, provided that the author and preprint are cited in any reuse.


