1. Introduction
Global climate change has emerged as a critical challenge confronting humanity in the 21st century. Global annual greenhouse gas emissions averaged 59 GtCO2e from 2010 to 2019, with energy consumption and land use change contributing approximately 73% and 23%, respectively, to total carbon emissions [
1]. Land cover changes, such as tropical deforestation, peatland degradation, and agricultural expansion, have led to forest degradation and soil carbon loss [
2], reducing the carbon sequestration capacity of terrestrial ecosystems. Advancements in technology, management optimization, and increased financial investments enable adjustments in carbon emission intensity and volume by increasing resource utilization efficiency without altering land cover types [
3,
4,
5].
Land use transition, a critical manifestation of human-nature interactions [
6,
7], particularly explicit and implicit land use change, significantly influences the carbon budget. Explicit land use transition, i.e., quantitative and spatial changes in land use/cover types, can be quantified using land use transfer matrices and dynamic models [
8,
9]. In contrast, implicit transition modifies carbon flux per unit land area due to management intensity, technological inputs, or policy interventions without altering surface cover. Implicit land use indicators, coupling coordination models, and geographically weighted models are typically used to identify transition stages and driving factors of implicit transitions [
10,
11,
12]. The carbon emission effects of the two transition types exhibit distinct patterns across socioeconomic contexts. Explicit transitions directly alter vegetation carbon stocks and soil carbon pools, exhibiting abruptness and a spatial lock-in. For instance, tropical deforestation instantaneously releases decades of accumulated biomass carbon [
13], while irreversible carbon sink loss occurs when urban areas encroach on croplands [
14]. Implicit transitions primarily influence carbon flux intensity; they are gradual and systemic. Examples include increased N2O emissions from nitrogen fertilizer use in agriculture [
15] and reduced carbon intensity per GDP by increasing industrial land use efficiency, albeit with potential trade-offs like intensified urban heat island effects [
16,
17].
Extensive research has focused on explicit land use transition’s carbon effects using spatiotemporal analysis, geographically weighted regression, the stochastic impacts by regression on population, affluence, and technology (STIRPAT) model, and logarithmic mean Divisia index (LMDI) decomposition to quantify emissions based on land cover-specific coefficients and energy consumption factors [
18,
19,
20,
21,
22,
23,
24]. These approaches often oversimplify complex human-environment interactions. Linear models cannot capture nonlinear impacts of technological innovation and management optimization on emissions, particularly in economically advanced regions where capital, governance, and technological factors affect industrial, agricultural, and residential activities [
25,
26,
27]. Therefore, this study adopts the emission accounting framework of the Intergovernmental Panel on Climate Change (IPCC) [
28,
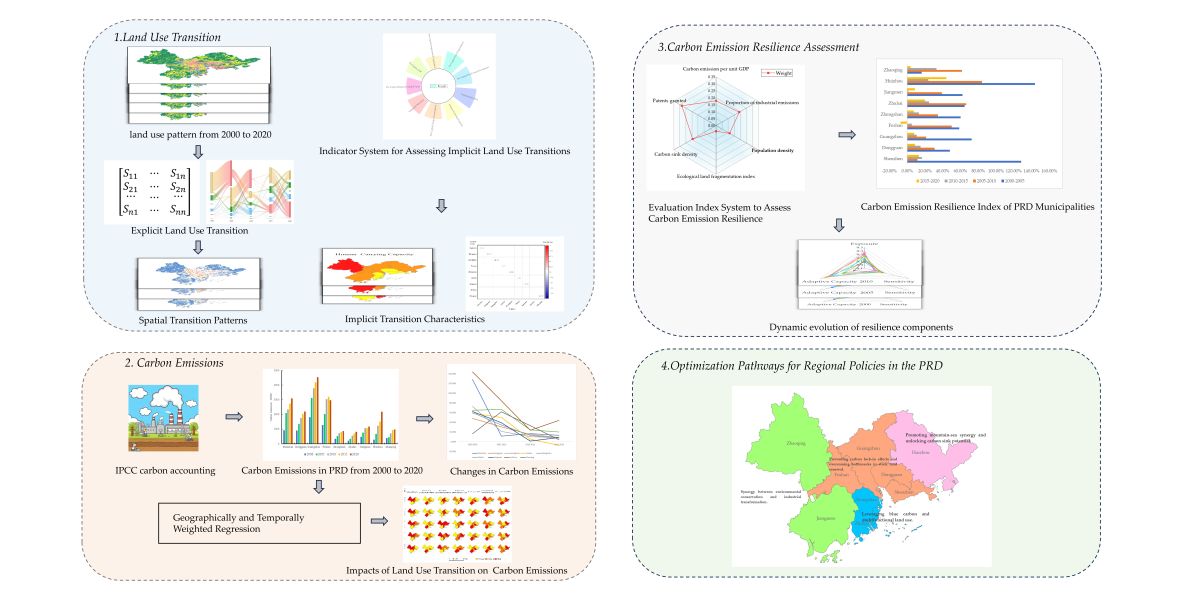
29] and methodologies from the Guangdong Provincial Guidelines for City/County Greenhouse Gas Inventories to assess carbon emissions from energy consumption, industrial production, and agriculture in the Pearl River Delta (PRD) during from 2000 to 2020. A geographically and temporally weighted regression (GTWR) model is coupled with land use transition characteristics to determine the path-dependent evolution of spatiotemporal emissions. We establish a resilience assessment framework to examine the exposure, sensitivity, and adaptive capacity to carbon emission in a socio-ecological system and identify dominant resilience constraints across spatial units. The findings advance the understanding of the effects of anthropogenic disturbances on the carbon cycle and inform low-carbon land management strategies.
The PRD is China’s most economically dynamic region. It produces nearly 1/9 of the national GDP and has undergone significant transformations in land use, socioeconomic development, and energy consumption over the past half-century. Its land use trajectory from extensive exploitation to intensive utilization and high-quality transition epitomizes China’s modernization, providing an exemplary case for investigating carbon transition [
30]. The study period (2000–2020) coincides with pivotal policy implementations, including the Implementation Plan for Industrial Structure Adjustment in Guangdong (2001), Dual Transfer Strategy (2008), PRD Reform and Development Plan (2008–2020), Three Olds Redevelopment (2009), and Guangdong-Hong Kong-Macao Greater Bay Area Plan (2019). This study seeks to reveal stage-specific carbon effects of land use restructuring by analyzing land use transition phases, emission trajectories, and regional disparities, providing actionable insights for formulating regionally adaptive carbon peaking and neutrality policies.
2. Materials and Methods
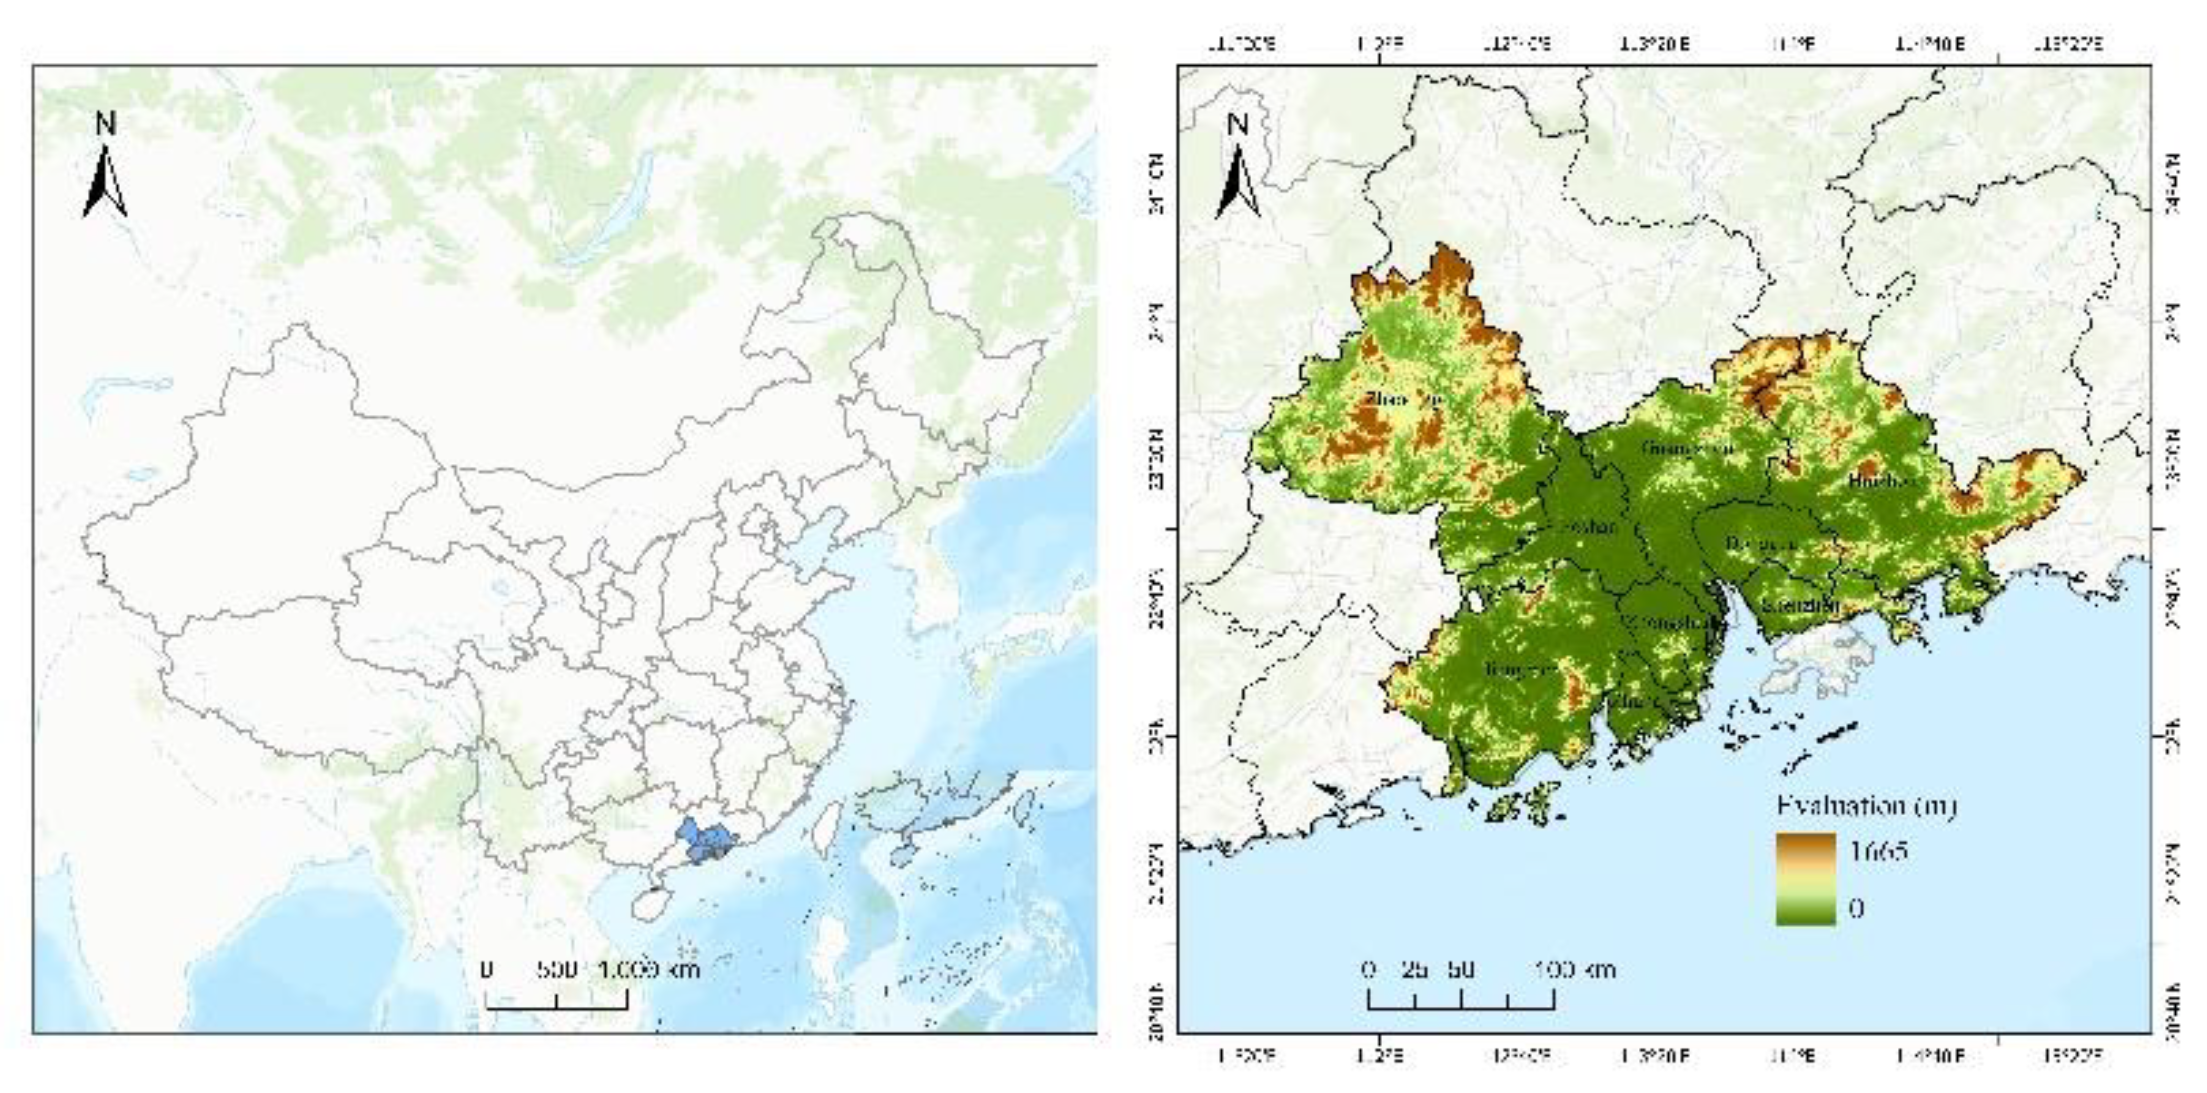
2.1. Study Area
The PRD is located in the central and southern parts of Guangdong Province, encompassing the cities of Guangzhou, Shenzhen, Zhuhai, Foshan, Jiangmen, Dongguan, Zhongshan, Huizhou, and Zhaoqing and covering an area of 55,300 km². This area has numerous rivers and diverse topography. It is surrounded by mountains on three sides and by the ocean on one side. Three rivers converge here, and eight rivers flow out of the area. The cities of Zhuhai, Zhongshan, Foshan, Guangzhou, Dongguan, and Shenzhen are situated along the banks of the Pearl River Estuary. According to the Guangdong Provincial Land Spatial Plan (2021-2035), the PRD has arable land covering 3,875.80 km², accounting for 21.10% of the province's area. Additionally, an ecological protection red line of 13,548.36 km² has been established, representing 26.67% of the province’s area. The urban development boundary is 10,105.23 km² long, accounting for 66.52% of the total area (
Figure 1).
2.2. Data and Sources
We used land use, socioeconomic, GDP, population, carbon emission, and administrative boundary data for the PRD (
Table 1).
2.3. Methods
2.3.1. Explicit Land Use Change
Explicit land use transitions refer to changes in the quantity and structure of land use. These characteristics can be represented using land use change dynamics and land use transition matrices [
10,
11,
12]. The land use change dynamics reflect the number of land use changes in a period. The dynamic degree of land use characterizes the changes in the area of the land use type during a given period relative to the initial area:
where
Ui represents the dynamic degree of the
i-th land use type,
Si+ is the area that transitions into the
i-th type,
Si- is the area that transitions out of the
i-th type,
Si1 is the initial area of the
i-th type, and
T is the time difference between the first and last year.
We utilized conversions to and from the i-th land use type to the j-th land use type to characterize the directional changes in the transition of land use types and represent the contribution rate.
where MGi,j denotes the proportion of the increase in the i-th land use type to the total increase of the j-th land use type, and MLi,j represents the proportion of the decrease of the i-th land use type to the total decrease of the j-th land use type.
2.3.2. Implicit Land Use Change
Implicit land use transitions are influenced by the stages of social development and policies and the level of financial and technological investment, resulting in different economic, social, and ecological benefits. We established an indicator system for implicit land use transitions based on existing research and the study areas’ resources and socioeconomic development [
20,
21,
22]. We used the Analytic Hierarchy Process (AHP) and considered existing land use, land use change, and land rights. The entropy method was employed to determine the indicator weights (
Table 2). Normalization in the temporal and spatial dimensions was performed to enable the comparison of the indicators in n time intervals and m units. The implicit land use transition index was calculated based on the weights. A higher index indicates a higher order of implicit land use transition. Dynamic analysis was conducted following Tian [
31] to assess the interannual variations of the indicator values:
where
Dj represents the dynamic degree of land use change for the j-th indicator; Fn and Fn+1 are the values of the j-th indicator in the initial and final periods. The dynamic degree
Dj was categorized into slow (0<
Dj≤0.2), rapid (0.2<
Dj≤0.4), and very rapid (
Dj>0.4) increases.
2.3.3. Carbon Emission Accounting
Terrestrial systems are major carbon sources. Industrial production, transportation, commercial activities, and residential consumption generate emissions. Following the IPCC carbon accounting methodology [
28] and the Guangdong Provincial Guidelines for City/County Greenhouse Gas Inventories (Trial), we calculated categorized emissions in the PRD from 2000 to 2020, encompassing energy consumption, industrial production, and agricultural activities. The data were sourced from municipal statistical yearbooks, the Guangdong Rural Statistical Yearbook, and the China Urban Construction Statistical Yearbook.
(1) Energy Consumption Emissions
Based on regional energy profiles, emissions from 12 fuel types (e.g., raw coal, crude oil, and natural gas) were quantified using the following formula:
where
Cen is the total carbon emissions (
tCO₂e),
Ei is the physical fuel consumption
i,
NCVi is the net calorific value, and
CEFi is the carbon emission factor (
Table 3).
(2) Industrial Emissions
Industrial emissions arise from energy use and production. This study focuses on process-related emissions.
where
Cin is the total industrial emissions
(tCO₂e),
Qi is the output of industrial product
i, and
fi is the product-specific emission factor (
Table 4).
(3) Agricultural Emissions
Agricultural emissions come from agrochemical inputs and methane from rice paddies. The agrochemical emissions were calculated using the following formula:
where
Cfa is total emissions from agrochemicals (
tCO₂e),
Qi is the consumption of input
i, and
fi is the emission factor (
Table 5).
Methane emissions from paddies were calculated using the following formula:
where
Cri is total methane emissions (
kgCH₄), Ai is the rice cultivation area (hm²), and
fi is the methane emission factor (
Table 6).
2.3.4. Geographically and Temporally Weighted Regression
The Geographically and Temporally Weighted Regression (GTWR) model is a statistical model that considers spatial and temporal dimensions. It is an extension of the GWR model that accounts for spatiotemporal non-stationarity [
33]. It determines the spatial and temporal influences on the regression coefficients at the observation points [
34]. Land use generates carbon emissions. The land use type exhibits significant spatial correlation and heterogeneity that depends on socioeconomic development, which affects carbon emissions through land use structure, intensity, methods, and phases. We analyzed the factors influencing carbon emissions from land use (explicit and implicit) by excluding significantly correlated factors and using GTWR:
where
Yi represents the amount of carbon emissions,
β0 is the regression coefficient at point
i; ui and
vi denote the spatial information at point
i,
ti represents time,
βk is the
k-th regression parameter at point
i,
Xik represents the indicator values, and
εi is the residual of the model function.
2.3.5. Carbon Emission Resilience
Carbon emission resilience (CER) refers to the capacity of a regional system to maintain emission governance efficacy and achieve sustainable development by optimizing economic structures, advancing technological innovation, and adjusting institutional frameworks under climate change and low-carbon transition. Drawing on the IPCC risk governance framework [
35,
36] and the vulnerability-sustainability-resilience (VSD) model proposed by Turner et al. [
37], we established a three-dimensional evaluation system to assess the exposure, sensitivity, and adaptive capacity to carbon emissions (
Table 7). The entropy method was employed to determine the indicator weights.
Exposure characterizes the intensity of regional impacts from high-carbon economic activities, reflecting the spatial distribution of external stressors. Key indicators include carbon emissions per unit GDP (calculated using the IPCC methods [
28] and indicating the efficiency of using carbon-based resources) and the proportion of industrial carbon emissions (based on the industrial metabolism theory [
38] to determine linkages between industrial structure and carbon emissions).
Sensitivity measures a system’s responsiveness to carbon reduction, reflecting the inherent vulnerabilities of industrial and energy systems. Key indicators are population density (based on the ecological footprint theory [
39] to link population density to spatial heterogeneity of emissions) and the ecological land fragmentation index (derived from landscape ecology [
40]; it assesses ecosystem stability and resilience).
Adaptive capacity evaluates the ability to mitigate the negative impacts of carbon constraints through technological innovation and policy optimization, reflecting the regulatory potential. Key indicators include the carbon sink capacity of land use types (quantified via ecosystem service assessment frameworks [
41]. It measures natural capital contributions to carbon neutrality), the number of patents granted per 10,000 people (based on the endogenous growth theory [
42]. It focuses on technology-driven emission reduction).
3. Results and Analysis
3.1. Land Use Transition
3.1.1. Explicit Land Use Transition
(1) Structural Evolution
The PRD underwent significant land use restructuring from 2000 to 2020, with a mean change rate of 33.79%, characterized by the expansion of construction land and the reduction in cropland and woodland (
Table 8). Key patterns include:
Significant Increase in Construction Land: The area increased from 42.81×10⁴ ha to 80.82×10⁴ ha (+88.8%), with an annual growth rate of 4.44%. The proportion of construction land increased from 7.9% to 11.4%, peaking during 2000–2005 (+44.5%) before decelerating post-2010 (2015–2020: +7.2%), indicating the initial success of intensive land use policies.
Persistent Cropland and Woodland Loss: Cropland decreased by 16.3% (143.81→120.44×10⁴ ha, annual -0.81%), and woodland declined by 3.3% (300.44→290.5×10⁴ ha, annual -0.17%). Guangzhou, Dongguan, and Shenzhen experienced significant cropland loss (>2.5% annually), whereas Foshan’s cropland area remained stable (annual -0.21%) due to the mulberry-dyke-pond system.
Fluctuation in Other Land Cover Types: Water decreased by 8.4% (43.83→40.14×10⁴ ha), grassland by 3.5% (10.7→10.33×10⁴ ha), and bare land by 77.4% (0.31→0.07×10⁴ ha) due to ecological restoration.
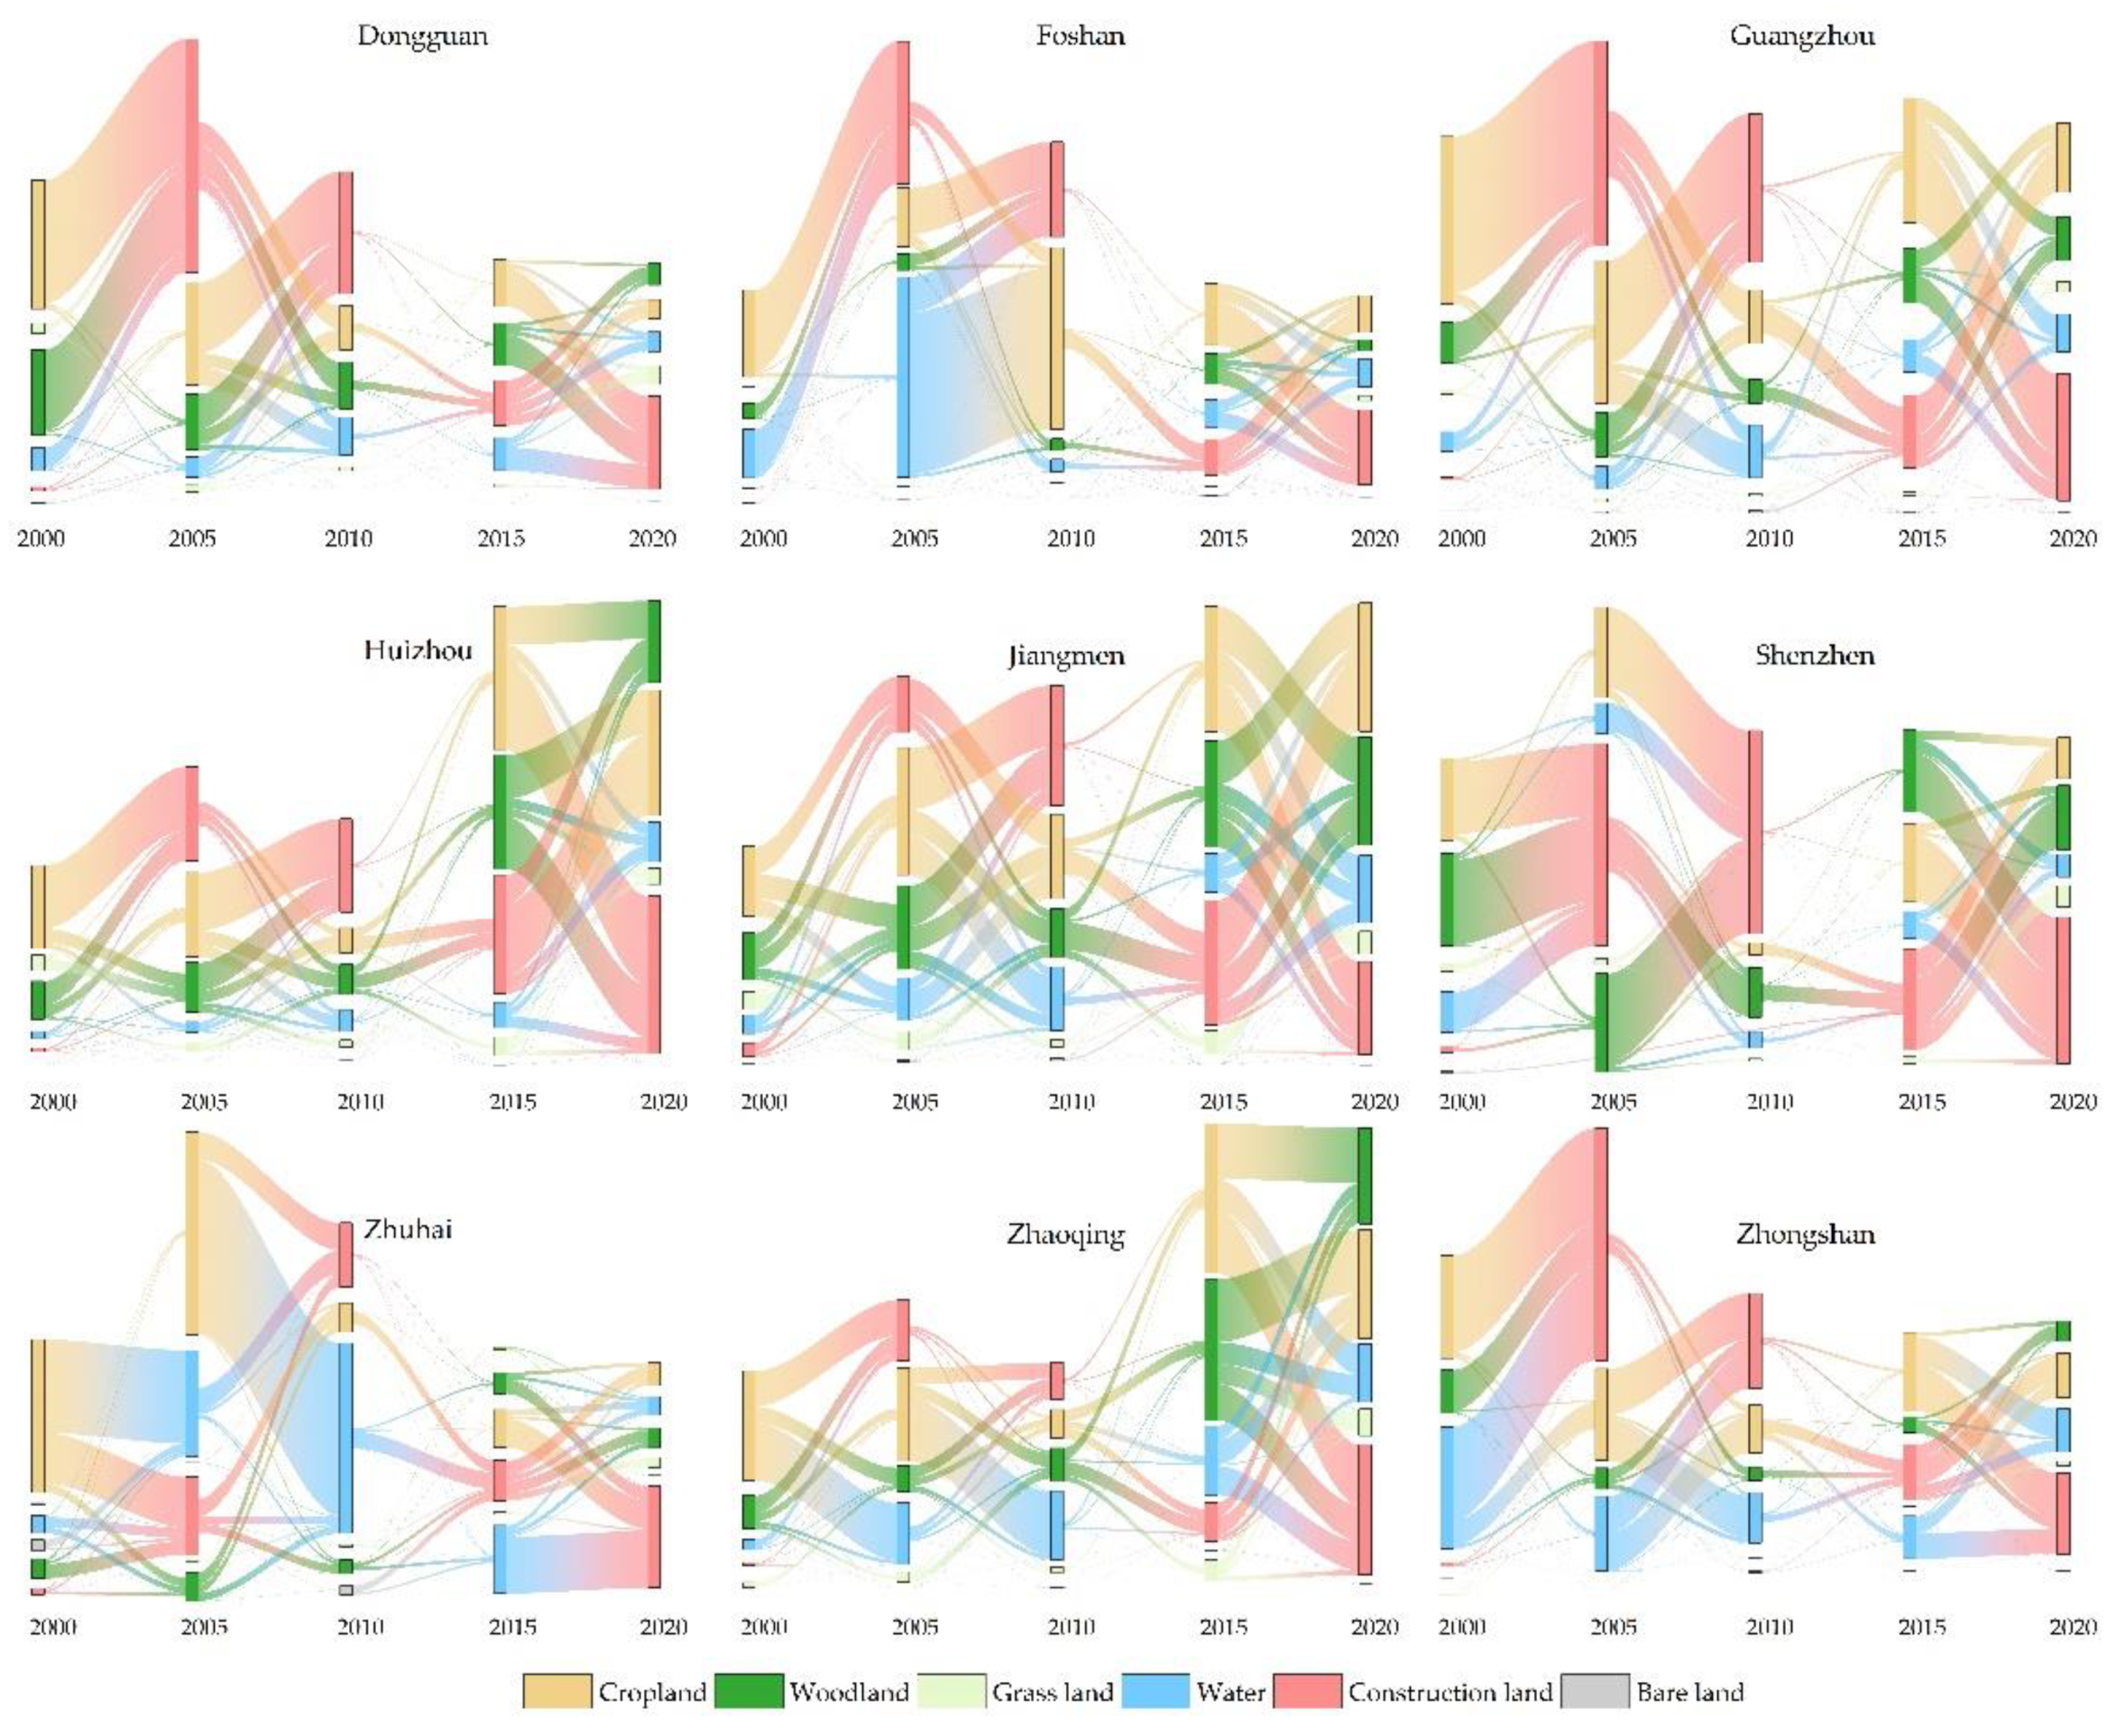
(2) Transition Phases
A land use/cover change analysis (
Figure 2) revealed three phases:
Rapid Expansion Phase (2000–2010): The growth rate of construction land peaked at 9.46% (2000–2005), with 57.1% of new areas converted from cropland, aligning with the land finance model. From 2005 to 2010, 13.99×10⁴ ha of cropland were converted to construction land (77.0%), reflecting the policy orientation of "strengthening the radiation effect of core cities" in the PRD’s Reform and Development Plan (2008–2020).
Structural Adjustment Phase (2010–2015): The growth of construction land slowed (dynamic degree: 1.46%), and the sources of land use types were diverse (cropland’s contribution dropped to 52.2%, whereas that of woodland and water rose to 27.7% and 16.9%). The Dual Transfer Strategy caused the relocation of labor-intensive industries, whereas Foshan’s Three Olds Redevelopment tripled the GDP output per construction land unit. The dynamic degree of bare land was 14.21% due to mining reclamation and wetland restoration; however, large areas of woodland were converted to construction land (33.7%).
Quality Enhancement Phase (2015–2020): The growth rate of construction land was 7.2%. Cropland contributed 44.0%, and water contributed 19.2% to construction land, indicating a shift toward ecological compensation.
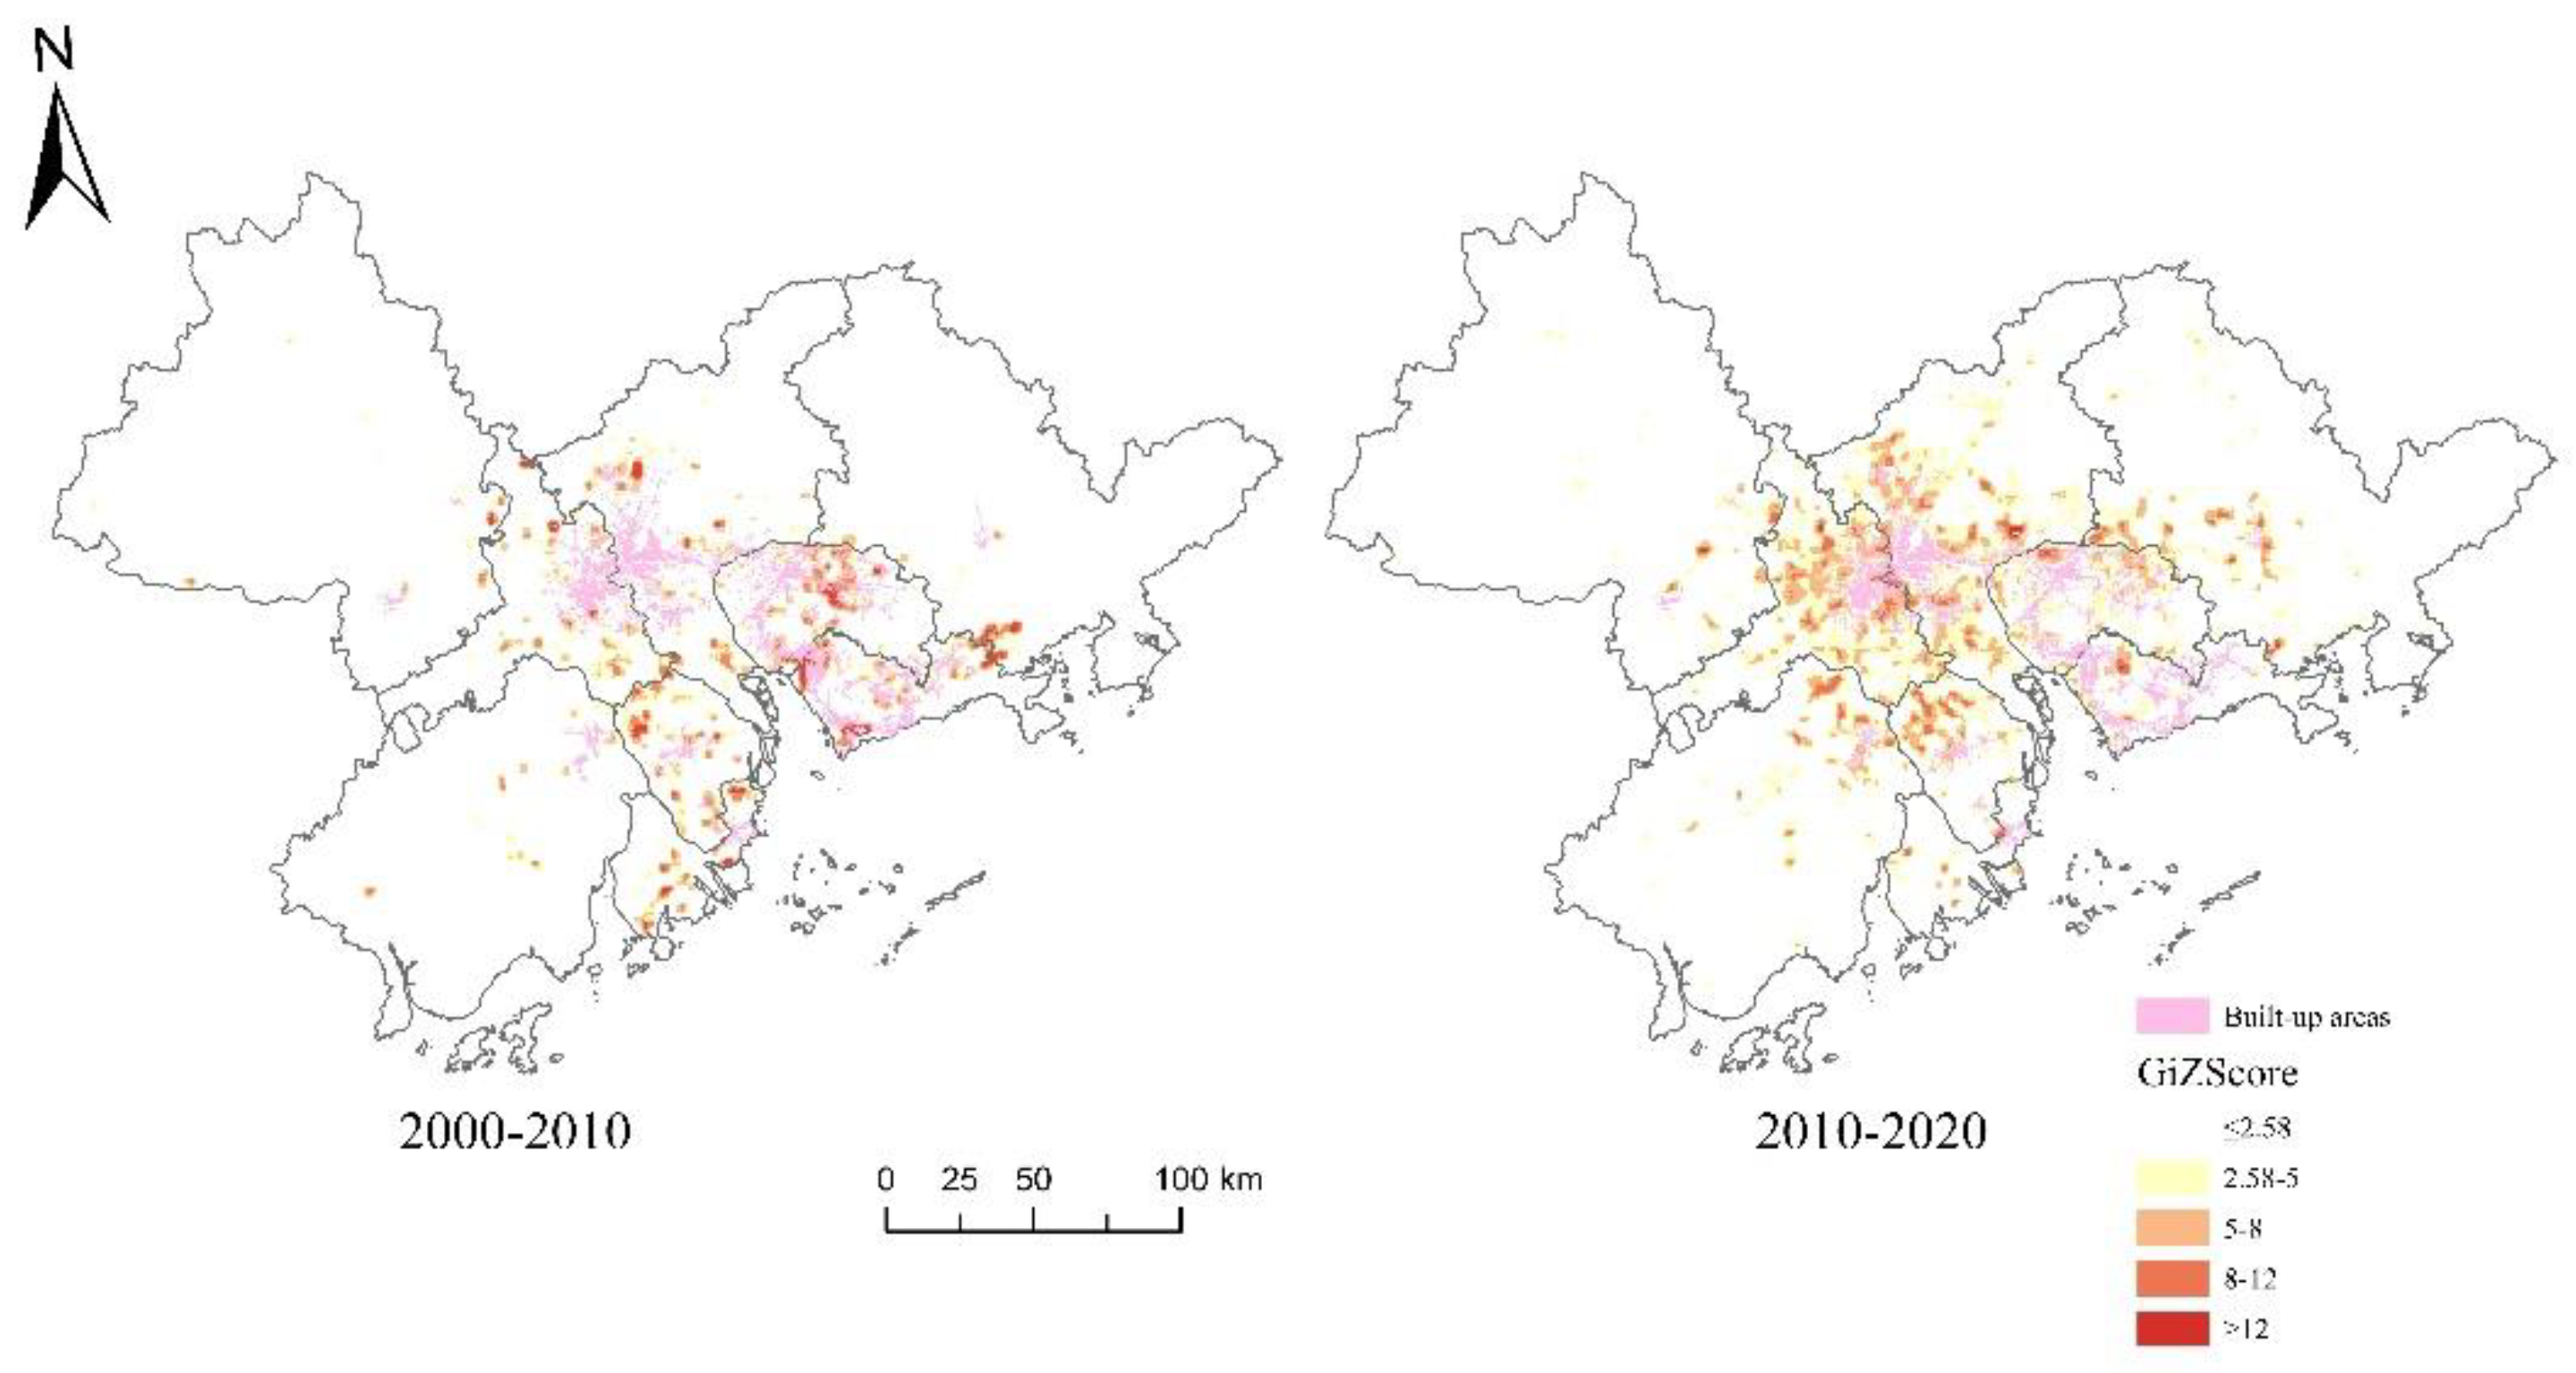
(3) Spatial Transition Patterns.
Core-Periphery Gradient: The core cities (Guangzhou, Shenzhen, Dongguan, Foshan) formed a high-density built-up golden triangle (
Figure 3). Guangzhou lost 5.87×10⁴ ha of cropland (21.3% of regional total), and 87.7% of Shenzhen’s cropland loss resulted from construction. Peripheral cities (Zhaoqing, Jiangmen) retained >50% of woodland, highlighting conservation-development conflicts. Coastal zones (Zhuhai, Zhongshan) showed significant conversions from and to cropland and water bodies.
Spatiotemporal Shifts in Hotspots: During near-field expansion (2000–2010), land use change hotspots (>10 ha/yr) were clustered within 10 km of built-up areas (central agglomeration). Post-2010, hotspots shifted to suburbs, with emerging industrial nodes like Huizhou becoming transition cores, reflecting industrial relocation.
(4) Path Dependency and Transition Barriers
Unidirectional cropland-construction land conversion persisted, with 65.9% of cropland loss attributed to construction during 2000–2020 (peaking at 77.0% in 2000–2005). Post-2015, water bodies contributed 19.2% to construction land growth, whereas cropland was reclaimed (e.g., Foshan’s mulberry-dyke-fishpond conversion), indicating an imbalance between a quantity equilibrium and quality degradation.
3.1.2. Implicit Land Use Transition
(1) Transition Characteristics
The implicit land use transition index in the PRD increased from 2.18 to 6.44 from 2000 to 2020 (
Table 9), with an annualized growth rate of 15.6%. Three phases occurred: rapid development, steady adjustment, and high-quality transition.
Rapid Development Phase (2000–2010): The index grew 11.3% annually, driven by export-oriented economies. Core cities (Shenzhen, Dongguan) increased land use efficiency using fixed-asset investment (annual +18.7%) and technology imports. For example, Shenzhen’s land use input index rose from 0.31 to 0.33, with the land urbanization rate increasing by 7.7% annually, reflecting the dominant space-for-growth strategy, where rapid economic development depends on the rapid increase in construction land.
Steady Adjustment Phase (2010–2015): The growth slowed to 4.9% due to policy interventions. Foshan’s Three Olds Redevelopment increased industrial land use efficiency by 1.8 times, resulting in upgrades and technology-driven innovation.
High-Quality Transition Phase (2015–2020): The growth declined to 3.1%, with core cities entering innovation-driven stages. Research and development (R&D) investment accounted for 35% of total inputs.
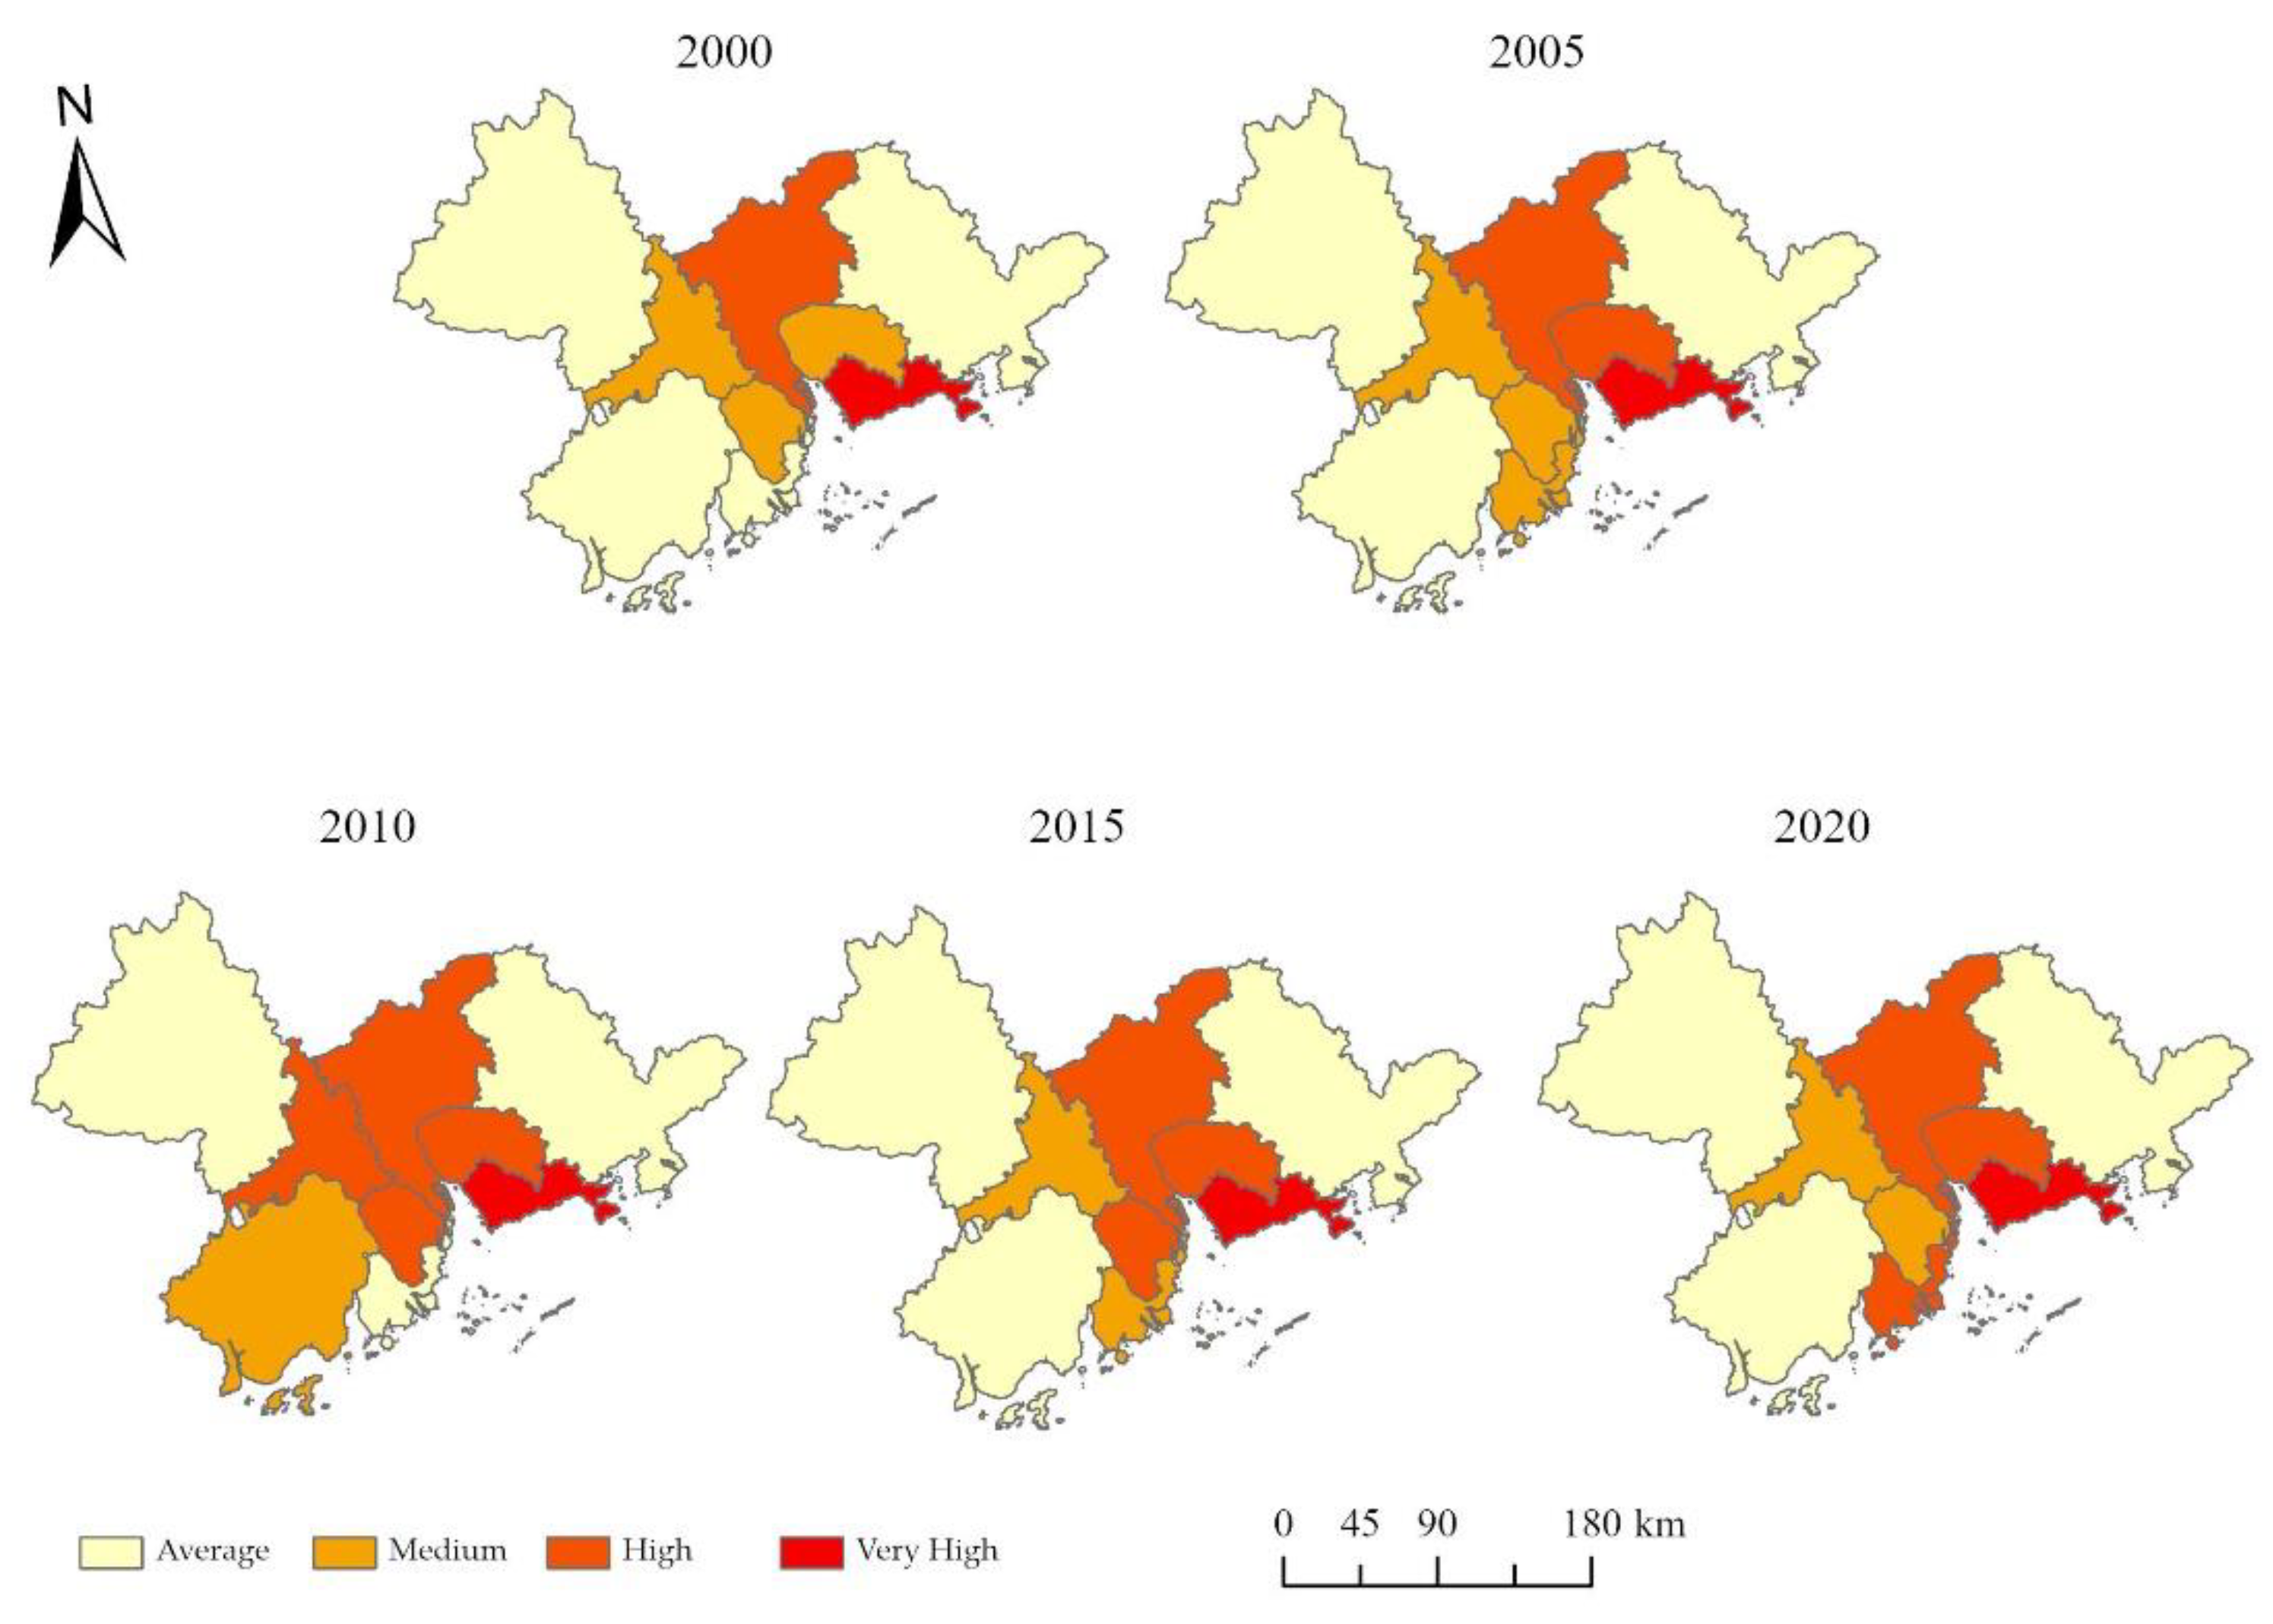
(2) Spatial Differences
Core-Periphery Gradient: The core cities (Shenzhen: 0.91; Guangzhou: 0.80; Dongguan: 0.81) had the highest implicit indices, with Shenzhen’s land property rights reform (dynamic degree: 0.743 during 2000–2005), indicating institutional advantages. Peripheral cities (Zhaoqing: 0.57; Jiangmen: 0.60; Huizhou:0.59) had lower values due to traditional industry’s path dependency and insufficient land investment.
Coastal Transition Zone Dynamics: Zhuhai exhibited the fastest index growth (3.48% annually). High-level transitions (index >0.70) were clustered along the Guangzhou-Shenzhen Innovation Corridor, forming a Shenzhen-Dongguan-Guangzhou axis (
Figure 4), whereas peripheral areas (Zhaoqing, Jiangmen, Huizhou) had low values (<0.60).
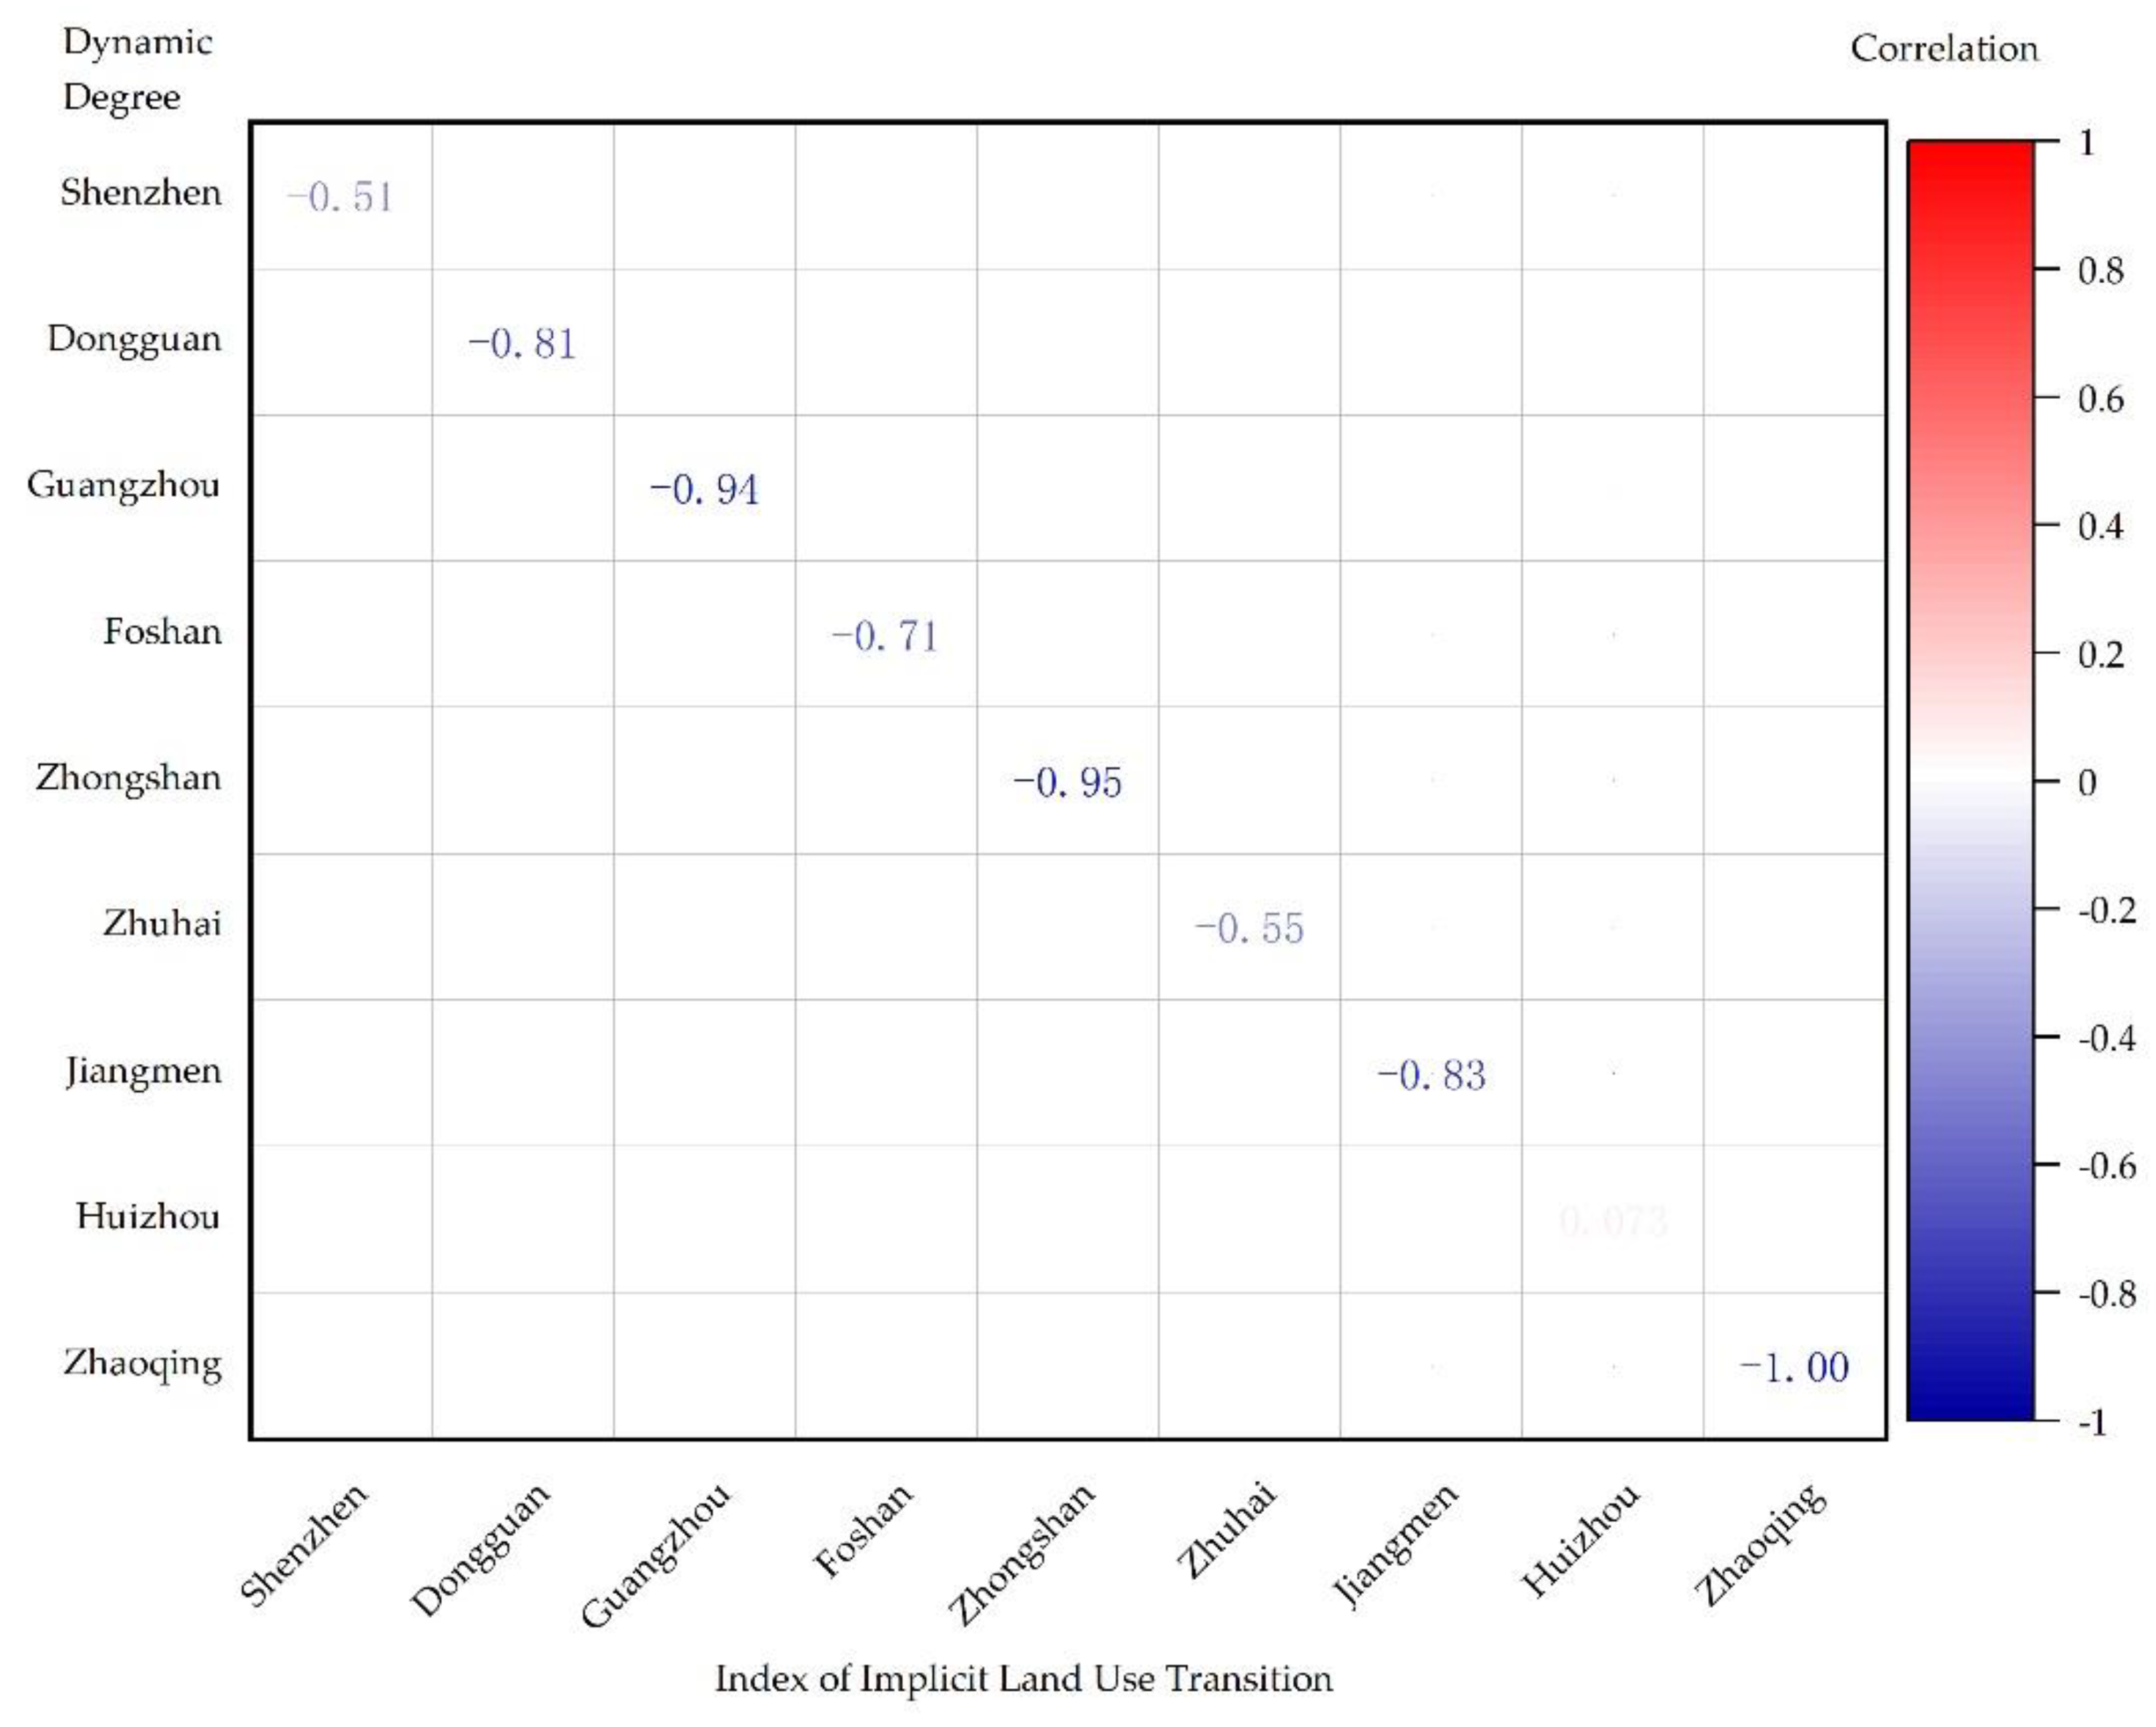
Correlation between index of implicit and dynamic degree: A significant negative correlation occurred between index of implicit and dynamic degrees (Mean Pearson’s r = -0.79, p < 0.01) (
Figure 5). Shenzhen had a high index (0.91 in 2020) and a low dynamic degree (0.005), indicating rising marginal costs due to an advanced transition. Conversely, Zhuhai had a lower index (0.74) and higher dynamic degree (0.340) due to a lag in technological development.
(3) Phase-Specific Drivers
Effects of Land Property Rights (2000–2005): Land institutional changes contributed 53.7% (Dongguan: 0.743; Foshan: 0.325), indicating the effects of market-oriented reforms.
Industrial Upgrading (2005–2010): Land use output dominated the contributions (Foshan: 0.881; Huizhou: 0.593), with tertiary sector growth (+7.8%) being dominant.
Land Use Potential Enhancing (2010–2015): The land use input contributions rose (Zhuhai: 0.094; Zhaoqing: 0.204) because governments enabled more efficient resource use through land remediation and infrastructure investment.
Innovation-Policy Synergy (2015–2020): Technological innovation and policy coordination influenced high-order transitions.
3.2. Spatiotemporal Evolution of Carbon Emissions
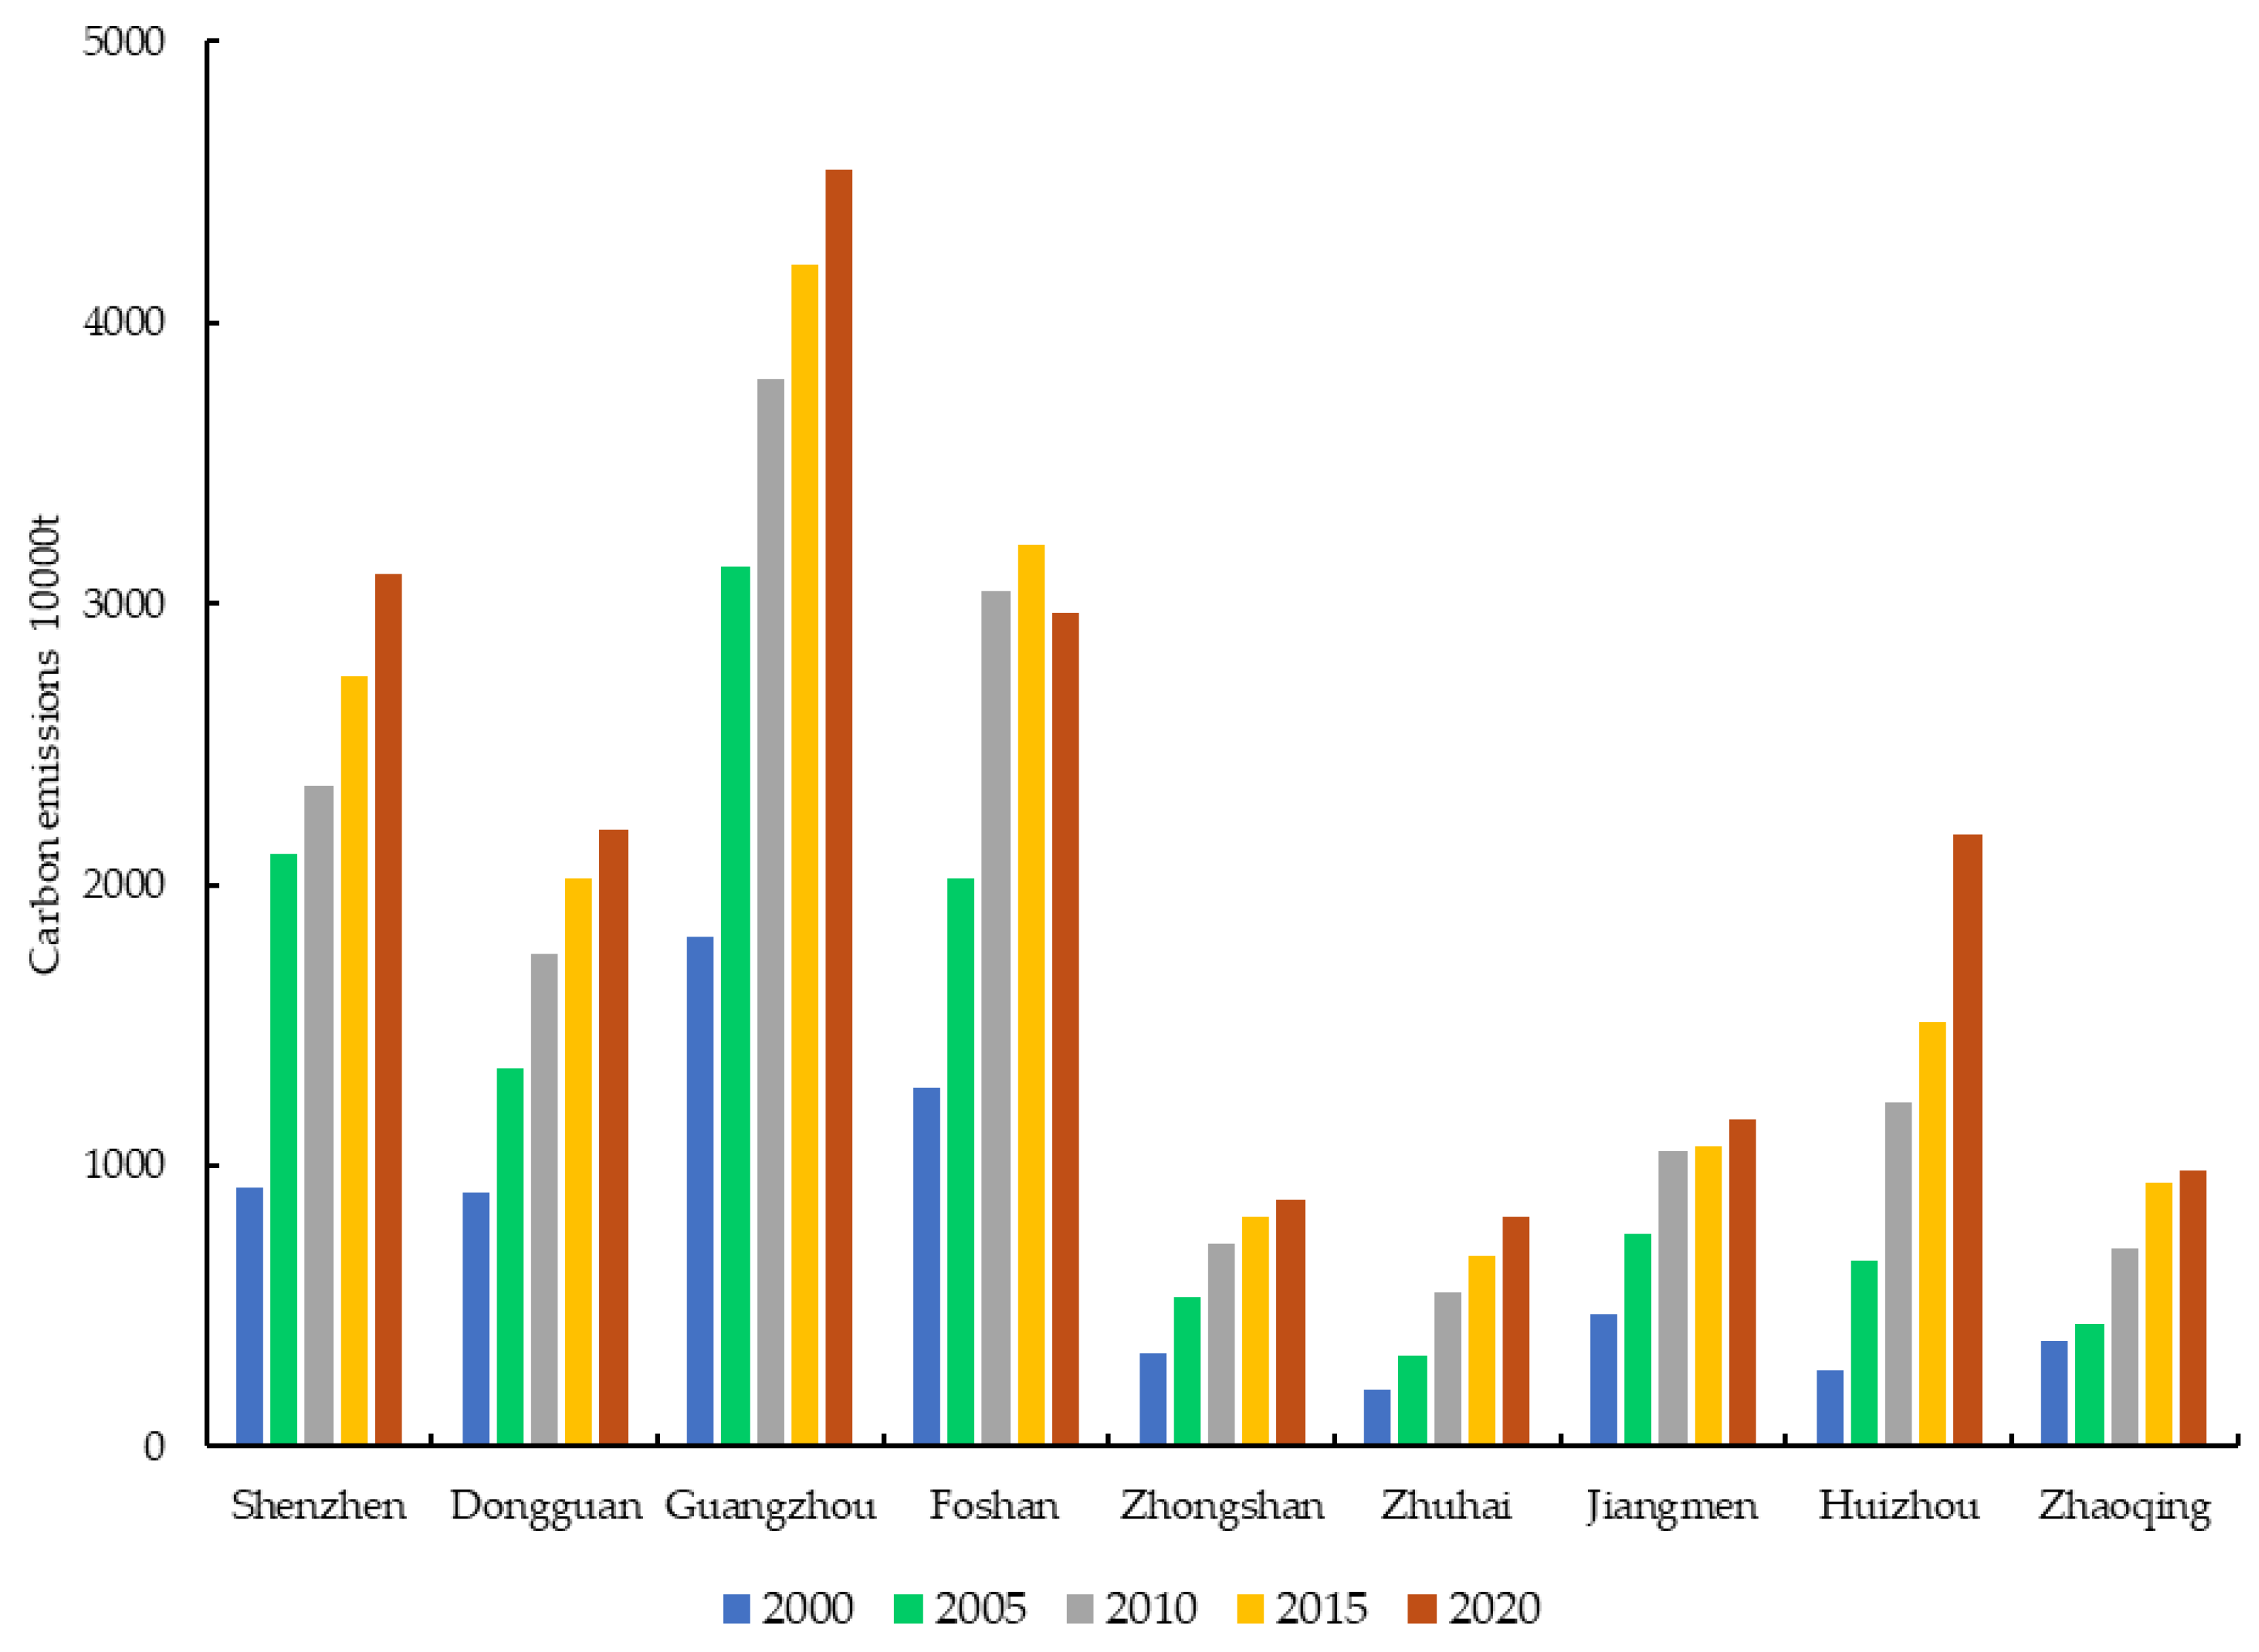
3.2.1. Macro Trends and Regional Disparities
Total carbon emissions in the PRD increased from 65.65 million tons (2000) to 188.38 million tons (2020), a 186.96% increase, but the growth rate declined (from 9.51% during 2015–2020 to72.59% in 2000–2005). Emissions were stable, and the ranking was Guangzhou (45.45 million tons, 31.2%) > Foshan > Shenzhen > Dongguan > Huizhou (
Figure 6). Core cities (Guangzhou, Shenzhen, Dongguan) increased their emissions from 54.3% to 61.8%, confirming the carbon lock-in effects of economic agglomeration. Peripheral regions, particularly Huizhou, exhibited a 703.6% increase in emissions due to relocated energy-intensive industries, revealing spatial restructuring, in line with the pollution haven hypothesis.
3.2.2. Phase-Specific Dynamics
The emission evolution had three phases (
Table 10):
Rapid Growth Phase (2000–2010): Land-finance-driven industrial expansion (annual land growth: 8.2%) increased emissions in Shenzhen (72.1% annual growth) and Huizhou (114.3%), exceeding the regional average (49.2%).
Deceleration Phase (2010–2015): The emissions in core cities slowed to <10% growth, with Foshan showing negative growth (-7.38%) after the implementation of the Dual Transfer Strategy (industrial and labor relocation), indicating an initial success of industrial upgrading.
Different Adjustment Phase (2015–2020): Core cities transitioned toward low-carbon pathways (Shenzhen: 13.3% growth), whereas peripheral regions’ emissions increased due to petrochemical projects (Huizhou: 44.2%) and port economies (Zhuhai: 20.1%).
3.2.3. Spatial Heterogeneity and Underlying Mechanisms
Different spatial patterns were observed in core, peripheral, and coastal regions.
Core Regions (Guangzhou, Shenzhen, Dongguan, Foshan): They produced >70% of total emissions but achieved significant decoupling through technological innovation (carbon intensity per GDP decreased by 42%).
Peripheral Regions (Zhaoqing, Jiangmen): They produced <10% of emissions; however, Zhaoqing’s 33.1% growth (2010–2015) reflected path dependency in traditional industries (carbon intensity per industrial added value: 2.3× core regions).
Coastal Zones (Zhuhai, Zhongshan): Their emissions were high in the east and low in the west. Zhuhai was a hotspot (37% of 2020 emissions from port-related activities) due to deep-water port expansion.
3.3. Impacts of Land Use Transition on Carbon Emissions
3.3.1. Effect of Construction Land Expansion on Emission in Different Phases
Construction land had the largest influence on carbon emissions, exhibiting an increasing/decreasing trend (2000: 0.637 → 2010: 0.865 → 2020: 0.843) (
Table 11). Under the land finance model, core cities (Guangzhou, Foshan, Dongguan) increased leases for industrial land leasing (annual growth, 6.4%) from 2000 to 2010, resulting in a 7.2% annual emission increase. Dongguan’s land development intensity (42.3% construction land in 2005) and carbon intensity per GDP (3.2 t/10
4 CNY) exceeded regional averages, confirming the carbon lock-in effects of extensive expansion. Post-2010, construction land growth in core cities decelerated to 5.8%, whereas peripheral regions (e.g., Huizhou) showed driver rebounds (0.844) due to petrochemical projects, revealing asymmetric policy implementations.
3.3.2. Implicit Drivers: Dual Pathways of Economic Intensification and Technological Upgrading
The GDP per unit area (mean: 0.798) and energy intensity (0.762) were the dominant factors affecting implicit land use transitions; however, the dominant mechanisms differed temporally (
Figure 8):
Economic Scale-Driven Phase (2000–2010): The influence of the GDP per unit area increased from 0.719 to 0.857, with a 4.8-percentage-point rise in the tertiary sector’s share (48.3%→53.1%). However, energy-intensive industries still contributed 65% to industrial emissions, highlighting the contradiction between industrial upgrading and energy efficiency.
Technology-Dominated Phase (2010–2020): The carbon intensity per unit area GDP declined by 42%, and the energy intensity influence decreased from 0.858 to 0.682, indicating the effect of technological innovation.
3.3.3. Spatial Heterogeneity of Drivers: Agglomeration Effects vs. Model Innovation
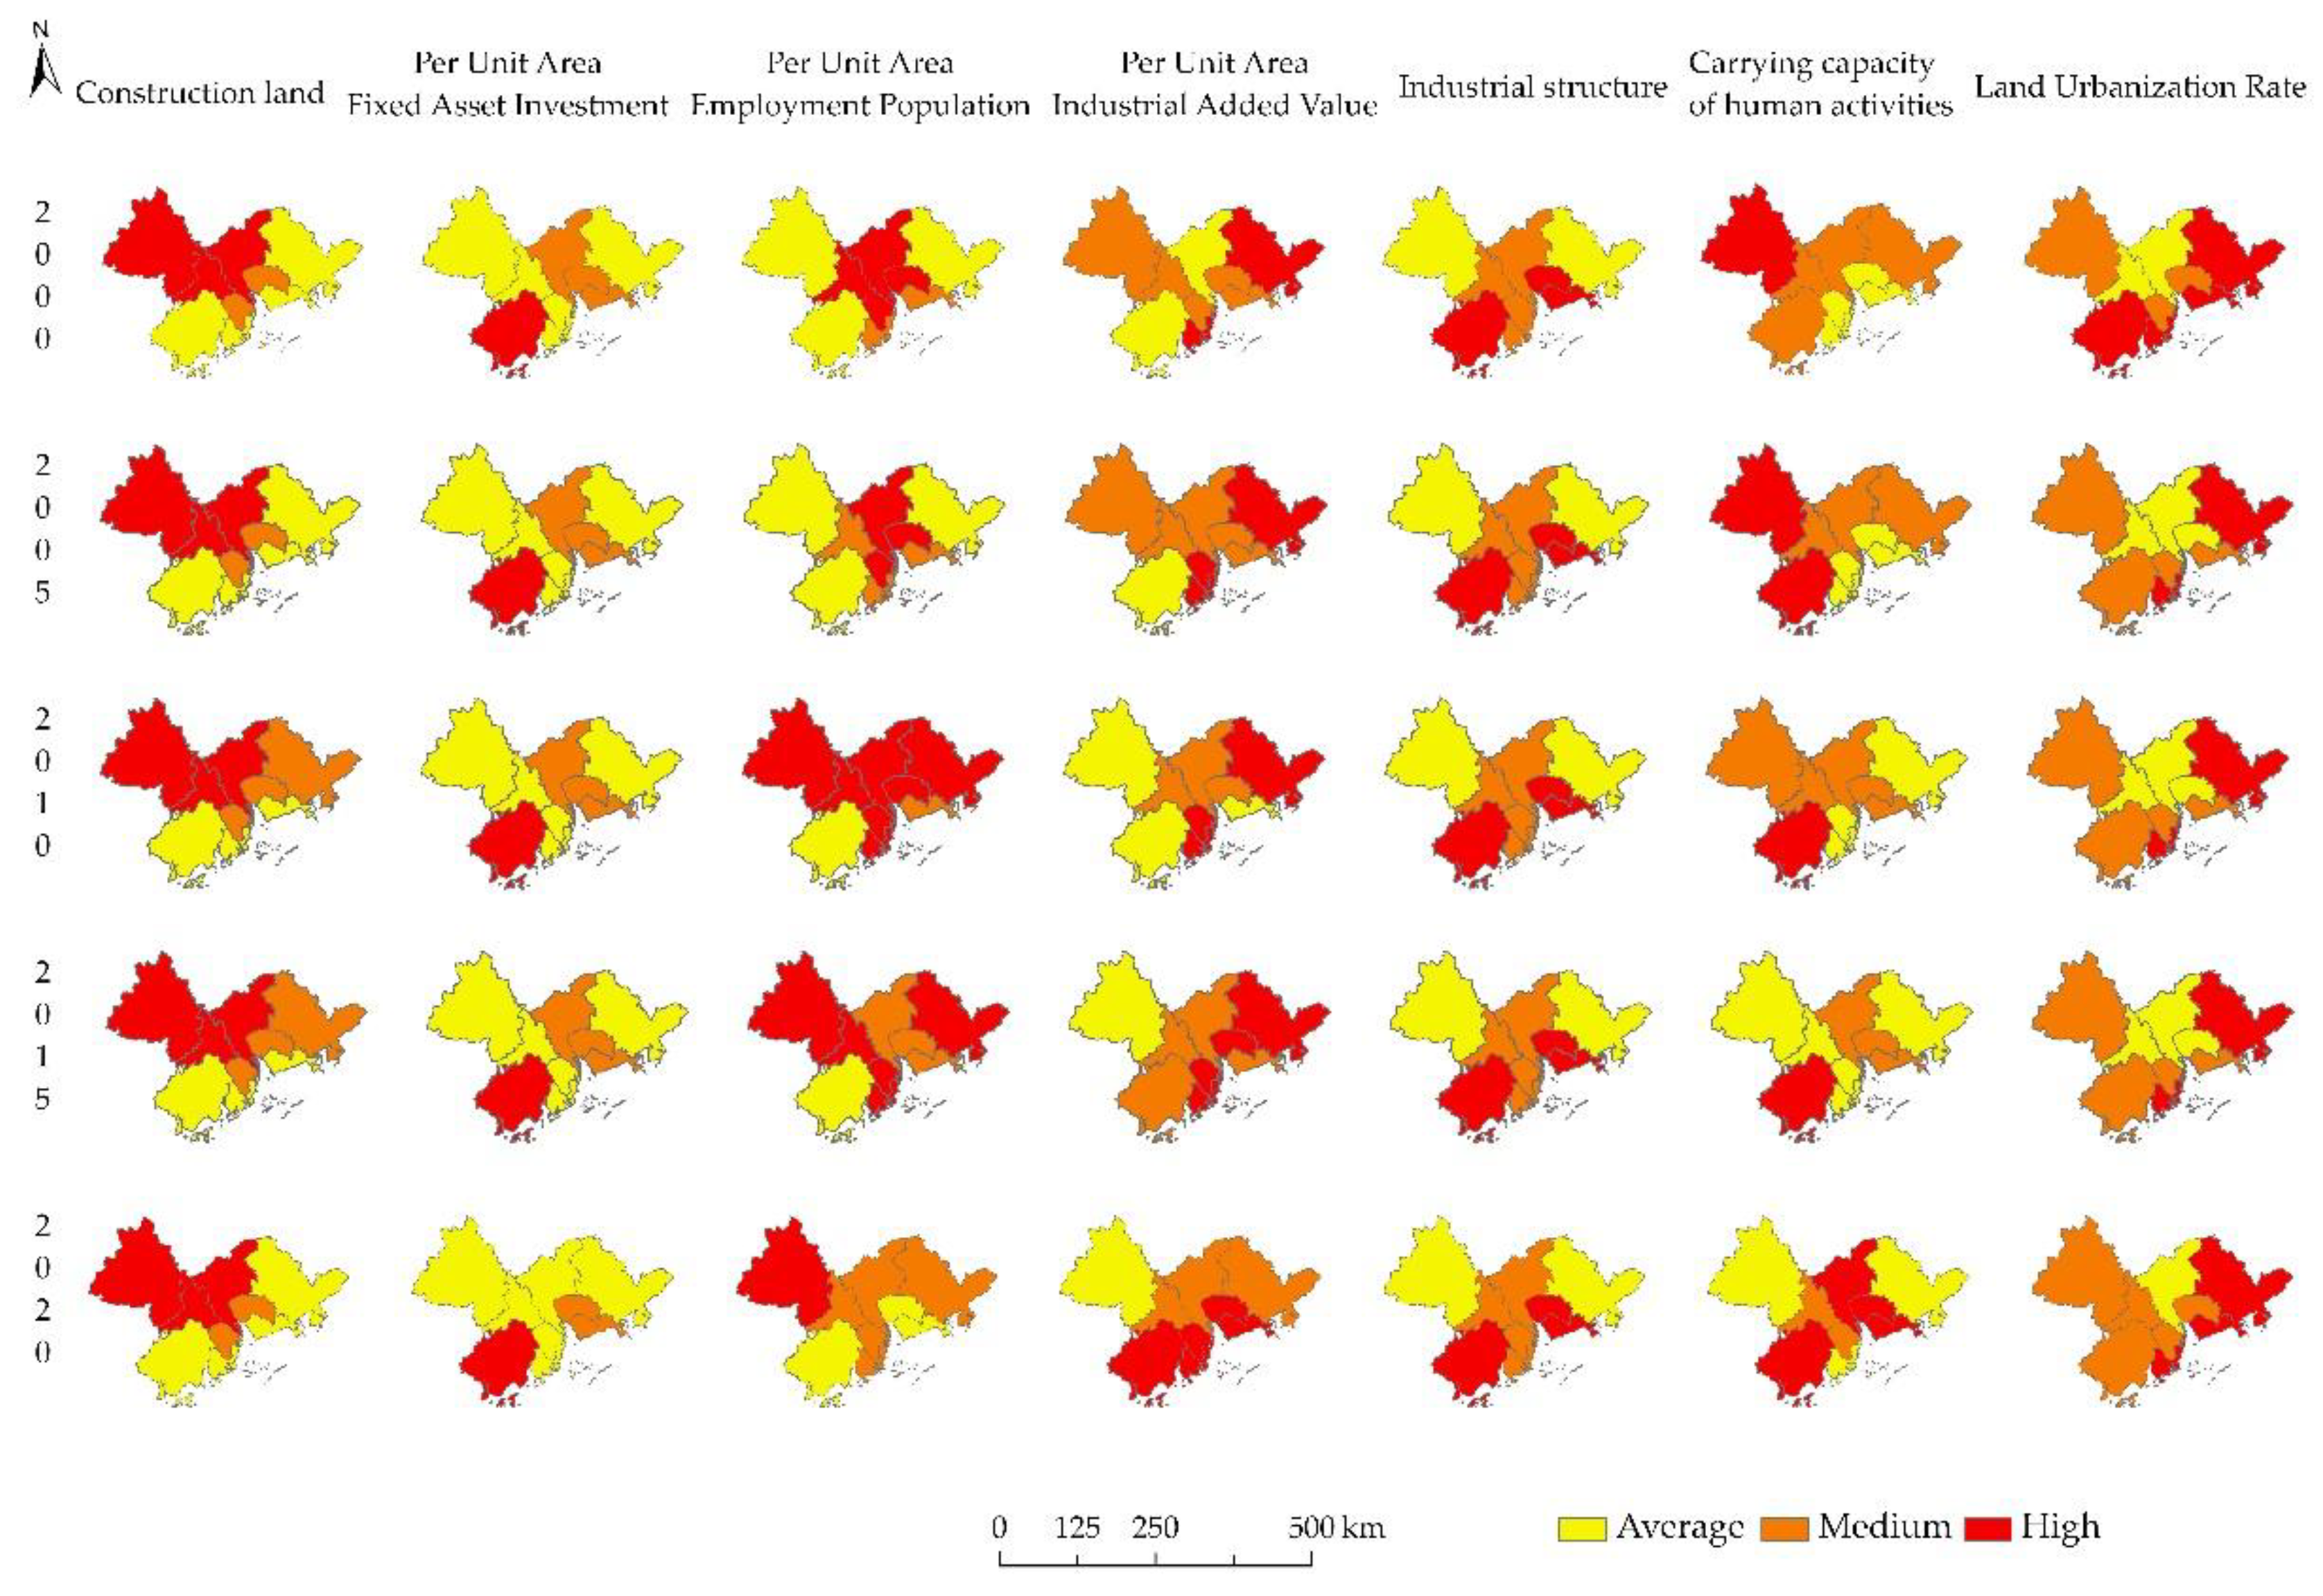
The spatial patterns of the factors affecting carbon emissions are shown in
Figure 7.
Core Regions (Guangzhou, Shenzhen, Dongguan, and Foshan): Significant high-high clustering of construction land and GDP per unit area (Moran’s I=0.68, p<0.01) was observed, creating a growth–expansion–emission positive feedback loop.
Peripheral Regions (Zhaoqing, Jiangmen): Human activity carrying capacity (weight: 0.561) and land urbanization rate (0.458) had the largest effects on emissions, indicating marginal incremental effects of population density and urban sprawl.
Coastal Transition Zones (Zhuhai, Zhongshan): Synergy between fixed-asset investment per unit area (0.712) and the combination of fish farming and solar power generation reduced carbon intensity per GDP by 28% compared to the core regions, demonstrating the mitigation potential of clean energy integration and multifunctional land use.
Figure 7.
Spatial Patterns of Factors Influencing Carbon Emission Driving in Cities of the PRD from 2000 to 2020.
Figure 7.
Spatial Patterns of Factors Influencing Carbon Emission Driving in Cities of the PRD from 2000 to 2020.
3.4. Carbon Emission Resilience
The carbon emission resilience index (CRI) of the PRD municipalities exhibited pronounced spatial and temporal heterogeneity from 2000 to 2020. The mean regional CRI increased from 0.53 in 2000 to 0.58 in 2020, with an annual growth rate of ~0.5%, indicating a slow increase in resilience. Notably, the disparity in the CRI between core municipalities (Shenzhen, Guangzhou, and Dongguan) and peripheral cities (Zhaoqing, Jiangmen) widened, highlighting uneven regional development and policy responsiveness (
Table 12).
3.4.1. Regional Differences in Resilience Patterns
Core cities exhibited higher resilience. Economically advanced municipalities like Shenzhen (CRI 0.793 in 2020), Guangzhou (0.683), and Zhongshan maintained high resilience due to their robust adaptive capacity (e.g., Shenzhen’s adaptive capacity: 0.393) and low sensitivity (Shenzhen’s sensitivity: 0.03). These cities effectively mitigated systemic carbon risks through technological innovations (e.g., smart grids in Shenzhen) and policy initiatives (e.g., circular economy pilots in Guangzhou). In contrast, peripheral cities like Zhaoqing (CRI 0.191) and Jiangmen (0.420) exhibited persistent vulnerabilities due to low adaptive capacity (Zhaoqing’s adaptive capacity: 0 in multiple periods) and high exposure (Zhaoqing’s exposure: 0.041 in 2020). Their reliance on traditional energy-intensive industries (e.g., building materials in Zhaoqing) and insufficient low-carbon infrastructure investments increased risk.
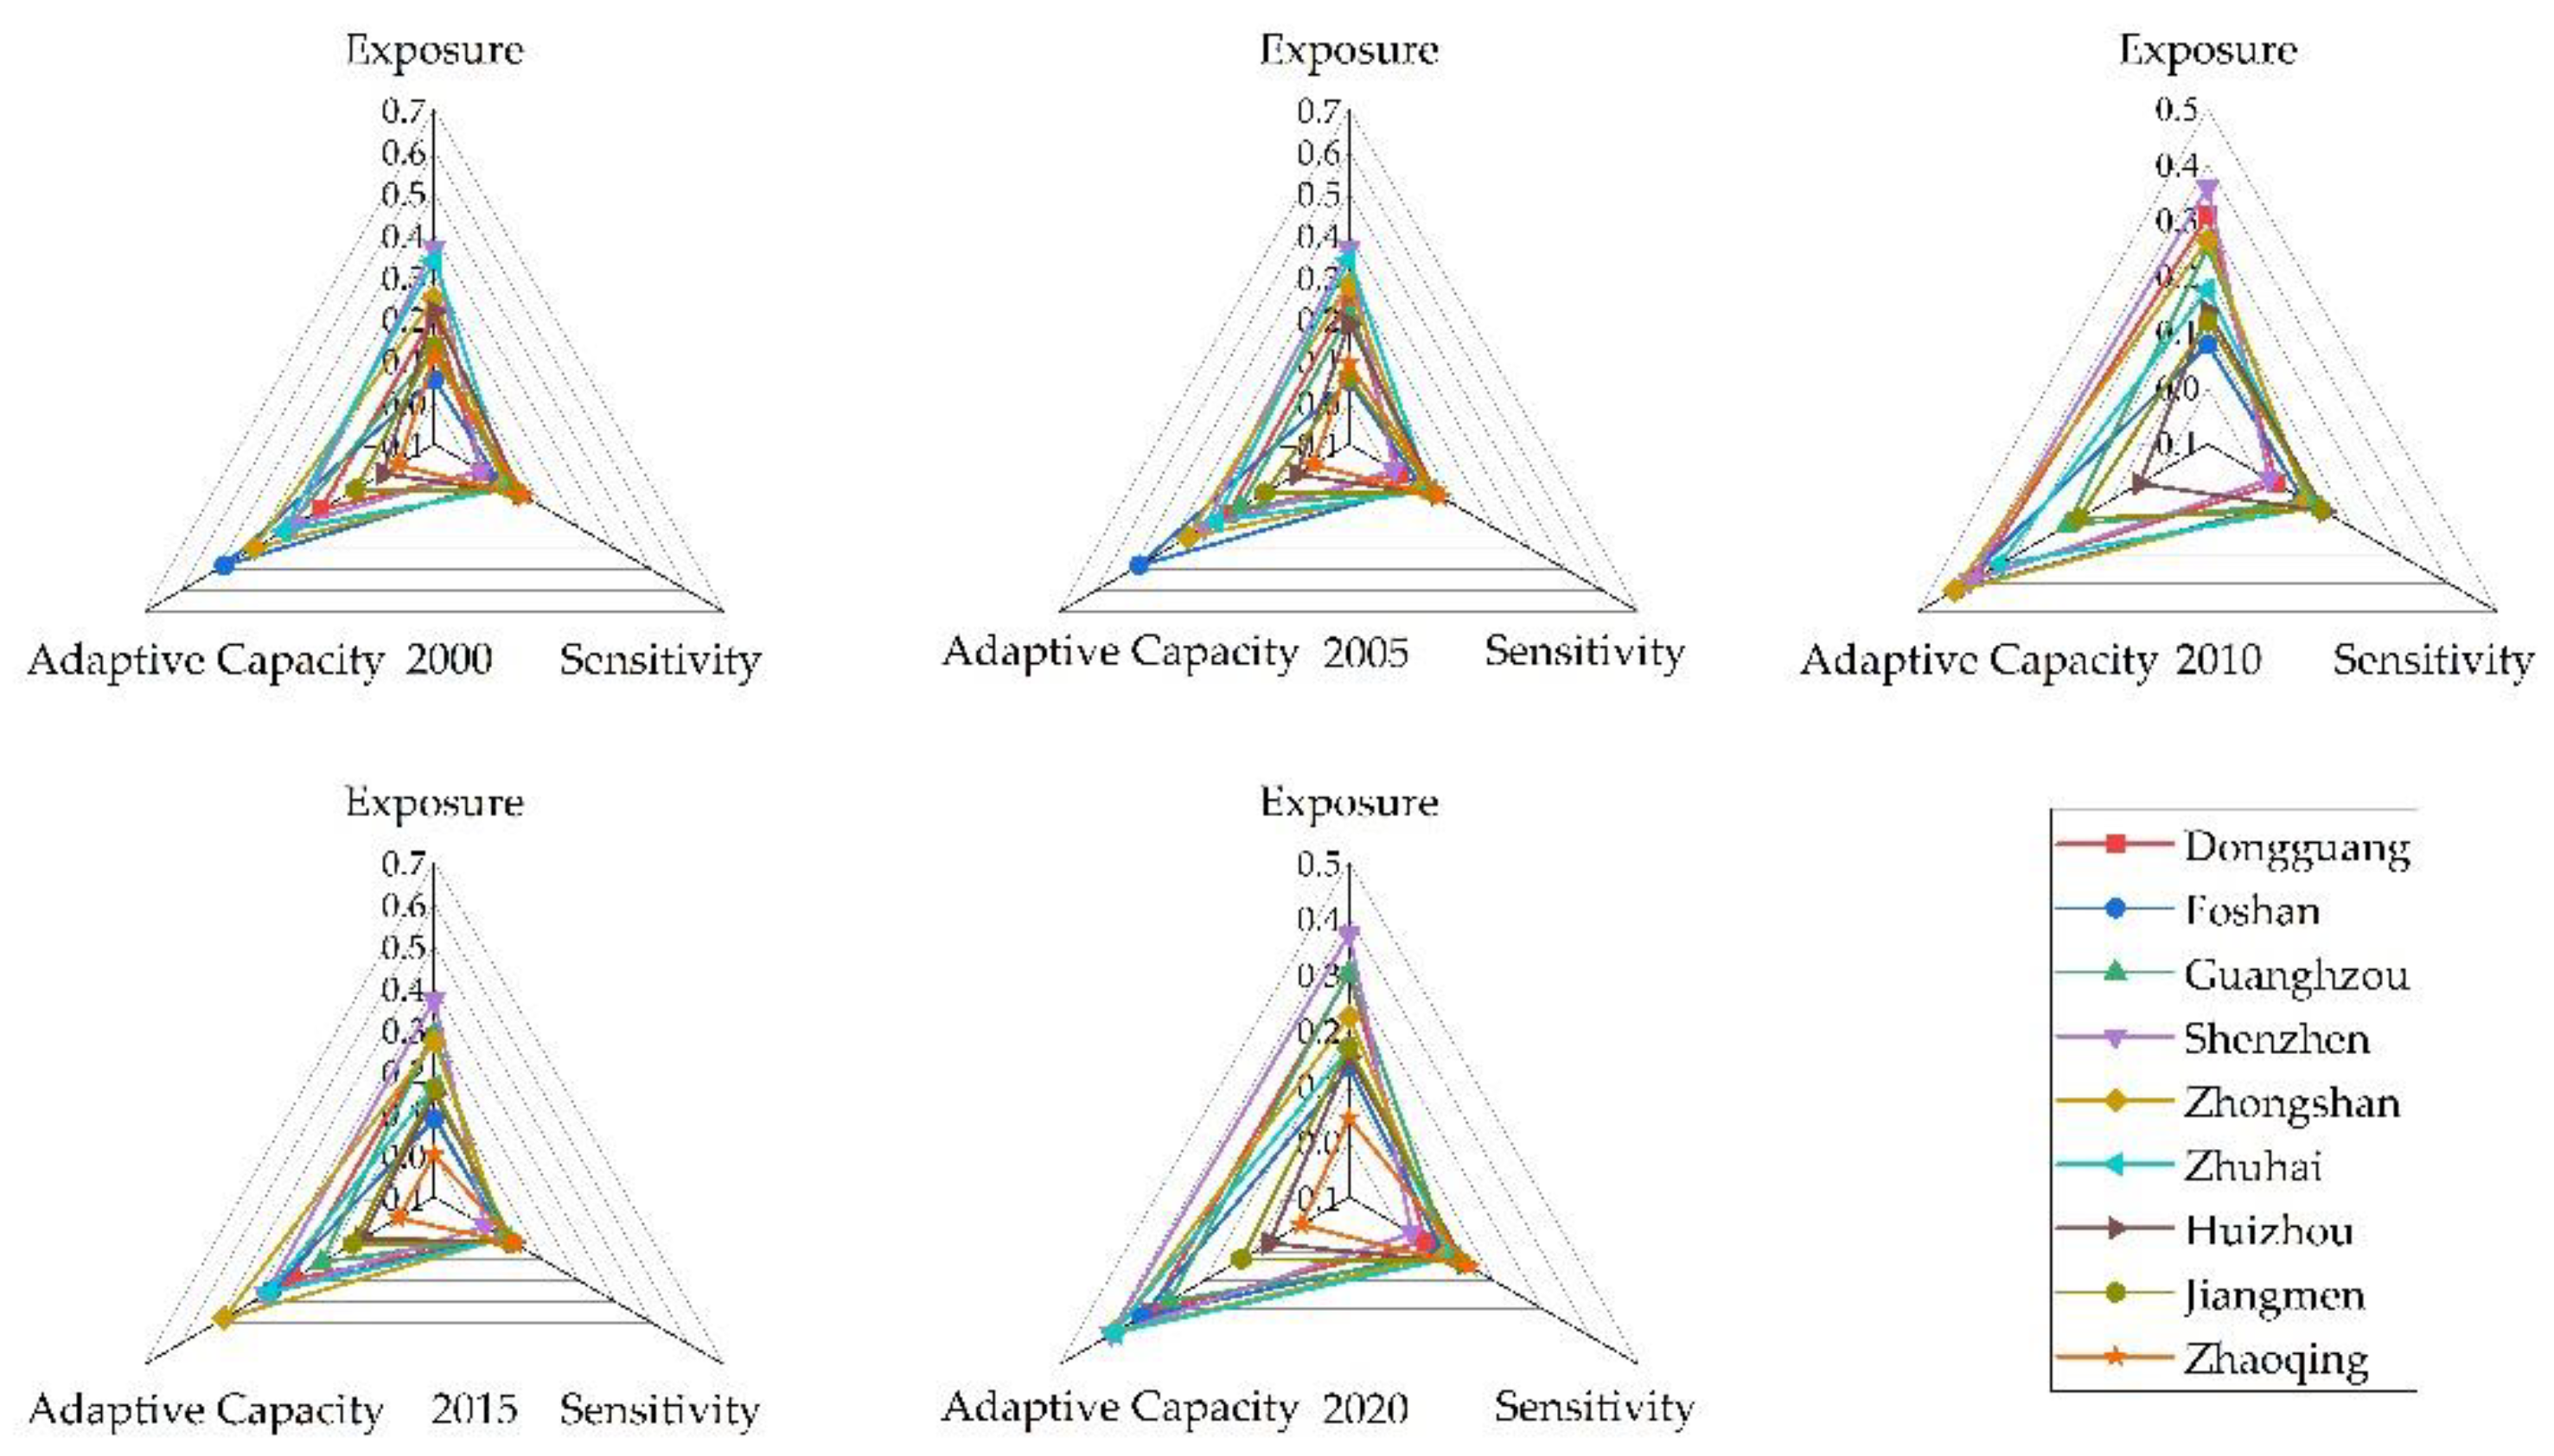
3.4.2. Dynamic Evolution of Resilience Components
High adaptive capacity resulted in high resilience (
Figure 8). Shenzhen and Zhongshan achieved high resilience through adaptive capacity improvements (Zhongshan’s adaptive capacity peaked at 0.48 in 2015), whereas Zhaoqing and Huizhou had lower resilience due to lower adaptive capacity. Trade-offs between exposure and sensitivity occurred. Guangzhou’s exposure increased from 0.128 (2000) to 0.302 (2020), and its adaptive capacity growth (0.306→0.273) reduced risks, yielding a 25% CRI increase. Conversely, Zhongshan’s post-2015 CRI decline (0.846→0.710) stemmed from rising exposure (0.271→0.224) and diminished adaptive capacity (0.48→0.384), underscoring the inadequacy of single factors on sustained resilience.
Figure 8.
Radar Chart of Carbon Emission Resilience Dimensional Scores in Cities of the PRD from 2000 to 2020.
Figure 8.
Radar Chart of Carbon Emission Resilience Dimensional Scores in Cities of the PRD from 2000 to 2020.
3.4.3. Critical temporal inflection points
2010–2015: Differences in adaptive capacity:
The adaptive capacity of core cities (Shenzhen, Zhongshan) increased (Shenzhen: 0.285→0.365), whereas that of peripheral cities (Zhaoqing, Jiangmen) remained stable, amplifying regional disparities.
2015-2020: Resilience decrease phase:
Multiple cities experienced CRI declines (e.g., Zhongshan: -0.136) amid economic deceleration and environmental pressures. The exposure increased due to intensifying conflicts between conventional development paradigms and low-carbon objectives.
4. Discussion
The interaction between land use transitions and carbon emissions in the PRD revealed conflicts between policy directives and economic imperatives. Our analysis demonstrates that construction land expansion was the dominant factor affecting carbon emission increases (2000–2020), a trend in line with the implementation of the Guangdong-Hong Kong-Macao Greater Bay Area national strategy. The PRD urban cluster (centered on Guangzhou and Shenzhen) exhibited an 8.13% annual increase in the construction land growth rate from 2000 to 2010, aligning with the policy orientation of "strengthening the radiation effect of core cities"objective of the PRD Regional Reform and Development Plan (2008–2020). The growth decelerated to 6.28% annually after 2015, consistent with the Guangdong Territorial Spatial Plan (2021–2035), which mandates strict control of new construction land and stock renewal, indicating high policy efficacy.
However, systemic conflicts remained. 1) Farmland-urbanization conflict: 234,000 hectares of farmland were lost (2000–2020), with 52.0% converted to construction land, affecting the balance between farmland requisition and compensation. Farmland derived from wetland reclamation (e.g., Foshan’s mulberry-dyke-fishpond conversion) often has lower quality, exposing the policy’s quantity equilibrium vs. quality deficit loophole. 2) Ecological redline enforcement gaps: Despite designating 13,500 km² of environmental protection zones, the PRD experienced a net forest loss of 1,992 km² (2010–2020). Most land was converted to construction land, indicating weak regulatory constraints during rapid urbanization.
- 2.
Effect of Land Use Transition on Carbon Emissions in the Pearl River Delta
Short-Term Drivers (2000–2010): Investment-Led Urbanization and Carbon Lock-In. The investment-driven rapid urbanization from 2000 to 2010 triggered substantial carbon lock-in effects. A strong coupling was observed between investment flows, construction land expansion, and carbon emission growth (R²=0.89), validating the path dependency of local governments under the land finance model—a strategy reliant on attracting industrial investments through subsidized land leasing. Structural rigidities in energy systems and industrial composition encouraged high-carbon pathways, with energy-intensive industries contributing 65% to industrial emissions. The high correlation between secondary sector value-added and emissions (R²=0.89) suggested systemic lock-in of carbon-intensive sectors. Despite Guangdong’s Dual Transfer Strategy (2008) to relocate labor-intensive industries, technological stagnation impeded energy efficiency improvements, perpetuating the reliance on traditional manufacturing.
Long-Term Drivers (2010–2020): Industrial Upgrading and Technological Innovation. Post-2010, structural adjustments and technological progress reduced emission growth rates, resulting in a decoupling trajectory of industrial upgrading, increased land efficiency, and policy synergy. Dongguan and Foshan exhibited negative emission hotspots, where industrial upgrading reduced carbon emission growth. However, energy consumption remained a positive driver in peripheral regions (e.g., Huizhou and Zhaoqing), revealing lagging low-carbon transitions. Core cities exhibited fewer short-term drivers but high long-term decarbonization capacity, whereas peripheral areas followed conventional development.
- 3.
Carbon Emission Resilience and Pathways for Enhancement
The PRD exhibited high CER in core cities and low CER in peripheral regions. The adaptive capacity had the largest effect on system resilience (weight: 0.284). Regional disparities necessitate synergistic policies and technological interventions due to existing economic structures and institutional design.
Core Cities (Shenzhen, Guangzhou): They have high-tech clusters (new energy and digital economy) and adequate policy instruments (carbon trading pilots and green finance). They reduced carbon intensity by 42% (2010–2020), demonstrating the amplifying effect of technology-institution synergy on resilience.
Peripheral Cities (Zhaoqing, Jiangmen): Due to traditional manufacturing, their industrial carbon intensity was 2.3 times higher than that of core cities, resulting in a high emission (annual growth: 33.1%)–low resilience (index <0.45) vicious cycle.
The spatial pattern indicateda gradient in resilience:
Coastal Zones (Zhuhai, Zhongshan): These had high adaptive capacity due to blue carbon ecosystem restoration (e.g., 18.7% increase in mangrove carbon sequestration in Zhuhai) and marine energy exploitation.
Inland Areas (Zhaoqing, Huizhou): Due to the fragility of the karst landscape, environmental restoration yielded diminishing returns (annual resilience growth <3%).
Different Resilience Pathways:
Responsibilities of Core Cities: Shenzhen and Guangzhou should focus on technology diffusion (e.g., cross-regional low-tech incubators) and fiscal transfers (regional resilience funds).
Strategies for Peripheral Cities: Zhaoqing could develop carbon-neutral tourism based on Danxia landforms to replace energy-intensive industries. Jiangmen could utilize diaspora networks to establish zero-carbon pilot zones.
Governance Based on Dynamic Resilience: Real-time policy response to the resilience index could be implemented. For instance, a 5% decline in Zhongshan’s CER could trigger industrial subsidies and carbon quota reallocation, enabling proactive risk management.
- 4.
Regional Differences in Policy Pathways Toward Carbon Neutrality
Provincial governments should establish a regional low-carbon technology transition fund and construct a multi-level response system to address the core-periphery difference in carbon emission resilience. A ≥5% CRI decline would trigger industrial subsidies and carbon quota reallocations. A collaborative network of governments, enterprises, and communities should be established based on the Guangdong-Hong Kong-Macao Greater Bay Area Green Finance Alliance to monitor carbon emissions of key industries. We propose policy interventions for the PRD tailored to different regions to balance economic growth and carbon neutrality goals. They are based on the factors affecting carbon emissions (short-term land finance dependency and long-term technology-industry decoupling) and the resilience assessment results (high adaptive capacity in core zones vs. systemic vulnerability in peripheral areas) (
Table 13).
- 5.
Limitations and Future Directions
The proposed CER assessment framework has the following limitations:
Homogeneous Indicator Weights: The equal weighting of exposure, sensitivity, and adaptive capacity (intra-dimensional weight differences <15%) does not consider the dominance of adaptive capacity (e.g., contributing 62% to Shenzhen’s resilience). Future studies could integrate entropy and the technique for order of preference by similarity to an ideal solution (TOPSIS) models for assigning variable weights.
Unresolved Scale Effects: City-scale analysis overlooks county-level heterogeneity. Multi-scale data fusion is required to determine micro-mechanisms.
Unquantified Policy-Market Interactions: The dynamic impacts of land finance and industrial relocation on resilience were not measured. Panel vector autoregression (VAR) models could improve the accuracy of analyzing the influencing factors.
5. Conclusion
This study systematically evaluated the coupling mechanisms between land use transition and carbon emissions in the PRD from 2000 to 2020, integrating multi-source spatiotemporal data and a resilience assessment framework. The key findings are as follows:
Construction land increased by 88.79% during the study period (42.81→80.82×10⁴ ha) with an annual growth rate of 4.44%. Initially, the source was primarily cropland (78% during 2000–2010), followed by multi-source inputs (58% cropland, 15% woodland, and 7% water bodies post-2010).
- 2.
Three-Phase Evolution of Implicit Land Use Transition
The implicit land use transition index increased annually by 15.6%, exhibiting three phases: rapid development (2000–2010, 22.3%), steady adjustment (2010–2015, 12.3%), and high-quality transition (2015–2020, 8.1%). Core cities (Shenzhen: 0.91; Guangzhou: 0.80) led innovation-driven transitions but experienced diminishing marginal returns (Shenzhen’s growth rate dropped to 0.005 post-2015), whereas peripheral cities (Zhaoqing: 0.57) lagged behind due to path dependency and technological gaps.
- 3.
Spatiotemporal Differences in Emission Drivers and Policy Effects
Regional carbon emissions increased by 186.96% (6564.89→18838.46×104 t), indicating carbon lock-in effect in core cities (61.8% from core cities) vs. peripheral rebound (Huizhou: +703.6%) spatial patterns. Changes in construction land had the dominant effects on emissions (mean influence: 0.799), but this impact declined post-2010 (0.865→0.843). Implicit drivers included GDP per unit area (0.798) and energy intensity (0.762). I industrial restructuring contributed 26.7% to emission reduction, confirming the decoupling potential of tertiary sector growth.
- 4.
Policy-Market Synergy Requirements due to Different Phases
Land-finance-driven carbon lock-in dominated short-term (2000–2010) dynamics, with a high correlation between construction land expansion and emission growth (R²=0.89). Long-term (2010–2020) transitions in core cities were affected by industrial upgrading (tertiary sector share: +7.8%) and technological innovation (carbon intensity per GDP: −42%), whereas peripheral regions remained vulnerable to industrial transfer - carbon emission transfer risks from industrial relocation.
- 5.
Effect of Adaptive Capacity on Resilience Gradient
The CRI index rose from 0.53 to 0.58, with high values in Shenzhen and Zhongshan and low values in Jiangmen and Zhaoqing. Core cities increased their resilience through technological innovation (patents per 104 people: weight 0.284) and policy synergy (e.g., carbon trading pilots), whereas peripheral cities had high exposure (industrial emission share: 0.192) and low carbon sink capacity (0.194), resulting in a high emission–low resilience feedback loop.
Author Contributions
W.W.: writing—original draft, software, visualization, and methodology. Y.H.: supervision. X.C.: resources, funding acquisition. X.M.: project administration, and writing—review and editing. Y.Z.: data curation. L.T. software, visualization. J.C.: validation. All authors have read and agreed to the published version of the manuscript.
Funding
This work was supported by the National Key R&D Program of China [grant number 2023YFD1900100]; the Shaoguan Science and Technology Plan Project [grant number 220531134531827].
Data Availability Statement
Data are available and can be provided upon request.
Acknowledgments
We are thankful to the anonymous reviewers for their valuable comments.
Conflicts of Interest
The authors declare no conflicts of interest.
References
- Masson-Delmotte, V.; Pörtner, H.O.; Skea, J.; et al. Climate Change and Land: An IPCC Special Report on Climate Change, Desertification, Land Degradation, Sustainable Land Management, Food Security, and Greenhouse Gas Fluxes in Terrestrial Ecosystems; IPCC: Geneva, Switzerland, 2019. [Google Scholar]
- Harris, N.L.; Gibbs, D.A.; Baccini, A.; et al. Global Maps of Twenty-First Century Forest Carbon Fluxes. Nat. Clim. Chang. 2021, 11, 234–240. [Google Scholar] [CrossRef]
- Tian, H.; Xu, R.; Canadell, J.G.; et al. A Comprehensive Quantification of Global Nitrous Oxide Sources and Sinks. Nature 2020, 586, 248–256. [Google Scholar] [CrossRef] [PubMed]
- Xia, L.; Lam, S.K.; Wolf, B.; et al. Trade-Offs between Soil Carbon Sequestration and Reactive Nitrogen Losses under Straw Return in Global Agroecosystems. Glob. Chang. Biol. 2018, 24, 5919–5932. [Google Scholar] [CrossRef]
- Gao, S.; Zhang, X.; Chen, M. Spatiotemporal Dynamics and Driving Forces of City-Level CO2 Emissions in China from 2000 to 2019. J. Clean. Prod. 2022, 377, 134358. [Google Scholar] [CrossRef]
- Grainger, A. National Land Use Morphology: Patterns and Possibilities. Geography 1995, 80, 235–245. [Google Scholar] [CrossRef]
- Liu, Y.Q.; Long, H.L. Land Use Transitions and Their Dynamic Mechanism: The Case of the Huang-Huai-Hai Plain [In Chinese]. J. Geogr. Sci. 2016, 26, 515–530. [Google Scholar] [CrossRef]
- Long, H.L. Explanation of Land Use Transitions [In Chinese]. China Land Sci. 2022, 36, 1–7. [Google Scholar] [CrossRef]
- Song, X.Q. Discussion on Land Use Transition Research Framework [In Chinese]. Acta Geogr. Sin. 2017, 72, 471–487. [Google Scholar] [CrossRef]
- Yang, S.H.; Li, L.; Ma, J.D.; et al. Land Use Transitions and Its Terrain Gradient Effects Based on Production-Living-Ecological Spaces in Shaanxi Province during 1990–2020 [In Chinese]. Arid Zone Res. 2024, 41, 1249–1258. [Google Scholar] [CrossRef]
- Ding, X.Y.; Ye, C.S.; Hu, H.P.; et al. Land Use Function Transformation and Its Driving Mechanism in Poyang Lake City Cluster of China [In Chinese]. Trans. Chin. Soc. Agric. Eng. 2024, 40, 298–308. [Google Scholar] [CrossRef]
- Wang, Y.X.; Wang, Y.F.; Zhang, J.W.; et al. Land Use Transition in Coastal Area and Its Associated Eco-Environmental Effect: A Case Study of Coastal Area in Fujian Province [In Chinese]. Acta Sci. Circumstantiae 2021, 41, 3927–3937. [Google Scholar] [CrossRef]
- Houghton, R.A. Carbon Emissions and the Drivers of Deforestation and Forest Degradation in the Tropics. Curr. Opin. Environ. Sustain. 2012, 4, 597–603. [Google Scholar] [CrossRef]
- Seto, K.C.; Güneralp, B.; Hutyra, L.R. Global Forecasts of Urban Expansion to 2030 and Direct Impacts on Biodiversity and Carbon Pools. Proc. Natl. Acad. Sci. USA 2012, 109, 16083–16088. [Google Scholar] [CrossRef] [PubMed]
- Smith, P.; et al. How to Measure, Report and Verify Soil Carbon Change to Realize the Potential of Soil Carbon Sequestration for Atmospheric Greenhouse Gas Removal. Glob. Chang. Biol. 2020, 26, 219–241. [Google Scholar] [CrossRef] [PubMed]
- Li, K.; Lin, B. Impacts of Urbanization and Industrialization on Energy Consumption/CO2 Emissions: Does the Level of Development Matter? Renew. Sustain. Energy Rev. 2015, 52, 1107–1122. [Google Scholar] [CrossRef]
- Oke, T.R.; Mills, G.; Christen, A.; Voogt, J.A. Urban Climates; Cambridge University Press: Cambridge, UK, 2017. [Google Scholar]
- Gui, D.; He, H.; Liu, C.; Han, S. Spatio-Temporal Dynamic Evolution of Carbon Emissions from Land Use Change in Guangdong Province, China, 2000–2020. Ecol. Indic. 2023, 156, 111131. [Google Scholar] [CrossRef]
- Liu, J.S.; Wang, S.H.; Zhao, M.S.; et al. Spatial-Temporal Differences and Influencing Factors of Land Use Carbon Emissions in Shanxi Province [In Chinese]. J. Yichun Univ. 2023, 45, 6–11. [Google Scholar]
- Wang, Y.J.; Zhai, C.X.; Liu, C.Y.; et al. Analysis of Spatiotemporal Differences and Influencing Factors of Land Use Carbon Emissions in Ningxia [In Chinese]. Environ. Sci. 2024, 45, 5049–5059. [Google Scholar] [CrossRef]
- Li, Z.H.; Zhou, D.M.; Jiang, J.; et al. Spatial and Temporal Evolution Characteristics of Carbon Emission from Land Use and Influencing Factors in Gansu Province [In Chinese]. Environ. Sci. 2024, 45, 5040–5048. [Google Scholar] [CrossRef]
- Huang, D.; Liu, Y.Z.; Liu, J.N.; et al. Spatial-Temporal Evolution of Production-Living-Ecological Functions and Their Carbon Emission Effects in Liaoning Province [In Chinese]. Bull. Soil Water Conserv. 2024, 44, 421–431. [Google Scholar] [CrossRef]
- Long, Z. Spatiotemporal Pattern of Carbon Emissions and Carbon Balance Zoning Optimization in the County Scale [In Chinese]. Ph.D. Thesis, Lanzhou University, Lanzhou, China, 2022. [Google Scholar]
- Yuan, X. Temporal-Spatial Patterns of Land Use Carbon Emissions and Low Carbon Optimization in Chongqing in Recent 20 Years [In Chinese]. Master’s Thesis, Southwest University, Chongqing, China, 2018. [Google Scholar]
- Creutzig, F.; Agoston, P.; Minx, J.C.; et al. Urban Infrastructure Choices Structure Climate Solutions. Nat. Clim. Chang. 2016, 6, 1054–1056. [Google Scholar] [CrossRef]
- Zheng, J.; Mi, Z.; Coffman, D.M.; et al. Regional Development and Carbon Emissions in China. Energy Econ. 2019, 81, 25–36. [Google Scholar] [CrossRef]
- Creutzig, F.; Baiocchi, G.; Bierkandt, R.; et al. Global Typology of Urban Energy Use and Potentials for an Urbanization Mitigation Wedge. Proc. Natl. Acad. Sci. USA 2015, 112, 6283–6288. [Google Scholar] [CrossRef] [PubMed]
- IPCC. 2006 IPCC Guidelines for National Greenhouse Gas Inventories; IPCC: Geneva, Switzerland, 2006. [Google Scholar]
- Kazmierczak, A.; Bittner, S.; Breil, M.; et al. Urban Adaptation in Europe: How Cities and Towns Respond to Climate Change; European Environment Agency: Copenhagen, Denmark, 2020. [Google Scholar] [CrossRef]
- Wang, F.; Wang, C.; Lin, X.; et al. County-Level Spatiotemporal Dynamics and Driving Mechanisms of Carbon Emissions in the Pearl River Delta Urban Agglomeration, China. Land 2024, 13, 1829. [Google Scholar] [CrossRef]
- Tian, J.F. The Process, Mechanism and Optimization of Regional Land Use Transition under the Guidance of Policy: A Case Study of Three Provinces of Northeast China [In Chinese]. Ph.D. Thesis, Jilin University, Changchun, China, 2020. [Google Scholar]
- Wang, Y. Spatial-Temporal Evolution and Scenario Simulation of Territorial Spatial Carbon Emission in Wuhan City [In Chinese]. Master’s Thesis, China University of Geosciences, Wuhan, China, 2022. [Google Scholar]
- Zhang, Y.Y.; Zhu, H.C.; Yang, L. Study on Temporal and Spatial Distribution Characteristics and Influencing Factors of XCO2 Concentration in China [In Chinese]. Chin. Sci. Bull. 2024, 40, 95–100. [Google Scholar] [CrossRef]
- Huang, M.; et al. Spatial and Temporal Analysis of Income Inequality. J. Urban Econ. 2010, 68, 5–25. [Google Scholar]
- IPCC. Climate Change 2014: Impacts, Adaptation, and Vulnerability; Cambridge University Press: Cambridge, UK, 2014. [Google Scholar]
- IPCC. Climate Change 2022: Impacts, Adaptation and Vulnerability; Cambridge University Press: Cambridge, UK, 2022. [Google Scholar]
- Turner, B.L.; Kasperson, R.E.; Matson, P.A.; et al. A Framework for Vulnerability Analysis in Sustainability Science. Proc. Natl. Acad. Sci. USA 2003, 100, 8074–8079. [Google Scholar] [CrossRef]
- Ayres, R.U.; Simonis, U.E. (Eds.) Industrial Metabolism: Restructuring for Sustainable Development; United Nations University Press: Tokyo, Japan, 1994. [Google Scholar]
- Rees, W.E.; Wackernagel, M. Ecological Footprints and Appropriated Carrying Capacity: What Urban Economics Leaves Out. Environ. Urban. 1992, 4, 121–130. [Google Scholar] [CrossRef]
- Forman, R.T.T.; Godron, M. Landscape Ecology; John Wiley & Sons: New York, NY, USA, 1986. [Google Scholar]
- Sharp, R.; Tallis, H.T.; Ricketts, T.; et al. InVEST 3.13.0 User’s Guide; Natural Capital Project: Stanford, CA, USA, 2022. [Google Scholar]
- Romer, P.M. Endogenous Technological Change. J. Polit. Econ. 1990, 98, S71–S102. [Google Scholar] [CrossRef]
- Lin, T.; Yang, M.Z.; Wu, D.F.; et al. Spatial Correlation and Prediction of Land Use Carbon Storage Based on the InVEST-PLUS Model: A Case Study in Guangdong Province [In Chinese]. China Environ. Sci. 2022, 42, 4827–4839. [Google Scholar] [CrossRef]
Figure 1.
Spatial location and topography of the study area.
Figure 1.
Spatial location and topography of the study area.
Figure 2.
Land use transition matrices from 2000 to 2020 for each period.
Figure 2.
Land use transition matrices from 2000 to 2020 for each period.
Figure 3.
Hotspots of land use change in the PRD from 2000 to 2020.
Figure 3.
Hotspots of land use change in the PRD from 2000 to 2020.
Figure 4.
Spatial Distribution of the Index of Implicit Land Use Transition in the PRD from 2000 to 2020.
Figure 4.
Spatial Distribution of the Index of Implicit Land Use Transition in the PRD from 2000 to 2020.
Figure 5.
Correlation between Dynamic Degree and Index of Implicit Land Use Transition.
Figure 5.
Correlation between Dynamic Degree and Index of Implicit Land Use Transition.
Figure 6.
Carbon Emissions in Cities of the PRD from 2000 to 2020.
Figure 6.
Carbon Emissions in Cities of the PRD from 2000 to 2020.
Table 1.
Data and Sources.
Table 1.
Data and Sources.
| Data |
Source |
| Land Use |
Resource and Environment Science and Data Center (RESDC, www.resdc.cn), classified into six categories: cropland, woodland, grassland, water, construction land, and bare land.
China Land Cover Dataset (CLCD, doi.org/10.5194/essd-13), cross-validated with an overall accuracy >85% (Kappa = 0.82). |
| Socioeconomic data |
China Urban Statistical Yearbook (2001-2021), China Urban Construction Statistical Yearbook (2006-2021), Guangdong Statistical Yearbook (2001-2021), Guangdong Rural Statistical Yearbook (2001-2021), and statistical yearbooks of cities in the PRD (2001-2021) |
| Administrative Boundaries |
PRD Municipal and County Administrative Boundary Map (Open Street Map, www.openstreetmap.org) |
Table 2.
Indicator System for Assessing Implicit Land Use Transitions.
Table 2.
Indicator System for Assessing Implicit Land Use Transitions.
| Objective Layer |
Criterion Layer |
Indicator Layer |
Calculation Method |
Unit |
Weight |
| Implicit Land Use Transition |
Land Use Input |
Per Unit Area Fixed Asset Investment |
Fixed Asset Investment / Area |
10,000 CNY/ km² |
0.109 |
| Per Unit Area Fiscal Expenditure |
Local Public Fiscal Expenditure / Area |
10,000 CNY/ km² |
0.121 |
| Per Unit Area Employment Population |
Number of Employed Persons / Area |
Persons/km² |
0.084 |
| Land Use Output |
Per Unit Area GDP |
GDP / Area |
10,000 CNY/ km² |
0.124 |
| Per Unit Area Industrial Added Value |
Industrial Added Value / Area |
10,000 CNY/ km² |
0.098 |
| Industrial Structure |
Tertiary Industry Proportion / Secondary Industry Proportion |
10,000 CNY/ km² |
0.109 |
| Land Use Intensity |
Per Unit Area Energy Consumption |
Energy Consumption / Area |
Tons of Standard Coal/km² |
0.102 |
| Human Activity Carrying Capacity |
Total Population / Area |
Persons/km² |
0.117 |
| Changes in Land Rights |
Land Urbanization Rate |
Urban Built-up Area / Total Land Area |
% |
0.136 |
Table 3.
Net calorific values and carbon emission factors of key energy sources.
Table 3.
Net calorific values and carbon emission factors of key energy sources.
| Energy Type |
Carbon Emission Factor1 (tC/TJ) 1
|
Net Calorific Value1
(kJ/kg or kJ/m³)1
|
| Raw Coal |
26.1 |
20,908 |
| Washed Coal |
25.41 |
26,344 |
| Other Washed Coal |
25.41 |
8,363 |
| Coke |
29.42 |
28,435 |
| Crude Oil |
20.01 |
41,816 |
| Gasoline |
18.9 |
43,070 |
| Kerosene |
19.6 |
43,070 |
| Diesel |
20.2 |
43,652 |
| Fuel Oil |
21.1 |
41,816 |
| Other Petroleum |
20 |
37,681 |
| LPG |
17.2 |
50,179 |
| Natural Gas |
15.3 |
38,931 |
Table 4.
Emission factors for key industrial products in the PRD.
Table 4.
Emission factors for key industrial products in the PRD.
| Product |
Steel1
|
Pig Iron1
|
Cement1
|
Aluminum1
|
| EF (t/t) |
0.248 |
4.1 |
0.538 |
0.6 |
Table 5.
Emission factors for agricultural inputs.
Table 5.
Emission factors for agricultural inputs.
| Inputs |
N Fertilizer1
|
P Fertilizer1
|
K Fertilizer1
|
Compound1 Fertilizer |
Mulch Film1
|
Pesticides1
|
| EF (tC/t) |
3.392 |
0.636 |
0.18 |
1.147 |
5.18 |
4.934 |
Table 6.
Methane emission factors by rice type.
Table 6.
Methane emission factors by rice type.
| Rice Type |
Single Season1
|
First season in double cropping1
|
Last season in double cropping1
|
| EF kgCH₄/hm²) |
236.7 |
241 |
273.2 |
Table 7.
Evaluation Index System to Assess Carbon Emission Resilience.
Table 7.
Evaluation Index System to Assess Carbon Emission Resilience.
| Criteria Layer |
Indicator Layer |
Calculation Method |
Impact Direction |
Weight |
| Exposure |
Carbon emissions per unit GDP (t/10⁴ yuan) |
Total emissions/GDP |
Negative: Higher exposure reduces resilience |
0.177 |
| Proportion of industrial emissions (%) |
Industrial emissions/Total emissions |
data |
0.192 |
| Sensitivity |
Population density (persons/km²) |
Population / Area |
Negative: Higher sensitivity reduces resilience |
0.112 |
| Ecological land fragmentation index |
(Forest + Grassland + Wetland patches)/Area |
|
0.041 |
| Adaptive Capacity |
Carbon sink capacity (t/km²) |
Calculated via inVEST model & LIN [43] |
Positive: Higher capacity increases resilience |
0.194 |
| Patents granted per 10,000 people |
Patent count/Population |
|
0.284 |
Table 8.
Land Use Change in the PRD from 2000 to 2020 (Unit: 100 km2).
Table 8.
Land Use Change in the PRD from 2000 to 2020 (Unit: 100 km2).
| |
2000 |
2005 |
2010 |
2015 |
2020 |
Average
change rate |
| Class |
Area |
Proportions |
Area |
Proportions |
Area |
Proportions |
Area |
Proportions |
Area |
Proportions |
| Cropland |
143.81 |
26.54% |
130.89 |
24.15% |
125.96 |
24.15% |
124.16 |
24.15% |
120.44 |
24.15% |
-0.81% |
| woodland |
300.44 |
55.44% |
296.71 |
54.75% |
294.6 |
54.75% |
292.81 |
54.75% |
290.5 |
54.75% |
-0.17% |
| Grass land |
10.7 |
1.97% |
9.95 |
1.84% |
9.53 |
1.84% |
9.53 |
1.84% |
10.33 |
1.84% |
-0.17% |
| Water |
43.83 |
8.09% |
42.32 |
7.81% |
41.2 |
7.81% |
40.3 |
7.81% |
40.14 |
7.81% |
-0.42% |
| Construction land |
42.81 |
7.90% |
61.86 |
11.42% |
71.41 |
11.42% |
75.4 |
11.42% |
80.82 |
11.42% |
4.44% |
| Bare land |
0.31 |
0.06% |
0.19 |
0.03% |
0.32 |
0.03% |
0.09 |
0.03% |
0.07 |
0.03% |
-3.95% |
Table 9.
Index of implicit in Cities of the PRD from 2000 to 2020.
Table 9.
Index of implicit in Cities of the PRD from 2000 to 2020.
| Cities |
2000 |
2005 |
2010 |
2015 |
2020 |
| Shenzhen |
0.4543 |
0.6044 |
0.7026 |
0.9051 |
0.9098 |
| Dongguan |
0.2520 |
0.4352 |
0.5538 |
0.6739 |
0.8164 |
| Guangzhou |
0.3093 |
0.4153 |
0.5509 |
0.6705 |
0.8010 |
| Foshan |
0.2252 |
0.3628 |
0.5684 |
0.5923 |
0.6938 |
| Zhongshan |
0.2161 |
0.3829 |
0.5153 |
0.6550 |
0.6995 |
| Zhuhai |
0.1855 |
0.3651 |
0.4477 |
0.5522 |
0.7396 |
| Jiangmen |
0.1818 |
0.3152 |
0.4785 |
0.5141 |
0.6153 |
| Huizhou |
0.2079 |
0.2161 |
0.4320 |
0.5389 |
0.5918 |
| Zhaoqing |
0.1529 |
0.2464 |
0.3678 |
0.4820 |
0.5738 |
Table 10.
Changes in Carbon Emissions in Cities of the PRD from 2000 to 2020.
Table 10.
Changes in Carbon Emissions in Cities of the PRD from 2000 to 2020.
| Cities |
2000-2005 |
2005-2010 |
2010-2015 |
2015-2020 |
| Shenzhen |
128.60% |
11.55% |
16.74% |
13.32% |
| Dongguan |
48.11% |
30.85% |
15.04% |
8.69% |
| Guangzhou |
72.82% |
21.35% |
10.76% |
7.97% |
| Foshan |
58.82% |
50.22% |
5.34% |
-7.38% |
| Zhongshan |
60.17% |
34.55% |
13.13% |
7.46% |
| Zhuhai |
64.87% |
66.74% |
24.58% |
20.11% |
| Jiangmen |
62.38% |
39.12% |
1.38% |
8.61% |
| Huizhou |
144.09% |
84.47% |
23.76% |
44.15% |
| Zhaoqing |
16.42% |
61.76% |
33.08% |
4.08% |
Table 11.
Driving Forces of Land Use Transitions on Carbon Emissions in the PRD from 2000 to 2020.
Table 11.
Driving Forces of Land Use Transitions on Carbon Emissions in the PRD from 2000 to 2020.
| Characteristics of Land Use Transition |
Indicator |
2000 |
2005 |
2010 |
2015 |
2020 |
Average |
| Explicit Characteristics |
Quantity of Construction land |
0.6368 |
0.8012 |
0.8653 |
0.8518 |
0.8427 |
0.7996 |
| Implicit Characteristics |
Land Use Input |
Per Unit Area Fixed Asset Investment |
0.4393 |
0.9157 |
0.8583 |
0.8449 |
0.5037 |
0.7124 |
| Per Unit Area Fiscal Expenditure |
0.4393 |
0.8548 |
0.825 |
0.8167 |
0.7754 |
0.7422 |
| Per Unit Area Employment Population |
0.8534 |
0.4989 |
0.3381 |
0.4654 |
0.3747 |
0.5061 |
| Land Use Output |
Per Unit Area GDP |
0.7193 |
0.8574 |
0.8183 |
0.8173 |
0.7756 |
0.7976 |
| Per Unit Area Industrial Added Value |
0.4633 |
0.8723 |
0.8257 |
0.7696 |
0.3799 |
0.6622 |
| Industrial Structure |
0.8014 |
0.4402 |
0.2497 |
0.1832 |
0.175 |
0.3699 |
| Land Use Intensity |
Per Unit Area Energy Consumption |
0.64 |
0.8574 |
0.8176 |
0.8139 |
0.6817 |
0.7621 |
| Human Activity Carrying Capacity |
0.3595 |
0.4009 |
0.6897 |
0.5279 |
0.8288 |
0.56136 |
| Changes in Land Rights |
Land Urbanization Rate |
0.5536 |
0.3919 |
0.6316 |
0.2995 |
0.4138 |
0.45808 |
Table 12.
CRI in the PRD from 2000 to 2020.
Table 12.
CRI in the PRD from 2000 to 2020.
| Cities |
2000 |
2005 |
2010 |
2015 |
2020 |
| Dongguan |
0.45 |
0.52 |
0.73 |
0.67 |
0.67 |
| Foshan |
0.61 |
0.63 |
0.59 |
0.53 |
0.55 |
| Guangzhou |
0.55 |
0.52 |
0.55 |
0.59 |
0.68 |
| Shenzhen |
0.68 |
0.69 |
0.78 |
0.77 |
0.79 |
| Zhongshan |
0.74 |
0.73 |
0.79 |
0.85 |
0.71 |
| Zhuhai |
0.76 |
0.73 |
0.63 |
0.62 |
0.67 |
| Huizhou |
0.4 |
0.38 |
0.32 |
0.36 |
0.35 |
| Jiangmen |
0.38 |
0.33 |
0.42 |
0.4 |
0.42 |
| Zhaoqing |
0.26 |
0.24 |
0.15 |
0.12 |
0.19 |
Table 13.
Optimization Pathways for Regional Policies in the PRD.
Table 13.
Optimization Pathways for Regional Policies in the PRD.
| Region |
Core Challenges |
Solutions |
Optimized Pathways |
|
Core Zone (Guangzhou, Shenzhen, Dongguan, and Foshan) |
Economic growth and carbon emissions create a growth-emission positive feedback loop. High adaptive capacity exposure risks occur. |
Preventing carbon lock-in effects and overcoming bottlenecks in stock land renewal. |
• Carbon-constrained land leasing: Use carbon intensity thresholds in land contracts. |
| • Tiered carbon taxation: Impose progressive taxes on enterprises with carbon intensity exceeding 200% of the regional average. |
| • Urban renewal with carbon sink offsets: Mandate developers to construct green spaces or invest in regional carbon sinks. |
Northwestern Ecological Zone
(Zhaoqing, Jiangmen)
|
High emission growth from relocated industries and lagging technological decoupling. Low adaptive capacity and carbon sink degradation. |
Synergy between environmental conservation and industrial transformation. |
• Cross-regional environmental compensation fund: Transfer payments based on core zones’ carbon sink utilization |
| • Low-carbon industrial zoning: Limit energy-intensive projects and promote agroforestry |
| • Forest carbon market integration: Create pilot project on tradable forestry credits |
|
Coastal Transition Belt (Zhaoqing, Jiangmen) |
Conflicts among cropland, water bodies, and construction land. Untapped potential of blue carbon restoration. |
Leveraging blue carbon and multifunctional land use. |
• Blue carbon reserves: Designate mangrove wetlands as carbon sinks. |
| • Salt-alkali land reclamation: Prioritize saline soil utilization over coastal encroachment. |
| • Aquavoltaic integration: Deploy floating photovoltaics in aquaculture ponds. |
Eastern Coordination Zone
(Huizhou) |
Rapid industrial land expansion, high environmental fragmentation, and high carbon intensity |
Promoting mountain-sea synergy and unlocking carbon sink potential. |
• Green hydrogen-coupled refining pilots: Replace fossil fuels with offshore wind-derived hydrogen. |
| • Ecological Industrialization: Promoting the Integration of Mountain-Sea Carbon Sink Synergy and Ecological Industrialization |
|
Disclaimer/Publisher’s Note: The statements, opinions and data contained in all publications are solely those of the individual author(s) and contributor(s) and not of MDPI and/or the editor(s). MDPI and/or the editor(s) disclaim responsibility for any injury to people or property resulting from any ideas, methods, instructions or products referred to in the content. |
© 2025 by the authors. Licensee MDPI, Basel, Switzerland. This article is an open access article distributed under the terms and conditions of the Creative Commons Attribution (CC BY) license (http://creativecommons.org/licenses/by/4.0/).