Submitted:
17 February 2025
Posted:
19 February 2025
You are already at the latest version
Abstract
Clustering algorithms or methods for GPS trajectories are in constant evolution due to the interest aroused in part of the scientific community. With the development of clustering algorithms considered traditional, improvements to these algorithms and even unique methods considered as “novelty” for science have emerged. This work aims to analyze the scientific production that exists around the topic “GPS trajectories clustering” by means of bibliometrics. Therefore, a total of 559 articles from the main collection of Scopus were analyzed, previously filtering the generated sample to discard any article that does not have a direct relationship with the topic to be analyzed. This analysis establishes an ideal environment for other disciplines and researchers, since it provides a current state of the trend of the subject of study in their field of research.
Keywords:
Trajectory clustering
; GPS trajectories
; Trajectory clustering algorithms
; Bibliometrics
; Bibliometry
1. Introduction
Vehicle trajectory analysis has become essential to address mobility problems in complex urban environments, where traffic and congestion present increasing challenges. The implementation of artificial intelligence and data mining in this field makes it possible to identify travel patterns from large volumes of data, facilitating the understanding of traffic flows and their relationship with road infrastructure [1,2]. This type of analysis supports traffic planners and managers in making data-driven decisions, helping to reduce congestion and optimize the use of road networks [3].
In addition, intelligent transportation systems, which employ advanced spatial analysis tools, enable real-time traffic monitoring, detecting critical points and assessing safety conditions in various areas of the city [4]. This constant monitoring enables a timely response to road infrastructure problems, while improving road safety and maintenance [5]. In turn, spatial data processing techniques have applications that go beyond transportation, providing value in areas such as massive data analysis and the study of consumer behavior, extending the impact of these advances to various sectors [6,7].
The analysis of scientific production in emerging areas, such as intelligent transportation systems and the study of vehicle trajectories, provides a better understanding of the trends and impact of these fields in science and technology. Bibliometric studies provide a valuable framework for observing how research in these topics has evolved, revealing patterns of collaboration, citations, and relevance that reflect their growing importance in the scientific community.
Bibliometric study is a discipline that has had an important growth within the scientific community in recent years. Eugene Garfield, with the establishment of the Institute for Scientific Information (ISI) in the 1960s, initiated the measurement of articles, journals, researchers, and institutions [8]. Bibliometric research examines authorship, publication, citations, and content by applying quantitative measures to a body (corpus) of literature [9]. Currently, scientific articles are stored and indexed in large scientific databases, allowing to measure the parameters they have, such as their keywords, numbers of citations, numbers of authors, author collaboration and impact, annual scientific production, among others. The main idea is that getting more citations in a scientific field indicates greater importance, quality and is more remarkable [10]. The reason for indexing articles is given by the following: authors cite other papers for their central idea, this is due to the connection they have with the central theme of their research or work. Since any author can select which article to cite, including only the most relevant and related to their article, most of the articles that are cited could demonstrate the impact or importance they have had within their scientific field. The information that can be obtained can be leveraged by various institutions, as valuable information on both individual and aggregate impact is given. Therefore, it could help in the recruitment of teachers or in devising research strategies in universities and research councils, however, bibliometric studies can also help with information about the history that has had a certain topic, in addition, to publicize the scope or trend that leads that research topic. This helps new researchers to have an idea of the impact that a research topic has on their scientific field [11]. This type of analysis is made possible through the availability of large bibliographic databases such as Scopus or Web of Science, among others. These indexing services are an important means for the evaluation process in academia.
Scopus is a bibliographic database that collects citations and abstracts from a wide variety of neutral sources. These resources are carefully selected by independent experts who are recognized leaders in their respective disciplinary fields. Scopus offers researchers a range of discovery and analysis tools. This platform not only facilitates the search and retrieval of relevant information, but also promotes collaboration and the exchange of ideas between individuals and institutions in the scientific community. With a broad scope, Scopus indexes content from more than 7000 publishers, covering a diversity of disciplines. In addition, it hosts a vast data collection, with more than 91 million records, including more than 94000 affiliation profiles and the contribution of more than 17 million authors.
From a macroscopic level, metrics can be determined that are common to many journals and are useful for different stakeholders. However, some characteristics change from one context or discipline to another. There are a number of researchers and journals that perform unevenly. In recent years there has been an expansion in the number of journals and an increase in the periods in which they are published, this may be thanks to the expansion of the academic sector in several countries, increasing gradually in the last decade in various countries. In addition, scientific disciplines have different parameters regarding the publication of an article. Therefore, it is important to study, their characteristics and/or equivalent topics, in order to provide a meaningful classification for bibliometric parameters.
The objective of this paper is to analyze the metadata of all articles indexed in the Scopus bibliographic database that perform “algorithms or methods for GPS trajectory clustering”. It is also noted that the samples generated by the bibliographic database were manually filtered to exclude all articles that are not part of the field of study. This article will provide useful information on the main journals that are interested in publishing articles on this particular topic, as well as the evolution of its scientific field over time. In addition, other aspects are discussed, such as the most cited authors, the areas in which these articles are most published, the number of publications per year, strategic diagrams on the impact of the topics, the thematic evolution, among others.
The bibliometric analysis is given graphically by the VOSviewer software which is a software tool to create maps based on network data, to visualize and explore these maps [12], including graphs of citations, sources and authors. In addition, use is made of the bibliometrix package and its graphical interface biblioshiny of the R programming language, which was developed by Aria and Cuccurullo [13] to perform the analysis about the graphical distribution of the corresponding author, the most cited articles, the main keywords, the main publication sources, the strategic diagrams of the keywords and the thematic evolution of the keywords. Both softwares are open source, which allows the researcher to use all their functionalities, such as the most cited article, co-authorship, among others.
The remainder of the paper is structured as follows. Section 2 describes the materials and methods used in the analysis methodology. Section 3 details the data under analysis, as well as the main findings of the study by means of bibliometrix and its graphical interface biblioshiny. In addition, the analysis by means of VOSviewer of the selected indicators is performed. Finally, section 4 extracts the main conclusions and explains the possible lines of research that can be derived from the analysis.
2. Materials and Methods
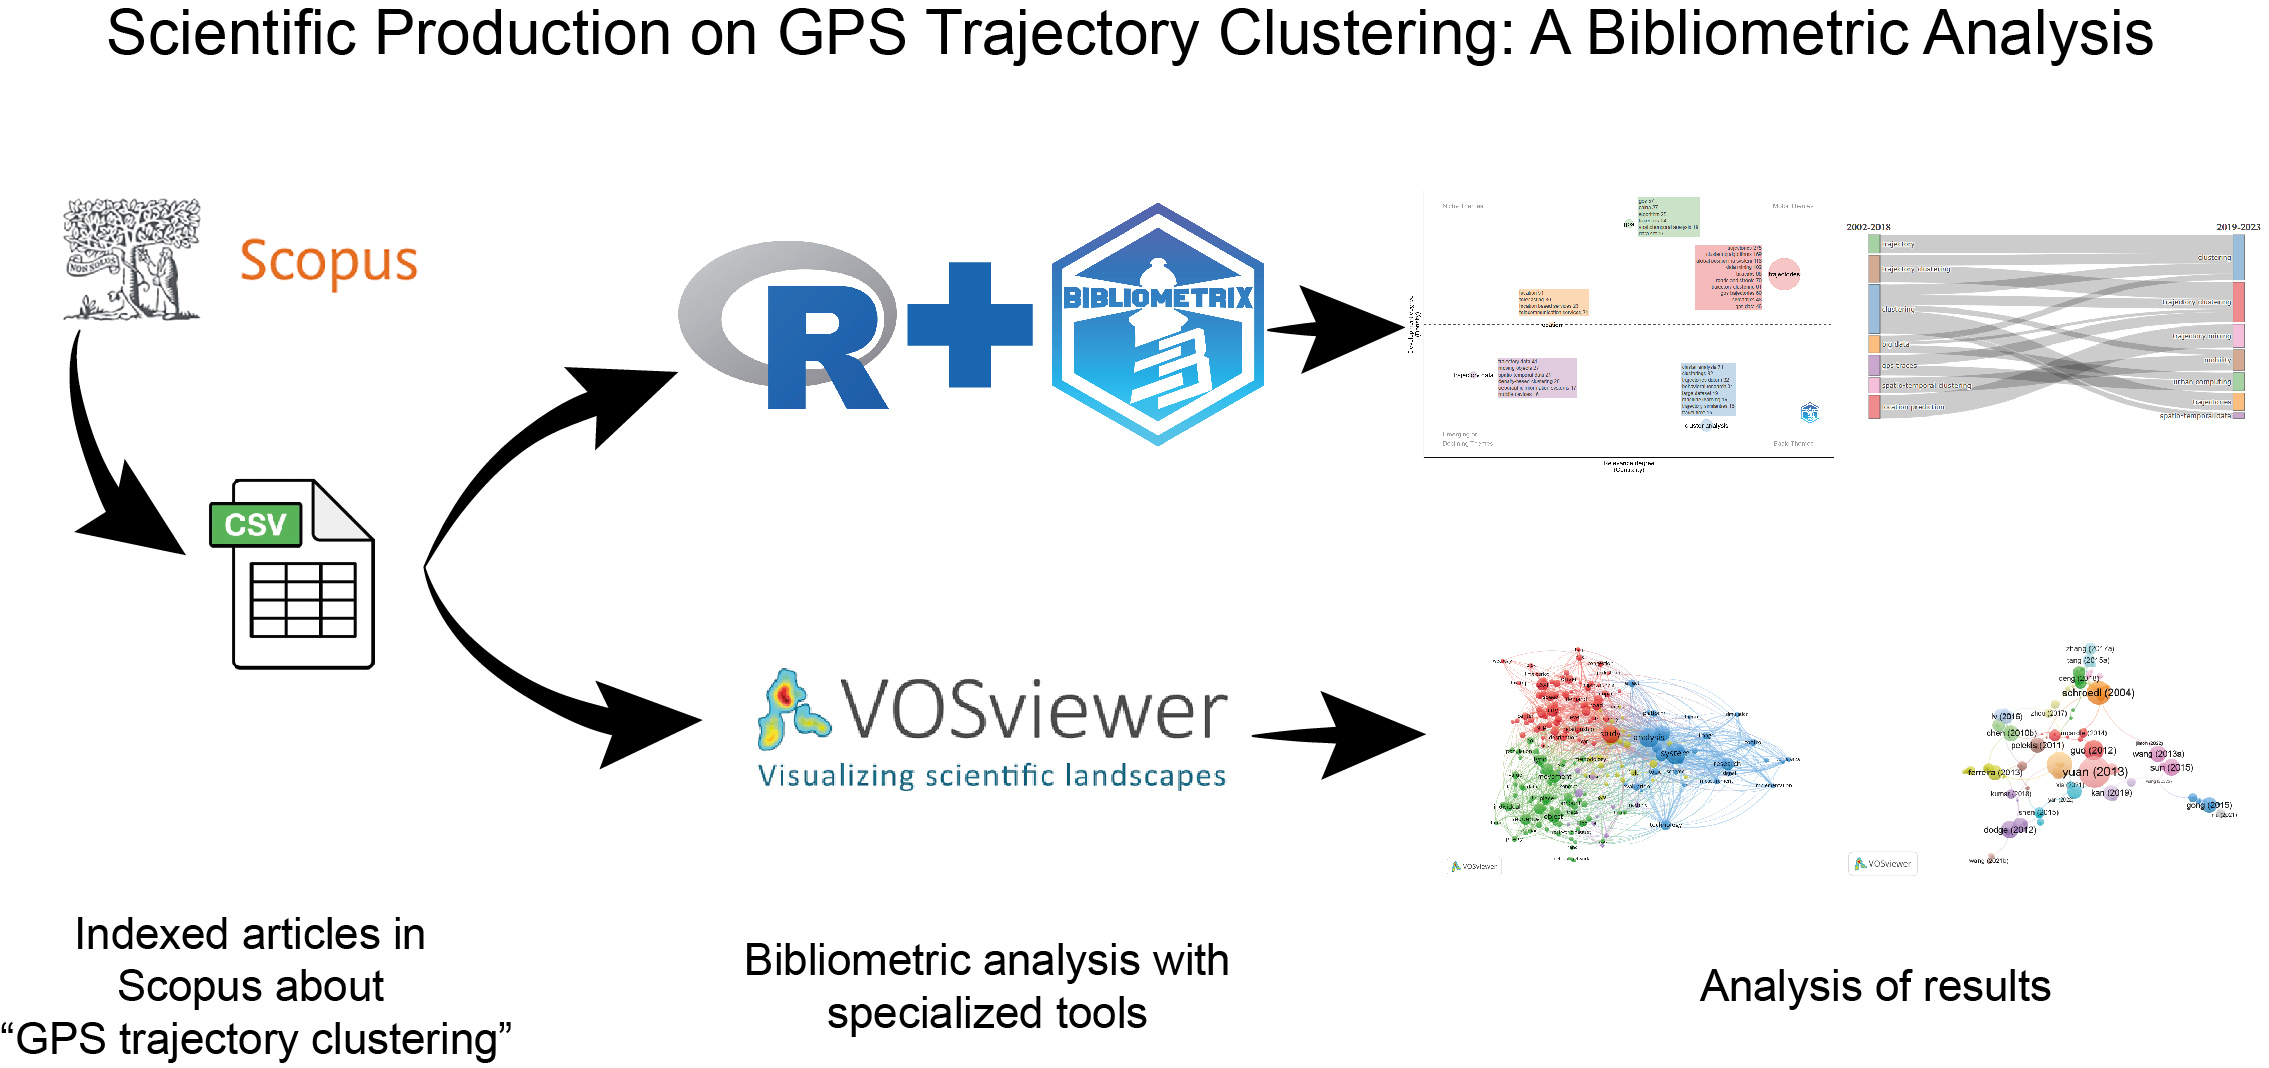
To analyze the scientific production in “GPS Trajectory Clustering”, a detailed methodological approach was developed that integrated bibliometric analysis and specialized data visualization tools. First, 559 articles were extracted from the Scopus database, selected through a rigorous filtering process that excluded those works without direct relevance to the research topic. The collection of these articles considered publications from 2002 to 2023 and covered papers that included both general analyses and specific developments in GPS trajectory clustering algorithms.
Visualization and analysis of bibliographic networks was performed using VOSviewer [12], a specialized tool that allows mapping networks of co-citation, author collaboration and thematic distribution. This software facilitated the creation of structural graphs showing the relationships between the most relevant articles, journals and authors in the field of study. Likewise, the analysis was complemented with the use of bibliometrix and its interface biblioshiny, developed in R language, which enabled the evaluation of keywords, thematic evolution and the identification of emerging trends. Both programs, freely available and open source, offer the advantage of replicability and allow other researchers to extend the application of this method to similar studies.
To quantify the concentration of variables, such as the distribution of authors, countries and research areas, Shannon entropy was used to evaluate the homogeneity of data dispersion. The values obtained were used to interpret the patterns of concentration in authorship and international collaborations, as well as the diversification of topics in the literature on GPS trajectories.
3. Results
We worked with the bibliographic metadata (bibliographic metadata) of the articles that are indexed in the bibliographic database Scopus. Therefore, only the articles that develop or investigate about the “GPS trajectories clustering” were selected. Scopus hosts a total of 559 sample papers, published in 333 sources (journals, books, etc), during the period 2002-2023. These papers were (co-) authored by 1416 individuals, the vast majority of papers are multi-authored, however, only 11 papers are single-authored. The average number of authors per document is 3.87. Upon analysis, it was observed that they were concentrated in two main research areas: Computer Science and Engineering. Scopus assigns indexed articles to one or more research areas. The 559 articles in the sample were assigned to various research areas, giving a total of 1094, i.e., they belong to more than one specific area. The five main research areas are shown in Table 1.
The detail of the annual publications of articles is shown in Table 2. In Scopus it is observed that the first years had the reception of few articles related to the “GPS trajectories clustering”, although in the last decade the number of articles published has been increasing, possibly due to the reception of the scientific community. The total number of records in the sample has an average annual growth rate of 15.6% from 2002 to 2023.
3.1. Geographical Distribution of the Corresponding Author
The Table 3 shows China as the top country whose authors have published the most papers, followed by the USA as the second country with the second most published papers. The top ten countries accumulate 53.9% of the published papers related to “GPS trajectory clustering”. The acronyms SCP, MCP and MCP Ratio correspond to “Single Country Publications”, “Multi-Country Publications” and “Proportion of Multi-Country Publications”. Table 4 shows the top countries, ordered by total number of citations. The average number of citations for all articles is 21.92. China and USA, the two countries with the most published articles and total citations, are above this figure, with an average of 19.30 and 34.60 respectively. Although China is the first country in terms of published articles, it has the second lowest average number of citations per article among the leading countries. It is also important to note that the USA is the country with the highest average number of citations per article, which can be used as a common denominator in the average scientific importance or quality of the articles. The countries that collaborate the least internationally with other countries are the Netherlands and Thailand with a publication rate of 0.0%. The country that collaborates most internationally with other countries is China, where 30.80% of the papers are of this type.
3.2. Main Publication Sources
Table 5 shows the top ten sources that publish articles related to “path clustering algorithms”. The top three are Lecture Notes in Computer Science (LNCS) (including its subseries Lecture Notes in Artificial Intelligence, LNAI and Lecture Notes in Bioinformatics, LNBI) is a series of conference proceedings that publishes the latest research advances in all areas of computer science. ISPRS International Journal of Geo-Information which is an international peer-reviewed open access journal on geo-information. IEEE Access which is a leading multidisciplinary open access journal. GIS: Proceedings of the ACM International Symposium On Advances In Geographic Information Systems are ACM SIGSPATIAL International Conferences on advances in interdisciplinary research in all aspects of geographic information systems. ACM International Conference Proceeding Series are a series of International Conference Proceedings (ICPS) that provide a mechanism for publishing the contents of high quality conferences, technical symposia, and workshops. The International Journal of Geographical Information Science is a peer-reviewed journal that publishes topics related to fundamental and computational geographic information science among others. Cluster Computing-The Journal of Networks Software Tools and Applications is a peer-reviewed scientific journal on parallel processing, distributed computing systems and computer communication networks. IEEE Transactions on Intelligent Transportation Systems is a journal that is published through IEEE Access, among the scope of the topics published are: communications (intervehicle and vehicle-to-road), computers (hardware, software), information systems (databases, data fusion, security), among others. International Archives Of The Photogrammetry, Remote Sensing And Spatial Information Sciences - Isprs Archives is a series of peer-reviewed proceedings published by the International Society for Photogrammetry and Remote Sensing (ISPRS). The scientific journal Jiaotong Yunshu Xitong Gongcheng Yu Xinxi/ Journal of Transportation Systems Engineering and Information Technology is included in the Scopus database, its main subject areas of published articles are Computer Science Applications, Systems and Control Engineering, Modeling and Simulation, and Transportation. And finally Transactions in GIS is an international peer-reviewed journal that publishes original research articles, review articles and short technical notes on the latest advances and best practices in spatial sciences.
3.3. Most Cited Articles
Table 6 shows the list of the top 10 papers categorized as a highly cited paper in Scopus. According to González-Betancor and Dorta-González [14] the most highly cited papers are those that have received a number of citations equal to or greater than the q percentile for their field and year of publication. A highly cited paper is recognized as possessing scientific excellence, setting the foundation for the field in which its context in the world is focused. Therefore, they serve to highlight important articles in different fields. These articles become avenues for research. The first most cited article is proposed by Yuan et al.[15] who designed a variance-entropy based clustering approach to estimate the distribution of travel time between two reference points in different time slots. Abul et al. [16] propose a novel concept of k-anonymity based on co-location that exploits the inherent uncertainty of the moving object’s whereabouts. Jing Yuan et al. [17] designed a variance-entropy based clustering approach to estimate the travel time distribution between two landmarks at different time intervals. Tang et al. [18] use an observed matrix of the central area in Harbin city to model traffic distribution patterns based on entropy maximization method, and the estimation performance verifies its effectiveness. Schroedl et al. [19] present an approach to induce high-accuracy maps from vehicle traces equipped with differential GPS receivers. Guo et al. [20] present new methodology for detecting the location of spatial patterns and structures embedded in origin-destination of motions. Abul et al. [21] address the problem of anonymization of moving object databases and propose a novel concept of co-location-based k-anonymization, which exploits the inherent uncertainty of the whereabouts of moving objects. Li et al. [22] propose an incremental clustering framework for trajectories that contains two parts, online microcluster maintenance and offline macrocluster creation. Chen et al. [23] propose a probabilistic framework for inferring trip purposes, it has one phase that identifies activity areas and computes probabilities using Bayes’ theorem, while the second phase clusters delivery points and matches activity areas for real-time responses. Finally, Monreale et al. [24] present a method that guarantees anonymity in trajectory data using a transformation based on spatial generalization and k-anonymity, providing formal data protection with a theoretical upper bound on reidentification.
Table 7 shows the most productive authors. The table was made from a manual search, since bibliometrix, when analyzing the parameter of the authors, is unable to differentiate between one or another author who has the same surname with the same initial of his name, therefore, the following results were obtained. In first place are Wang Haoyu and Li Jinhong with 7 published articles respectively, followed by Xu Hao and Liu Xintao with 6 articles, finally Li Yanhua with 4 published articles.
3.4. Main Keywords
Table 8 shows the ten most frequently used keywords in GPS trajectory clustering articles. Scopus provides two types of keywords: (a) Author Keywords, which are those provided by the original authors, and (b) Keywords-Plus, which are those extracted from the titles of cited references. Keyword-Plus are automatically generated by a computer algorithm. The two most frequent author keywords are “clustering” and “trajectory”. The Keywords-Plus in their first places contain the words “trajectories” and “clustering algorithms”, present in articles published by Reyes et al. [25]. It is observed that at least four of the main Keywords in both types coincide, possibly because they encompass everything that has to do with trajectories and GPS data, in addition, they are used in the process of data mining.
3.5. Keyword Strategy Diagram
In the strategic diagram, it is possible to see which topics are emerging, are trending, are within or have disappeared from a field of research by analyzing the keywords. When joint word analysis is used to map science, clusters of keywords (and their interconnections) are obtained. These clusters are considered themes. Each research topic obtained in this process is characterized by two parameters “density” and “centrality” [26]. The bibliometrix package through its biblioshiny interface allows the creation of the thematic map or strategic diagram of keywords, titles and abstracts. Given the interpretation of the strategic diagram of Cobo et al. [26], the diagram provided by bibliometrix is analyzed as follows:
- The topics in the upper right quadrant are well developed and are important for the structuring of a research field. They are known as the driving themes of the specialty, since they have a strong centrality and high density. The location of the topics in this quadrant implies that they are externally related to concepts applicable to other topics that are closely related conceptually.
- Topics in the upper left quadrant have well-developed internal linkages, but unimportant external linkages and are therefore of marginal importance to the field. These topics are highly specialized and peripheral in nature.
- Themes in the lower left quadrant are underdeveloped and marginal. The themes in this quadrant have low density and low centrality, representing mainly emerging or missing themes.
- The topics in the lower right quadrant are important for a research field, but are not developed. So, this quadrant groups basic cross-cutting and general topics.
Figure 1 and Figure 2 show the strategic diagrams pertaining to the KeyWords Plus and Scopus author keywords. For Figure 1 the KeyWords Plus are shown, its upper right quadrant contains the topics “trajectories” and part of the topic “gps” considered as a group of well developed and important subtopics for the research field of “algorithms or methods for GPS trajectory clustering”. Its upper left quadrant partially contains the topics “gps” and “location”, i.e., they contain well-developed subtopics, although they are not of importance to the research field. Its lower left quadrant contains the keyword “trajectory data” and the other half of the theme “gps” within these themes are subthemes that are underdeveloped, not taken into account, emerging or missing. Finally, the lower right quadrant has the “cluster analysis” theme, i.e., it contains important sub-themes, although they are not fully developed.
For Figure 2 author keywords are shown, its upper right quadrant contains part of the theme “mobility” considered as a group of well developed and important subthemes for the research field of “algorithms or methods for GPS trajectory clustering”. Its upper left quadrant has the “vehicle trajectory” theme and partially the “mobility” and “urban computing” themes, i.e., they contain well-developed sub-themes, although they are not of importance to the research field. Its lower left quadrant contains the other half of the “urban computing” theme, within this theme are sub-themes that are underdeveloped, not taken into account, emerging or missing. Finally, its lower right quadrant contains the “trajectory cluster” and “clustering” themes, i.e., they contain important sub-themes, although they are not fully developed.
3.6. Thematic Evolution of Keywords
For the thematic analysis of the evolution of the keywords, the R package bibliometrix with its graphical interface biblioshiny was used, in which a range of years was established to observe the changes that exist between one thematic or another. Figure 3 and Figure 4 show the thematic evolution of the author’s keyWord Plus and keywords, from the beginning of the studies in the research field to the present. In Figure 3 the theme trajectories is maintained, although it is integrated with some of the subthemes that belonged to data location, cab cabs and trajectory data. This forms a new group, however, the clustering theme prevails possibly because it maintains in its entirety the subthemes that were present from 2002 to 2018. The themes “location”, “taxi cabs” and “trajectory data” also became new themes that maintain certain subthemes of the themes that existed before 2018. However, it is noted that “gps” has undergone minor changes in the subtopics that have been presented up to the present time.
In Figure 4, the clustering theme has now been integrated with some of the sub-themes that belonged to trajectory, trajectory clustering and big data. Likewise, the trajectory clustering theme is maintained, although some of its sub-themes became part of the clustering theme. Other topics, such as trajectory mining, are made up entirely of the subtopics that before 2018 belonged to the location prediction topic. At present, topics such as mobility, trajectories and spacio-temporal data have emerged whose subtopics have been derived from the clustering topic. Finally, it is observed that none of the current themes have retained the subthemes in their entirety.
3.7. Degree of Concentration of Selected Variables
In this subsection, some bibliometric variables are analyzed in order to show the degree to which they are concentrated. According to Stuart [27] bibliometric studies can be broadly classified as relational or evaluative, either providing information on the relationship between units of analysis or assisting in the evaluation of units of analysis. To perform this type of analysis, use is made of the information theory proposed by Shannon [28], this theory provides different metrics that allow information to be obtained, such as standard deviation, skewness or kurtosis. He also developed his own metric called the Shannon entropy, which by means of a discrete probability distribution with the Shannon entropy is defined as:
Shannon entropy can be interpreted or used in many ways in other scientific fields. Mejia-Barron et al. [29] make use of Shannon Entropy and a fuzzy logic system to diagnose short-circuit faults, in another article Babichev et al. [30] present gene expression profile reduction technology based on complex use of fuzzy logic methods, statistical criteria and Shannon entropy. On the other hand, Savakar and Hiremath [31] discusses about the detection of falsification of an image using Shannon Entropy and similarity and dissimilarity measures. Finally, it is used in bibliometric studies in order to study the equity/concentration distribution of different important variables such as research topics, authors, among others [32]. For a better interpretation of the information, use is made of Shannon’s Entropy in its normalized form, dividing it by its maximum value. Therefore, the normalized concentration index is defined as follows:
Under the condition of , where means that all categories are uniformly represented, i.e., there is no concentration, and means that the distribution is concentrated at a single point. The normalized entropic concentration index was calculated for the distribution of authors, sources, countries, research areas and citations. The results are shown in Table 9. Where it is observed that the authors are evenly distributed. The sources are also evenly distributed, as shown in Table 5. The countries publishing articles related to the topic of study are highly concentrated in a few countries as shown in Table 3. However, taking into account the value of the index of authors and countries shows that the distribution of authors within these countries is evenly distributed. Similarly, in the research areas, a moderately low concentration was detected, as can be seen in Table 1, where 74.5% of publications are distributed among the areas of computer science, engineering, social sciences and mathematics. Finally, the most cited articles are moderately concentrated as can be seen in Table 6.
An alternative measure to observe the distribution that authors follow according to their productivity is Lokta’s law. According to the empirical finding made by Lotka [33], Lokta’s law follows a form of Zipf’s law. The original finding was based on a data base restricted to physics and chemistry. Its equation based on this restriction is defined below:
Where is the number of authors publishing n articles and is the number of authors publishing a single article. Lotka [33] derived his empirical law from a very specific sample, however, for a generalization of his equation could be:
where c is a parameter to be estimated to best fit the distribution data. The value of , with an . Table 10 summarizes the actual and fitted distribution of the number of authors publishing n articles. It is observed that the actual number of authors publishing only 1 article is lower than predicted by Lokta’s law confirming that authorship is not more widely and evenly distributed.
3.8. Charts of Citations, Sources and Authors
The following figures were generated using the VOSviewer software tool that allows the creation of network-based maps, allowing visualization and exploration. Developed by Van Eck and Waltman [12] it allows us to count the words that appear in the title, abstract and keywords, obtaining the relationships that appear in the different documents that are published. Figure 5 represents the cloud map with the words that are relevant in the articles. The map shows how many times the words appear in the articles and how much of a relationship exists between them. The map is divided into groups, the blue part has a concentration of the word system, which in turn is related to the words analysis, research, technology and evaluation. In the red part there are words that are related to urban planning or urbanism, among its words are study, cab, road, demand, congestion. In the green, yellow and purple part allude to concepts associated with the movement of objects and their different applications. The words study, city, analysis, system and movement stand out because they create the links between the whole set of words, this has allowed the detection of new perspectives of analysis towards emerging applications such as the one proposed by por Reyes et al. [34].
Figure 6 is a representation almost similar to Figure 5, with the difference that words are counted binary. This means that when a word appears, VOSviewer will only count it once regardless of the number of times it appears in the document. This slight difference can change the results that were obtained with the previous graphs, because if a word is repeated a lot it does not enter in the count of the final result. In the cloud map it can be seen that the yellow part of Figure 6 have been merged with the words that had to do with classification, topic, strategy and networks, being the main difference between Figure 5 and Figure 6. However, the red part is still present with words that allude to concepts associated with urban planning and its different applications, also the blue and green part is maintained with topics closely related to the management and efficiency of problems derived from urban planning.
Figure 7 shows the cloud map of the article sources. The map differentiates the journals, which reference Table 5 each of the sources publishes articles related to algorithms or methods of trajectory clustering, GPS trajectory clustering, urbanism, planning, traffic, among others.
Figure 8 shows all the articles that belong to the sample and the size of the node that is created depends on the number of citations they have. This result can be seen in Table 6 of the most cited articles subsection. In Figure 8 it can be seen that the two nodes that stand out the most are Jing Yuan et al. [17] published in IEEE Xplore with the design of a variance-entropy based clustering approach for estimation in the distribution of travel times between two different points, and Schroedl et al. [19] published in Data Mining and Knowledge Discovery that present an approach to induce high-precision maps from vehicle traces equipped with differential GPS receivers.
4. Conclusions
This analysis shows that clustering for GPS trajectories comprises a combination of urban planning and the effects that vehicles have on streets, roads or carts. It should be noted that this would not be possible without Global Positioning Systems or GPS. In addition to the integration of correct trajectory clustering algorithms such as TraClus, Kmeans, Tra-Dbscan and others. This article is a significant contribution to the bibliometric analysis of clustering algorithms or methods for GPS trajectories, which includes 559 articles published in Web of Science, these records allowed finding significant results, both in the relationships between keywords, authors, citations, among others. It was detected that there are important articles that are not found in Scopus, for example, Time-focused clustering of trajectories of moving objects by Nanni and Pedreschi [35], considered in other bibliographic sources as a highly cited article. Table 9 shows a high concentration of authors from China, although the diversity of countries does predominate. In addition, it can be seen in Figure 8 that the citations between articles are closely related, possibly indicating that the topic of study is consolidating.
Although there are a wide variety of clustering algorithms for trajectories, there are very few literature or literature reviews about how they work or what fields of research they can target, the only one that deals limitedly is Yuan et al. [36] with his analysis of clustering algorithms for trajectories, however, he adapts it to a general context of the topic of study. According to the bibliometric review, the study of GPS data obtained from vehicles can help solve both road and urban problems, therefore, in this line there is still a lack of studies that provide starting guidelines for new researchers who wish to enter the field of GPS trajectory clustering, for example, to identify which roads, air or sea spaces are the most suitable for the rapid mobility of multimodal means of transport, planning the routes of modern urbanizations or those under construction to reduce vehicular traffic, analyzing which patterns cause traffic accidents in order to try to avoid them, determining which routes are the most feasible for autonomous vehicles to circulate, establishing safe roads, streets or highways for people using a different means of transportation such as bicycles, scooters, skateboards, among others. Finally, one can also incur in the review of trajectory clustering algorithms focused on another area, both in the analysis of mobility or migration of animals, people, trajectories of robots, unmanned aerial vehicles, hurricane trajectory analysis among others. In relation to this aspect, there are almost no papers indicating the trend of clustering algorithms or methods for GPS trajectories in this field of research.
Author Contributions
Conceptualization, G.R.; methodology, G.R.; validation, L.L and C.E.; formal analysis, L.L and C.E.; investigation, G.R.; data curation, G.R.; supervision, R.T. and A.B. All authors have read and agreed to the published version of the manuscript.
Funding
This research received no external funding.
Conflicts of Interest
The authors declare no conflicts of interest.
References
- Reyes, G.; Crespo, C.; León-Granizo, O.; Bazán, W.; Horta, R. Propuesta de método de extracción de ubicaciones georreferenciales de una red de carreteras para el análisis de trayectorias GPS. Investigación, Tecnología e Innovación 2022, 14, 1–15. [Google Scholar] [CrossRef]
- Reyes, G.; Lanzarini, L.C.; Estrebou, C.A.; Maquilón, V. Vehicular Flow Analysis Using Clusters. In Proceedings of the XXVII Congreso Argentino de Ciencias de La Computación (CACIC), Virtual, 4–8 October 2021. [Google Scholar]
- Moreira, J.S.; León, C.C.; Zambrano, G.R.; Joel, C.M.J. Parámetros que influyen en el congestionamiento vehicular [Parameters influencing in the vehicular overcrowding]. International Journal of Innovation and Applied Studies 2018, 24, 1440–1455. [Google Scholar]
- Reyes, G.; Vera, L. Reference Architecture for an Intelligent Transportation System. International Journal of Innovation and Applied Studies 2016, 15, 2028–9324. [Google Scholar]
- Reyes, G.; Lanzarini, L.; Estrebou, C.; Fernandez Bariviera, A. Dynamic Grouping of Vehicle Trajectories. Journal of Computer Science and Technology 2022, 22, e11. [Google Scholar] [CrossRef]
- Lanzarini, L.C.; Hasperué, W.; Villa Monte, A.; Jimbo Santana, P.; Reyes Zambrano, G.; Corvi, J.P.; Fernández Bariviera, A.; Olivas Varela, J.Á. Minería de Datos, Minería de Textos y Big Data. In Proceedings of the XXI Workshop de Investigadores En Ciencias de La Computación (WICC 2019), San Juan, Argentina, 25-26 April 2019. [Google Scholar]
- Zambrano, G.R.; Banchón, J.M. Computación afectiva y análisis del comportamiento del consumidor [Affective computing and analysis of consumer behavior]. International Journal of Innovation and Applied Studies 2017, 20. [Google Scholar]
- Merediz-Solà, I.; Bariviera, A.F. A Bibliometric Analysis of Bitcoin Scientific Production. Research in International Business and Finance 2019, 50, 294–305. [Google Scholar] [CrossRef]
- Haddow, G. Bibliometric Research. In Research Methods, 2nd ed.; Elsevier: Amsterdam, The Netherlands, 2018; pp. 241–266. [Google Scholar] [CrossRef]
- Dede, E.; Ozdemir, E. Mapping and Performance Evaluation of Mathematics Education Research in Turkey: A Bibliometric Analysis from 2005 to 2021. Journal of Pedagogical Research 2022, 4. [Google Scholar] [CrossRef]
- Singh, N.; Gupta, A.; Kapur, B. A Bibliometric Analysis of IJQRM Journal (2002–2022). International Journal of Quality & Reliability Management 2023, 40, 1647–1666. [Google Scholar] [CrossRef]
- Van Eck, N.J.; Waltman, L. Software Survey: VOSviewer, a Computer Program for Bibliometric Mapping. Scientometrics 2010, 84, 523–538. [Google Scholar] [CrossRef]
- Aria, M.; Cuccurullo, C. Bibliometrix : An R-tool for Comprehensive Science Mapping Analysis. Journal of Informetrics 2017, 11, 959–975. [Google Scholar] [CrossRef]
- González-Betancor, S.M.; Dorta-González, P. Porcentaje de Artículos Altamente Citados: Una Medida Comparable Del Impacto de Revistas Entre Campos Científicos. Revista española de Documentación Científica 2015, 38, e092. [Google Scholar] [CrossRef]
- Yuan, J.; Zheng, Y.; Zhang, C.; Xie, W.; Xie, X.; Sun, G.; Huang, Y. T-Drive: Driving Directions Based on Taxi Trajectories. In Proceedings of the 18th SIGSPATIAL International Conference on Advances in Geographic Information Systems, San Jose, CA, 2–5 November 2010; pp. 99–108. [Google Scholar] [CrossRef]
- Abul, O.; Bonchi, F.; Nanni, M. Never Walk Alone: Uncertainty for Anonymity in Moving Objects Databases. In Proceedings of the 2008 IEEE 24th International Conference on Data Engineering, Cancun, Mexico, 7–12 April 2008; pp. 376–385. [Google Scholar] [CrossRef]
- Yuan, J.; Zheng, Y.; Xie, X.; Sun, G. T-Drive: Enhancing Driving Directions with Taxi Drivers’ Intelligence. IEEE Transactions on Knowledge and Data Engineering 2013, 25, 220–232. [Google Scholar] [CrossRef]
- Tang, J.; Liu, F.; Wang, Y.; Wang, H. Uncovering Urban Human Mobility from Large Scale Taxi GPS Data. Physica A: Statistical Mechanics and its Applications 2015, 438, 140–153. [Google Scholar] [CrossRef]
- Schroedl, S.; Wagstaff, K.; Rogers, S.; Langley, P.; Wilson, C. Mining GPS Traces for Map Refinement. Data Mining and Knowledge Discovery 2004, 9, 59–87. [Google Scholar] [CrossRef]
- Guo, D.; Zhu, X.; Jin, H.; Gao, P.; Andris, C. Discovering Spatial Patterns in Origin-Destination Mobility Data. Transactions in GIS 2012, 16, 411–429. [Google Scholar] [CrossRef]
- Abul, O.; Bonchi, F.; Nanni, M. Anonymization of Moving Objects Databases by Clustering and Perturbation. Information Systems 2010, 35, 884–910. [Google Scholar] [CrossRef]
- Li, Z.; Lee, J.G.; Li, X.; Han, J. Incremental Clustering for Trajectories. In Database Systems for Advanced Applications; Springer: Berlin/Heidelberg, 2010; Volume 5982, pp. 32–46. [Google Scholar] [CrossRef]
- Chen, C.; Jiao, S.; Zhang, S.; Liu, W.; Feng, L.; Wang, Y. TripImputor: Real-Time Imputing Taxi Trip Purpose Leveraging Multi-Sourced Urban Data. IEEE Transactions on Intelligent Transportation Systems 2018, 19, 3292–3304. [Google Scholar] [CrossRef]
- Monreale, A.; Andrienko, G.; Andrienko, N.; Giannotti, F.; Pedreschi, D.; Rinzivillo, S.; Wrobel, S. Movement Data Anonymity through Generalization. Transactions on Data Privacy 2010, 3, 91–121. [Google Scholar]
- Reyes, G.; Estrada, V.; Tolozano-Benites, R.; Maquilón, V. Batch Simplification Algorithm for Trajectories over Road Networks. ISPRS International Journal of Geo-Information 2023, 12, 399. [Google Scholar] [CrossRef]
- Cobo, M.; López-Herrera, A.; Herrera-Viedma, E.; Herrera, F. An Approach for Detecting, Quantifying, and Visualizing the Evolution of a Research Field: A Practical Application to the Fuzzy Sets Theory Field. Journal of Informetrics 2011, 5, 146–166. [Google Scholar] [CrossRef]
- Stuart, D. Open Bibliometrics and Undiscovered Public Knowledge. Online Information Review 2018, 42, 412–418. [Google Scholar] [CrossRef]
- Shannon, C.E. A Mathematical Theory of Communication. Bell System Technical Journal 1948, 27, 379–423. [Google Scholar] [CrossRef]
- Mejia-Barron, A.; De Santiago-Perez, J.; Granados-Lieberman, D.; Amezquita-Sanchez, J.; Valtierra-Rodriguez, M. Shannon Entropy Index and a Fuzzy Logic System for the Assessment of Stator Winding Short-Circuit Faults in Induction Motors. Electronics 2019, 8, 90. [Google Scholar] [CrossRef]
- Babichev, S.; Barilla, J.; Fišer, J.; Škvor, J. A Hybrid Model of Gene Expression Profiles Reducing Based on the Complex Use of Fuzzy Inference System and Clustering Quality Criteria. In Proceedings of the 2019 Conference of the International Fuzzy Systems Association and the European Society for Fuzzy Logic and Technology (EUSFLAT 2019), Prague, Czech Republic, 9–13 September 2019. [Google Scholar] [CrossRef]
- Savakar, D.G.; Hiremath, R. Copy-Move Image Forgery Detection Using Shannon Entropy. In Applied Computer Vision and Image Processing; Springer: Singapore, 2020; Volume 1155, pp. 76–90. [Google Scholar] [CrossRef]
- Polyakov, M.; Polyakov, S.; Iftekhar, M.S. Does Academic Collaboration Equally Benefit Impact of Research across Topics? The Case of Agricultural, Resource, Environmental and Ecological Economics. Scientometrics 2017, 113, 1385–1405. [Google Scholar] [CrossRef]
- Lotka, A.J. The Frequency Distribution of Scientific Productivity. Journal of Washington Academy Sciences 1926, 16, 317–323. [Google Scholar]
- Reyes, G.; Lanzarini, L.; Hasperué, W.; Bariviera, A.F. Proposal for a Pivot-Based Vehicle Trajectory Clustering Method. Transportation Research Record 2022, 2676, 281–295. [Google Scholar] [CrossRef]
- Nanni, M.; Pedreschi, D. Time-Focused Clustering of Trajectories of Moving Objects. Journal of Intelligent Information Systems 2006, 27, 267–289. [Google Scholar] [CrossRef]
- Yuan, G.; Sun, P.; Zhao, J.; Li, D.; Wang, C. A Review of Moving Object Trajectory Clustering Algorithms. Artificial Intelligence Review 2017, 47, 123–144. [Google Scholar] [CrossRef]
Figure 1.
Strategic diagram of the KeyWords Plus, generated with bibliometrix. Source: Scopus.
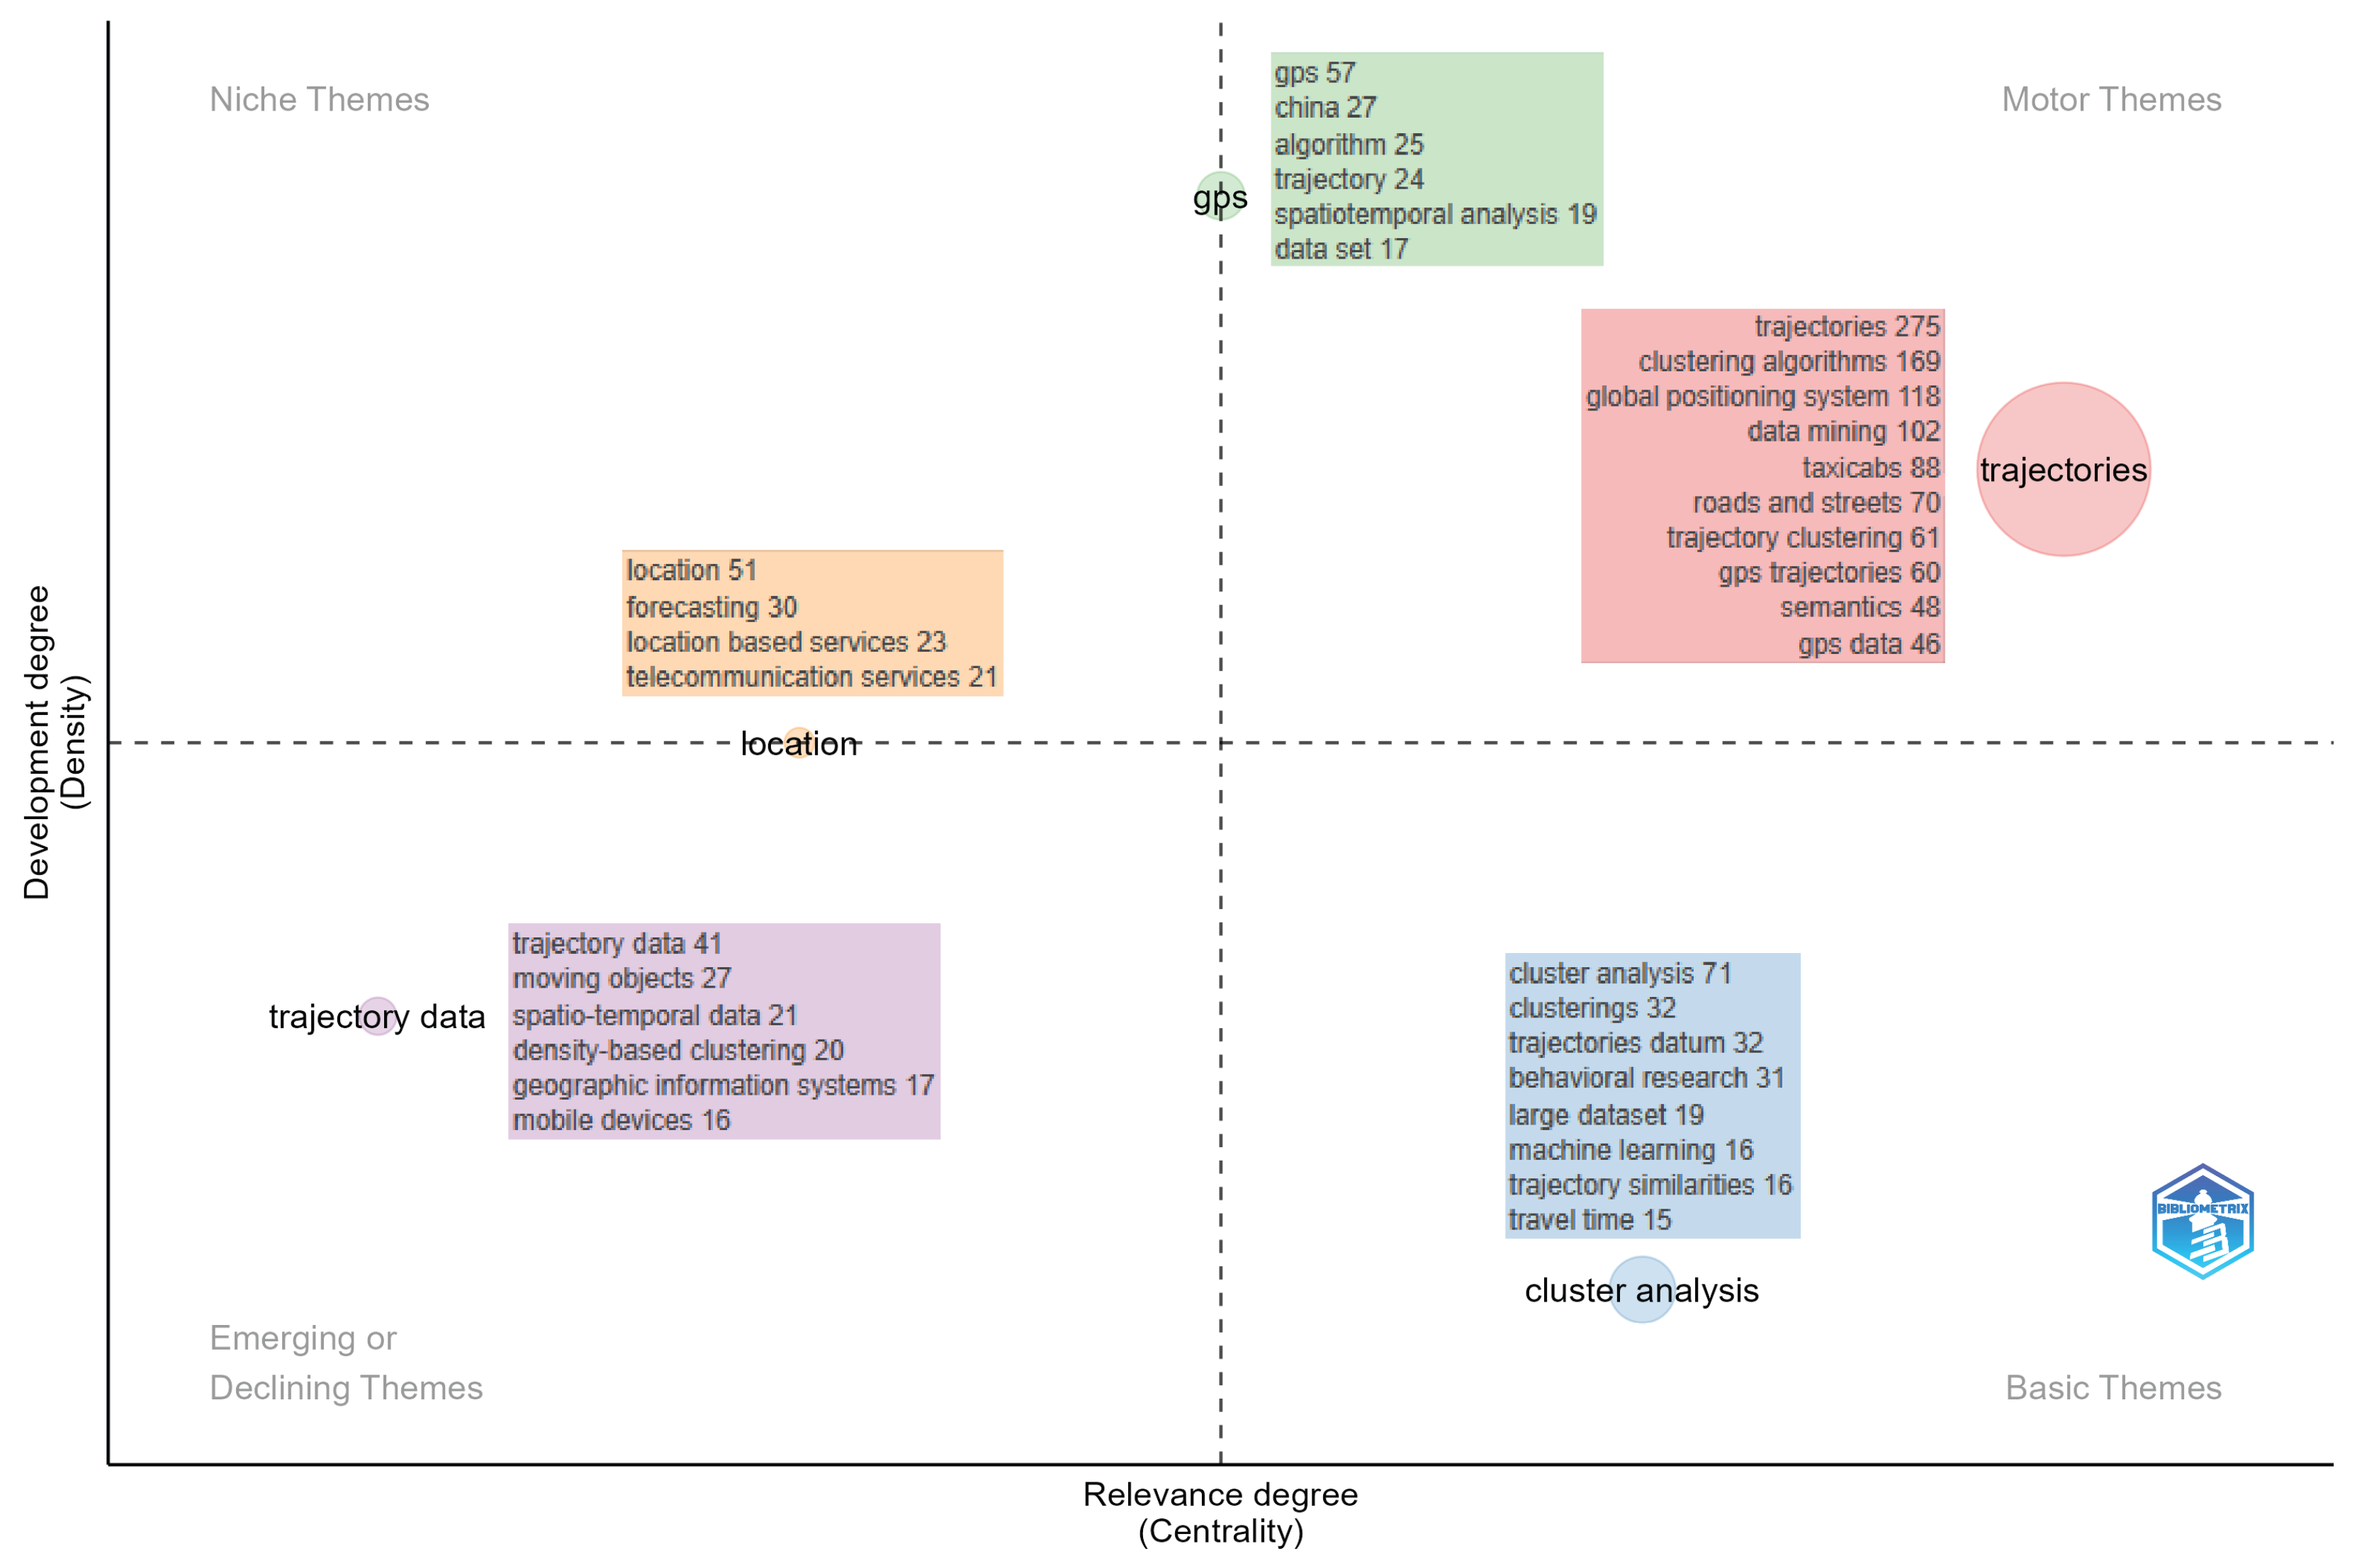
Figure 2.
Strategic diagram of the author’s keywords, generated with bibliometrix. Source: Scopus.
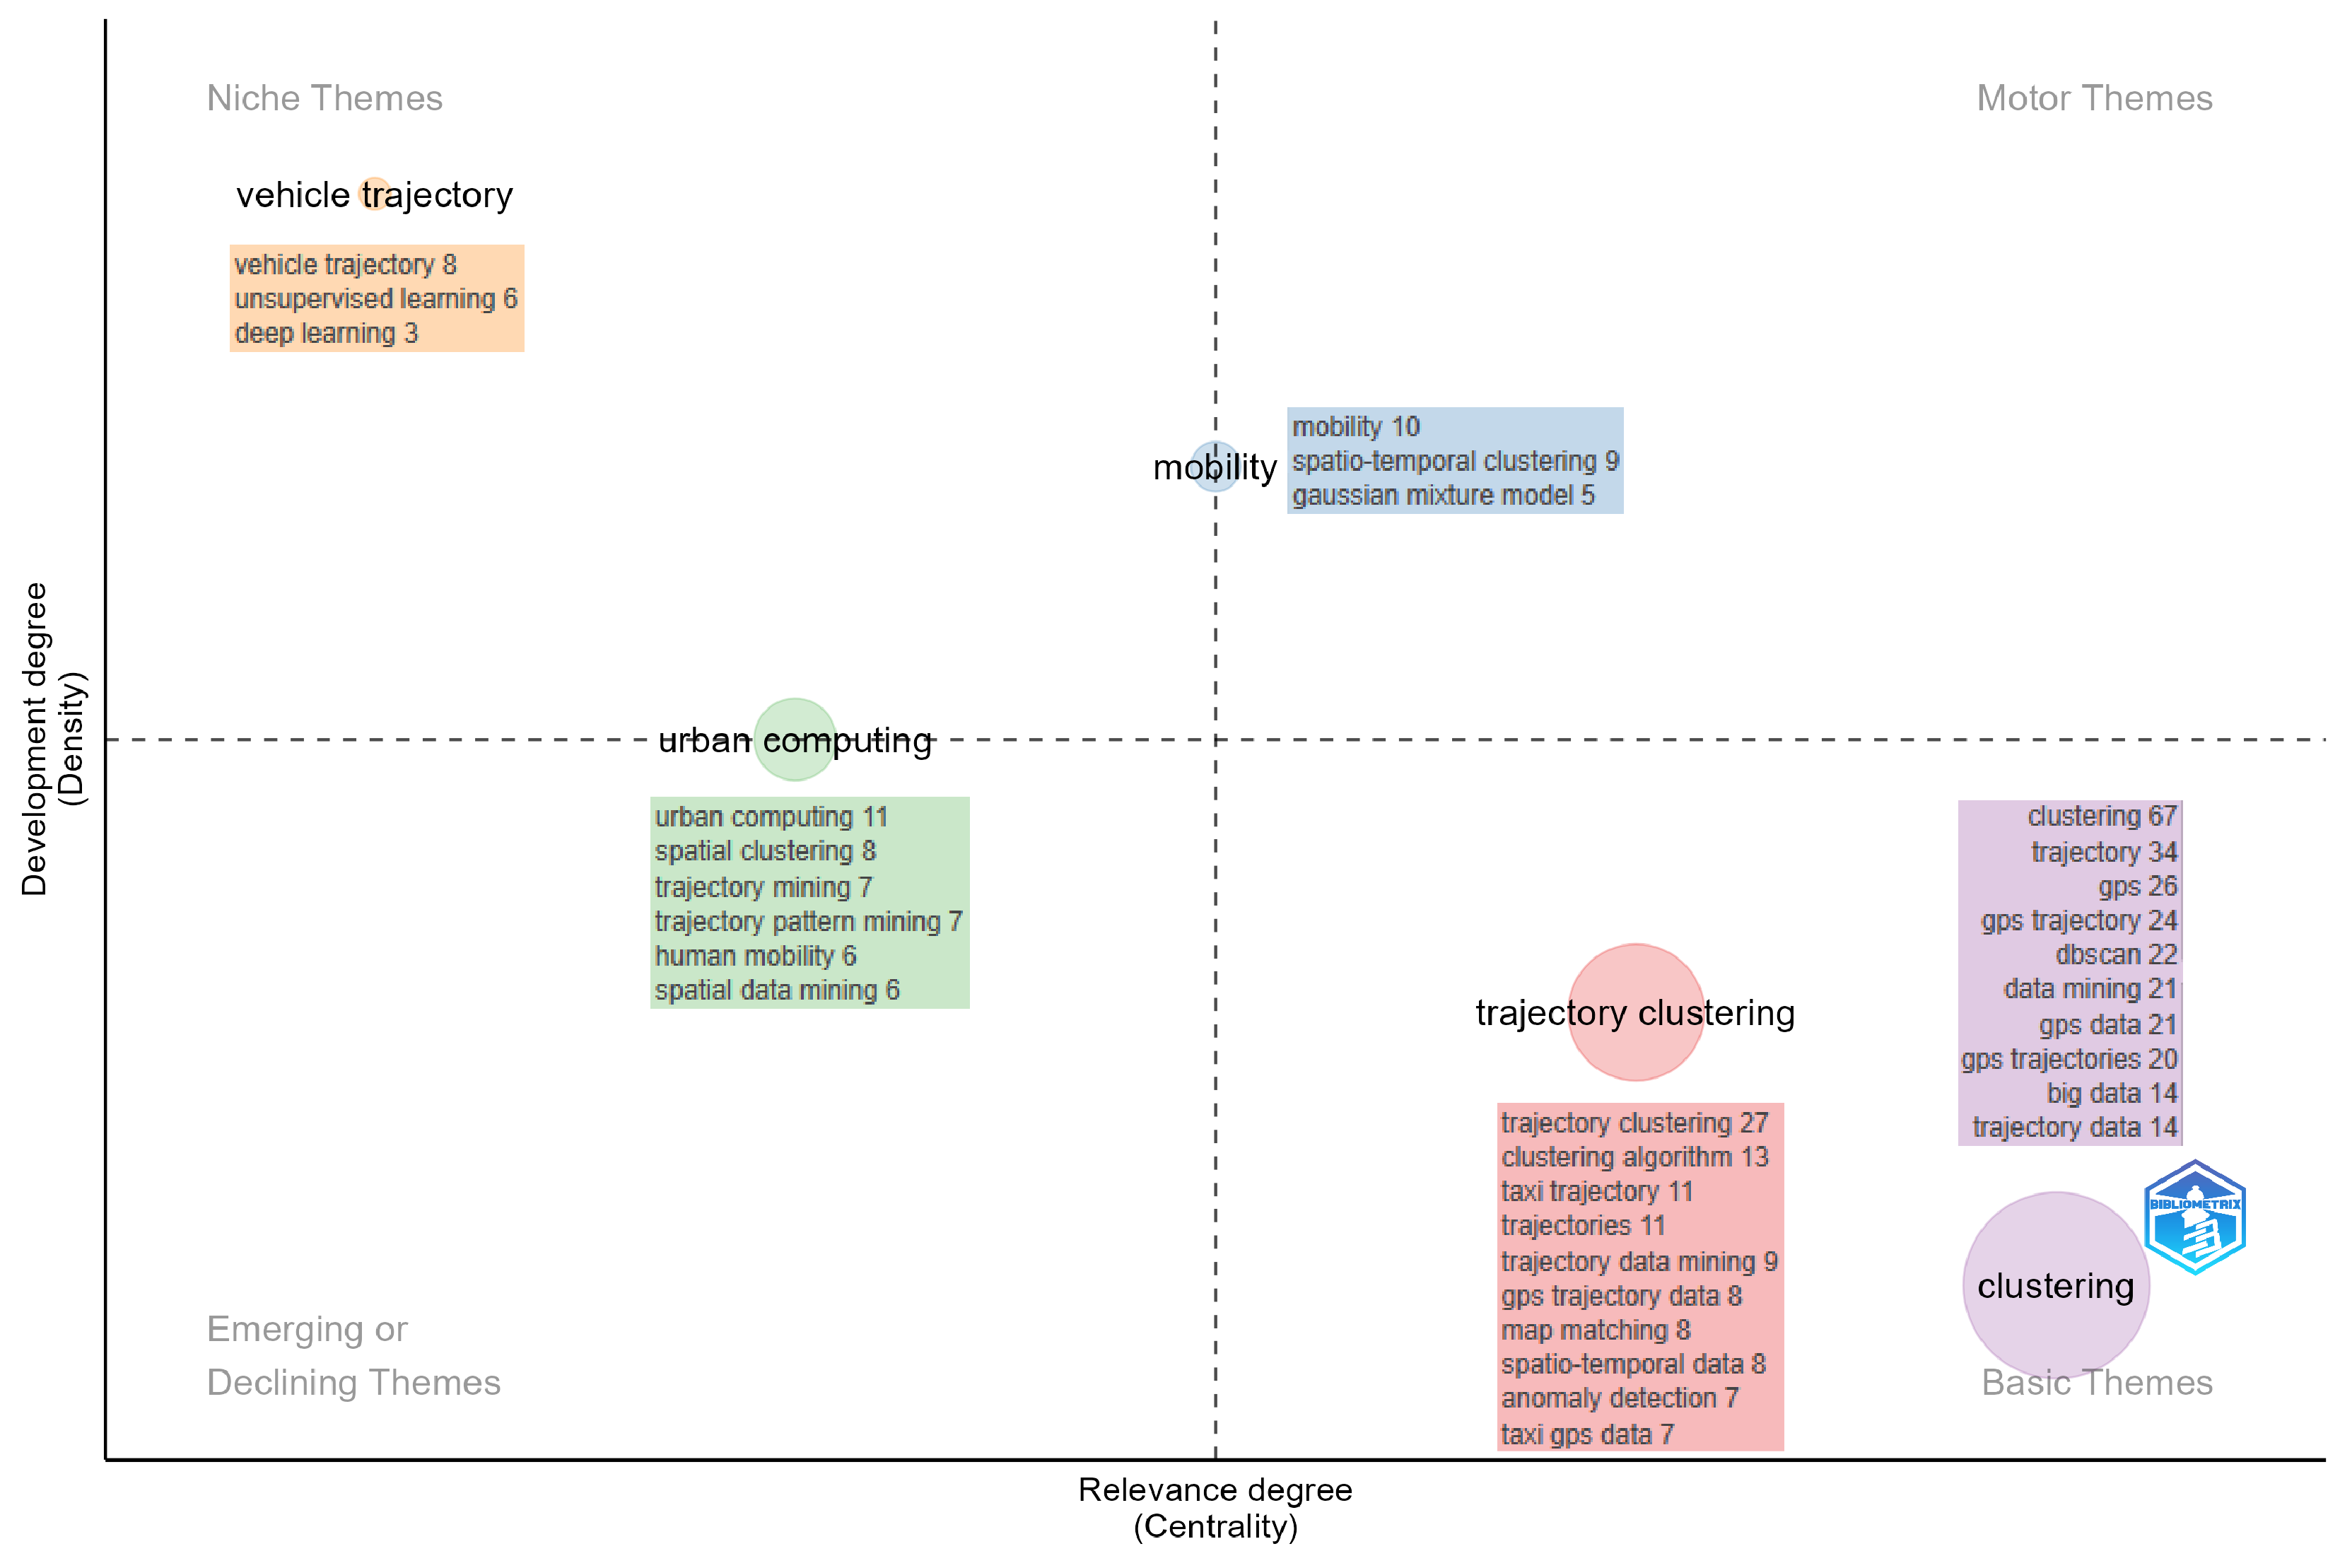
Figure 3.
Strategic diagram of the author’s keywords Plus, generated with bibliometrix. Source: Scopus.
Figure 3.
Strategic diagram of the author’s keywords Plus, generated with bibliometrix. Source: Scopus.
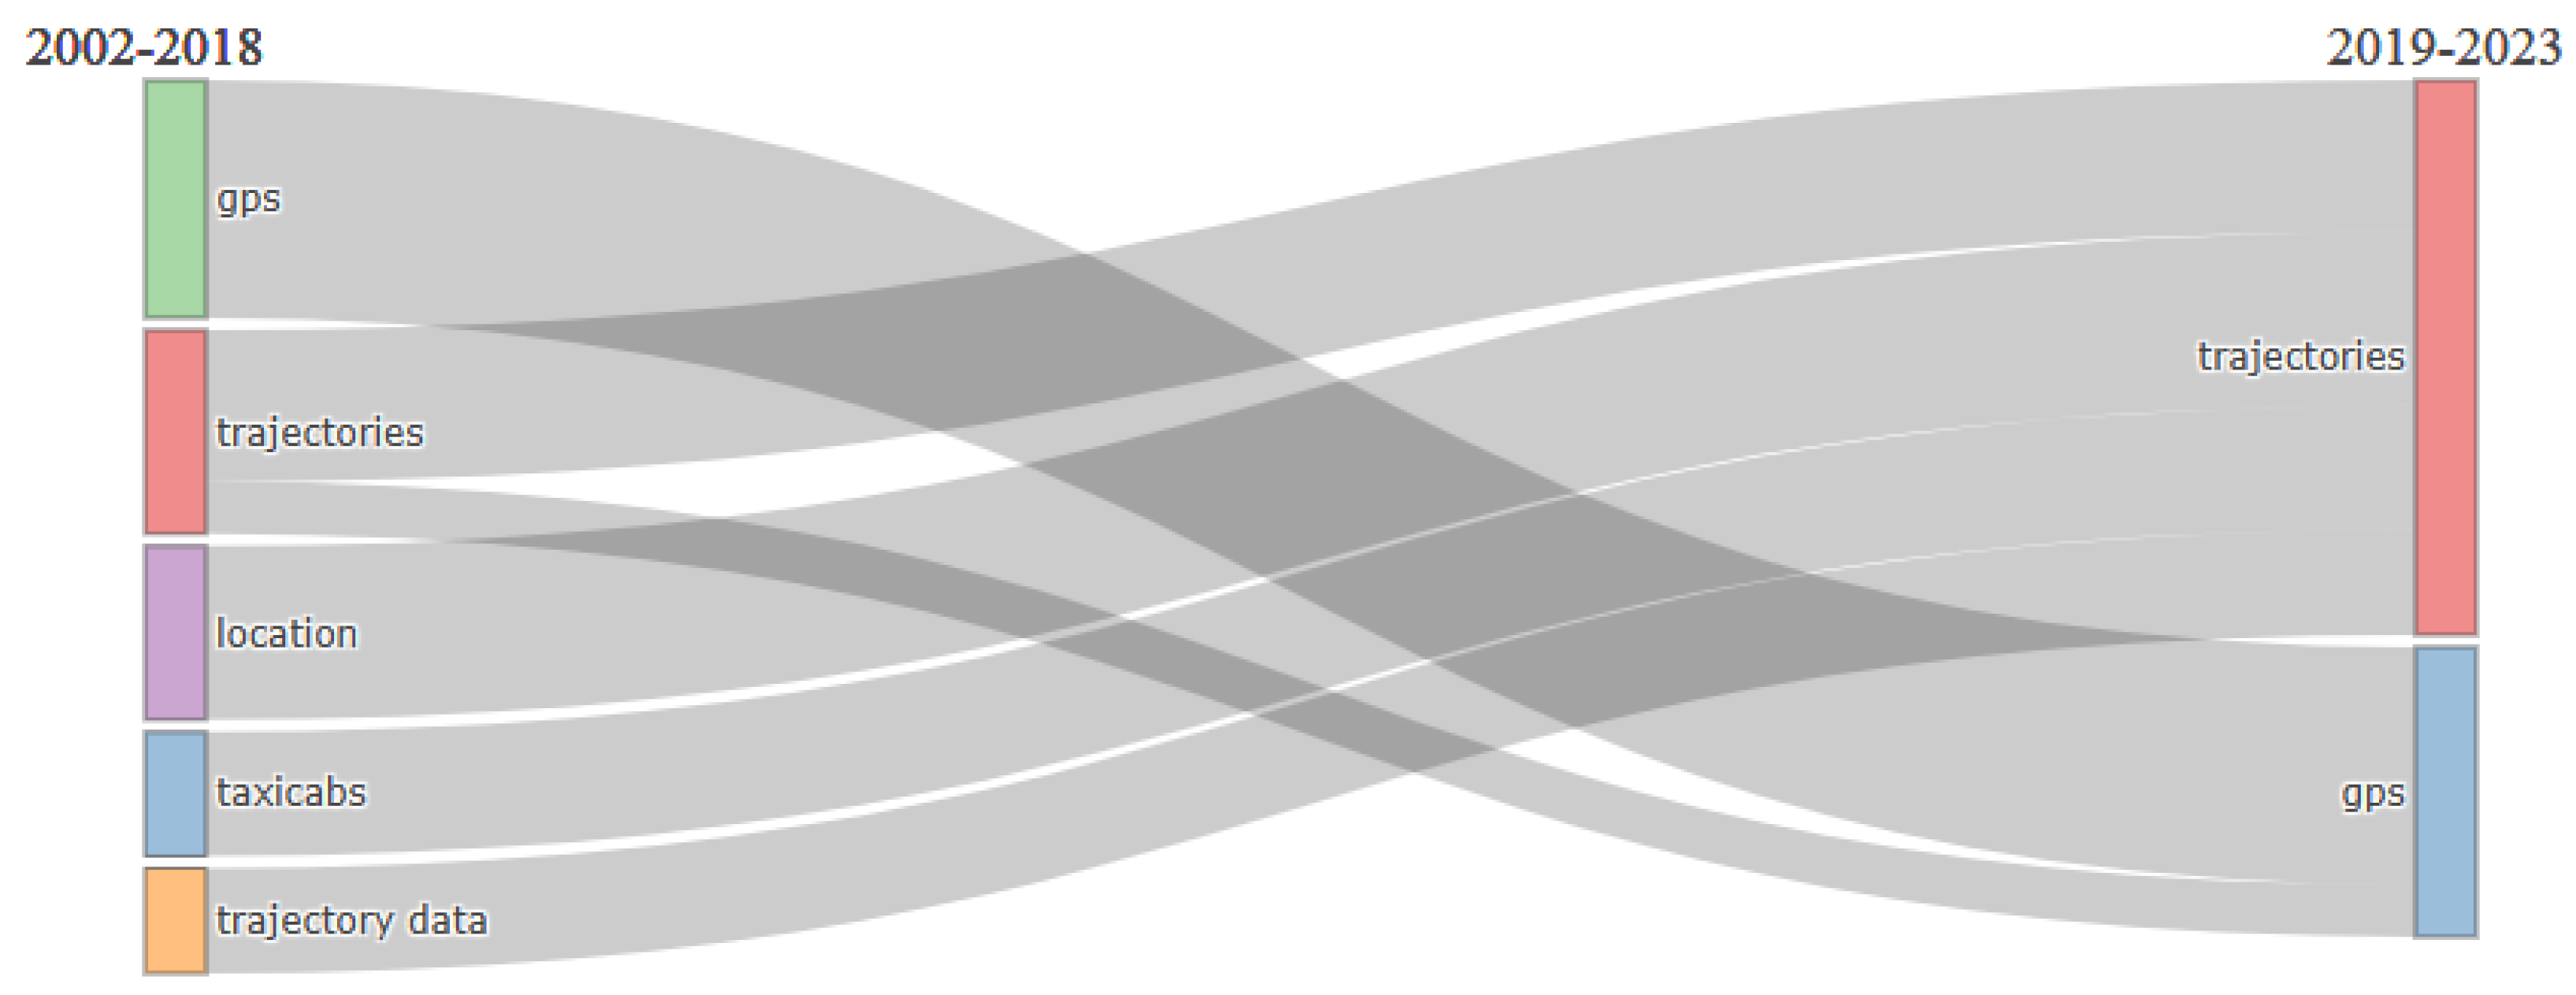
Figure 4.
Strategic diagram of the author’s keywords, generated with bibliometrix. Source: Scopus.
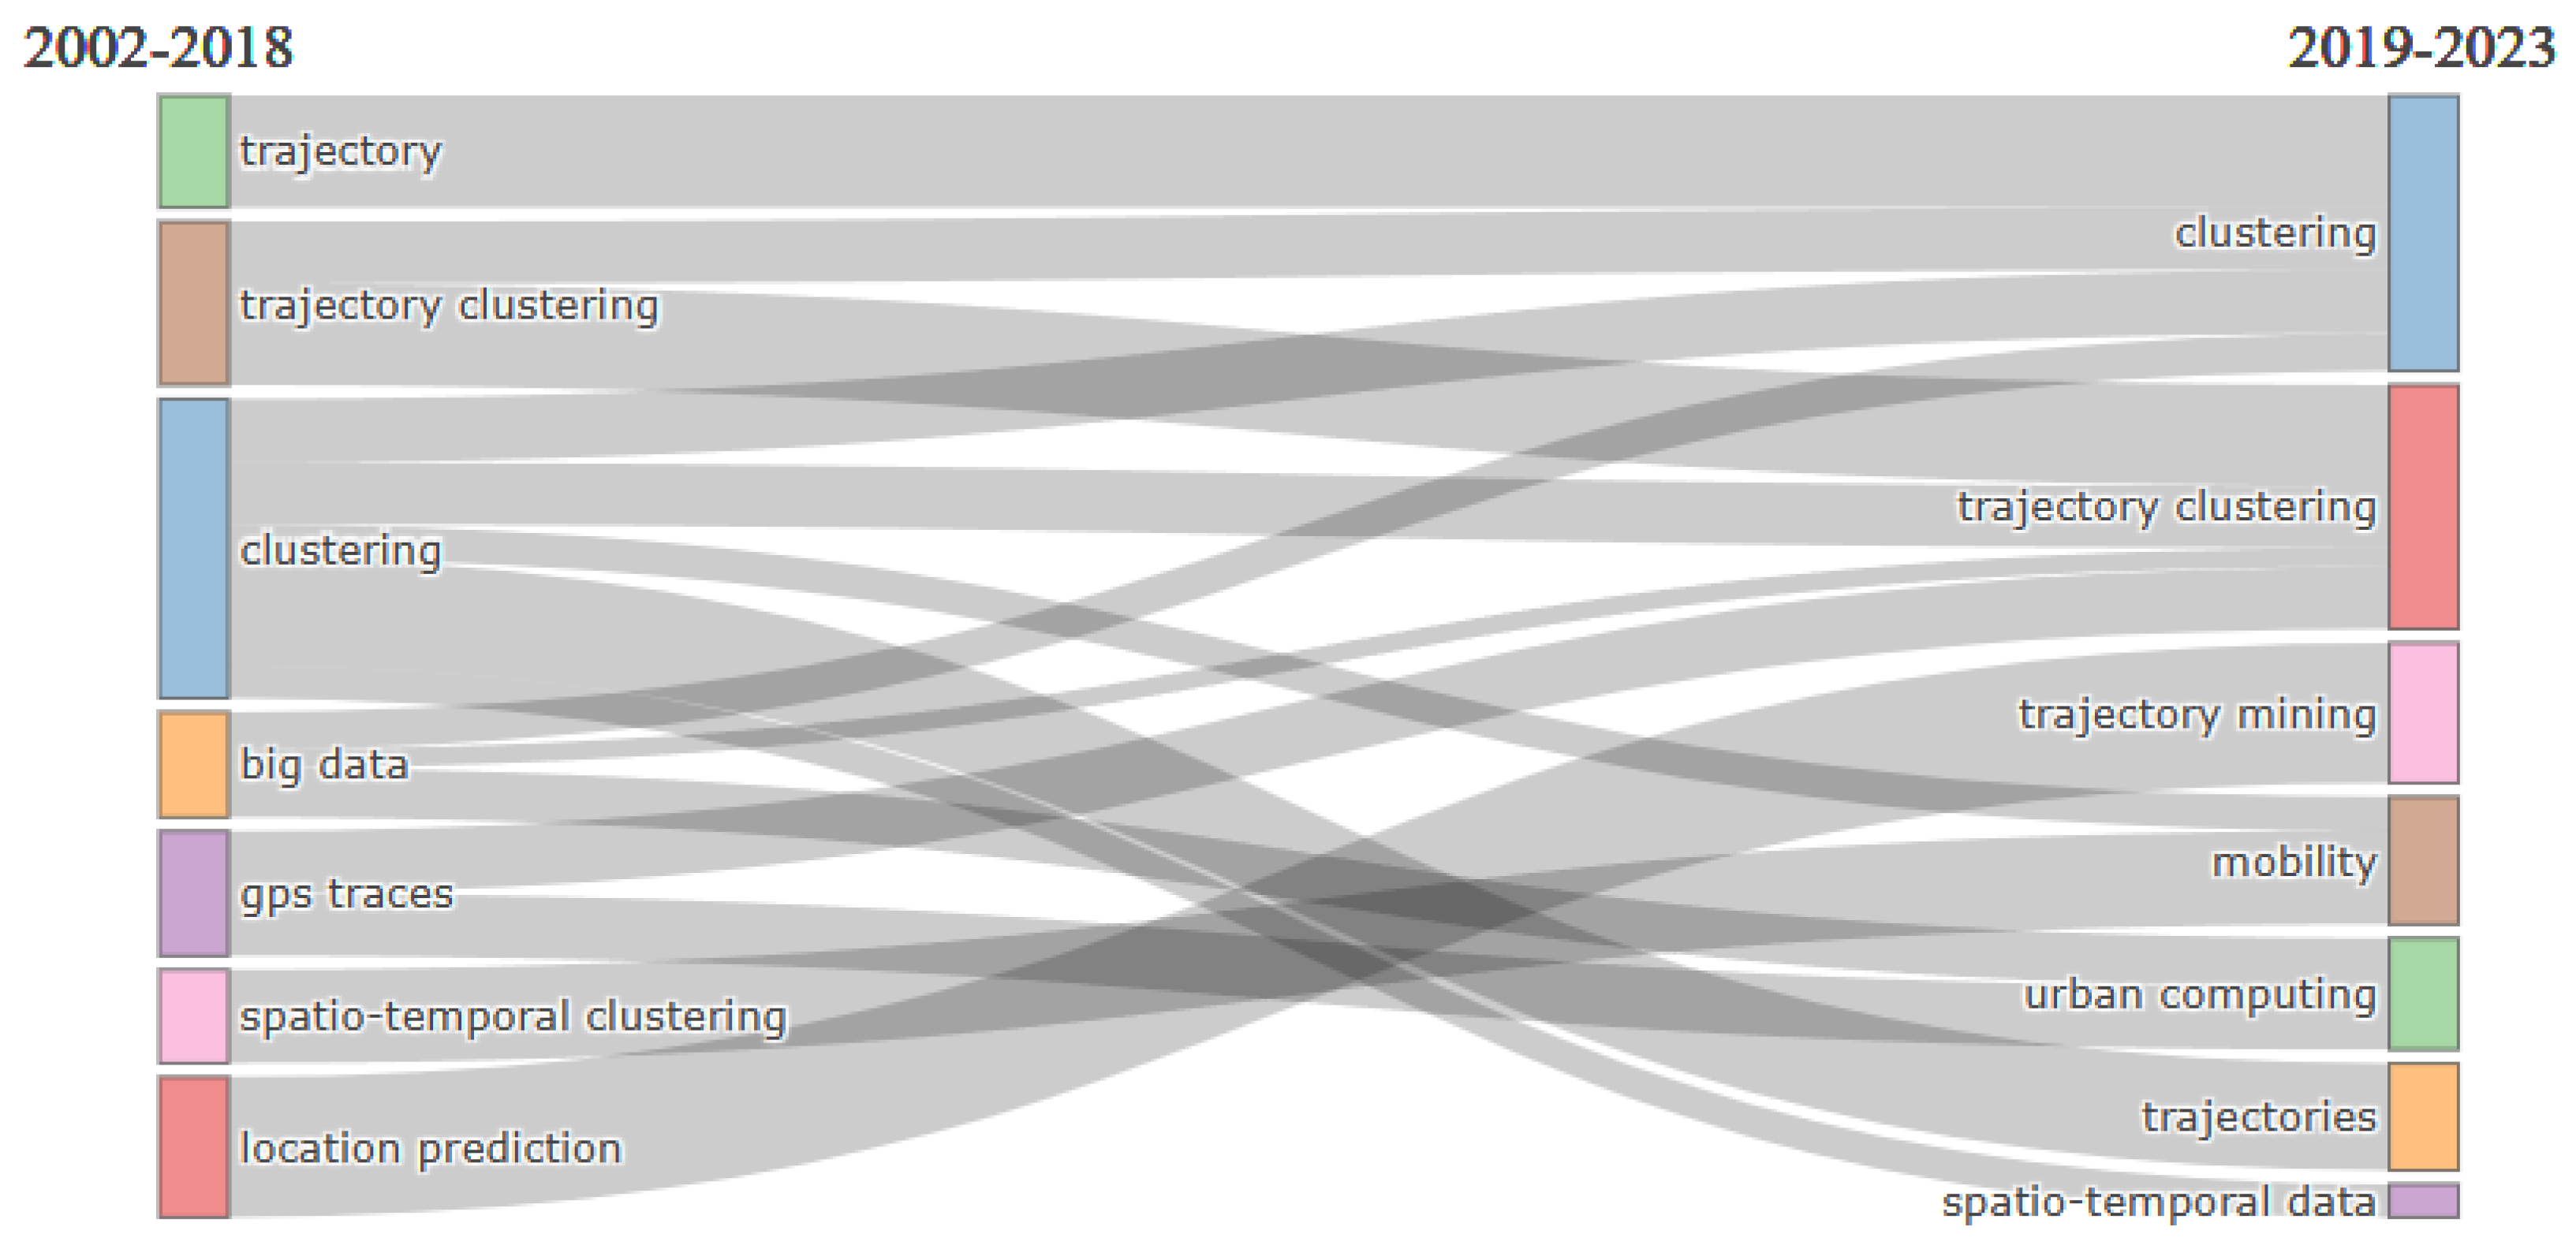
Figure 5.
Map of word clouds in titles and abstracts (full count), generated with VOSviewer. Source: Scopus.
Figure 5.
Map of word clouds in titles and abstracts (full count), generated with VOSviewer. Source: Scopus.
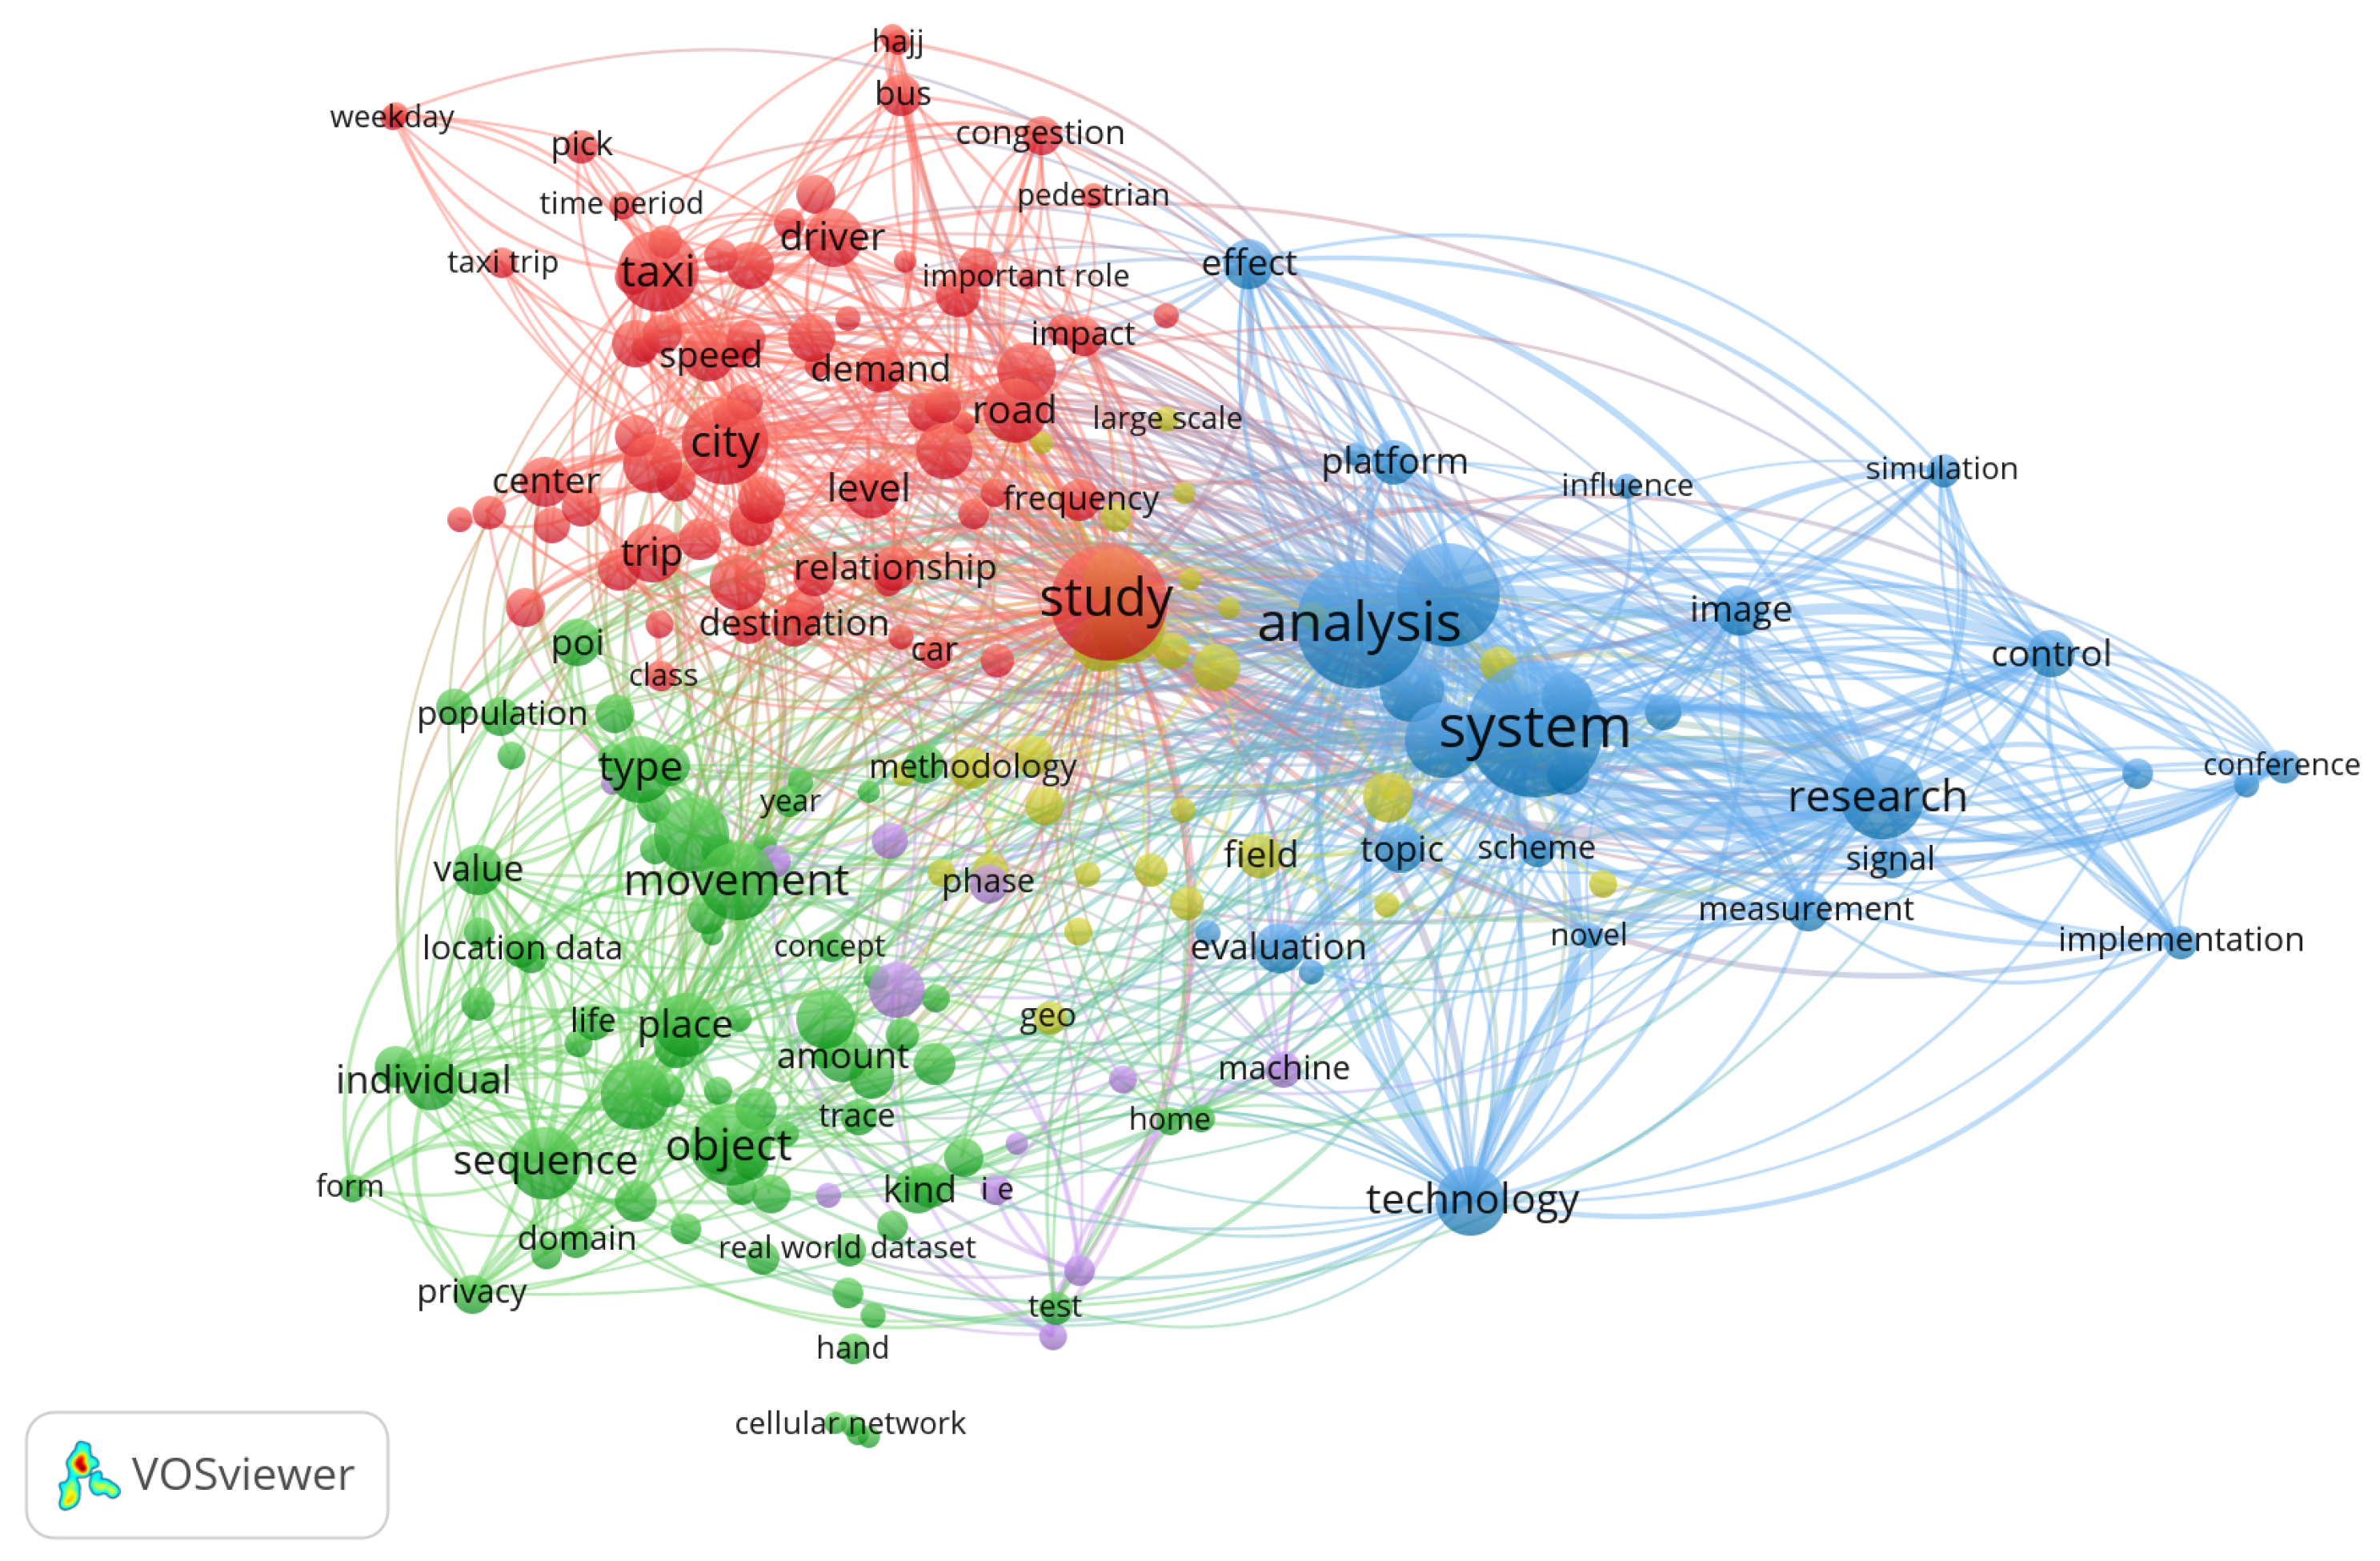
Figure 6.
Map of word clouds in titles and abstracts (binary count), generated with VOSviewer. Source: Scopus.
Figure 6.
Map of word clouds in titles and abstracts (binary count), generated with VOSviewer. Source: Scopus.
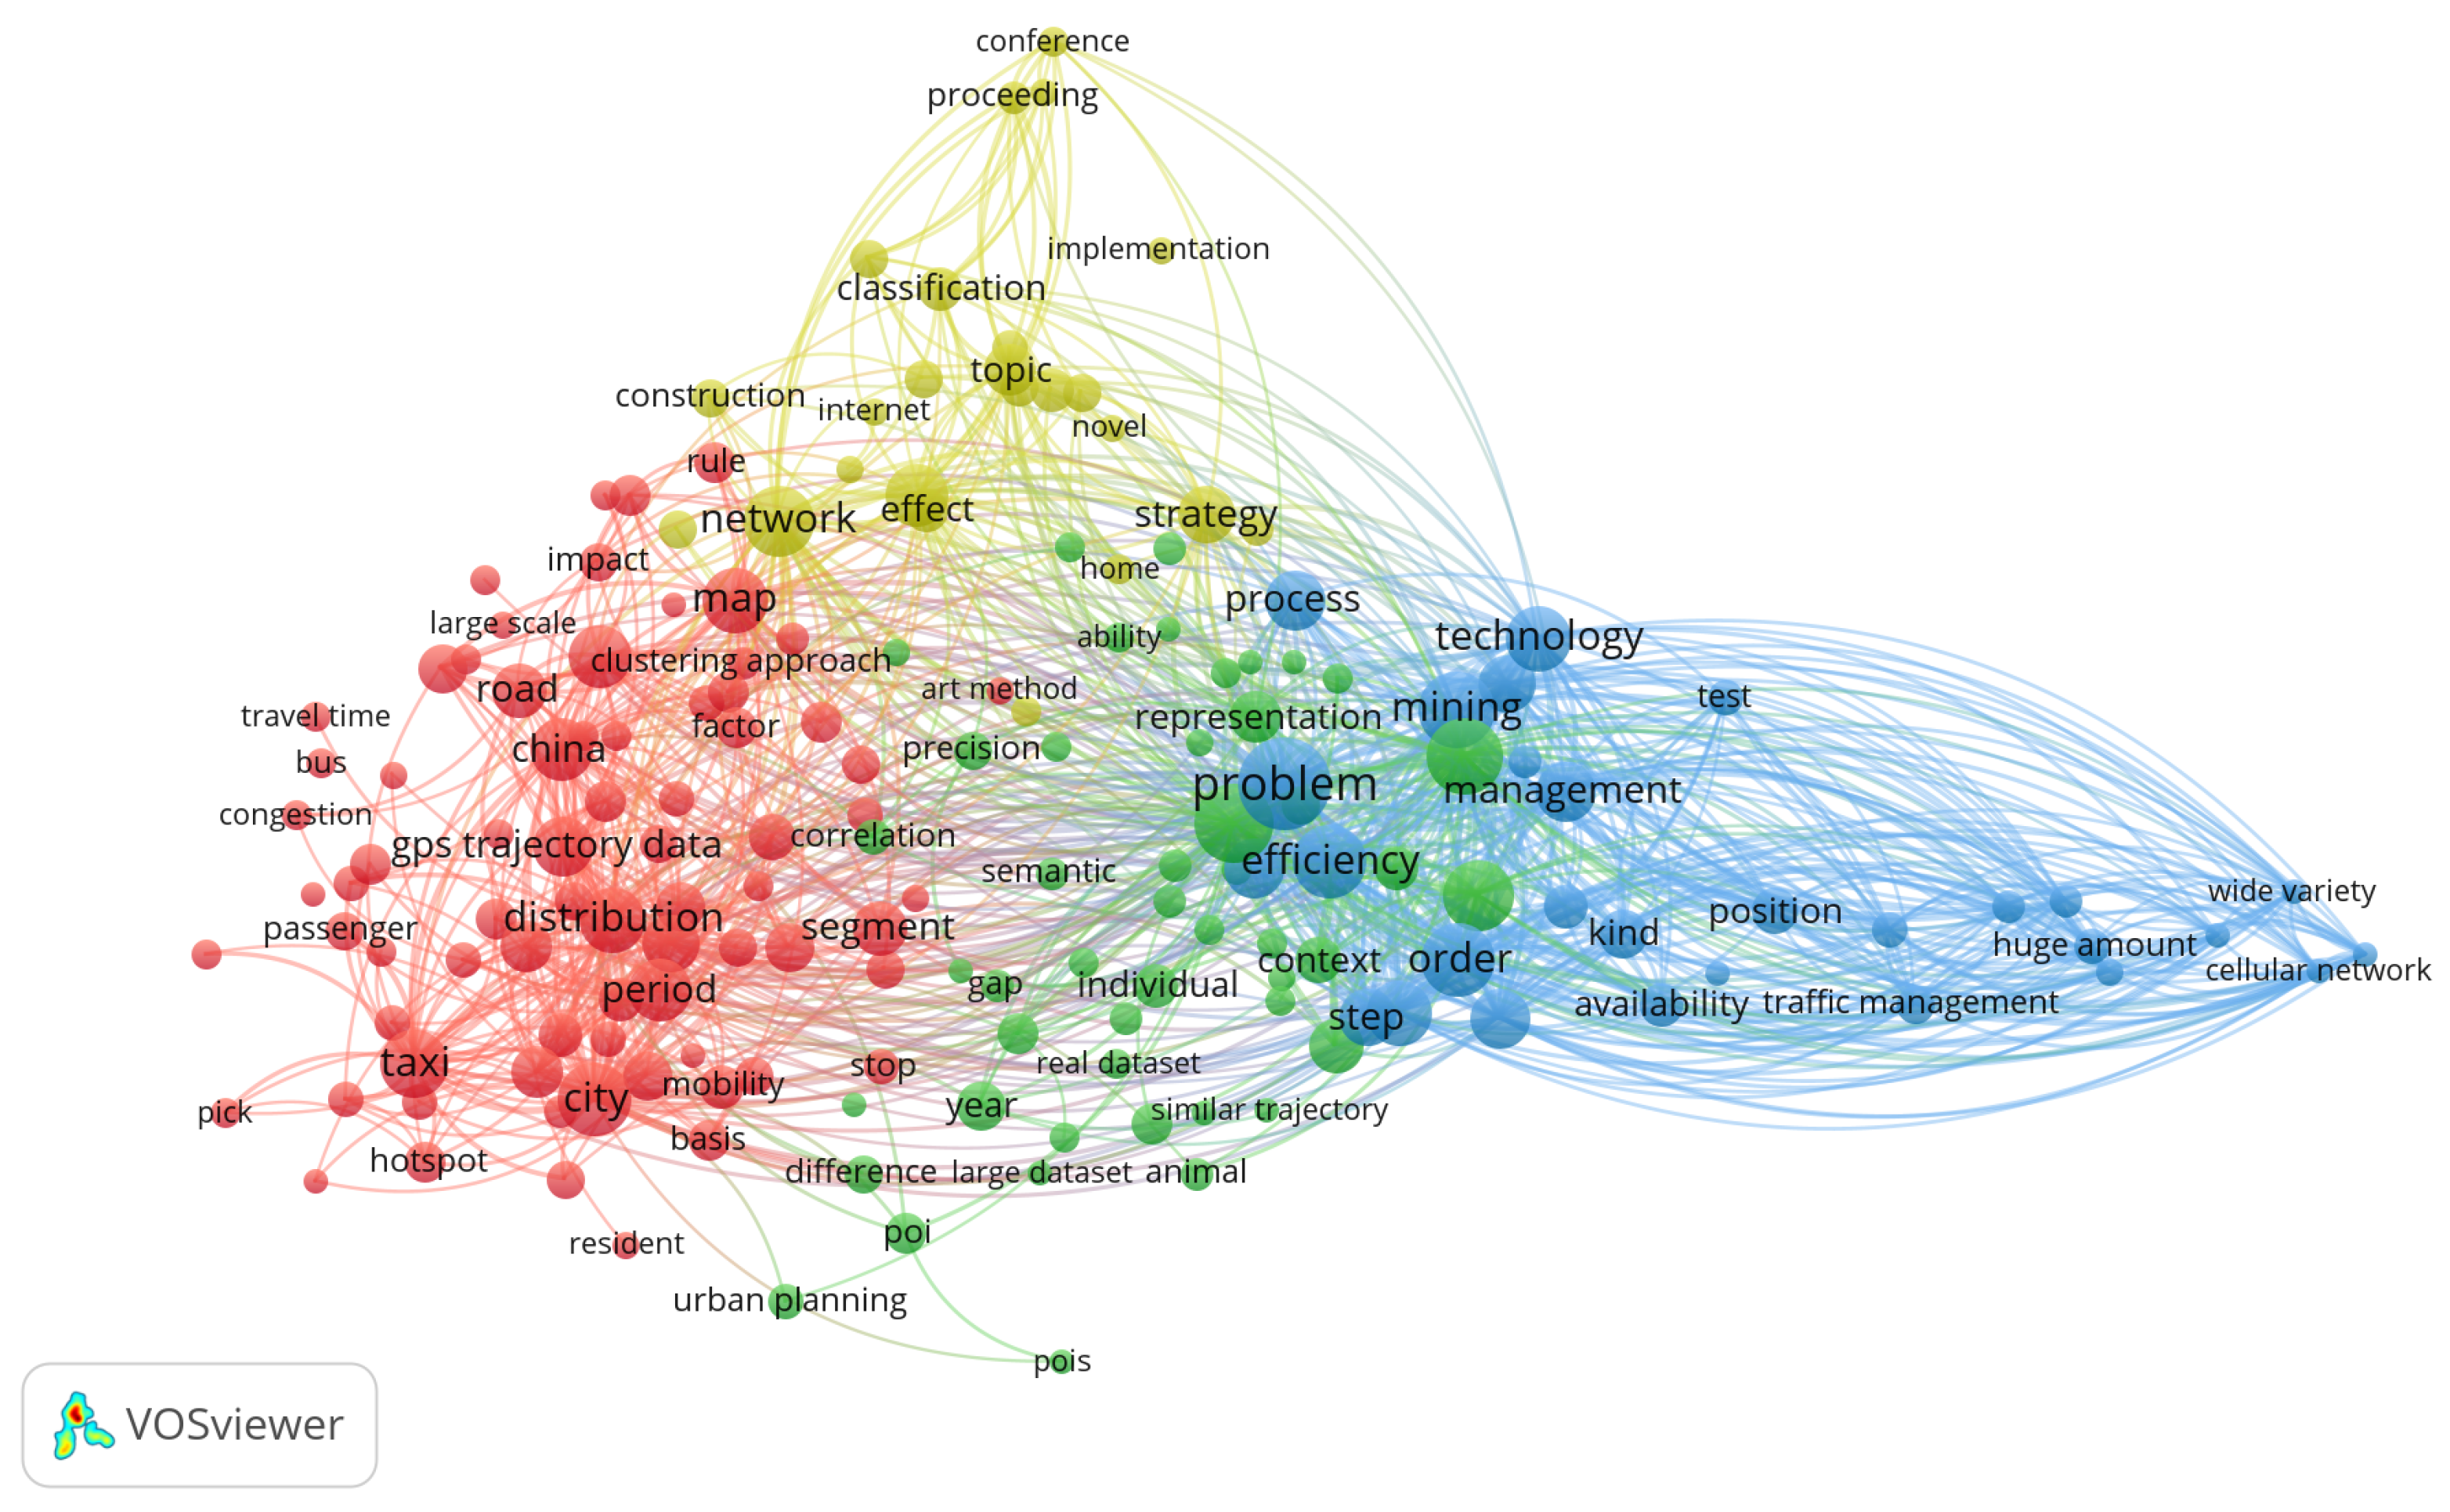
Figure 7.
Cloud map of journals where articles on “GPS trajectory clustering” were published, generated with VOSviewer. Source: Scopus.
Figure 7.
Cloud map of journals where articles on “GPS trajectory clustering” were published, generated with VOSviewer. Source: Scopus.
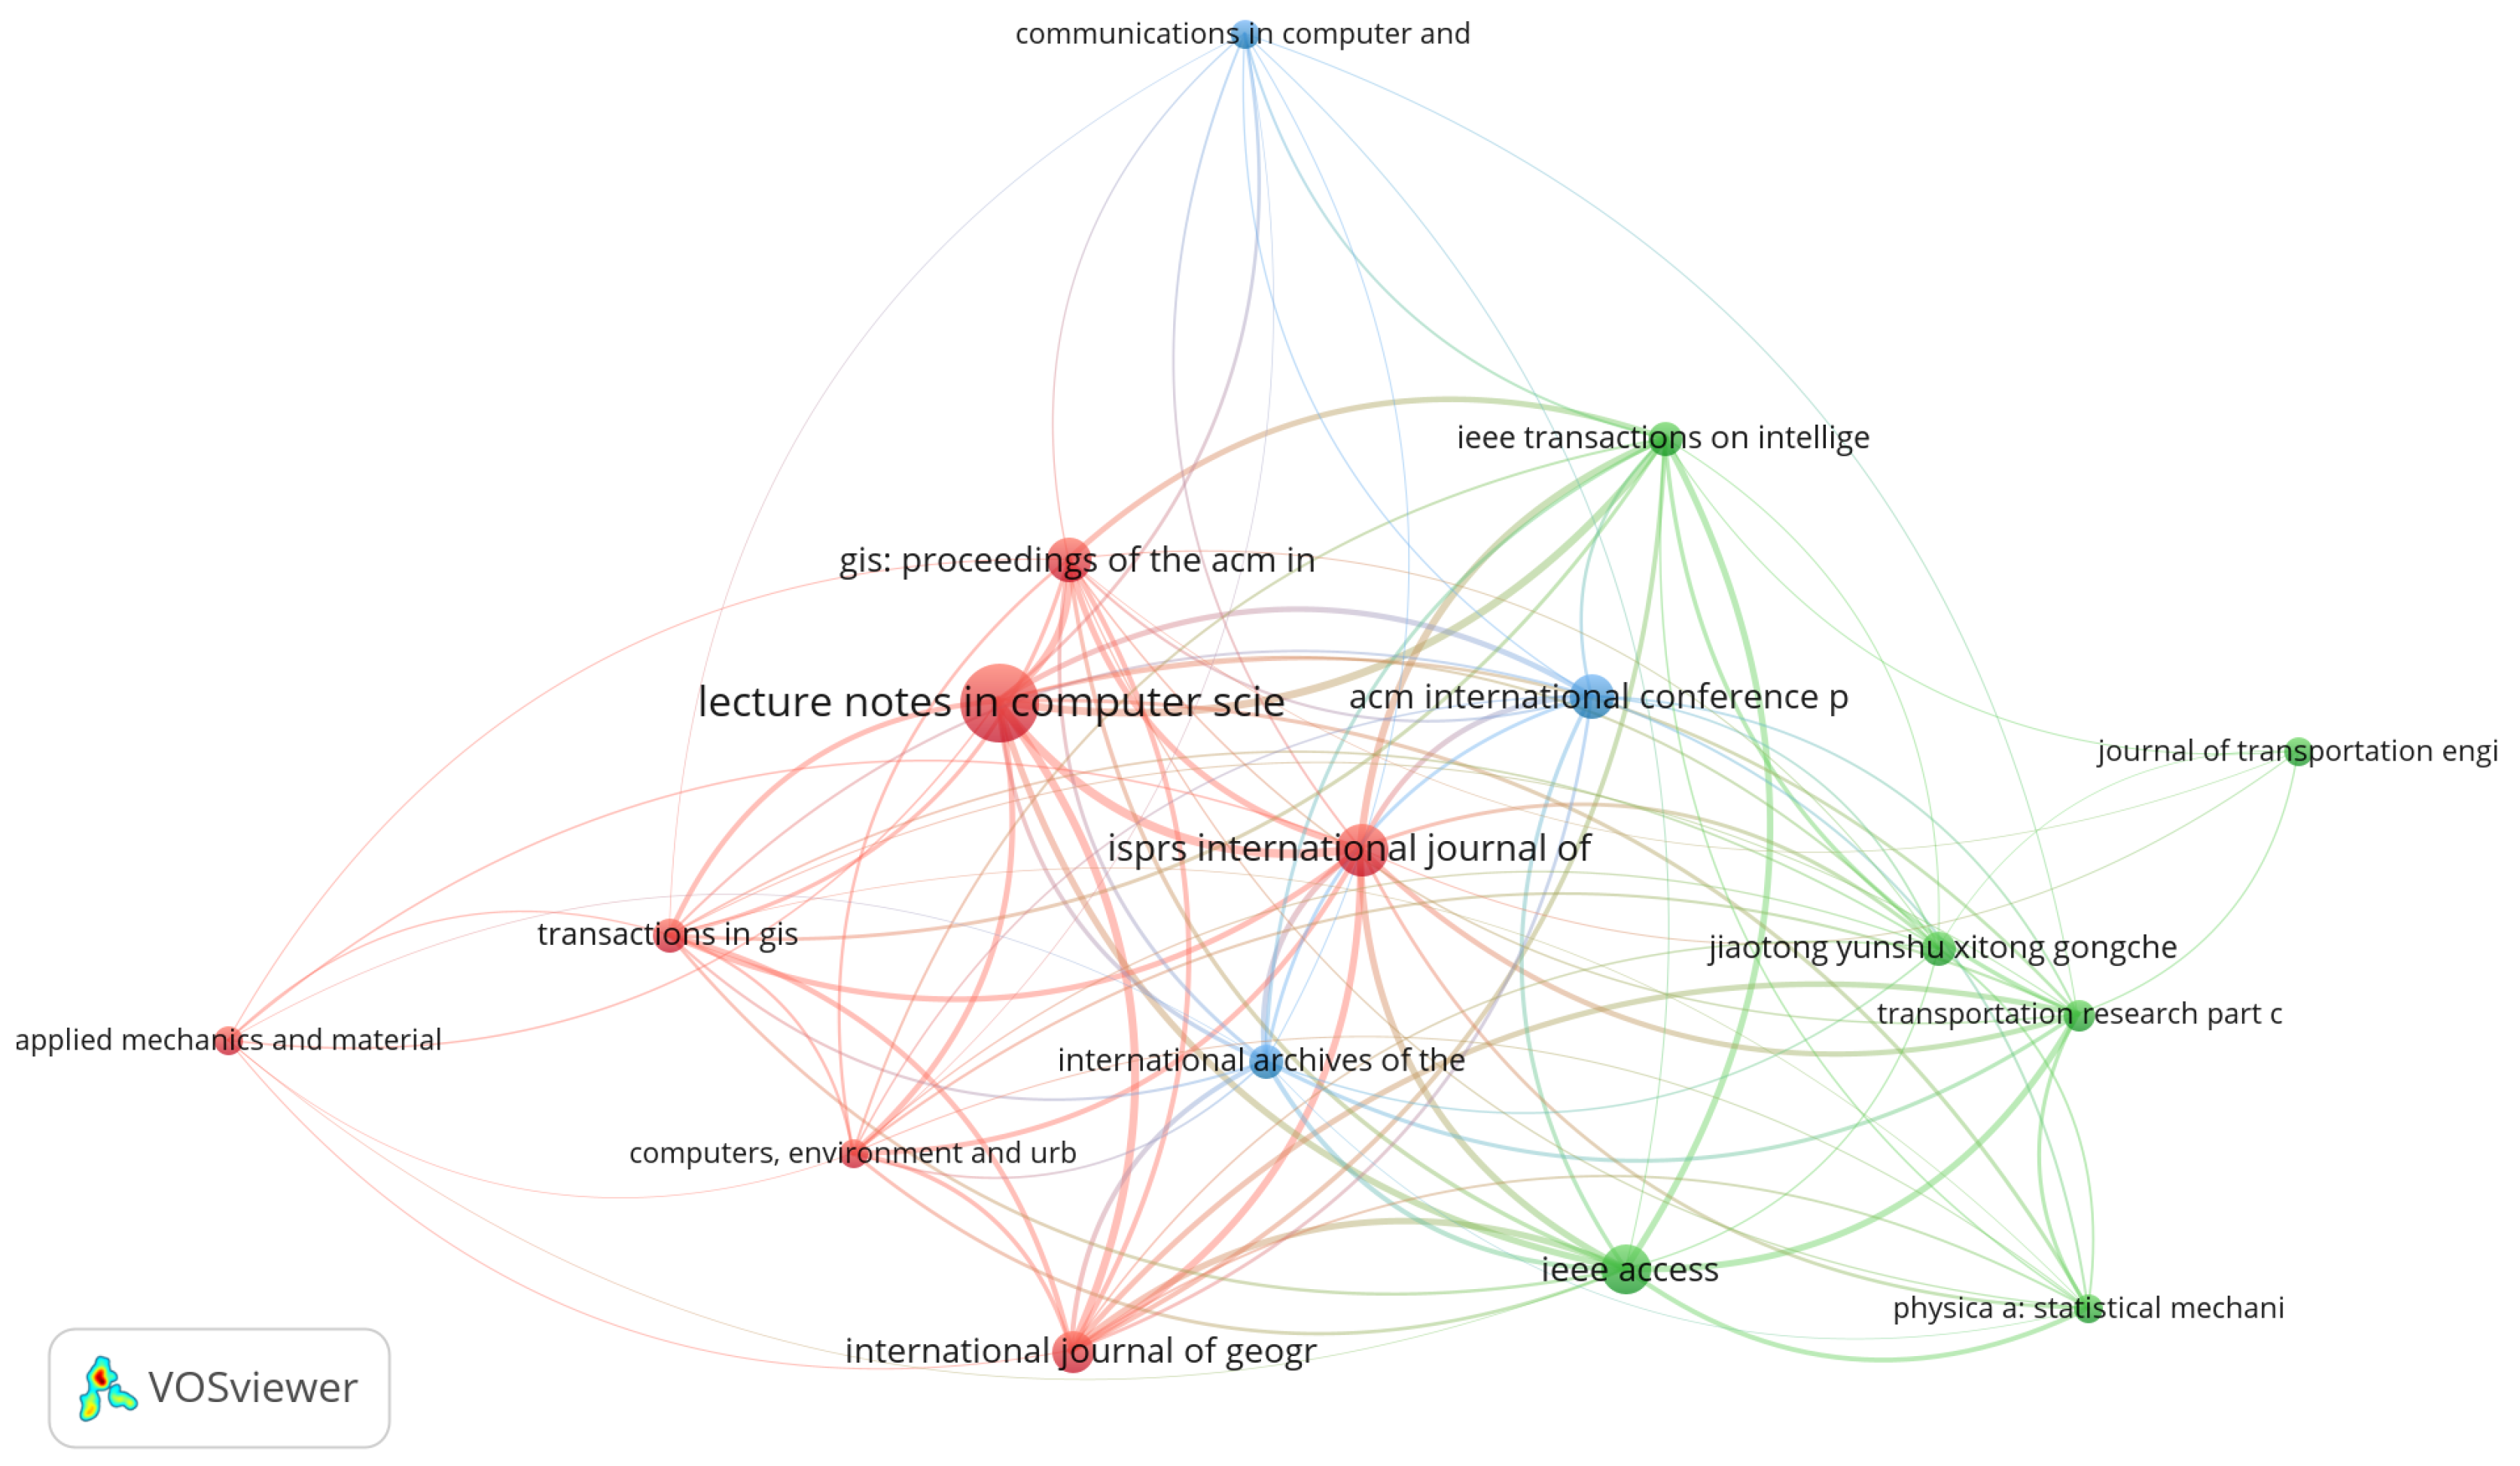
Figure 8.
Cloud maps were published from authors’ journals with papers on “GPS trajectory clustering”, generated with VOSviewer. Source: Scopus.
Figure 8.
Cloud maps were published from authors’ journals with papers on “GPS trajectory clustering”, generated with VOSviewer. Source: Scopus.
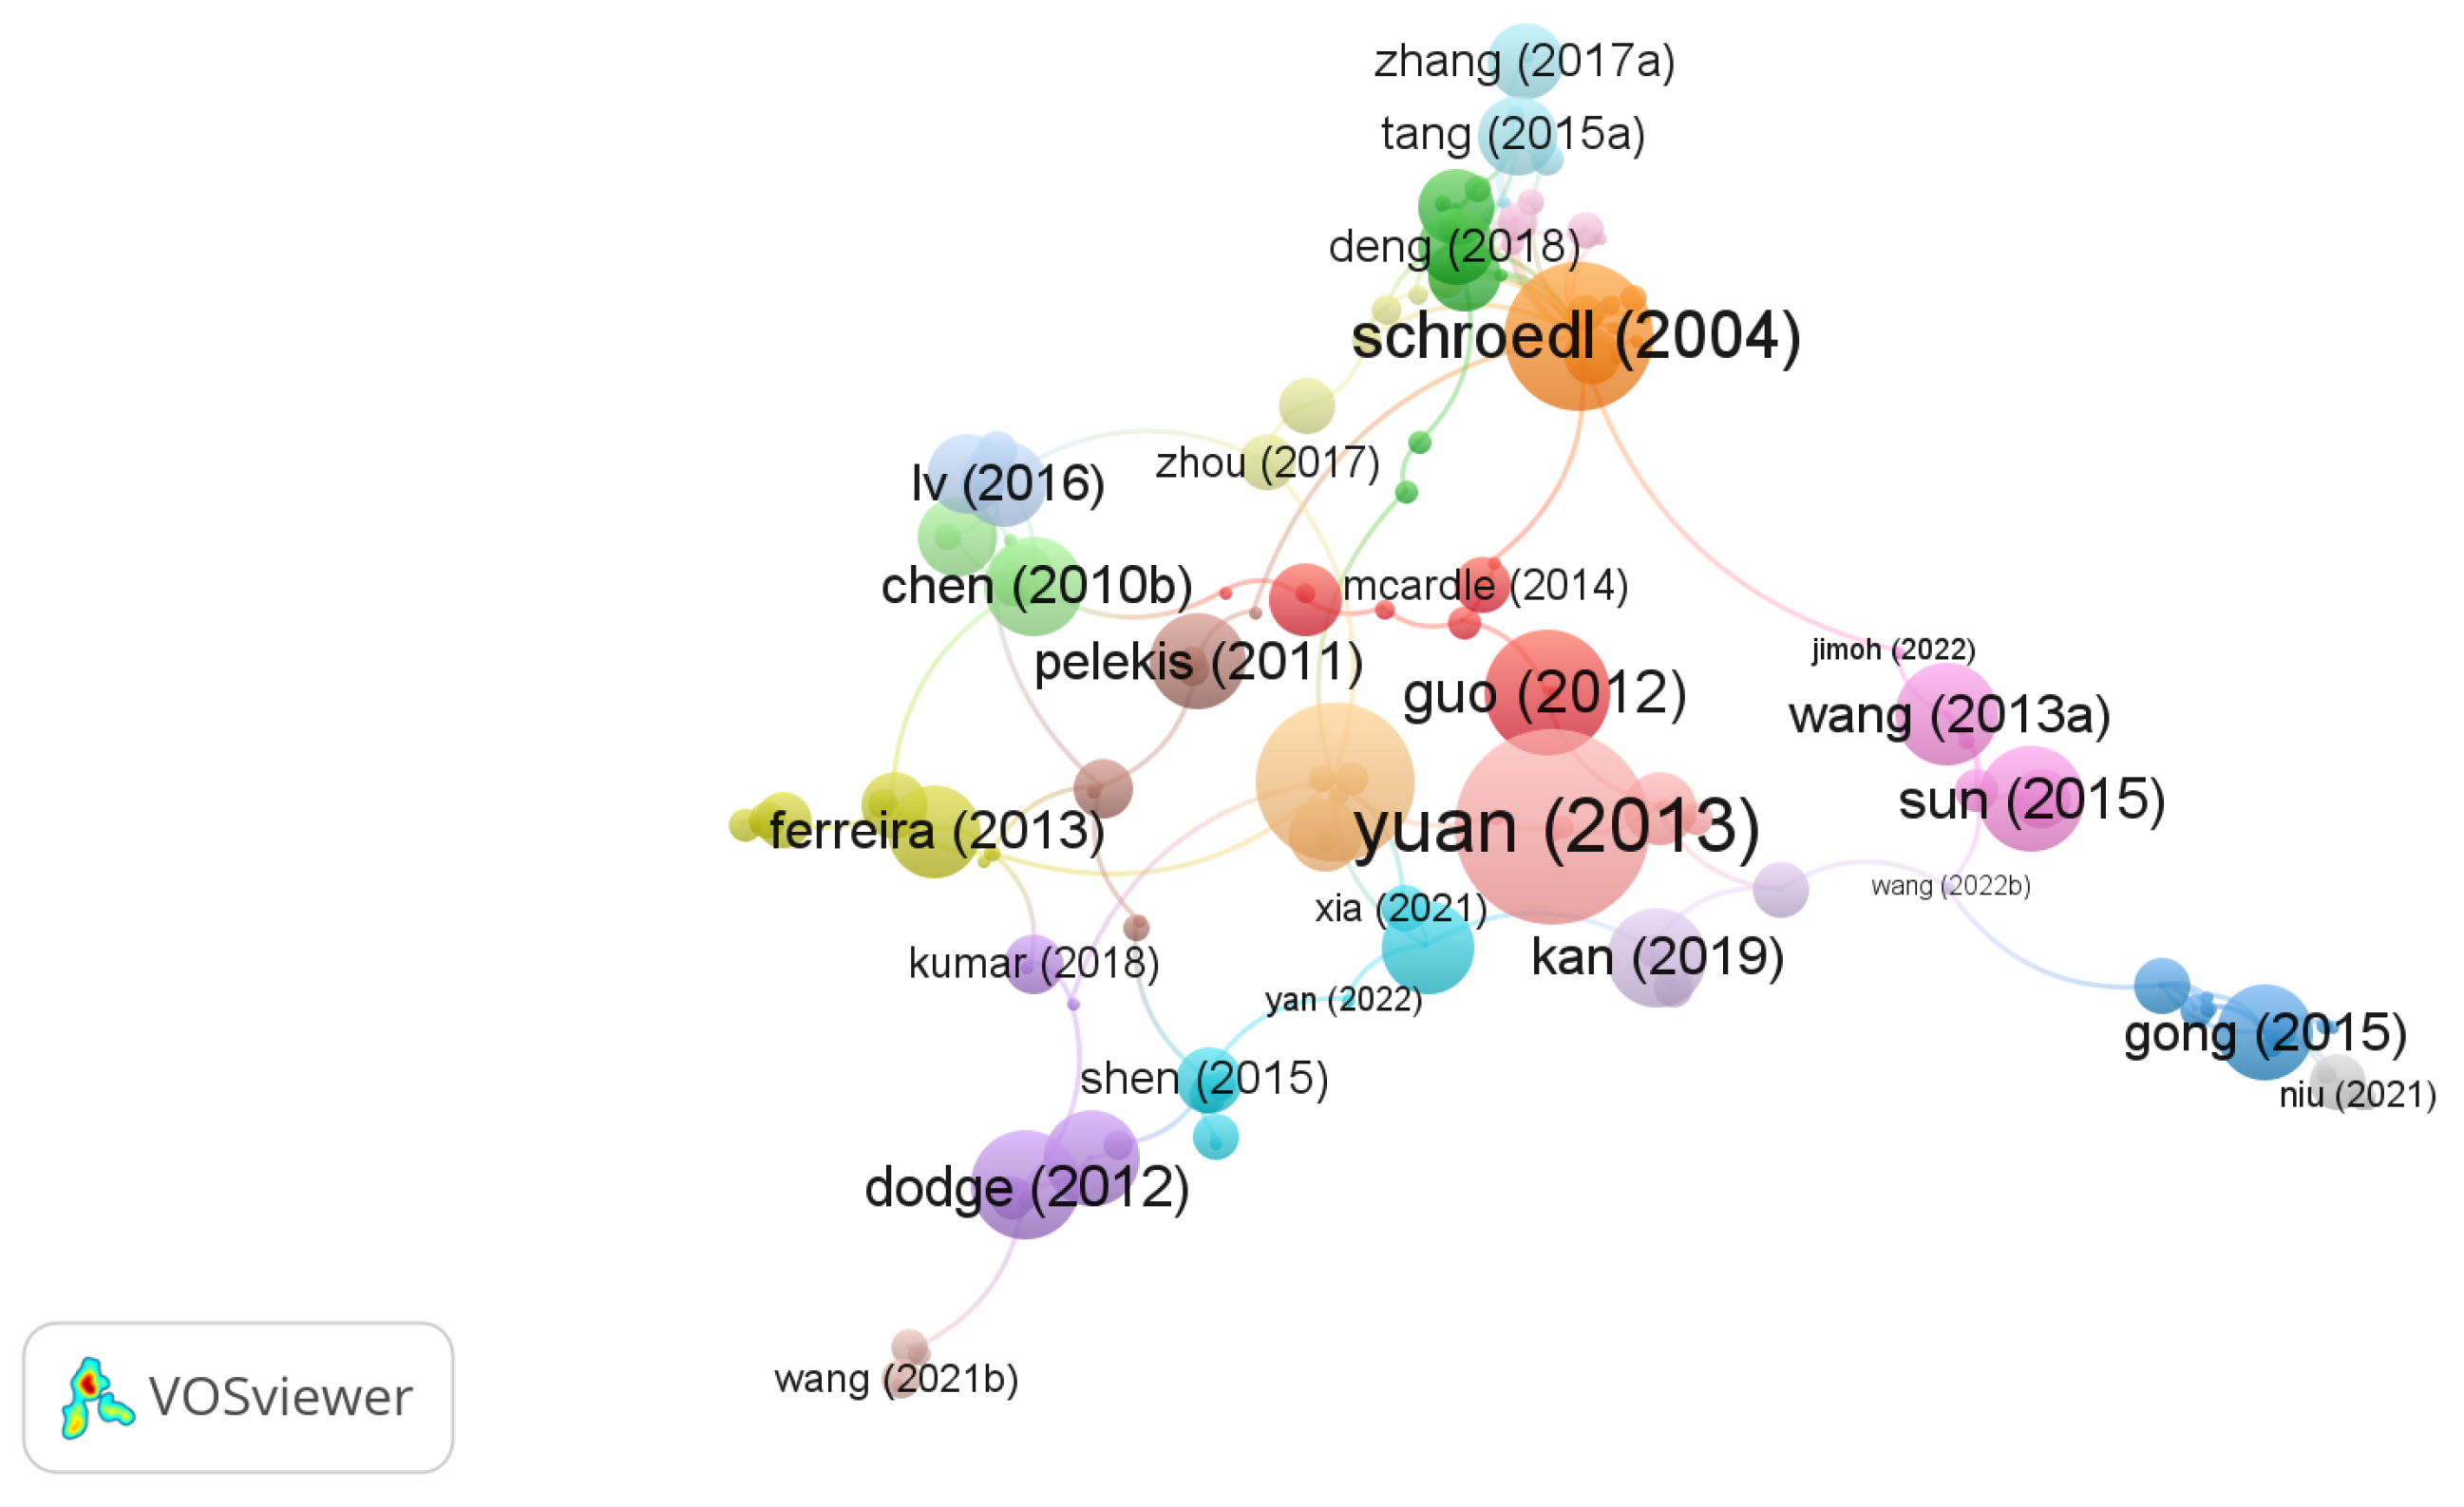

Table 1.
Main areas of research assigned to the sample papers. Source: Scopus.
| Research areas | Records | % of 1094 |
|---|---|---|
| Computer science | 391 | 35.74% |
| Engineering | 176 | 16.09% |
| Social sciences | 125 | 11.43% |
| Mathematics | 123 | 11.24% |
| Earth and planetary sciences | 69 | 6.31% |
| Total of the 5 main research areas | 884 | 80.80% |
Table 2.
Number of articles published per year. Source: Scopus.
| Years | Items | Annual growth rate |
|---|---|---|
| 2002 | 2 | - |
| 2003 | 2 | 0.0% |
| 2004 | 1 | -50.00% |
| 2005 | 0 | -100.00% |
| 2006 | 0 | - |
| 2007 | 1 | - |
| 2008 | 2 | 100.00% |
| 2009 | 11 | 450.00% |
| 2010 | 12 | 9.09% |
| 2011 | 12 | 0.00% |
| 2012 | 15 | 25.00% |
| 2013 | 21 | 40.00% |
| 2014 | 30 | 42.86% |
| 2015 | 31 | 3.33% |
| 2016 | 37 | 19.35% |
| 2017 | 48 | 29.73% |
| 2018 | 55 | 14.58% |
| 2019 | 68 | 23.64% |
| 2020 | 57 | -16.18% |
| 2021 | 52 | -8.77% |
| 2022 | 60 | 15.38% |
| 2023 | 42 | -30.00% |
| Total | 559 | 15.6% |
Table 3.
Ten countries of corresponding authors. Source: Scopus.
| Country | Articles | Frequency | SCP | MCP | MCP Ratio |
|---|---|---|---|---|---|
| China | 203 | 36.3% | 159 | 44 | 21.7% |
| USA | 29 | 5.2% | 17 | 12 | 41.4% |
| India | 16 | 2.9% | 14 | 2 | 12.5% |
| Italy | 13 | 2.3% | 12 | 1 | 7.7% |
| Korea | 11 | 2.0% | 8 | 3 | 27.3% |
| Portugal | 8 | 1.4% | 4 | 4 | 50.0% |
| Japan | 6 | 1.1% | 5 | 1 | 16.7% |
| Australia | 5 | 0.9% | 3 | 2 | 40.0% |
| France | 5 | 0.9% | 2 | 3 | 60.0% |
| Germany | 5 | 0.9% | 3 | 2 | 40.0% |
| Total 10 countries | 301 | 53.9% | 227 | 74 | 31.7% |
Table 4.
Top ten total citations by country. Source: Scopus.
| Country | Total citations | Average citations of articles |
|---|---|---|
| China | 3908 | 19.30 |
| USA | 1004 | 34.60 |
| Turkey | 400 | 400.00 |
| Italy | 202 | 15.50 |
| Hong Kong | 173 | 34.60 |
| Switzerland | 173 | 34.60 |
| Greece | 167 | 33.40 |
| Spain | 156 | 39.00 |
| France | 127 | 25.40 |
| Australia | 118 | 23.60 |
| Total (all countries) | 7138 | 21.92 |
Table 5.
The ten most relevant sources. Source: Scopus.
| Sources | Articles | Type |
|---|---|---|
| Lecture Notes in Computer Science (Including Subseries Lecture Notes in Artificial Intelligence and Lecture Notes in Bioinformatics) | 38 | Conference Proceedings |
| ISPRS International Journal of Geo-Information | 17 | Journal |
| IEEE Access | 15 | Journal |
| GIS: Proceedings of the ACM International Symposium on Advances in Geographic Information Systems | 13 | Conference Proceedings |
| ACM International Conference Proceeding Series | 12 | Conference Proceedings |
| International Journal of Geographical Information Science | 11 | Journal |
| IEEE Transactions on Intelligent Transportation Systems | 8 | Journal |
| International Archives of the Photogrammetry, Remote Sensing and Spatial Information Sciences - ISPRS Archives | 8 | Journal |
| Jiaotong Yunshu Xitong Gongcheng Yu Xinxi/Journal of Transportation Systems Engineering and Information Technology | 7 | Journal |
| Transactions in GIS | 7 | Journal |
Table 6.
The ten most cited articles, ordered descending by number of citations. Source: Scopus.
| Author (year) and Title | Source | Citations |
|---|---|---|
| Yuan et al. (2010). T-drive: driving directions based on taxi trajectories [15]. | GIS: International Conference on Advances in Geographic Information Systems | 884 |
| Abul et al. (2008). Never Walk Alone: Uncertainty for Anonymity in Moving Objects Databases [16]. | 2008 IEEE 24th International Conference on Data Engineering | 400 |
| Jing Yuan et al. (2013). T-Drive: Enhancing Driving Directions with Taxi Drivers’ Intelligence [17]. | IEEE Xplore | 348 |
| Tang et al. (2015). Uncovering urban human mobility from large scale taxi GPS data [18]. | Physica A: Statistical Mechanics and its Applications | 232 |
| Schroedl et al. (2004). Mining GPS Traces for Map Refinement [19]. | Data Mining and Knowledge Discovery | 197 |
| Guo et al. (2012). Discovering Spatial Patterns in Origin-Destination Mobility Data [20]. | Transactions in GIS | 145 |
| Abul et al. (2010). Anonymization of moving objects databases by clustering and perturbation [21]. | Information Systems | 144 |
| Li et al. (2010). Incremental Clustering for Trajectories [22]. | Springer Berlin Heidelberg | 132 |
| Chen et al. (2018). TripImputor: Real-Time Imputing Taxi Trip Purpose Leveraging Multi-Sourced Urban Data [23]. | IEEE Transactions on Intelligent Transportation Systems | 125 |
| Monreale et al. (2010). Movement data anonymity through generalization [24]. | Transactions on Data Privacy | 125 |
Table 7.
Most productive authors. Source: Scopus.
| Authors | Institution | Articles |
|---|---|---|
| Wang Haoyu | Yunnan University, Kunming, China | 16 |
| Li Jinhong | North China University of Technology, Beijing, China | 15 |
| Li Xue | Shandong University of Science and Technology, Qingdao, China | 12 |
| Liu Yizhi | Hunan University of Science and Technology, Xiangtan, China | 12 |
| Li Qing | Shandong University of Science and Technology, Qingdao, China | 11 |
Table 8.
Main keywords. Source: Scopus.
| Author keywords | Articles | Keywords plus | Articles |
|---|---|---|---|
| clustering | 67 | trajectories | 278 |
| trajectory | 34 | clustering algorithms | 169 |
| trajectory clustering | 27 | global positioning system | 119 |
| gps | 26 | data mining | 105 |
| gps trajectory | 24 | taxicabs | 88 |
| dbscan | 22 | cluster analysis | 75 |
| data mining | 21 | roads and streets | 70 |
| gps data | 21 | gps trajectories | 61 |
| gps trajectories | 20 | trajectory clustering | 61 |
| big data | 14 | gps | 57 |
Table 9.
Entropic concentration index (H) of the selected variables. Source: Scopus.
| Variable | H |
|---|---|
| Authors | 0.9665 |
| Sources | 0.9211 |
| Countries | 0.5375 |
| Areas of research | 0.6682 |
| Article citations | 0.8169 |
Table 10.
Observed distribution of the number of authors who wrote a given number of articles and adjusted values of Lotka’s law. Source: Scopus.
Table 10.
Observed distribution of the number of authors who wrote a given number of articles and adjusted values of Lotka’s law. Source: Scopus.
| Number of Articles | Authors | Observed frequency | Adjusted frequency |
|---|---|---|---|
| 1 | 1080 | 0.7627 | 0.7630 |
| 2 | 184 | 0.1299 | 0.1300 |
| 3 | 64 | 0.0452 | 0.0450 |
| 4 | 35 | 0.0247 | 0.0250 |
| 5 | 17 | 0.0120 | 0.0120 |
| 6 | 12 | 0.0085 | 0.0080 |
| 7 | 6 | 0.0042 | 0.0040 |
| 8 | 6 | 0.0042 | 0.0040 |
| 9 | 2 | 0.0014 | 0.0010 |
| 10 | 2 | 0.0014 | 0.0010 |
| 11 | 4 | 0.0028 | 0.0030 |
| 12 | 2 | 0.0014 | 0.0010 |
| 15 | 1 | 0.0007 | 0.0010 |
| 16 | 1 | 0.0007 | 0.0010 |
Disclaimer/Publisher’s Note: The statements, opinions and data contained in all publications are solely those of the individual author(s) and contributor(s) and not of MDPI and/or the editor(s). MDPI and/or the editor(s) disclaim responsibility for any injury to people or property resulting from any ideas, methods, instructions or products referred to in the content. |
© 2025 by the authors. Licensee MDPI, Basel, Switzerland. This article is an open access article distributed under the terms and conditions of the Creative Commons Attribution (CC BY) license (http://creativecommons.org/licenses/by/4.0/).
Copyright: This open access article is published under a Creative Commons CC BY 4.0 license, which permit the free download, distribution, and reuse, provided that the author and preprint are cited in any reuse.


