

Submitted:
17 February 2025
Posted:
19 February 2025
You are already at the latest version
Abstract
Service quality research has traditionally focused either on identifying Kano two-dimensional quality categories or detecting service quality deficiencies. However, integrating these perspectives remains a challenge due to the Kano model's nonlinear characteristics and the Importance-Performance and Gap Analysis (IPGA) model's linear approach. This study proposes the Kano-IPGA (KIPGA) model, incorporating Mutual Information (MI) to bridge the gap between these two models. The KIPGA model first employs moderated regression analysis to classify service attributes into Kano’s quality categories. MI is then used to calculate relative importance (RI), while relative performance (RP) is determined using the original IPGA approach. The results are mapped into the KIPGA strategic matrix, categorizing service attributes into eight management strategies. An empirical analysis of Taiwan’s online insurance systems demonstrates the model’s effectiveness in simultaneously identifying Kano categories and prioritizing service quality improvements. The findings reveal that Critical Improvement and Enhanced Improvement regions require immediate attention. The proposed KIPGA model offers a systematic approach for service quality management, providing decision-makers with a structured framework to allocate resources effectively and enhance customer satisfaction. This study contributes to service quality research by offering an integrated model that accounts for both linear and nonlinear quality assessment perspectives.
Keywords:
Service Quality
; Kano Model
; Importance-Performance and Gap Analysis (IPGA)
; Mutual Information (MI)
; KIPGA
1. Introduction
In the current highly competitive market environment, service quality has become a critical factor for enterprises to gain a competitive advantage. As customer expectations for services continue to rise, businesses must continuously improve service quality to meet customer needs, enhance satisfaction, and build loyalty [2,16]. However, traditional service quality analysis methods, such as Importance-Performance Analysis (IPA), while providing a means to identify priority areas for service quality improvement, face various limitations in their application. Consequently, many scholars have proposed methods for improvement [5,10,11,15,18,20]. Among these, Lin et al. (2009) introduced the Importance-Performance and Gap Analysis (IPGA) model [11]. This model integrates IPA with service quality gap analysis, enabling the effective identification of service quality issues that need improvement and providing a basis for resource allocation.
Furthermore, due to its ability to classify service attributes into different quality categories (including Basic quality, Performance quality, Excitement quality, etc.), the Kano model has become an important tool for analyzing customer service needs [7,10,12]. However, the Kano model lacks a systematic approach for practical applications that integrates with resource allocation optimization. Therefore, combining the Kano model with the IPGA model would enable simultaneous identification of Kano two-dimensional quality categories and analysis of the priority order for improving service quality.
The Kano model considers the nonlinear relationships. In contrast, the IPGA model is primarily based on linear correlation analysis. As a result, the IPGA model fails to fully capture these nonlinear relationships, leading to differences in the identification of key improvement items compared to the Kano model. To address the above issues, this study proposes introducing Mutual Information (MI) as an analytical tool. MI can measure the total correlation between two variables, including both linear and nonlinear relationships, providing more comprehensive information than traditional correlation coefficients. Therefore, this study intends to incorporate MI to integrate the Kano model and IPGA model, developing a comprehensive KIPGA model.
Through the KIPGA model, businesses can simultaneously identify the Kano quality categories of service quality attributes and analyze the improvement priority of each service quality factor. This allows businesses to effectively identify key service quality factors in need of improvement. Moreover, this study will establish a strategic matrix based on the developed integrated model. This will assist businesses in formulating service quality management strategies, optimizing resource allocation, enhancing service quality, meeting customer needs, and strengthening market competitiveness.
In summary, this study aims to integrate the Kano two-dimensional quality model, the IPGA model, and Mutual Information (MI) to provide a more precise and comprehensive tool for service quality analysis. This tool will help businesses develop effective service quality improvement strategies under limited resources, addressing the limitations of existing models in identifying nonlinear relationships between service quality and target performance. The research objectives are as follows:
- (1)
- To utilize the characteristics of Mutual Information (MI) in analyzing both linear and nonlinear relationships between two variables, and to develop an integrated model – KIPGA that combines the Kano model and the IPGA model. This model will enable the simultaneous identification of Kano two-dimensional quality categories and the prioritization of service quality improvements. As a result, it can help identify key service quality factors that require improvement.
- (2)
- Based on the developed integrated model, the study aims to formulate a strategic matrix according to Kano two-dimensional quality categories and the prioritized improvement order of service quality factors. This matrix will serve as a foundation for developing effective service quality management strategies.
2. Literature review
2.1. IPA and IPGA
The concept of Importance-Performance Analysis (IPA) involves using surveys to understand users' perceptions of the "importance" and "performance" levels of quality attributes. A two-dimensional matrix of importance and performance levels is then used to categorize these attributes into four quadrants: Keep Up the Good Work, Concentrate Here, Low Priority, and Possible Overkill [14]. While the IPA model is widely regarded by researchers as a simple tool for performance evaluation and quality management, it also presents certain practical issues in application and decision-making. These issues include the inability to differentiate quality attributes within the same quadrant, the lack of consideration for service gaps, variations in the importance of quality attributes, and subjective conflicts [5,11,15,18]. Therefore, many scholars have proposed methods for improvement [5,10,11,15,18,20]. Among them, Lin et al.(2009) introduced the Importance-Performance and Gap Analysis (IPGA) model [11]. This model integrates Importance-Performance Analysis (IPA) with service quality gap analysis by replacing the IPA model's coordinate axes with Relative Importance (RI) and Relative Performance (RP). Similar to the traditional IPA model, the IPGA model divides resource allocation into four quadrants with different strategic implications.
The IPGA model applies transformation functions to the two coordinate axes. If the importance of the j-th attribute is significantly lower than its service performance, it indicates that the attribute has not met consumer expectations. Thus, its position in the matrix should fall into a high-priority range for resource allocation. Conversely, if the importance of the j-th attribute is significantly higher than its service performance, it suggests that the attribute has exceeded consumer expectations. Therefore, its position in the matrix should be in a lower priority range for resource allocation. When an attribute is located in Quadrant II of the IPGA matrix and is farther from the intersection point, the priority for resource adjustment increases (as shown in Figure 1, Attribute A has a higher resource adjustment priority than Attribute B).
2.2. KANO two-dimensional quality
The Kano two-dimensional quality model, proposed by Noriaki Kano in 1984, is a framework used to analyze customer needs and satisfaction. It has been widely applied in the fields of quality management and service design [1,7,13,17]. The model classifies quality attributes into five categories based on their impact on customer satisfaction: Basic Quality, Performance Quality, Excitement Quality, Indifferent Quality, and Reverse Quality. The significant contribution of the Kano model lies in its ability to help businesses understand the varying effects of different quality attributes on customer satisfaction. This understanding enables organizations to optimize resource allocation and design products and services that align with customer needs, thereby improving customer satisfaction and loyalty. Additionally, the model highlights the dynamic nature of quality attributes over time and with increasing market competition. Specifically, attributes classified as Excitement Quality may gradually transition to Performance Quality or even evolve into Basic Quality.
In the Kano two-dimensional quality identification method, Kano et al. (1984) proposed the model and designed a questionnaire analysis approach [7]. Berger et al. (1993) further refined the application of the questionnaire analysis method [1]. This method primarily collects customer responses to specific attributes through a questionnaire, using functional questions and dysfunctional questions, and classifies attributes based on these responses.
Additionally, Lin et al. (2010) proposed the moderated regression analysis method to identify the attribute categories of various service items [12]. This method analyzes the relationship between customers' evaluations of all service attributes () and the target performance () using moderated regression analysis. The target performance can include overall satisfaction, continuous use, or recommendation to others. The analysis model is as follows:
where ,m represents the moderate evaluation value, and
are the regression coefficients.
The classification criteria for each service category factor are shown in Table 1.
2.2. Mutual Information (MI)
In 1948, Claude Shannon proposed the concept of Mutual Information (MI), defining it as follows [4]:
where : the joint probability distribution of the random variables (X,Y).
: the marginal probabilities of X and Y, respectively.
According to the above formula, when the MI value is larger, it indicates a stronger association between the two variables and greater mutual influence. Conversely, if MI equals 0, it signifies that the two variables are completely independent. The distinguishing feature of MI lies in its ability to capture both linear and nonlinear relationships between variables. This makes it particularly advantageous when dealing with high-dimensional or nonlinear data. When analyzing data associations, MI provides a more comprehensive correlation analysis compared to traditional statistical methods (e.g., Pearson correlation coefficient), which only measure linear relationships. For datasets with nonlinear patterns, MI can detect a broader range of dependencies, whereas correlation coefficients may underestimate these associations. For example, if the Pearson correlation coefficient might approach 0, yet MI can accurately reflect the dependency between X and Y.
Regarding the applications of MI, Laarne et al. (2022) utilized MI to explore nonlinear relationships among atmospheric variables [9]. Their study highlighted that this method effectively identifies significant associations in complex datasets and captures nonlinear patterns, particularly excelling in handling data with exponential distributions. Compared to traditional correlation analyses (e.g., Pearson correlation coefficient), MI demonstrates significant advantages. Dionisio, Menezes, and Mendes (2004) applied MI in financial research to detect nonlinear relationships between time series [6]. The study emphasized that MI better describes nonlinear associations between two variables compared to traditional correlation coefficients. Young et al. (2023) employed MI to investigate critical features of variables in epidemiologic data [23]. The study specifically highlighted three characteristics of MI:
(i) Its ability to capture all types of relationships, including both linear and nonlinear.
(ii) It equals zero only when the random variables are independent.
(iii)It serves as a robust measure of relationship strength.
On the other hand, Vergara and Estévez (2014) reviewed MI's application scenarios and noted that, compared to other related indices (including correlation coefficients), MI proves significantly more effective in handling nonlinear or high-dimensional data [22].
Regarding the relationship between MI and the correlation coefficient, when the relationship between two variables is primarily linear and (X,Y) follows a bivariate normal distribution [8]:
,where is the squared correlation coefficient.
The above formula indicates that MI and the correlation coefficient can exhibit similar relative magnitudes. This means that as the correlation coefficient increases, MI also becomes larger.
In summary, MI is an important tool for measuring the relationship between variables. It not only captures both linear and nonlinear relationships but also effectively handles high-dimensional and complex data, addressing the limitations of traditional correlation coefficients.
3. KIPGA Model
3.1. Development of KIPGA model
This study aims to integrate the Kano and IPGA models to develop a comprehensive framework, referred to as the Kano-IPGA (KIPGA) model. This framework will enable the simultaneous identification of service quality attribute types, key service quality attributes requiring improvement, and their prioritized improvement order. However, since the Kano model is nonlinear while the IPGA model is based on a linear approach, this study will use Mutual Information (MI) to modify the IPGA model.
Since the IPGA model calculates Relative Importance (RI) and Relative Performance (RP). In the calculation,
where represents the importance of the i-th service quality attribute, and represents the average importance of the service quality attributes. The calculation of Relative Performance (RP) is as follows:

Table 2.
Rules for Calculating Relative Performance (RP).
| Importance and Performance Analysis of Attribute i | Results of the Paired Sample t-test | Calculation of RP Value |
| Significance (p<0.05) | ||
| Significance (p<0.05) | ||
| or | Non-significance (p>0.05) | 0 |
Note: The performance of attribute i is , and its importance is . The average performance of all attributes is .
This study will retain the Relative Performance (RP) of the IPGA model while modifying the Relative Importance (RI). The revised model is explained as follows:
Let represent the influence of the i-th attribute on the target performance (e.g., overall satisfaction), which corresponds to the mutual information value (MI) between the i-th attribute and the target performance. That is
where is represents the evaluation of the i-th attribute; represents the target performance (e.g., overall satisfaction).
The value is used to replace the importance measure in the IPGA model. Combined with the Kano two-dimensional quality categories, this study calculates the Relative Importance (RI) value as follows:
-
Performance Quality: When the i-th attribute is a performance quality, its relative importance (RI) is as follows:where represents the average Mutual Information (MI) between all attributes belonging to the performance quality category and the target value, expressed as ,where P: the set of performance quality attributes, denotes the number of elements in the set P.
- Excitement Quality: When the i-th attribute is an excitement quality and its performance is greater than or equal to 0 (), the relative importance of this attribute is as follows:where E: the set of quality attributes, >0.
The reason for selecting : It is primarily to ensure better representation in the two-dimensional matrix. When the attribute belongs to the excitement quality category and its performance is greater than or equal to 0, it indicates that quality improvement at this stage can yield higher benefits. This signifies that its relative importance is higher than all performance quality attributes. For attributes that also belong to the excitement quality category, to facilitate visualization in the matrix while still reflecting the differences in their impact on the target, their values are normalized (unitized) towards 1.
- 3.
- Basic Quality: When the i-th attribute is a basic quality and its performance is less than 0 (), the relative importance of this attribute is as follows:where B: the set of ,>0.
The reason for selecting is the same as that for , which is also for the visualization of the two-dimensional matrix coordinates. When the attribute belongs to the basic quality category and its performance is less than 0, failing to improve its quality could cause a significant negative impact on the target. This signifies that its relative importance is higher than all performance quality attributes. For attributes that also belong to the basic factor category, to facilitate visualization in the matrix while still reflecting the differences in their impact on the target, their values are normalized (unitized) towards 1.
- 4.
- Basic Quality: When the i-th attribute is a basic quality and its performance is greater than or equal to 0 (), the relative importance of this attribute is as follows:where B: the set of , >0.
The reason for selecting : is the same as that for and . When an attribute belongs to the basic quality category and its performance is greater than or equal to 0, quality improvements will have only a minimal impact on the target. This indicates that its relative importance is lower than all performance quality attributes. For attributes within the basic quality category, normalization is applied to facilitate visualization in the matrix while still reflecting differences in their impact on the target. This formula indicates that the greater the difference between the MI value of this attribute and the maximum MI value, the lower its relative importance.
- 5.
- Excitement Quality: When the i-th attribute is an excitement quality and its performance is less than 0 (), the relative importance of this attribute is as follows:where E: the set of , >0.
The reason for selecting : is the same as that for , and . When an attribute belongs to the attractive quality category and its performance is less than 0, improving this quality attribute will have only a minimal impact on the target. This indicates that its relative importance is lower than all performance factors. For attributes within the excitement quality category, normalization is applied to facilitate visualization in the matrix while still reflecting differences in their impact on the target. This formula indicates that the greater the difference between the MI value of this attribute and the maximum MI value, the lower its relative importance.
The mathematical model summarizing the above explanation is as follows:
where P: , B: the set of basic , E: the set of excitement q;, , is represents the evaluation of the i-th attribute, ; represents the target performance, .
3.2. Strategic Matrix Management Implications of the KIPGA Model
Based on the KIPGA model, this study divides the two-dimensional coordinates into eight regions. The strategic matrix diagram uses (0,1) as the center point, with relative performance (RP) as the X-axis and relative importance (RI) as the Y-axis. Two parallel dashed lines are added (line1 : 、line2 : ) to create an eight-region strategic matrix diagram, as shown in Figure 1.
The management strategies for the eight regions are described as follows:
Quadrant I: This quadrant consists of high relative importance and positive performance attributes. Based on its strategic implications, it is further divided into two regions.
(1) Innovation & Competitive Advantage (Upper Region of Quadrant I)
Attributes in this region belong to the excitement quality category for strategic objectives. This means that investing resources in these attributes yields a positive nonlinear effect, generating significantly greater benefits than other attributes. As a result, these attributes exhibit high relative importance. Additionally, customers currently rate these attributes higher than their expectations, reflecting a positive performance. This indicates that customers are already perceiving the company’s efforts in these areas. Thus, attributes in this quadrant can be regarded as competitive advantage factors, and companies should continue investing in them. If resources are sufficient, further investment in these attributes will enhance differentiation and competitiveness.
(2) Maintain Excellence (Lower Region of Quadrant I)
Attributes in this region belong to the performance quality category for strategic objectives. This means that investing resources in these attributes yields a positive linear effect, generating relatively higher benefits compared to other attributes (except for Innovation & Competitive Advantage attributes).. Consequently, these attributes have high relative importance. Additionally, customers currently rate these attributes higher than their expectations, indicating positive performance. Managers should continue maintaining the current level of investment, while service providers should consistently monitor their performance to ensure sustained quality.
Quadrant II: This quadrant consists of attributes with high relative importance and. negative performance. Based on its strategic implications, it is further divided into two regions.
(3) Critical Improvement (Upper Region of Quadrant II)
Attributes in this region belong to the basic quality category for strategic objectives. However, customers currently rate these attributes lower than their expectations, indicating negative performance. This indicates that customers perceive the provided level of these attributes as insufficient. Additionally, investment in this region yields nonlinear effects, meaning that improving these attributes will generate significantly greater benefits than other attributes, making them highly important. Therefore, attributes in this quadrant should be regarded as key priority monitoring attributes, requiring increased investment and improvement until customers rate them above their expectations, achieving positive performance. This region is the top priority for improvement.
(4) Enhanced Improvement (Lower Region of Quadrant II)
Attributes in this region belong to the performance quality category for strategic objectives. This indicates that resource investment has a positive linear effect on the target, generating relatively higher benefits compared to other attributes (except for Critical Improvement attributes). However, customers currently rate these attributes lower than their expectations, indicating negative performance. This means that customers perceive the provided level of these attributes as insufficient. Therefore, additional resources should be allocated to improve these attributes until customer ratings exceed expectations and reach positive performance.
Quadrant III: This quadrant consists of attributes with low relative importance and negative performance. Based on its strategic implications, it is further divided into two regions.
(5) Complementary Improvement (Upper Region of Quadrant III)
Attributes in this region belong to the performance quality category for strategic objectives. This means that resource investment in these attributes yields a positive linear effect, but the benefits generated are relatively low. As a result, these attributes have low relative importance. However, customers currently rate these attributes lower than their expectations, indicating negative performance. This indicates that customers perceive the provided level of these attributes as insufficient. Therefore, resource allocation to improve these attributes should only be considered after higher-priority attributes have been addressed. Once improvements in more important areas are completed, additional resources can be invested in this region until customer ratings exceed expectations and achieve positive performance.
(6) Deferred Investment (Lower Region of Quadrant III)
Attributes in this region belong to the excitement quality category for strategic objectives. This means that resource investment in these attributes yields a positive nonlinear effect. However, customers currently rate these attributes lower than their expectations, indicating negative performance. This indicates that customers have not yet perceived the company’s development efforts in these areas. Although the benefits generated by improving these attributes are higher, these attributes have not been a major focus in the past, meaning that significant resource investment would be required for improvement. From the perspective of resource allocation order, these attributes have low relative importance. Therefore, after addressing higher-priority attributes, companies may consider investing resources in these attributes if additional capacity is available.
Quadrant IV: This quadrant consists of attributes with low relative importance and. positive performance. Based on its strategic implications, it is further divided into two regions.
(7) Potential Overinvestment (Upper Region of Quadrant IV)
Attributes in this region belong to the performance quality category for strategic objectives. This means that resource investment in these attributes yields a positive linear effect, but the benefits generated are relatively low. Customers rate these attributes as meeting their expectations, indicating positive performance. This means that customers already perceive the provided level of these attributes as sufficient. Therefore, managers should evaluate whether these services are at risk of oversupply. However, continuous monitoring is necessary to ensure performance does not decline, and resource adjustments should be made if needed.
(8) Surplus Investment (Lower Region of Quadrant IV)
Attributes in this region belong to the basic quality category for strategic objectives. Customers rate these attributes as meeting their expectations, indicating positive performance. This means that customers already perceive the provided level of these attributes as sufficient. At this stage, additional resource investment in these attributes would generate significantly lower benefits compared to other attributes. Therefore, managers should evaluate whether these services are already overinvested, and resource adjustments should be made if necessary.
3.3. Priority of Resource Adjustment
In the KIPGA strategic matrix, Quadrant II represents the primary improvement area. Quadrant II is further divided into Critical Improvement and Enhanced Improvement. The following section explains the priority order for resource adjustments in these two key regions.
(1) Critical Improvement
For the Critical Improvement Region, this study identifies the intersection point of the x1 line with the y-axis in the KIPGA strategic matrix, where . When the coordinate of attribute k in this region is , the standardized distance between and is calculated using the following formula:
where CI represents the Critical Improvement Region in Quadrant II. The larger this value, the higher the priority of this attribute for improvement.
(2) Enhanced Improvement
For the Enhanced Improvement Region, when the coordinate of attribute k in this region is , the standardized distance between and the coordinate center point is calculated using the following formula:
where EI represents the Enhanced Improvement Region in Quadrant II. The larger this value, the higher the priority of this attribute for improvement in the region.
4. Empirical Analysis
This study aims to enhance the continuous use of online insurance systems in Taiwan by conducting an empirical analysis of KIPGA service quality categories and improvement strategies. In this research, the E-S-QUAL mobile service quality scale was used as a foundation [21,24]. Additionally, key functions of various online insurance platforms in Taiwan and the characteristics of insurance services were integrated to develop a service quality scale for online insurance systems. This scale consists of 9 dimensions with a total of 26 attributes, including: Efficiency (3 attributes), Fulfillment (4 attributes), System Availability (2 attributes), Privacy and Security (3 attributes), Responsiveness (2 attributes), Compensation (2 attributes), Contact (3 attributes), Personalization (5 attributes) and Tangibility (2 attributes). Table 3 provides detailed information.
The research participants are Taiwanese individuals who have previously used online insurance systems. This study adopts a 5-point Likert scale for measurement, followed by data collection through an online survey. A total of 357 valid responses were collected, evaluating the importance and satisfaction of all quality attributes, as well as users' willingness to continue using the system.
For the importance scale, the Cronbach’s α of each dimension ranged from 0.686 to 0.939, with standardized factor loadings > 0.5 and average variance extracted (AVE) > 0.5. For the satisfaction scale, the Cronbach’s α of each dimension ranged from 0.880 to 0.969, with standardized factor loadings > 0.5 and AVE > 0.5. These results indicate that the questionnaire demonstrates good reliability and validity.
This study analyzes the collected data following these steps:
Step 1. Use Formula (1) and Table 1 to perform moderated regression analysis and determine the Kano two-dimensional quality categories. (set m=3)
Step 2. Calculate MI values using Formula (2).
Step 3. Use Table 2 to calculate the performance gap and RP values.
Step 4. Calculate RI values using Formula (3). (set )
Step 5. Using Figure 2, the category of the KIPGA strategic matrix is determined based on Kano two-dimensional quality categories and the RP and RI values of service quality attributes.
The analysis results are summarized in the table below. These results indicate that the service quality categories aimed at enhancing the continuous use of online insurance systems in Taiwan include three types: basic factors, performance factors, and indifferent factors, as shown in Table 4. Furthermore, the main critical improvement factors, enhanced improvement factors, and their improvement priorities are summarized in Table 5.
From Table 4, it can be seen that the service quality categories aimed at enhancing the continuous use of the online insurance system include the following as Basic Quality Attributes: "Easy to use" under Efficiency, "Stable system without crashes" under System Usability, "Refunds available in case of insurance errors due to system" under Compensation, "Online intelligent customer service available" under Contact, "Provides personalized professional insurance information," "Offers policy health check service," and "Provides personalized historical insurance records" under Personalization, and "Visually appealing interface" under Tangibility. Additionally, "Provides clear error messages when issues occur" under Responsiveness is classified as an Indifferent Quality Attribute Apart from this, the remaining attributes are classified as Performance Quality Attributes.
According to the KIPGA analysis results, eight attributes fall into the Critical Improvement Region, and another eight attributes fall into the Enhanced Improvement Region. Using Formula (4) and (5), the distances and can be calculated. Based on these distances, the priority order for improvement is summarized in the table below. The analysis results indicate that, to enhance the continuous use of online insurance systems by Taiwanese users, the top three service quality attributes are "Online intelligent customer service available" under Contact, "Offers policy health check service" under Personalization, and "Provides personalized historical insurance records" under Personalization.
5. Discussion and Conclusion
In service quality research, the Kano model classifies service attributes into different quality categories, making it an essential tool for analyzing customer service needs [7]. Additionally, in identifying service quality deficiencies, the IPGA model integrates IPA and Gap Analysis to identify service quality deficiencies that require improvement [11]. Among these two models, the Kano model considers a nonlinear approach, while the IPGA model adopts a linear approach. Therefore, to integrate the Kano model and the IPGA model for simultaneously analyzing Kano’s two-dimensional quality categories and identifying service quality deficiencies, model adjustments are necessary. In response to this, this study introduces mutual information to calculate the RI value and develops an integrated model combining the Kano model and the IPGA model. This integrated model is referred to as the KIPGA model in this study.
In the KIPGA model, this study first applies the moderated regression model proposed by Lin et al. to identify the Kano two-dimensional quality categories [12]. Next, based on their classification within the Kano model, Mutual Information (MI) is introduced to calculate the relative importance (RI) value. At the same time, the original IPGA model is used to compute the relative performance (RP) value. Finally, the obtained coordinates are used to plot the KIPGA matrix, which is then divided into eight different regions, each assigned a distinct management strategy. The following section details the execution steps of this process.
Step 1. Use Formula (1) and Table 1 to perform moderated regression analysis and determine the Kano two-dimensional quality categories. (In Formula (1), m represents the moderate evaluation value. For example, in a five-point Likert scale, m can be set to 3 or the median of all data values.)
Step 2. Calculate Mutual Information (MI) values using Formula (2).
Step 3. Use Table 2 to calculate the performance gap and Relative Performance (RP) values.
Step 4. Calculate Relative Importance (RI) values using Formula (3). ( can be any positive value. However, for ease of visualization in the KIPGA matrix, it is recommended to set )
Step 5. Using Figure 2, the category of the KIPGA strategic matrix is determined based on Kano two-dimensional quality categories and the RP and RI values of service quality attributes.
Based on the analysis from the above steps, this study categorizes the KIPGA matrix into the following eight categories: (1) Innovation & Competitive Advantage (Upper Region of Quadrant I); (2) Maintain Excellence (Lower Region of Quadrant I); (3) Critical Improvement (Upper Region of Quadrant II);(4) Enhanced Improvement (Lower Region of Quadrant II); (5) Complementary Improvement (Upper Region of Quadrant III); (6) Deferred Investment (Lower Region of Quadrant III); (7) Potential Overinvestment (Upper Region of Quadrant IV); (8) Surplus Investment (Lower Region of Quadrant IV).
Among the eight categories mentioned above, the highest priority improvement region is the Critical Improvement Region. This region represents Basic Quality, where performance does not meet customer expectations. To further analyze the improvement priority within this region, Formula (4) can be used to calculate the standardized distance between the attribute’s coordinate and (0, a), where (0, a) is the intersection point of the x₁ line with the y-axis in the KIPGA strategic matrix. Additionally, the second priority improvement region is the Enhanced Improvement Region. This region represents Performance Quality, where performance also fails to meet customer expectations. To further analyze the priority for improvement within this region, Formula (5) can be used to calculate the standardized distance between the attribute’s coordinate and the coordinate center point (0,1). The larger the distance value, the higher the improvement priority.
After establishing the model, this study further conducts an empirical analysis of the KIPGA model with the objective of enhancing the continuous use of online insurance systems in Taiwan. The research findings confirm that the KIPGA model can effectively classify service quality factors into different Kano two-dimensional quality categories while identifying the key factors that require improvement. Furthermore, the model can analyze and determine the priority order for improvement.
Overall, previous service quality research has primarily focused either on identifying Kano two-dimensional quality categories or detecting service quality deficiencies. In contrast, this study differs from past research by not only integrating the Kano model with the IPGA model, which identifies service quality deficiencies, but also considering the differences between the two models. By incorporating Mutual Information (MI), this study successfully integrates the Kano model and the IPGA model, establishing the KIPGA model. This integrated model can accurately classify service quality attributes into Kano two-dimensional quality categories while also identifying the key factors requiring improvement and determining their priority for enhancement. The KIPGA model provides a valuable reference for service quality managers to develop service quality strategies and address service quality deficiencies effectively under limited resource conditions.
References
- Berger, C. , Blauth, R., Boger, D., & Bolster, C. Kano’s methods for understanding customer-defined quality. The Center for Quality Management Journal 1993, 2, 3–36. [Google Scholar]
- Cheng, C. C. , Chang, Y. Y., Tsai, M. C., Chen, C. T., & Tseng, Y. C. An evaluation instru- ment and strategy implications of service attributes in LOHAS restaurants. International Journal of Contemporary Hospitality Management 2019, 31, 194–216. [Google Scholar]
- Deng, W.J. Using a revised importance-performance analysis approach: The case of Taiwanese hot springs tourism. Tourism Management 2007, 28, 1274–1284. [Google Scholar] [CrossRef]
- Cover, T. M. , & Thomas, J. A. Entropy, relative entropy and mutual information. Elements of information theory 1991, 2, 12–13. [Google Scholar]
- Deng, W. Using a revised importance–performance analysis approach: The case of Taiwanese hot springs tourism. Tourism management 2007, 28, 1274–1284. [Google Scholar] [CrossRef]
- Dionisio, A. , Menezes, R., & Mendes, D. A. Mutual information: a measure of dependency for nonlinear time series. Physica A: Statistical Mechanics and its Applications 2004, 344, 326–329. [Google Scholar]
- Kano, N. , Seraku, N., Takahashi, F., & Tsuji, S. Attractive quality and must-be quality. The Journal of the Japanese Society for Quality Control 1984, 14, 39–48. [Google Scholar]
- Kraskov, A. , Stögbauer, H., & Grassberger, P. Estimating mutual information. Physical Review E—Statistical, Nonlinear, and Soft Matter Physics 2004, 69, 066138. [Google Scholar]
- Laarne, P. , Amnell, E., Zaidan, M. A., Mikkonen, S., & Nieminen, T. Exploring non-linear dependencies in atmospheric data with mutual information. Atmosphere 2022, 13, 1046. [Google Scholar]
- Lin, S. P. , & Chan, Y. H. Enhancing service quality improvement strategies by integrating Kano’s model with importance-performance analysis. International Journal of Services Technology and Management 2011, 16, 28–48. [Google Scholar]
- Lin, S. P. , Chan, Y. H., & Tsai, M. C. A transformation function corresponding to IPA and gap analysis. Total Quality Management & Business Excellence 2009, 20, 829–846. [Google Scholar]
- Lin, S. P. , Yang, C. L., Chan, Y. H., & Sheu, C. Refining Kano's ‘quality attributes–satisfaction’model: A moderated regression approach. International journal of production economics 2010, 126, 255–263. [Google Scholar]
- Matzler, K. , & Hinterhuber, H. H. How to make product development projects more successful by integrating Kano’s model of customer satisfaction into quality function deployment. Technovation 1998, 18, 25–38. [Google Scholar]
- Martilla, J. A. , & James, J. C. Importance-Performance Analyses. Journal of Marketing 1977, 41, 77–79. [Google Scholar]
- Matzler, K. , & Sauerwein, E. The factor structure of customer satisfaction: An empirical test of the importance grid and the penalty-reward-contrast analysis. International Journal of Service Industry Management 2002, 13, 314–332. [Google Scholar]
- Parasuraman, A. , Zeithaml, V. A., & Berry, L. L. A Conceptual model of service quality and Its implications for future research. Journal of Marketing 1985, 49, 41–50. [Google Scholar]
- Shahin, A. , Pourhamidi, M., Antony, J., & Hyun Park, S. Typology of Kano models: A critical review of literature and proposition of a revised model. International Journal of Quality & Reliability Management 2020, 37, 685–717. [Google Scholar]
- Tarrant, M. A. , & Smith, E. K. The use of a modified importance–performance framework to examine visitor satisfaction with attributes of outdoor recreation settings. Managing Leisure 2002, 7, 69–82. [Google Scholar]
- Thomas, M. T. C. A. J. , & Joy, A. T. (2006). Elements of Information Theory. Wiley-Interscience. chapter8.
- Tonge, J. , & Moore, S. A. Importance-satisfaction analysis for marine-park hinterlands: A western Australian case study. Tourism Management 2007, 28, 768–776. [Google Scholar]
- Tsai, M. C. , Chien, Y. Y., & Cheng, C. C. Upgrading service quality of mobile banking. International Journal of Mobile Communications 2018, 16, 82–115. [Google Scholar]
- Vergara, J. R. , & Estévez, P. A. A review of feature selection methods based on mutual information. Neural Computing and Applications 2014, 24, 175–186. [Google Scholar]
- Young, A. L. , van den Boom, W., Schroeder, R. A., Krishnamoorthy, V., Raghunathan, K., Wu, H. T., & Dunson, D. B. Mutual information: Measuring nonlinear dependence in longitudinal epidemiological data. Plos One 2023, 18, e0284904. [Google Scholar]
- Zeithaml, V.A. , Parasuraman, A. and Malhotra, A. ‘Service quality delivery through websites: a critical review of extant knowledge. Journal of the Academy of Marketing science 2002, 30, 62–375. [Google Scholar] [CrossRef]
Figure 1.
IPGA matrix diagram.
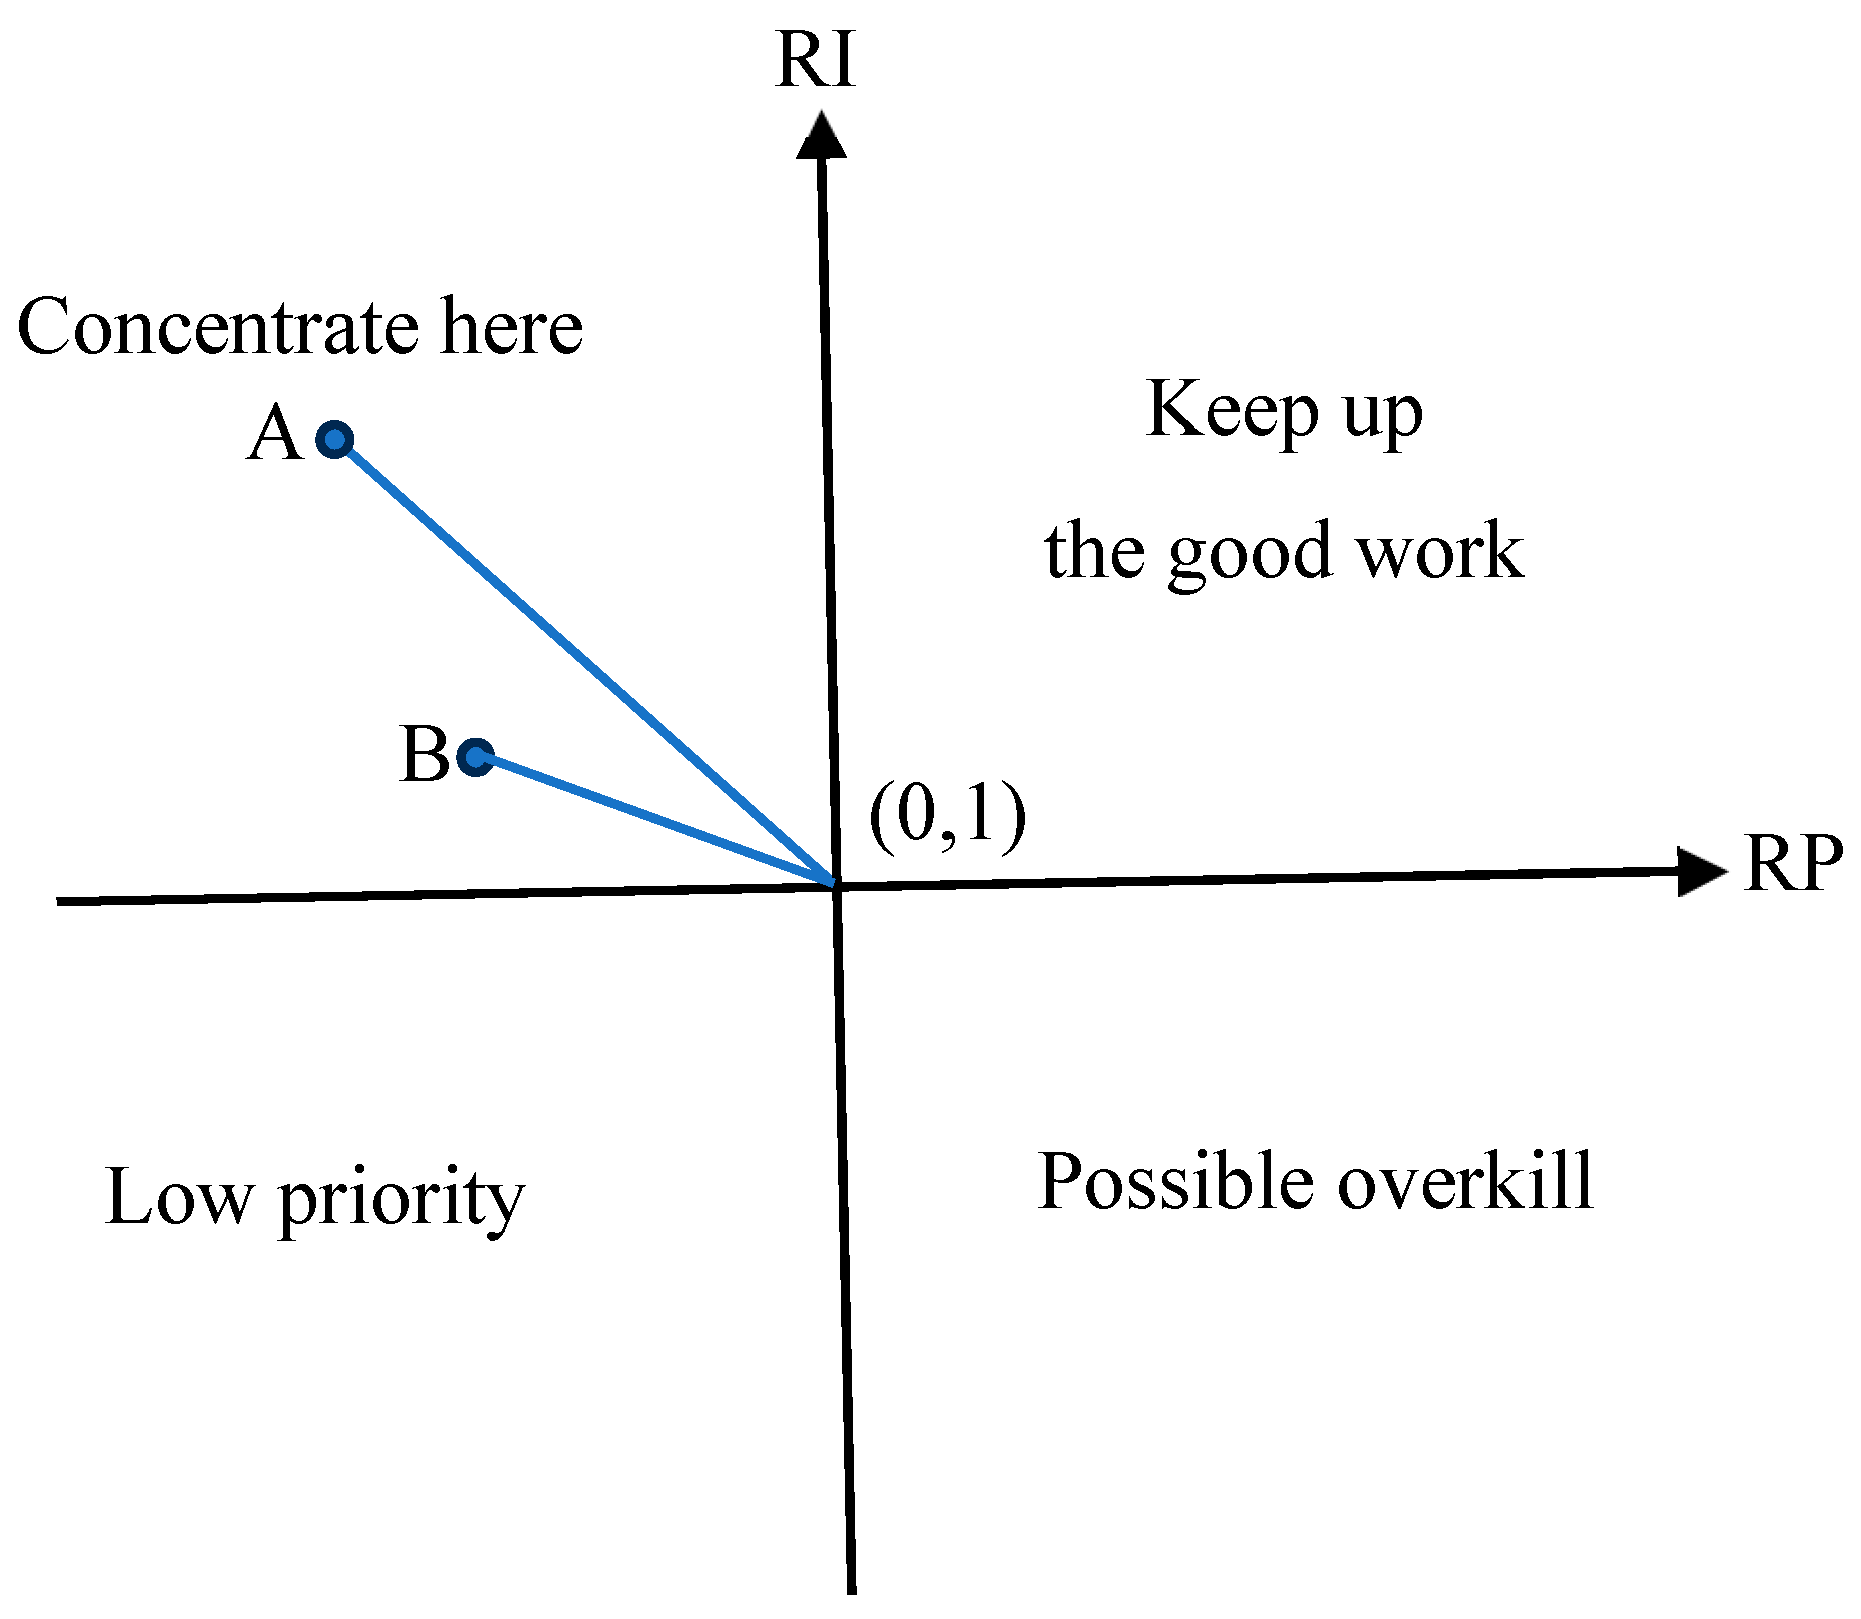
Figure 2.
KIPGA strategic matrix.
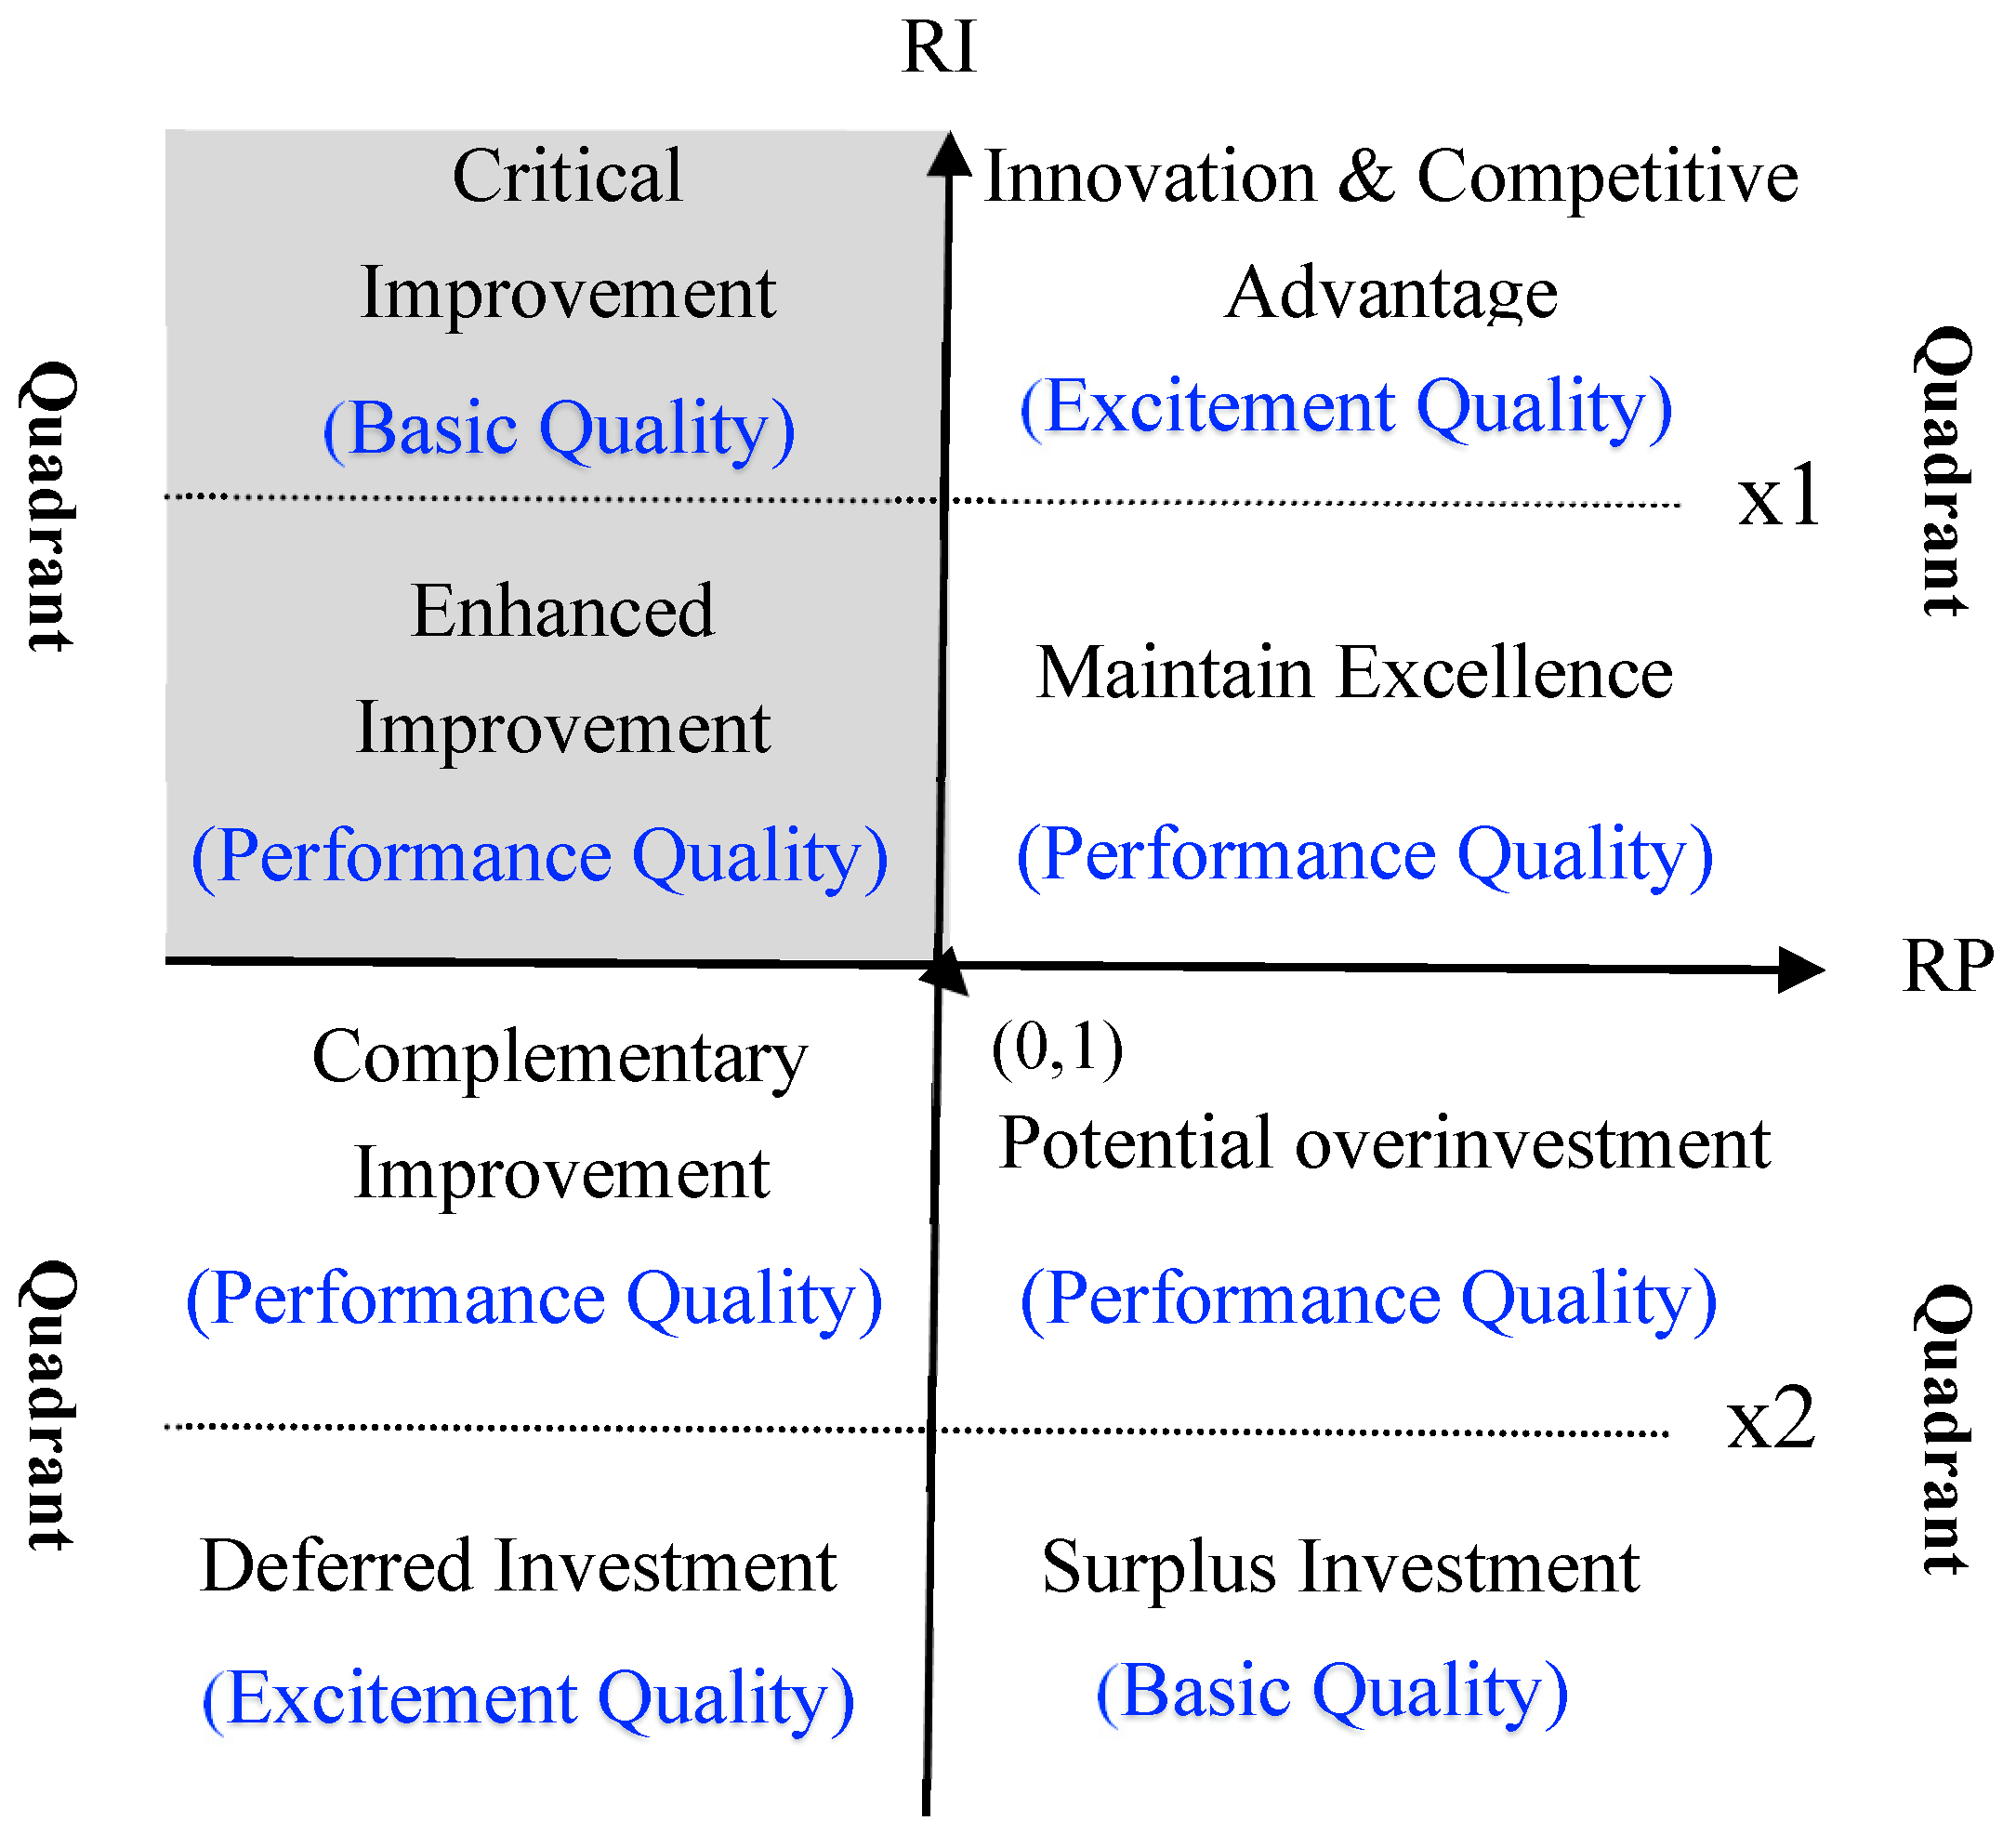
Table 1.
Classification of Factors Identified through Moderated Regression Analysis.
| Factor Category | Excitement Quality | Basic Quality |
Performance Quality | Indifferent Quality | Reverse Quality |
| >0 | <0 | =0 | =0 | =0 | |
| any value | any value | >0 | =0 | <0 |
Table 3.
KIPGA Analysis for Enhancing the Continuous Use of Online Insurance Systems.
| Dimension | Attribute | Code | Quality Category | Perfor-mance gap | MI | RP | RI | KIPGA matrix |
| Efficiency | Available at any time | EF1 | P | NS | 0.202 | 0.000 | 0.923 | CPI |
| Easy to use | EF2 | B | Neg | 0.194 | -0.999 | 1.371 | CI | |
| Fast completion of the insurance process | EF3 | P | Neg | 0.199 | -0.997 | 0.909 | CPI | |
| Fulfillment | Real-time and accurate insurance information | PF1 | P | Neg | 0.227 | -0.985 | 1.037 | EI |
| Complete insurance information | PF2 | P | Neg | 0.204 | -0.994 | 0.932 | CPI | |
| Comprehensive insurance application process | PF3 | P | Neg | 0.200 | -0.985 | 0.914 | CPI | |
| Comprehensive claims process and details | PF4 | P | Neg | 0.171 | -0.993 | 0.781 | CPI | |
| System Usability | System operates normally | SA1 | P | Neg | 0.211 | -0.985 | 0.964 | CPI |
| Stable system without crashes | SA2 | B | Neg | 0.190 | -1.002 | 1.370 | CI | |
| Privacy and Security | Secure password and key login mechanism | PS1 | P | Neg | 0.199 | -0.973 | 0.909 | CPI |
| Secure and fast biometric login mechanism | PS2 | P | Neg | 0.199 | -0.994 | 0.909 | CPI | |
| Information security management mechanism | PS3 | P | Neg | 0.220 | -0.968 | 1.005 | EI | |
| Responsiveness | Provides clear error messages when issues occur | RE1 | IN | Neg | 0.231 | -0.994 | 0.000 | --- |
| Quickly responds with solutions when problems arise | RE2 | P | Neg | 0.225 | -0.995 | 1.028 | EI | |
| Compensation | Refunds available in case of insurance errors due to system malfunction | CP1 | B | Neg | 0.217 | -0.998 | 1.380 | CI |
| Compensation available for losses caused by system malfunctions | CP2 | P | Neg | 0.202 | -0.999 | 0.923 | CPI | |
| Contact | Customer service email provided | CT1 | P | Neg | 0.224 | -1.019 | 1.023 | EI |
| Telephone customer service hotline available | CT2 | P | Neg | 0.242 | -1.004 | 1.106 | EI | |
| Online intelligent customer service available | CT3 | B | Neg | 0.247 | -1.036 | 1.393 | CI | |
| Personalization | Provides personalized professional insurance information | PE1 | B | Neg | 0.224 | -1.011 | 1.383 | CI |
| Offers a personalized user interface | PE2 | P | Neg | 0.283 | -1.005 | 1.293 | EI | |
| Provides insurance needs estimation function | PE3 | P | Neg | 0.249 | -0.999 | 1.138 | EI | |
| Offers policy health check service | PE4 | B | Neg | 0.240 | -1.008 | 1.390 | CI | |
| Provides personalized historical insurance records | PE5 | B | Neg | 0.231 | -1.006 | 1.386 | CI | |
| Tangibility | Visually appealing interface | TG1 | B | Neg | 0.248 | 0.000 | 1.393 | CI |
| Well-designed user experience | TG2 | P | Neg | 0.264 | 0.000 | 1.206 | EI |
Note. P: Performance Quality, B: Basic Quality, IN: Indifferent Quality; NS: Non-significance, Neg: Negative Performance; CI: Critical Improvement, EI: Enhanced Improvement, CPI: Complementary Improvement.
Table 4.
Service Quality Categories for Enhancing the Continuous Use of Online Insurance Systems.
| Quality Category | Basic Quality | Performance Quality | Nondifference Quality |
| Attribute | EF2, SA2, CP1, CT3, PE1, PE4, PE5, TG1 | EF1, EF3, PF1, PF2, PF3, PF4, SA1, PS1, PS2, PS3, RE2, CP2, CT1, CT2, PE2, PE3, TG2 | RE1 |
Table 5.
KIPGA Categories and Distances for Enhancing the Continuous Use of Online Insurance Systems.
Table 5.
KIPGA Categories and Distances for Enhancing the Continuous Use of Online Insurance Systems.
| CI (Critical Improvement) | EI (Enhanced Improvement) | ||||
| Item | Distances | Rank | Item | Distances | Rank |
| CT3 | 1.4113 | 1 | PE2 | 1.4045 | 9 |
| PE4 | 1.3724 | 2 | PE3 | 1.0866 | 10 |
| PE5 | 1.3457 | 3 | CT2 | 1.049 | 11 |
| PE1 | 1.33 | 4 | CT1 | 1.0032 | 12 |
| CP1 | 1.3016 | 5 | RE2 | 0.9806 | 13 |
| EF2 | 1.2417 | 6 | PF1 | 0.9749 | 14 |
| SA2 | 1.234 | 7 | PS3 | 0.9498 | 15 |
| TG1 | 1.0000 | 8 | TG2 | 0.7037 | 16 |
Disclaimer/Publisher’s Note: The statements, opinions and data contained in all publications are solely those of the individual author(s) and contributor(s) and not of MDPI and/or the editor(s). MDPI and/or the editor(s) disclaim responsibility for any injury to people or property resulting from any ideas, methods, instructions or products referred to in the content. |
© 2025 by the authors. Licensee MDPI, Basel, Switzerland. This article is an open access article distributed under the terms and conditions of the Creative Commons Attribution (CC BY) license (http://creativecommons.org/licenses/by/4.0/).
Copyright: This open access article is published under a Creative Commons CC BY 4.0 license, which permit the free download, distribution, and reuse, provided that the author and preprint are cited in any reuse.