Submitted:
17 February 2025
Posted:
18 February 2025
You are already at the latest version
Abstract
This research covers the application of machine learning algorithms in identifying best-selling products to enhance sales forecasting among SMEs. Given the limitations of operational scales and the poor derivation of insights from sales data by SMEs, this study adopts Decision Trees, Random Forest, Naïve Bayes, and Support Vector Machines with kernel functions in analyzing and classifying sales patterns. The results clearly illustrate the fact that the SVM model is better compared to other algorithms in product classification. By incorporating data-driven decision-making, this approach enables SMEs to achieve optimal inventory management, refine their marketing strategies, and enhance their overall business efficiency. Future work will be refining these models on larger datasets and exploring hybrid approaches that can give further enhancements in predictive performance.
Keywords:
SMEs
; Decision Trees
; Random Forest
; Naïve Bayes
; Support Vector Machines
1. Introduction
Small and Medium-sized Enterprises (SMEs) play a vital role in the highly competitive business environment of today, serving as key facilitators to economic development, driving job creation, innovations, and local economies. Nonetheless, despite their significance, SMEs frequently face unique hurdles in fine-tuning operations and achieving data-driven business decisions. A primary challenge rests in the detection and utilization of best-selling items to improve profits and maintain growth. Without visibility into which products are selling, SMEs run the risk of over-promoting lower-demand items or failing to take advantage of profitable product sales. The events can cause poor inventory management, ill-conceived campaigns as well as lost revenue[1,2,3,4]. This research proposal seeks to address these concerns by developing a data-based solution that can help SMEs identify their top-selling products. This solution primarily involves data analysis and machine learning techniques, especially Decision Tree, Random Forest, Naive Bayes, and SVM Kernel algorithms. Such tools will allow SMEs to derive insights on your sales data trends, patterns, and the differentiating factors that set similar products apart in terms of being best-sellers. Decision Trees will be performed to determine the attributes behind a successful product.
It will analyze seasonality, customer demographics, purchase history, and other attributes to pinpoint the top drivers of product performance. Collectively, they present an accessible and actionable solution for SMEs who do not have the resources to conduct large data analysis. Random Forest accompanies this and follows up on this by accumulating multiple decision trees for more robust predictions while reducing the risk of overfitting[5,6,7,8]. Naive Bayes offers a perspective in terms of probability, making it particularly useful for categorical data analysis, while the SVM Kernel algorithm excels at finding complex relationships within the data [9,10,11,12].
This project is not just about identifying which products sell best. Giving SMEs actionable insights clearly will enable them to make decisions on inventory optimization, and marketing campaign targeting and respond to customer demands now with much more agility. Consequently, this will lead to overall operational efficiency, increased customer satisfaction, and widened profit margins. For SMEs that typically have tighter margins, and far fewer minutes to spend on analysis this is not just a game-changer it is a potential survival solution [13,14,15,16,17,18]. Decision Tree, Random Forest, Naive Bayes, and SVM Kernel algorithms were the chosen models due to their success in similar use cases. These techniques are interpretable because they directly produce thresholds that put boundaries on the data time series and can throw out non-harmful events while preserving harmful ones in a few seconds so unlike many of the complex predictive models, SMEs know what they mean and how to act upon loss events. Moreover, they need less computational resources which also makes them perfect for businesses that cannot afford advanced infrastructure. The solution is made easy, affordable, and highly customizable to support the specific needs of SMEs seeking to upgrade their business intelligence capabilities [19,20,21].
2. Literature Review
Over the past years, great emphasis has been placed on studying methodologies for product demand estimates. Nowadays, with the emergence of e-commerce and other sales platforms, every business strategy is heavily dependent on data for the optimization of offerings. A detailed review of the conventional methods using sentiment analyses, revenue analysis, and some classification techniques, as well as a combined approach to identify best-selling products using Decision Tree, Random Forest, Naïve Bayes, and SVM Kernel algorithms, is presented herein [22,23,24].
One common technique used is the analysis of sales data to rank products by revenue generated. This approach calculates the total revenue for each product by multiplying its price by the quantity sold. The result is a ranking that enables a business to focus on items that generate the most income. For instance, in a dataset of pizza sales trends, a high-priced deluxe pizza may top the revenue rankings even though it sells less frequently than lower-priced options. This approach is helpful for financial planning and inventory management because it identifies those products that have the most significant monetary impact. However, revenue-based rankings can miss out on popular, lower-priced items that help drive customer satisfaction and loyalty. High-priced products often skew these rankings, making them less reflective of overall consumer preferences [25,26]
Another effective strategy is customer review and sentiment analysis, which examines textual comments and numerical ratings from customers. By analyzing feedback, businesses gain qualitative insights into the aspects of products that resonate most with buyers. For instance, NLP can help in identifying recurring themes in reviews, such as praise over product quality or complaints related to durability. Generally, those products that receive overwhelmingly positive ratings tend to realize higher sales, thus making this method useful in understanding consumer preferences. However, sentiment analysis is resource-intensive, requiring advanced computational tools and expertise that may not be accessible to all businesses [15,16,17,18,19]
This solution uses consumer reviews as an indicator of sales within that product. Votes from consumers provide a clear and reliable measure of consumer preference. Thus, it could be effective and efficient. Contrary to sentiment analysis, which makes use of some complex tools, and revenue-based ways that are distorted by the price of products, this method is simple and unbiased. Consumer votes give businesses unbiased measures where well-informed decisions can be taken regarding marketing and inventory management.
Here, the Decision Tree Analysis has been made into models generated as flowchart-like diagrams which can be used to classify data elements according to parameters such as type of product, volume of sales, and rating by customer votes. Decision Trees provide good pathways for capturing details because they can analyze several variables at once, with examples being price sensitivity and frequency of purchase. They are specifically useful in identifying best-selling products. However, without effective pruning methods, they may become unmanageable and complex when implemented with a very large dataset[20]
The Random Forest is simply an extension of Decision Trees that constructs numerous trees and amalgamates their predictions, hence improving accuracy as well as lessening overfitting. Such an approach serves gloriously in making product ranking reliable. Once again, with categorical data Naïve Bayes, the probabilistic classifier, performs effectively with quick analyses of consumer preference and demographic factors. Also, SVM Kernel algorithms work very well in detecting non-linear relationships and help in the discovery of intricate patterns that distinguish bestsellers from ordinary ones.
In this study, we implemented an amalgamation of these algorithms to identify the best-selling products available within the Zomato dataset. Decision Trees and Random Forest ranked products using customer votes obtained from the respective price band. Further, Naïve Bayes and SVM Kernel algorithms acted as add-on insights into the patterns and relationships found within the dataset.
As an example, the overall winner in this combined approach was Chicken Biryani, with 70,374 votes, followed closely by Mutton Biryani with 30,028; Mini Chicken Biryani came third with 28,080 votes. Thus, in using these algorithms, our approach came out free from revenue-based ranking biases, converting into useful insights for marketing strategies and inventory decisions[25,26]. Recent studies have demonstrated the effectiveness of deep learning techniques, particularly Convolutional Neural Networks (CNNs), in enhancing the automation of detection systems across various domains. These techniques have been successfully applied to tasks such as energy-efficient designs in image processing [27,28] and improving the performance of network protocols [29,30,31]. Additionally, machine learning approaches have been utilized for link prediction in dynamic networks, showcasing their ability to handle evolving data structures [32]. Moreover, advancements in deep learning have led to more robust and accurate models[33,34,35]. These methods underline the growing importance of AI-driven solutions in automating complex detection tasks, ensuring higher accuracy and efficiency in various real-time applications [36,37,38].
3. Analysis
- 1.
- Data Preprocessing
The process of data transformation before using it to create the model. Generally, every raw dataset may have some issues like missing values, outliers, scaling problem, meaningless data combination etc. This step is a very crucial part of Machine Learning as well as Data Analysis. For creating the most efficient algorithm, we need a complete dataset with least issues. Fundamentally, the mid-stages between obtaining the dataset and modeling are all parts of data preprocessing, converting unusable raw data to reliable and clean data. The main steps in data preprocessing are seven in number, and they are as follows:
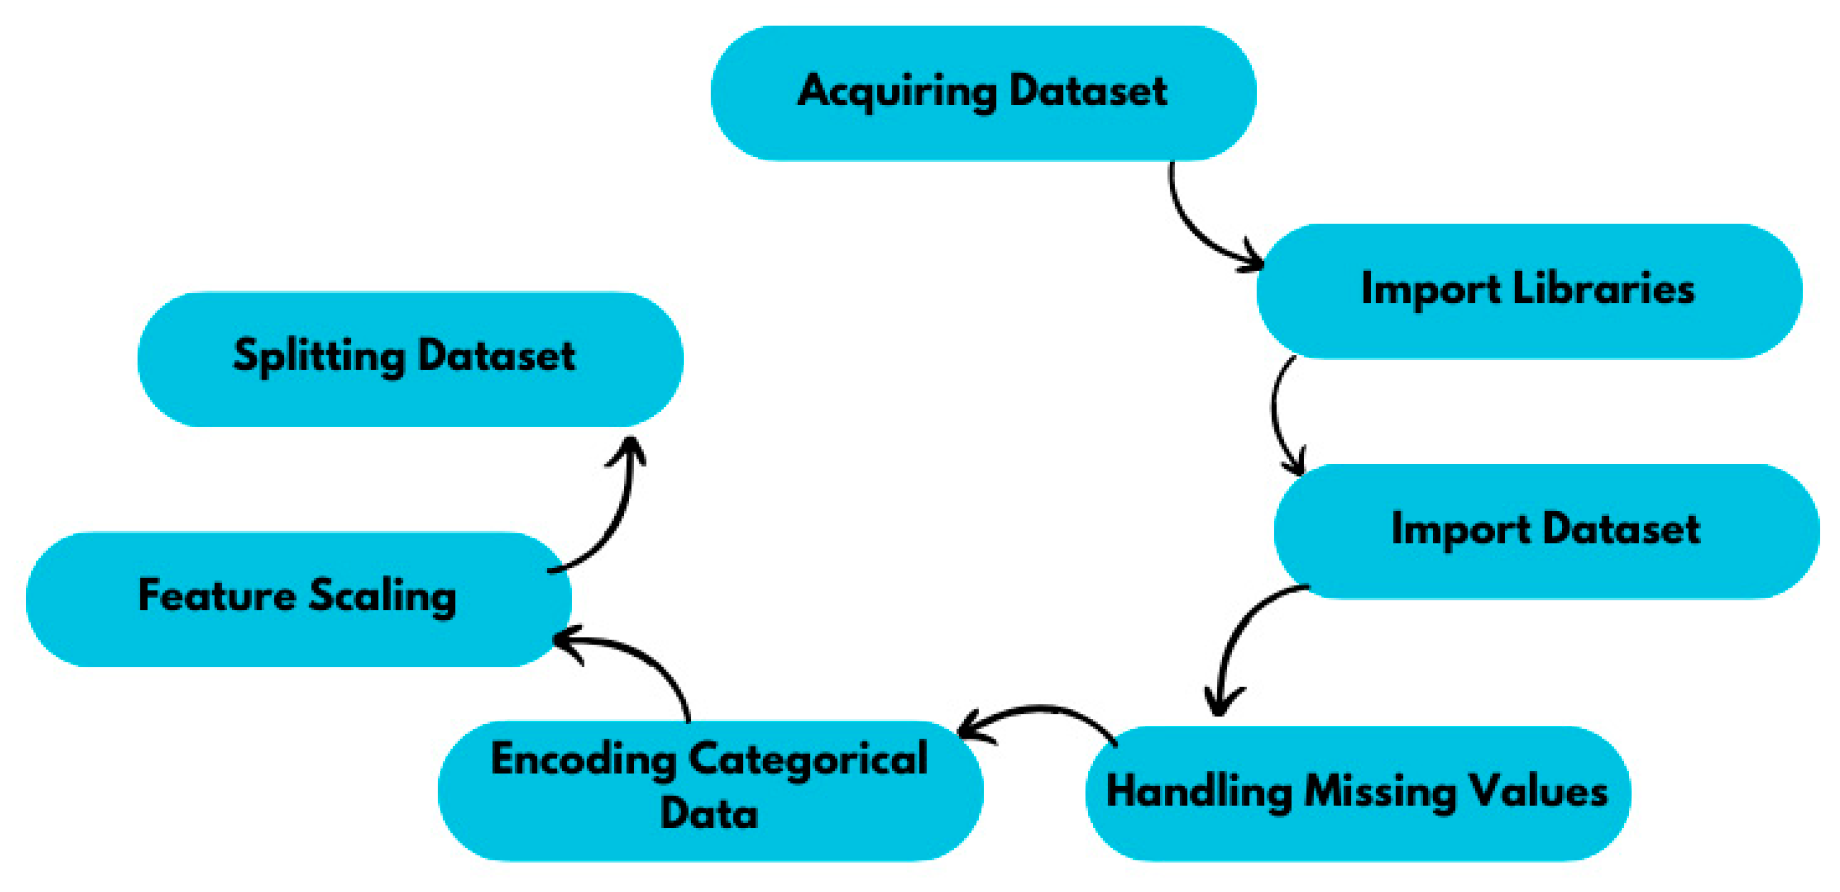
Figure 1.
Data Preprocessing Steps.
- 2.
- Obtaining the Dataset
Collecting the perfect dataset from a valid source is another important part of data preprocessing. To get the proper machine learning algorithm, finding and collecting the right dataset from an appropriate source is an essential part of it. Otherwise, the model and its purpose aren't fulfilled if proper data isn't collected or if it is not from a valid source. Thus, we evaluate to create an effective model by reaching a fixed target. the dataset by checking the required attributes and factors. For checking these details, exploratory data analysis comes out as a handy process to evaluate the dataset and get the overall features and limitations of the dataset.
- 3.
- Exploratory Data Analysis:
Data scientists use exploratory data analysis, which often employs data visualization techniques to inspect and study data sets and to summarize their main characteristics. EDA makes it easier for data scientists to find patterns, identify anomalies, test a hypothesis, or verify assumptions by helping you decide how to best change your data sources to get the answers you need. EDA gives a greater familiarity with the variables in the dataset and their relationships, and it is mainly applied to explore what data can reveal beyond the formal modelling or hypothesis testing brief. It may also help you to assess the suitability of the statistical techniques that you are considering using to analyse the data. It is by IBM, n.d.
- Dataset Overview

Table 1.
Dataset Overview.
| Value | |
| Number of Rows | 240 |
| Number of Columns | 7 |
| Column Names | TARIKH, PERKARA, BELIAN, BONUS PRODUK, JUALAN, STOCK, Source_Sheet |
- Column Data Types
Table 2.
Column Data Types.
| Column | Non-Null Count | Data Type |
| TARIKH | 98 | datetime64[ns] |
| PERKARA | 237 | object |
| BELIAN | 81 | float64 |
| BONUS PRODUK | 6 | object |
| JUALAN | 87 | float64 |
| STOCK | 130 | object |
| SOURCE SHEET | 240 | object |
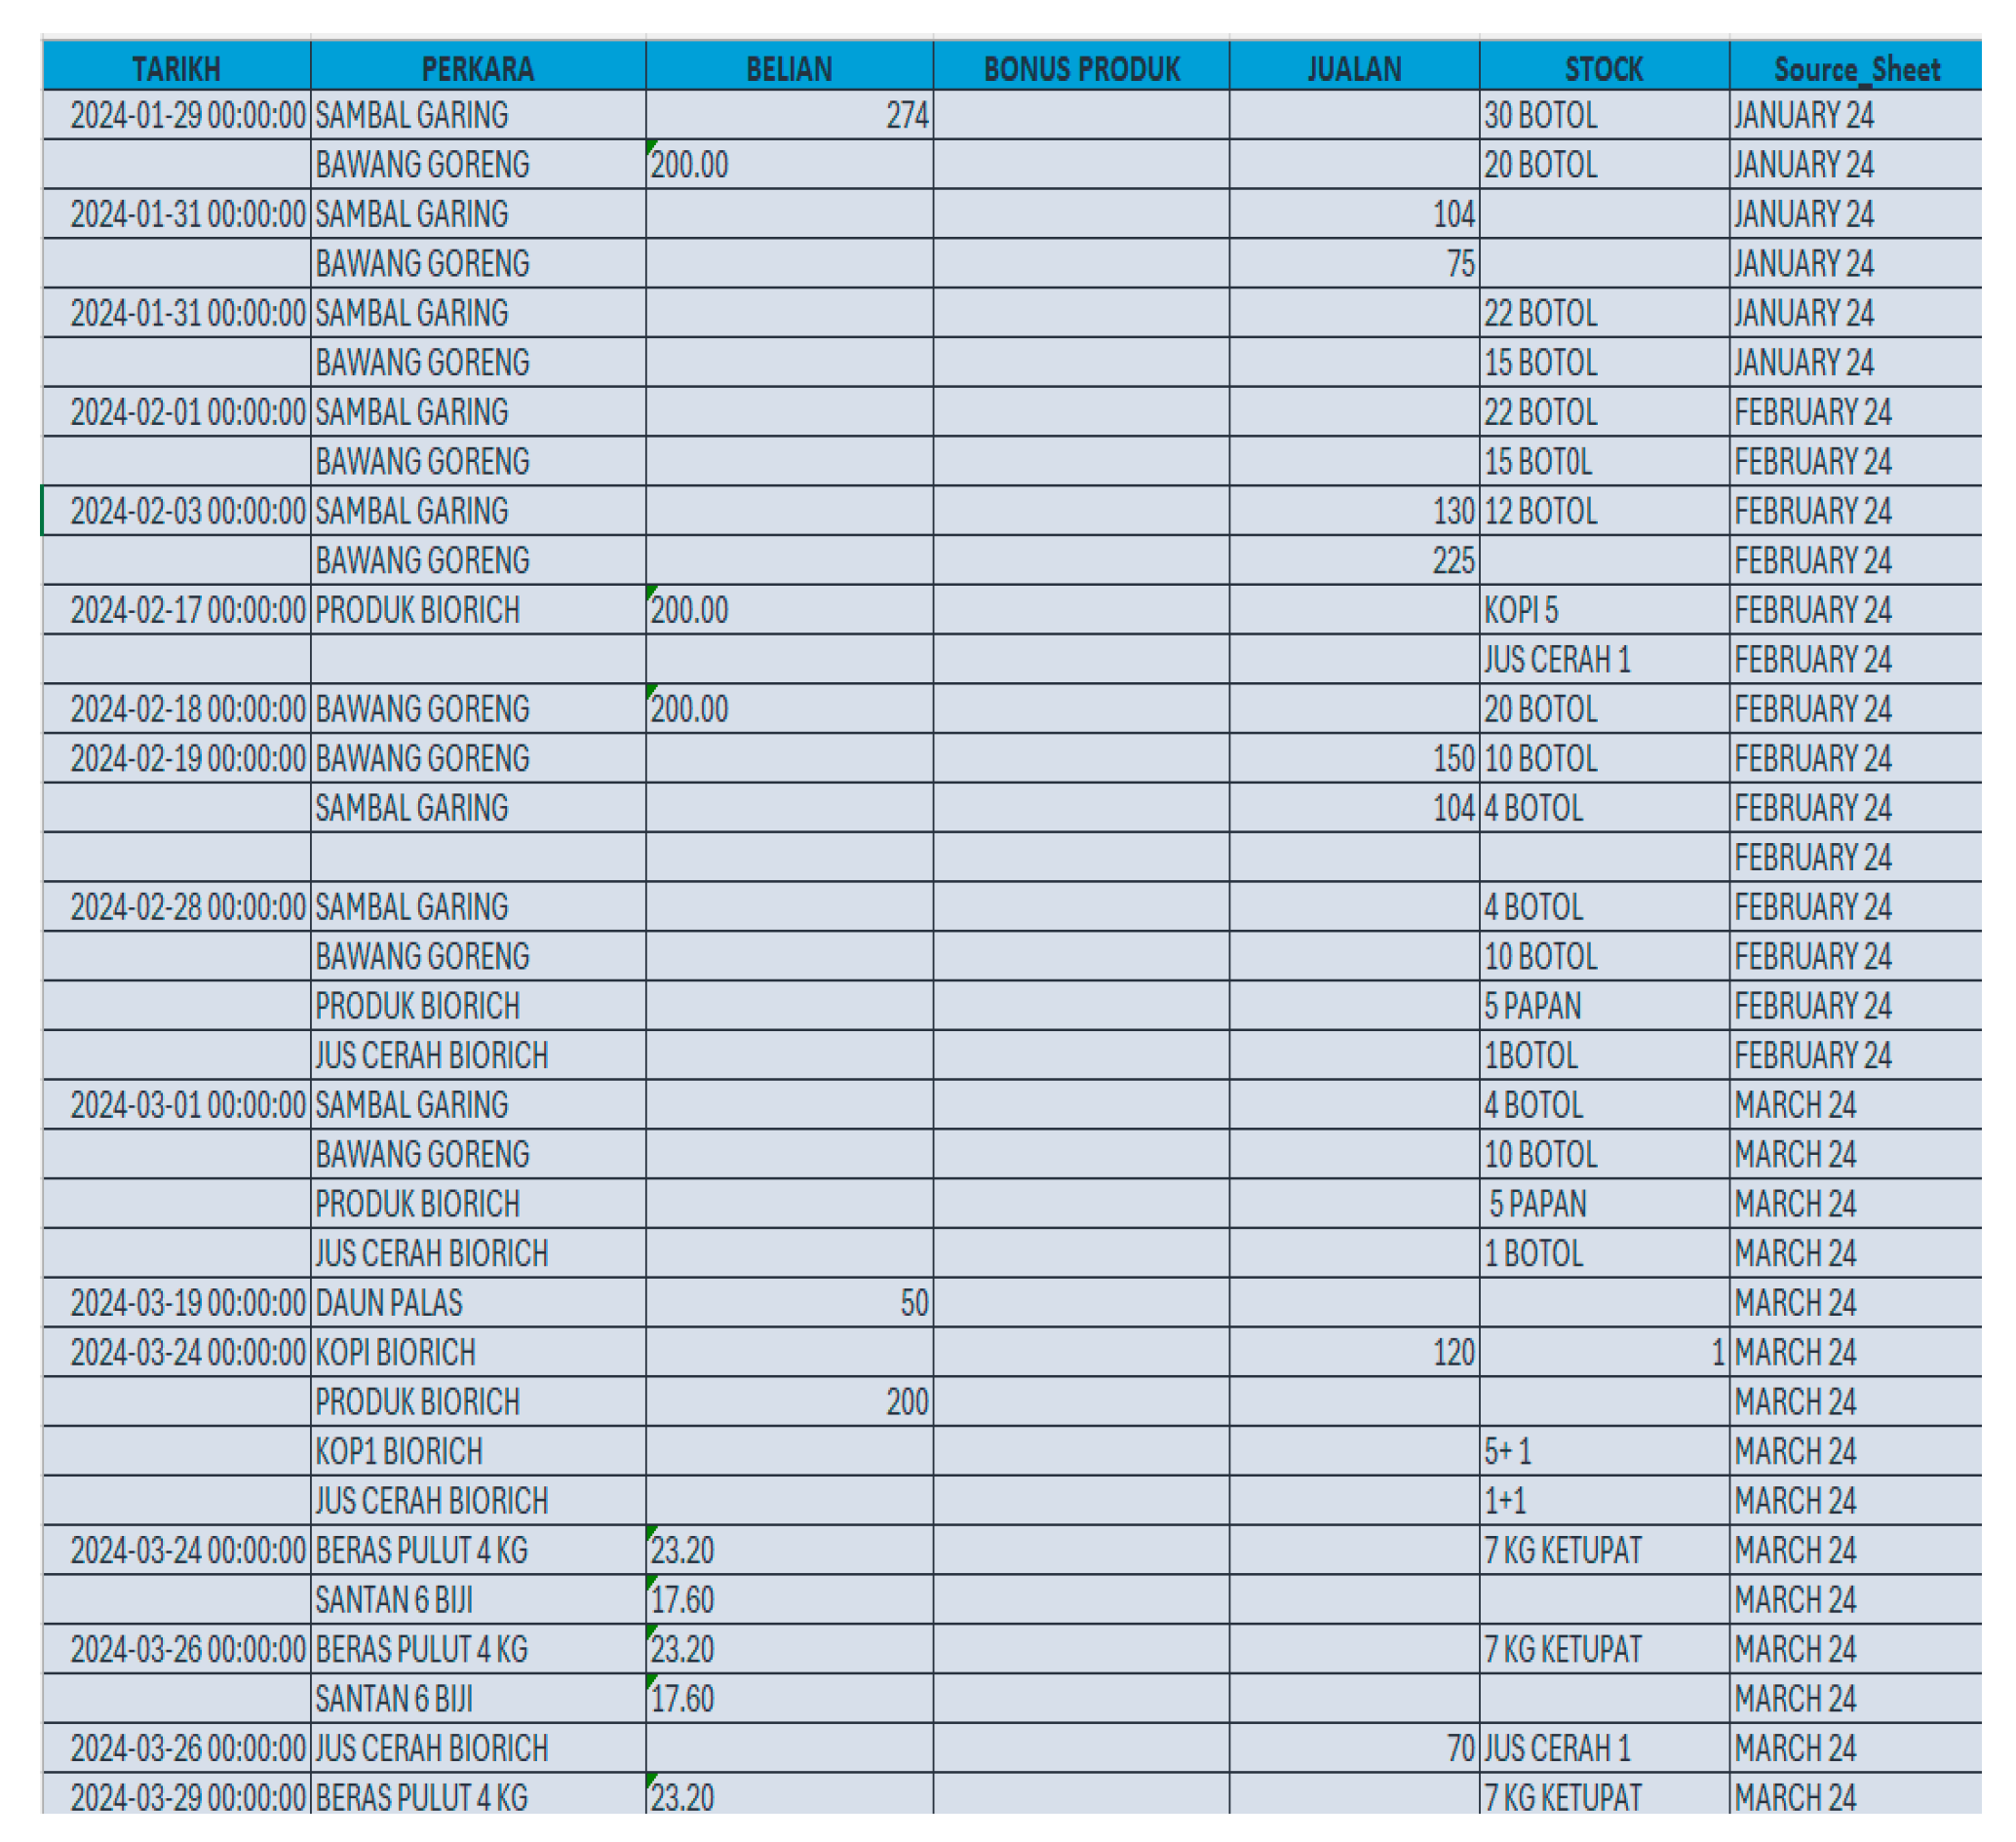
- Preview of the Dataset
Figure 2.
Preview of the Dataset.
- Import Libraries for Machine Learning and Data Science
Import of necessary libraries is a meaningful step in data science and machine learning that allows data manipulation, feature engineering, label encoding, and visualization for better interpretation of model outputs. Different categories of libraries serve different purposes in this process.
- 1. Data Manipulation Libraries
These libraries are responsible for reading, manipulating, and executing general operations on data. Pandas is broadly used in manipulating and analyzing data; hence, most operations involving the manipulation of data are efficiently done with this, including reading of files and handling of missing values. For example, pd.read_excel() reads an Excel file and loads data, whereas data.isnull().sum() helps to find the missing values. NumPy specializes in numerical calculations and functionalities, which include the identification of data types using np.issubdtype(). These libraries in essence provide the backbone for pre-processing data in machine learning.
- 2. Libraries for Feature Scaling and Transformation
It ensures all the inputs must have the same scale, then only the algorithm will work easily and efficiently in processing information. StandardScaler standards features, and MinMaxScaler scales data to a fixed range. Moreover, LabelEncoder also is very helpful in converting the categorical data to numerical data format since machine learning models cannot use categorical variables themselves.
- 3. Model Training and Evaluation Libraries
After preprocessing, the data needs to be divided into training and testing sets for model performance evaluation. The function train_test_split divides the dataset into training and test subsets, and shuffle randomizes the order of rows to avoid bias. Some of the metrics to evaluate the model are accuracy_score, classification_report, confusion_matrix, etc., which help in effective model performance evaluation.
- 4. Classification Libraries
Classification algorithms are a class of supervised learning wherein the algorithms need to classify data and predict results based on predefined classes. Some of the most usable classification models that improve the accuracy of prediction include DecisionTreeClassifier and RandomForestClassifier. The plot tree function is useful for visualizing decision trees, while ROC Curve and AUC play an important role in model performance evaluation, especially in imbalanced datasets. OneVsRestClassifier and label_binarize are useful functions for handling multi-class classification tasks.
With the proper importation and utilization of these libraries, data scientists can pre-process data, train machine learning models, and evaluate their performance with accuracy and efficiency.
- 5. Import the Dataset
We imported the dataset from the local device by uploading the file code. Through this code, we have uploaded our collected dataset to be pre-processed later. import google.collab import files: We basically import all the files module through this module which mainly operates the upload and download of a file functionality for our project.
- 6. Handling Missing Values, Encoding Categorical Data, Feature Scaling, and Dataset Splitting in Machine Learning
- 6.1 Handling Missing Values
Missing values are a frequent problem in machine learning; this happens when data is not enough to represent a variable. The missing value can lead to the loss of information and lower the precision of the model or reliability. Hence, missing value treatment is one of the critical steps in data preprocessing to ensure robustness and unbiased results for the models This missing value can be found through the function data.isnull().sum() that will give an overall overview of how many values are missing across the columns. In one dataset, the missing values across different columns were found to be: TARIKH 142, PERKARA 3, BELIAN 159, BONUS PRODUK 234, JUALAN 153, STOCK 110, and Source_Sheet 0. To address these missing values and improve model robustness, different imputation strategies were carried out depending on the data type. For this purpose, with respect to all categorical variables, missing values will be replaced using the mode; that is, the most recurrent value in each column. Replacing missing numerical values required the use of surrounding values on the column. This would thus make the information more accurate and representative.
Table 4.
Missing Values Details.
| Column | Missing Values |
| TARIKH | 142 |
| PERKARA | 3 |
| BELIAN | 159 |
| BONUS PRODUK | 234 |
| JUALAN | 153 |
| STOCK | 110 |
| Source_Sheet | 0 |
- Encoding Categorical Values to Numerical Values
Data encoding is a crucial pre-processing step in machine learning, where categorical or textual data is converted into numerical form to be processed by algorithms. Most machine learning models operate on numerical data, so categorical data must be transformed accordingly to help the model identify patterns and make predictions (Aiskunks, 2020). The categorical columns in the dataset include PERKARA, BONUS PRODUK, and STOCK. The date values inside the column TARIKH were dealt with separately from encoding. The values were first converted to the Pandas datetime format and then reformatted as a string for further analysis. In encoding the remaining categorical values, LabelEncoder() has been used which changes text categorical values into numerical representation, making it compatible with the machine learning model.
- Scaling Features
Feature scaling is an important pre-processing technique that makes all features contribute equally to the model by transforming their values to a similar scale. This is especially useful in datasets where features have different ranges, units, or magnitudes. Feature scaling enhances model performance, accelerates convergence, and avoids biases due to features with larger numerical values.
Two common feature scaling techniques were applied:
StandardScaler: Standardizes features by scaling them so that they have a mean of 0 and a standard deviation of 1.
MinMaxScaler: Rescales data within a specified range, typically between 0 and 1, ensuring uniform feature distribution and improved model efficiency.
- Splitting the Dataset into Training and Testing Sets
- Data splitting is a process of dividing a dataset into subsets, usually training and testing. Proper splitting avoids overfitting; hence, it makes sure the model generalizes well on unseen data. The model will be trained first on the training set, then the test set to measure accuracy
and performance. Research has shown that 60-80% of the data allocation to training produces an effective model since it is exposed more to learning. Why 70/30 or 80/20 Relation between Training and Testing Sets: A Pedagogical Explanation, 2018. A random state is fixed before the splitting for shuffling the data, to be able to randomize the row order; in this way, multiple runs will be the same. Feature and target variable selection use pre-processed and scaled features, not raw data, to make consistency in values represented. This split is into 60% for training and 40% for testing, done with a random state of 42 to ensure that our dataset is always split in one way. Thus, the model will be well-trained but not overfitted, hence promising accurate and reliable predictions when set to real-world applications.
- Machine Learning Algorithms: Decision Tree and Random Forest Classifiers
- 1.
- Decision Tree Classifier
The Decision Tree Classifier classified sales volume into three categories: low sales, which fall between 0-75 RM, moderate sales which falls between 75-200 RM, and high sales, anything above 200+ RM. These categories were labeled as 0, 1, and 2, respectively, under the newly engineered feature 'JULUAN_grouped'. The model made predictions on scaled data, X_scaled_minmax, and the target variable y was remapped from 'JULUAN' to 'JULUAN_grouped'. Since it is a relatively smaller dataset, reshuffling and splitting 60-40 for training and testing was done. After tuning the hyperparameter, the models were further improved using grid search optimization that could allow iterative improvements in accuracy. The performance of the models will be measured with regard to key metrics, such as accuracy and confusion matrix, which would essentially show the extent to which classification is effective.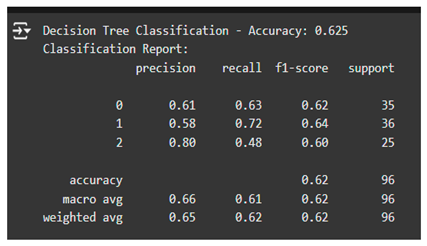
- 2.
- Performance Metrics for Decision Tree: Accuracy and Confusion Matrix
The evaluation of the Decision Tree model included metrics such as precision, which measures correct classifications per predicted class; recall, or correct predictions per actual class; F1-score, or balance between precision and recall; and support, or sample size per class. The macro average and weighted average of these metrics were also computed to assess overall model performance. The confusion matrix showed how well the model had classified each group. The diagonal values from 0,0 to 2,2 represented correctly classified instances, which totaled 60 out of 96 predictions for an accuracy of 62.5%. Although the classification model did a good job, it still needed refinements to arrive at a better result.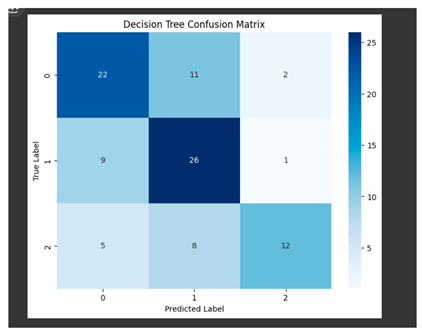
- 3. Visualization of Decision Tree Classifier
For better interpretability, the structure of the decision tree was plotted using the plot_tree function. The tree was plotted at maximum depth 5 to avoid too much complexity. Feature names were labeled for better readability, and the structure of the tree was adjusted with parameters such as filled=True and rounded=True.
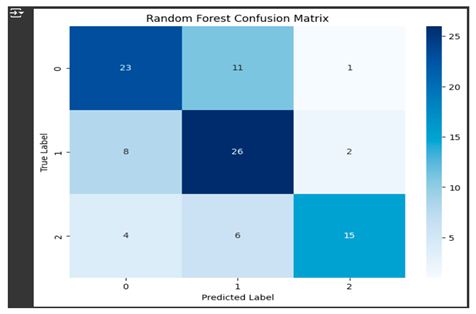
- 4. Random Forest Classifier
The Random Forest model was trained with the same engineered feature, 'JULUAN_grouped', along with its three classes. Similar to the Decision Tree model, max_depth and n_estimators were also fine-tuned in this to optimize performance for the model. The model performance was checked with the help of a confusion matrix and accuracy via a classification report. The Random Forest classifier outperformed the Decision Tree model by 64 correct predictions out of 96, hence giving an accuracy of 67%. The result proved that Random Forest was a more reliable model on this dataset.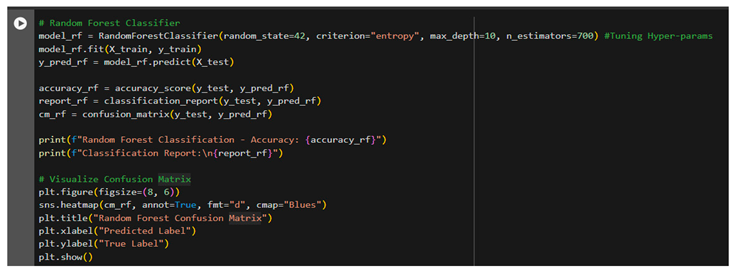
- 3.
- Feature Importance Analysis
First, the feature importance has been observed using Decision Tree and Random Forest models. Their respective importance has been extracted from them into Data Frames sorted in descending order so as to show the important ones atop, while their magnitude gets visualized as a double subplot in seaborn, featuring the importance of each model in relation to features that contributed importantly to each one for predicting the target variable.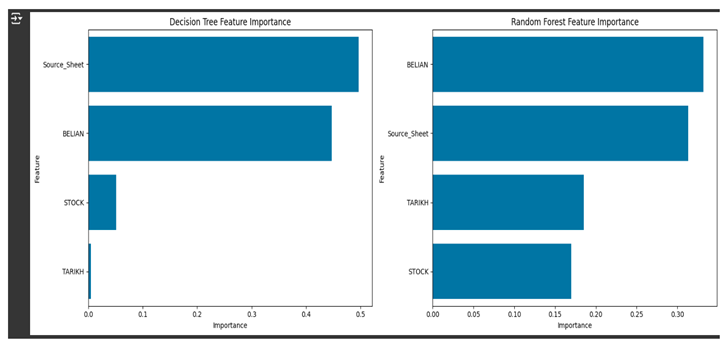
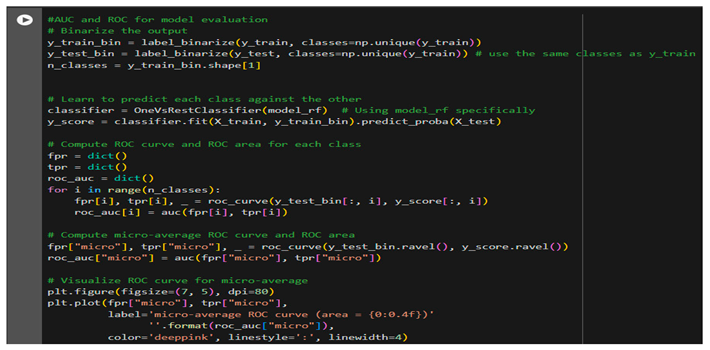
- AUC-ROC Analysis to Evaluate Performance
- AUC-ROC was also done to evaluate the performance of the Random Forest model. This kind of evaluation was quite useful since this is a multi-class classification problem; thus, it was made using the OvR approach with the following implementation:
- Binarization: target variable JULUAN_ grouped was converted in binary format, using label_binarize making different classification problems for each distinct class.
- Model Fitting: A OneVsRestClassifier trains a model that puts one class against the rest.
- ROC Curve and AUC Calculation: Compute for each class the False Positive Rate (FPR), True Positive Rate (TPR) of its corresponding ROC curve, and calculate also the AUC. Get the micro-averaged ROC curve and AUC for an overall summary of classification performance.
- Visualization: Plotting the ROC Curves - the random model, represented by a diagonal line where AUC = 0.5; whereas curves closer to the upper-left corner suggest a better classification performance (AUC=1).
AUC values were used to decide the strength of the model in differentiating among the three sales groups. Consistently high AUC over classes is indicative of good performance. The disparities provide scope for improvement. Here, the AUC-ROC graph reflects no major class-wise performance difference, which means that the Random Forest Classifier does not have a class wise bias in any manner. This strong performance of classification results from an iteration of hyper-parameter tuning, the improved selection of features, binning of a variable 'JULUAN' into a new variable, 'JULUAN_grouped', dramatically improving both predictiveness and the generalization capacity of the developed model.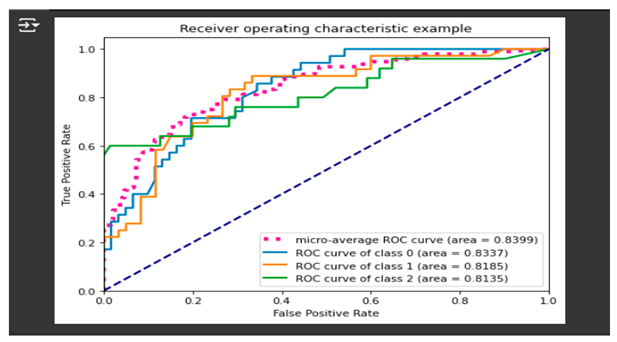
RESULT AND DISCUSSION
- 4. Reporting and Visualization Tools
Selection of proper reporting and visualization tools is highly important for appropriate implementation of our solution-the best-selling product identification. These will present the insights in a clear, actionable, and accessible way to small and medium enterprises. Hereby, below is prepared a generic description of the selected tools and their purpose:
Colab: This is a Google-provided cloud-based platform for effectively running Python code. Sharing features herein make this tool a perfect solution for SMEs with limited computational resources since the analysis and visualization of data can be done with ease.
Pandas: A core library in data manipulation; it supports filtering, grouping, and aggregating datasets. Makes data structured and hence ready for analysis and visualization.
- Matplotlib: This is the minimum necessary library to create simple graphics, such as line graphs and bar charts. These will help to develop visualizations of sales trends, product ranking, and comparative output between best-seller and worst-seller products.
- Seaborn: This library is important for advanced purposes of visualization, enabling scatter plots and heatmaps. These will serve to understand pattern consumption behavior and relationships between different characteristics from the dataset, such as price and sales.
- Scikit-learn Metrics: This module provides performance evaluation metrics such as ROC curves, accuracy scores, and confusion matrices. These metrics validate the machine learning models used in the analysis, ensuring the reliability and accuracy of insights.
- StandardScaler and MinMaxScaler: Feature scaling techniques used to normalize numerical data, such as prices and sales volume. This enhances the efficiency of machine learning algorithms, ensuring precise rankings of the best-selling products.
These tools further promote a data-driven approach by helping SMEs make sense of complex data into insightful, actionable formats that are comprehensible and hence can easily communicate findings. This helps businesses make informed decisions on their operations, marketing, and inventory.
- Analysis of Results
- Naïve Bayes Model
The Naïve Bayes Model was one of the classification techniques applied to our dataset. The dataset is split into 60% training and 40% testing, after which the model was trained using X_train and y_train. The fit method optimized the model's parameters based on training data. The test dataset is used to make a prediction, and accuracy is computed by comparing the predicted and actual labels. The model achieved an accuracy of 54.16%, meaning it only correctly classified 54.16% of instances in the dataset. The low accuracy denotes that the Naïve Bayes Model is unreliable to carry out the classification task.
- SVM Kernel Model
Another classification approach used was the Support Vector Machine Kernel Model. The model was trained on a synthetic dataset consisting of 1000 data points and 20 features, with 15 informative features and 5 redundant ones. The dataset was split to 80-20 for training and testing, and StandardScaler was applied to normalize the data.
It uses the RBF kernel, which is highly useful in nonlinear classification problems. Besides, the regularization parameter C was tuned for the best smoothness of the decision boundary. Further, using the trained model, predictions on the test dataset were made and the performance of the model was evaluated in terms of the classification report containing precision, recall, F1-score, and support. The SVM Kernel Model yielded an accuracy of 94%, which states that the performance is highly reliable and has robust predictive power. The model reflected high precision with high recall, showing its high capability of rightly classifying the instances and also locating the relevant data points. The F1 score showed a well-balanced trade-off between precision and recall, further confirming the model's robustness.
- _______________________________________
- Showing Top 10 Selling Products using SVM Kernel Model
Using the SVM Kernel Model, we identified the top 10 best-selling products based on sales predictions. Key features used for this analysis include 'PERKARA – Products,' 'JUALAN – Sales,' and 'STOCK – Stock'. The trained model was applied to predict sales trends, and the dataset was grouped by product categories.
For determining the best-selling products, the total sales figures were calculated and combined with prediction results. The sales data is sorted in a descending order that highlights the best-selling products. A bar chart was used to present findings visually. The top 3 products were colored in orange, while the rest 7 were colored in blue. Labels, axis descriptions, and a legend were added for clarity. This visualization provided great insight into which products sold best and how they compared to one another.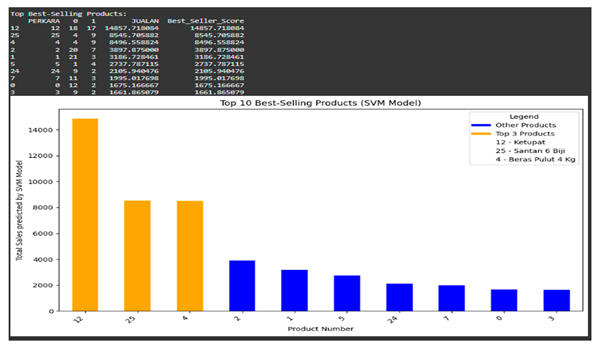
Conclusion
It identifies top-selling products using machine learning algorithms and data visualization techniques in ways useful for the SMEs concerned. It emerges that the SVM Kernel Model turns out as a reliable classifier by yielding a superior accuracy rate at 94%, while Naïve Bayes Model failed for the study as it is the worst performing algorithm with 54.16%. Using Google Colab, Pandas, Matplotlib, Seaborn, and Sklearn Metrics, we efficiently processed, analyzed, and visualized sales data to inform SMEs in making informed decisions on inventory management, marketing strategies, and operational planning. Continuous refinements and data-driven improvements will further enhance the accuracy and impact of these models in business applications. The present study highlights how advanced machine learning algorithms will further improve decision-making in SMEs, which are always battling with limited resources, restricted operations, and poor insight from sales data. Using Decision Trees, Random Forest, Naïve Bayes, and SVM Kernel functions, a flexible framework was designed that can spot the most sold products, analyze the trend, and optimize overall business performance.
It shows that the results vary within the models as highlighted below:
Decision Tree: 62.5% - Transparent and easy to interpret; not very good with complex or overlapping data.
Random Forest: 66.6%: While enhancing the certainty in predictions by including several decision trees, it improves the model but only slightly from the Decision Tree Model.
SVM Kernel (Accuracy: 94%) - Handles high-dimensional and nonlinear data with much ease, hence the most robust and reliable model for this task. Naïve Bayes (Accuracy: 54.1%) - Though it has low accuracy, it is still useful in categorical data and quick decision-making due to its probabilistic nature and computational efficiency. The results have shown the selection of an appropriate machine learning algorithm because of business needs and constraints. Among them, the Kernel Model SVM had the best accuracy, efficiency, and suitability for SMEs to gain a strategic advantage in using data-driven decisions. Future studies may also be directed at hybrid models that implement the SVM Kernel with other approaches, which would hopefully improve prediction accuracy and undertake real-time applications for dynamically adapting SMEs to changes in market conditions. Embracing AI-driven analytics helps SMEs not only address prevailing challenges but also find a competitive edge in contemporary data-driven business environments.
References
- Li, C.; Jiang, W.; Yang, Y.; Pan, S.; Huang, G.; Guo, L. Predicting best-selling new products in a major promotion campaign through graph convolutional networks. IEEE Transactions on Neural Networks and Learning Systems 2022, 34, 9102–9115. [Google Scholar] [CrossRef] [PubMed]
- Chen, J.; Li, M.; Xu, H. Selling data to a machine learner: Pricing via costly signaling. In International Conference on Machine Learning; PMLR, 2022; pp. 3336–3359. [Google Scholar]
- Upreti, G.; Natarajan, A.K. Leveraging unsupervised machine learning to optimize customer segmentation and product recommendations for increased retail profits. In Intersection of AI and Business Intelligence in Data-Driven Decision-Making; IGI Global, 2024; pp. 257–282. [Google Scholar]
- Ridzki, M.M.; Hadijah, I.; Mukidin, M.; Azzahra, A.; Nurjanah, A. K-Means algorithm method for clustering best-selling product data at XYZ grocery stores. International Journal of Social Service and Research 2023, 3, 3354–3367. [Google Scholar] [CrossRef]
- Raharjo, A.; Utama, N.I.; Lubis, M. Using supervised machine learning to predict sales in marketplaces: Case study predicting sales of Padimas Bread in marketplaces in Indonesia. Informatics Management, Engineering and Information System Journal 2023, 1, 139–146. [Google Scholar] [CrossRef]
- Rahman, D.F.; Tjhin, V.U. Application of data mining for evaluation of best-selling internet package using K-Means clustering. Jurnal Cahaya Mandalika 2023, 3, 650–662. [Google Scholar]
- Marada, T.K.; Majji, D.K. Enhancing e-commerce with machine learning for personalized gift segmentation and recommendations. 2024. [Google Scholar]
- Alferidah, D.K.; Jhanjhi, N.Z. Cybersecurity impact over big data and IoT growth. In Proceedings of the 2020 International Conference on Computational Intelligence (ICCI); IEEE, 2020; pp. 103–108. [Google Scholar]
- Jena, K.K.; Bhoi, S.K.; Malik, T.K.; Sahoo, K.S.; Jhanjhi, N.Z.; Bhatia, S.; Amsaad, F. E-learning course recommender system using collaborative filtering models. Electronics 2022, 12, 157. [Google Scholar] [CrossRef]
- Aherwadi, N.; Mittal, U.; Singla, J.; Jhanjhi, N.Z.; Yassine, A.; Hossain, M.S. Prediction of fruit maturity, quality, and its life using deep learning algorithms. Electronics 2022, 11, 4100. [Google Scholar] [CrossRef]
- Jhanjhi, N.Z.; Humayun, M.; Almuayqil, S.N. Cybersecurity and privacy issues in industrial Internet of Things. Computer Systems Science & Engineering 2021, 37. [Google Scholar]
- Lee, S.; Abdullah, A.; Jhanjhi, N.Z. A review on honeypot-based botnet detection models for smart factory. International Journal of Advanced Computer Science and Applications 2020, 11. [Google Scholar]
- Khan, N.A.; Jhanjhi, N.Z.; Brohi, S.N.; Almazroi, A.A.; Almazroi, A.A. A secure communication protocol for unmanned aerial vehicles. CMC-Computers, Materials & Continua 2022, 70, 601–618. [Google Scholar]
- Putri, N.F.; Hameed, A.; Akin, M.; Akin, I.; Khan, M.Z.; Banerjee, S.; Zaidi, S.M.T. Analyzing the modest fashion market: An empirical study of e-commerce best-selling products. Journal of Islamic Marketing 2024. [Google Scholar]
- Mahmud, T.; Chakma, R.; Akther, R.; Aziz, M.T.; Rahman, T.; Hossain, M.S.; Andersson, K. Leveraging data-driven decision making for e-commerce growth: A machine learning framework. In International Conference on Intelligent Computing & Optimization; Springer Nature: Switzerland, 2023; pp. 210–219. [Google Scholar]
- Hasan, M.R. Addressing seasonality and trend detection in predictive sales forecasting: A machine learning perspective. Journal of Business and Management Studies 2024, 6, 100–109. [Google Scholar] [CrossRef]
- Saeed, S.; Abdullah, A. Hybrid graph cut hidden Markov model of K-mean cluster technique. CMC-Computers, Materials & Continua 2022, 1–15. [Google Scholar]
- Saeed, S.; Haron, H. Improve correlation matrix of discrete Fourier transformation (CM-DFT) technique for finding the missing values of MRI images. Mathematical Biosciences and Engineering 2021, 1–22. [Google Scholar]
- Saeed, S. Implementation of failure enterprise systems in the organizational perspective framework. International Journal of Advanced Computer Science and Applications 2017, 8, 54–63. [Google Scholar] [CrossRef]
- Saeed, S.; Abdullah, A. Combination of brain cancer with hybrid K-NN algorithm using statistical analysis of cerebrospinal fluid (CSF) surgery. International Journal of Computer Science and Network Security 2021, 21, 120–130. [Google Scholar]
- Saeed, S.; Abdullah, A. Analysis of the lung cancer patients for data mining tool. International Journal of Computer Science and Network Security 2019, 19, 90–105. [Google Scholar]
- Saeed, S.; Abdullah, A. Investigation of brain cancer with interfacing of 3-dimensional image processing. Indian Journal of Science & Technology 2019, 12, 1–12. [Google Scholar]
- Saeed, S.; Khan, H. Global mortality rate and statistical results of coronavirus. Infectious Diseases and Tropical Medicine 2021, 1–12. [Google Scholar]
- Aguirre Méndez, K.M.; Moreno Torres, A.L.; Ovalle, C. Predictive model based on machine learning for the prevention of overstock in a footwear company. LACCEI 2023, 1. [Google Scholar]
- Kumar, U.D.; Pradhan, M.; Grover, S.; Bhansali, N.K. Intelligence assistant using deep learning: Use case in crop disease prediction. International Journal of Business Intelligence and Data Mining 2024, 25, 451–469. [Google Scholar] [CrossRef]
- Najmi, K.Y.; AlZain, M.A.; Masud, M.; Jhanjhi, N.Z.; Al-Amri, J.; Baz, M. A survey on security threats and countermeasures in IoT to achieve users' confidentiality and reliability. Materials Today: Proceedings 2023, 81, 377–382. [Google Scholar] [CrossRef]
- Gouda, W.; Almurafeh, M.; Humayun, M.; Jhanjhi, N.Z. Detection of COVID-19 based on chest X-rays using deep learning. Healthcare 2022, 10, 343. [Google Scholar] [CrossRef] [PubMed]
- Kumar, T.; Pandey, B.; Mussavi, S.H.A.; Zaman, N. CTHS based energy efficient thermal aware image ALU design on FPGA. Wireless Personal Communications 2015, 85, 671–696. [Google Scholar] [CrossRef]
- Fatima-tuz-Zahra, N. Jhanjhi, S. In N. Brohi, N. A. Malik and M. Humayun, Proposing a Hybrid RPL Protocol for Rank and Wormhole Attack Mitigation using Machine Learning. In Proceedings of the 2020 2nd International Conference on Computer and Information Sciences (ICCIS), Sakaka, Saudi Arabia; 2020; pp. 1–6. [Google Scholar] [CrossRef]
- Lim, M.; Abdullah, A.; Jhanjhi, N.Z.; Khan, M.K.; Supramaniam, M. Link prediction in time-evolving criminal network with deep reinforcement learning technique. IEEE Access 2019, 7, 184797–184807. [Google Scholar] [CrossRef]
- Dogra, V.; Singh, A.; Verma, S.; Kavita, Jhanjhi, N.Z.; Talib, M.N. Analyzing DistilBERT for Sentiment Classification of Banking Financial News. In Intelligent Computing and Innovation on Data Science. Lecture Notes in Networks and Systems; Peng, SL., Hsieh, SY., Gopalakrishnan, S., Duraisamy, B., Eds.; Springer: Singapore, 2021; Volume 248. [Google Scholar] [CrossRef]
- Zaman, N.; Low, T.J.; Alghamdi, T. Energy efficient routing protocol for wireless sensor network. In Proceedings of the 16th international conference on advanced communication technology; IEEE, 2014; pp. 808–814. [Google Scholar]
- Kok, S.H.; Abdullah, A.; Jhanjhi, N.Z.; Supramaniam, M. A review of intrusion detection system using machine learning approach. International Journal of Engineering Research and Technology 2019, 12, 8–15. [Google Scholar]
- Gopi, R.; Sathiyamoorthi, V.; Selvakumar, S.; Manikandan, R.; Chatterjee, P.; Jhanjhi, N.Z.; Luhach, A.K. Enhanced method of ANN based model for detection of DDoS attacks on multimedia internet of things. Multimedia Tools and Applications 2022, 1–19. [Google Scholar] [CrossRef]
- Chesti, I.A.; Humayun, M.; Sama, N.U.; Jhanjhi, N.Z. Evolution, mitigation, and prevention of ransomware. roceedings of the 2020 2nd International Conference on Computer and Information Sciences (ICCIS); IEEE, 2020; pp. 1–6. [Google Scholar]
- Alex, S.A.; Jhanjhi, N.Z.; Humayun, M.; Ibrahim, A.O.; Abulfaraj, A.W. Deep LSTM model for diabetes prediction with class balancing by SMOTE. Electronics 2022, 11, 2737. [Google Scholar] [CrossRef]
- Alkinani, M.H.; Almazroi, A.A.; Jhanjhi, N.Z.; Khan, N.A. 5G and IoT based reporting and accident detection (RAD) system to deliver first aid box using unmanned aerial vehicle. Sensors 2021, 21, 6905. [Google Scholar] [CrossRef]
- Alferidah, D.K.; Jhanjhi, N.Z. Cybersecurity impact over bigdata and iot growth. 2020 International Conference on Computational Intelligence (ICCI); IEEE, 2020; pp. 103–108. [Google Scholar]
Disclaimer/Publisher’s Note: The statements, opinions and data contained in all publications are solely those of the individual author(s) and contributor(s) and not of MDPI and/or the editor(s). MDPI and/or the editor(s) disclaim responsibility for any injury to people or property resulting from any ideas, methods, instructions or products referred to in the content. |
© 2025 by the authors. Licensee MDPI, Basel, Switzerland. This article is an open access article distributed under the terms and conditions of the Creative Commons Attribution (CC BY) license (http://creativecommons.org/licenses/by/4.0/).
Copyright: This open access article is published under a Creative Commons CC BY 4.0 license, which permit the free download, distribution, and reuse, provided that the author and preprint are cited in any reuse.


