Preprint
Article

Analysis of Sushi Rice: Preparation Techniques, Physicochemical Properties and Quality Attributes

This version is not peer-reviewed.

Submitted:

17 February 2025

Posted:

18 February 2025

You are already at the latest version

Abstract

This study explores, the multifaceted aspects of sushi rice preparation is explored, including washing, soaking and cooking processes, and their impact on the texture and sensory properties of rice. Selenio rice, a premium short-grain rice, was analysed for variations in amylose content and viscosity profiles. The study allows to highlight how the rice's compositional characteristics, particularly the amylose-to-amylopectin ratio, influence gelatinisation and cooling behaviour. The effects of soaking duration, vinegar mix composition, and water-to-rice ratio on texture profile analysis (TPA) are also examined, as well as overall sensory quality. Rice reaches maximum water absorption within three minutes of soaking, independent of water temperature (10-50°C). Vinegar mix addition effectively lowered rice pH to below 4.5, contributing to improved shelf stability. Additionally, the TPA of sushi rice was evaluated over a 10-day storage period, with findings suggesting that optimised preparation techniques can improve rice quality, extending its freshness and acceptability. The importance is underscored of precise preparation methods in optimising the quality of sushi rice, contributing to the broader field of rice research and culinary science.

Keywords: 
;  ;  ;  ;  ;  ;  

1. Introduction

Sushi is one of Japan's most traditional foods, having been consumed for centuries. It has been successfully culturally adapted, and is currently a popular dish in countries all around the world [1]. Hong, et al. [2] suggested that the Japonica subspecies (Oryza sativa L. subsp. japonica), often called sushi rice, is the preferred choice for making sushi. High-quality sushi rice is characterised by short, rounded grains that develop a sticky and chewy texture upon cooking. When cooled, the grains maintain a compact, soft structure, ensuring suitability for moulding into traditional sushi forms [3]. The specific textural properties of the sushi rice are due to its higher amylopectin content, which provides a sticky characteristic when cooked [4,5], while higher content of amylose is generally associated with rice of a firmer texture, less prone to sticking [6]. In the research by Li, et al. [7], it was demonstrated that rice varieties with smaller amylose molecules, and a greater proportion of long amylose chains tend to exhibit a firmer texture following cooking.
The tradition of washing rice before cooking is commonly applied in the sushi industry, primarily to remove dust and impurities. In studies on the subject, it has been indicated that rinsing rice is vital for making rice products, and the number of required rinses depends on the rice variety [8,9,10]. According to Yu, et al. [11], the act of washing rice has been identified as a means to eliminate lipids adhering to the surface of raw rice grains. Consequently, this procedure assumes significance because it serves as an effective method for mitigating lipid oxidation, primarily by the removal of free fatty acids, thereby contributing to the prevention of off-flavour development in cooked rice.
Soaking is a significant processing stage prior to cooking, since the process itself can help avoid uneven cooking between the surface and inner part of the rice. The even distribution of water during soaking ensures a reduction in cooking time and a decrease in energy consumption. Additionally, during soaking, foreign substances such as excess starch and free fatty acids are removed from the grain surface, resulting in less flavour deterioration [11,12,13].
The cooking and textural characteristics of rice are determined by a comprehensive set of interrelated parameters, including multiple stages of rice production and preparation. These critical factors comprise rice variety, the conditions and techniques employed during drying and storage processes, initial moisture content of the rice, amylose content, starch type, extent of milling, water-to-rice ratio, as well as pre- and post-cooking processing. Each of these parameters substantively contributes to the ultimate sensory and textural properties of the cooked rice [14].
Domestic rice preparation methodologies typically include two primary cooking strategies: one characterised by the utilisation of excess water, and an alternative approach involving a precisely predetermined water amount with a standardised rice-to-water ratio. In the latter method, the water is completely absorbed during the cooking process, resulting in a more controlled and predictable final rice preparation outcome [15]. Increasing the amount of water during thermal processing can mitigate the intensity of retrogradation phenomena while simultaneously enhancing the perception of juiciness, thereby, counteracting undesirable textural changes in the product.
Extensive research has been conducted on the characterisation of physicochemical properties, cooking processes, sensory properties and instrumental textural measurements of rice [16,17,18,19,20]. Despite existing studies on the physicochemical properties of rice and its behaviour during cooking, there remains a gap in understanding the comprehensive effects of different preparation techniques, such as washing as well as soaking time, and vinegar addition on the quality attributes of sushi rice and its shelf-life. This research aims to fill this gap by examining how variations in rice composition, soaking duration and the addition of vinegar mixes influence the textural and sensory qualities of sushi rice, with focus on its stability and appeal over time.

2. Materials and Method

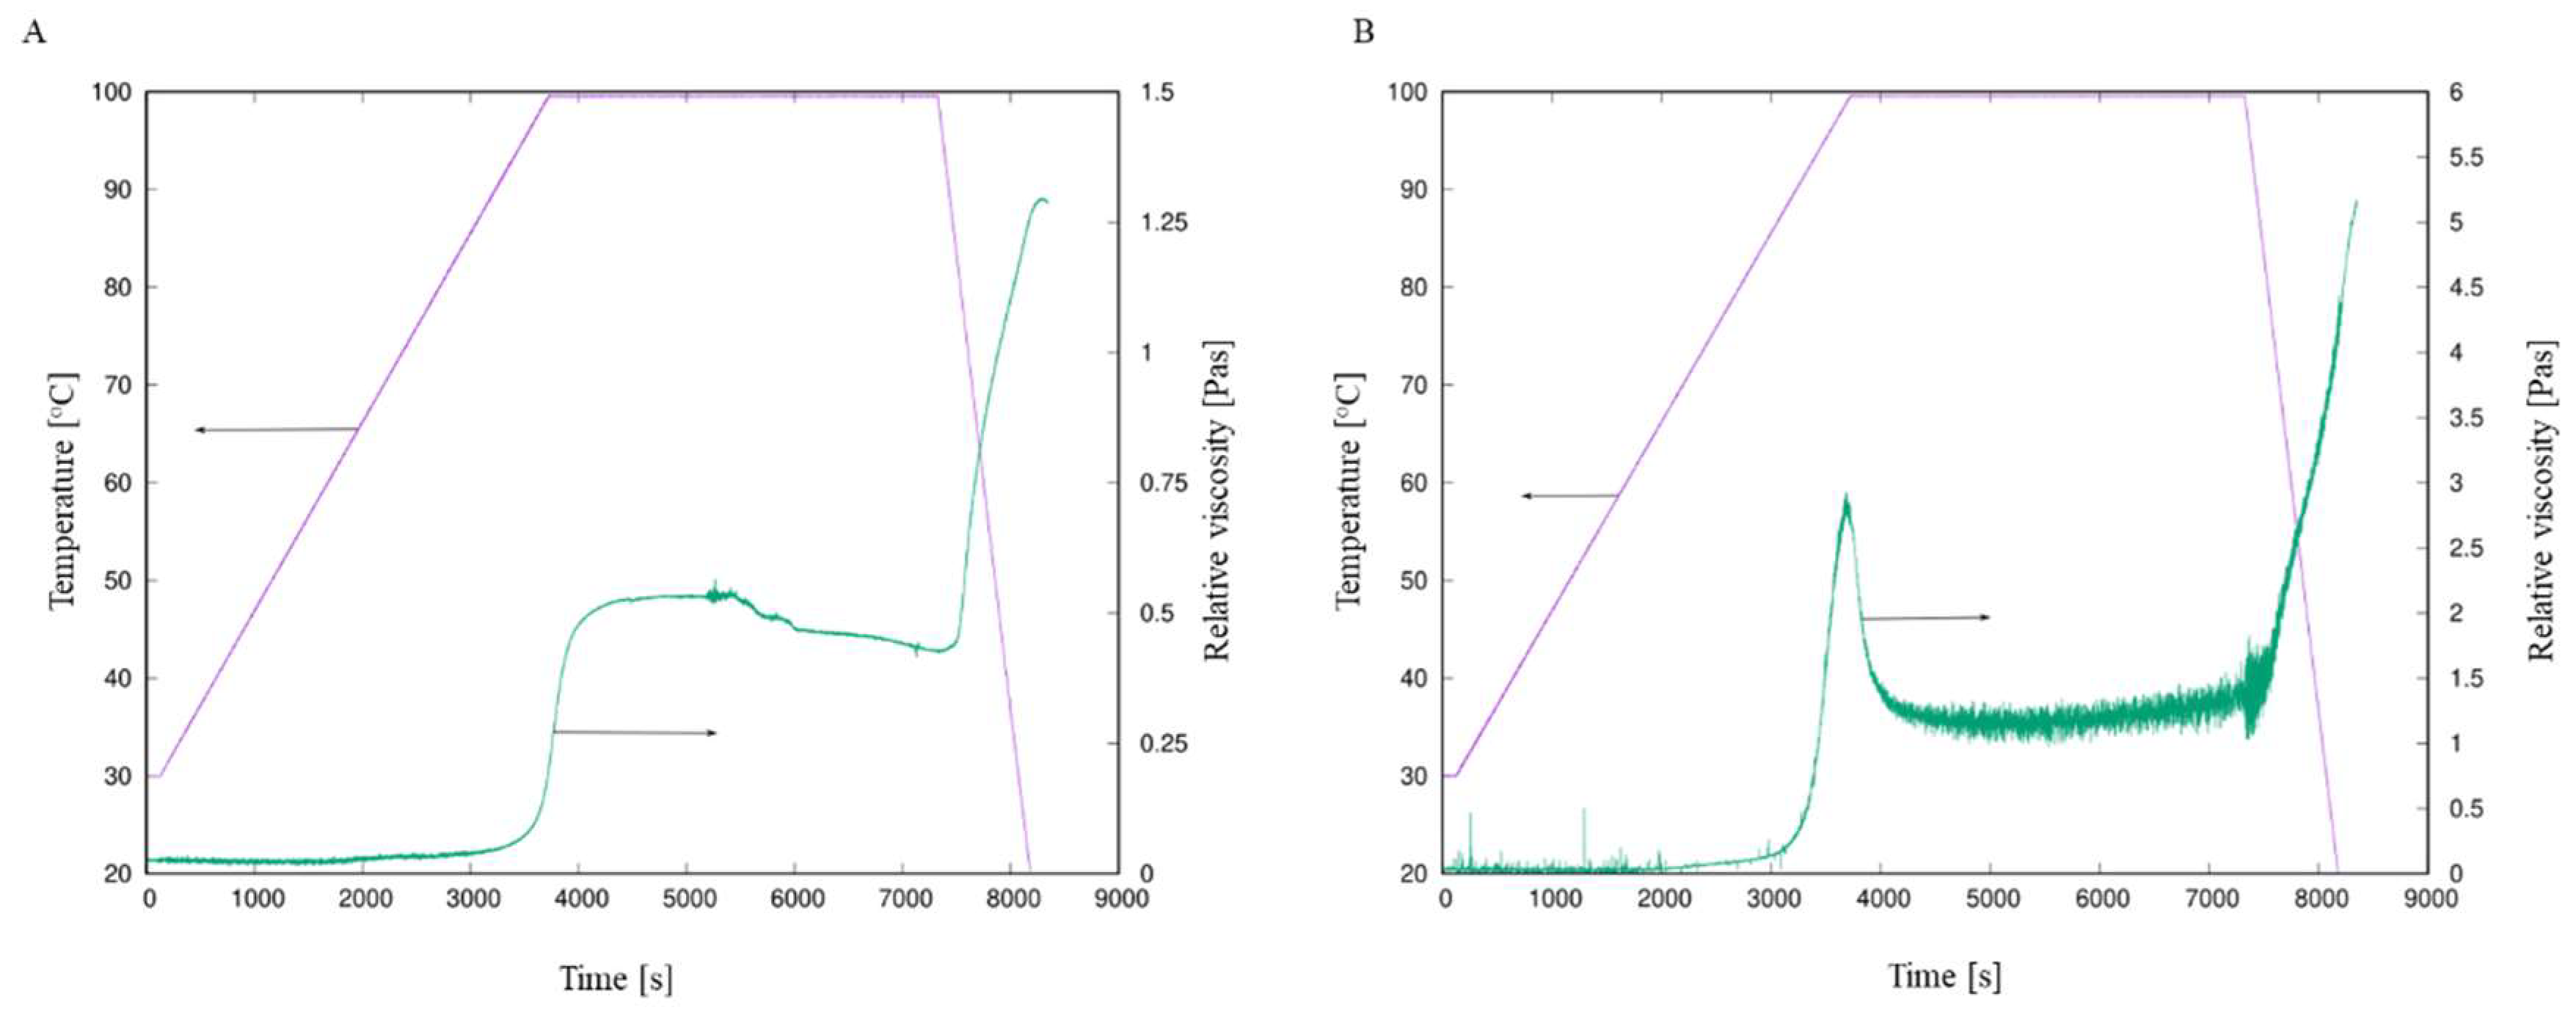
2.1. Initial Characterisation of Sushi Rice

Sushi rice (Oryza sativa L. subsp. japonica) of the Selenio variety was obtained from Innoaim Sp. z o.o. (Stalowa Wola, Poland). The rice was cultivated in Italy. The dry rice samples were ground using a spice mill (Santos P1, Lyon, France), with each batch undergoing two grinding cycles. The resulting flour was used for subsequent analyses. Two batches of Selenio rice were examined: one harvested in spring 2020 and another in the fall of 2019. Amylose content was determined spectrophotometrically, following a modified version of the method described by Avaro, et al. [21]. The calibration curve was adjusted using potato amylose (Sigma, CAS 9005-82-7) and maize amylopectin (Sigma, CAS 9037-22-3). Gelatinisation examination of the rice flour employed a modified Brabender approach using a rotational rheometer equipped with a Vane-type sensor. Initial attempts using standard Brabender parameters (5% suspension, 25 °C to 96 °C heating at 1.5 °C/min, 10-minute hold at 96 °C, cooling to 25 °C at 1.5 °C/min) proved insufficient for complete gelatinisation. Consequently, the heating phase was extended to 3,000 seconds while maintaining the original cooling rate to achieve full gelatinisation.

2.2. Investigating the Sushi Rice Production Process

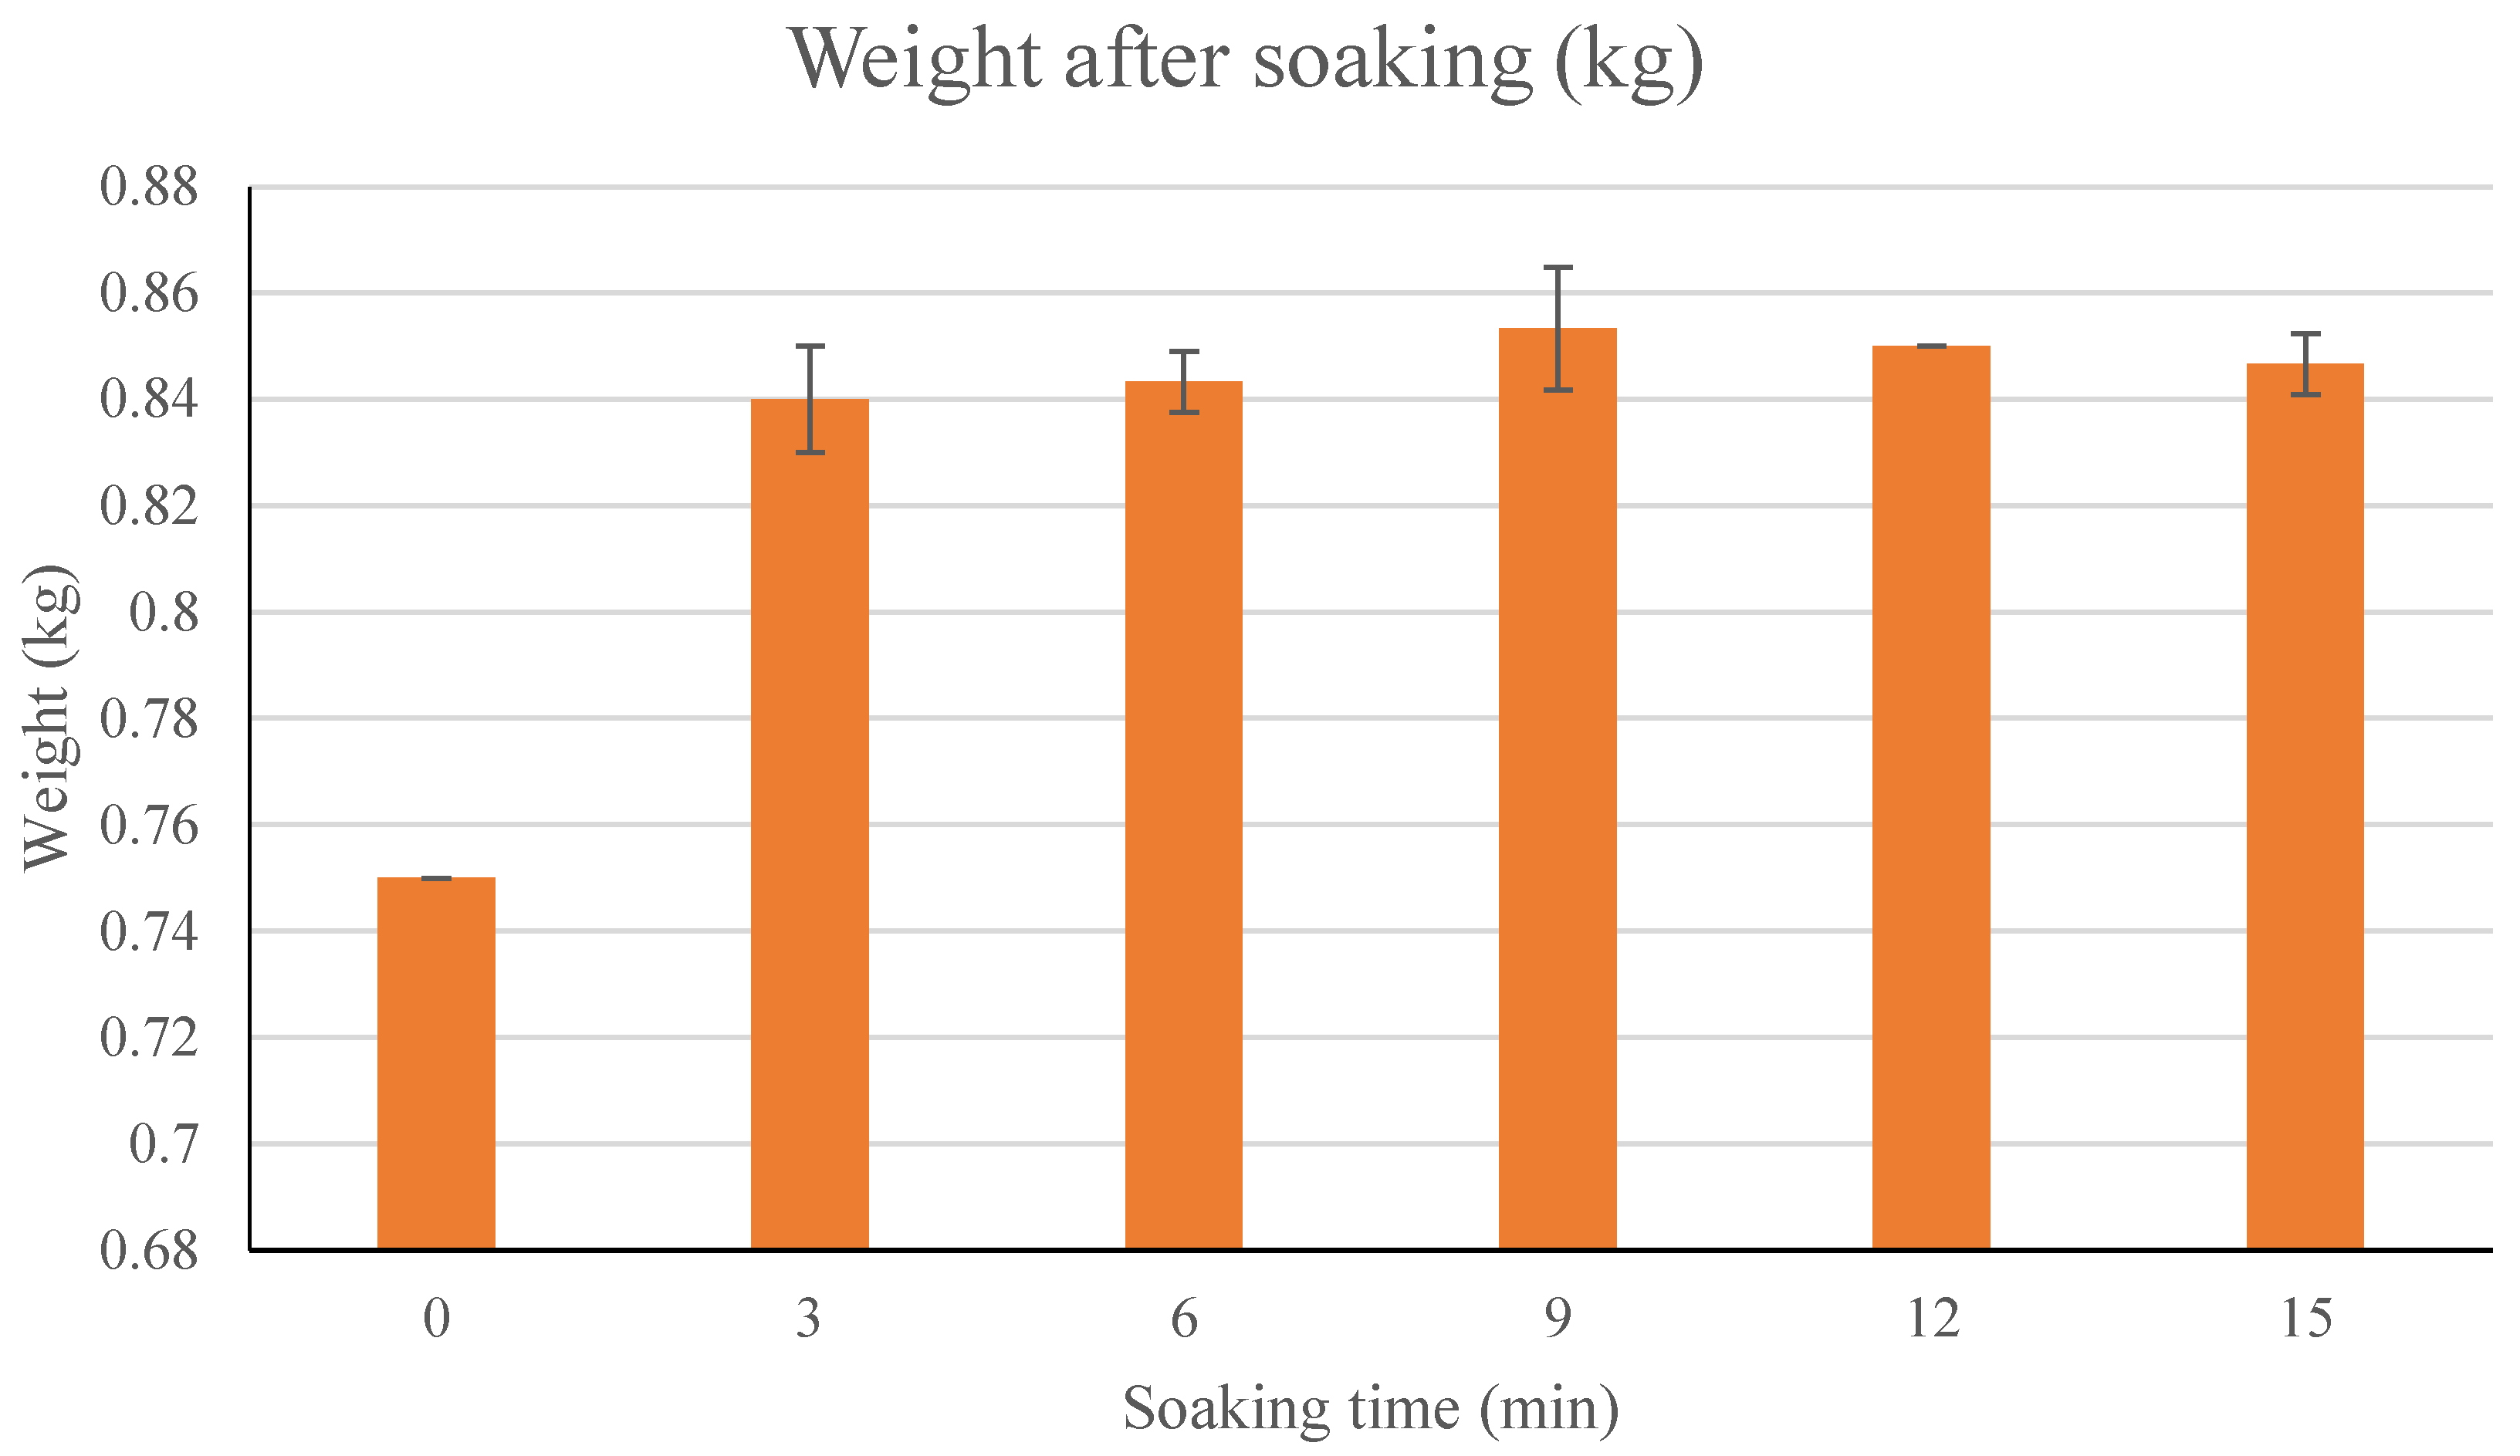
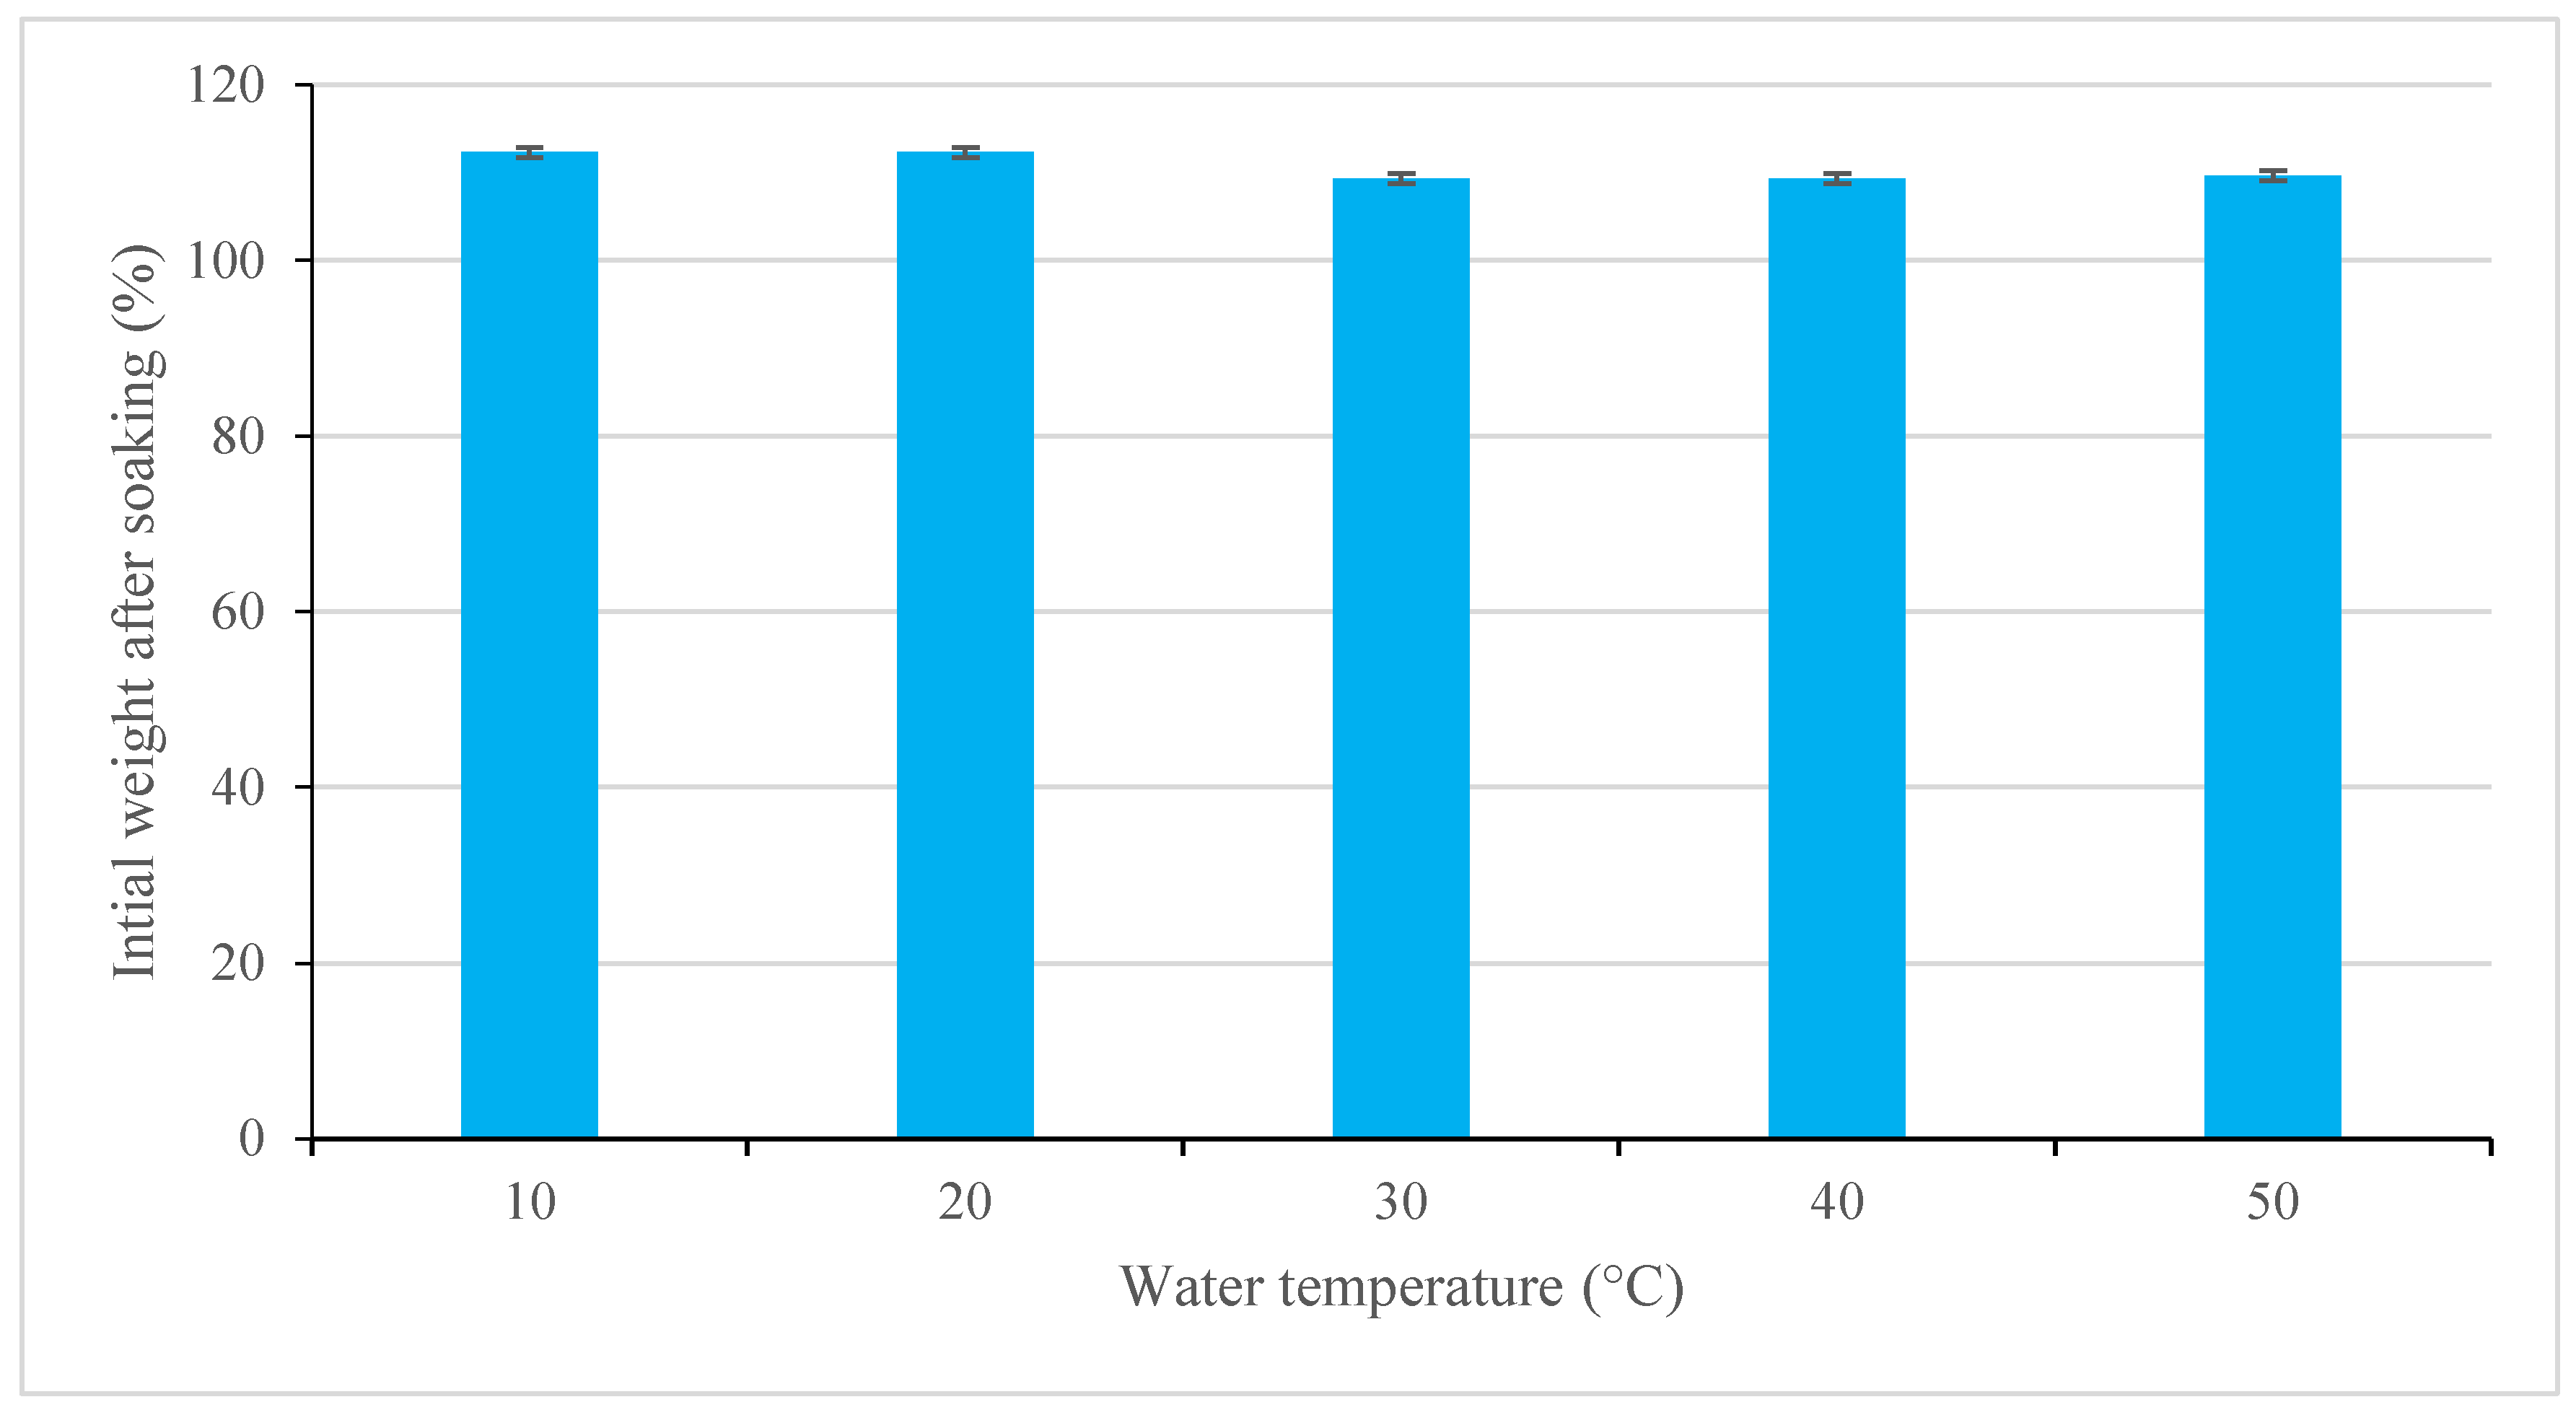
2.2.1. Washing and soaking Sushi Rice

An automated rice washing machine, the Ricemini 401 (Rice Techno Products, Saitama, Japan), was used for rice washing. Each time, exactly 0.75 kg of rice was washed with varying washing time from 200-350 s with a 30-s time interval between the analysed groups (W1-W6). Following this, the rice underwent a soaking process, during which it was placed in stainless steel containers, covered with water, and left to soak for a specified time between 0-15 min, with a 3-min time interval between groups. Once the soaking was complete, the water was drained. The rice was then allowed to continue draining for an additional 15 minutes. Rice yield during soaking was determined by pre- and post-soak weights.

2.2.2. Cooking, Seasoning and Rice Formation

Cooking was performed in an induction rice cooker with an automated cooking parameter configuration (Panasonic SR-PGC54, Osaka, Japan). The rice cooking methodology incorporated five distinct water-to-rice ratios: 1.3:1 (R1); 1.4:1 (R2); 1.6:1 (R3); 1.8:1 (R4) and 2:1 (R5).
After cooking, the rice was allowed to evaporate before being combined with a vinegar solution. The vinegar solution was formulated using sucrose, rice vinegar and salt. The composition of the different vinegar mixes is presented in Table 1. Each mix was incorporated into the rice at quantities of 120 g and 180 g per 1 kg of cooked rice. The cooked rice was combined with the vinegar solution using an automated rice mixer (Robotic Sushi FTN-550R, South Korea). The rice mixture was then cooled in stainless steel GN containers. Forming the rice into a shape for shari-dama was carried out using a semi-automatic Fujiseiki TSDG-4000 machine (Fukuoka, Japan). Nigiri samples were formed at temperatures of cooked rice ranging from 10 °C to 60 °C, with 10 °C increments (10, 20, 30, 40, 50 and 60 °C). The weight of five randomly selected pieces of nigiri were measured for each temperature condition. The weight of each piece was determined through triplicate measurements. Finally, the prepared rice was stored in sealed containers, which were packaged using the TraySealer (Mini Oceania, Italian Pack, Como, Italy) for the analyses of rice quality during storage.
2.2.3. pH Analysis
The pH of the seasoned homogenised cooked rice samples was analysed by taking 5 g of the sample and using the Elmetron CP-505 pH metre (Zabrze, Poland). Before conducting the measurement, the pH metre was calibrated using standard phosphate buffers with pH values of 4.00 and 7.00, and adjustments for temperature were made.

2.3. Shelf-Life Examination of Cooked Sushi Rice

2.3.1. TPA

The TA-XT Plus texturometer (Stable Microsystems, UK), equipped with the Ottawa cell and a plunger was used to measure texture parameters. For each test, 100 g of rice was placed on the 3-mm diameter bar plate of the Ottawa cell. A double compression test was then performed, compressing the sample to 90% of its initial height at a rate of 3 mm/s. All measurements were performed at room temperature (20 °C±1) and repeated five times for each sample type. The force-deformation relationship during the double compression was analysed to determine key parameters including hardness, adhesiveness, chewiness and elasticity.

2.3.2. Sensory Evaluation

The sensory assessment was performed by a panel of 10 experts. The experts have been trained in the typical characteristics associated with the sensory quality of sushi. Using a five-point descriptive scale, the experts assessed the parameters of cooked rice samples: smell, colour and appearance, texture, taste, and using a nine-point hedonic scale, the overall impression.

2.4. Statistical Analysis

Data organisation and preliminary analysis were conducted using Microsoft Excel 2019 (Microsoft Corporation, Redmond, WA, USA). Statistical analysis was carried out using the R software package, version 4.2.1. To determine significant mean differences between groups, two-way ANOVA was performed using Tukey’s post hoc test (p<0.05). For washing time, soaking duration and texture analysis, the significance of differences was determined separately. For nigiri and hosomaki sushi, the significance of differences was determined independently.

3. Results and Discussion

3.1. Initial Characterisation of Sushi Rice

Analysis of rice samples from consecutive harvest seasons revealed significant variations in their initial compositional characteristics. The amylose content, a crucial parameter influencing sushi rice functionality and quality, exhibited marked differences between harvests. Samples from the 2020 harvest yielded an amylose content of 20%, whereas those from the 2019 harvest, demonstrated a notably lower amylose content of 15%. This inter-annual variation in amylose content suggests potential influences of environmental factors or agricultural practices on rice starch composition [22]. Such differences in amylose-to-amylopectin ratio are known to have significant impact on the physicochemical properties, cooking behaviour and textural attributes of rice [23]. In a study conducted by Mohapatra and Bal [14], it was revealed that cooking and textural properties depend more on the cultivars' chemical composition than physical characteristics. They found that high-amylose rice cooks faster than low-amylose varieties. Wang, et al. [24] reported that amylose content contributes to heterogeneity and can reduce starch product quality by increasing gelatinisation temperature and promoting retrogradation.
In Figure 1, the Brabender viscosity profiles are illustrated for two rice samples from different harvest years, alongside the applied temperature regime. The temperature profile, depicted by the purple curve, demonstrates the standardised heating and cooling cycles employed for both samples, ensuring comparable experimental conditions. The green curves represent the viscosity profiles of the rice starch suspensions during thermal processing. Sample A (20% amylose, 2020 harvest) exhibits a gradual viscosity increase with temperature elevation, reaching a peak at the point of starch gelatinisation. Subsequently, a decrease in viscosity is observed, indicative of starch granule disruption under prolonged thermal exposure. Upon cooling, a modest viscosity increase is noted. In contrast, Sample B (15% amylose, 2019 harvest) displays a higher peak viscosity, followed by a more pronounced viscosity reduction post-peak, suggesting enhanced granule breakdown.
The cooling phase for this sample is characterised by a more substantial viscosity increase, resulting in a higher terminal viscosity compared to Sample A. The observed variations in viscosity profiles can be attributed to the differential amylose content between the samples. The higher amylose content (20%) in the 2020 sample restricts granule swelling and promotes the formation of a more rigid gel structure upon cooling. Conversely, the lower amylose content (15%) in the 2019 sample facilitates extensive granule swelling, manifesting as higher peak viscosity and more significant breakdown during continued heating. The final viscosity disparities further reflect the influence of amylose-amylopectin ratios. The 2019 sample's higher terminal viscosity is consistent with its elevated amylopectin content, which forms a more viscous gel. In contrast, the 2020 sample shows a more stable viscosity profile during cooling, aligning with the characteristic behaviour of higher amylose content in forming a more rigid gel structure.
These findings highlight the significant impact of amylose content on the gelatinisation and pasting properties of rice starch, as evidenced by the distinct Brabender viscosity profiles. The 20% amylose rice exhibits controlled swelling and reduced breakdown during heating, resulting in a more stable gel upon cooling. In contrast, the 15% amylose rice demonstrates higher peak viscosity and more pronounced breakdown, culminating in a higher final viscosity due to the amylopectin-induced viscous gel formation.

3.2. Investigating the Sushi Rice Production Process

3.2.1. Washing and soaking Sushi Rice

The weight variation of rice samples subjected to a combination of different washing durations and subsequent soaking times are presented in Table 3. Washing time significantly (p<0.05) affected rice weight gain, with notable differences observed between W1 and W3, W4 and W6. Increasing washing time from 200 to 260-350 seconds appears to improve weight gain. While most other comparisons showed no significant differences (p<0.05), the results suggest that washing time has impact on rice weight gain, particularly within specific time ranges. The working hypothesis was that increasing the rinsing time would result in more water being absorbed during the washing process itself, which would reduce the amount of water that could be absorbed during the soaking process. The hypothesis turned out to be incorrect. The increase in washing time in the machine did not affect the ability to absorb water during rice soaking. On the other hand, it was found that with longer washing times (from 4 min 50 seconds upwards), the rice stuck more in the rice forming device, which resulted in nigiri balls with a more irregular shape and weight, requiring additional stops of the machine in order to clear out the stuck rice.
For all washing groups (Table 3), the rice exhibits a gradual rise in weight gain as soaking time extends from 15 to 45 minutes. However, no significant differences (p<0.05) were noted beyond 45 minutes. This pattern implies that rice achieves its peak absorption capacity within 30-45 minutes of soaking. Prolonged soaking beyond this period may result in minor weight reduction, likely caused by excessive water absorption (overhydration) or the breakdown and release of starches from the grains. Overall, while minor differences exist between washing groups and soaking durations, the data does not show a statistically significant (p<0.05) or consistent trend in weight gain.
For culinary applications such as sushi rice preparation, washing and soaking processes should aim for balanced hydration, avoiding excessive washing or overly long soaking to maintain grain integrity and prevent undesirable textural changes. Therefore, it was found in the study that rice washing for 230 s was enough to reach a good quality product and increasing this time not only does not benefit rice quality, but might even cause problems during the later forming process. Based on the washing time results, we selected a 230 second washing duration for subsequent soaking and shelf-life quality assessment of sushi rice.
Since no differences in rice weight gain were observed during the 15-75-minute soaking period, we examined how shorter soaking durations (0–15 minutes) impact water absorption. In Figure 2, it is depicted how varying periods of soaking influence water absorption in sushi rice, consequently, altering its total weight. During the initial soaking period (0-3 minutes), the rice showed a rapid increase in weight, suggesting a quick absorption phase. Initial rice weight increased from 0.75 kg to 0.84 kg during the first 3 minutes of soaking, demonstrating rapid water uptake. In a comparable study conducted by Kashaninejad et al. (2007), it was found that moisture content increased rapidly within the first 5 minutes. The researchers suggested this could be attributed to the presence of surface cracks and internal fissures in the grains, which likely formed during the milling process. During the soaking period of 3 to 6 minutes, the weight of the rice stabilized, indicating no further significant increase in water absorption. For longer soaking durations (6–15 minutes), the weight remained unchanged, suggesting that the grains reached a saturation point and can no longer absorb additional water under these conditions.
The findings demonstrate that extending soaking time beyond 3 minutes does not provide additional benefits in terms of water absorption. This information can be utilised during industrial rice preparation, in which time efficiency is important. Knowing that rice reaches near-maximum absorption by 3 minutes can help in planning cooking processes, ensuring the rice is adequately hydrated without unnecessary delay.
The impact of water temperature on weight gain during rice soaking was investigated by soaking rice in water at temperatures ranging from 10 to 50 ºC for 30 minutes. As illustrated in Figure 3, the initial rice weights after soaking were consistent across all temperature conditions. The uniformity of the results demonstrates that temperature had minimal impact on water absorption. While it was expected that warmer water will facilitate greater absorption, the data revealed no such relationship with no significant differences observed between temperatures. The practical implication of this finding is that rice can be soaked in regular tap water without temperature adjustment, as the absorption process reaches equilibrium regardless of water temperature within this range.

3.2.2. Seasoning

The addition of vinegar mix serves several functions in the case of sushi rice. It is responsible for the specific sensory qualities of the product, giving it the proper taste and aroma. In addition, by lowering the pH of rice, it extends its shelf-life during storage. The findings obtained by [25] demonstrated that reducing the pH to 4 significantly slows down the process of retrogradation compared to higher pH levels. This reduction in retrogradation preserves the desired softness and stickiness of the rice, essential for maintaining its textural qualities during storage. The addition of vinegar mix with a large amount of sucrose also increases the stickiness of the rice after it has been cooled and may inhibit the retrogradation process [26]. The addition of a properly configured vinegar mix is therefore a key parameter in obtaining rice of the right quality during storage. In addition, vinegar mix can be a good source of introducing thermolabile additive ingredients that cannot be used at the cooking stage.
The pH of cooked rice, without the addition of vinegar mix, ranges from 7.1 to 7.3, depending on the amount of water added during cooking. The addition of vinegar mix lowered the pH to below 4.5 relatively quickly. A greater reduction in pH, however, requires a significant increase in the amount of vinegar mix or vinegar concentration in the mix. For example, the addition of more mix 3, with the highest amount of vinegar, lowered the pH to only 4.08, while the addition of the same amount of vinegar mix with a smaller amount of vinegar (mix 2) reduced the pH to 4.09 (Table 2). In the case of adding 180 g/kg of the seasoning, it was difficult to evenly distribute the mix in the product and leakage accumulated at the bottom of the container, regardless of mixing duration. This explains the small difference in pH between rice with mixes 2 and 3.
Table 2. pH of rice with addition of various vinegar mixes.
Amount Seasoned Rice 1 Seasoned Rice 2 Seasoned Rice 3 Seasoned Rice 4
120 g/kg 4.28 ± 0.01 4.22 ± 0.01 4.18 ± 0.01 4.46 ± 0.10
180 g/kg 4.16 ± 0.02 4.09 ± 0.01 4.08 ± 0.01 4.33 ± 0.02
Table 3. Rice weight gain depending on length of soaking and rinsing process.
Group WashingDuration [s] Initial Weight After Soaking (%)
15 min 30 min 45 min 60 min 75 min
W1 200 112.50a ± 0.71 112.50a ± 0.71 113a ± 0 112.50a ± 0.71 112a ± 0
W2 230 112.50a ± 0.71 113a ± 0 112.5a ± 0.71 112.50a ± 0.71 110.50a ± 2.12
W3 260 114b ± 1.41 116c ± 0 115.5c ± 0.71 115bc ± 1.41 113b ± 0
W4 290 113.50b ± 0.71 116c ± 0 116.5c ± 2.12 114.50b ± 0.71 113.50b ± 0.71
W5 320 114b ± 1.41 114.50bc ± 2.12 114b ± 1.41 114.50b ± 2.12 112.50a ± 0.71
W6 350 114.50b ± 2.12 116c ± 0 116c ± 0 114.50b ± 2.12 113.50b ± 0.71
Initial weight after soaking (%) at different washing times for each group. Values are expressed as mean ± standard deviation. Values with different superscript letters (a-c) in the same column indicate significant differences (p<0.05).

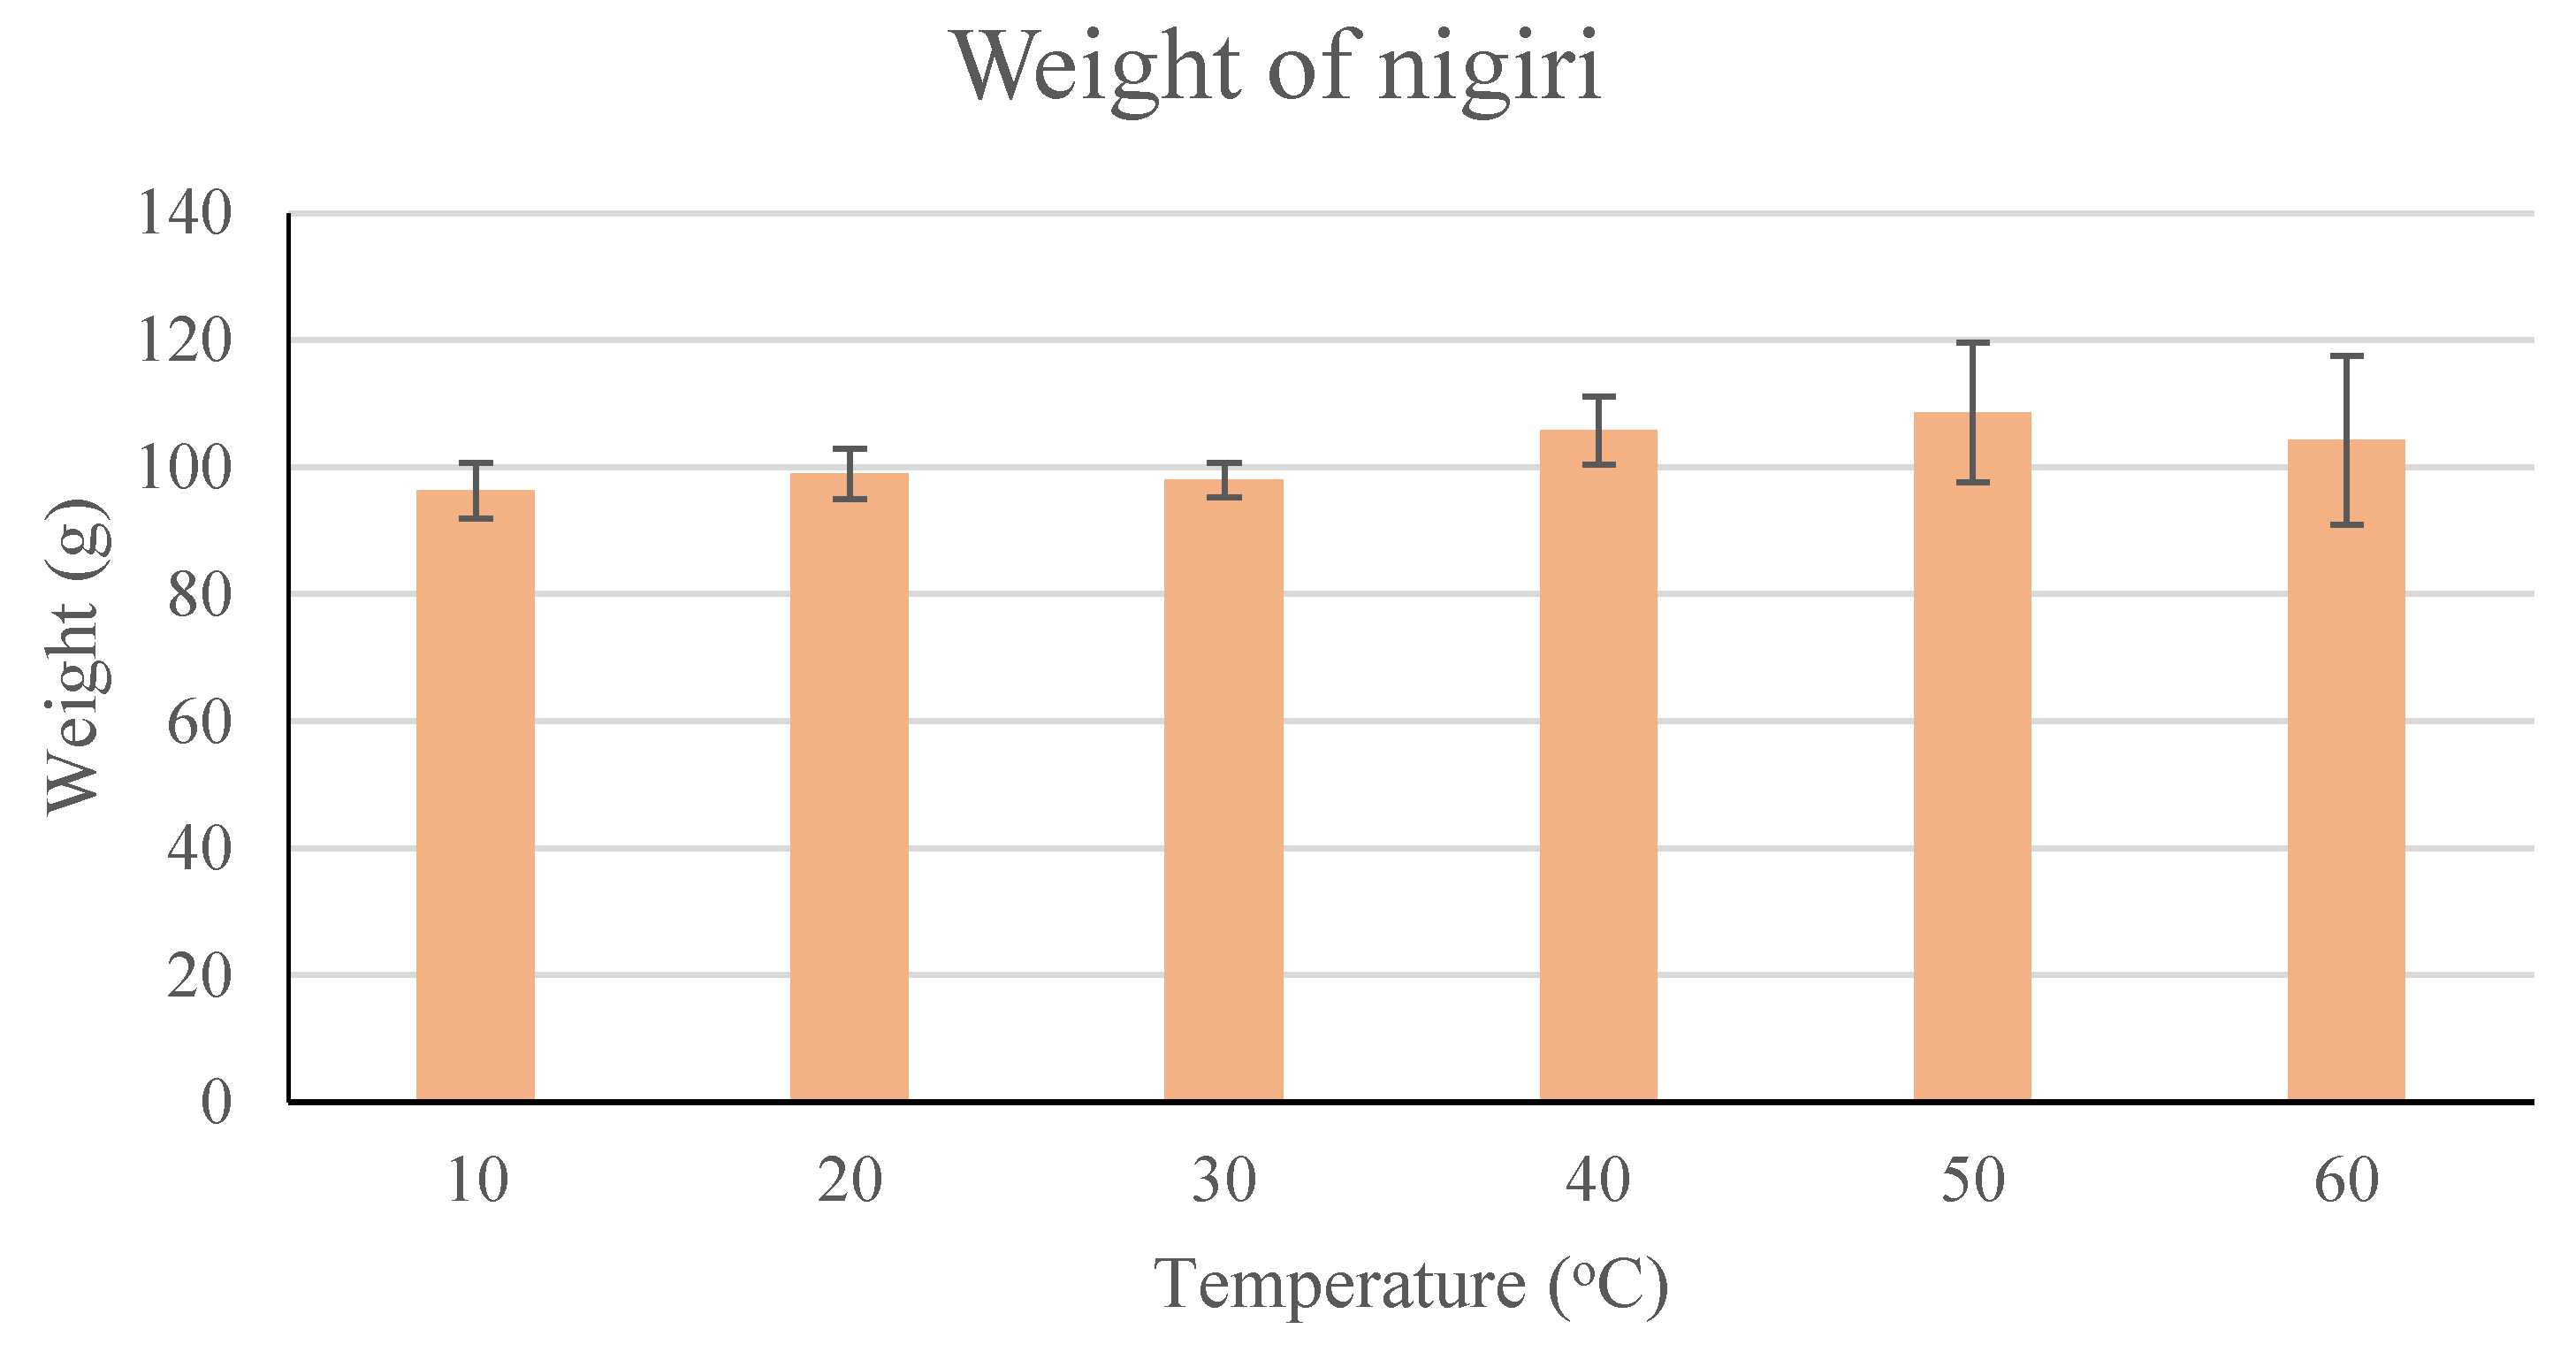
3.2.3. Nigiri Ball Weight at Different Temperatures

Improper temperature and water-to-rice ratios adversely affect nigiri formation and quality. At temperatures above 38 °C, rice becomes overly soft and mushy, compromising its structural integrity. Conversely, temperatures below 30 °C reduce the rice's natural stickiness, hindering its ability to form cohesive shapes. Similarly, a high water-to-rice ratio (>1.8:1) results in overly soft rice with compromised grain integrity, producing dense and compact nigiri, while excess surface stickiness combined with internal mushiness negatively influences texture and presentation. A low water-to-rice ratio (<1.3:1) yields rice that is too firm and prone to crumbling, making moulding difficult. Maintaining optimal temperature and hydration levels ensures consistent, high-quality nigiri with desirable taste and texture.
In Figure 4, it is illustrated how different temperatures affect the weight of nigiri when shaping cooked rice. There appears to be a slight increase in weight as temperature increases from 10 °C to 50 °C, followed by a small decrease at 60 °C. The error bars increase in size at higher temperatures, indicating greater variability in weight measurements at these temperatures. The total change in weight across the temperature range is relatively small, with the difference between the lowest and highest mean weights being approximately 11 g.
During nigiri formation, the temperature of sushi rice plays a crucial role in determining how well it can be shaped and maintain its form. Temperature affects both the handling characteristics and final weight of the nigiri in distinct ways: when the rice is warmer (30-40 °C), it becomes more malleable and easier to shape. Under these conditions, less compression force is needed, typically resulting in a lighter final weight of nigiri pieces.
Conversely, when the rice is cooler (20-29 °C), it becomes firmer and more resistant to shaping. More pressure is required during formation to get the grains to stick together. The increased compression typically results in denser, slightly heavier nigiri.
The relationship between temperature and weight is largely due to how much compression is required at different temperatures to achieve proper formation. Working with rice at the right temperature helps achieve consistent weight across pieces without over-compressing.

3.3. Shelf-Life Study of Cooked Sushi Rice

3.3.1. TPA

3.3.1.1. Different Washing Time on TPA

In Table 4, data is provided on TPA parameters for different storage times. These parameters are influenced by the washing time which, in turn, affects the quality and characteristics of the samples. Hardness generally significantly increases (p<0.05) with storage time for all samples. For example, in W1, hardness increases from 51.39 N on day 1 to 132 N on day six. This indicates that over time, the samples become harder, which could be due to re-crystallisation of starch over time. Shorter washing durations (W1) may leave more surface starch, initially contributing to higher cohesiveness and hardness, while prolonged washing (W2-W5) removes excess starch, resulting in softer textures. However, with extended washing (W6), the rice exhibits the highest initial hardness at 77.49N, suggesting a complex relationship between washing duration and textural properties.
The adhesiveness shows a marked decrease with increased storage time, although with minor fluctuations, as observed in sample W2. For example, in W4, it increases (p<0.05) from -645.30 on day one to -10.80 on day six. The observed decrease in adhesiveness value (less sticky) may be attributed to the progressive retrogradation of starch molecules, particularly the reassociation of amylose and amylopectin chains [27]. Springiness remains relatively constant but exhibits slight fluctuations (p<0.05). For example, in W2, it starts at 0.71 on day one, drops to 0.39 on day four, and then to 0.64 on day six. The stability of springiness suggests that the rice maintains its elastic properties even as other textural attributes change. This is crucial for the structural integrity of sushi rice, ensuring it can recover its shape after compression during handling or consumption.
Cohesiveness does not change greatly significantly across storage times, maintaining within a small range. For W5, it stays around 0.56 to 0.52 (p<0.05) over the storage period. Cohesiveness, indicating the internal bonding strength of the rice grains, appears unaffected by washing duration or storage time. This stability ensures that the rice maintains its compact form, an essential characteristic for sushi preparation. Chewiness exhibits a general increase (p<0.05) with storage time, as evidenced in sample W3, for which values rise from 11.85 on day one to 60.96 on day six. This trend indicates progressive textural changes in the rice, likely due to starch retrogradation and molecular restructuring. The increased chewiness suggests that samples become firmer and require more masticatory effort over time, reflecting changes in the rice's textural properties during storage. Resilience remains relatively stable across the storage times, with slight fluctuations (p<0.05). For example, The resilience of W6 ranges from 0.18 to 0.24. The uniformity in resilience across treatments indicates that this property is not significantly influenced by washing duration or storage.
As storage duration increases, the TPA parameters generally indicate that the samples become harder, adhesive and chewier. This is a typical behaviour for products that lose moisture and become denser over time [28]. The washing time, although not explicitly stated, can be inferred to have a role in the initial texture of the rice [29]. If washing time affects the removal of certain components, it could influence the initial hardness and adhesiveness [10]. However, the data suggests that storage time has a more pronounced effect on the TPA parameters than the initial washing duration. The trends are consistent across all samples, suggesting that the washing processes affecting texture are similar across different sample groups. For optimal sushi quality, shorter washing durations may be preferred for immediate use, while extended storage requires careful moisture control to mitigate the effects of retrogradation and maintain desired textural properties.

3.3.1.2. Different Water to Rice Ratio on TPA

In Table 5, the TPA parameters are presented for rice cooked with varying water-to-rice ratios, measured for different storage durations. The hardness of the rice significantly varied (p<0.05) between the groups and across the storage period. R1, having the lowest water content, exhibited the highest hardness values (p<0.05) after 10 days (538.1±27.73 N), maintaining its firmness better than other groups. Conversely, R5 consistently showed the lowest hardness across all storage times, indicating a softer texture (161.6±12.82 N on day 10). This suggests that higher water-to-rice ratios lead to softer rice, while lower ratios (R1) preserve hardness over extended storage. The increase in hardness (p<0.05) for R2 from day four to day 10 (265.4±19.55 N to 415.3±11.09 N) reflects the retrogradation process, in which starch crystallizes, contributing to texture changes.
Adhesiveness, measured as the negative force required to overcome stickiness, was lowest (least adhesive) (p<0.05) in R1 throughout storage (-369.3±70.25 on day one, -532.1±73.5 on day 10). In contrast, R5 exhibited the highest adhesiveness (-1474±11.18 on day one, -1228±47.98 on day 10), indicating that rice with higher water-to-rice ratios tends to remain stickier. The decline in adhesiveness (p<0.05) for all groups over time may be attributed to moisture redistribution and retrogradation, which reduce stickiness. In a similar study by Tadele, et al. [25], it was found that sushi rice became notably less sticky, showing a significant reduction in adhesiveness during the two-week storage period. Springiness remained relatively consistent across all groups, with values ranging from 0.87 to 1.03. These findings allow to indicate that the water-to-rice ratio has minimal impact on springiness during the storage period. The elastic properties of the cooked rice matrix were largely maintained, even as hardness and adhesiveness change. Cohesiveness values were generally low (p<0.05), ranging from 0.16 to 0.44, and they varied minimally across groups. R1 demonstrated higher cohesiveness on day 10 (0.44±0.26), suggesting that lower water-to-rice ratios may enhance structural integrity over time. On the other hand, the decrease in cohesiveness for R5 (0.16±0.27 on day 10) resulted in weaker internal bonding, particularly after storage.
Chewiness is influenced by a combination of hardness, cohesiveness and springiness. Lower water ratios (R1) create firmer grains, contributing to higher chewiness. Over time, the retrogradation process further enhances chewiness due to the increased firmness of rice. R1 showed the highest chewiness values throughout the study, with a peak of 155.4±14.19 on day four and a slight decrease (p<0.05) by day 10 (152.9±13.52). In contrast, R5 exhibited the lowest chewiness values across the storage period (22.15±7.07 on day 10), reflecting its softer and less cohesive texture. These results suggest that higher water content reduces chewiness, potentially making the rice more appealing for specific uses. Resilience showed a gradual decline in most groups over the storage period, with R1 exhibiting the highest values (p<0.05) on day 10 (0.21±0.15), indicating its ability to recover its structure after deformation. R5 had the lowest resilience (0.05±0), which correlates with its lower cohesiveness and chewiness, indicating structural degradation over time in rice with higher water content.
In summary, the results of the TPA indicate that the water-to-rice ratio significantly influences the textural attributes of cooked rice during storage. Lower water-to-rice ratios (e.g. R1) result in firmer, less adhesive rice with higher cohesiveness and resilience, maintaining its structural integrity over 10 days. Conversely, higher water-to-rice ratios (e.g. R5) produce softer, stickier rice with reduced chewiness and resilience, potentially limiting its shelf stability. These findings underscore the importance of optimising the water-to-rice ratio to achieve the desired textural properties for specific applications, while minimising the impact of storage on rice quality. For sushi preparation, moderate water-to-rice ratios (e.g. R3 or R4) may provide balance between softness, stickiness and cohesiveness, particularly in the case of rice intended for immediate use. For storage, adjustments to minimise retrogradation, such as controlling temperature and humidity, are essential to maintain optimal texture.

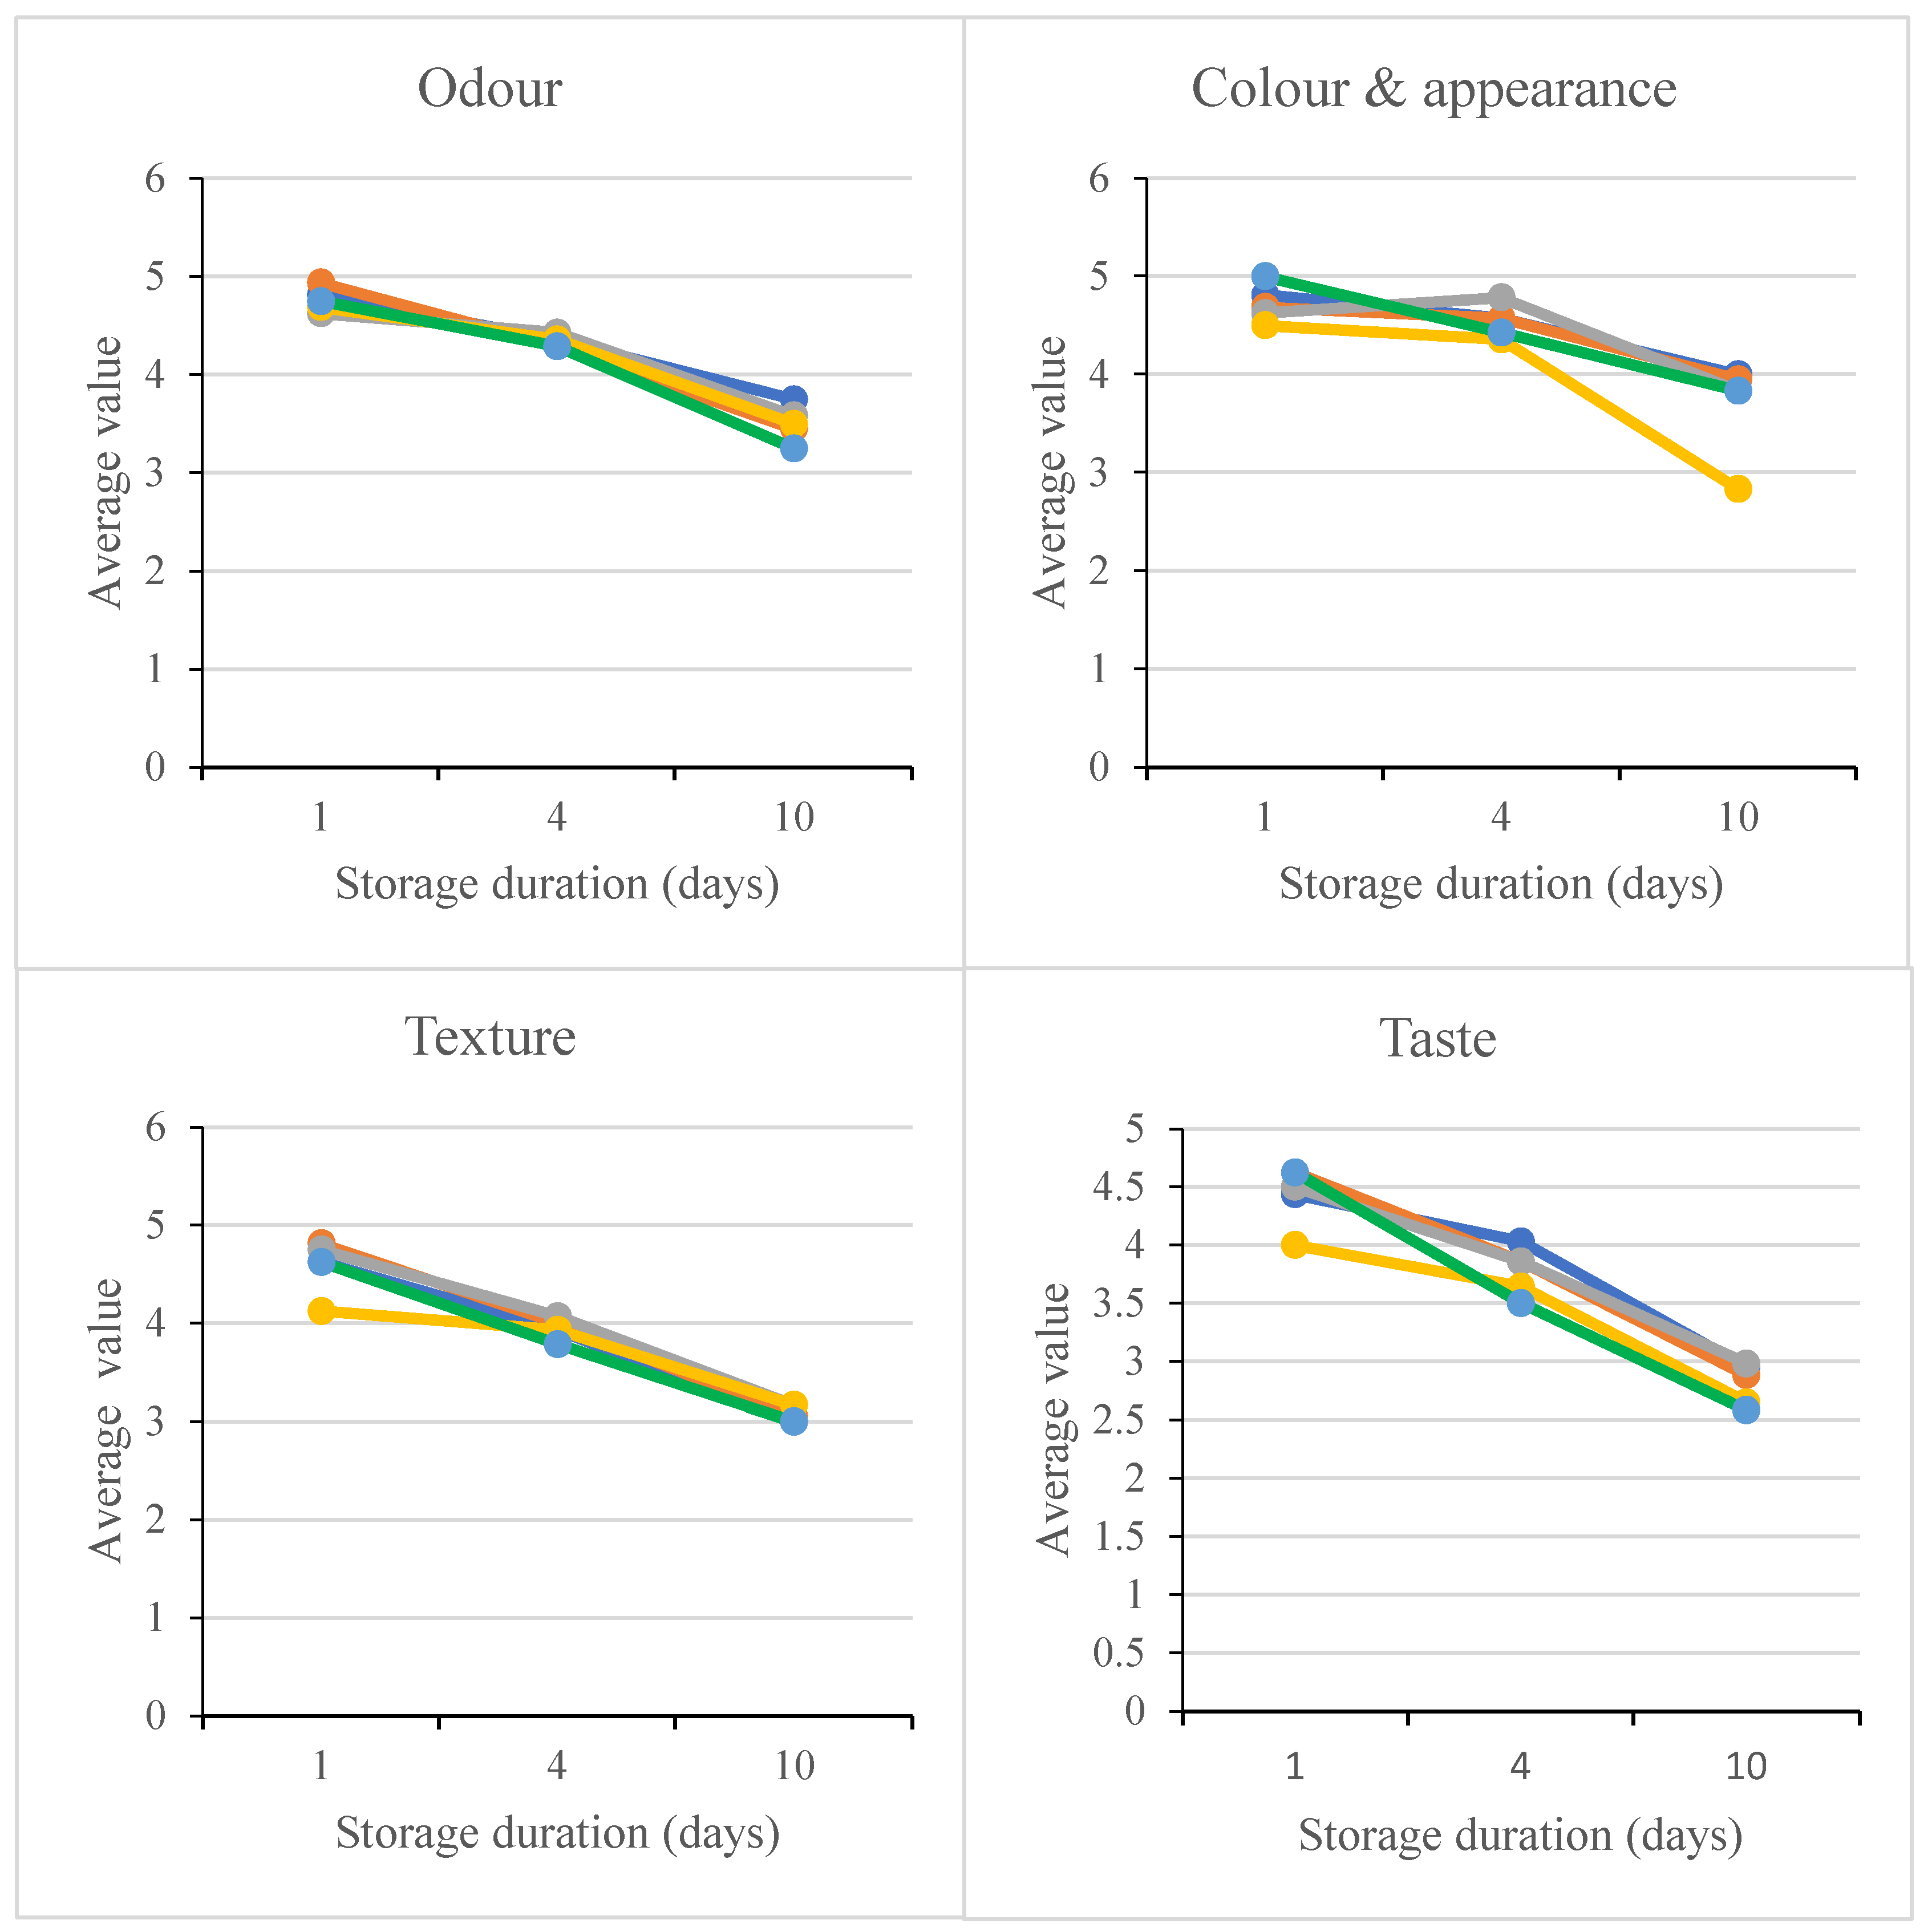
3.2.2. Sensory Evaluation

While the organoleptic characteristics of cooked sushi rice are fundamentally defined by its seasoning, the conventional preparation methodology involves the incorporation of sushi vinegar, a composite solution prepared from rice vinegar, sugar and salt. The sugar and salt components serve a dual functional role: primarily modulating the vinegar's acidic profile and secondarily enhancing the taste. These acidic interventions demonstrate the capacity to restore sensory freshness and decrease hardening phenomena observed in prolonged cooked rice storage [30].
The sensory analysis of differently processed sushi rice samples over a 10-day period are illustrated in Figure 5. Evaluated sensory attributes included odour, taste, texture, colour, appearance and overall acceptability. The data in the figure allow to suggest that the water to rice ratio used in cooking sushi rice can have impact on odour profile and its changes during storage. This indicates that the rice samples experience a decline in odour quality as they are stored for longer periods. On day one, the different rice samples show varying initial odour values, with R2 having the highest baseline odour and R1 the lowest.
On day one, the sushi rice samples demonstrate varying initial colour and appearance scores, with R2 and R3 having the highest scores, and R1 the lowest. The different R1 to R5 water to rice ratios result in distinct texture profiles during storage. Samples R2 and R3 began with higher texture scores but declined more rapidly compared to samples R1 and R5. For all the rice samples, the taste scores declined over the 10-day storage period. However, the rate of decline differed between the samples. Samples R3 and R3 started with higher taste scores but declined more rapidly compared to samples R1 and R5. Bett-Garber, et al. [20] found that water-to-rice ratio significantly impacts texture quality, and optimising this ratio can maximise cooked rice texture without altering flavour. Colour and appearance ratings exhibited a less pronounced decline compared to other attributes, suggesting that these characteristics were less affected by storage time. The analysis indicates that odour and taste are significantly influenced by storage time, with noticeable declines over the 12-day period. In contrast, colour and appearance were the least affected, with most samples maintaining relatively high ratings. Notably, R1 and R5 generally maintained higher ratings across most attributes, suggesting that the specific water-to-rice ratio may be more effective in preserving sensory qualities.
A clear downward trend in overall acceptability was observed for all rice samples over the 10 days. However, the rate of decline differs between the samples. This suggests that the water to rice ratio used in cooking sushi rice can have significant impact on the overall acceptability of the rice during storage. On day one, the sushi rice samples have varying initial overall acceptability scores, with R2 demonstrating the highest and R1 having the lowest. The final days showed a more pronounced drop in ratings, indicating increased degradation of sensory qualities. The general decline in overall acceptability suggests that the sensory qualities of the rice degrade over time, impacting the perceived quality. In summary, the water-to-rice ratio used in cooking sushi rice appears to be a critical factor influencing the sensory profile and shelf-life of the final product.

4. Conclusions

This study concludes that amylose content plays a significant role in the gelatinisation and pasting properties of sushi rice. Rice samples from different harvest years exhibited varying amylose contents (15-20%), significantly influencing their gelatinisation and pasting behaviour. Higher amylose content results in a more stable gel structure and less retrogradation during cooling, whereas lower amylose content facilitates greater granule swelling and softer texture. The soaking time and washing duration influence water absorption and grain integrity, with optimal soaking periods around three minutes showing the best balance for sushi rice preparation. In the study, it was revealed that washing rice for 230 seconds provided optimal results. Nigiri ball formation was optimal within a temperature range of 30-40 °C, ensuring proper cohesion. Additionally, the water-to-rice ratio significantly influences texture, with lower ratios resulting in firmer, more cohesive rice, while higher ratios lead to softer, stickier rice. Sensory evaluation confirmed that the water-to-rice ratio affects rice quality attributes such as odour, taste, and overall acceptability during storage. Proper control of these preparation parameters is essential for achieving high-quality sushi rice with desirable sensory and textural properties over its shelf-life. These insights emphasize the necessity of meticulous preparation techniques to enhance sushi rice quality, offering valuable guidelines for culinary professionals and rice breeders aiming to improve end-use quality.

References

  1. P. Kulawik and D. Dordević, "Sushi processing: microbiological hazards and the use of emerging technologies," Critical Reviews in Food Science and Nutrition, vol. 62, no. 5, pp. 1270-1283, 2022. [CrossRef]
  2. Y. Hong et al., "Quality characteristics of rice varieties suitable for sushi," Korean Journal of Crop Science/Hanguk Jakmul Hakhoe Chi, vol. 57, no. 4, pp. 436-440, 2012. [CrossRef]
  3. E. Hebishy, D. Buchanan, J. Rice, and S. Oyeyinka, "Variation in amylose content in three rice variants predominantly influences sushi rice," 2024. Journal of Food Measurement and Characterization (2024) 18:4545–4557. [CrossRef]
  4. M.-Y. Kang, C. W. Rico, and S.-C. Lee, "Physicochemical properties of eight popular glutinous rice varieties in Korea," Plant Production Science, vol. 13, no. 2, pp. 177-184, 2010. [CrossRef]
  5. W. Tadele, P. Kulawik, A. Szymkowiak, A. R. Jambrak, Y. Ozogul, and F. Ozogul, "Cold-Storage Preservation of Cooked Rice Quality: Exploring Challenges and Strategies, Featuring Insights on Sushi Rice," Food Bioscience, p. 104553, 2024. [CrossRef]
  6. C. J. Bergman, "Rice end-use quality analysis," Chemistry and Technology 2019, pp. 273-337. [CrossRef]
  7. H. Li, S. Prakash, T. M. Nicholson, M. A. Fitzgerald, and R. G. Gilbert, "The importance of amylose and amylopectin fine structure for textural properties of cooked rice grains," Food Chemistry, vol. 196, pp. 702-711, 2016. [CrossRef]
  8. E. T. Champagne et al., "Important sensory properties differentiating premium rice varieties," Rice, vol. 3, pp. 270-281, 2010. [CrossRef]
  9. G. P. Yadav, D. Kumar, C. G. Dalbhagat, and H. N. Mishra, "A Comprehensive Review on Instant rice: Preparation Methodology, Characterization, and Quality Attributes," Food Chemistry Advances, p. 100581, 2023. [CrossRef]
  10. L. Yu, M. Turner, M. Fitzgerald, J. Stokes, and T. Witt, "Review of the effects of different processing technologies on cooked and convenience rice quality," Trends in Food Science & Technology, vol. 59, pp. 124-138, 2017. [CrossRef]
  11. L. Yu, M. S. Turner, M. Fitzgerald, J. R. Stokes, and T. Witt, "Review of the effects of different processing technologies on cooked and convenience rice quality," Trends in Food Science & Technology, vol. 59, pp. 124-138, Jan 2017. [CrossRef]
  12. L. Zhu et al., "Effect of soaking and cooking on structure formation of cooked rice through thermal properties, dynamic viscoelasticity, and enzyme activity," Food Chemistry, vol. 289, pp. 616-624, Aug 15 2019. [CrossRef]
  13. Y. Tian, J. Zhao, Z. Xie, J. Wang, X. Xu, and Z. Jin, "Effect of different pressure-soaking treatments on color, texture, morphology and retrogradation properties of cooked rice," LWT-Food Science and Technology, vol. 55, no. 1, pp. 368-373, 2014. [CrossRef]
  14. D. Mohapatra and S. Bal, "Cooking quality and instrumental textural attributes of cooked rice for different milling fractions," Journal of Food Engineering, vol. 73, no. 3, pp. 253-259, 2006. [CrossRef]
  15. M. Altheide, R. Morawicki, and T. Hager, "Impact of milling and water-to-rice ratio on cooked rice and wastewater properties," Food Science and Technology International, vol. 18, no. 3, pp. 291-298, 2012. [CrossRef]
  16. M. Peleg, "Quantitative instrumental assessment of cooked rice stickiness," Food Engineering Reviews, vol. 12, no. 4, pp. 452-459, 2020. [CrossRef]
  17. Y. Yamaguchi, Y. OkAWA, K. Ninomiya, H. Kumagai, and H. Kumagai, "Evaluation and suppression of retrogradation of gelatinized rice starch," Journal of Nutritional Science and Vitaminology, vol. 65, no. Supplement, pp. S134-S138, 2019. [CrossRef]
  18. K. Tao, W. Yu, S. Prakash, and R. G. Gilbert, "Investigating cooked rice textural properties by instrumental measurements," Food Science and Human Wellness, vol. 9, no. 2, pp. 130-135, 2020. [CrossRef]
  19. S. Yu, Y. Ma, and D.-W. Sun, "Impact of amylose content on starch retrogradation and texture of cooked milled rice during storage," Journal of Cereal Science, vol. 50, no. 2, pp. 139-144, 2009. [CrossRef]
  20. K. L. Bett-Garber, E. T. Champagne, D. A. Ingram, and A. M. McClung, "Influence of water-to-rice ratio on cooked rice flavor and texture," Cereal Chemistry, vol. 84, no. 6, pp. 614-619, 2007. [CrossRef]
  21. M. R. A. Avaro, Z. Pan, T. Yoshida, and Y. Wada, "Two alternative methods to predict amylose content of rice grain by using tristimulus CIE lab values and developing a specific color board of starch-iodine complex solution," Plant Production Science, vol. 14, no. 2, pp. 164-168, 2011. [CrossRef]
  22. H.-S. Kim, B. Patel, and J. N. BeMiller, "Effects of the amylose–amylopectin ratio on starch–hydrocolloid interactions," Carbohydrate Polymers, vol. 98, no. 2, pp. 1438-1448, 2013. [CrossRef]
  23. E.-H. Jang et al., "Correlation between physicochemical properties of japonica and indica rice starches," LWT-Food Science and Technology, vol. 66, pp. 530-537, 2016. [CrossRef]
  24. S. Wang, P. Li, J. Yu, P. Guo, and S. Wang, "Multi-scale structures and functional properties of starches from Indica hybrid, Japonica and waxy rice," International Journal of Biological Macromolecules, vol. 102, pp. 136-143, 2017. [CrossRef]
  25. W. Tadele et al., "Effects of multilayer Nano/Mini Furcellaran/Chitosan Emulsions with oregano essential oil and bioactive peptides on sensory, physicochemical properties and retrogradation in Sushi in cold storage conditions," Innovative Food Science & Emerging Technologies, vol. 96, p. 103767, 2024. [CrossRef]
  26. S. Wang, C. Li, L. Copeland, Q. Niu, and S. Wang, "Starch Retrogradation: A Comprehensive Review," Comprehensive Reviews in Food Science and Food Safety, vol. 14, no. 5, pp. 568-585, 2015. [CrossRef]
  27. R. Sumida, C. Inaguma, and K. Kawai, "Effects of maltotriose syrup, water content, and pH on the retrogradation of cooked rice in chilled storage," Journal of Food Measurement and Characterization, vol. 16, no. 4, pp. 2510-2517, 2022. [CrossRef]
  28. F. Balestra, "Empirical and fundamental mechanical tests in the evaluation of dough and bread rheological properties," 2009. [CrossRef]
  29. H. Li, J. Yang, M. Gao, J. Wang, and B. Sun, "Washing rice before cooking has no large effect on the texture of cooked rice," Food Chemistry, vol. 271, pp. 388-392, 2019. [CrossRef]
  30. C. N. Molina, R. Garzón, and C. M. Rosell, "Unraveling seasonings impact on cooked rice quality: Technological and nutritional implications for sushi," Journal of Cereal Science, vol. 104, p. 103442, 2022. [CrossRef]
Figure 1. Gelatinisation profiles for rice harvested in 2020 (A) and 2019 (B.
Preprints 149591 g001
Figure 2. Effect of soaking duration on rice weight gain.
Preprints 149591 g002
Figure 3. Rice weight gain after soaking in water at different temperatures.
Preprints 149591 g003
Figure 4. Impact of temperature on nigiri weight and repeatability during formation.
Preprints 149591 g004
Figure 5. Sensory evaluation of cooked sushi rice stored for 10 days.
Preprints 149591 g005
Table 1. Composition of vinegar mixes [%].
Ingredient Mix 1 Mix 2 Mix 3 Mix 4
Rice vinegar 52 64 76 40
Sugar 42 31 21 52
Salt 6 5 3 8
Table 4. TPA results for sushi rice with different washing and storage durations.
Storage Duration(Days) Group Hardness (N) Adhesiveness Springiness Cohesiveness Chewiness Resilience
1 W1 51.39def ± 17.79 -730.1def ± 8.67 0.88a ± 0.13 0.54a ± 0.07 24.28bcde ± 8.71 0.21a ± 0.02
4 110bc ± 12.56 -164bg ± 21.95 0.84a ± 0.02 0.43a ± 0.03 40.13abcd ± 2.56 0.21a ± 0.01
6 132ab ± 5.37 -19ab ± 14.28 0.67a ± 0.36 0.51a ± 0.08 50.72ab ± 5.03 0.24a ± 0.03
1 W2 11.46g ± 3.19 -658.5c ± 33.44 0.71a ± 0.26 0.57a ± 0.10 18.74de ± 18.82 0.22a ± 0.03
4 36.14efg ± 13.15 -51.05cde ± 5.10 0.39a ± 0.11 0.57a ± 0.05 8.47e ± 4.46 0.26a ± 0.03
6 129.50ab ± 5.65 -113ab ± 43.95 0.64a ± 0.17 0.51a ± 0.10 50.23abc ± 1.73 0.24a ± 0.04
1 W3 29.65fg ± 13.44 -653.40cd ± 20.91 0.73a ± 0.24 0.53a ± 0.08 11.85e ± 6.61 0.20a ± 0.03
4 63.54de ± 9.63 -134.10ef ± 17.02 0.67a ± 0.12 0.47a ± 0.02 23.29bcde ± 10.33 0.22a ± 0.02
6 166.20a ± 13.56 -8.32a ± 3.24 0.60a ± 0.39 0.54a ± 0.14 60.96a ± 19.88 0.26a ± 0.05
1 W4 42.10fg ± 12.60 -645.30cd ± 30.80 0.76a ± 0.21 0.54a ± 0.08 18.96de ± 13.50 0.20a ± 0.02
4 76.60de ± 11.00 -103.50c ± 16.00 0.58a ± 0.12 0.50a ± 0.03 27.62bcde ± 7.80 0.23a ± 0.02
6 146.10ab ± 8.00 -10.80a ± 8.20 0.60a ± 0.31 0.53a ± 0.09 55.11ab ± 6.10 0.25a ± 0.03
1 W5 31.20fg ± 10.20 -649.8cd ± 25.50 0.78a ± 0.23 0.56a ± 0.09 15.81de ± 12.1 0.21a ± 0.02
4 69.50def ± 12.80 -92.80c ± 12.50 0.63a ± 0.10 0.49a ± 0.04 22.64bcde ± 6.90 0.23a ± 0.02
6 155.30a ± 9.40 -16.10a ± 9.00 0.59a ± 0.28 0.52a ± 0.10 58.84a ± 7.20 0.25a ± 0.03
1 W6 77.49cd ± 16.47 -654.20fg ± 41.48 0.82a ± 0.23 0.48a ± 0.05 22.38cde ± 13.15 0.18a ± 0.01
4 27.11fg ± 4.90 -45.93cd ± 14.20 0.55a ± 0.30 0.59a ± 0.11 13.61e ± 11.67 0.24a ± 0.05
6 139.90ab ± 12.36 -23.41ab ± 17.43 0.55a ± 0.48 0.54a ± 0.08 57.62a ± 4.01 0.24a ± 0.04
The letters (a-g) indicate statistical differences (p<0.05) between the means. Means sharing the same letter are not significantly different.
Table 5. TPA results for sushi rice cooked in different rice-to-water ratios and storage durations.
Storage Duration(Days) Group Hardness (N) Adhesiveness Springiness Cohesiveness Chewiness Resilience
1 R1 406.30cd ± 15.13 -369.30a ± 70.25 0.99a ± 0.02 0.27ab ± 0.01 109.50b ± 6.56 0.14abcd ± 0.01
4 538.90a ± 23.85 -718.80c ± 14.44 0.99a ± 0.02 0.30ab ± 0.02 155.40a ± 14.19 0.16ab ± 0.01
10 538.10a ± 27.73 -532.10b ± 73.50 0.89a ± 0.26 0.44a ± 0.26 152.90a ± 13.52 0.21a ± 0.15
1 R2 411.30c ± 19.49 -1650j ± 30.44 0.88a ± 0.27 0.25b ± 0.02 100.60bc ± 10.67 0.12abcd ± 0.01
4 265.40b ± 19.55 -913.10d ± 58.51 1.00a ± 0.00 0.29ab ± 0.00 138.10a ± 7.68 0.15abc ± 0.01
10 415.30c ± 11.09 -948.70de ± 39.37 0.99a ± 0.02 0.29ab ± 0.02 117.20b ± 10.20 0.14abcd ± 0.02
1 R3 301.20fg ± 11.18 -1341hi ± 27.12 0.99a ± 0.02 0.22b ± 0.01 63.88ef ± 1.73 0.09bcd ± 0.00
4 325.40ef ± 29.41 -1127fg ± 5.16 1.00a ± 0.00 0.23b ± 0.00 74.76de ± 5.53 0.11bcd ± 0.01
10 365de ± 15.48 -669.60bc ± 27.26 1.00a ± 0.00 0.23b ± 0.00 85.32cd ± 8.83 0.11bcd ± 0.01
1 R4 225.60h ± 19.14 -1292gh ± 39.87 1.03a ± 0.06 0.22b ± 0.02 50.07fg ± 3.79 0.09bcd ± 0.01
4 265.40gh ± 15.71 -1155fg ± 25.10 1.00a ± 0.01 0.20b ± 0.01 51.85f ± 4.21 0.08bcd ± 0.00
10 276g ± 17.29 -1122f ± 54.31 0.88a ± 0.26 0.20b ± 0.26 48.07fg ± 14.42 0.08bcd ± 0.01
1 R5 167.30i ± 13.64 -1474i ± 11.18 0.99a ± 0.02 0.20b ± 0.01 32.36gh ± 3.41 0.08bcd ± 0.03
4 169.20i ± 12.20 -1117ef ± 13.98 0.87a ± 0.24 0.17b ± 0.24 24.53h ± 7.48 0.06cd ± 0.01
10 161.60i ± 12.82 -1228fgh ± 47.98 0.88a ± 0.27 0.16b ± 0.27 22.15h ± 7.07 0.05d ± 0.00
Values are presented as mean ± standard deviation. Within each column, means marked with different letters (a-i) significantly different from one another (p<0.05).
Disclaimer/Publisher’s Note: The statements, opinions and data contained in all publications are solely those of the individual author(s) and contributor(s) and not of MDPI and/or the editor(s). MDPI and/or the editor(s) disclaim responsibility for any injury to people or property resulting from any ideas, methods, instructions or products referred to in the content.
Copyright: This open access article is published under a Creative Commons CC BY 4.0 license, which permit the free download, distribution, and reuse, provided that the author and preprint are cited in any reuse.

Downloads

47

Views

35

Comments

0

Subscription

Notify me about updates to this article or when a peer-reviewed version is published.

Email

Prerpints.org logo

Preprints.org is a free preprint server supported by MDPI in Basel, Switzerland.

Subscribe

© 2025 MDPI (Basel, Switzerland) unless otherwise stated