
Submitted:
14 February 2025
Posted:
17 February 2025
You are already at the latest version
Abstract
The early warning systems based on statistical prediction models; indicators of environmental risks and remote sensing constitute an essential source of environmental information for the development of these warning systems. The present work is focused on the use of remote sensing for the estimation of the risk of transmission and the prediction of malaria cases in the northwest of Argentina. The study was carried out in the city of San Ramón de la Nueva Orán, where cases of the disease have been reported from 1986 to 2005. The existent relationship between reported malaria cases and climatic/environmental variables (Normalized Difference Vegetation Index (NDVI), Normalized Difference Water Index (NDWI) and Land Surface Temperature (LST)), obtained from Landsat 5 and 7 satellite images, was analyzed through multilevel Poisson regression analyses. A higher abundance of reported cases of malaria in summer was observed. A model of ARIMA (Autoregressive Integrated Moving Average) temporal series, which included the environmental variables, was generated to forecast malaria cases in the year 2000. In turn, the relationship between malaria cases and environmental/climatic factors showed that malaria cases were associated with an increase in LST and mean temperature and a decrease in NDVI. Early warning systems provide information about spatial and temporal predictions of epidemics might help control and prevent malaria outbreaks. Based on the results, this study is expected to be used for the development of future prevention and control actions by the health officials.
Keywords:
malaria
; predictive models
; satellite images
; arima temporal series
; disease prevention
1. Introduction
The use of remote sensing and Geographic Information Systems (GIS) applied to epidemiological events bring options for more integrated approaches to diseases and novel possibilities for their prevention and control [1]. Early warning systems that provide information about temporal and spatial predictions of epidemics might help control and prevent malaria outbreaks [2], since they guarantee that health authorities and decision makers become aware of the immediate threat faced, and prepare them to take effective control measures [3]. Thus, early detection and prevention of malaria outbreaks constitute one of the four technical elements of the Global Strategy for Malaria Control [4].
Generally, early warning systems of malaria are based on records and monthly diagnoses of reported patients by health authorities, who are responsible for diagnosing cases and providing effective treatment to the population. If the monitoring system is conducted effectively, prevention and control measures can be carried out early, prioritizing resources in more vulnerable areas [2,5].
One of the most used tools for the development of early warning systems are statistical prediction models based on historical reports of cases and indicators of environmental risks [6,7]. Being able to quantify the incidence of environmental/climatic variables over the occurrence of malaria cases is a key step towards an effective early detection. However, one limiting factor is the lack of or difficulty to access environmental and meteorological data. It is here where remote sensing constitutes a key source of information for the development of epidemiological predictive models.
In Argentina, studies using satellite information for predicting disease cases transmitted by mosquito vectors are limited and primarily focused on addressing the issue of dengue [6,8,9,10,11]. However, in the case of malaria, studies allowing the prediction of epidemic outbreaks have not been conducted to date.
The area encompassing the Argentinean-Bolivian border is a region of intense epidemiological dynamics, where pathogenic interactions are related to structural, climatic, and social conditions, such as migratory dynamics in both directions. For many years, the transmission of malaria has been favored by cases imported from Bolivia [12]. Although in the ARBOL (Argentina-Bolivia) campaigns during the 90s, a reduction of malaria cases was achieved in both frontiers, bad weather conditions jeopardized accessibility to terrain, leading to the discontinuity of control actions [13]. Nevertheless, the number of indigenous malaria cases decreased substantially and reached zero, for which Argentina has been officially recognized by the World Health Organization (WHO) as free from autochthonous transmission of malaria in 2019.
In this context, the analysis of the degree of influence of environmental factors (obtained from remote sensing or satellite imagery) on the emergence of malaria cases is proposed, aiming to generate models capable of predicting future epidemic outbreaks and maintain epidemiological surveillance in San Ramón de la Nueva Orán, Orán Department (Salta province). To achieve this, epidemiological data of people reported with malaria in San Ramón de la Nueva Orán between 1986 and 2005 were analyzed; a local environmental characterization of the study area was performed; environmental variables were obtained through the pre-processing and processing of satellite imagery; and ARIMA (Autoregressive Integrated Moving Average) models based on the fluctuation of malaria cases and on the obtained environmental variables were used to determine the degree of adjustment of the model for predicting the emergence of new cases and estimating transmission risks.
2. Materials and Methods
2.1. Study Area
The study area corresponds to the city of San Ramón de la Nueva Orán, located in the north of the Salta province (Figure 1). The population is 82,413 inhabitants [14] and thus the city is the second most important of the province and constituting an important economic center [15,16].
The climate is subtropical with dry season. The mean annual rainfall ranges between 700-1000 mm and it concentrates in summer months (November-March) [17]. Mean annual temperature is 21.4° C, reaching extreme values of 45° during the summer. Winters are temperate, and humidity is around 78% [18]. The city is located in the altitudinal stratum corresponding to Yungas piedmont forests (between 400 and 700 meters above sea level, m.a.s.l.). Land use in the region is based mainly on the cultivation of sugar cane, citrus fruits, horticulture, tropical fruit production and logging [18].
2.2. Epidemiological Data
The cases of malaria patients were extracted from epidemiological sheets developed by technicians at the operating base of Orán, which belongs to the National Program of Vector Control, Salta delegation, of the National Health Ministry of Argentina. These epidemiological sheets contain data provided by patients, including date (day, month, year), name of the patient, address of the patient, place of infection, trips held in the last months, occupation, nationality of the patient and classification (indigenous, introduced or imported, according to the place of infection). Cases were registered monthly. Some data of the original epidemiological sheets were extracted and digitized in Excel sheets. In this study, only malaria cases reported as indigenous and introduced were used, excluding imported cases under the assumption that climatic variables fluctuations at the local level might have influenced the emergence of the former but not the emergence of imported ones.
2.3. Landsat Images: Selection, Calibration and Georeferencing
Since the epidemiological data used in this study are in a monthly resolution, a temporal series of Landsat satellite images with an equivalent frequency was generated (240 images from January, 1986 to December, 2005). Thus, an interpolation algorithm in IDL was implemented to estimate missing data and generate a complete temporal series that matched the epidemiological series. Landsat images were obtained from three different sources: United States Geological Survey (USGS), Global Land Cover Facility (GLCF): Maryland University, United States, with support from NASA, and the Instituto de Pesquisas Espaciais (INPE, Brazil). Since the study area was in the limit of two adjacent satellite passes: path: 230/231; row: 076 in the WRS-2 System (World Reference System), it was possible to define it in both scenes, for which an important number of images became available (Figure 2). A total of 160 Landsat TM 4 and 5, and X Landsat ETM+.7 images were downloaded. The reference system of the images is UTM_WGS84.
Satellite images were calibrated through the use of the remote sensing package. For the present study, two calibration scripts (one for Landsat 5 and one for Landsat 7) were created. Once the bands were calibrated, NDVI and NDWI were calculated in RStudio, using the “ndvi” and “ndwi” functions of the Remote Sensing package. The calculated NDWI corresponds to Gao [19].
Three satellite images from the different sources were selected to assess whether they were correctly georeferenced. Google Earth coordinates were defined as the real coordinates. By overlapping USGS Landsat images with Google Earth images, it was possible to check the geographic correspondence between them, and a USGS Landsat image was then used for georeferencing in ENVI 4.8 software. Since the INPE images were not correctly georeferenced, the georeferencing proceeding was performed for all these images with the USGS template image.
2.4. Environmental Variables Through Satellite Imagery
Three temporal series of Landsat images (one for the Land Surface Temperature (LST), one for the Normalized Difference Vegetation Index (NDVI), and one for the Normalized Difference Water Index (NDWI)) were obtained, and the fluctuation of the environmental variables within the study period was derived. Pre-processing steps of the Landsat satellite images are reported and the images from the calibration through the usage of an R algorithm on the one hand and of the Remote Sensing package in R on the other are compared.
2.5. Normalized Indices
Data collected through satellite images were processed in order to estimate real ecological variables and meteorological variables measured in situ [20]. These estimations consist of transformations of the images using algorithms based on the bands, and have been widely used to monitoring changes in natural factors, such as rainfall and surface temperature. Normalized Vegetation Index (NDVI): For the identification of plant masses, ratios or indices were based on the specific radiometric behavior of vegetation. The Normalized Vegetation Index (NDVI) [21] transforms multispectral data into a single band. As all normalized indices, NDVI values vary between -1 and +1, with values closer to 1 in a given pixel or area reflecting higher vegetation health [22]. Normalized Difference Water Index (NDWI): Different versions of the normalized water index exist, and all of them are considered good indicators of water content and humidity conditions of vegetation. Its values range between -1 and 1, with water bodies exhibiting positive values and vegetation and soil exhibiting zero or negative values [19]. Generation of NDVI, NDWI and LST temporal series: A total of three temporal series were obtained from the original Landsat images: one for NDVI, one for NDWI and one for LST, as previously reported. For their processing, ENVI 4.8 and IDL were used.
2.6. ARIMA Models (Autoregressive Integrated Moving Average)
The temporal analysis of Box-Jenkins or ARIMA models the reported cases, allowing to predict the number of expected cases; and provides confidence intervals associated to these predictions. The comparison of such predictions with the observed cases facilitates decision making and allows determining whether a high number of cases corresponds to an outbreak of the disease or to random variation.
The ARIMA model includes the following two parameters: “autoregressive” (AR), and moving average (MA), each of which includes one term indicating the number of lags, designed as “degree”. Thus, the autoregressive term relates the observation obtained at the time t to the observation obtained at the time t -1 (first degree) or t – 2 (second degree), and so on. The moving average term relates the error (difference between observed and expected values) of time t to those of time t – 1 and t – 2, etc. Both sets might also include seasonal terms (of degree 12, 13, 52, etc., depending of the interval between observations) and their multiples.
2.7. Data Analysis Through ARIMA Model and Adjustment
To establish the relation between malaria prevalence and the environmental variables derived from satellite imagery, a multivariate ARIMA model was estimated. This model reflected the influence of the values of the (dependent) variables and their random noise at the recent past, over the values of the dependent variables at each interval, taking the effect of the independent variables and their respective lags into account [23].
The search of the ARIMA model which best adjusted to the data was performed using the “Expert modeler” option of the Temporal Series module of SPSS 15.0 software. In order to do this, the series of malaria cases and environmental variables were divided in two sub-periods: one sub-period of estimation, used to determine which model best adjusts data; and one sub-period of prediction, used to test the forecast capacity of the model. The estimation period went from January, 1986 to December, 1999, and the prediction period corresponded to the year 2000 (from January to December).
The Expert Modeler automatically searches for the model which best adjusts to each dependent series. If independent (predictor) variables are specified, the Expert Modeler selects those with significant associations with the dependent series for their inclusion in the ARIMA models. If the independent variables do not bring any information, an univariate ARIMA model is generated [24].
To determine the degree of adjustment of the multivariate ARIMA model proposed by the Expert Modeler, the coefficient of determination (R2) was used, which determines the proportion of the variance of the dependent variable explained by the model. This statistic value varies between 0-1. The adjustment of the model was also tested with a residual analysis, verifying that they were not correlated through the Ljung-Box statistic test, which assesses the existence of autocorrelation among residuals through the Q index (i.e., a non-significant Q index implies absence of autocorrelation).
2.8. Influence of Environmental Variables over Malaria Cases
The degree of influence of the climatic/environmental variables (NDVI, NDWI and LST) obtained from the remote sensors over the emergence of malaria cases in San Ramón de la Nueva Orán between January, 1986 and December, 2005 was analyzed.
Firstly, a correlation analysis between the remote-sensing-derived environmental variables was performed, in order to avoid multicollinearity issues (i.e., high correlation among explaining variables) (Table 1). Then, a selection of the variables was performed, and two possible models were considered: Model A, which included the variables NDVImed, NDWIvar, LSTmed y LSTvar; and Model B, which included the variables NDWImed, NDVIvar, LSTmed, LSTvar.
Before applying the statistical analyses to Models A and B, an exploratory analysis of the data was carried out, in order to assess for correlations between the number of malaria cases and the independent variables. The analysis revealed that the number of infected patients was higher when the mean independent variables with one month lag were considered.
On the other hand, through an annual mean and variance analysis of the independent variables considered, it was observed that the mean of malaria cases exhibited higher annual variability and that the mean and variance of the total number of cases in the 20 years was very different. This result led to the application of hyper Poisson regression models for over dispersed data with a variable ⎣ parameter (incidence rate) by year (i.e., ⎣ is not constant but varies with time). In sum, the fluctuation of the climatic/environmental variables in relation to the emergence of malaria cases was analyzed through Poisson regressions.
An index named Incidence Rate Ratio (IRR) is obtained, through which it is possible to determine the percentage of influence of each of the environmental/climatic variables over the emergence of malaria cases. In turn, standard error (S.E.), p and confidence interval values (C.I. 95%) are obtained.
In the present study, data were analyzed through the aforementioned Poisson regressions, but considered the two previously described models A and B (which included NDVImed, NDWIvar, LSTmed and LSTvar; and NDWImed, NDVIvar, LSTmed, LSTvar respectively).
3. Results
3.1. Fluctuation of Cases in San Ramón de la Nueva Orán
The fluctuation of indigenous/introduced cases of malaria from January, 1986 to December, 2005 was analyzed, in order to determine the existence of a seasonal pattern of the disease. The total number of reported indigenous/introduced cases of malaria during the 20 years period in San Ramón de la Nueva Orán was 453. The highest peaks of cases occurred in 1996, during January, February and April with 41, 24 and 25 cases, respectively. Another important peak was observed in February, 1997, with 24 cases. There were years with no transmission of malaria, such as 1986. From the year 2000, the number of reported cases was near zero, with sporadic occurrences of only 1 or 2 cases in the summer months. A total of 23 cases were notified from January, 2000 to December, 2005. When analyzing the occurrence of malaria cases in relation to the months of the year, a seasonal pattern with most cases reported during summer months (December-March) can be observed.
3.2. Descriptive Analysis of Malaria Cases During the 1986-2005 Period
The demographic characteristics and relative frequencies of malaria cases were determined. With Excel software, descriptive graphics for each of the variables considered (such as “sex”, “age group” and “occupation”) were elaborated.
Considering the sex of patients infected with malaria, the annual frequency of occurrence was analyzed during the period 1986-2005. It was observed that in all years, most cases (more than 50%) corresponded to male individuals. Considering the age of the infected patients for the same period, a higher frequency of infected individuals was observed in the age group between 15-30 years old, with 143 reported cases. Within the age group between 31-45 years old, 127 cases were registered, and the third place in terms of number of infected people corresponded to the age group between 0-15 years old, with 96 cases. Lastly, the frequency of people infected with malaria by occupation in the study period was analyzed. The different types of jobs were grouped according to the location of the work activity (i.e., in rural areas- “countryside”- or urban areas “city”). Underage individuals who did not work were grouped as “Minors”. Within the “countryside” group, 183 malaria cases were found, followed by the “city” group, with 169 cases, and in a much lower proportion by the “Minor” group.
3.3. Results of ARIMA Models
The model proposed by the Expert Modeler for the prediction of malaria cases from the environmental variables NDVI, NDWI, and LST extracted from satellite images corresponds to an ARIMA model (0,0,1) (0,0,0). This means that the variables entered did not need any kind of differentiation, since if having done so, the model would have automatically included those steps. This type of ARIMA model is equivalent to a moving average model AR (1), in which the cases which occur in a given month, depend of the error corresponding to the previous month.
The Expert Modeler was set to search for the best ARIMA model, taking into account the 12 satellite-derived environmental variables as predictor variables. It found two significant predictor variables (“number of predictors”). The coefficient of determination was 0.882, which means that the 88% of the observed variability can be explained by the model. The validity of the model was confirmed through the visualization of the residuals, with no autocorrelation for any lag, as corroborated by the Ljung-Box test, which was not significant (p=0.420) (Table 2).
It was observed that maximum NDVI and mean NDWI were the only environmental variables which influenced the emergence of malaria cases in San Ramón de la Nueva Orán. It was also observed that the effects of mean NDWI do not seem to be immediate but rather occurred after 5 months (Table 3).
Figure 3 shows the fluctuation of malaria cases during the period comprised between January, 1986 and December, 2000 (red line). The adjustment of the proposed model (blue line), the upper and lower confidence intervals (dotted lines) and the fluctuation of cases proposed by the model for the year 2000 (in green) are also observed. In the figure, it is shown that the ARIMA model (0,0,1) presents a good adjustment with regard to malaria cases during the period of estimation, and it was also capable of accurately predicting malaria cases which took place in the prediction period (year 2000).
3.4. Influence of Environmental Variables over Malaria Cases
3.4.1. Model A
According to the variables included in Model A (NDVImed, NDWIvar, LSTmed and LSTvar), it was observed that only NDVImed and LSTmed were significant (p = 0,001, p = 0,016; respectively) (Table 4).
With Model A it is predicted that:
- For each 0.1 unit increase of NDVImed with respect to the NDVImed of the 20 years (0.57318), there is a 29% decrease of IRR (in 0.71) compared to the incidence rate that occurs when NDVImed and LSTmed reach the 20 years mean value (0.57318 and 19.9089, respectively).
- For each unit of change of LSTmed with respect to the mean LSTmed of the 20 years (19.9089), the IRR changes by 1.107 (11% increase) compared to the incidence rate that occurs when NDVImed and LSTmed reach the 20 years mean value (0.57318 and 19.9089, respectively) (Figure 4).
3.4.2. Model B
Regarding the variables included in model B (NDWImed, NDVIvar, LSTmed, LSTvar) it is observed that only NDWImed and LSTmed were significant (p = 0,003, p = 0.005; respectively) (Table 5).
With model B, it is predicted that:
1) For every 0.1 unit increase in NDWImed with respect to the 20 years mean NDWImed (0.25908), IRR diminishes by 25% compared to the incidence rate that occurs when NDWImed and LSTmed reach the 20 years mean value (0.25908 and 19.9089, respectively).
2) For every unit of change in LSTmed with respect to the 20 years mean LSTmed (19.9089), the IRR increases 11% compared to the incidence rate that occurs when NDWImed and LSTmed reach the 20 years mean value (0.25908 and 19.9089, respectively) (Figure 5).
Both models (A and B) showed very similar results, since the effect of vegetation and humidity is similar, although model A presented a higher reliability.
4. Discussion
Epidemiologically, the northwest of Argentina was an important region due to the outbreaks of malaria cases registered since the late 19th century. The development of the disease was influenced by the topography, climate and phytogeography [12]. Thus, the “Malaric mountainous area” was limited to the provinces of the north and center of the country [25,26]. Historically, the season of transmission of the disease occurred in October or November in Salta and Jujuy; in November or December in Tucumán, Santiago del Estero and Catamarca; and in December and January in La Rioja and Córdoba, but it was delayed if the previous winter and spring were especially cold and rainy, respectively. The transmission of the disease could last until May or June in the whole area, and it could extend during temperate winters [12,25,27].
In the current study, the fluctuation of malaria cases in San Ramón de la Nueva Orán during the 1986-2005 period showed a seasonal pattern with abundance peaks during summer and autumn months. This agrees with authors who found that malaria cases emerged during summer and autumn in Aguas Blancas (border with Bolivia), preceded by the highest abundance of the mosquito vector, An. pseudopunctipennis, three months before [12]. Thus, the emergence of malaria cases was related not only to the presence of the mosquito but also to the periods of its highest abundance, which for the study area occurred in spring [28,29] and summer [28].
San Ramón de la Nueva Orán is located at the Yungas piedmont, an area which has suffered severe anthropic transformations in the last decades, mainly due to deforestation for agricultural expansion or urbanization. The latter is linked to the migration of the population towards rural areas in search of work, this increases the contact with the populations of mosquitoes and the risk of contracting the disease by rural workers who, in general, do not use body-covering clothing or repellent in their working hours. The contact is due to the fact that the “edge effect” of the natural vegetation patches increases, which are adjacent to agriculture and represent areas with high abundance of mosquitoes [30]. It should be taken into account that the emergence of agricultural land generates suitable conditions for the generation of breeding grounds, such as irrigation channels.
Based on the descriptive analysis, it was observed that the most affected age group was the one comprised by male gender between 15 and 30 years old, followed by the 31-45 years old group. This makes sense, since young adults are the ones who generally carry out rural work, while women and children remain in the households. This agrees with a study carried out in Perú, where the authors surveyed people who had contracted the disease, finding that all of them were male farm workers who had not protected during working hours [31]. Dantur Juri et al. [12] also found a high prevalence (79%) of male cases in El Oculto in comparison with Aguas Blancas (49%). The authors attributed that high difference to the fact that Aguas Blancas is on the border with Bolivia, thus trade is the main commercial activity, in which women are also involved. It is well-known that the dynamics of malaria are related to human activities [32,33,34].
As previously mentioned, should be taken into account by the medical authorities when implementing control measurements, since by knowing which are the seasons with a higher number of reported cases, it can be deduced that a higher exposure and infection might exist then. Besides, it is important to warn the target population in order for them to take adequate control measurements to avoid contracting the disease by avoiding contact with the vector.
The use of indices derived from the satellite images and ARIMA temporal series models were developed to predict the emergence of new malaria cases and to estimate the risk of disease transmission. In the present study, the ARIMA model was adjusted to the changes in the epidemiological behavior of malaria in San Ramón de la Nueva Orán, and which was generated automatically. With NDVI, NDWI, and LST indices used as predictor variables for the occurrence of cases, it was observed that their prevalence was related with the emergence of cases the month before and with maximum NDVI and the mean NDWI observed five months before.
The relation between maximum NDVI and malaria prevalence has been previously reported, where the vegetation covers directly affected the abundance of anopheline mosquitoes [35], since it maintained soil and air humidity, and provided them of more shelter [12]. Another study that agrees with these results was carried out in Kenya. The study observed that the monthly number of malaria cases was strongly correlated with the NDVI of the previous month. In turn, the authors observed that with a minimum value of NDVI, the number of cases of malaria registered in the following month was more than 5% of the total [20]. In Burundi (Africa), a model was developed to predict the incidence of malaria from the association between climatic variables and NDVI with the cases of malaria reported monthly. The best model to predict the incidence of the disease included rainfall, maximum temperature, and NDVI of the previous month. In turn, through the use of monthly records of malaria cases of 23 provinces of Afghanistan and their relation with environmental variables, such as rainfall, temperature and NDVI [36]. Adimi et al. [37] found that the latter was the best predictor of the incidence of malaria. Similar results were reported by Gaudart et al. [38] in a study performed in Mali, Africa, in which the authors established a cohort of children up to 12 years old and followed them for five years to evaluate parasitaemia in blood samples. Through a temporal series analysis associating incidence of Plasmodium falciparum and NDVI, they found that this index explained the seasonal pattern of the parasite with a lag of 15 days, and that an increase in NDVI generated a significant increase of parasitaemia.
As previously cited, in this study, it was observed that the NDWI related inversely with the emergence of malaria cases in San Ramón de la Nueva Orán. The use of NDWI as a regressor variable in the temporal and spatial models of different diseases has been previously reported by some authors. Estallo et al. [10] demonstrated that NDWI is a good predictor of the Household Infection Index (HI) in San Ramón de la Nueva Orán. In turn, Cohen et al. [39] used NDWI, among other remote-sensing-derived environmental variables, to develop spatial models of malaria transmission in Swaziland, Africa. The authors showed that the transmission of the disease was related to areas with high NDWI values. In the study of Dambach et al. [40], the authors showed the existence of a significant relation between NDWI and the presence of breeding sites of the vector of malaria in a rural area of Burkina Faso, which resulted of great importance for the generation of risk maps for the transmission of the disease. In Italy, Rosa et al. [41] analyzed temporal series of captures of Culex pipiens, a mosquito vector of the West Nile Virus, and environmental variables such as rainfall, temperature and NDWI. They found that an increase in NDWI at the beginning of the year was related with a shortening of the season of highest abundance of mosquitoes. However, this study agrees with the reported by Estallo et al. [10] and Machault et al. [42]. NDWI is used for the environmental characterization, since it measures the foliar content of water in vegetation and also constitutes an indirect measure of rainfall and soil humidity, which play an important role in the biology of the disease vector.
Although in the described studies, the relation between NDWI and the drivers of the emergence of several diseases is positive, in this study, the NDWI exhibited a negative effect on the emergence of malaria cases 5 months later. Taking into account that NDWI is related with the occurrence of rainfall and humidity conditions, the inverse relationship between NDWI and the emergence of malaria cases here found might be explained by the occurrence of heavy rains, which might cause the washing of breeding sites of the immature forms of the mosquito vectors, with the consequent reduction of the populations of anopheline mosquitoes, and the indirect reduction of the number of malaria cases.
A similar result was reported in a study carried out in Colombia, where the transmission of dengue was associated with the variability of local climatic conditions, with a lag of 20 weeks (approximately 5 months) in the case of rainfall [23]. According to the authors, one of the hypotheses which might explain this lag is that local populations of the vector might connect through the dispersion of a small group of migrant females which might colonize recently established new habitats (water reservoirs) during periods of higher rainfall. Subsequently, due to the generation of many populations of the vector, the flux of individuals within the new habitats is possibly favored, which might ultimately derive in the long-term persistence of vector populations. This can generate a critical population density of the vector, which likely allows the efficient dispersion of dengue virus within human population.
As a result of the multilevel Poisson regressions and the two formulated models, it was observed that malaria cases might increase with both a decrease in mean NDVI and an increase in mean LST; or with a decrease in NDWI and an increase in mean LST. In other words, in both formulated models malaria cases were positively related to an increase in mean LST. It is known that temperature is a key factor for the transmission of malaria [43].
Several authors [33,35,44,45] reported that an increase in temperature produced a faster hatching of eggs and shortened the duration of the larval period, which generated a higher number of adults in a shorter time, thus increasing the populations of anophelines. Furthermore, with the increase of temperature, the gonotrophic cycle of the female mosquito shortens, which increases the frequency of blood intakes, i.e., the biting rate [32,33,45]. Lindblade et al. [32] not only demonstrated that an increase in temperature resulted in an increase of the number of adults of Anopheles (Cellia) gambiae which rested in households, but also that the biting rate was higher in localities of higher temperature. On the other hand, different laboratory tests demonstrated the reduction of the gonotrophic cycle of An. albimanus when exposed to temperatures between 24 and 30° C [46].
In the study of Afrane et al. [47], the authors reported a reduction in the gonotrophic cycle of An. gambiae from 0.9 to 1.7 days in localities of Iguhu (Uganda) with higher temperature. Besides, the extrinsic incubation period of the parasite held a direct relation with temperature, since when increasing it, the incubation period of the Plasmodium parasite became shorter [33,35,44,45,47], which increases the time of effective life of the vector. Thus, for example, the extrinsic period of Plasmodium falciparum in An. gambiae was reduced by 17.3 days (from 55.5 to 38.2 days) when temperature increased from 18 to 18.9° C [32]. In general terms, in the case of the mosquito, the gonadotrophic cycle lasts 2-3 days, matching with the biting of females in search of blood [44].
The relationship between the emergence of malaria cases and temperature has been previously reported in the country by Dantur Juri et al. [12], who showed that malaria cases in El Oculto and Aguas Blancas localities (Orán Department, Salta province) were associated to mean and maximum mean temperature, among other variables. In El Oculto, rises in maximum mean temperature provoked an increase in emergence risk of malaria cases; while in Aguas Blancas the increase in emergence risk of malaria was produced by rises in mean monthly temperature and relative humidity. Also, Sáez-Sáez et al. [45] analyzed the relation between rainfall and temperature on the incidence of the disease in Sucre (Venezuela). In the mentioned study, malaria cases and climatic variables showed a positive correlation, with rainfall and air temperature as the variables that better explained the emergence of malaria.
In Model A of the present study, the cases of malaria were also influenced by the decrease of mean NDVI; while in Model B malaria cases were also affected by a decrease of mean NDWI. This might be due to the fact that both indices are related. NDVI measures the status of the vegetation, its vigor and “greenness” in relation to the process of photosynthesis. This, in turn, is positively related with environmental conditions such as rainfall, humidity and temperature. NDWI measures the water content of vegetation and is thus an indirect indicator of soil and environment humidity. Ultimately, an increase in rainfall will produce increases in both NDWI and NDVI. It is well-known that rainfall generates suitable conditions for the creation of new larval habitats, but strong rainfalls might produce floods which would wash the breeding sites of anophelines [12].
Although there are studies which differ with the results obtained in the present work, showing a positive relation between NDVI and malaria cases, in a study carried out in Bangladesh, Haque et al. [48] analyzed malaria cases in relation to meteorological and environmental variables, such as rainfall, temperature, humidity and NDVI. The authors reported that an increase of 0.1 in monthly NDVI was associated with a 30.4% decrease of malaria cases.
Finally, it should be taken into account that the dynamics of malaria are very complex and not only environmental but also social, economic and politic factors play a role. The quality of households (which is in turn related to economic conditions of the populations), hygiene conditions, actions carried out but public health agencies, population dynamics and migration within areas of endemic transmission, among others, are factors which directly and indirectly affect the dynamics of the disease.
5. Conclusions
In San Ramón de la Nueva Orán, a seasonal fluctuation of malaria cases was observed during the 1986-2005 period, with a higher number of infected people reported during summer months. Also, the emergence of malaria seemed to be related with the rural activities carried out by young male adults (15-45 years old). Meanwhile, the multivariate ARIMA model proved to be useful for predicting malaria cases in San Ramón de la Nueva Orán, where the environmental variables related to the emergence of cases, according to the proposed models were maximum NDVI and mean NDWI, with a lag of 5 months for the latter. Additionally, the relation between climatic/environmental factors and malaria cases was quantified through multilevel Poisson regression models, by calculating for that purpose the Incidence Rate Ratio (IRR). This analysis showed that malaria cases were associated with an increase in mean temperature and a decrease in NDVI.
Author Contributions
Conceptualization, A.C.C. and M.J.D.J.; methodology, A.C.C, L.M.G., M.O.Z. and M.J.D.J.; formal analysis, A.C.C., L.M.G. and P.L.D.; investigation, A.C.C., R.D.C.P., D.C.A., M.P.M. and P.L.D., resources, M.O.Z. and M.J.D.J.; data curation, A.C.C., L.M.G. and M.J.D.J.; writing—original draft preparation, M.J.D.J., P.L.D., A.C.C., R.D.C.P., D.C.A. and M.P.M.; writing—review and editing, M.J.D.J. and P.L.D; funding acquisition M.J.D.J. and M.O.Z. All authors have read and agreed to the published version of the manuscript.
Funding
This research was funded by Roemmers Foundation and the Agencia Nacional de Promoción Científica y Tecnológica, grant number ANPCyT PICT-2014-3281. P.L.D. is PhD fellow at the Consejo Nacional de Investigaciones Científicas y Tecnológicas (CONICET), Argentina. M.J.D.J. is member of the researcher career of CONICET, Argentina.
Institutional Review Board Statement
The study was approved by the Ethical Committee of the Ministry of Health of Argentina (Protocol of the Manual de Normas y Procedimientos de Vigilancia y Control de Enfermedades de Notificación Obligatoria, Ministerio de Salud Argentina).
Informed Consent Statement
Informed consent was obtained from all subjects involved in the study.
Data Availability Statement
The original contributions presented in this study are included in the article. Further inquiries can be directed to the corresponding author.
Acknowledgments
This work was carried out with the invaluable contribution of the technicians from Base Operativa Orán, Coordinación Nacional de Control de Vectores, Ministerio de Salud de la Nación.
Conflicts of Interest
The authors declare no conflicts of interest.
References
- Rodríguez-Morales, A.J. Ecoepidemiología y epidemiología satelital: nuevas herramientas en el manejo de problemas en salud pública. Rev. Perú Med. Exp. salud publica 2005, 1–10. [Google Scholar]
- Midekisa, A.; Senay, G.; Henebry, G.M.; Semuniguse, P.; Wimberly, M.C. Remote sensing-based time series models for malaria early warning in the highlands of Ethiopia. Malar. J. 2012, 11, 1–10. [Google Scholar] [CrossRef]
- Thomson, M.C.; Connor, S.J. The development of Malaria Early Warning Systems for Africa. Trends Parasitol. 2001, 17, 438–445. [Google Scholar] [CrossRef]
- World Health Organization (WHO). A global strategy for malaria control; WHO Library Cataloguing in Publication Data: Geneva, Switzerland, 1993; Vol. 1, pp. 1–40. [Google Scholar]
- The Roll Back Malaria. The Global Malaria Action Plan for a Malaria-free world; Roll Black Malaria Partnership: Geneva, Switzerland, 2008; Vol. 1, pp. 1–274. [Google Scholar]
- Estallo, E.L.; Sippy, R.; Stewart-Ibarra, A.M.; Grech, M.G.; Benitez, E.M.; Ludueña-Almeida, F.F.; et al. A decade of arbovirus emergence in the temperate southern cone of South America: dengue. Heliyon 2020, 6, e04858. [Google Scholar] [CrossRef]
- Robert, M.A.; Stewart-Ibarra, A.M.; Estallo, E.L. Climate change and viral emergence: evidence from Aedes-borne arboviruses. Curr. Opin. Virol. 2020, 40, 41–47. [Google Scholar] [CrossRef]
- Rotela, C.; Fouque, F.; Lamfri, M.; Sabatier, P.; Introini, V.; Zaidenberg, M.; et al. Space-time analysis of the dengue spreading dynamics in the 2004 Tartagal outbreak, Northern Argentina. Acta Trop. 2007, 103, 1–13. [Google Scholar] [CrossRef]
- Estallo, E.L.; Lamfri, M.A.; Scavuzzo, C.M.; Almeida, F.F.L.; Introini, M.V.; Zaidenberg, M.; et al. Models for predicting Aedes aegypti larval indices based on satellite images and climatic variables. J. Am. Mosq. Control Assoc. 2008, 24, 368–376. [Google Scholar] [CrossRef]
- Estallo, E.L.; Ludueña-Almeida, F.F.; Visintin, A.M.; Scavuzzo, C.M.; Lamfri, M.A.; Introini, M.V.; et al. Effectiveness of normalized difference water index in modelling Aedes aegypti house index. Int. J. Remote Sens. 2011, 33, 4254–4265. [Google Scholar] [CrossRef]
- Estallo, E.L.; Más, G.; Vergara-Cid, C.; Lanfri, M.A.; Ludueña-Almeida, F.; Scavuzzo, C.M.; et al. Spatial Patterns of High Aedes aegypti Oviposition Activity in Northwestern Argentina. PLoS One 2013, 8, 1–8. [Google Scholar] [CrossRef]
- Dantur Juri, M.J.; Zaidenberg, M.; Claps, G.L.; Santana, M.; Almirán, W.R. Malaria transmission in two localities in north-western Argentina. Malar. J. 2009, 8, 18. [Google Scholar] [CrossRef]
- Curto, S.I.; Carbajo, A.E.; Boffi, R. Aplicación de Sistemas de Información Geográfica. Epidemiología. Caso de estudio: Malaria en la Argentina (1902–2000). Soc. Argentina Estud. Geográficos 2003, 1–9. [Google Scholar]
- INDEC Instituto Nacional de Estadística y Censos de la República Argentina. INDEC Censo 2010. Available online: https://www.indec.gob.ar/indec/web/Nivel4-Tema-2-41-135 (accessed on 1 March 2019).
- Poderti, A. San Ramón De La Nueva Orán: Una Ciudad, Muchas Historias; Fundación Banco del Noroeste: Salta, Argentina, 1995; pp. 1–208. [Google Scholar]
- García Rodríguez, M. San Ramón de la Nueva Orán. Ciudad encajonada y dispersa. Orán, Argentina, 2004; pp. 1–14.
- Brown, A.D.; Blendinger, P.G.; Lomáscolo, T.; Bes, P.G. Selva pedemontana de las Yungas. Historia natural, ecología y manejo de un ecosistema en peligro; Fundación Proyungas, Argentina, 2009; pp. 1–206.
- Arroyo, A.R. Diagnóstico productivo del departamento de Orán; Estac. Exp. Cultiv. Trop. Yuto, Salta, Argentina, 2004.
- Gao, B.C. NDWI—A normalized difference water index for remote sensing of vegetation liquid water from space. Remote Sens Environ. 1996, 58, 257–266. [Google Scholar] [CrossRef]
- Hay, S.I.; Snow, R.W.; Rogers, D.J. Predicting malaria seasons in Kenya using multitemporal meteorological satellite sensor data. Trans. R. Soc. Trop. Med. Hyg. 1998, 92, 12–20. [Google Scholar] [CrossRef]
- Jensen, J.R. Introductory Digital Image Processing: A Remote Sensing Perspective, 4th ed.; Brugham Young University: Utah, United States, 2016. [Google Scholar]
- Chuvieco, E. Teledeteccion Ambiental. La Observación de la Tierra Desde el Espacio; Ariel: Colombia, 2002; Vol. 1, pp. 1–586. [Google Scholar]
- Rúa-Uribe, G.L.; Suárez-Acosta, C.; Chauca, J.; Ventosilla, P.; Almanza, R. Modelling the effect of local climatic variability on dengue transmission in Medellín (Colombia) by means of temporary series analysis. Biomédica 2013, 33, 142–152. [Google Scholar]
- Loha, E.; Lindtjørn, B. Model variations in predicting incidence of Plasmodium falciparum malaria using 1998–2007 morbidity and meteorological data from south Ethiopia. Malar. J. 2010, 9, 1–8. [Google Scholar] [CrossRef]
- Bejarano, J. Distribución geográfica de Anophelini de la República Argentina. Rev. Sanid. Milit. Argent. 1957, 56, 307–348. [Google Scholar]
- Martínez-Palomo, A. La Comisión Internacional de Investigación en Salud. Salud Pública Mex. 1991, 33, 399–409. [Google Scholar]
- Bejarano, J.F. Áreas palúdicas de la República Argentina. Prim. J. Entomoepidemiol. Argentinas 1953, 1, 275–304. [Google Scholar]
- Dantur Juri, M.J.; Zaidenberg, M.; Almirón, W.R. Fluctuación estacional de Anopheles (Anopheles) pseudopunctipennis (Diptera: Culicidae) en un área palúdica de Salta, Argentina. Entomol. Vectores 2003, 10, 457–468. [Google Scholar]
- Dantur Juri, M.J.; Claps, G.L.; Santana, M.; Zaidenberg, M.; Almirón, W.R. Abundance patterns of Anopheles pseudopunctipennis and Anopheles argyritarsis in northwestern Argentina. Acta Trop. 2010, 115, 234–241. [Google Scholar] [CrossRef]
- Dantur Juri, M.J.; Zaidenberg, M.; Almirón, W.R. Distribución espacial de Anopheles pseudopunctipennis en las Yungas de Salta, Argentina. Rev. Saúde Pública 2005, 39, 565–570. [Google Scholar] [CrossRef]
- Sanabria, H.R.; Hernández, A.V.; Villafuerte, A.P.; Erazo, P.G. Percepción y condiciones de trabajo de personas que tuvieron malaria. Rev. Peru Med. Exp. Salud Pública 2004, 21. [Google Scholar]
- Lindblade, K.A.; Walker, E.D.; Onapa, A.W.; Katungu, J.; Wilson, M.L. Land use change alters malaria transmission parameters by modifying temperature in a highland area of Uganda. Trop. Med. Int. Health 2000, 5, 263–274. [Google Scholar] [CrossRef]
- Patz, J.A.; Graczyk, T.K.; Geller, N.; Vittor, A.Y. Effects of environmental change on emerging parasitic diseases. Int. J. Parasitol. 2000, 30, 1395–1405. [Google Scholar] [CrossRef]
- Pattanayak, S.; Dickinson, K.; Corey, C.; Murray, B.; Sills, E.; Kramer, R. Deforestation, malaria, and poverty: a call for transdisciplinary research to support the design of cross-sectoral policies. Sustain. Sci. Pract. Policy 2006, 2, 45–56. [Google Scholar] [CrossRef]
- Ahmadian Marj, A.; Mobasheri, M.R.; Valadanzouje, M.J.; Rezaie, Y.; Abaie, M.R. Using satellite images in determination of malaria outbreaks potential region. Nat. Preced. 2008, 1. [Google Scholar] [CrossRef]
- Gomez-Elipe, A.; Otero, A.; Van Herp, M.; Aguirre-Jaime, A. Forecasting malaria incidence based on monthly case reports and environmental factors in Karuzi, Burundi, 1997–2003. Malar. J. 2007, 6, 129. [Google Scholar] [CrossRef]
- Adimi, F.; Soebiyanto, R.P.; Safi, N.; Kiang, R. Towards malaria risk prediction in Afghanistan using remote sensing. Malar. J. 2010, 9, 125. [Google Scholar] [CrossRef]
- Gaudart, J.; Touré, O.; Dessay, N.; Dicko, A.L.; Ranque, S.; Forest, L.; et al. Modelling malaria incidence with environmental dependency in a locality of Sudanese savannah area, Mali. Malar. J. 2009, 8, 61. [Google Scholar] [CrossRef]
- Cohen, J.M.; Dlamini, S.; Novotny, J.M.; Kandula, D.; Kunene, S.; Tatem, A.J. Rapid case-based mapping of seasonal malaria transmission risk for strategic elimination planning in Swaziland. Malar. J. 2013, 12, 1–12. [Google Scholar] [CrossRef]
- Dambach, P.; Machault, V.; Lacaux, J.P.; Vignolles, C.; Sié, A.; Sauerborn, R. Utilization of combined remote sensing techniques to detect environmental variables influencing malaria vector densities in rural West Africa. Int. J. Health Geogr. 2012, 11, 1–12. [Google Scholar] [CrossRef]
- Rosà, R.; Marini, G.; Bolzoni, L.; Neteler, M.; Metz, M.; Delucchi, L.; et al. Early warning of West Nile virus mosquito vector: Climate and land use models successfully explain phenology and abundance of Culex pipiens mosquitoes in north-western Italy. Parasites Vectors 2014, 7, 1–12. [Google Scholar] [CrossRef]
- Machault, V.; Vignolles, C.; Borchi, F.; Vounatsou, P.; Pages, F.; Briolant, S.; et al. The use of remotely sensed environmental data in the study of malaria. Geospat. Health 2011, 5, 151–168. [Google Scholar] [CrossRef]
- Martens, W.J.M.; Niessen, L.W.; Rotmans, J.; Jetten, T.H.; McMichael, A.J. Potential impact of global climate change on malaria risk. Environ. Health Perspect. 1995, 103, 458. [Google Scholar] [CrossRef]
- López-Vélez, R.; Molina Moreno, R. Cambio climático en España y riesgo de enfermedades infecciosas y parasitarias transmitidas por artrópodos y roedores. Rev. Esp. Salud Pública 2005, 79, 177–190. [Google Scholar] [CrossRef]
- Sáez Sáez, V.; Martínez, J.; Rubio Palis, Y.; Delgado, L. Evaluación semanal de la relación malaria, precipitación y temperatura del aire en la Península de Paria, estado Sucre, Venezuela. Bol. Mal. Salud Amb. 2007, 47, 177–189. [Google Scholar]
- Rúa, G.L.; Quiñones, M.L.; Vélez, I.D.; Zuluaga, J.S.; Rojas, W.; Poveda, G.; et al. Laboratory estimation of the effects of increasing temperatures on the duration of gonotrophic cycle of Anopheles albimanus (Diptera: Culicidae). Mem. Inst. Oswaldo Cruz 2005, 100, 515–520. [Google Scholar] [CrossRef]
- Afrane, Y.A.; Lawson, B.W.; Githeko, A.K.; Yan, G. Effects of microclimatic changes caused by land use and land cover on duration of gonotrophic cycles of Anopheles gambiae (Diptera: Culicidae) in western Kenya highlands. J. Med. Entomol. 2005, 42, 974–980. [Google Scholar] [CrossRef]
- Haque, U.; Hashizume, M.; Glass, G.E.; Dewan, A.M.; Overgaard, H.J.; Yamamoto, T. The role of climate variability in the spread of malaria in Bangladeshi highlands. PLoS One 2010, 5, e14341. [Google Scholar] [CrossRef]
Figure 1.
Location of the study area in Orán department, Salta province, northwest of Argentina.
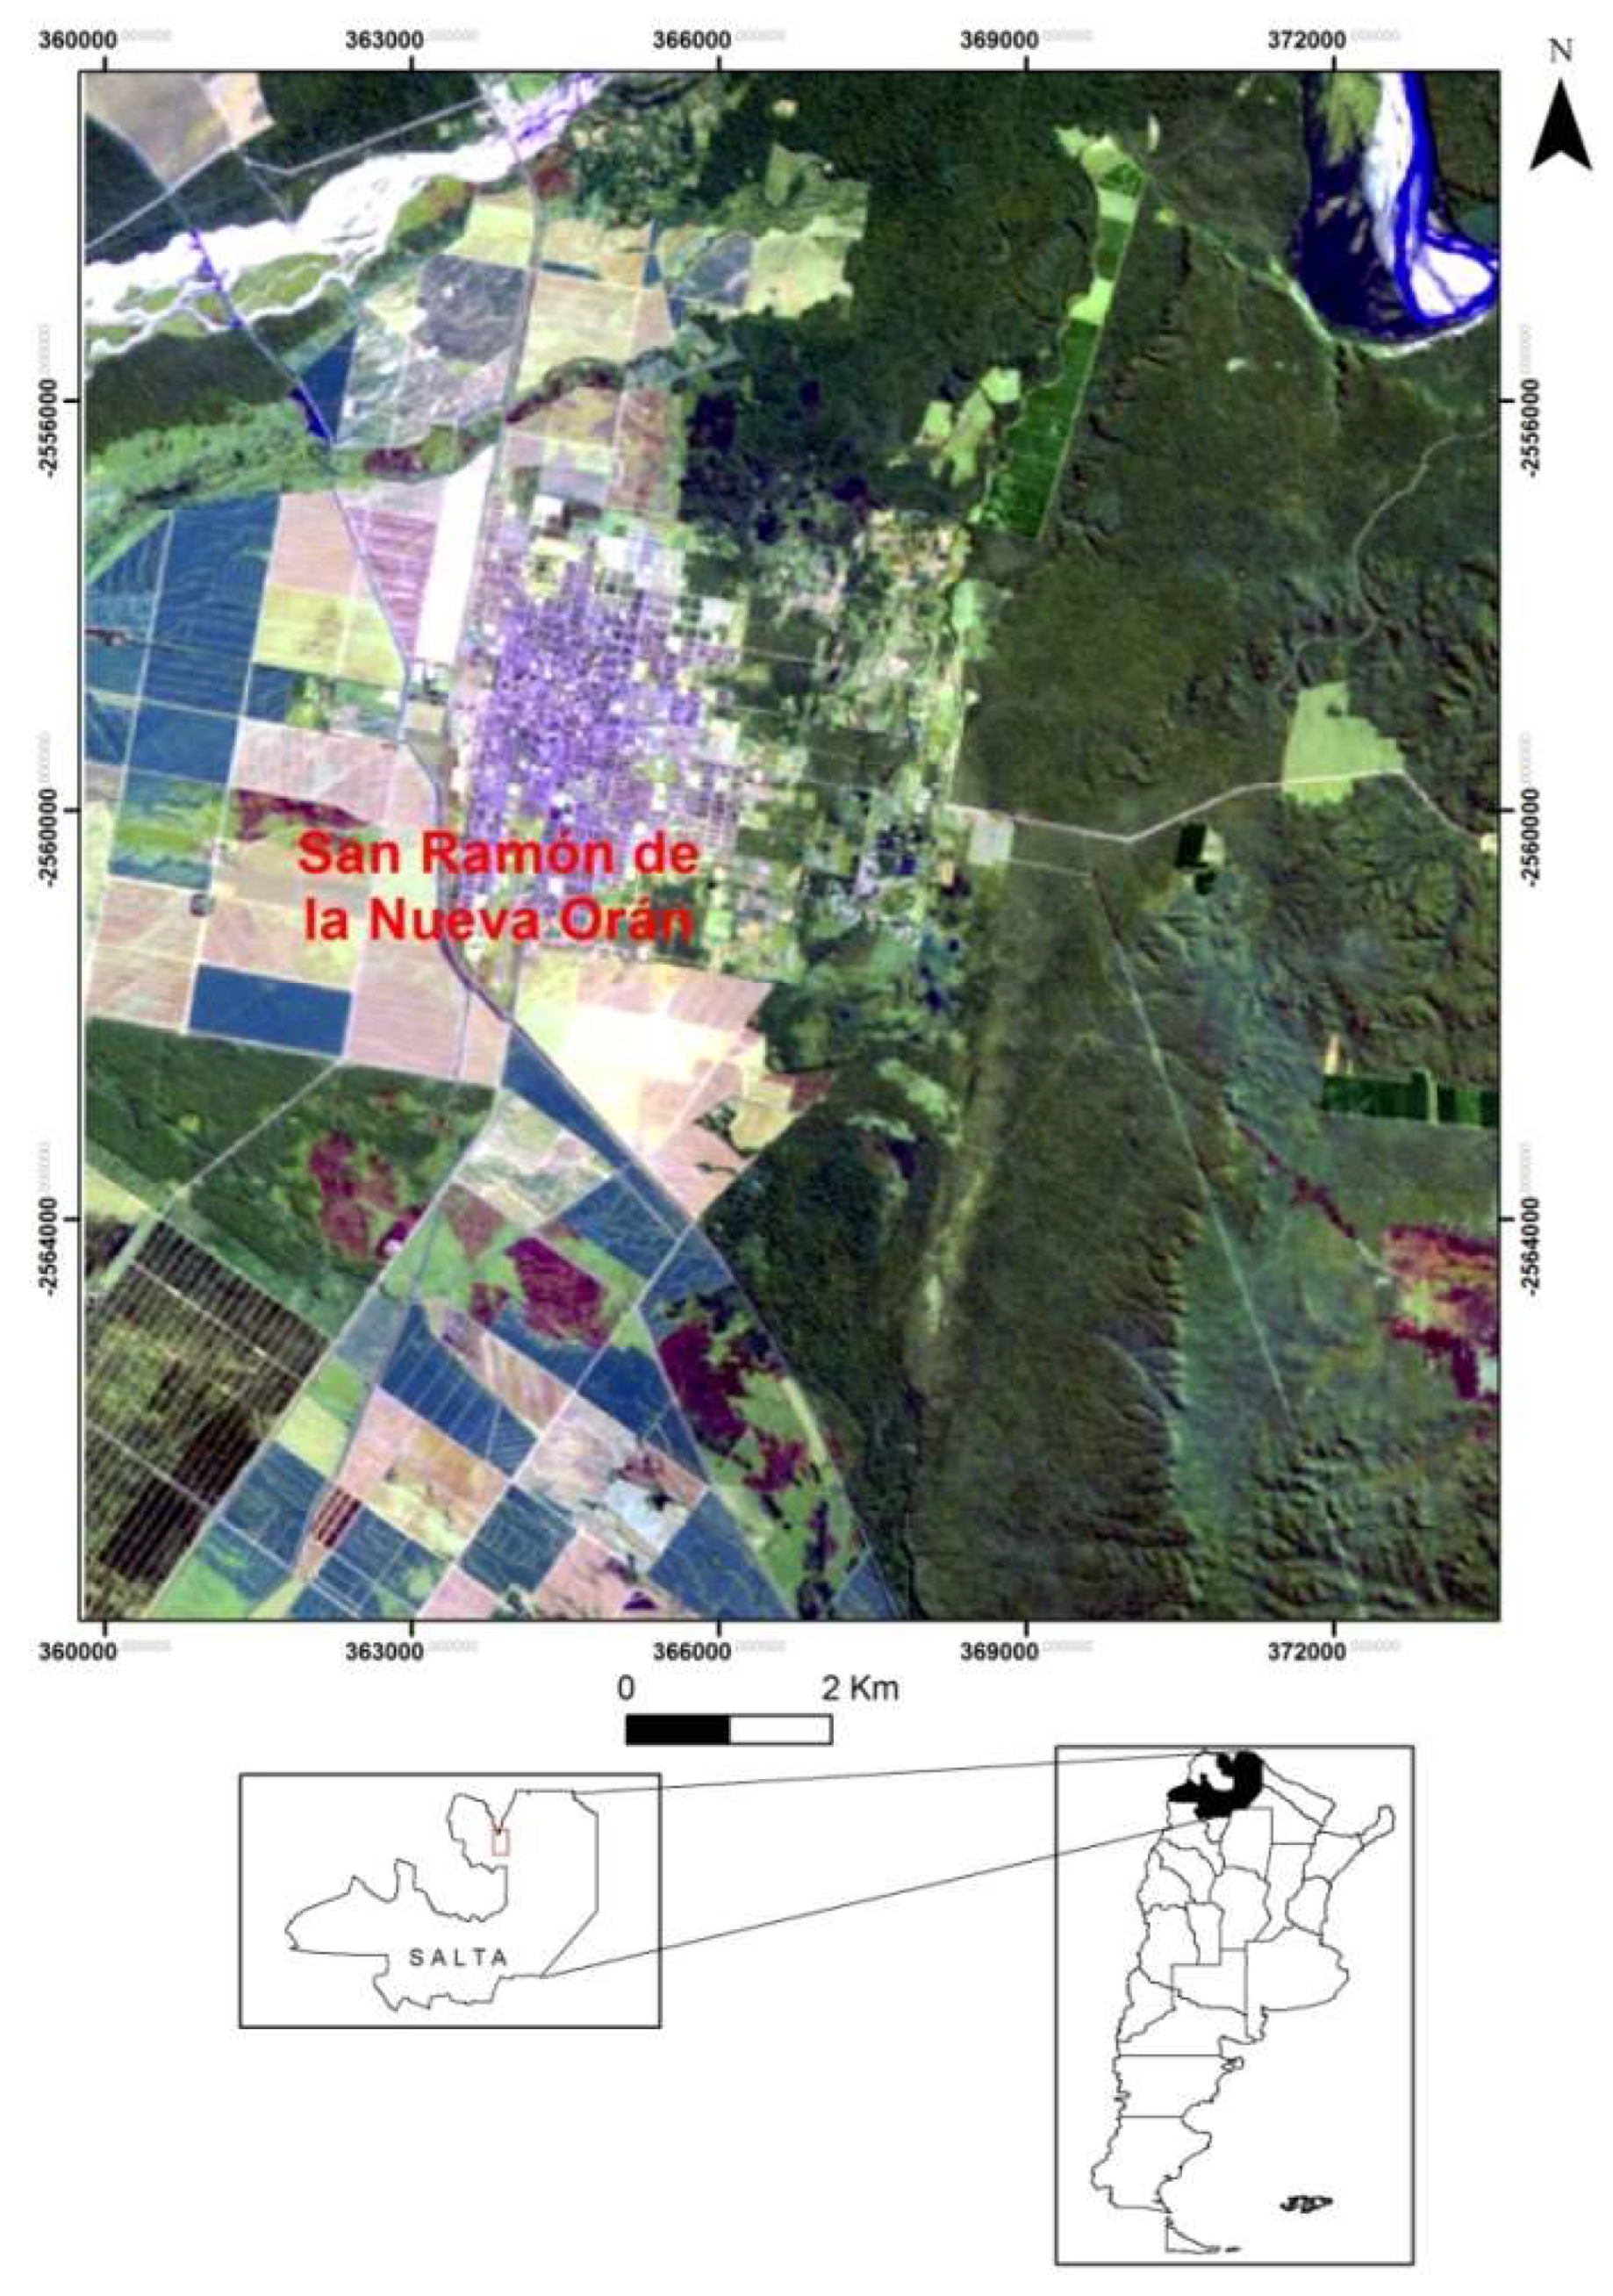
Figure 2.
Study area (red rectangle) in two scenes of two adjacent satellite passes. Path 231 (left), path 230 (right), Salta province, northwest of Argentina.
Figure 2.
Study area (red rectangle) in two scenes of two adjacent satellite passes. Path 231 (left), path 230 (right), Salta province, northwest of Argentina.
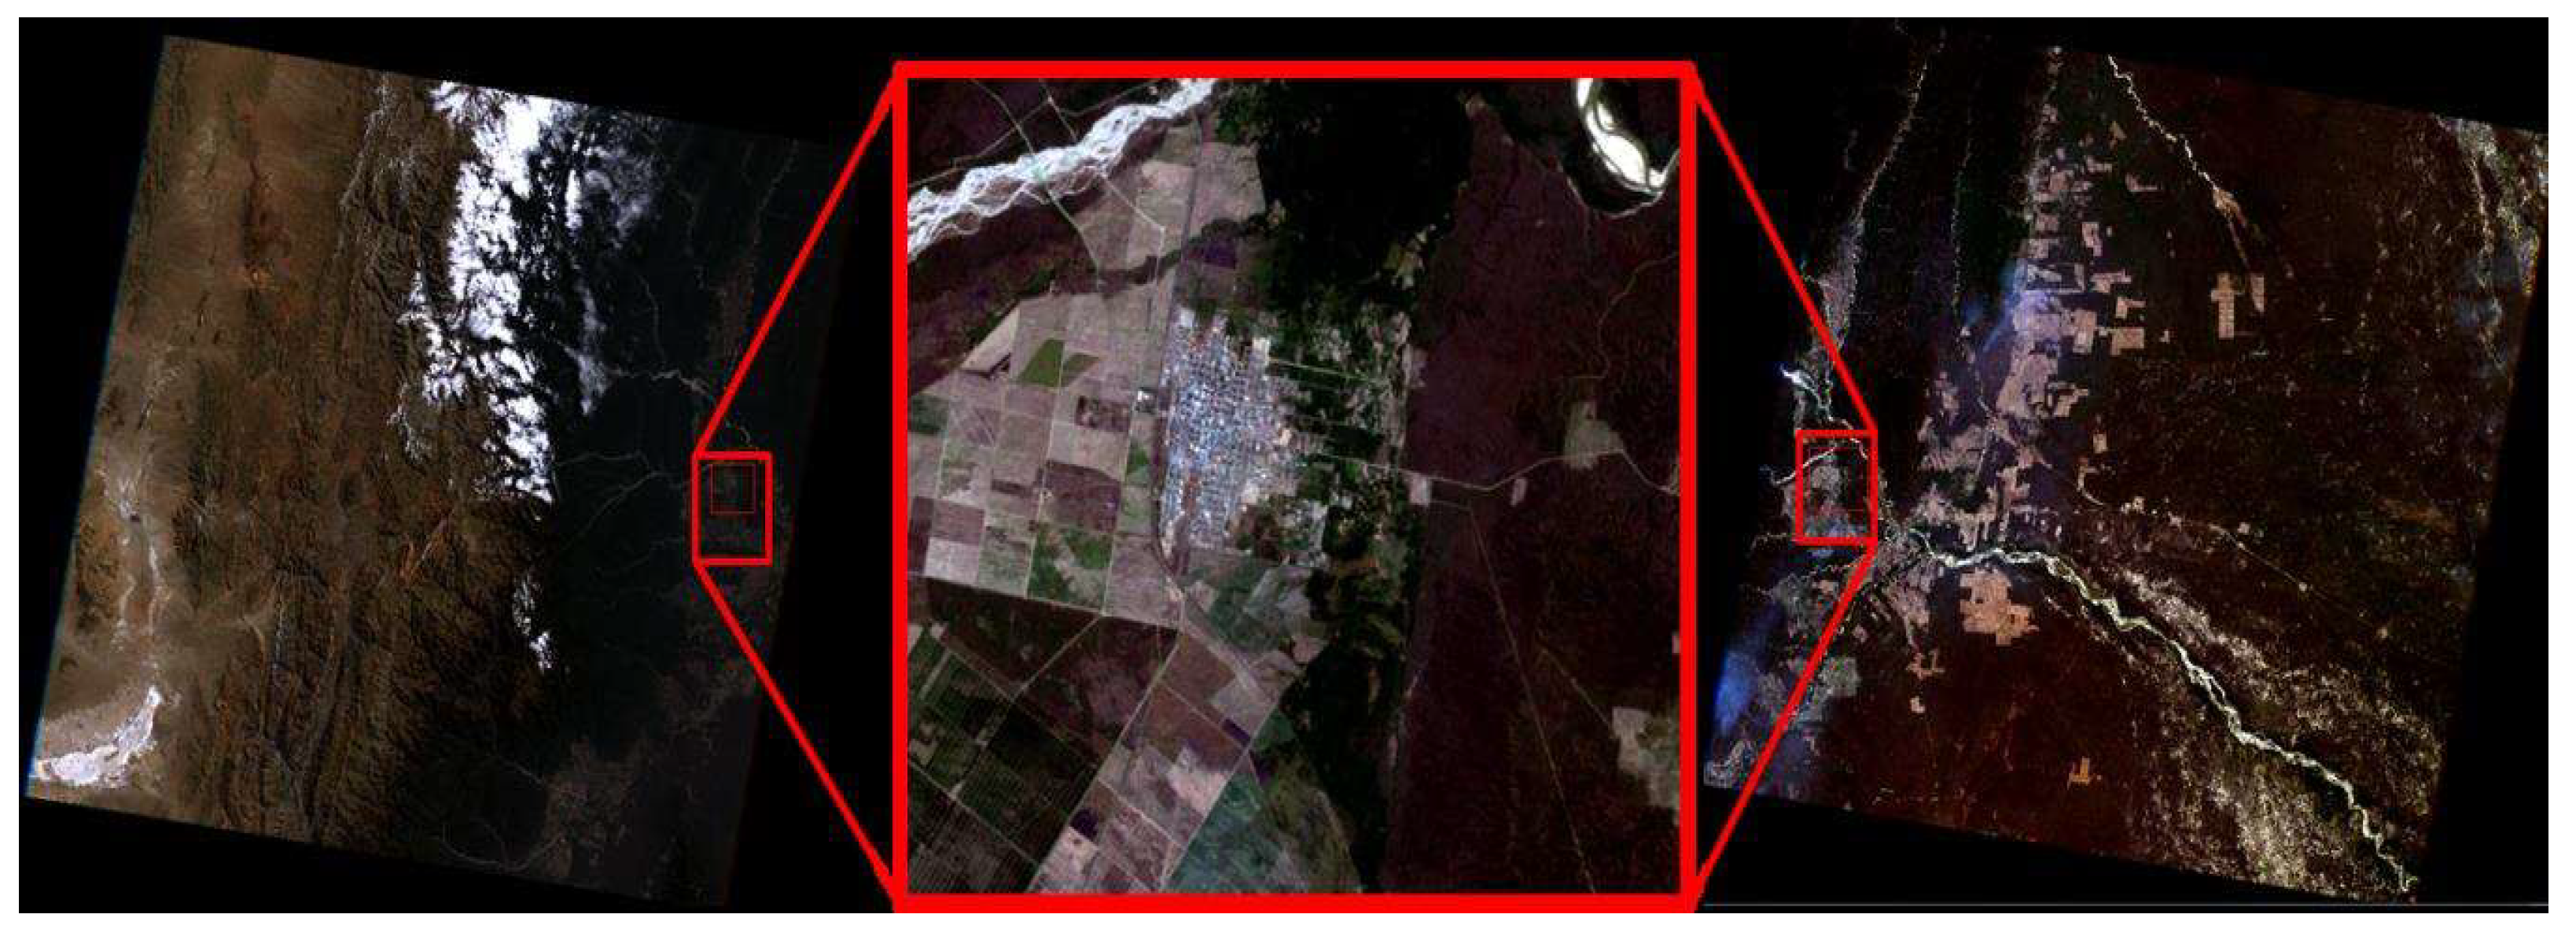
Figure 3.
Adjustment of the ARIMA model (0,0,1)(0,0,0) and prediction of malaria cases in San Ramón de la Nueva Orán from 1986 to 2000.
Figure 3.
Adjustment of the ARIMA model (0,0,1)(0,0,0) and prediction of malaria cases in San Ramón de la Nueva Orán from 1986 to 2000.
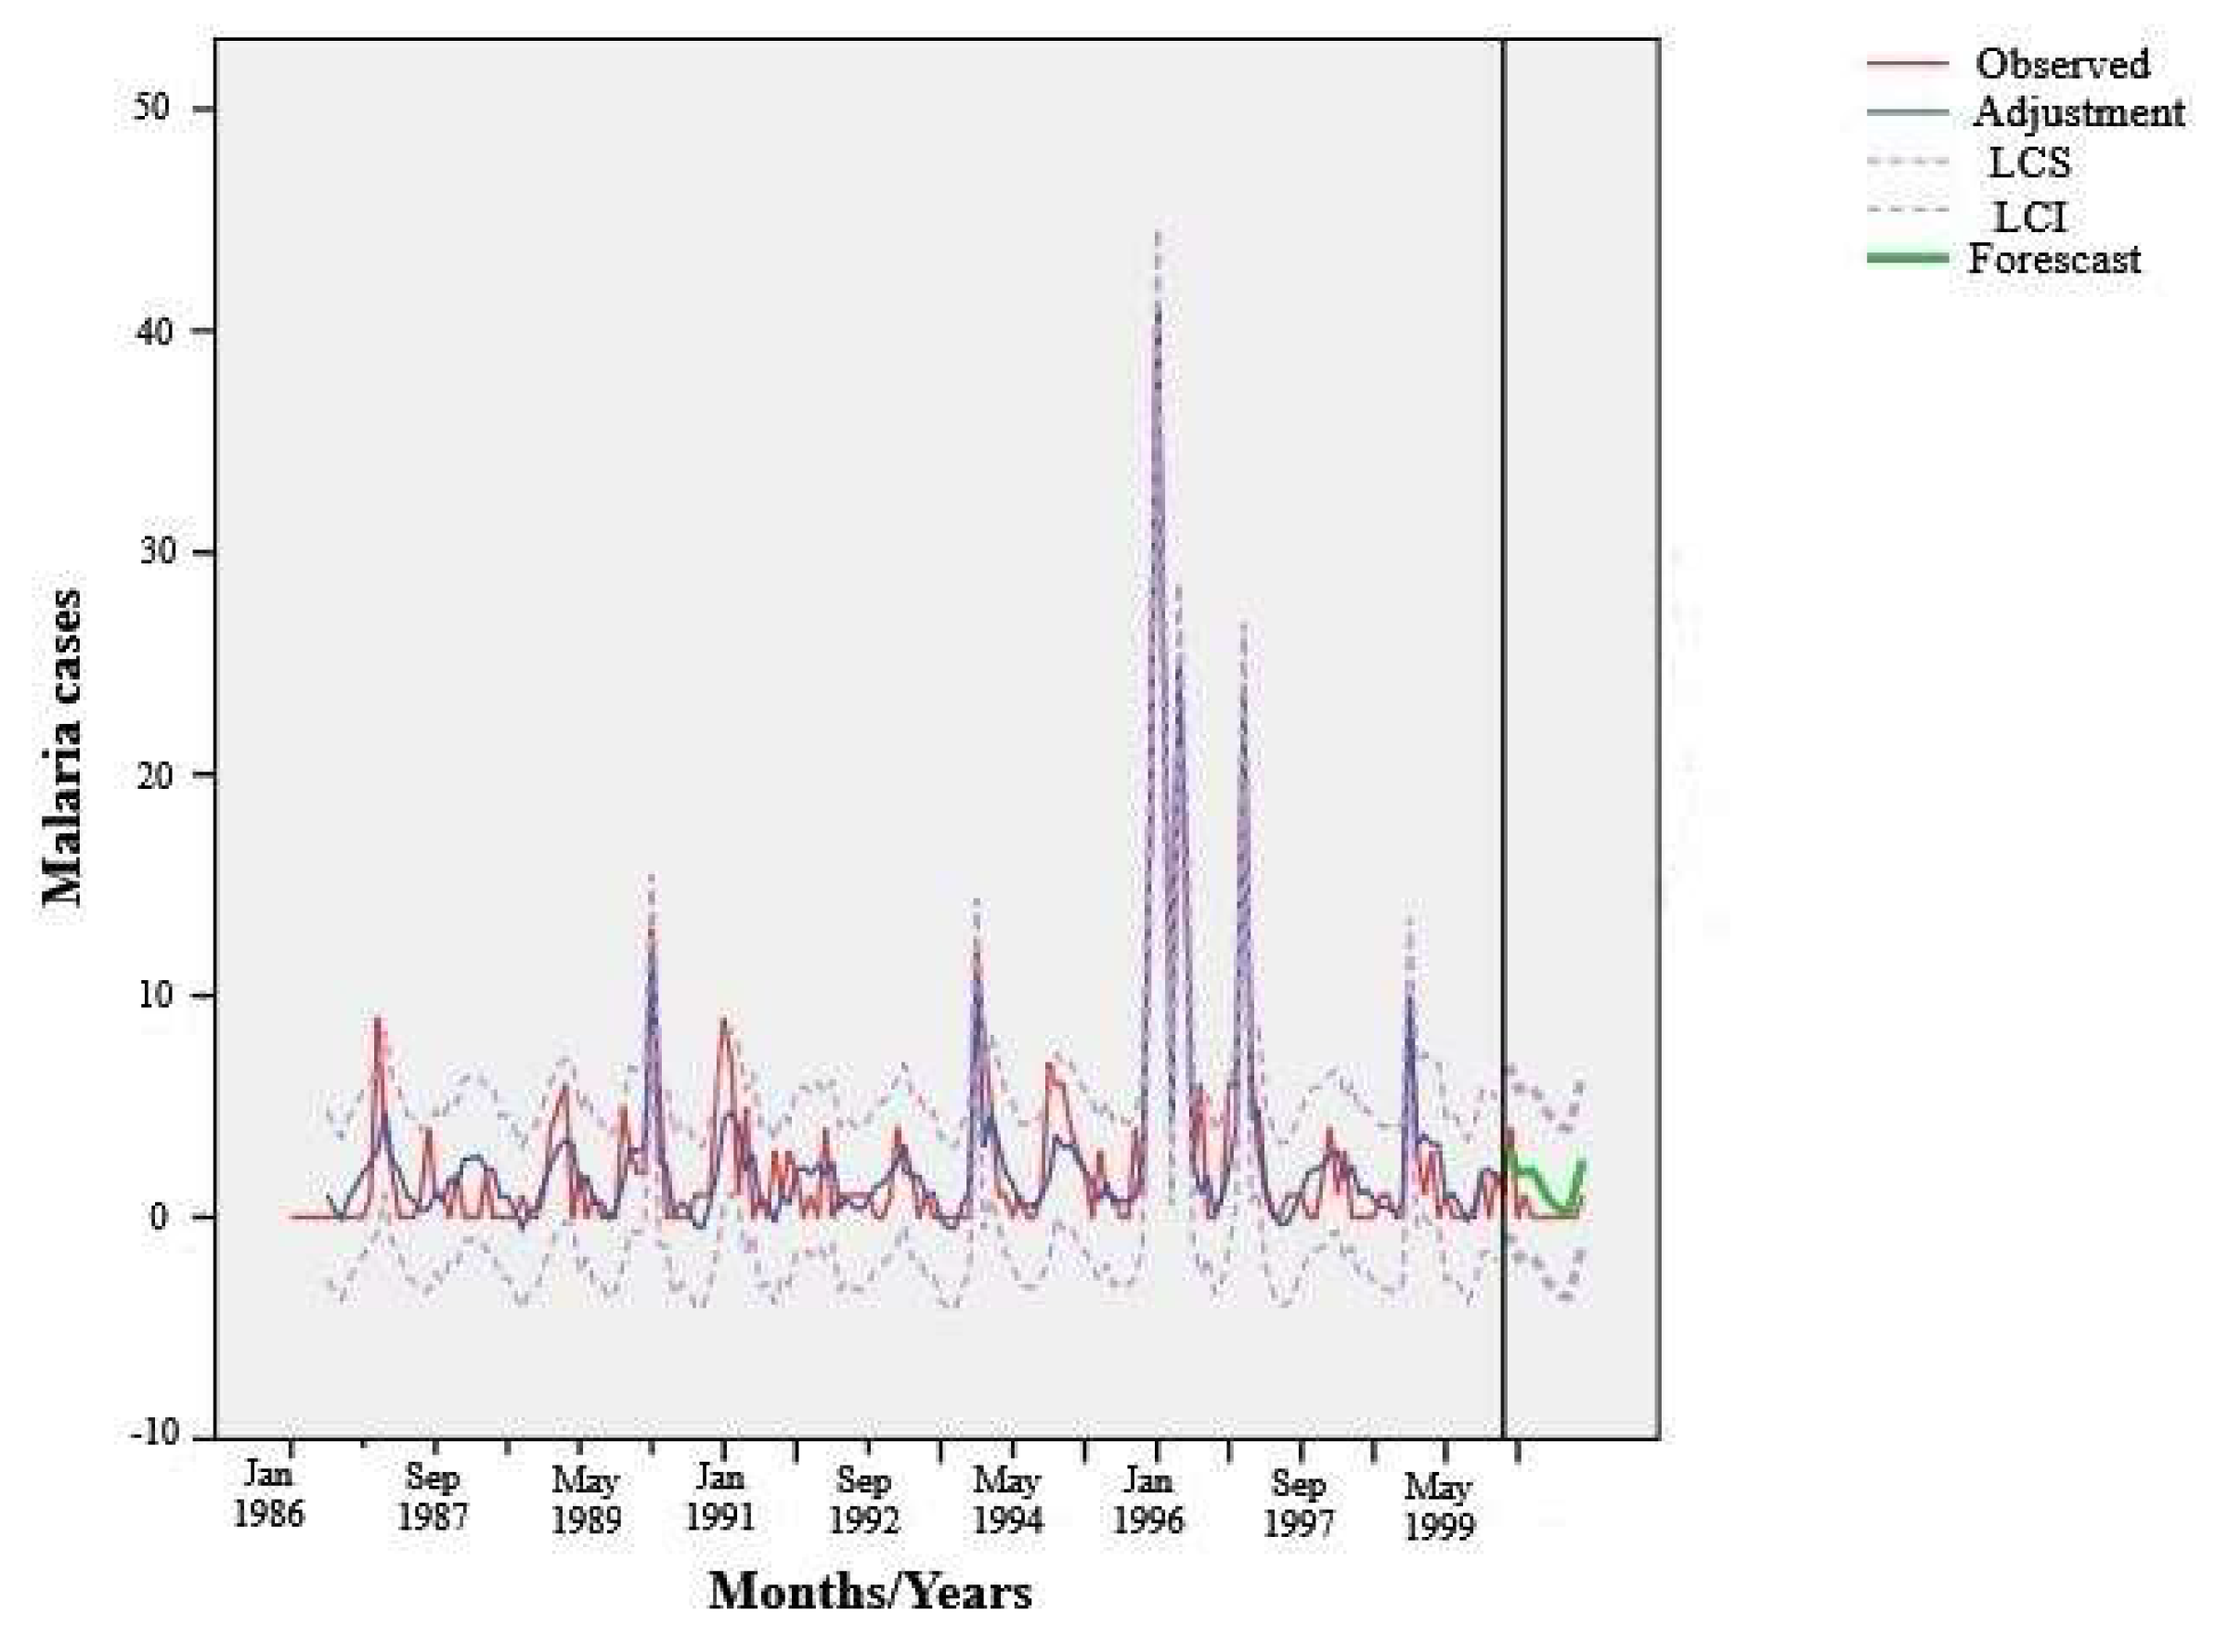
Figure 4.
Model A. Relation between malaria cases and observed variability of (a) mean NDVI and (b) mean LST.
Figure 4.
Model A. Relation between malaria cases and observed variability of (a) mean NDVI and (b) mean LST.
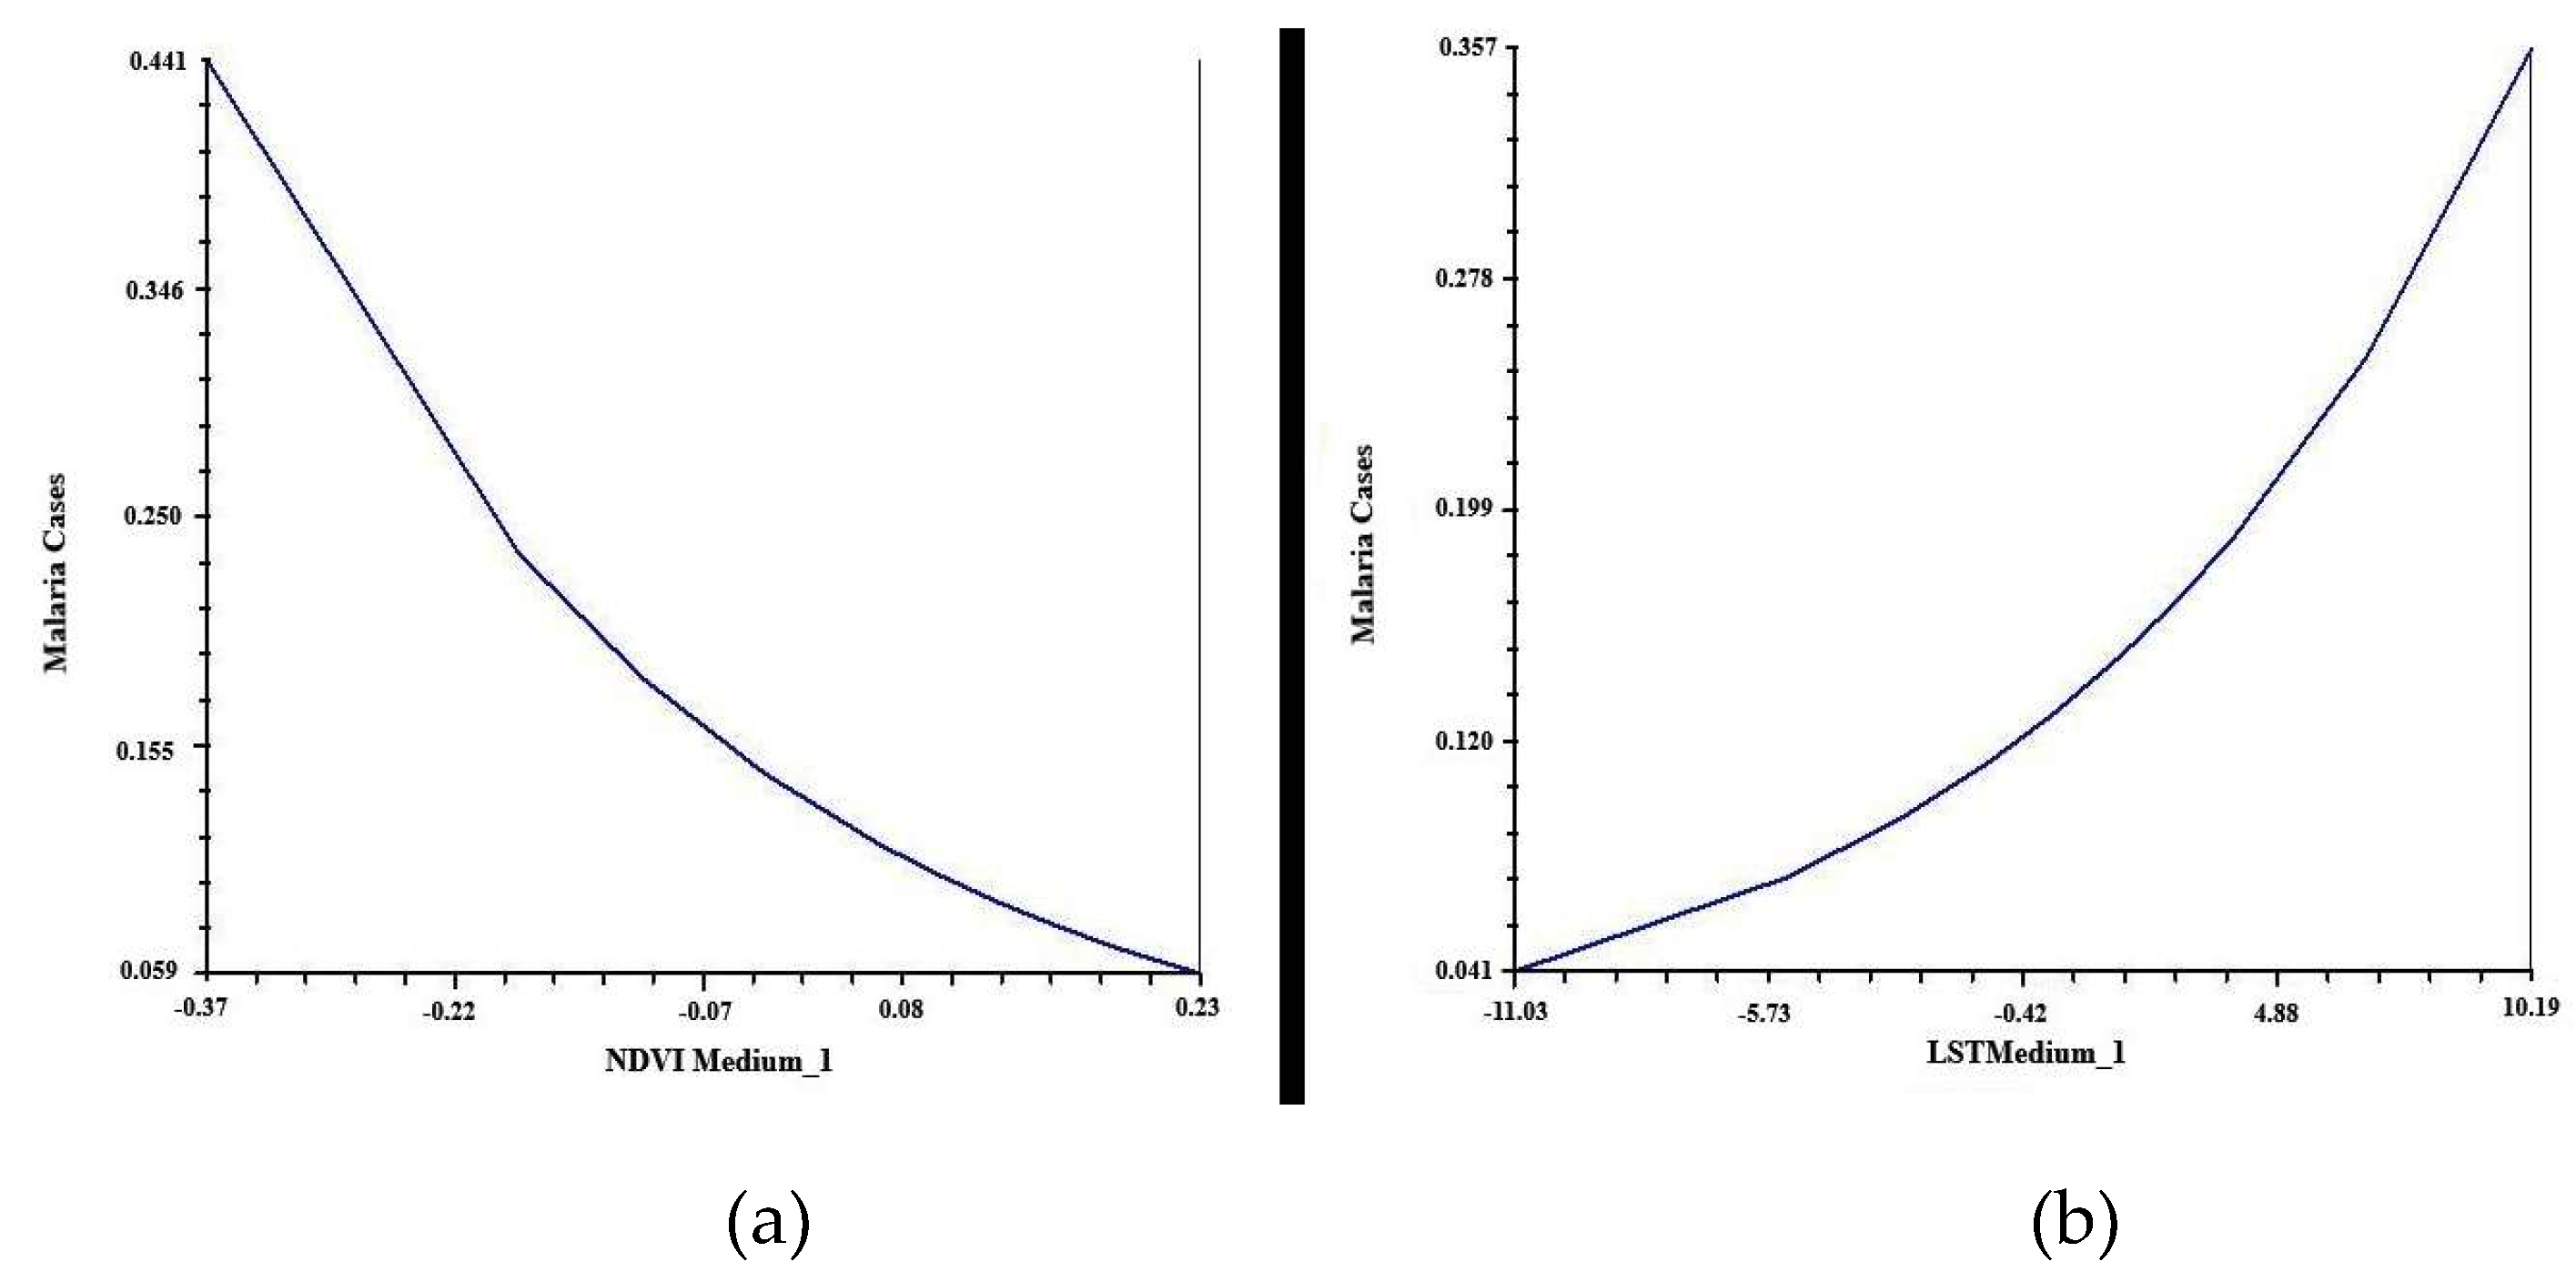
Figure 5.
Model B. Relation between malaria cases and observed variability of (a) mean NDVI and (b) mean LST.
Figure 5.
Model B. Relation between malaria cases and observed variability of (a) mean NDVI and (b) mean LST.
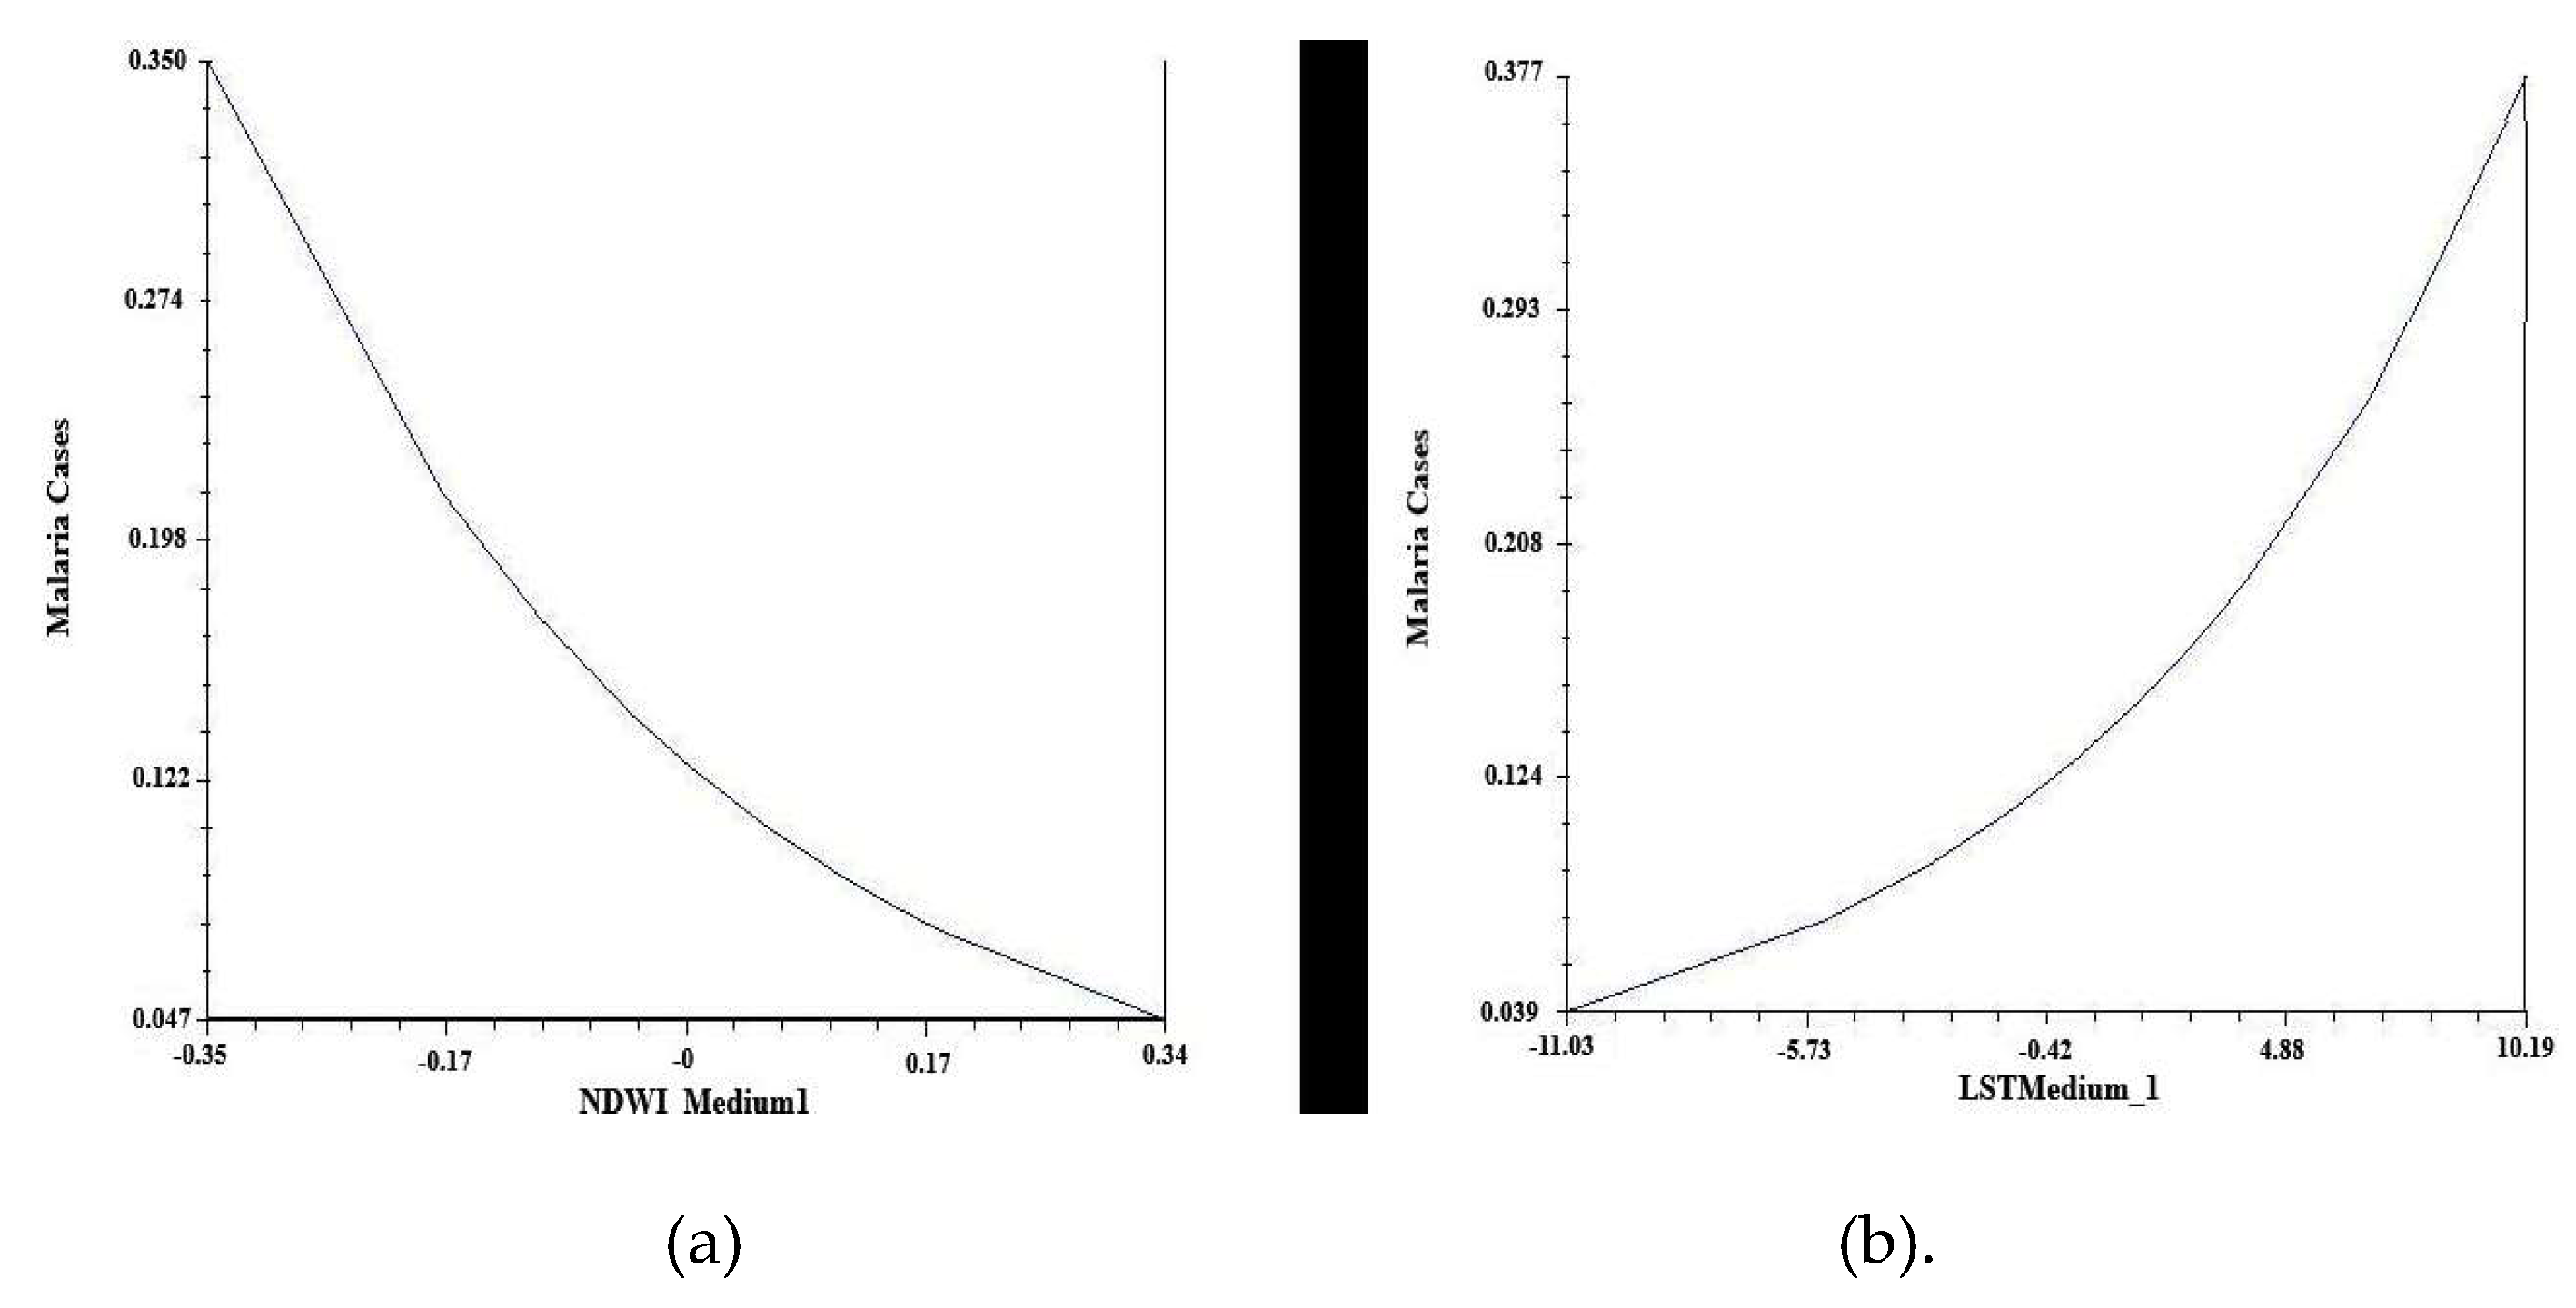

Table 1.
Correlation analysis between environmental variables NDVI, NDWI and LST.
| NDVImin | meanNDVI | NDVImax | NDVIvar | NDWImin | Wimedia | NDWImax | NDWIvar | LSTmin | meanLST | LSTmax | |
|---|---|---|---|---|---|---|---|---|---|---|---|
| NDVImin | 1 | ||||||||||
| meanNDVI | 0.865 | 1.000 | |||||||||
| NDVImax | 0.759 | 0.958 | 1.000 | ||||||||
| NDVIvar | -0.434 | -0.250 | -0.110 | 1.000 | |||||||
| NDWImin | 0.823 | 0.768 | 0.665 | -0.503 | 1.000 | ||||||
| Mean NDWI | 0.779 | 0.905 | 0.862 | -0.309 | 0.876 | 1.000 | |||||
| NDWImax | 0.582 | 0.807 | 0.828 | -0.189 | 0.770 | 0.932 | 1.000 | ||||
| NDWIvar | -0.419 | -0.141 | 0.081 | 0.194 | -0.247 | -0.051 | 0.171 | 1.000 | |||
| LSTmin | 0.128 | 0.072 | 0.032 | -0.019 | 0.055 | 0.057 | 0.010 | -0.085 | 1.000 | ||
| meanLST | -0.010 | -0.026 | -0.056 | 0.058 | -0.042 | -0.042 | -0.049 | -0.029 | 0.961 | 1.000 | |
| LSTmax | -0.093 | -0.095 | -0.110 | 0.123 | -0.128 | -0.115 | -0.110 | 0.006 | 0.932 | 0.989 | 1.000 |
| LSTVar | -0.544 | -0.409 | -0.317 | 0.410 | -0.453 | -0.411 | -0.269 | 0.304 | -0.185 | 0.064 | 0.156 |
NDVI: Normalized Difference Vegetation Index; NDWI: Normalized Difference Water Index; LST: Land Surface Temperature.
Table 2.
Details of the parameters of the model proposed by the Expert Modeler.
| Model | Number of predictors | Statistics of model adjustment | Lung-Box Q (18) | Number of outliers | ||||
| R-squared stationary | R-squared | RMSE | Statistics | Degrees of freedom | Sig. | |||
| Cases-Model_1 | 2 | 0.882 | 0.882 | 1.856 | 17.511 | 17 | 0.420 | 9 |
Table 3.
Estimators of TF proposed by the Expert Modeler.
| Estimation | SE | t- value | p-value | |||||
|---|---|---|---|---|---|---|---|---|
| Cases-Model_1 |
Cases NDVI_max NDWI_mean |
Without transformation Without transformation Without transformation |
MA Numerator Delay Numerator |
Delay 1 Delay 0 Delay 0 |
0.280 4.368 5 -4.588 |
0.081 0.453 0.963 |
-3.473 9.639 -4.764 |
0.001 0.000 0.000 |
SE: Standard Error.
Table 4.
Estimators of Model A (IRR: Incidence Rate Ratio; S.E. Standard Error; C.I. 95%: Confidence Interval).
Table 4.
Estimators of Model A (IRR: Incidence Rate Ratio; S.E. Standard Error; C.I. 95%: Confidence Interval).
| Variable | IRR | E. E. | C.I. 95 % |
|---|---|---|---|
| Mean NDVI | 0.035320 | 0.927147 | (0.006-0.219) |
| Mean LST | 1.107243 | 0.041824 | (1.020-1.202) |
NDVI: Normalized Difference Vegetation Index; LST: Land Surface Temperature.
Table 5.
Estimators of Model B (IRR: Incidence Rate Ratio; S.E. Standard Error; C.I. 95%: Confidence Interval).
Table 5.
Estimators of Model B (IRR: Incidence Rate Ratio; S.E. Standard Error; C.I. 95%: Confidence Interval).
| Variables | IRR | S. E. | C.I. 95 % |
|---|---|---|---|
| Mean NDWI | 0.044541 | 0.999834 | (0.006-0.318) |
| Mean LST | 1.113038 | 0.037246 | (1.034-1.198) |
NDVI: Normalized Difference Vegetation Index; LST: Land Surface Temperature.
Disclaimer/Publisher’s Note: The statements, opinions and data contained in all publications are solely those of the individual author(s) and contributor(s) and not of MDPI and/or the editor(s). MDPI and/or the editor(s) disclaim responsibility for any injury to people or property resulting from any ideas, methods, instructions or products referred to in the content. |
© 2025 by the authors. Licensee MDPI, Basel, Switzerland. This article is an open access article distributed under the terms and conditions of the Creative Commons Attribution (CC BY) license (http://creativecommons.org/licenses/by/4.0/).
Copyright: This open access article is published under a Creative Commons CC BY 4.0 license, which permit the free download, distribution, and reuse, provided that the author and preprint are cited in any reuse.


