Preprint
Article

This version is not peer-reviewed.

Nonlinear Associations Between Serum Vitamin D and Uric Acid in Korean Adults: 2022–2023 KNHANES Data

A peer-reviewed article of this preprint also exists.

Submitted:

13 February 2025

Posted:

14 February 2025

You are already at the latest version

Abstract

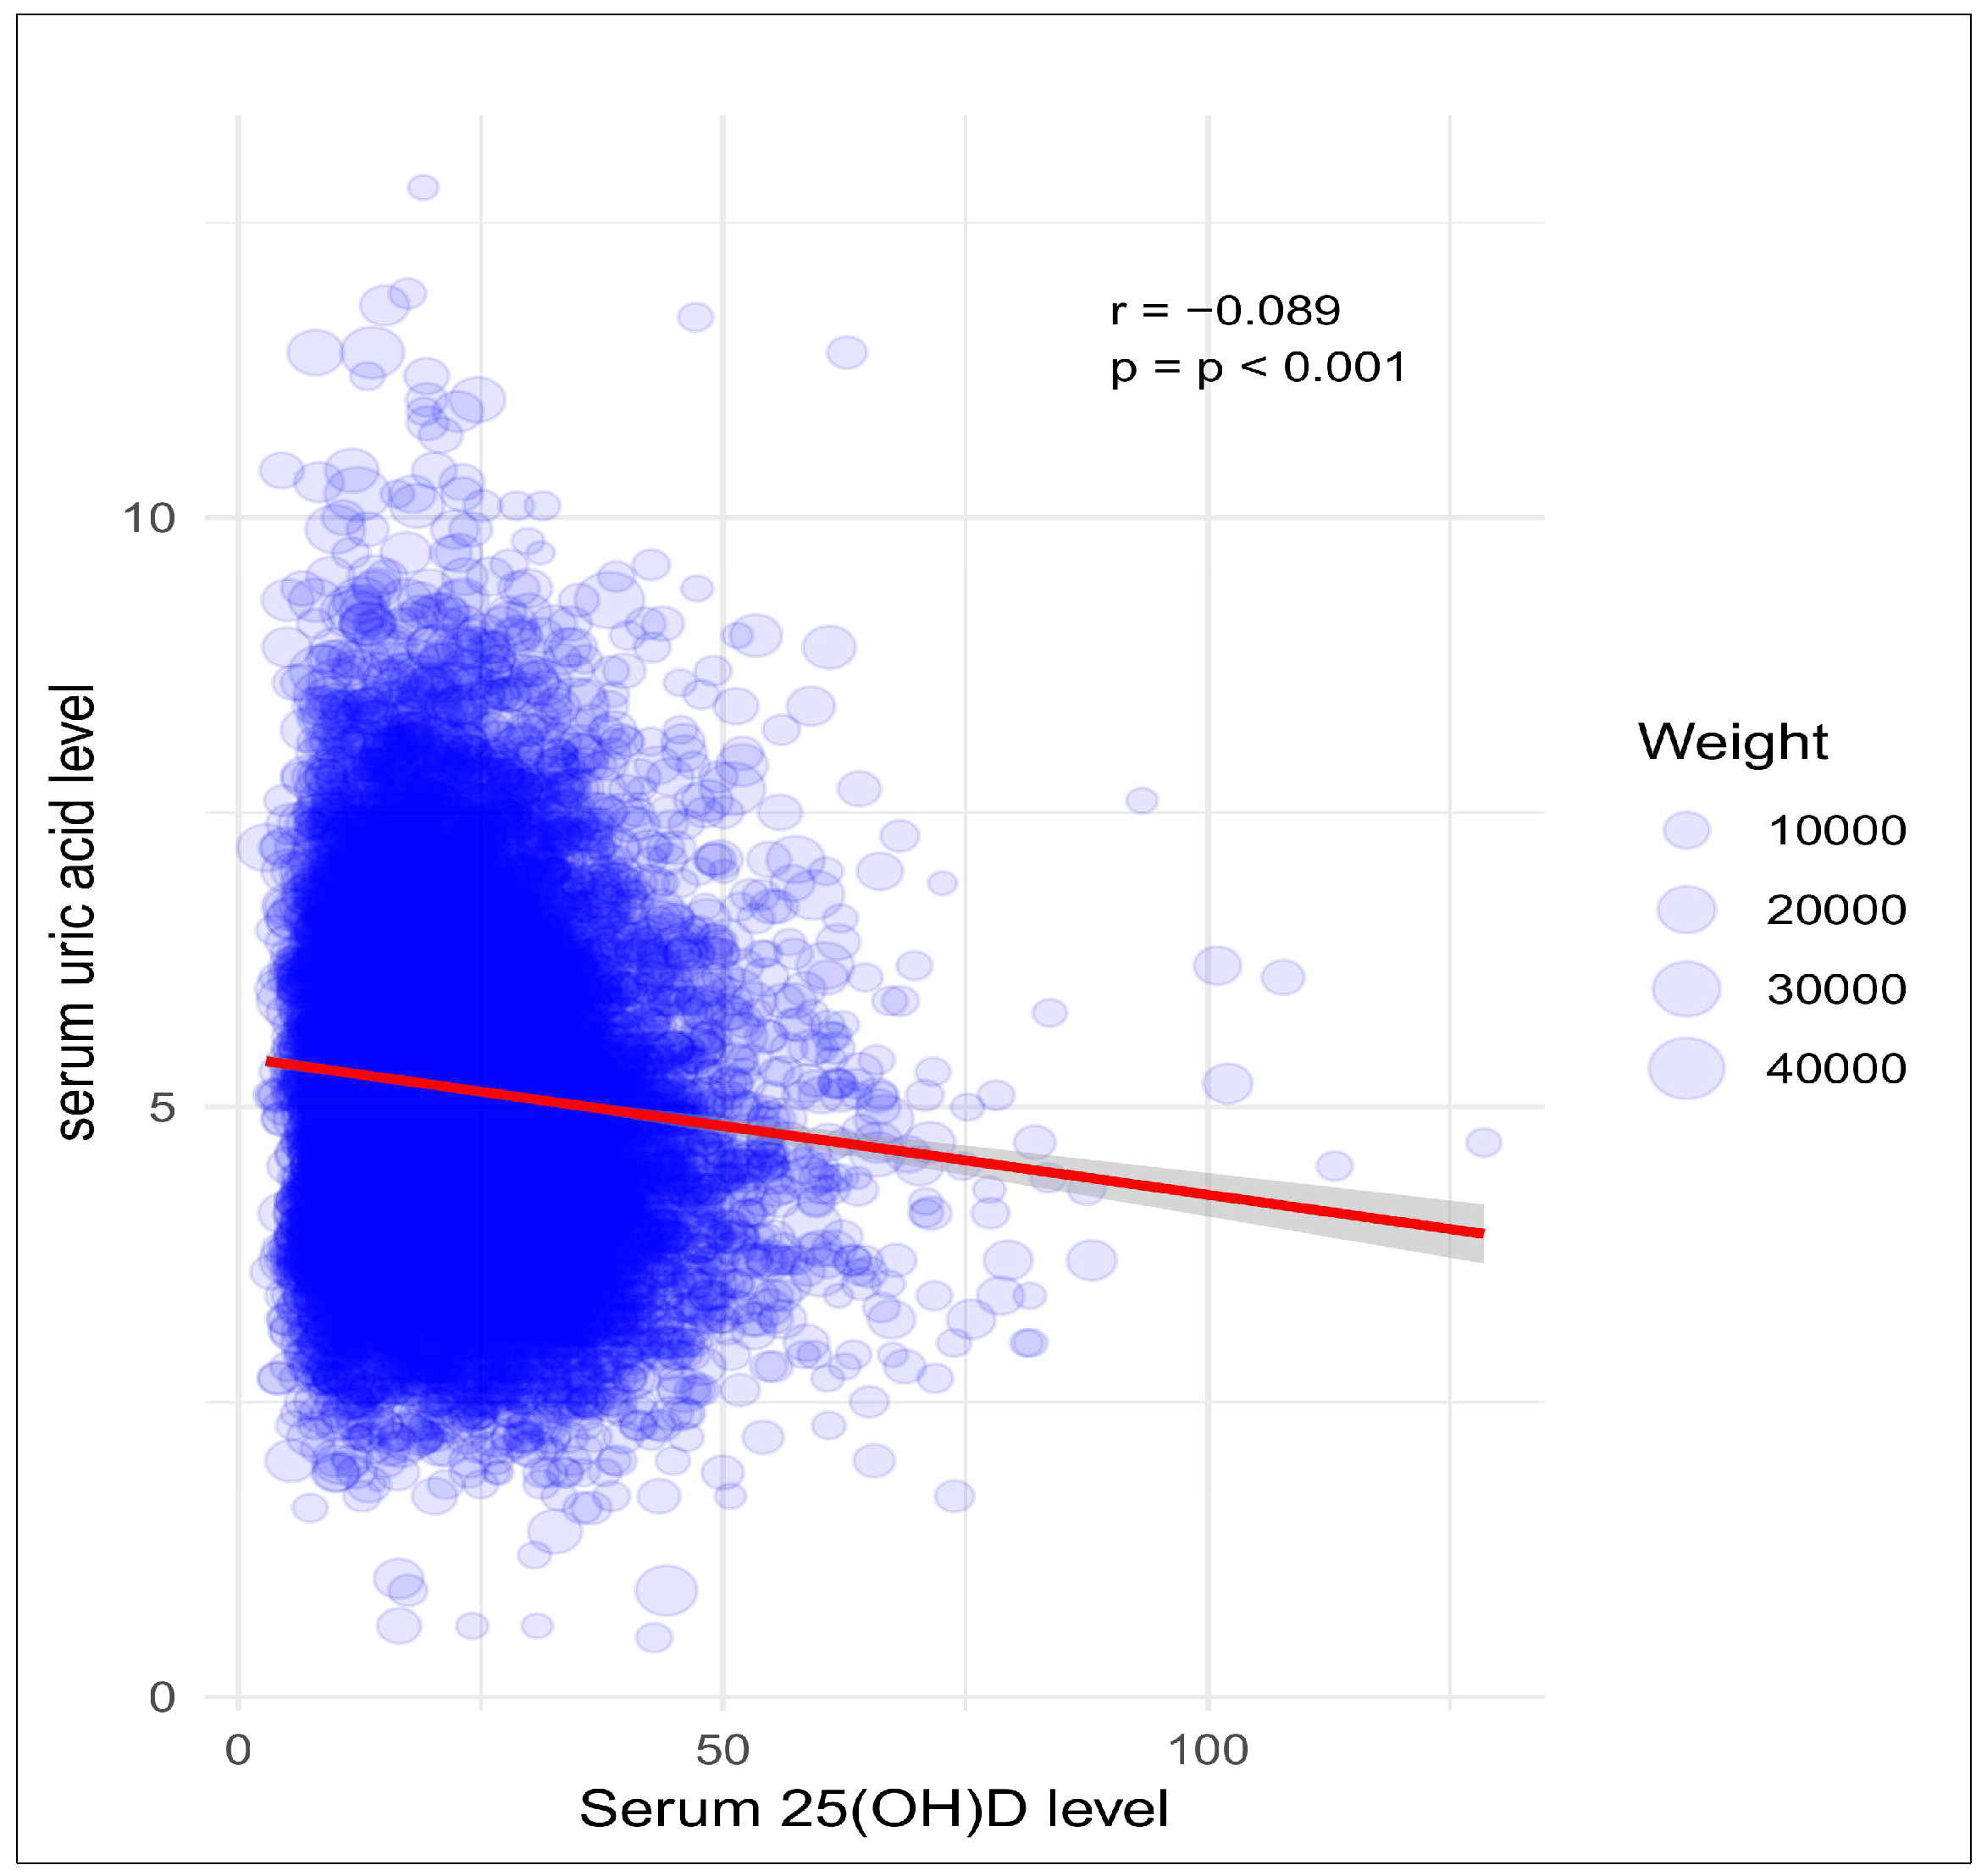
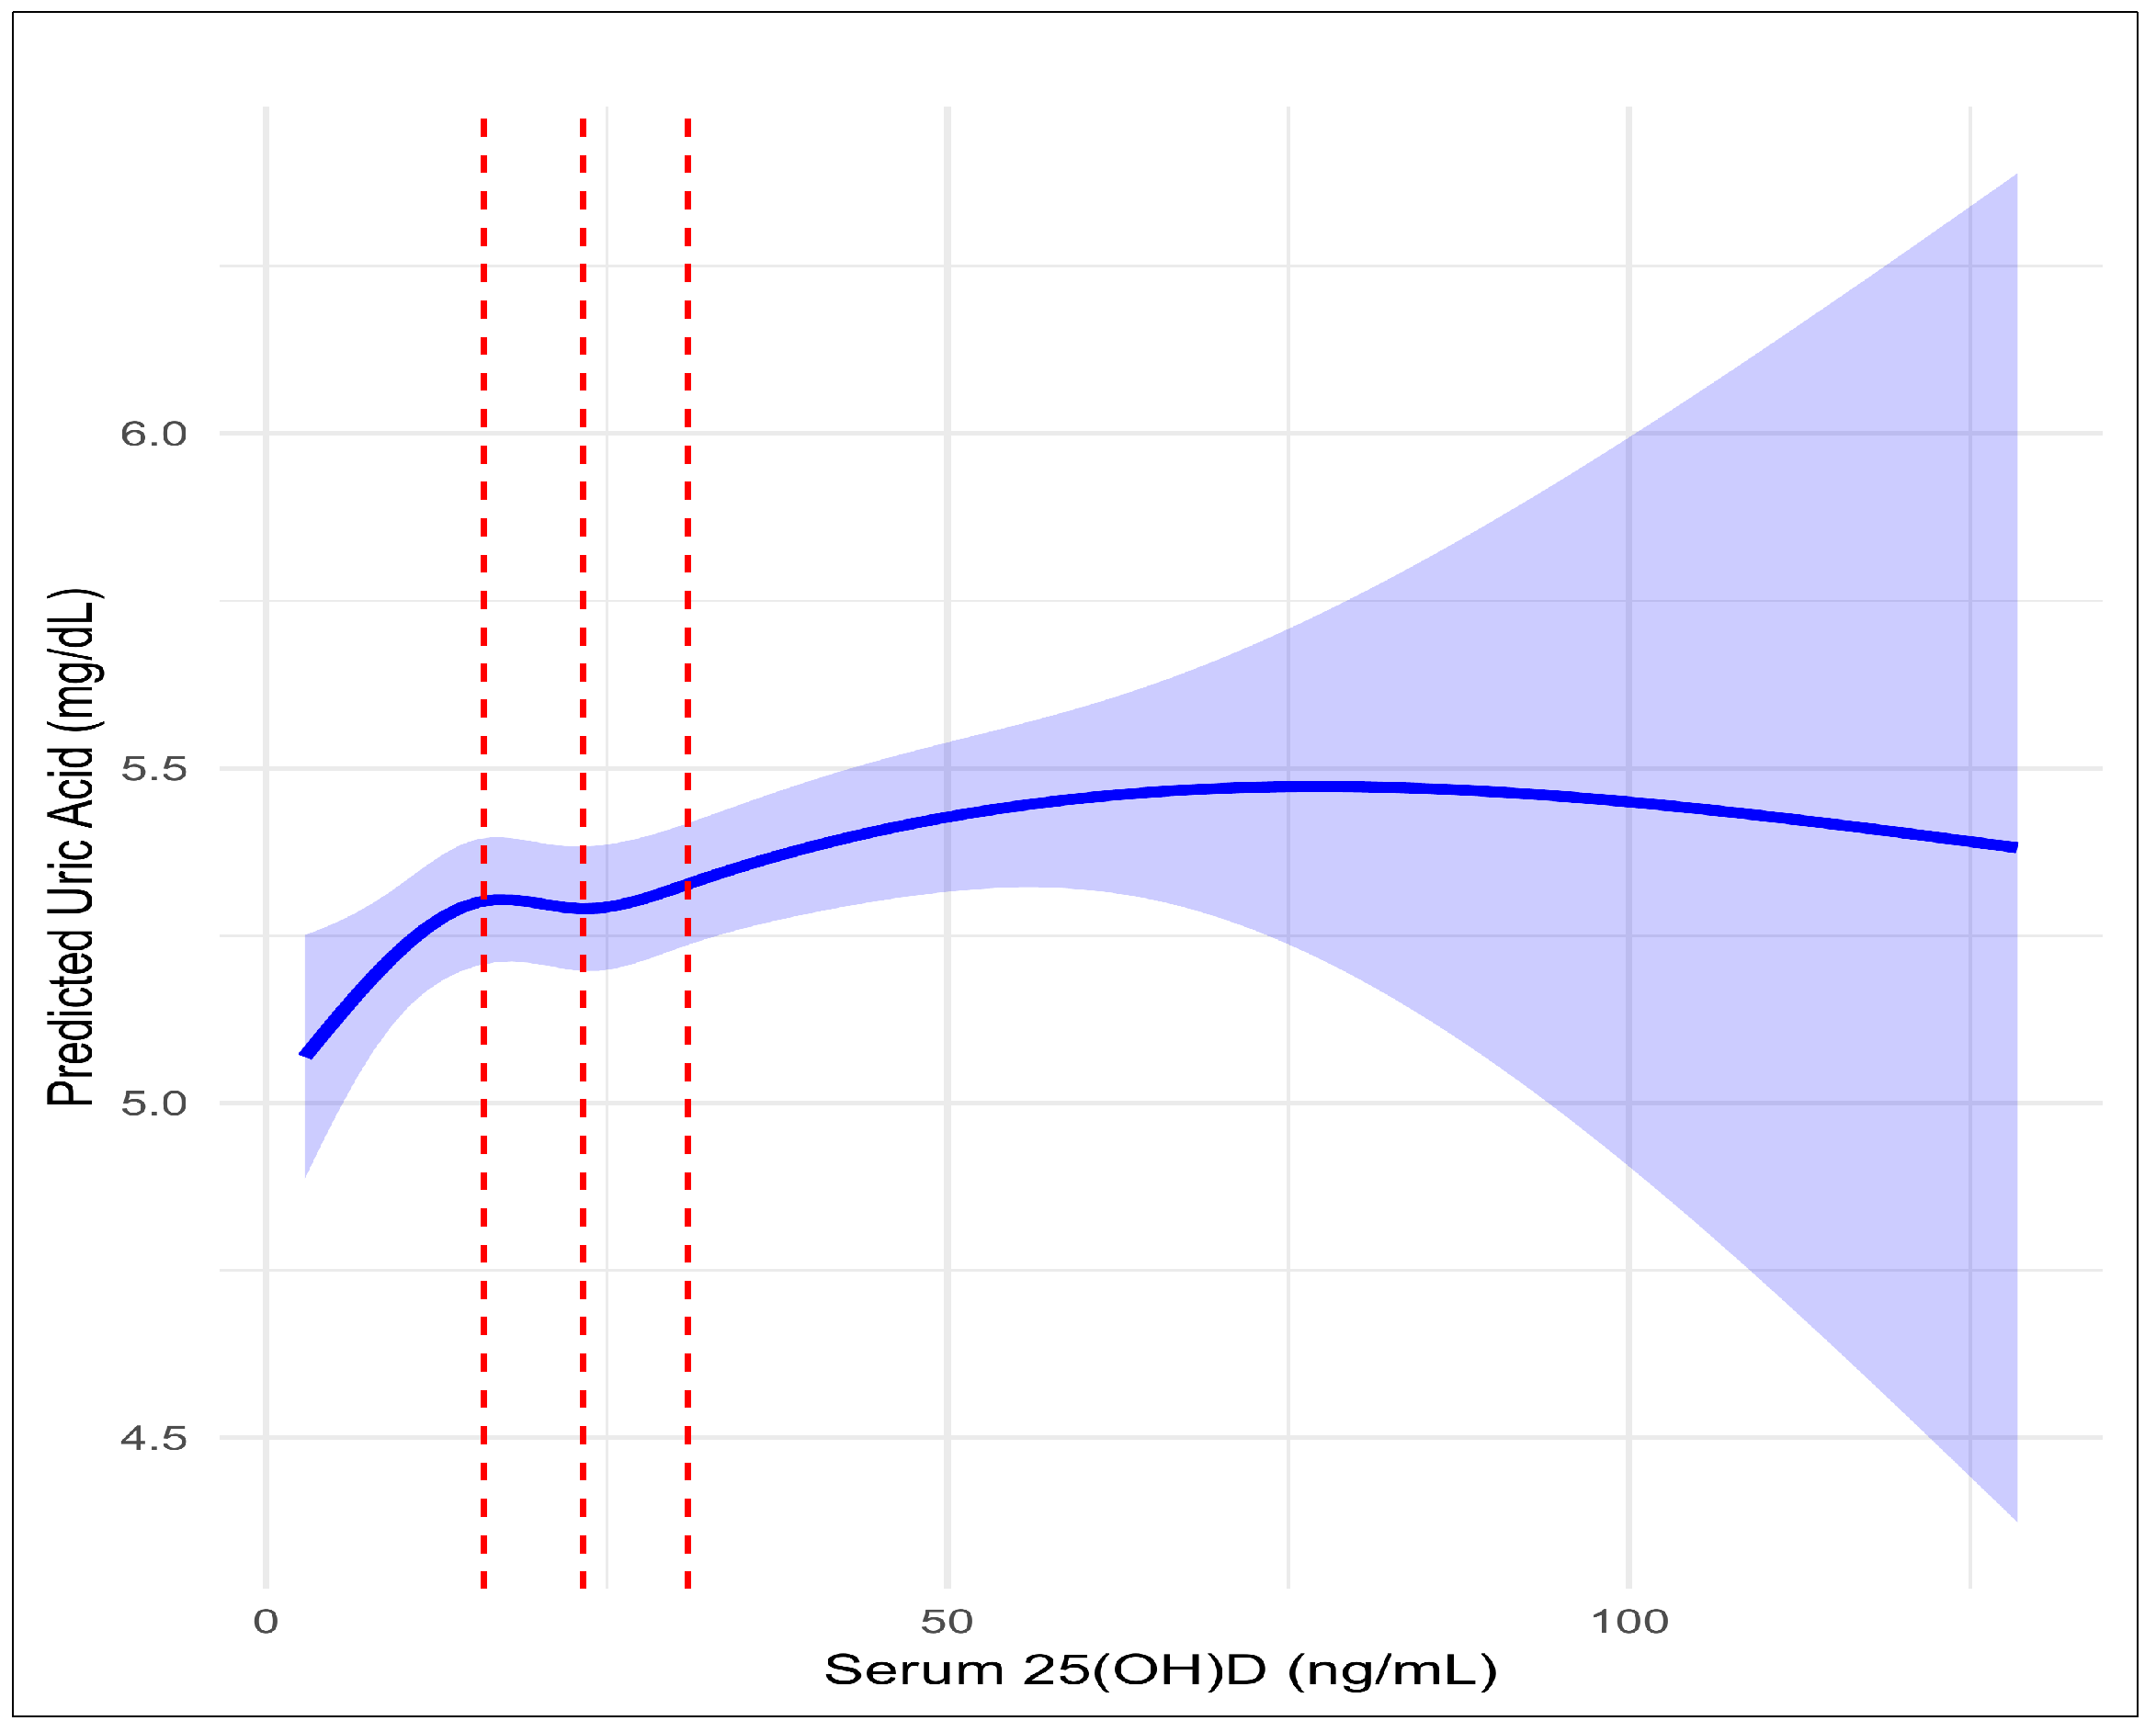
Objectives: To investigate a non-linear relationship between serum vitamin D level and uric acid concentration and to evaluate the potential of vitamin D as a biomarker for inflammatory diseases such as hyperuricemia. Methods: Using data from the Korea National Health and Nutrition Examination Survey (KNHANES), an analysis was conducted on 10,864 adults aged 19 years or more. Serum vitamin D levels were categorized into quartiles (Q1–Q4) for analysis. Their linear and non-linear relationships with uric acid concentrations were assessed using Pearson correlation analysis, analysis of variance (ANOVA), and restricted cubic spline regression. Confounding variables including age, sex, BMI, kidney function, chronic diseases, and macronutrient intake were adjusted for in the analysis. Results: In univariate analysis, a statistically significant but weak negative correlation was observed between serum vitamin D and uric acid levels (Pearson’s correlation coefficient: -0.089, < 0.001). However, after adjusting for confounders, multivariate regression revealed a weak positive association. Restricted cubic spline regression identified significant positive associations in lower quartiles (Q1–Q3), with the strongest effect observed in Q3 (beta-coefficient: 0.643, 95% CI: 0.09–1.20, p = 0.023). No significant association was found in the highest quartile (Q4). Conclusions: Vitamin D and uric acid metabolism have a non-linear relationship, particularly showing a positive association in vitamin D insufficiency (< 30 ng/mL). These findings support the potential of vitamin D as a biomarker for hyperuricemia and related inflammatory-metabolic diseases.

Keywords: 
;  ;  ;  ;  ;  ;  ;  

1. Introduction

Serum uric acid regulates inflammation and oxidative stress. It plays a critical role in chronic metabolic diseases such as cardiovascular disease, metabolic syndrome, obesity, and diabetes.[1,2,3] Vitamin D, known for its role in metabolic regulation, can also influence uric acid levels by reducing inflammatory responses, improving insulin sensitivity, mitigating oxidative damage, and modulating immune activity [4,5,6].
Emerging evidence has suggested a mutual influence between vitamin D and uric acid through shared mechanisms, including immune regulation and renal function.[7,8] Notably, vitamin D deficiency can heighten pro-inflammatory cytokine production (IL-6, TNF-α), leading to kidney damage and uric acid buildup, while elevated uric acid can exacerbate inflammation via NLRP3 inflammasome activation, further impairing vitamin D metabolism.[9,10,11] However, prior studies investigating their relationship have yielded inconsistent findings, including positive, negative, and non-linear associations, due to variations in study design, population characteristics, and environmental factors [12,13,14]. While sufficient vitamin D levels are consistently linked to lower uric acid concentrations, the relationship under insufficiency conditions remains unclear and varies significantly across studies [13,15]. Recent meta-analyses have suggested a potential bidirectional relationship between vitamin D and uric acid, [16,17] highlighting the complexity of their interplay and the involvement of multifaceted physiological mechanisms.
South Korea has relatively low average vitamin D levels due to limited sunlight exposure and an indoor-centered lifestyle.[18,19,20] This presents a unique opportunity to investigate the relationship between vitamin D and uric acid in a population with a high prevalence of vitamin D insufficiency, helping to clarify conflicting findings from previous studies and providing a deeper understanding of their association. Furthermore, these findings could offer valuable insights into chronic disease risk prediction and management strategies in populations worldwide with similar environmental and lifestyle characteristics.
This study aligns with ongoing efforts to standardize vitamin D measurement and investigates its potential role as a biomarker in inflammatory-based diseases. Using standardized serum 25-hydroxyvitamin D (25(OH)D) data obtained through LC-MS/MS methods from the Korea National Health and Nutrition Examination Survey (KNHANES), this study aimed to investigate a non-linear relationship between serum vitamin D level and uric acid concentration and to evaluate the potential of vitamin D as a biomarker for inflammatory diseases such as hyperuricemia. It provides consistent insights into the association between serum uric acid levels and vitamin D status. By addressing inconsistencies caused by non-standardized measurements in previous studies, this research offers a robust perspective on the relationship between vitamin D and uric acid while exploring whether this interaction follows a linear or non-linear pattern. Key factors such as age, sex, BMI, and kidney function are also considered, underscoring the potential of vitamin D as a biomarker in managing inflammatory and metabolic diseases.

2. Materials and Methods

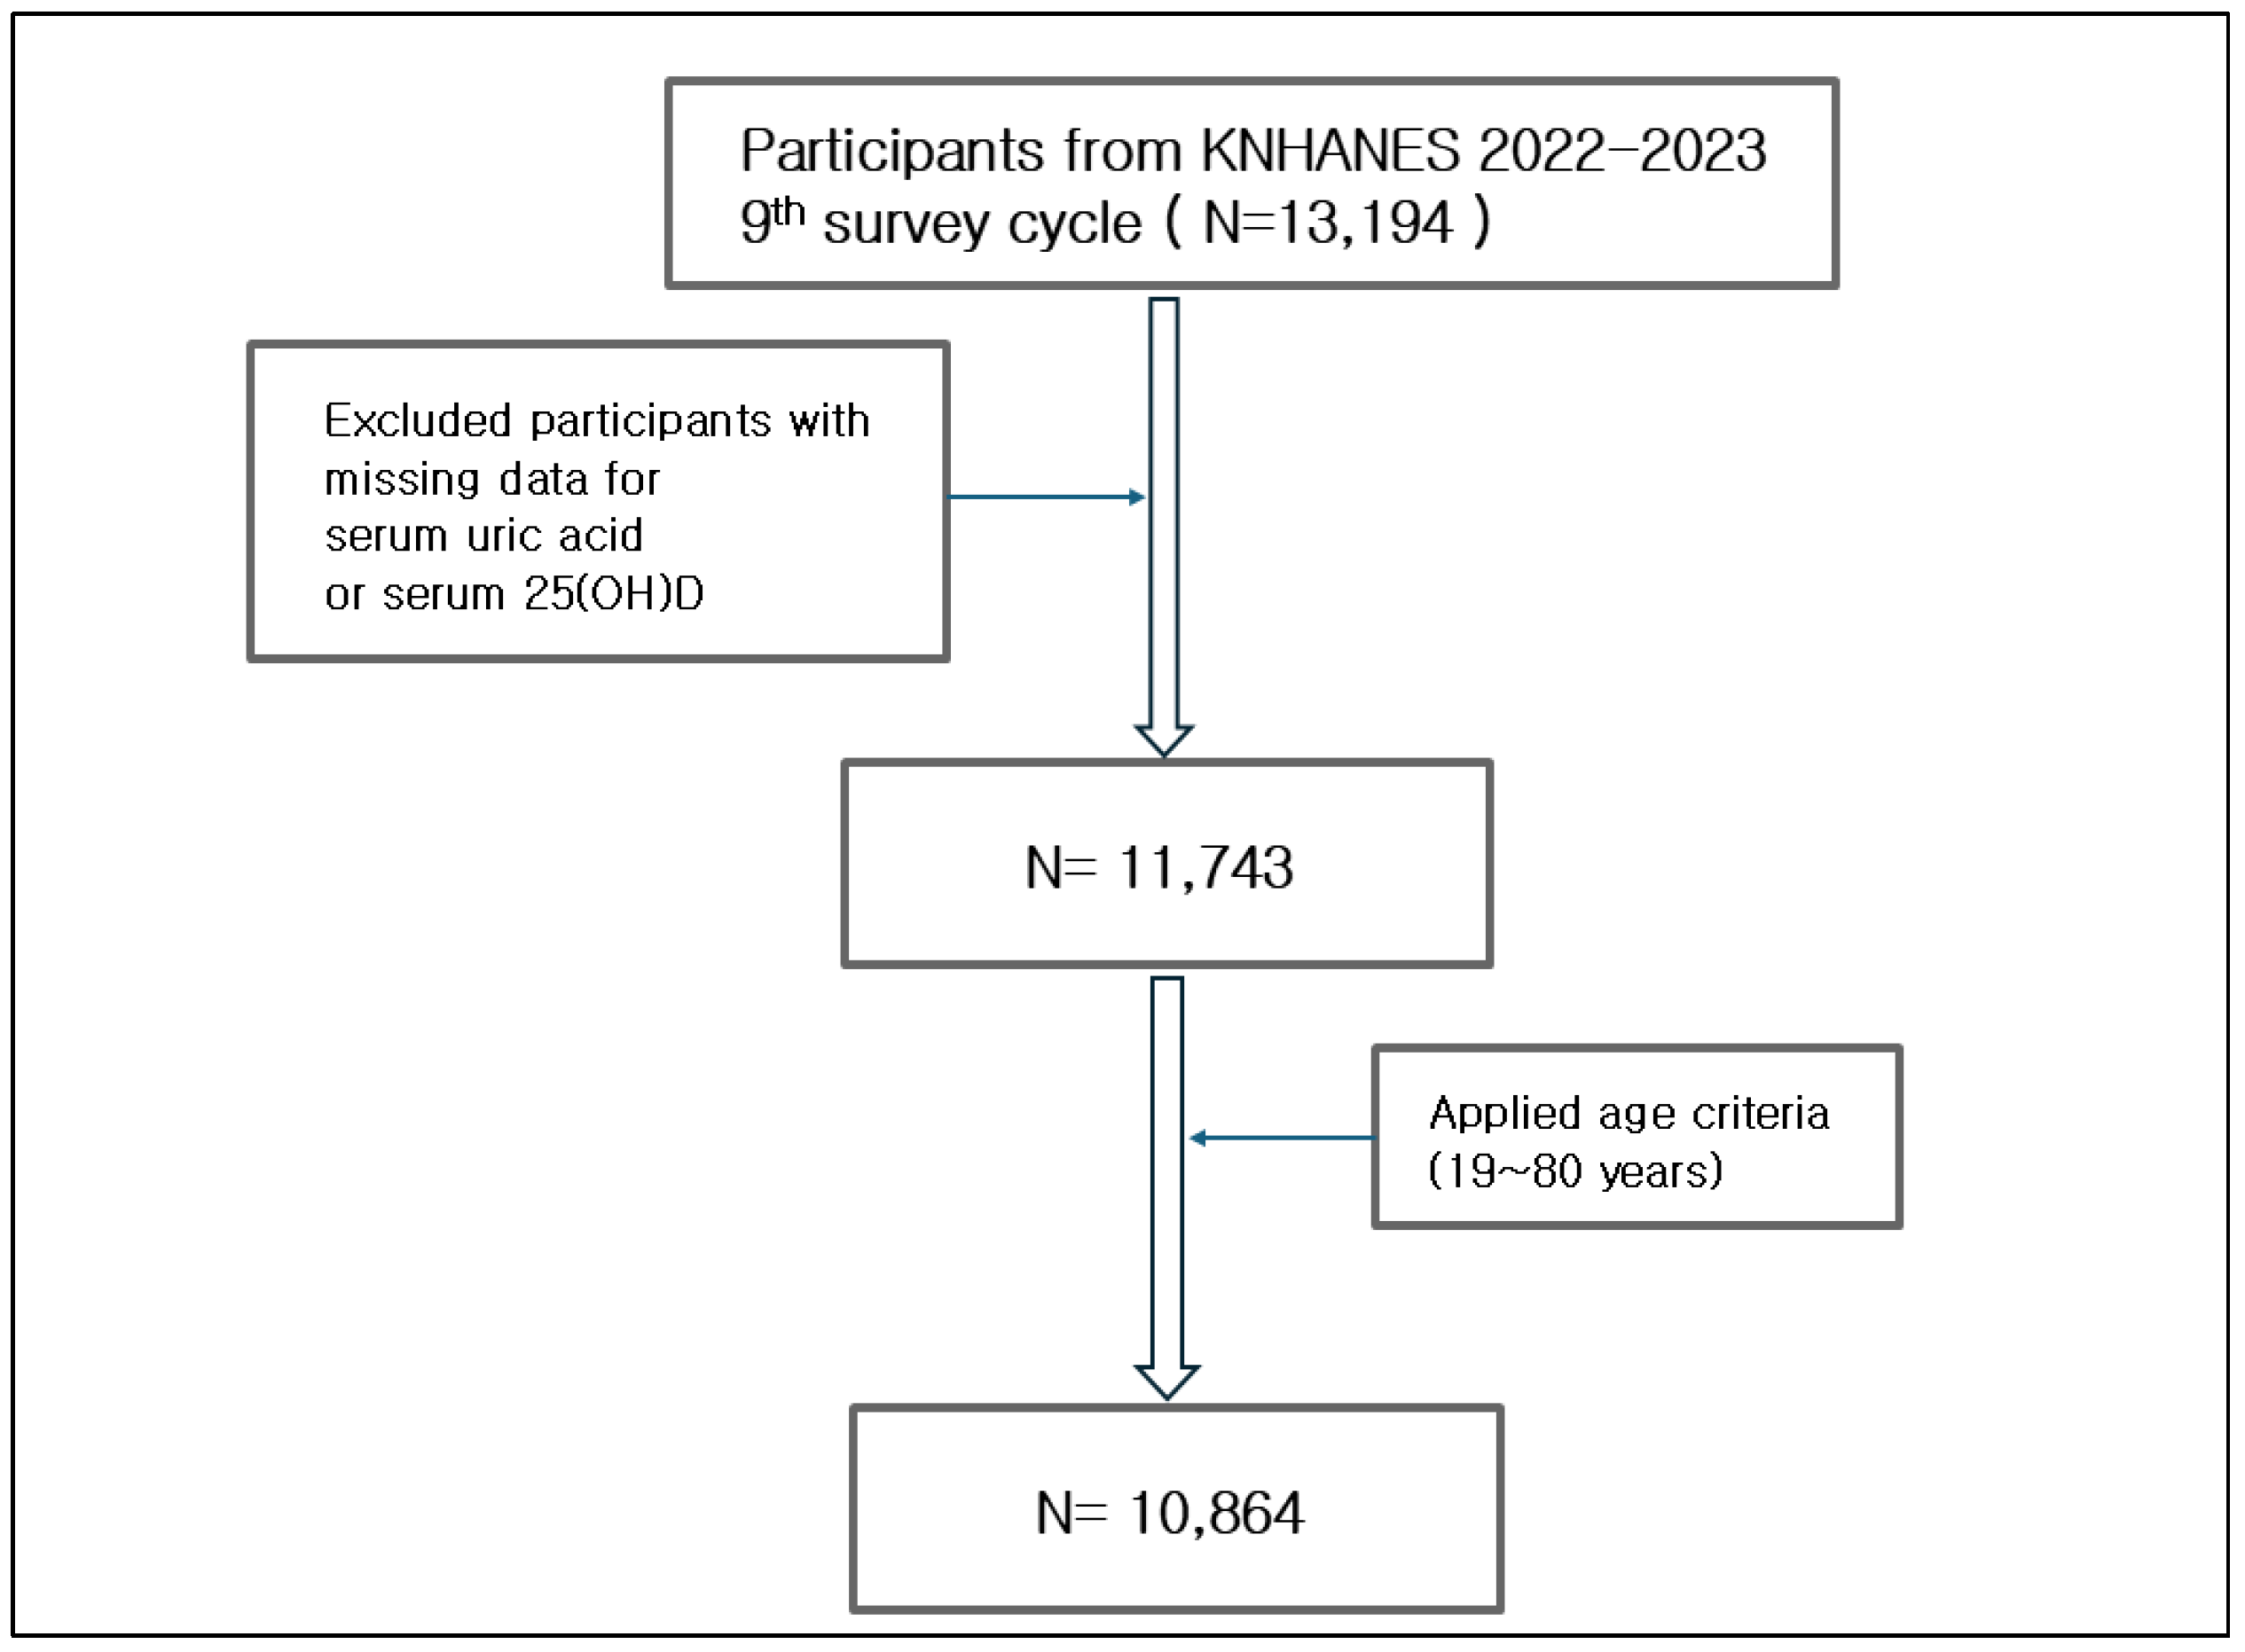
2.1. Study Population

This study used data from the Korea National Health and Nutrition Examination Survey (KNHANES) to explore the relationship between serum vitamin D levels and serum uric acid concentrations. Conducted annually by the Korea Disease Control and Prevention Agency (KDCA), KNHANES employs a sampling framework representative of the Korean population aged one year or more, capturing diverse demographic characteristics. Internationally recognized for its reliable data, KNHANES standardizes its 25(OH)D analysis to the liquid chromatography-tandem mass spectrometry (LC-MS/MS) method starting from the 9th survey cycle (2022–2023), improving accuracy and global comparability. Since the methodology for serum vitamin D analysis was revised in the 9th cycle, results are not directly comparable with earlier cycles. Therefore, this study focused on data from the first two years of the 9th cycle (2022–2023), which included measurements of serum vitamin D and uric acid. The analysis was restricted to adults aged 19 years or more. Participants with missing key data such as age, sex, serum uric acid, or vitamin D levels were excluded to maintain the integrity of the dataset while preserving sample size. After applying these exclusion criteria, a total of 10,864 participants were included in the final analysis (Figure 1). All participants in the 2022 and 2023 KNHANES provided written informed consent prior to participation. This study adhered to the principles of the Declaration of Helsinki. Since the KNHANES datasets are publicly available, anonymized, and de-identified, this secondary analysis was exempt from Institutional Review Board approval (IRB Approval Number: AJOUIRB-EX-2024-629).

2.2. Clinical and Laboratory Variables

Serum 25-hydroxyvitaminD [25(OH)D2 and 25(OH)D3] and serum uric acid concentrations were extracted separately from the KNHANES database. Total serum 25-hydroxyvitamin D [25(OH)D] concentration was calculated as the sum of 25(OH)D2 and 25(OH)D3. Demographic variables included age (years) and sex (male or female). Anthropometric measures comprised body mass index (BMI, kg/m²), waist circumference (WC, cm), and blood pressure levels [systolic (SBP, mmHg) and diastolic (DBP, mmHg)]. Medical variables encompassed the prevalence of hypertension, diabetes, and dyslipidemia determined via questionnaire-based responses. Laboratory markers measured in a fasting state included glycemic indices (fasting glucose), glycated hemoglobin (HbA1c), lipid profiles (total cholesterol, triglycerides, low-density lipoprotein cholesterol [LDL-C], and high-density lipoprotein cholesterol [HDL-C]), kidney function (creatinine [Cr]), and inflammatory markers (high-sensitivity C-reactive protein [hs-CRP, mg/L]). Lifestyle variables comprised monthly alcohol consumption frequency and daily nutrient intake, including protein (g/day), carbohydrates (g/day), and fat (g/day).

2.3. Statistics

Various statistical methods were employed to analyze the relationship between serum total 25-hydroxyvitamin D (25(OH)D) levels and serum uric acid concentrations. A scatterplot was generated to visualize the relationship between serum total 25(OH)D levels and serum uric acid concentrations. Pearson’s correlation coefficient (PCC) was calculated to assess the linear association between the two variables. Serum total 25(OH)D levels were categorized into quartiles (Q1–Q4). One-way analysis of variance (ANOVA) was performed to evaluate differences in mean uric acid levels across quartile groups. Post-hoc pairwise comparisons were conducted using the Bonferroni adjustment and a p-value of < 0.05 was considered statistically significant. Multivariate linear regression analysis was conducted to control for potential confounding variables, including age, sex, BMI, dietary intake, and other clinical factors. Serum uric acid concentration was set as the dependent variable. Serum total 25(OH)D concentration was used as the independent variable. Restricted cubic spline regression was applied to evaluate the nonlinear relationship between serum total 25(OH)D levels and serum uric acid concentrations. This analysis accounted for potential confounding variables, including age, sex, BMI, dietary intake, and clinical factors, while exploring variable change patterns across specific intervals. Sampling weights were applied to ensure that findings could be representative of the Korean population, accounting for the complex survey design. All analyses were conducted using R software (version 4.4.2).

3. Results

3.1. Baseline Characteristics

Baseline characteristics according to serum total 25-hydroxyvitamin D (25(OH)D) level quartile are presented in Table 1, providing an overview of demographic, clinical, and biochemical parameters categorized by vitamin D quartile. As serum total 25(OH)D concentrations increased, trends toward an older age, a greater proportion of female participants, an elevated systolic blood pressure, increased prevalence of hypertension and diabetes, dyslipidemia, and a higher HbA1c level were observed. In contrast, trends toward lower BMI, waist circumference (WC), triglyceride levels, LDL-C levels, serum uric acid levels, and monthly alcohol consumption (defined as ≥ 1 drink/month) were observed with higher serum total 25(OH)D concentrations. No significant correlation of serum total 25(OH)D concentration with high-sensitivity C-reactive protein (hs-CRP) level was found. One-way ANOVA revealed significant differences in mean uric acid levels among quartiles (p-value < 0.001; Table 1). This indicates that higher serum total 25(OH)D concentrations are associated with lower uric acid levels. Bonferroni-adjusted post-hoc comparisons revealed significantly lower uric acid levels in Q4 (4.91 ± 0.03 mg/dL) than in Q1–Q3 (5.22 ± 0.05 mg/dL). This finding was based on a weighted analysis, which adjusted for sampling bias. It differed slightly from the unweighted analysis presented in Table 1. These trends suggest that higher serum total 25(OH)D concentrations are associated with favorable metabolic profiles.

3.2. Linear Correlation Analysis

A scatterplot revealed a weak negative correlation between serum 25(OH)D level and uric acid concentration (Pearson’s correlation coefficient [PCC]: -0.089, p < 0.001; Figure 2). This finding suggests that higher serum 25(OH)D levels might be associated with slightly lower uric acid concentrations. However, the correlation strength is minimal and likely influenced by additional factors. In contrast, multivariate analysis using weighted data demonstrated that this relationship was not significant after adjusting for age and sex (Model 1, Table 2). When BMI was added to the adjustment (Model 2, Table 2), a significant but very weak positive correlation emerged, differing from the initial negative trend observed in the scatterplot. Further adjustments of age, sex, BMI, alcohol use, creatinine, chronic disease status (hypertension and diabetes), and lipid profiles (HDL-c, TG, LDL-c) in Model 3 showed a significant p-value, but the correlation was still very weak and positive. These findings underscore the complexity of the association between serum 25(OH)D and uric acid levels and highlight the importance of accounting for confounding variables in such analyses.

3.3. Non-Linear Analysis

Based on these findings, a potential non-linear relationship between serum 25(OH)D level and uric acid concentration was hypothesized. Among regression models, Model 3 demonstrated the highest explanatory power (Table 2). Thus, it was considered the most appropriate for this analysis. Restricted cubic spline regression was performed using weighted data, adjusting for covariates in Model 3, including age, sex, BMI, alcohol use, creatinine, chronic disease status (hypertension, diabetes, and dyslipidemia), nutritional intake (carbohydrates, fats, and proteins), and lipid levels (HDL-c, TG, LDL-c). The analysis revealed significant positive associations in quartiles Q1 (< 15.96 ng/mL), Q2 (15.96–23.21 ng/mL), and Q3 (23.21–30.94 ng/mL), with the strongest association observed in Q3 (beta-coefficient: 0.643, 95% CI: 0.09–1.20, p = 0.023; Table 3; Figure 3). In contrast, Q4 (> 30.94 ng/mL) showed no statistically significant association of serum 25(OH)D level with uric acid concentration (beta-coefficient: 0.186, 95% CI: -0.82–1.19, p = 0.716). Since 25(OH)D3 is the predominant form of total 25(OH)D and primarily responsible for vitamin D’s biological activity and physiological effects, an additional analysis focusing on serum 25(OH)D3 levels was conducted. The restricted cubic spline regression for serum 25(OH)D3 after adjusting for the same covariates as in the total 25(OH)D analysis revealed significant positive associations of serum 25(OH)D3 levels with uric acid concentrations in quartiles Q1 (< 15.62 ng/mL), Q2 (15.62–22.88 ng/mL), and Q3 (22.88–30.62 ng/mL), with the strongest association observed in Q3 (beta-coefficient: 0.598, 95% CI: 0.05–1.15, p = 0.033; Table 4). In contrast, Q4 (> 30.62 ng/mL) showed a positive trend (beta-coefficient: 0.203, 95% CI: -0.79–1.20; Table 4) that did not reach statistical significance (p = 0.691). These findings aligned with those observed for total 25(OH)D. This suggests that 25(OH)D3 is the primary driver of observed relationships.

4. Discussion

This study was based on data from the Korea National Health and Nutrition Examination Survey (KNHANES), where serum 25-hydroxyvitamin D [25(OH)D] levels were analyzed using the standardized liquid chromatography-tandem mass spectrometry (LC-MS/MS) method. ANOVA after dividing participants into quartiles based on serum vitamin D levels showed that Q4 (serum vitamin D > 30 ng/mL) had significantly lower BMI, waist circumference, triglycerides, LDL-C, and uric acid levels than lower quartiles. A weak negative correlation between vitamin D and uric acid was observed in the overall scatterplot, supporting the hypothesis that vitamin D would have anti-inflammatory and metabolic regulatory effects. However, multivariate regression analysis after adjusting for confounders revealed a weak positive correlation, suggesting that factors such as BMI, age, and sex might influence this relationship and point to more complex mechanisms. Further restricted cubic spline regression confirmed significant positive associations between 25(OH)D and uric acid in lower to middle quartiles, with no significant association in Q4. Similar trends were observed in the analysis of 25(OH)D3, a major metabolite of vitamin D. This pattern suggests that the association between vitamin D and uric acid metabolism can vary depending on the concentration of vitamin D, with distinct metabolic impacts in insufficiency (< 30 ng/mL) and sufficiency (≥ 30 ng/mL) ranges.
Previous studies have explored the association between serum vitamin D level and uric acid concentration across diverse populations, emphasizing the complexity and variability of this relationship. For instance, the U.S. National Health and Nutrition Examination Survey (NHANES) using standardized LC-MS/MS methods to analyze serum 25(OH)D has found that individuals in the lowest quartile of vitamin D levels have a 46% higher risk of hyperuricemia compared to those in the highest quartile.[15] Meanwhile, another cross-sectional study of the general Chinese population employing LC-MS/MS has observed a non-linear, inverted U-shaped association between serum 25(OH)D and uric acid concentrations.[21] Additionally, a recent meta-analysis synthesizing existing evidence has highlighted significant heterogeneity in results across studies, largely attributed to differences in vitamin D measurement methods.[16]
According to current research, explaining the effect of vitamin D on hyperuricemia through a simple linear relationship is challenging. This complexity appears to stem from intricate interactions between serum vitamin D and uric acid known to be influenced by factors such as renal function, hormonal regulation, inflammation, oxidative stress, and genetic predispositions.[7,22] Furthermore, the lack of standardized methods for measuring vitamin D has been a significant obstacle to achieving consistent research findings.[16,23].
Vitamin D may exert its anti-inflammatory effects by suppressing pro-inflammatory cytokines such as interleukin-6 (IL-6) and C-reactive protein (CRP), which can help stabilize purine metabolism and potentially reduce uric acid production.[24,25] Additionally, it has been suggested that vitamin D might indirectly regulate enzymes such as xanthine oxidase, contributing to uric acid homeostasis.[26] In kidneys, vitamin D can reduce the expression of urate transporter 1 (URAT1), a key protein involved in uric acid reabsorption, while enhancing the activity of ATP-binding cassette subfamily G member 2 (ABCG2) and sodium-phosphate cotransporter types 1 and 4 (NPT1/4) to facilitate uric acid excretion.[27,28] These combined mechanisms suggest that vitamin D can lower uric acid levels through its anti-inflammatory properties and metabolic regulatory effects.
However, the impact of vitamin D on uric acid levels within the insufficient range has not been thoroughly discussed in previous studies. Our study confirmed a non-linear relationship between vitamin D and uric acid, revealing a positive correlation in the insufficient range. Several mechanisms might explain this observation. Uric acid, the final product of purine metabolism, is generated during normal cellular processes. It functions as an antioxidant, neutralizing reactive oxygen species (ROS) and alleviating oxidative stress.[29,30] In a vitamin D-deficient state, oxidative stress may increase, potentially triggering compensatory activation of purine metabolism, which can result in higher uric acid production.[9,17] Furthermore, vitamin D deficiency is associated with elevated parathyroid hormone (PTH) levels, which may cause kidneys to prioritize calcium-phosphate balance over uric acid excretion.[31,32] Elevated PTH levels can affect uric acid homeostasis by increasing renal uric acid reabsorption.[33,34] Conversely, sufficient vitamin D levels can reduce PTH, which may promote uric acid excretion pathways mediated by transporters such as ABCG2 and GLUT9 (glucose transporter type 9) while potentially modulating uric acid reabsorption.[35,36] Therefore, in vitamin D-insufficient individuals, increased vitamin D levels may initiate a compensatory metabolic response, potentially promoting continued accumulation of uric acid rather than promoting uric acid clearance. Additionally, elevated parathyroid hormone (PTH) levels may further impair renal uric acid excretion, further exacerbating these effects. These findings suggest that vitamin D plays a role in uric acid metabolism, with its effects varying depending on insufficiency and sufficiency states.[16,22] Our study’s strength lies in elucidating the non-linear association between vitamin D and uric acid metabolism, providing new insights into this complex relationship. Furthermore, the use of standardized LC-MS/MS data and a large, nationally representative cohort enhanced the robustness and generalizability of our findings.
Despite its strengths, this study has several limitations. First, the cross-sectional design precludes causal inferences, making it unclear whether vitamin D could directly influence uric acid levels or if the relationship is bidirectional. Second, residual confounding cannot be ruled out despite adjustments for multiple factors, as unmeasured variables such as physical activity, dietary purine intake, or genetic polymorphisms might have influenced our results. Third, vitamin D levels were measured at a single time point, which might reflect seasonal variations rather than long-term status.[37] Lastly, while non-linear patterns were identified, the underlying biological mechanisms remain speculative and require further exploration. Therefore, future research should focus on elucidating the molecular mechanisms underlying the relationship between vitamin D and uric acid. This includes investigating roles of vitamin D receptors (VDR), urate transporters, inflammatory cytokines, and oxidative stress pathways. Additionally, longitudinal studies with repeated measurements of vitamin D and uric acid levels are essential for understanding their interactions and temporal dynamics. Randomized controlled trials (RCTs) are indispensable for evaluating effects of vitamin D supplementation on uric acid levels and metabolic outcomes. These studies will help us validate current findings and provide clearer insights into the role of vitamin D as a biomarker.

5. Conclusions

This study revealed a non-linear relationship between serum vitamin D level and uric acid concentration, highlighting differing metabolic effects in states of vitamin D insufficiency (< 30 ng/mL) compared to sufficiency (≥ 30 ng/mL). By utilizing standardized LC-MS/MS data, this research provides a clearer understanding of the intricate interplay between vitamin D and uric acid metabolism.

Author Contributions

Conceptualization, N.S.J.; Methodology, H.R.L.; Software, H.R.L.; Validation, H.R.L. and N.S.J.; Formal analysis, H.R.L.; Investigation, H.R.L.; Resources, H.R.L.; Data curation, H.R.L.; Writing—original draft preparation, H.R.L.; Writing—review and editing, N.S.J.; Visualization, H.R.L.; Supervision, N.S.J.; Project administration, N.S.J. All authors have read and agreed to the published version of the manuscript.

Funding

This research received no external funding

Institutional Review Board Statement

This study adhered to the principles of the Declaration of Helsinki. Ethical review and approval were waived because the KNHANES datasets are publicly available, anonymized, and de-identified. As a result, this secondary analysis was exempt from Institutional Review Board approval (IRB Approval Number: AJOUIRB-EX-2024-629).

Informed Consent Statement

Informed consent was obtained from all subjects involved in the original KNHANES survey. Since this study utilized publicly available, anonymized, and de-identified data, additional informed consent was not required.

Data Availability Statement

The data presented in this study are available from the Korea National Health and Nutrition Examination Survey (KNHANES) database at https://knhanes.kdca.go.kr. Access to the data requires approval from the Korea Disease Control and Prevention Agency (KDCA).

Conflicts of Interest

The authors have no conflicts of interest to disclose.

Abbreviations

The following abbreviations are used in this manuscript:

References

  1. Huang, G.; Xu, J.; Zhang, T.; Cai, L.; Liu, H.; Yu, X.; Wu, J. Hyperuricemia is associated with metabolic syndrome in the community very elderly in Chengdu. Sci Rep 2020, 10, 8678. [Google Scholar] [CrossRef]
  2. Yu, W.; Xie, D.; Yamamoto, T.; Koyama, H.; Cheng, J. Mechanistic insights of soluble uric acid-induced insulin resistance: Insulin signaling and beyond. Rev Endocr Metab Disord 2023, 24, 327–343. [Google Scholar] [CrossRef] [PubMed]
  3. Deng, Y.; Liu, F.; Yang, X.; Xia, Y. The Key Role of Uric Acid in Oxidative Stress, Inflammation, Fibrosis, Apoptosis, and Immunity in the Pathogenesis of Atrial Fibrillation. Front Cardiovasc Med 2021, 8, 641136. [Google Scholar] [CrossRef]
  4. Zheng, J.S.; Luan, J.; Sofianopoulou, E.; Sharp, S.J.; Day, F.R.; Imamura, F.; Gundersen, T.E.; Lotta, L.A.; Sluijs, I.; Stewart, I.D.; et al. The association between circulating 25-hydroxyvitamin D metabolites and type 2 diabetes in European populations: A meta-analysis and Mendelian randomisation analysis. PLoS Med 2020, 17, e1003394. [Google Scholar] [CrossRef]
  5. Szabo, T.M.; Nagy, E.E.; Kirchmaier, A.; Heidenhoffer, E.; Gabor-Kelemen, H.L.; Frasineanu, M.; Cseke, J.; German-Sallo, M.; Frigy, A. Total 25-Hydroxyvitamin D Is an Independent Marker of Left Ventricular Ejection Fraction in Heart Failure with Reduced and Mildly Reduced Ejection Fraction. Biomolecules 2023, 13. [Google Scholar] [CrossRef] [PubMed]
  6. Fenercioglu, A.K. The Anti-Inflammatory Roles of Vitamin D for Improving Human Health. Curr Issues Mol Biol 2024, 46, 13514–13525. [Google Scholar] [CrossRef] [PubMed]
  7. Fayed, A.; El Nokeety, M.M.; Heikal, A.A.; Sadek, K.M.; Hammad, H.; Abdulazim, D.O.; Salem, M.M.; Sharaf El Din, U.A.; Vascular Calcification, G. Urine albumin and serum uric acid are important determinants of serum 25 hydroxyvitamin D level in pre-dialysis chronic kidney disease patients. Ren Fail 2019, 41, 540–546. [Google Scholar] [CrossRef]
  8. Adi, M.; Ghanbari, F.; Downie, M.L.; Hung, A.; Robinson-Cohen, C.; Manousaki, D. Effects of 25-Hydroxyvitamin D Levels on Renal Function: A Bidirectional Mendelian Randomization Study. J Clin Endocrinol Metab 2023, 108, 1442–1451. [Google Scholar] [CrossRef]
  9. Wimalawansa, S.J. Vitamin D Deficiency: Effects on Oxidative Stress, Epigenetics, Gene Regulation, and Aging. Biology (Basel) 2019, 8. [Google Scholar] [CrossRef]
  10. Chen, W.; Roncal-Jimenez, C.; Lanaspa, M.; Gerard, S.; Chonchol, M.; Johnson, R.J.; Jalal, D. Uric acid suppresses 1 alpha hydroxylase in vitro and in vivo. Metabolism 2014, 63, 150–160. [Google Scholar] [CrossRef]
  11. Braga, T.T.; Forni, M.F.; Correa-Costa, M.; Ramos, R.N.; Barbuto, J.A.; Branco, P.; Castoldi, A.; Hiyane, M.I.; Davanso, M.R.; Latz, E.; et al. Soluble Uric Acid Activates the NLRP3 Inflammasome. Sci Rep 2017, 7, 39884. [Google Scholar] [CrossRef]
  12. Zhang, Y.Y.; Qiu, H.B.; Tian, J.W. Association Between Vitamin D and Hyperuricemia Among Adults in the United States. Front Nutr 2020, 7, 592777. [Google Scholar] [CrossRef]
  13. Ma, Z.; Xiong, T.; Li, Y.; Kong, B.; Lu, W.; Zhang, Z.; Chen, L.; Tang, Y.; Yao, P.; Xiong, J.; et al. The Inverted U-Shaped Association between Serum Vitamin D and Serum Uric Acid Status in Children and Adolescents: A Large Cross-Sectional and Longitudinal Analysis. Nutrients 2024, 16. [Google Scholar] [CrossRef] [PubMed]
  14. Chen, Y.; Cheng, J.; Chen, Y.; Wang, N.; Xia, F.; Chen, C.; Han, B.; Lu, Y. Association between serum vitamin D and uric acid in the eastern Chinese population: a population-based cross-sectional study. BMC Endocr Disord 2020, 20, 79. [Google Scholar] [CrossRef] [PubMed]
  15. Han, Y.; Han, K.; Zhang, Y.; Zeng, X. Serum 25-hydroxyvitamin D might be negatively associated with hyperuricemia in U.S. adults: an analysis of the National Health and Nutrition Examination Survey 2007-2014. J Endocrinol Invest 2022, 45, 719–729. [Google Scholar] [CrossRef] [PubMed]
  16. Isnuwardana, R.; Bijukchhe, S.; Thadanipon, K.; Ingsathit, A.; Thakkinstian, A. Association Between Vitamin D and Uric Acid in Adults: A Systematic Review and Meta-Analysis. Horm Metab Res 2020, 52, 732–741. [Google Scholar] [CrossRef]
  17. Charoenngam, N.; Ponvilawan, B.; Ungprasert, P. Vitamin D insufficiency and deficiency are associated with a higher level of serum uric acid: A systematic review and meta-analysis. Mod Rheumatol 2020, 30, 385–390. [Google Scholar] [CrossRef]
  18. IK., J. IK., J. Prevalence of vitamin D deficiency in Korea: Results from KNHANES 2010 to 2011. J Nutr Health. 46.
  19. Park, H.Y.; Lim, Y.H.; Park, J.B.; Rhie, J.; Lee, S.J. Environmental and Occupation Factors Associated with Vitamin D Deficiency in Korean Adults: The Korea National Health and Nutrition Examination Survey (KNHANES) 2010-2014. Int J Environ Res Public Health 2020, 17. [Google Scholar] [CrossRef]
  20. Park, J.H.; Hong, I.Y.; Chung, J.W.; Choi, H.S. Vitamin D status in South Korean population: Seven-year trend from the KNHANES. Medicine (Baltimore) 2018, 97, e11032. [Google Scholar] [CrossRef]
  21. Li, S.T.; Wang, Y.L.; Ni, F.H.; Sun, T. Association between 25 hydroxyvitamin D and serum uric acid level in the Chinese general population: a cross-sectional study. BMC Endocr Disord 2024, 24, 187. [Google Scholar] [CrossRef]
  22. Nimitphong, H.; Saetung, S.; Chailurkit, L.O.; Chanprasertyothin, S.; Ongphiphadhanakul, B. Vitamin D supplementation is associated with serum uric acid concentration in patients with prediabetes and hyperuricemia. J Clin Transl Endocrinol 2021, 24, 100255. [Google Scholar] [CrossRef] [PubMed]
  23. Koivula, M.K.; Matinlassi, N.; Laitinen, P.; Risteli, J. Four automated 25-OH total vitamin D immunoassays and commercial liquid chromatography tandem-mass spectrometry in Finnish population. Clin Lab 2013, 59, 397–405. [Google Scholar] [CrossRef] [PubMed]
  24. Saedmocheshi, S.; Amiri, E.; Mehdipour, A.; Stefani, G.P. The Effect of Vitamin D Consumption on Pro-Inflammatory Cytokines in Athletes: A Systematic Review of Randomized Controlled Trials. Sports (Basel) 2024, 12. [Google Scholar] [CrossRef] [PubMed]
  25. Karampela, I.; Stratigou, T.; Antonakos, G.; Kounatidis, D.; Vallianou, N.G.; Tsilingiris, D.; Dalamaga, M. 25-hydroxyvitamin D and parathyroid hormone in new onset sepsis: A prospective study in critically ill patients. Metabol Open 2024, 23, 100296. [Google Scholar] [CrossRef]
  26. Cojic, M.; Kocic, R.; Klisic, A.; Cvejanov-Kezunovic, L.; Kavaric, N.; Kocic, G. A novel mechanism of vitamin D anti-inflammatory/antioxidative potential in type 2 diabetic patients on metformin therapy. Arch Med Sci 2020, 16, 1004–1012. [Google Scholar] [CrossRef]
  27. Takada, T.; Miyata, H.; Toyoda, Y.; Nakayama, A.; Ichida, K.; Matsuo, H. Regulation of Urate Homeostasis by Membrane Transporters. Gout, Urate, and Crystal Deposition Disease 2024, 2, 206–219. [Google Scholar] [CrossRef]
  28. Enomoto, A.; Kimura, H.; Chairoungdua, A.; Shigeta, Y.; Jutabha, P.; Cha, S.H.; Hosoyamada, M.; Takeda, M.; Sekine, T.; Igarashi, T.; et al. Molecular identification of a renal urate anion exchanger that regulates blood urate levels. Nature 2002, 417, 447–452. [Google Scholar] [CrossRef]
  29. Khichar, S.; Choudhary, S.; Singh, V.B.; Tater, P.; Arvinda, R.V.; Ujjawal, V. Serum uric acid level as a determinant of the metabolic syndrome: A case control study. Diabetes Metab Syndr 2017, 11, 19–23. [Google Scholar] [CrossRef]
  30. Sautin, Y.Y.; Johnson, R.J. Uric acid: the oxidant-antioxidant paradox. Nucleosides Nucleotides Nucleic Acids 2008, 27, 608–619. [Google Scholar] [CrossRef]
  31. Thimachai, P.; Supasyndh, O.; Chaiprasert, A.; Satirapoj, B. Efficacy of High vs. Conventional Ergocalciferol Dose for Increasing 25-Hydroxyvitamin D and Suppressing Parathyroid Hormone Levels in Stage III-IV CKD with Vitamin D Deficiency/Insufficiency: A Randomized Controlled Trial. J Med Assoc Thai 2015, 98, 643–648. [Google Scholar]
  32. Dhillon-Jhattu, S.; McGill, R.L.; Ennis, J.L.; Worcester, E.M.; Zisman, A.L.; Coe, F.L. Vitamin D and Parathyroid Hormone Levels in CKD. Am J Kidney Dis 2023, 81, 122–124. [Google Scholar] [CrossRef] [PubMed]
  33. Hui, J.Y.; Choi, J.W.; Mount, D.B.; Zhu, Y.; Zhang, Y.; Choi, H.K. The independent association between parathyroid hormone levels and hyperuricemia: a national population study. Arthritis Res Ther 2012, 14, R56. [Google Scholar] [CrossRef] [PubMed]
  34. Chin, K.Y.; Nirwana, S.I.; Ngah, W.Z. Significant association between parathyroid hormone and uric acid level in men. Clin Interv Aging 2015, 10, 1377–1380. [Google Scholar] [CrossRef] [PubMed]
  35. Sugimoto, R.; Watanabe, H.; Ikegami, K.; Enoki, Y.; Imafuku, T.; Sakaguchi, Y.; Murata, M.; Nishida, K.; Miyamura, S.; Ishima, Y.; et al. Down-regulation of ABCG2, a urate exporter, by parathyroid hormone enhances urate accumulation in secondary hyperparathyroidism. Kidney Int 2017, 91, 658–670. [Google Scholar] [CrossRef]
  36. Cachau, R.; Shahsavari, S.; Cho, S.K. The in-silico evaluation of important GLUT9 residue for uric acid transport based on renal hypouricemia type 2. Chem Biol Interact 2023, 373, 110378. [Google Scholar] [CrossRef]
  37. Sreenivasulu, K.; Banerjee, M.; Tomo, S.; Shukla, K.; Selvi, M.K.; Garg, M.K.; Banerjee, S.; Sharma, P.; Shukla, R. Seasonal variation and Vitamin-D status in ostensibly healthy Indian population: An experience from a tertiary care institute. Metabol Open 2024, 23, 100298. [Google Scholar] [CrossRef]
Figure 1. Flowchart of participant selection. This figure outlines the selection process for study participants from the 9th KNHANES (2022–2023), starting with 13,194 individuals. After excluding those with missing data (serum uric acid or 25(OH)D levels), 11,743 participants remained. Applying the age criterion (19–80 years) further reduced the sample to 10,864 participants, who were included in the final analysis.
Preprints 149238 g001
Figure 2. Weighted scatter plot with regression line for serum 25(OH)D vs. serum uric acid. The red line represents the linear regression model, accounting for sampling bias with applied weights. Pearson’s correlation coefficient (PCC) was -0.089 (p-value < 0.001). Data points are scaled according to sampling weights.
Preprints 149238 g002
Figure 3. Spline regression analysis of serum 25(OH)D and serum uric acid with confidence intervals. The curve represents the restricted cubic spline regression model, with shaded areas indicating 95% confidence intervals. Red vertical lines divide quartiles (Q1: < 15.96 ng/mL, Q2: 15.96–23.21 ng/mL, Q3: 23.21–30.94 ng/mL, Q4: > 30.94 ng/mL) of serum 25(OH)D concentrations. This figure provides a visual representation of the results presented in Table 3.
Preprints 149238 g003
Table 1. Baseline characteristics of participants by the quartile of serum †25(OH)D.
Variable Total
(N= 10,864)
Quartiles of serum †25(OH)D levels (ng/ml) P. value
Q1 (N=2,718)
(2.82–15.96)
Q2 (N=2,715)
(15.96–23.21)
Q3(N=2,716)
(23.21–30.94)
Q4(N=2,715)
(30.94 -128.46)
Age (years) 53.56 ± 16.88 46.44 ± 0.34a 51.61 ± 0.32b 55.75 ± 0.3c 60.47 ± 0.27d <0.001
Male (n,%) * 4736 (43.59%) 1255 (46.17%) 1332 (49.06%) 1265 (46.58%) 884 (32.56%) <0.001
BMI (kg/m2) 24.07 ± 3.72 24.32 ± 0.08a 24.35 ± 0.07 24.1 ± 0.07 b 23.5 ± 0.06b <0.001
WC (cm) 84.04 ± 10.8 84.13 ± 0.23a 84.81 ± 0.21 84.39 ± 0.19 82.85 ± 0.19b <0.001
SBP (mmHg) 119.6 ± 16.04 118.4 ± 0.31a 119.39 ± 0.31a 120.09 ± 0.3 120.52 ± 0.31b <0.001
DBP (mmHg) 73.95 ± 9.59 73.8 ± 0.19 74.26 ± 0.19 74.13 ± 0.18 73.6 ± 0.18 0.048
Hypertension status (n,%) * 2927 (26.94%) 531 (19.54%) 672 (24.75%) 784 (28.88%) 940 (34.62%) <0.001
Dyslipidemia status (n,%) * 2518 (23.18%) 431 (15.86%) 540 (19.89%) 641 (23.61%) 906 (33.37%) <0.001
Diabetes status (n,%) * 1278 (11.76%) 261 (9.6%) 307 (11.31%) 303 (11.16%) 407 (14.99%) <0.001
≥1drink/month
(n,%) *
5466 (51.01%) 1511 (56.38%) 1465 (54.5%) 1398 (52.3%) 1092 (40.82%) <0.001
Glucose (mg/dL) 101.21 ± 23.09 101.04 ± 0.49 101.53 ± 0.47 101.55 ± 0.43 100.73 ± 0.38 0.492
HbA1c (%) 5.63 ± 0.79 5.56 ± 0.02a 5.64 ± 0.02a 5.63 ± 0.01 5.69 ± 0.01b <0.001
T. chol (mg/dL) 186.38 ± 40.46 186.31 ± 0.76 187.31 ± 0.76 186.71 ± 0.78 185.18 ± 0.81 0.262
HDL-c (mg/dL) 57.21 ± 15.49 56.11 ± 0.3a 56 ± 0.29 56.84 ± 0.29a 59.9 ± 0.31b <0.001
Triglycerides (mg/dL) 126.76 ± 96.14 131.99 ± 1.99 a 130.52 ± 1.82a 126.85 ± 2.05 117.68 ± 1.46b <0.001
LDL-c (mg/dL) 113 ± 36.79 113.36 ± 0.69a 114.76 ± 0.7a 113.63 ± 0.71 110.24 ± 0.72b <0.001
Creatinine (mg/dL) 0.8 ± 0.24 0.79 ± 0 a 0.81 ± 0.01b 0.8 ± 0 0.79 ± 0 0.002
Uric acid (mg/dL) 4.98 ± 1.4 5.04 ± 0.03a 5.13 ± 0.03 a 4.98 ± 0.03 4.79 ± 0.03b <0.001
Hs-CRP (mg/L) 1.5 ± 4.61 1.47 ± 0.08 1.46 ± 0.08 1.49 ± 0.08 1.55 ± 0.11 0.916
Carbohydrate
Intake (g/day)
255.96 ± 108 254.86 ± 2.16a 260.75 ± 2.07b 259.41 ± 2.04 248.92 ± 2.01a <0.001
Fat intake (g/day) 46.8 ± 33.31 48.51 ± 0.67a 48.59 ± 0.68a 46.81 ± 0.63a 43.33 ± 0.58b <0.001
Protein intake (g/day) 67.39 ± 34.55 67.03 ± 0.67a 69.34 ± 0.71b 68.6 ± 0.65 64.64 ± 0.62a <0.001
†25(OH)D 24.46 ± 11.35 11.8 ± 0.05 19.58 ± 0.04 26.88 ± 0.04 39.58 ± 0.17 <0.001
25(OH)D2 0.3 ± 0.68 0.26 ± 0.01 0.35 ± 0.01 0.31 ± 0.01 0.27 ± 0.02 <0.001
25(OH)D3 24.16 ± 11.38 11.54 ± 0.05 19.24 ± 0.04 26.57 ± 0.04 39.32 ± 0.17 <0.001
† 25(OH)D concentrations were calculated as the sum of serum 25(OH)D2 and 25(OH)D3 values. Data are presented as means ± standard deviations or as the number of subjects (percentage). * Categorical variables were analyzed using the Chi-square test, while continuous variables were analyzed using ANOVA to calculate p-values. abcd Different superscript letters denote significant differences between groups (Bonferroni-adjusted p < 0.05).
Table 2. Multiple regression analysis of serum †25(OH)D and serum uric acid levels.
Model Adjusted variables Beta coefficient P-value R-squared
Model1 Age; Sex 0.0017 0.127 0.281
Model2 Age; Sex; BMI 0.0051 < 0.001 0.338
Model3 Age; Sex; BMI; Alcohol Use; Cr; Chronic Disease (HTN, DM); Nutritional Intake (Carbohydrate, Fat, Protein); Lipid Levels (HDL-c, TG, LDL-c) 0.0042 < 0.001 0.390
† 25(OH)D concentrations were calculated as the sum of serum 25(OH)D2 and 25(OH)D3 values. All analyses were conducted using sampling weights to ensure representativeness of the study population.
Table 3. Nonlinear regression results for serum †25(OH)D quartiles.
Quartile Range (ng/ml) Coefficient Standard Error P-value
Q1 (1st quartile) <15.96 0.201 0.078 0.010
Q2 (2nd quartile) 15.96–23.21 0.377 0.125 0.003
Q3 (3rd quartile) 23.21–30.94 0.643 0.283 0.023
Q4 (4th quartile) >30.94 0.186 0.512 0.716
† 25(OH)D concentrations were calculated as the sum of serum 25(OH)D2 and 25(OH)D3 values. All analyses were conducted using sampling weights to ensure representativeness of the study population. Adjusted variables included age, sex, BMI, alcohol use (monthly), creatinine (Cr), chronic disease (hypertension, diabetes), nutritional intake (carbohydrate, fat, protein), and lipid levels (HDL-c, TG, LDL-c).
Table 4. Nonlinear regression results for serum 25(OH)D3 quartiles.
Quartile Range (ng/ml) Coefficient Standard Error P-value
Q1 (1st quartile) < 15.62 0.182 0.076 0.017
Q2 (2nd quartile) 15.62–22.88 0.361 0.125 0.004
Q3 (3rd quartile) 22.88–30.62 0.598 0.280 0.033
Q4 (4th quartile) > 30.62 0.203 0.511 0.691
Disclaimer/Publisher’s Note: The statements, opinions and data contained in all publications are solely those of the individual author(s) and contributor(s) and not of MDPI and/or the editor(s). MDPI and/or the editor(s) disclaim responsibility for any injury to people or property resulting from any ideas, methods, instructions or products referred to in the content.
Copyright: This open access article is published under a Creative Commons CC BY 4.0 license, which permit the free download, distribution, and reuse, provided that the author and preprint are cited in any reuse.
Prerpints.org logo

Preprints.org is a free preprint server supported by MDPI in Basel, Switzerland.

Subscribe

Disclaimer

Terms of Use

Privacy Policy

Privacy Settings

© 2026 MDPI (Basel, Switzerland) unless otherwise stated