1. Introduction
Nowadays, many serious health problems negatively affect people’s quality of life. One of these problems is stroke, which results in a person losing their ability to move and becoming bedridden. Although individuals with this condition have normal brain activity, they are confined to bed due to neurological disorders and have difficulty meeting their daily needs. Brain-computer interface (BCI) systems have been developed to assist these individuals in fulfilling their basic daily needs. BCI systems are designed to produce meaningful outputs by measuring the potential differences in the human brain. Neurons located on the human brain’s surface constantly interact with each other. The rhythms resulting from these interactions are grouped according to their frequency values. These groups are known as alpha, beta, theta, delta, and gamma waves.
Table 1 provides the frequency and amplitude values of these waves.
The delta wave, which has a frequency range of 0.5-4 Hz, is the slowest wave with the highest amplitude (
Table 1). This type of wave is seen in infants up to one year old and in adults during deep sleep [
1]. Theta waves, ranging from 4-7 Hz, are observed during light sleep and relaxation. Alpha waves, appearing in the 7-12 Hz range, are associated with eye closure and relaxation. Beta waves, observed in the 12-30 Hz range, dominate during states of alertness and anxiety. These waves are also elevated in individuals solving mathematical problems [
2]. Gamma waves, with frequencies above 30 Hz, have the lowest amplitude and play a crucial role in detecting neurological diseases. They relate to perception, recognition, and similar cognitive functions [
3]. These waves, categorized by their frequency values, are frequently used in BCI systems.
BCI systems typically use Electroencephalography (EEG), a non-invasive method that works a person’s brain signals without requiring surgical intervention. In this method, the signals measured from the individual’s brain activity are processed and taught to machines. Associating the output obtained from signal processing with a command allows for controlling electronic devices such as electric wheelchairs, beds, and lamps [
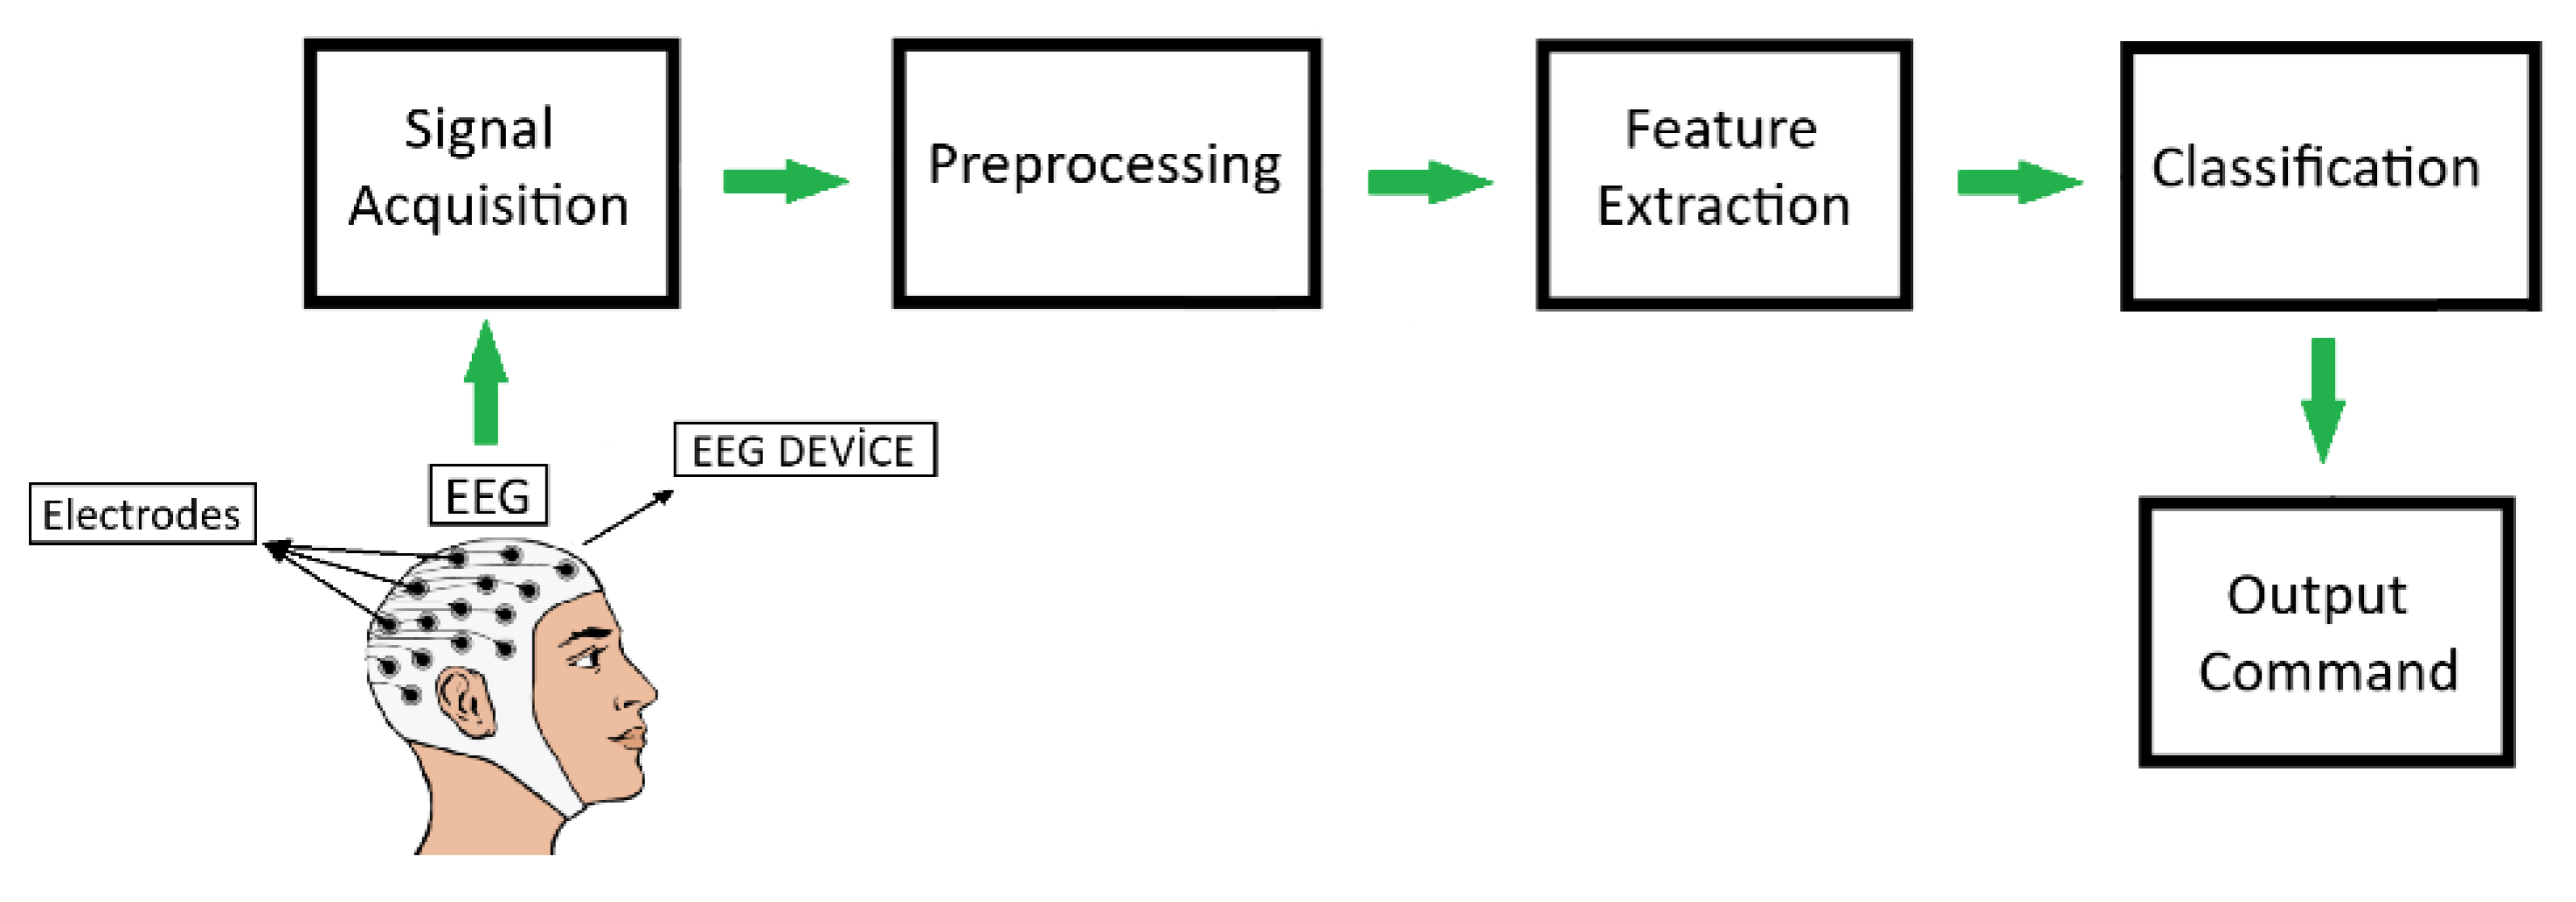
4]. This function enables individuals with paralysis to interact with their environment and meet their needs. The basic scheme used in BCI systems is depicted in
Figure 1.
As shown in
Figure 1, BCI systems are fundamentally composed of four groups. These groups are signal acquisition, preprocessing, feature extraction, and classification stages. In the signal acquisition stage, brain signals are recorded using EEG devices. During the preprocessing stage, operations such as trimming, filtering, and normalization are applied to the recorded data. Feature extraction methods are applied to the filtered data. The customized data are then classified in the classification stage, the final step of signal processing, using different learning algorithms. Then, an output command is generated based on the values obtained from classification.
In EEG-based BCI systems, methods such as Visual Evoked Potential (VEP) [
5], Motor Imagery (MI) [
6] and P300 [
7] are frequently used during the signal acquisition phase. In the VEP method, visual stimuli such as flashing lights or images at different frequency values are presented to the subject, and the resulting voltage changes in the brain are recorded. In the VEP method, when the frequency value exceeds 6 Hz, a state known as Steady-State Visual Evoked Potential (SSVEP) occurs. The P300 method involves a positive deflection in brain waves in response to certain stimuli such as lights, sounds, or various visual cues. P300 waves exhibit a positive deflection within a 300 ms to 600 ms time window and are recorded using EEG devices. In the MI method, the physical movements of the individual are replaced by imagined mental movements. When a person imagines any physical movement, specific patterns emerge in the brain, which are recorded using EEG devices. The recorded EEG signals from all these methods are processed using signal-processing techniques in a computer environment. Output is generated through classification based on the detected value from signal processing.
The primary goal of developing EEG-based BCI systems is to benefit individuals who have lost their ability to move. However, while these systems offer advantages, they also have some disadvantages. These issues can be listed as follows:
- ➢
Research and testing of the systems are only conducted in laboratory environments;
- ➢
The comfort of these systems, which users must rely on for life, is insufficient;
- ➢
The systems operate slowly;
- ➢
They are generally high-cost, which limits their accessibility to a broader audience;
- ➢
The systems are not particularly suited for long-term use by the user [
8].
In addition to these disadvantages, EEG devices are relatively cost-effective compared to recording techniques such as Magnetoencephalography (MEG) and Functional Magnetic Resonance Imaging (fMRI). However, they remain prohibitively expensive for daily use by individuals with disabilities [
7]. Another problem is that the visual and mental fatigue caused by vibrating stimuli in visual stimulus-based BCI systems hinders users’ adoption of such systems and complicates their usage [
9]. Furthermore, users must continuously focus on visual stimuli for the system to be active. Nevertheless, research has shown that users experience eye problems over time due to prolonged and continuous exposure to visual stimuli [
10]. This serious issue impedes users’ long-term use of these systems and threatens eye health. Additionally, in visual stimulus-based systems, the frequency values of the stimuli create potentials in the brain via the eyes, rendering these systems unsuitable for individuals with preexisting eye health issues.
In this study, a new hybrid system that uses Electrooculography (EOG) artifacts contained in EEG signals and the SSVEP method was developed in order to provide an alternative to the eye health problems caused by the visual stimuli contained in visual stimulus-based BCI systems in system users and to increase the usage time, comfort, usability and safety of the system. The SSVEP method is used more frequently than other common BCI paradigms because it can be more easily detected in EEG signals and does not require the creation of any training set [
11]. Therefore, in the current study, the SSVEP method was preferred to activate the system. Additionally, synchronized operation of BCI systems is a known challenge of these systems [
12].
In EEG signals recorded with an EEG device, EOG artifacts occur as a result of eye movements, mostly in the channels located in the frontal lobe of the brain. Artifacts are unwanted signals that can negatively impact neurological processes. These signals may influence the characteristics of neurological events and may even be mistakenly perceived as control signals in BCI systems [
13]. EOG artifacts are filtered through various methods when they are not intended to affect neurological conditions. However, in studies where eye movements need to be detected [
14], EOG artifacts found in EEG signals can be used as a source. Particular eye movements, including blinks, upward and downward glances, leftward and rightward shifts, as well as eye closures, can be identified, isolated, and categorized using EEG data. These detected movements can subsequently be linked to distinct command outputs for use in a BCI typing system [
15].
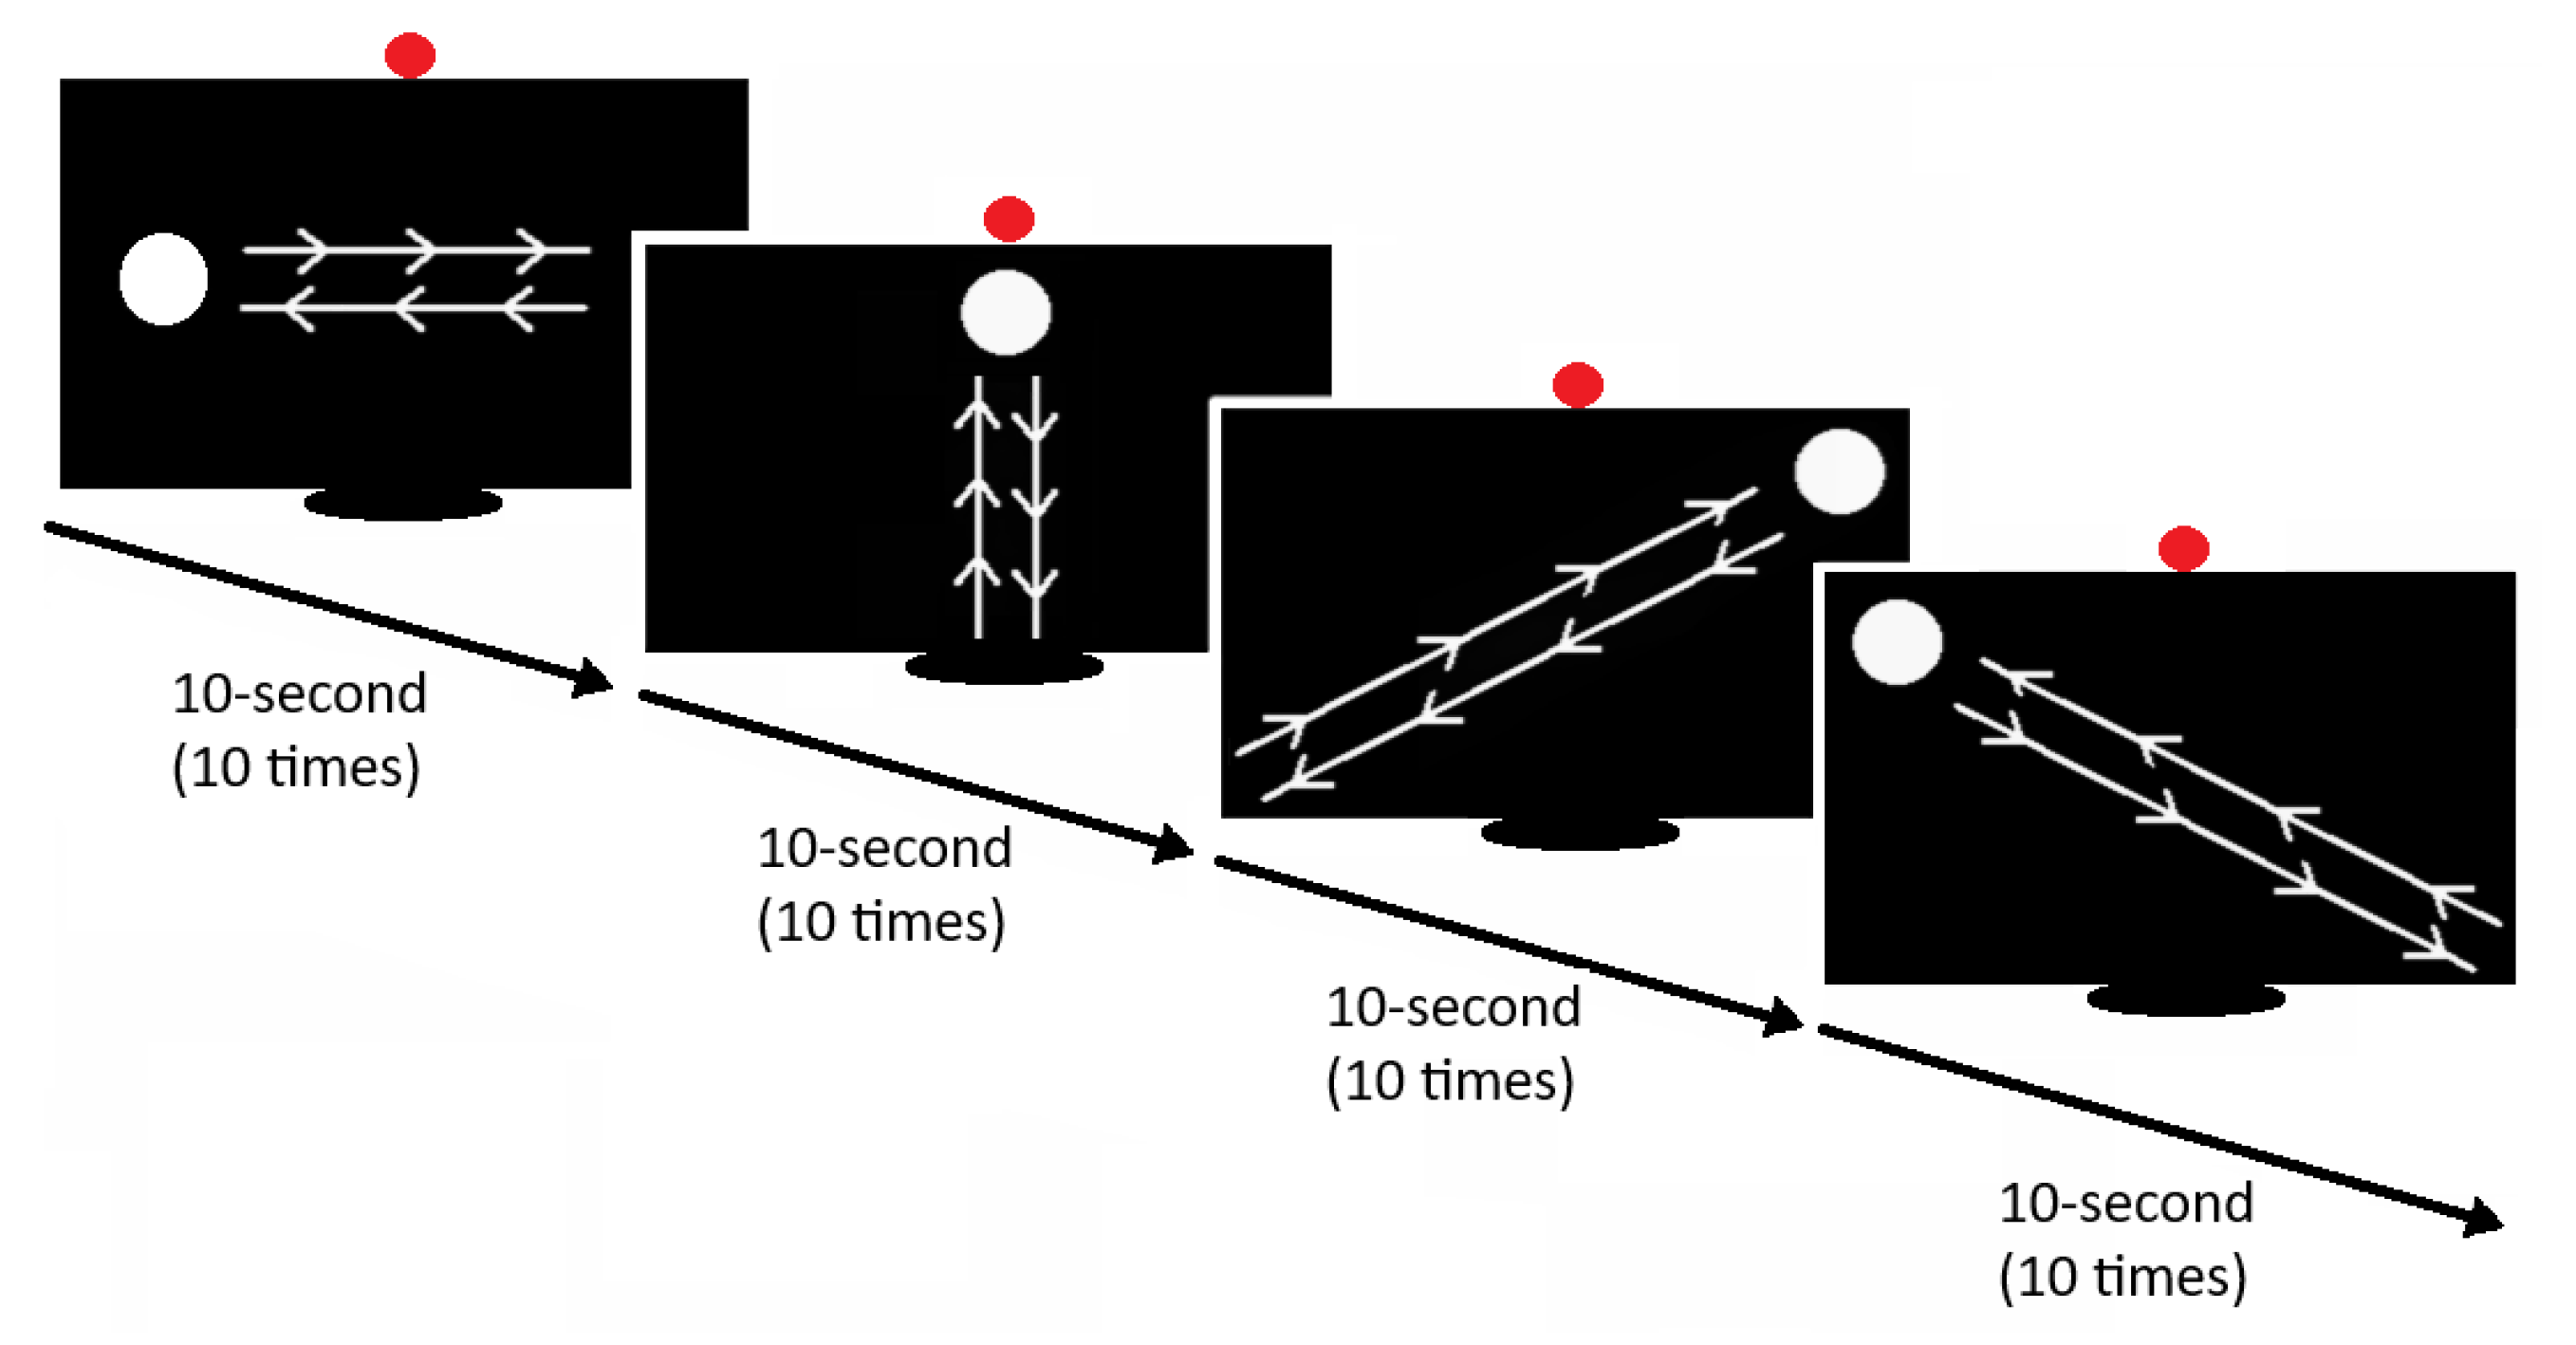
The hybrid system designed in the study proposes an innovative approach of moving objects, each with different routes, instead of the visual stimuli contained in visual stimulus-based BCI systems. In the system, moving balls are shown to the user via a computer screen. The command generated depending on the output assigned to the orbital movement focused by the user is sent as a control signal to peripheral devices (bed, wheelchair, etc.). However, this proposed approach has a drawback. The system user may involuntarily or unconsciously make the same orbital movement with the moving balls without looking at the monitor, and the system may be activated involuntarily. In order to solve this problem, a Light Emitted Diode (LED) with a frequency of 7Hz was placed in the upper middle of the screen as a condition for the system to be active. When the system is wanted to be activated with conscious eye movements, the system checks the presence of the LED at the point of view through the SSVEP method and is not activated in cases where the LED cannot be detected. Thus, it uses the LED as the safety valve of the system. The designed BCI system is shown in
Figure 2.
In the system, the general scheme of which is given in
Figure 2, since the number of LEDs is 1, not much light is emitted. In addition, the system does not require the user to look directly or focus on the visual stimulus. In common SSVEP based BCI systems, candidates are required to focus and look at least 4 flashing lights [
16]. In P300-based systems, it is necessary to look at the light at least two or more times for each command [
17]. However, in the proposed system, the candidate only needs to look in the direction of a flashing visual stimulus without focusing. Thus, the system user can use the system safely through a single visual stimulus, without the feeling of glare in the eye and without being exposed to the disturbing effect of light.
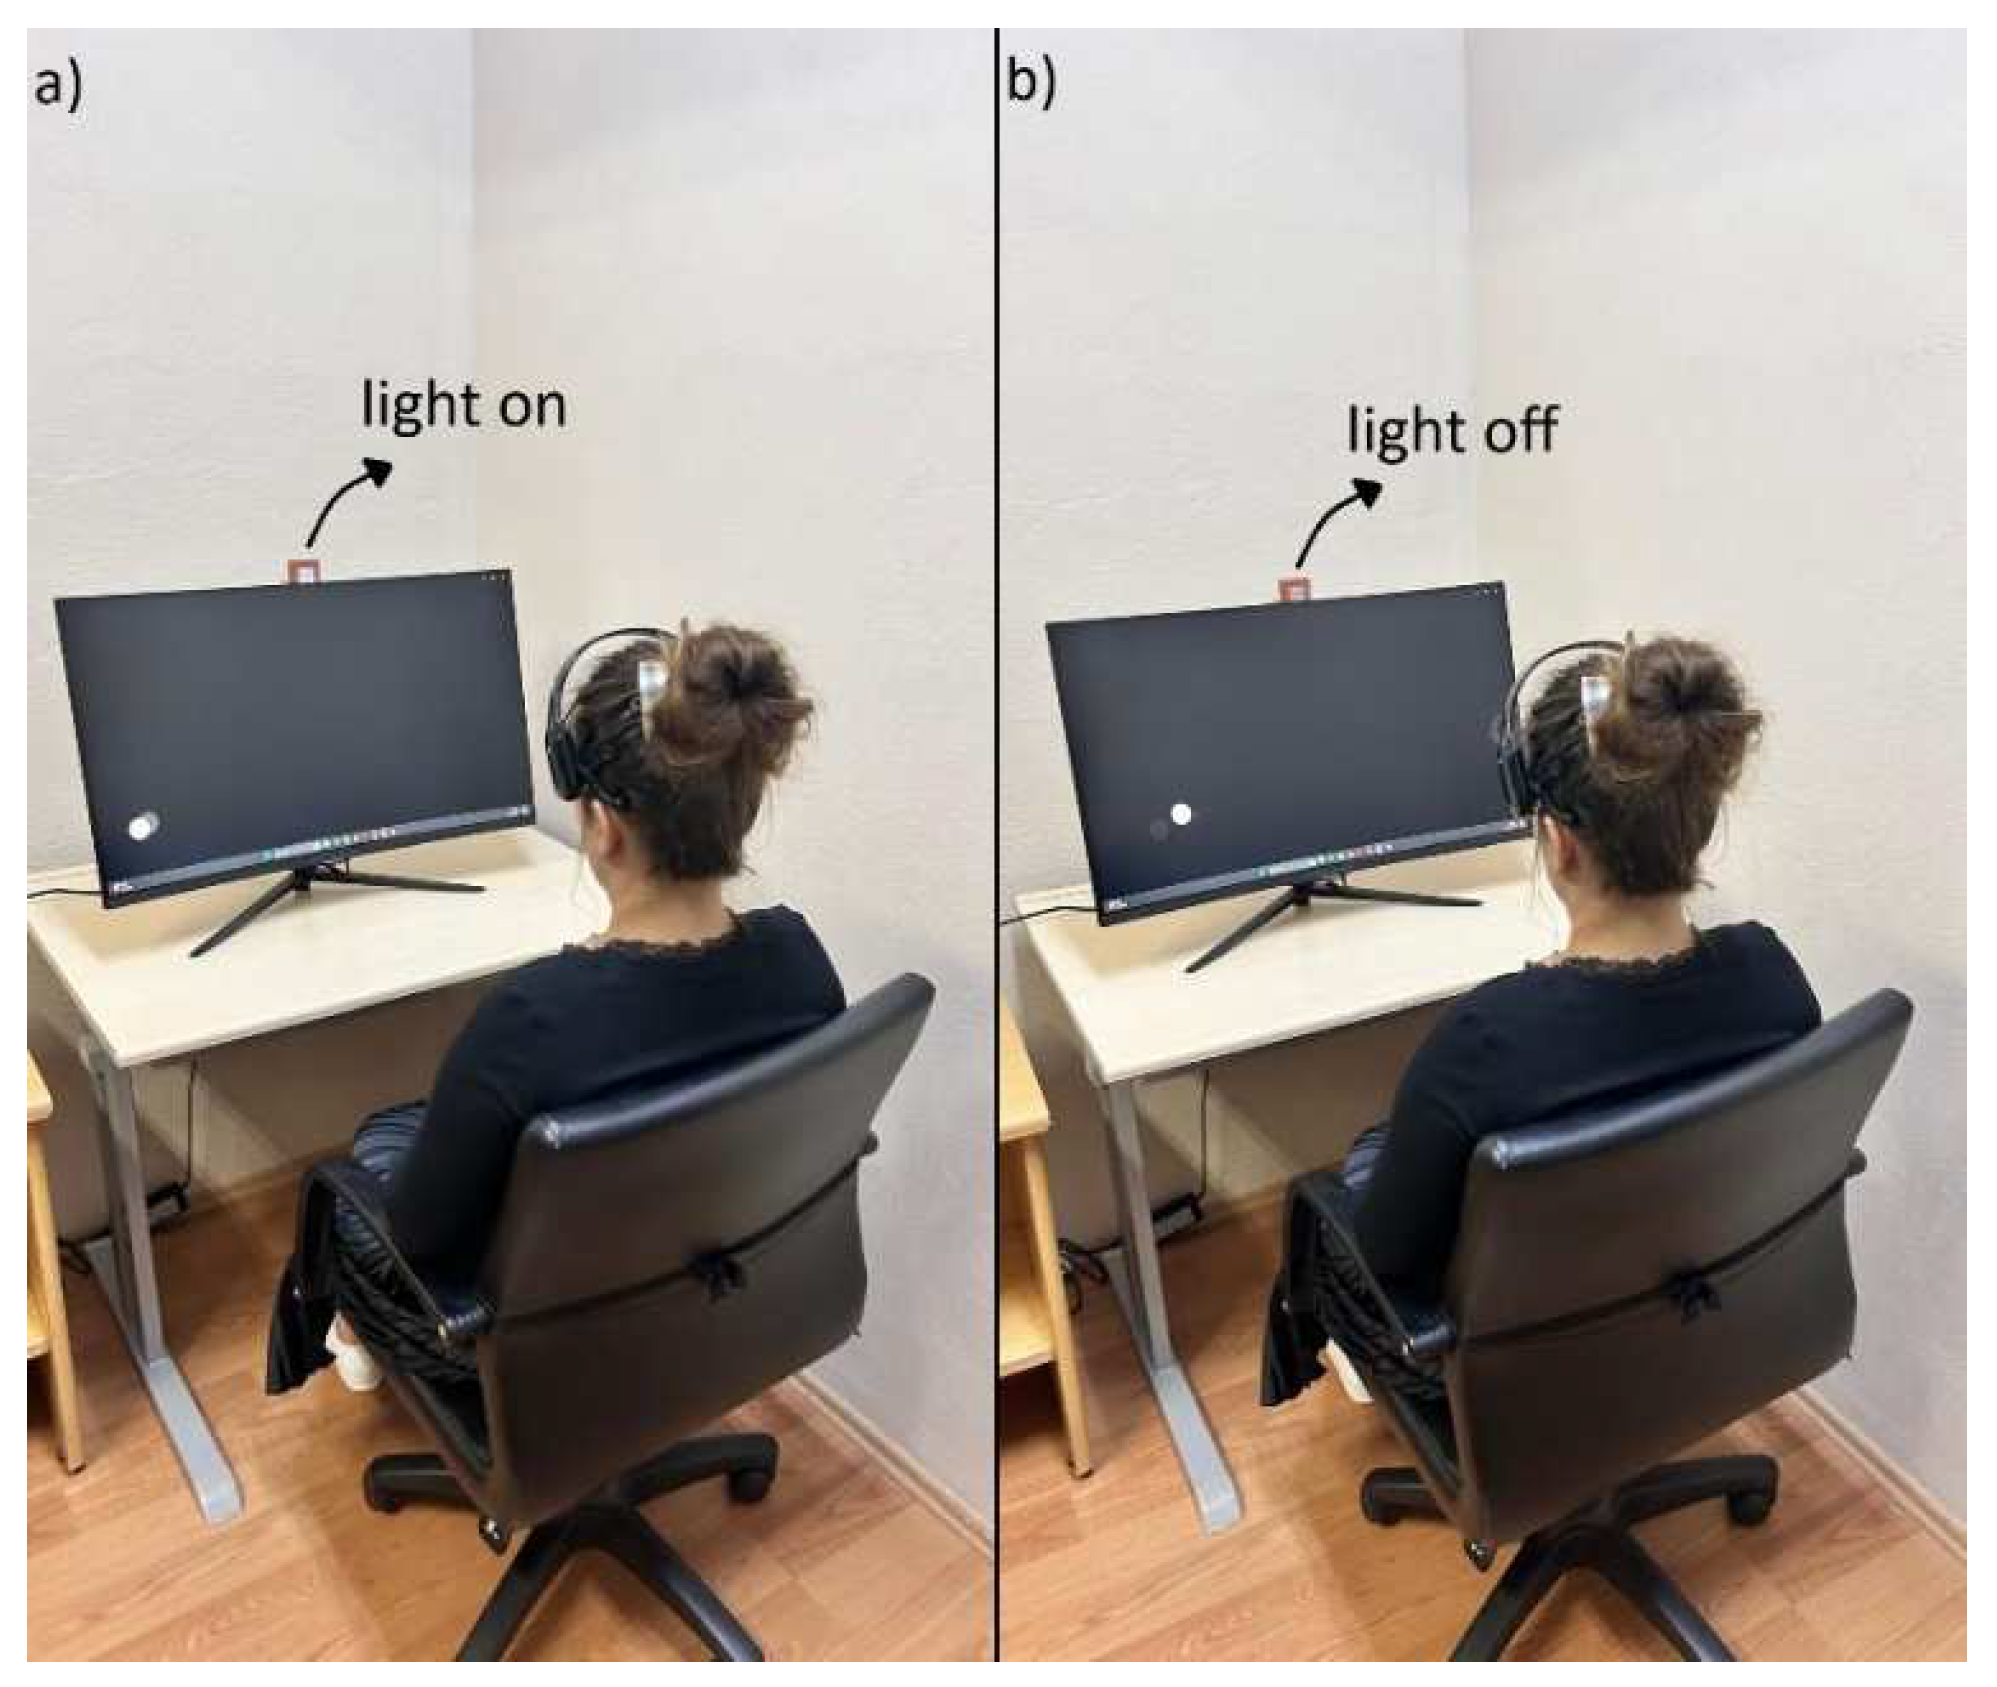
The designed system uses the 14-channel Emotiv EPOC X device, which is cost-effective, portable, wireless, easy to clean and use. Data in the study were recorded at a sampling frequency of 256Hz. The recording process was done in two stages: with the light on (illuminated) and with the light off (non-illuminated). Pre-processing steps such as cutting and filtering were applied to the recorded data, features were extracted and effective channel selection was made. The features extracted using active channels were classified in two stages. In the first classification stage, the data recorded with the light on and off were distinguished from each other using the trapezoidal method using the SSVEP method. In the second classification stage, EEG data containing EOG artifacts detected in the LED active state in the background in the first stage were classified in order to distinguish objects moving up-down, left-right, right-cross and left-cross.
In this study, it is aimed to find solutions to the feeling of glare in the user’s eyes and eye health problems that occur over time, caused by the visual stimuli contained in visual stimulus-based BCI systems. Since these problems directly negatively affect the system usage time, usability and comfort, a more usable, safe and comfortable system design is aimed with the proposed hybrid method and approach. In the study, EOG artifacts contained in EEG data were recorded through moving objects suggested in the approach, while the 7Hz LED, which is the condition for the system to be active, was active and disabled. Active channel selection was made through the recorded signals, and moving objects were classified with machine learning algorithms using EOG artifacts of the detected active channels. The detection of the LED, which acts as a safety valve, was made through the trapezoidal method using the SSVEP method. The proposed study is a hybrid system as it uses EOG artifacts in EEG signals to classify moving objects and uses the SSVEP method to detect the presence of LED by the system. The study proved that the LED placed in the background can be detected without the need for focusing and that moving objects can be classified using the EOG artifacts in the EEG signals through the proposed approach. Thus, a hybrid BCI system that is relatively harmless to visual stimulus-based BCI systems in terms of eye health, relatively more comfortable, suitable for long-term use and safer in terms of control has been proposed.
2. Related Works
One of the important disadvantages of BCI systems is the high cost of the systems [
8]. For this reason, researchers have focused on designing high-performance systems using low-cost EEG devices. The Emotiv EPOC wearable EEG device is frequently preferred by researchers due to its cheap cost, long battery life, short setup time and ease of use [
18].
In the study, SSVEP method was used via 7Hz LED as the condition for the system to be active. SSVEP has a higher signal-to-noise ratio (SNR) value and requires less training than other methods such as P300 and MI [
19]. Since the method does not require any mental effort as in the MI method, it is easier to apply and less tiring [
20]. In addition, studies have shown that the method gives relatively higher accuracy and ITR rates compared to other methods [
21]. Also, can be more easily detected in EEG signals [
11]. Considering the stated advantages, the SSVEP method was preferred in the study since the negative impact of the flashing light on the user is minimized through the proposed approach.
In this section, a literature review was conducted on hybrid BCI systems in which SSVEP and EOG signals are used together and visual stimulus-based BCI systems using the Emotiv EPOC EEG device.
In a study, researchers [
22] proposed a hybrid BCI system by combining the SSVEP method and EOG signals. In the study, researchers obtained the prior probability distribution of the target with the SSVEP method in order to reduce the transition time between tasks of the SSVEP-based system. They obtained target prediction output by using EOG signals to optimize the probability distribution. In another study [
14] where EOG signals and SSVEP signals were used together, researchers controlled a robotic arm with six degrees of freedom. Designing an EOG-based switch using triple eye blink, the researchers achieved an accuracy rate of 92.09% and an information transfer rate (ITR) value of 35.98 (bits/min) in the experiment. In another study [
23], researchers proposed a new hybrid asynchronous BCI system based on a combination of SSVEP and EOG signals. The researchers used 12 buttons, each representing 12 characters with different frequency values, to trigger SSVEPs in the interface they designed. They recorded signals on 10 subjects by changing the size of the buttons. At the end of the study, they stated that the asynchronous hybrid BCI system has great potential for communication and control. In another study [
24] where SSVEP method and EOG signals were used in the same system, researchers used 20 buttons corresponding to 20 characters in the interface they designed. Researchers used ten healthy subjects in the study and asked the subject to look at the lights, each of which was flashing at the same time during the experiment. They recorded EOG signals when the buttons moved in different directions. At the end of the experiments, they achieved an accuracy rate of 94.75%. In another study [
25], which combined the SSVEP method and EOG signals, a hybrid printer system was developed using 36 targets. The researchers divided the targets into nine groups of letters, numbers, and characters. While using EOG signals to detect the target group, they identified the target within the selected group with SSVEP. Researchers tested the proposed system on ten subjects and obtained an accuracy rate of 94.16%. In a different study that [
26] used both methods together, researchers presented a comparison data set for BCI systems. The data set consisted of data from the SSVEP-based BCI system and the SSVEP-EMG and SSVEP-EOG-based BCI systems. They conducted the experiments using a virtual keyboard containing nine visual stimuli flashing between 5.58Hz and 11.1Hz. They used ten participants in the copywriting task and collected data for 10 sessions for each system. They evaluated the systems with criteria such as accuracy, ITR, and NASA-TLX workload index.
In a visual stimulus-based BCI system [
27], researchers designed a screen containing visual stimuli at frequencies of 7Hz, 9Hz, 11Hz and 13Hz. They recorded signals over 10-min sessions. To augment the dataset, white noise with amplitudes of 0.5 and 5 was added to augment the size of the training set threefold. The classification was performed using SVM and k-NN classifiers. Without data augmentation, they achieved 51% and 54% accuracy rates, respectively. The accuracy rates improved with augmented data to 55% and 58%. In another study [
28], a drone controlled by EEG signals was developed and tested on 10 healthy subjects and detected visual stimuli at frequencies of 5.3 Hz, 7 Hz, 9.4 Hz, and 13.5 Hz. This system resulted in an average accuracy of 92.5% and an ITR value of 10 bits/min in the BBA system. In another study [
29], four LEDs with frequencies of 13 Hz, 14 Hz, 15 Hz, and 16 Hz were placed outside a visual interface. Next, the system was tested on five participants who completed image flickering experiments at four different frequencies in four directions. In this research, 23 participants were asked to complete tasks in different rooms. However, 12 participants either could not complete the tasks or did not achieve sufficient results. Those who completed all three tasks obtained an average accuracy of 79.2% and an ITR of 15.23 (bits/min). These studies indicate that systems incorporating multiple visual stimuli with different frequency values pose risks to users’ eye health due to the need for sustained focus. Consequently, these systems are uncomfortable and unsuitable for prolonged use. In this respect, some studies [
29] have observed that users experienced visual stimulus-related issues during the experiment, leading to task failure. Besides, the signal recording durations in these studies are often long, and the ITR values of the systems are relatively low.
Various studies have been conducted in the literature to mitigate the negative effects of visual stimuli on system users. For instance, in [
30], a BCI system operating at high frequencies (56-70 Hz) was proposed to reduce the sensation of flicker caused by vibrating stimuli. The system was tested with low-frequency (26-40 Hz) stimuli. The study achieved accuracy rates of 98% for low-frequency stimuli and 87.19% for high-frequency stimuli. The ITR of the system was calculated to be 29.64 (bits/min). This study demonstrated that while accuracy rates decreased with higher frequency values, the system did not provide a solution to the negative effects of visual stimuli on users. In another study [
31], a BCI system based on a rotating wing structure was proposed, wherein five healthy subjects aged between 27 and 32 participated. The designed interface had a black screen divided into four sections, each featuring a wing with an “A” mark. Each wing completed its rotation at different speeds and directions. Using the Cubic SVM method, the researchers recorded data for 125 second per class and achieved the highest success rate of 93.72%. Reviewing these studies indicates that the results obtained by these systems do not provide a permanent solution to the existing problems. Moreover, these systems have long recording times, relatively low accuracy rates, and vulnerability to unintended eye movements.
Overall, relevant studies have focused on eye movements for BCI systems as an alternative to visual stimuli. For instance, in [
32], eye movements were used to control a wheelchair. This research proposed a brain activity paradigm based on imagined tasks, including closing the eyes for alpha responses and focusing attention on upward, rightward, and leftward eye movements. The experiment was conducted with twelve volunteers to collect EEG signals. Employing a traditional motor imagery paradigm, the researchers achieved an average accuracy of 83.7% for left and right commands. Another study [
33] examined the relationship between eye blinking activity and the human brain. This research used channels AF3 and F7 for the left eye and AF4 and F8 for the right eye. The through the Convolutional Neural Networks (CNN) structure in a different study focusing on eye movements [
34], researchers investigated the effect of visual stimuli on the classification accuracy of human brain signals. The study involved 16 healthy participants who were shown arrows indicating right and left directions while their brain beta waves were recorded. Using SVM methods, the researchers achieved an average accuracy of 70% in standard tests and an accuracy of 76% in tests with effective visual stimuli. These studies primarily focus on the eye movements of the system user. However, systems remain vulnerable to unintended eye movements made by the user. Implementing sequential movement coding makes it challenging to users to adapt to the system, resulting in increased error rates. Additionally, these systems often have long recording times and relatively low accuracy rates.
The P300 method is among the frequently used techniques in the field. Using this method, researchers [
35] classified P300 signals obtained from six healthy subjects aged 20 to 37 using Deep Learning (DL) techniques. The interface they designed required participants to follow two different scenarios. For classification, they employed a 5-layer CNN deep learning module. The results showed that with deep learning classification, the transition time between stimuli achieved 100% success in training data. Meanwhile, in test data, 80% success was achieved with a 125-ms inter-stimulus interval and 40% success with a 250-ms inter-stimulus interval. In another study using the P300 method [
36], researchers developed a hybrid BCI hardware platform incorporating both SSVEP and P300. They created a chipboard platform with four independent radial green visual stimuli at frequencies of 7 Hz, 8 Hz, 9 Hz, and 10 Hz. The platform was designed to extract SSVEP and four high-power red LEDs flashing at random intervals to evoke P300 events. The platform was tested with five healthy subjects. The researchers successfully detected P300 events concurrently with four event markers in the EEG signals. In another study [
37], researchers investigated pattern recognition using the P300 component induced by visual stimuli. The study involved 19 healthy participants. Participants were instructed to look at a screen and count how many times it flashed, and the data were recorded. The researchers found that Bayesian Networks (BN) achieved the highest accuracy rate of 99.86%. These studies indicate that while visual stimuli are actively used in these methods, the systems often do not provide sufficient comfort for the user.
In [
38], the Motor Imagery method was used to examine the control of a spider robot. The researchers recorded EEG signals and tested the detection of imagined hand movements for controlling the robot. Specifically, the imagined opening of the hand was associated with forward movement of the robot, while the imagined closing of the hand was associated with backward movement. Through a CNN, the researchers achieved a maximum classification accuracy rate of 87.6%. In another study on motor imagery [
39], researchers analyzed motor imagery data obtained over 20 days from a participant. The study involved commands for right, left, up, and down movements. During the classification phase, they employed the Ensemble subspace discriminant classifier and achieved an optimal daily average accuracy of 61.44% for the 4-class classification. For five participants, the average accuracy for the 4-class classification was 50.42%, while the binary classification accuracy for right and left movements was 71.84%.
In [
40], the control of a wheelchair was investigated. To this end, three white LEDs with frequencies of 8 Hz, 9 Hz, and 10 Hz were installed in the screen’s right, left, and upper corners, respectively. The setup was tested on five different participants aged between 29 and 58 years, with movements including left, right, and forward. These authors employed Canonical correlation analysis (CCA) and Multivariate synchronization index (MSI) methods to determine the dominant frequency. The researchers achieved an accuracy rate of 96% for both methods. In [
41], the authors differentiated Error Related Potentials (ERP) in both online and offline conditions with 14 participants in a visual feedback task. Participants were shown red, blue, and green visual stimuli at periods of 500ms, 700ms, and 3000ms. The results showed an accuracy rate of 81% using deep learning techniques. In another study [
42], a system was designed to detect emotional parameters such as excitement, stress, focus, relaxation, and interest. Participants were shown a 15-min mathematics competition video to evoke excitement, attention, and focus. The researchers tested the collected experimental datasets using Naive Bayes and Linear Regression learning algorithms. The Linear Regression classifier achieved an accuracy rate of 62%, while the Naive Bayes classifier achieved an accuracy rate of 69%.
In a study investigating the impact of adjustable visual stimulus intensity, researchers [
43] designed a system to examine the effects of LED brightness on evoking SSVEP in the brain. The LED frequencies were set to 7 Hz, 8 Hz, 9 Hz, and 10 Hz, the brightness levels were adjusted to 25%, 50%, 75%, and 100%, and the system was tested on 5 individuals. The study found that the highest median response was achieved with a brightness level of 75%, which provided the highest SSVEP responses for all five participants. However, the 75% brightness level, despite yielding the best response, was found to be uncomfortably high for system users. Additionally, the number of visual stimuli used in the system was quite large. Thus, the applied method and obtained results do not provide an effective solution.
5. Discussion and Future Work
Reviewing the studies in the field are examined, it shows that a significant part of the research in visual evoked potential-based BCI systems focuses on system performance [
60]. However, the visual stimuli used in these systems seriously threaten the eye health of users, reduce system comfort, and reduce system usage time [
9,
10]. In fact, in some studies, it was observed that the subjects could not complete the experimental stages due to the negative effects of visual stimuli on the users [
29]. Visual stimulus-based BCI systems are also unsuitable for individuals with inadequate eye health, as these systems require the ability to perceive the frequency values of visual stimuli. Additionally, while EEG devices used in these systems are more cost-effective compared to many EEG recording methods (such as MEG and fMRI), they are still not sufficiently affordable to be widely adopted. Moreover, these devices are inadequate in terms of usability and comfort [
7].
This study proposed an innovative approach based on the hybrid method to minimize the negative effects of visual stimuli contained in visual stimulus-based BCI systems on the user. Instead of visual stimuli, four different moving objects (white balls), each moving in different trajectories, were used in the approach. Classification of moving objects was carried out using EOG artifacts found in the recorded EEG signals. However, the system may be activated unintentionally when the user makes the same eye movement as moving objects. This problem is also seen in many other eye movement-based BCI studies [
32,
33,
34]. Although various actions (for example, serial blinking or looking in a certain direction) have been tried to solve the problem, these methods complicate the use of the system and make it difficult for users to focus, increasing error rates. As a solution to this problem in the developed system, the user can activate the system by using the 7Hz LED placed on the top of the computer screen, without being exposed to the negative effects of any visual stimulus and without focusing on the stimulus. The system checks the presence of the background LED via the SSVEP method when EEG data is received. Detection of the LED indicates that the user made a conscious eye movement to activate the system. Otherwise, when the LED is not detected, it is concluded that the eye movements are independent of the system and the system should not be active. Since there is only one LED, the stimulating brightness of the system is low and the user does not have to focus directly on the LED. Thus, the system prevents users from experiencing a visual flash sensation, allowing users to safely use the system with moving objects without focusing on any visual stimuli.
In summary, in the study, while the control of moving objects was done using EOG artifacts contained in EEG signals, the detection of the LED placed in the background was made using the SSVEP method. The system’s classification of moving objects using EOG artifacts has been proposed as an alternative to visual stimuli in visual stimulus-based BCI systems. Thus, it is aimed to find solutions to the problems of the feeling of glare in the eyes caused by visual stimuli, the negative impact on system comfort and usability due to the feeling of glare, eye disorders caused by long-term use and reducing the system usage time. During the commissioning phase of the system using the LED in the background, the SSVEP method aims to enable the system to be safely activated and deactivated by the user. The success rate of the system during its activation phase is important. Because it is not difficult to foresee that systems that make wrong decisions will cause enough difficulties for paralyzed individuals. Thus, constant blinking etc. is required to activate the system in the field. An alternative solution to these methods has also been provided.
Table 9 provides basic information on some visual stimulus-based studies using the Emotiv Epoc EEG device.
As can be inferred from previous studies [
35,
61,
64], the number of subjects is relatively insufficient compared to the general standard. The number of subjects directly affects the performance metrics of the systems. Compared to other studies, the number of subjects used in this study is moderate. The accuracy rate is among the most critical parameters for the usability of systems. As shown in
Table 8, the accuracy rate obtained in this study can be considered effective. Additionally, some studies [
62,
64,
65,
66] report that the ITR values are either not computed or are low. The ITR value reflects the speed of the system and is the most important parameter for assessing its practical applicability. The ITR value of 36.7 (bits/min) achieved in this study is considered successful compared to the values considered in the studies reviewed.
During the experiments, illuminated data were recorded without requiring any focus on visual stimuli or eye contact. Nevertheless, visual stimuli still caused discomfort for the subjects over time. Although this study significantly alleviates the reliance on visual stimuli for the system user, visual stimuli can still cause discomfort in various ways. Furthermore, the Emotiv EPOC X EEG device has its own disadvantages. These drawbacks include the excessive pressure it applies to the user’s head during use exceeding 30 min, the inability to adjust the device to fit different head sizes, electrode oxidation, and continuous drying. Furthermore, the device’s sensor contact points cannot be altered, leading to variability in contact points for individuals with different head sizes. Despite these issues, the device is preferred considering its advantages, such as affordability, portability, long battery life, ease of use and setup, and no need for any cleaning after use.
In BCI systems, using fewer EEG channels makes the system more efficient. According to the literature [
61,
65], researchers often increase the number of channels to enhance accuracy rates. In contrast, the current study utilized only channels F7, AF3, AF4, and F8 of the Emotiv EPOC X EEG device. Future research could further reduce the number of channels by evaluating the performance of effective waveforms for each channel.
In this study, the number of visual stimuli was reduced to 1, eliminating the need for the user to focus on the stimulus. However, the monitor used to display the stimuli both emits light and is uncomfortable and impractical due to its necessity to be constantly in front of patients. Moreover, almost all studies reviewed consist of single-session or daily recordings. However, systems should be capable of producing consistent responses for the same user on different days. In summary, the model created from data recorded on the first day for Person A should be compatible with data recorded on the second day for the same person. Another problem is that the designed system has not been tested in real time. Stating that they are at the beginning of the study, the researchers stated that the system will be designed in real time in the next study. Future research will address these identified issues.
6. Conclusions
This study proposes a hybrid BCI system that uses SSVEP and EOG methods to minimize the negative effects of visual stimulus-based BCI systems on the user. Visual stimuli can be quite detrimental to the user’s eye health, as they require direct focus during system use. Additionally, this negatively affects system comfort and reduces usage time. The study proposes an innovative approach that uses objects (white balls) moving in different trajectories instead of visual stimuli to provide solutions to the mentioned problems. The system produces EOG artifacts potentials within EEG signals using white balls, and moving objects are classified using these EOG artifacts. However, the study also acknowledges the major drawback of the proposed approach. Since such systems are based on eye movements, they can also remain active in the user’s independent movements. In the study, this problem is solved through the SSVEP method by using a single 7Hz frequency LED with a low brightness level, which is placed in the upper middle part of the screen, where the user does not need to focus. The purpose of using the LED is to detect whether the system user is looking at the screen containing moving objects. When the user looks at the screen, SSVEP is triggered and the system is activated. If the screen is not looked at, the system is not triggered and is disabled. This ensures that the user can use the system safely.
In the study, a two-stage classification process was applied using 10 healthy subjects. In the first classification stage, SSVEP was triggered via LED and it was checked whether the LED was active or not. While the system does not react when the LED is not active, when it is active, the second classification stage is started. In the second classification stage, recorded EOG signals were classified using machine learning algorithms. As a result of the experiments, the RF machine learning algorithm achieved an accuracy rate of 99.57% for the first classification stage and 97.83% for the second classification, and an ITR value of 36.75 bits/minute. Considering the overall performance of the system, including classification-1 and classification-2 stages, the RF machine learning algorithm gave the best result with an accuracy rate of 97.42% and an ITR value of 35.75 bits/minute. Additionally, effective channels and wavebands for the proposed system were identified in the study. The proposed hybrid BCI system eliminates the need for focusing for visual stimuli, reducing the number of visual stimuli in VEP-based BCI systems to a minimum and manageable level. Additionally, the study offers an innovative perspective to the field by proving that visual stimulus-based BCI systems can be used in a different way by using moving balls, without requiring direct focusing on the LED.
Figure 1.
The basic scheme of BCI systems.
Figure 1.
The basic scheme of BCI systems.
Figure 2.
General schematic of the designed BCI system.
Figure 2.
General schematic of the designed BCI system.
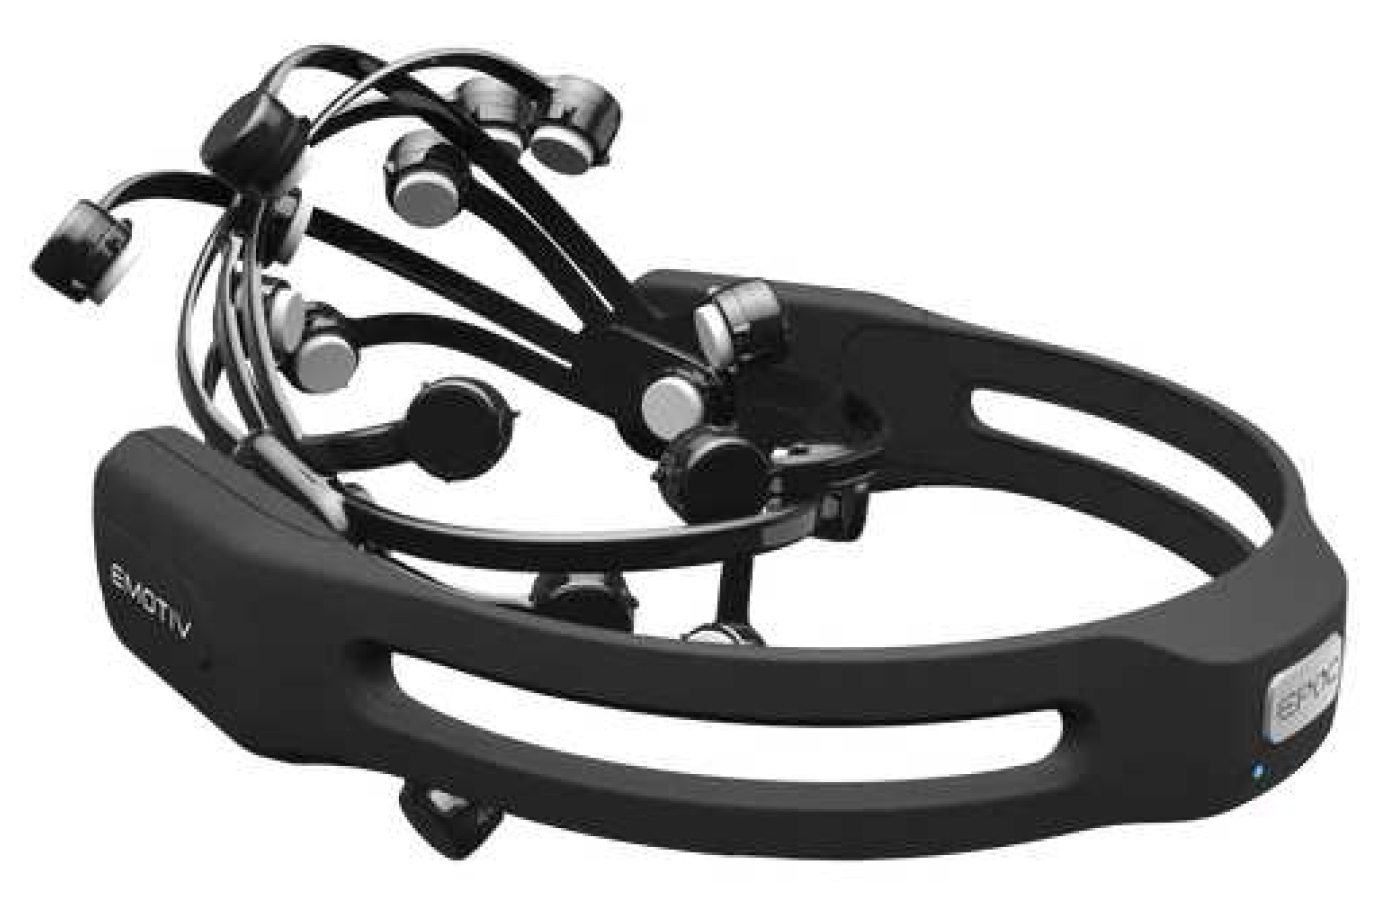
Figure 3.
Emotiv Epoc X EEG device.
Figure 3.
Emotiv Epoc X EEG device.
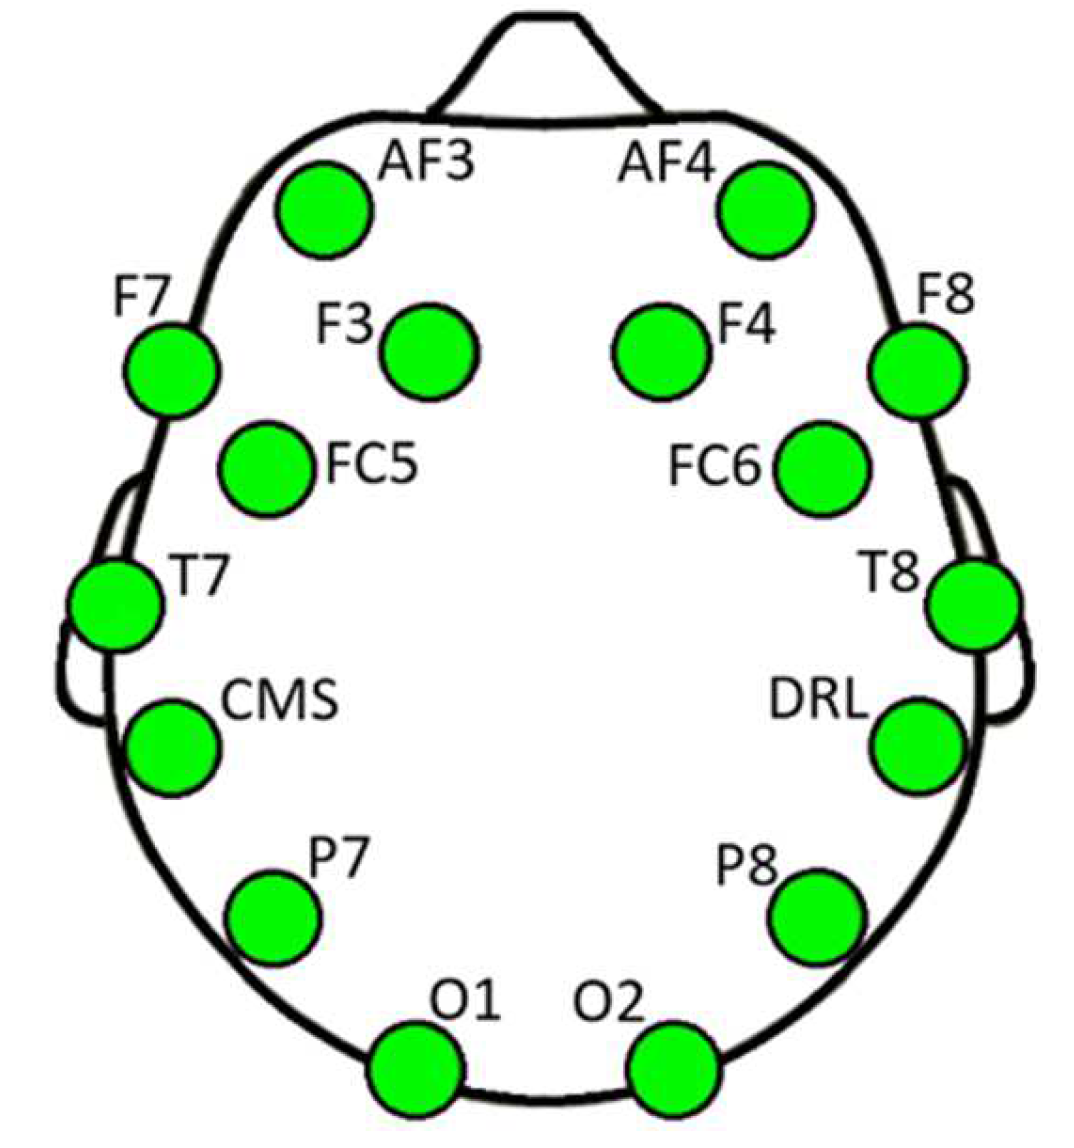
Figure 4.
Electrode locations of the Emotiv Epoc X EEG device.
Figure 4.
Electrode locations of the Emotiv Epoc X EEG device.
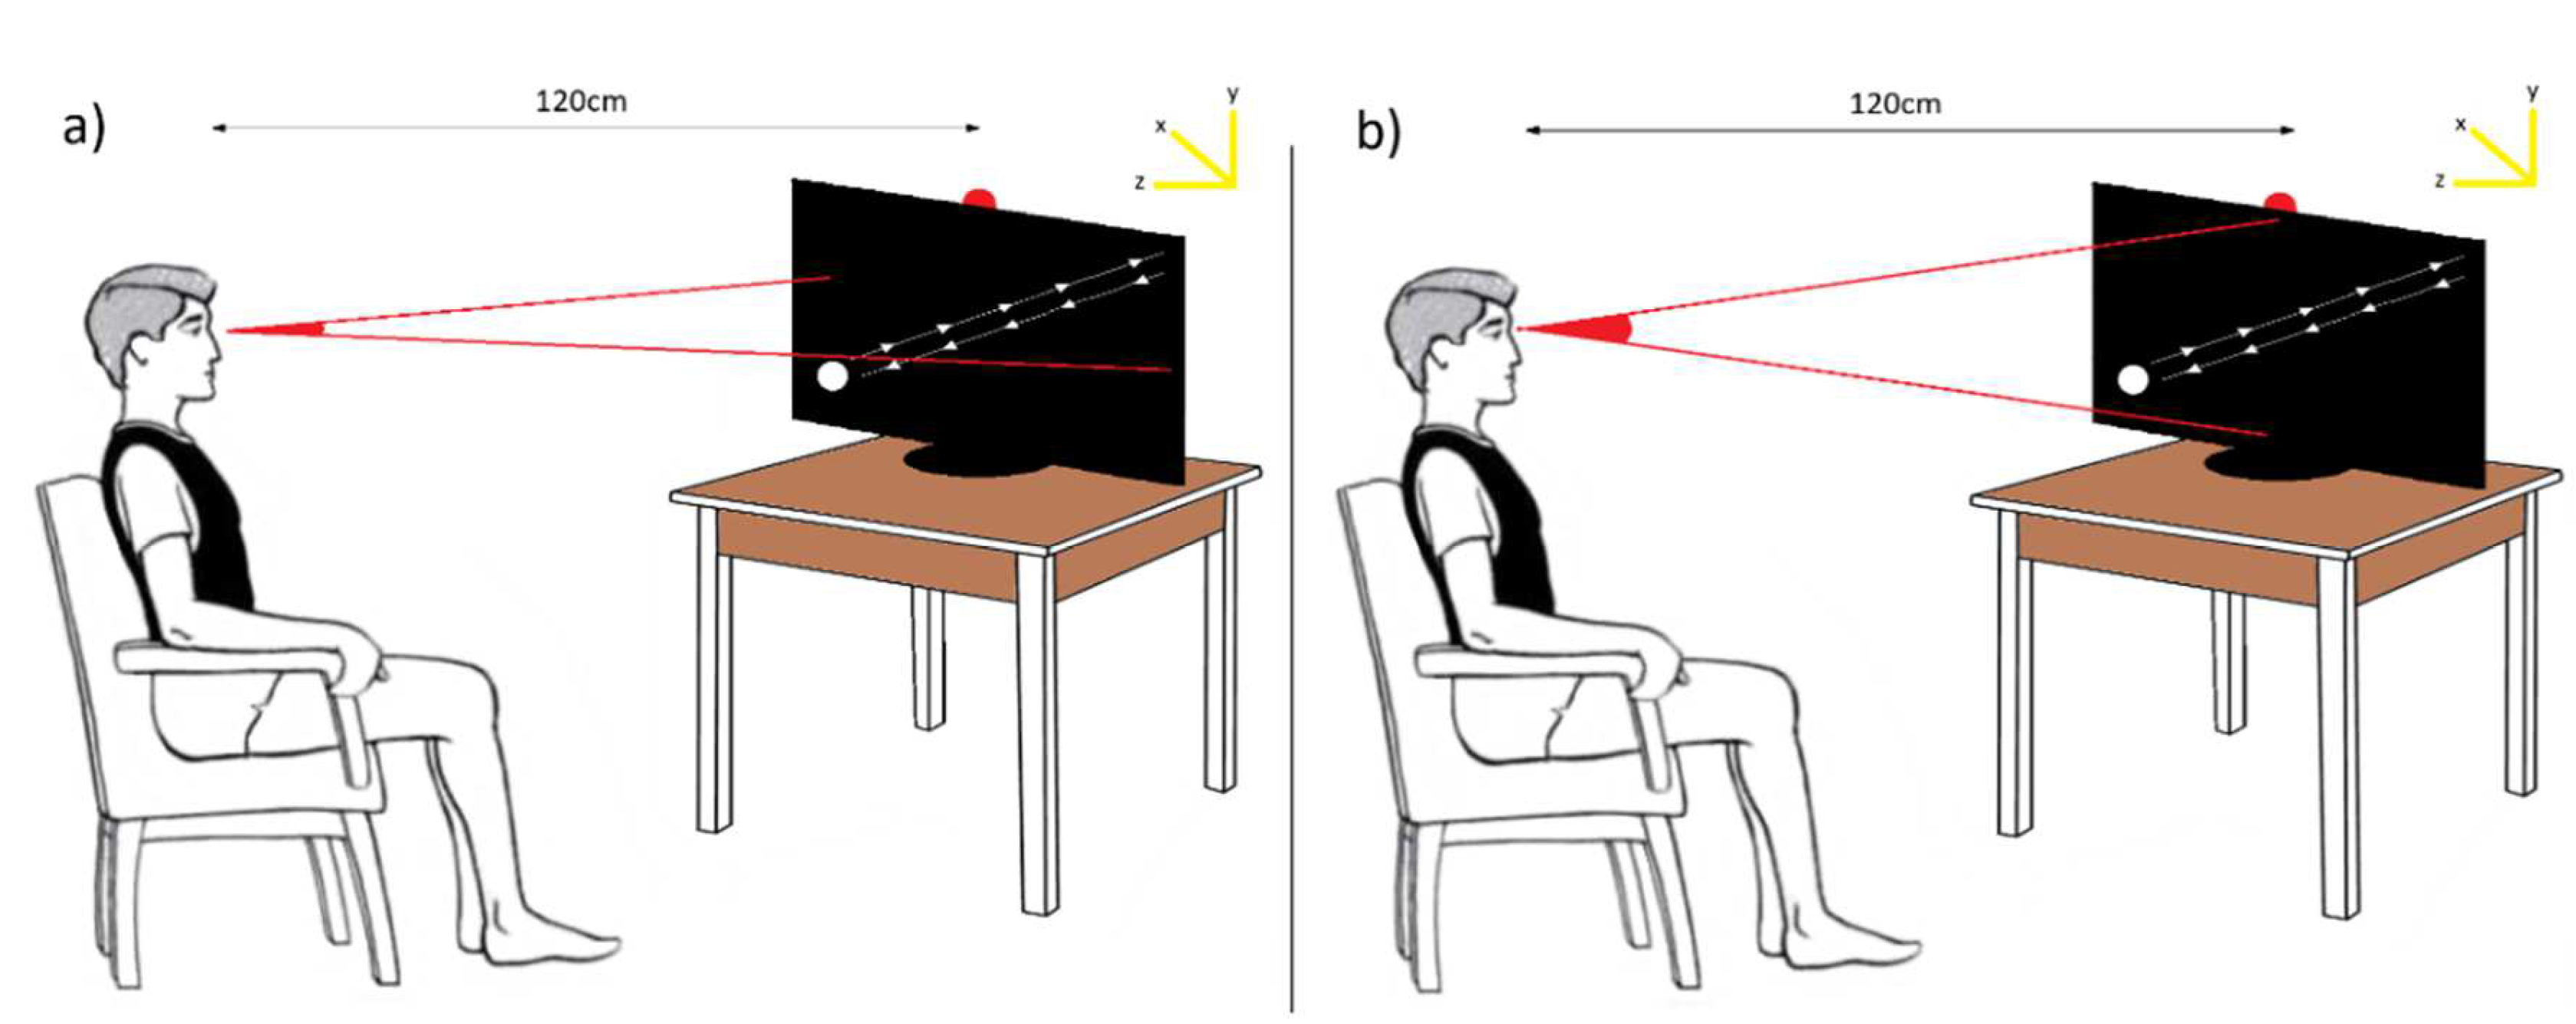
Figure 5.
Representative maximum gaze angles formed along the subject’s X(a) and Y(b) axes.
Figure 5.
Representative maximum gaze angles formed along the subject’s X(a) and Y(b) axes.
Figure 6.
Stages of applying the approach.
Figure 6.
Stages of applying the approach.
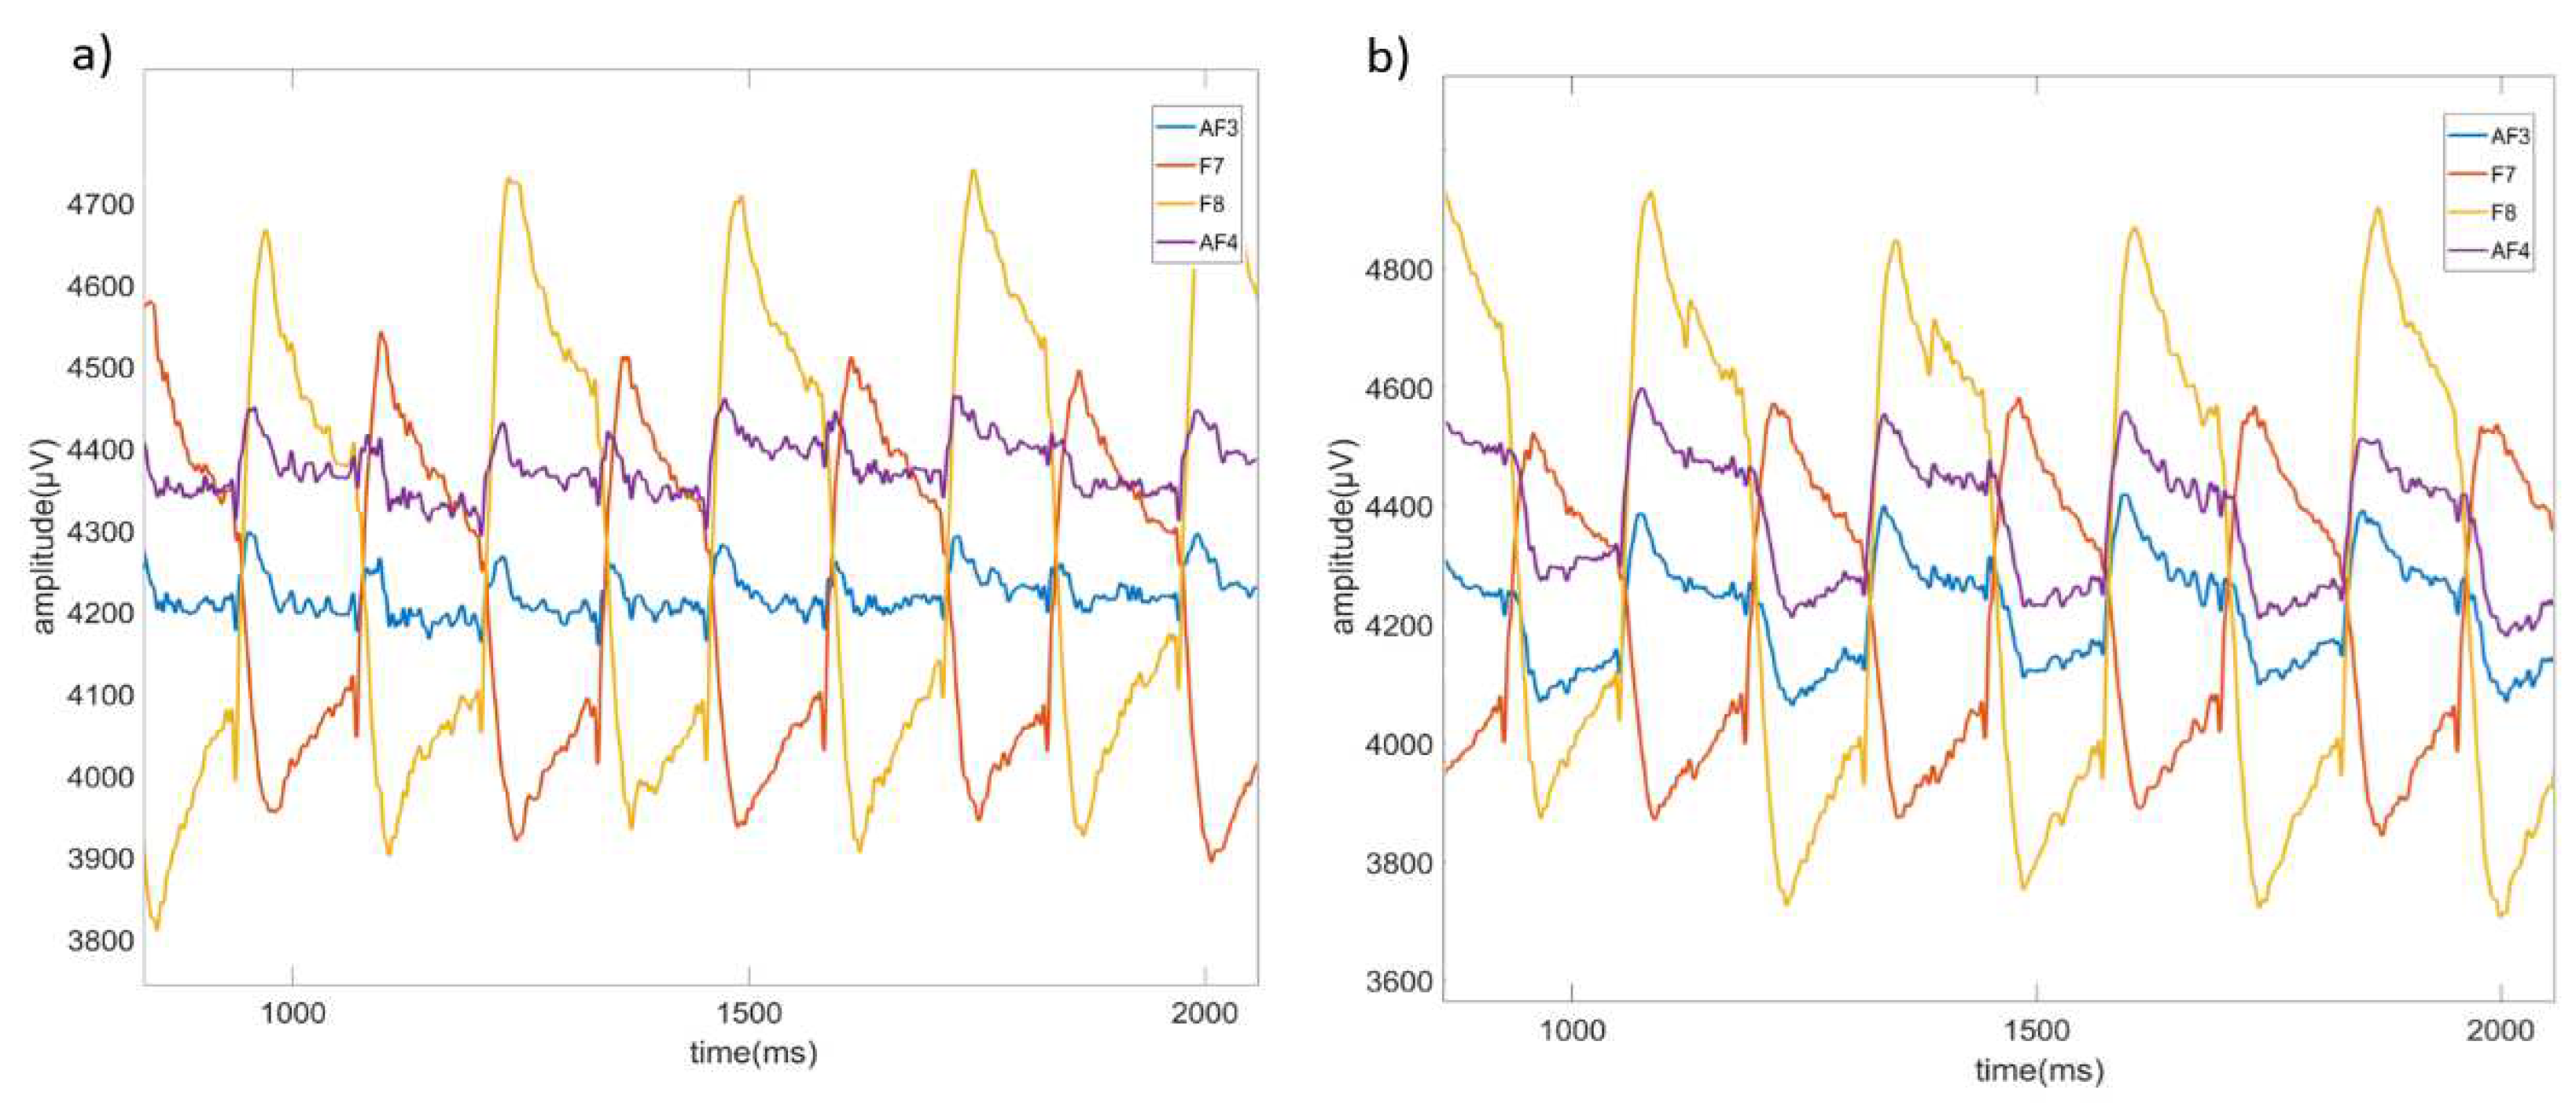
Figure 7.
The EEG signal recording stage under light on (a) and light off (b) conditions.
Figure 7.
The EEG signal recording stage under light on (a) and light off (b) conditions.
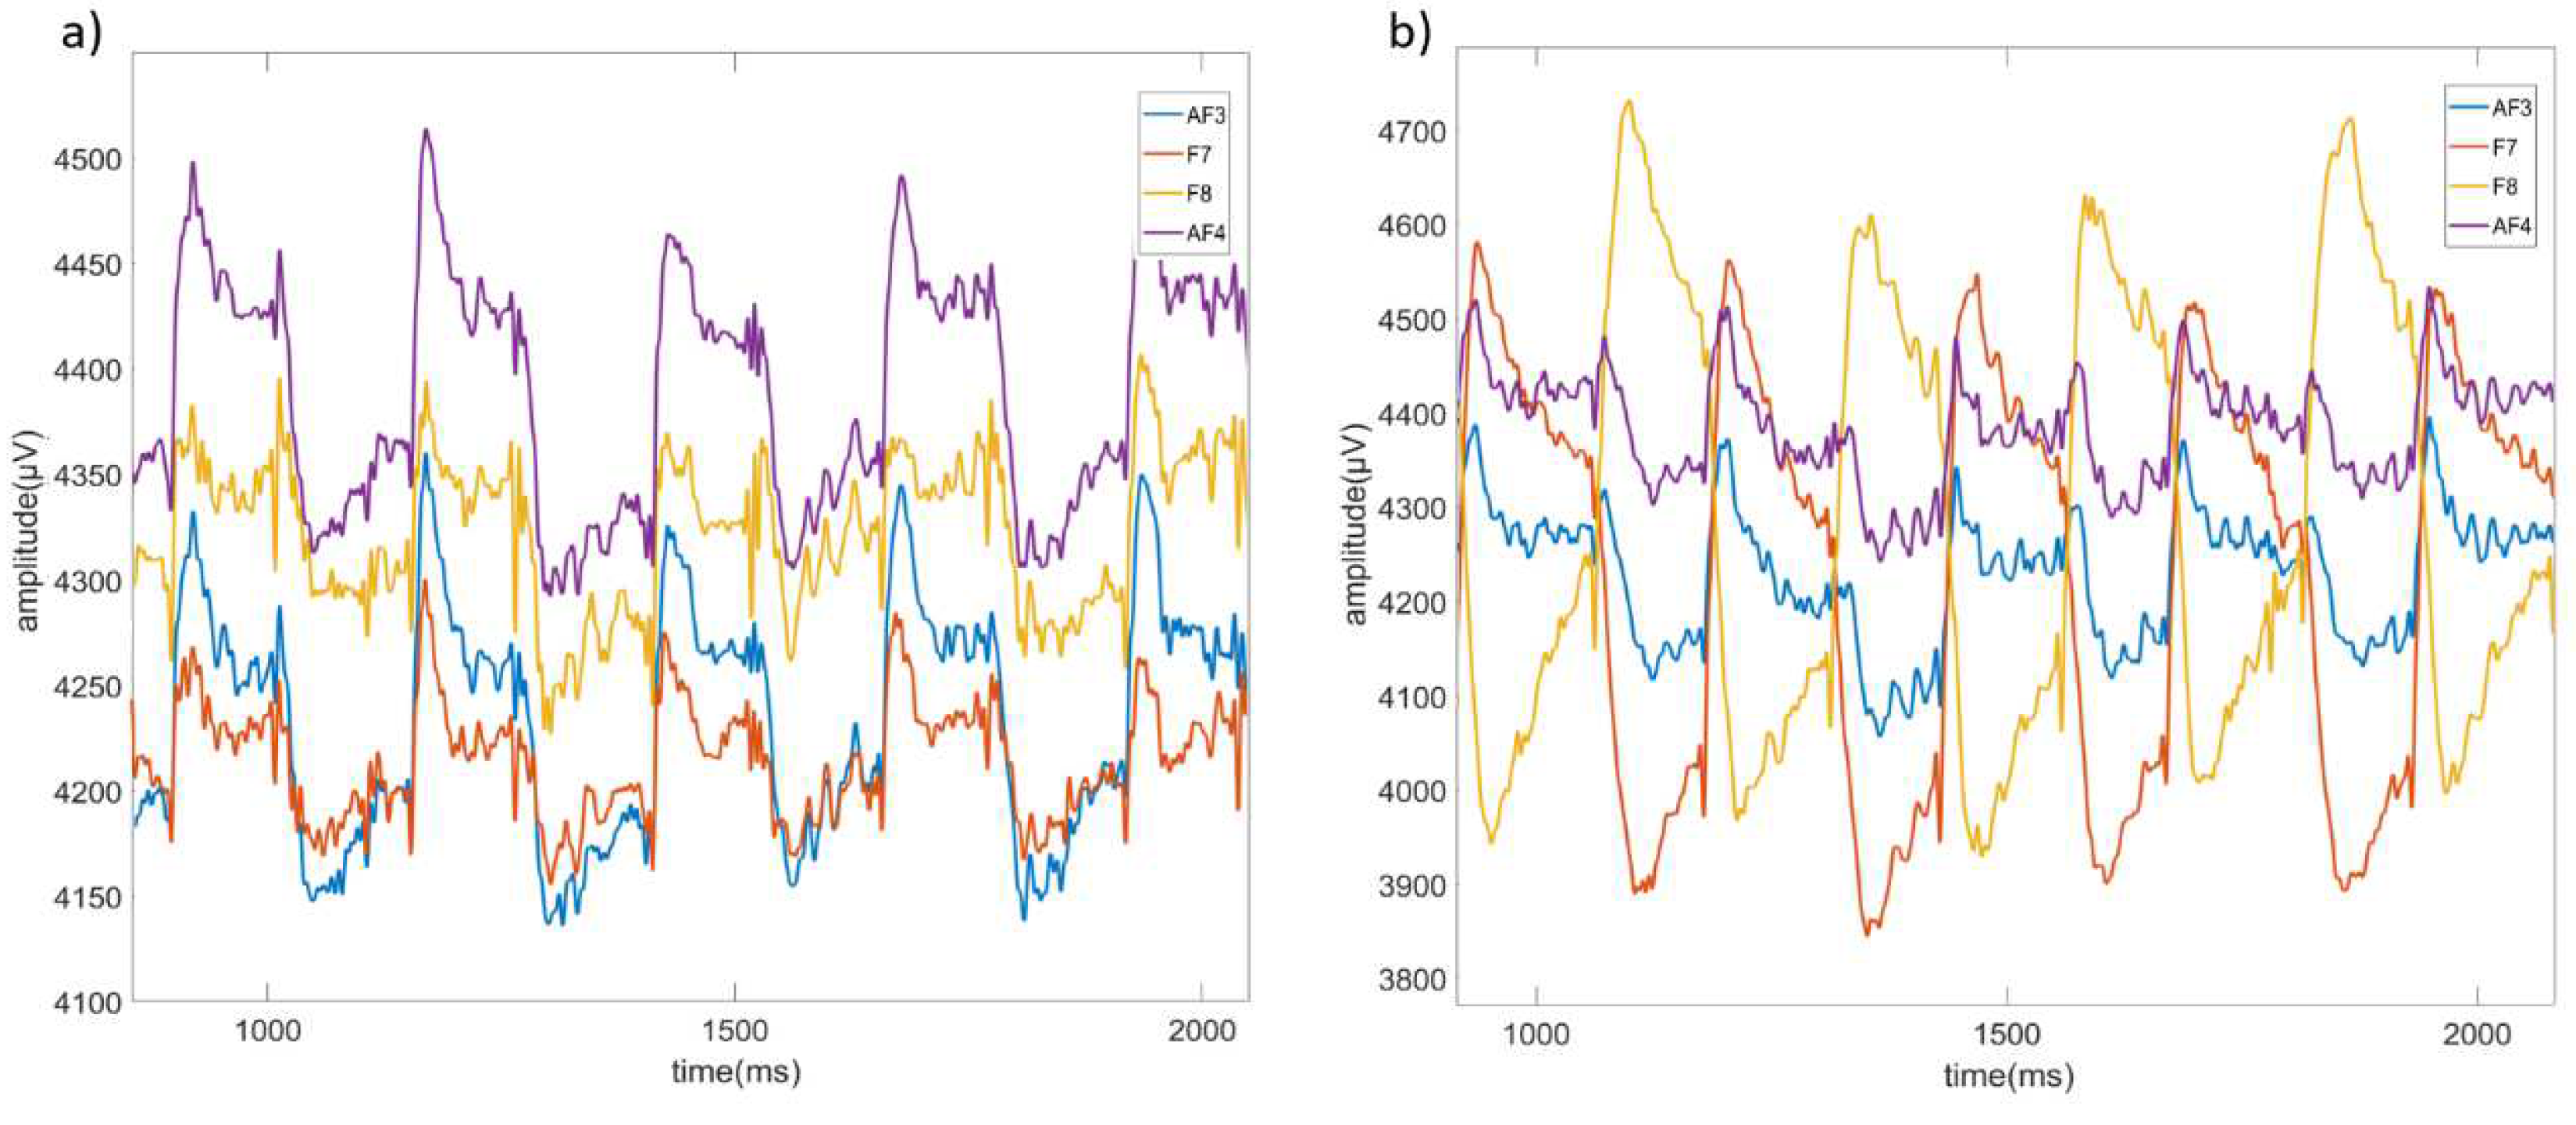
Figure 8.
Up-down movement (left) and left-cross movement (right) raw signals of AF3, F7, F8, AF4 channels caused by EOG artifacts in EEG signal.
Figure 8.
Up-down movement (left) and left-cross movement (right) raw signals of AF3, F7, F8, AF4 channels caused by EOG artifacts in EEG signal.
Figure 9.
Right-left movement (left) and right-cross movement (right) raw signals of AF3, F7, F8, AF4 channels caused by EOG artifacts in EEG signals.
Figure 9.
Right-left movement (left) and right-cross movement (right) raw signals of AF3, F7, F8, AF4 channels caused by EOG artifacts in EEG signals.
Figure 10.
(a) Unfiltered and (b) filtered data examples for channel AF3.
Figure 10.
(a) Unfiltered and (b) filtered data examples for channel AF3.
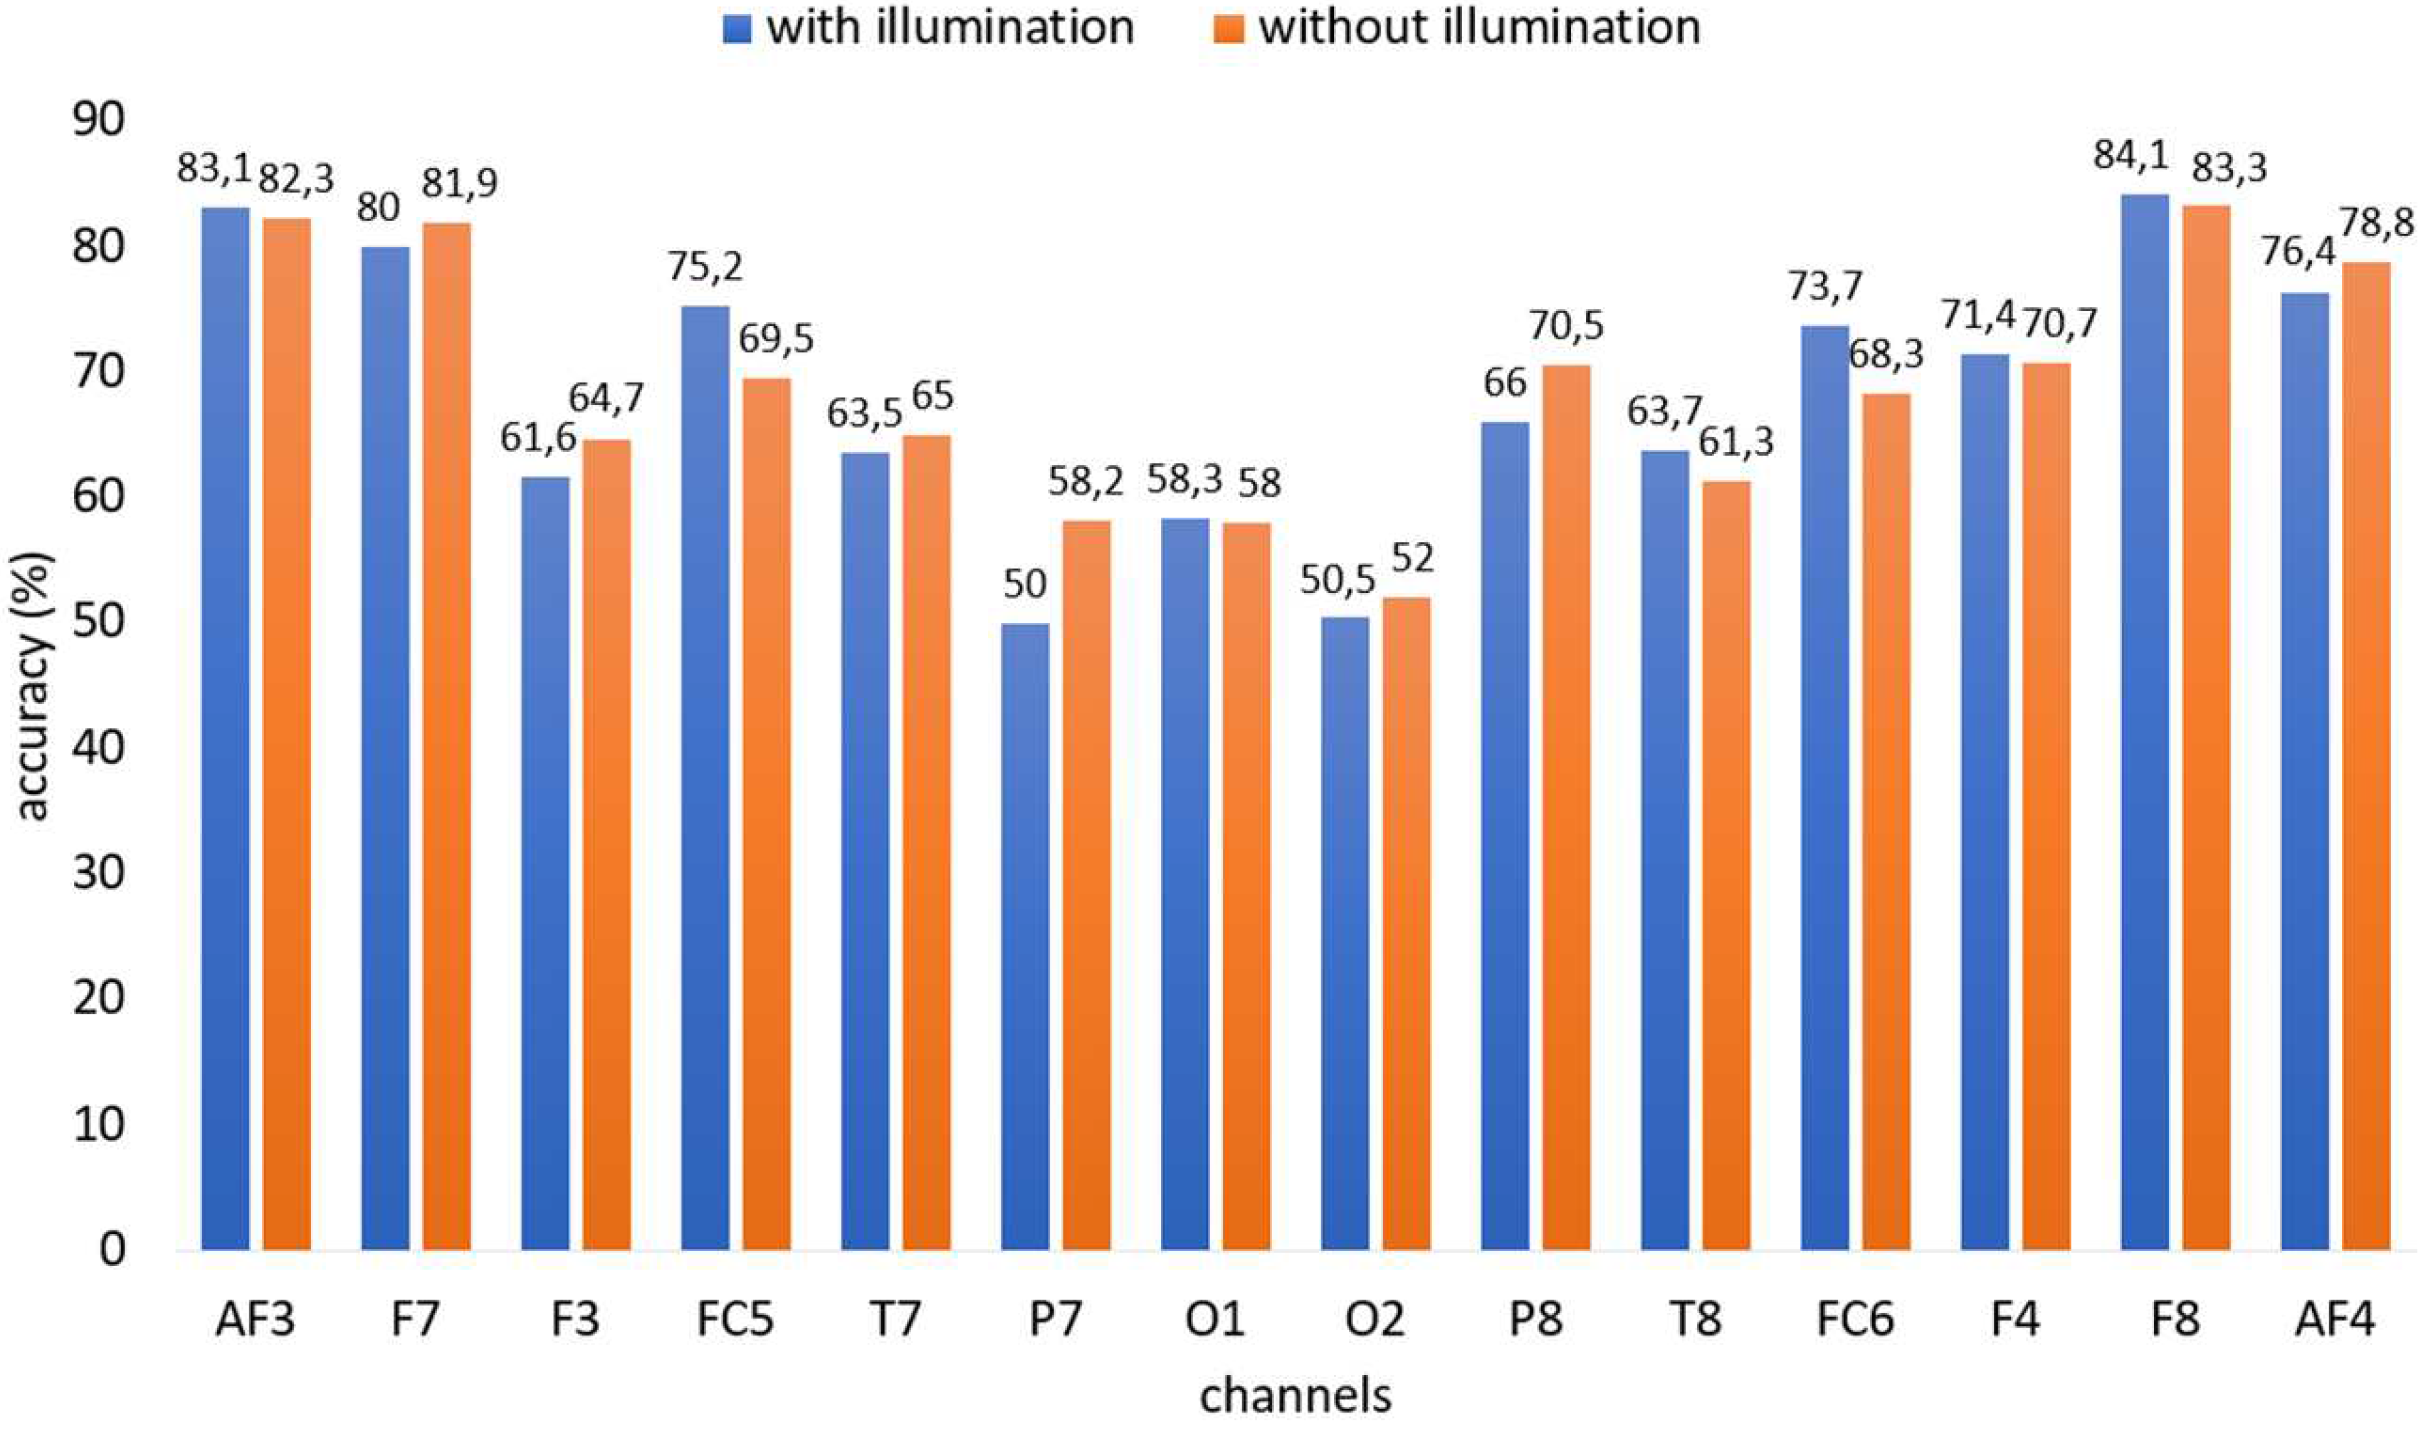
Figure 11.
Classification accuracy rates of illuminated and non-illuminated data using all channels with an RF classifier.
Figure 11.
Classification accuracy rates of illuminated and non-illuminated data using all channels with an RF classifier.
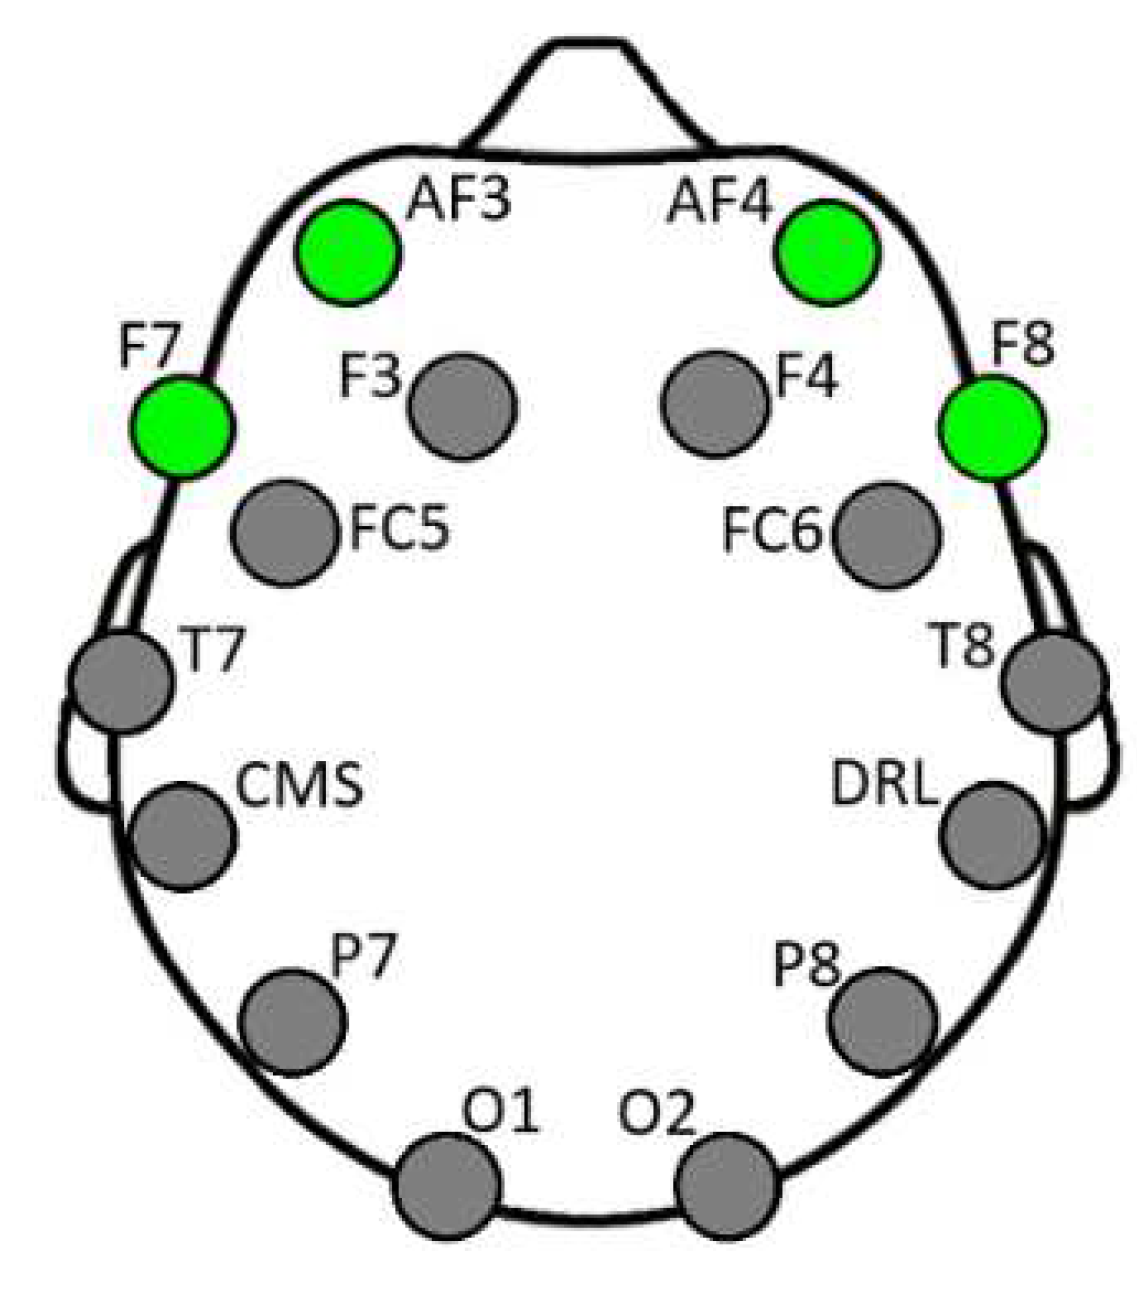
Figure 12.
The locations of channels AF3, F7, F8, and AF4 on the head.
Figure 12.
The locations of channels AF3, F7, F8, and AF4 on the head.
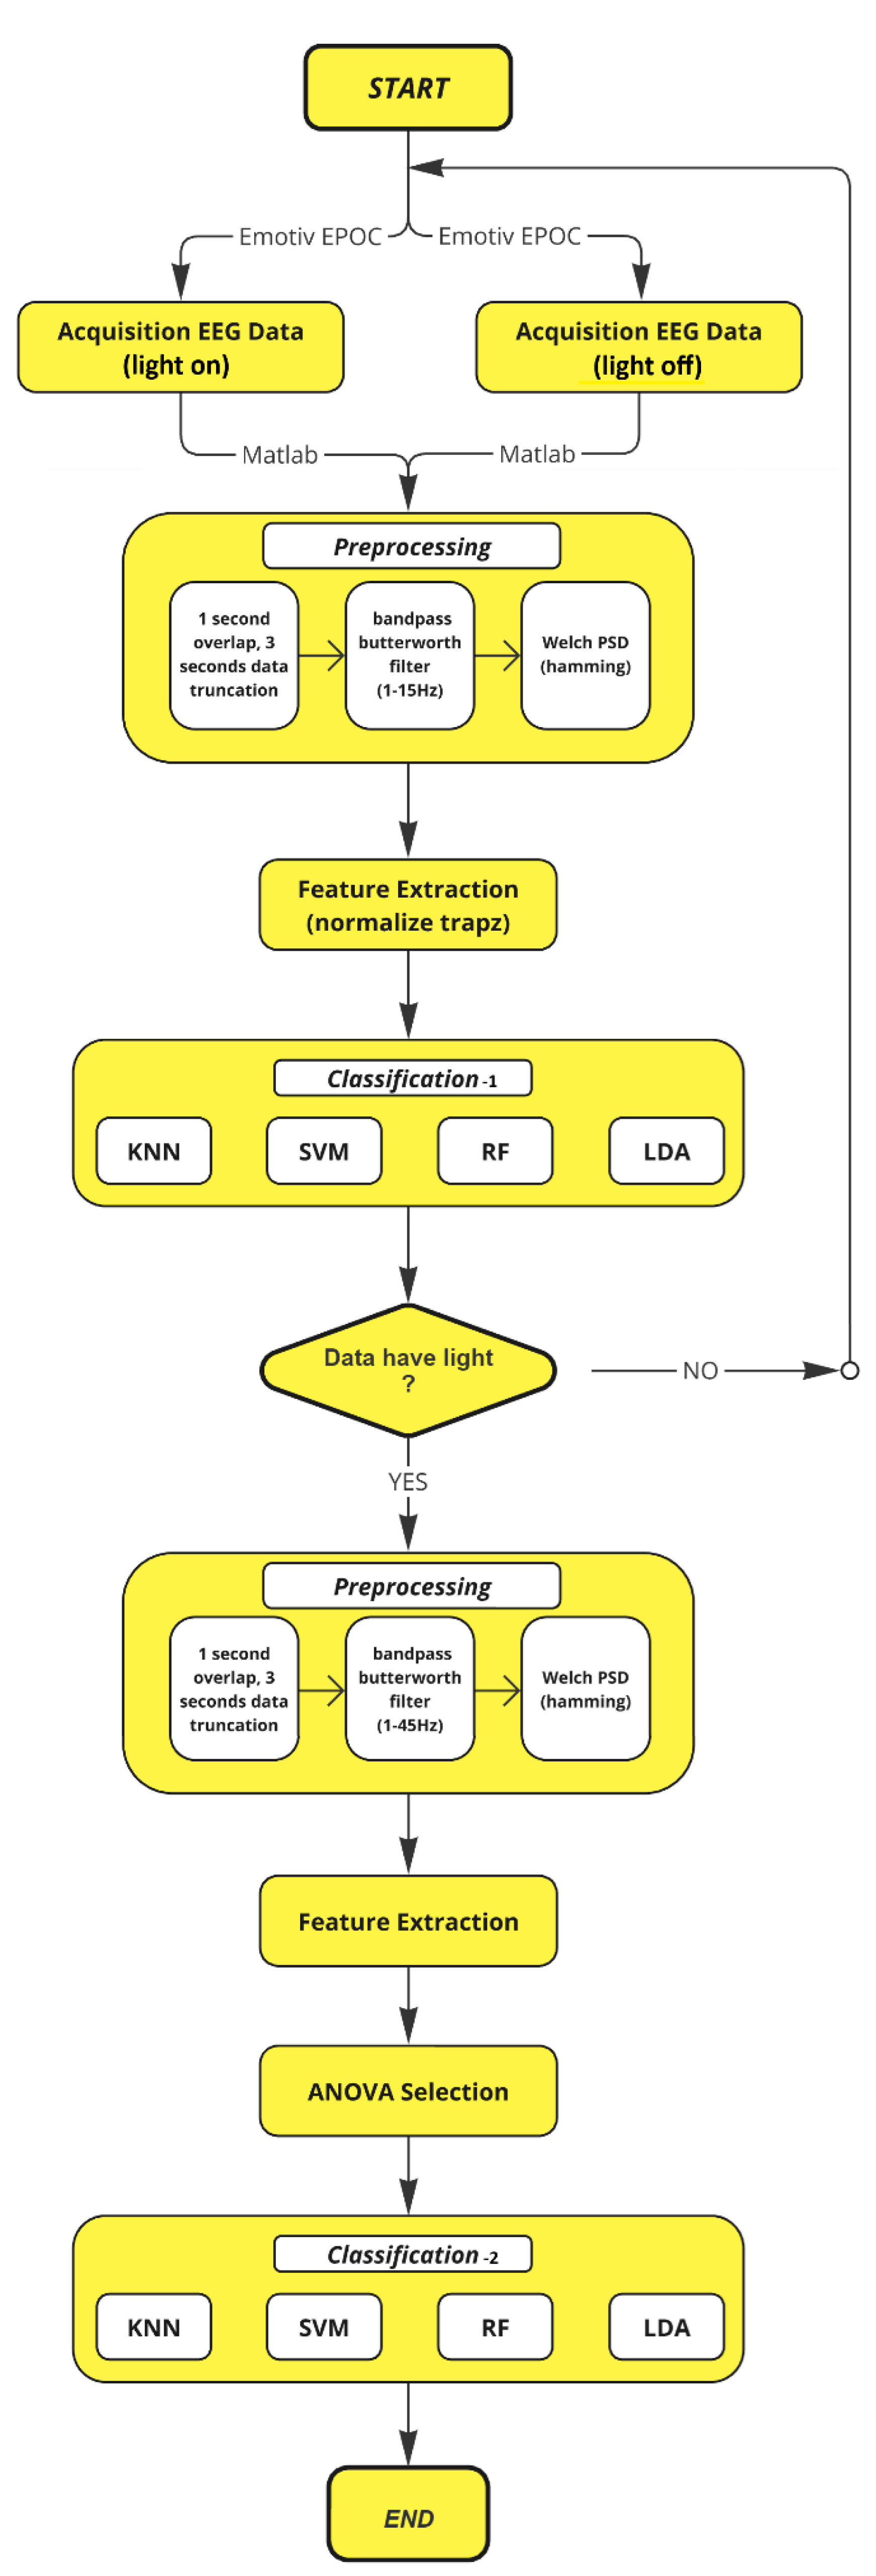
Figure 13.
Algorithm of the designed BCI system.
Figure 13.
Algorithm of the designed BCI system.
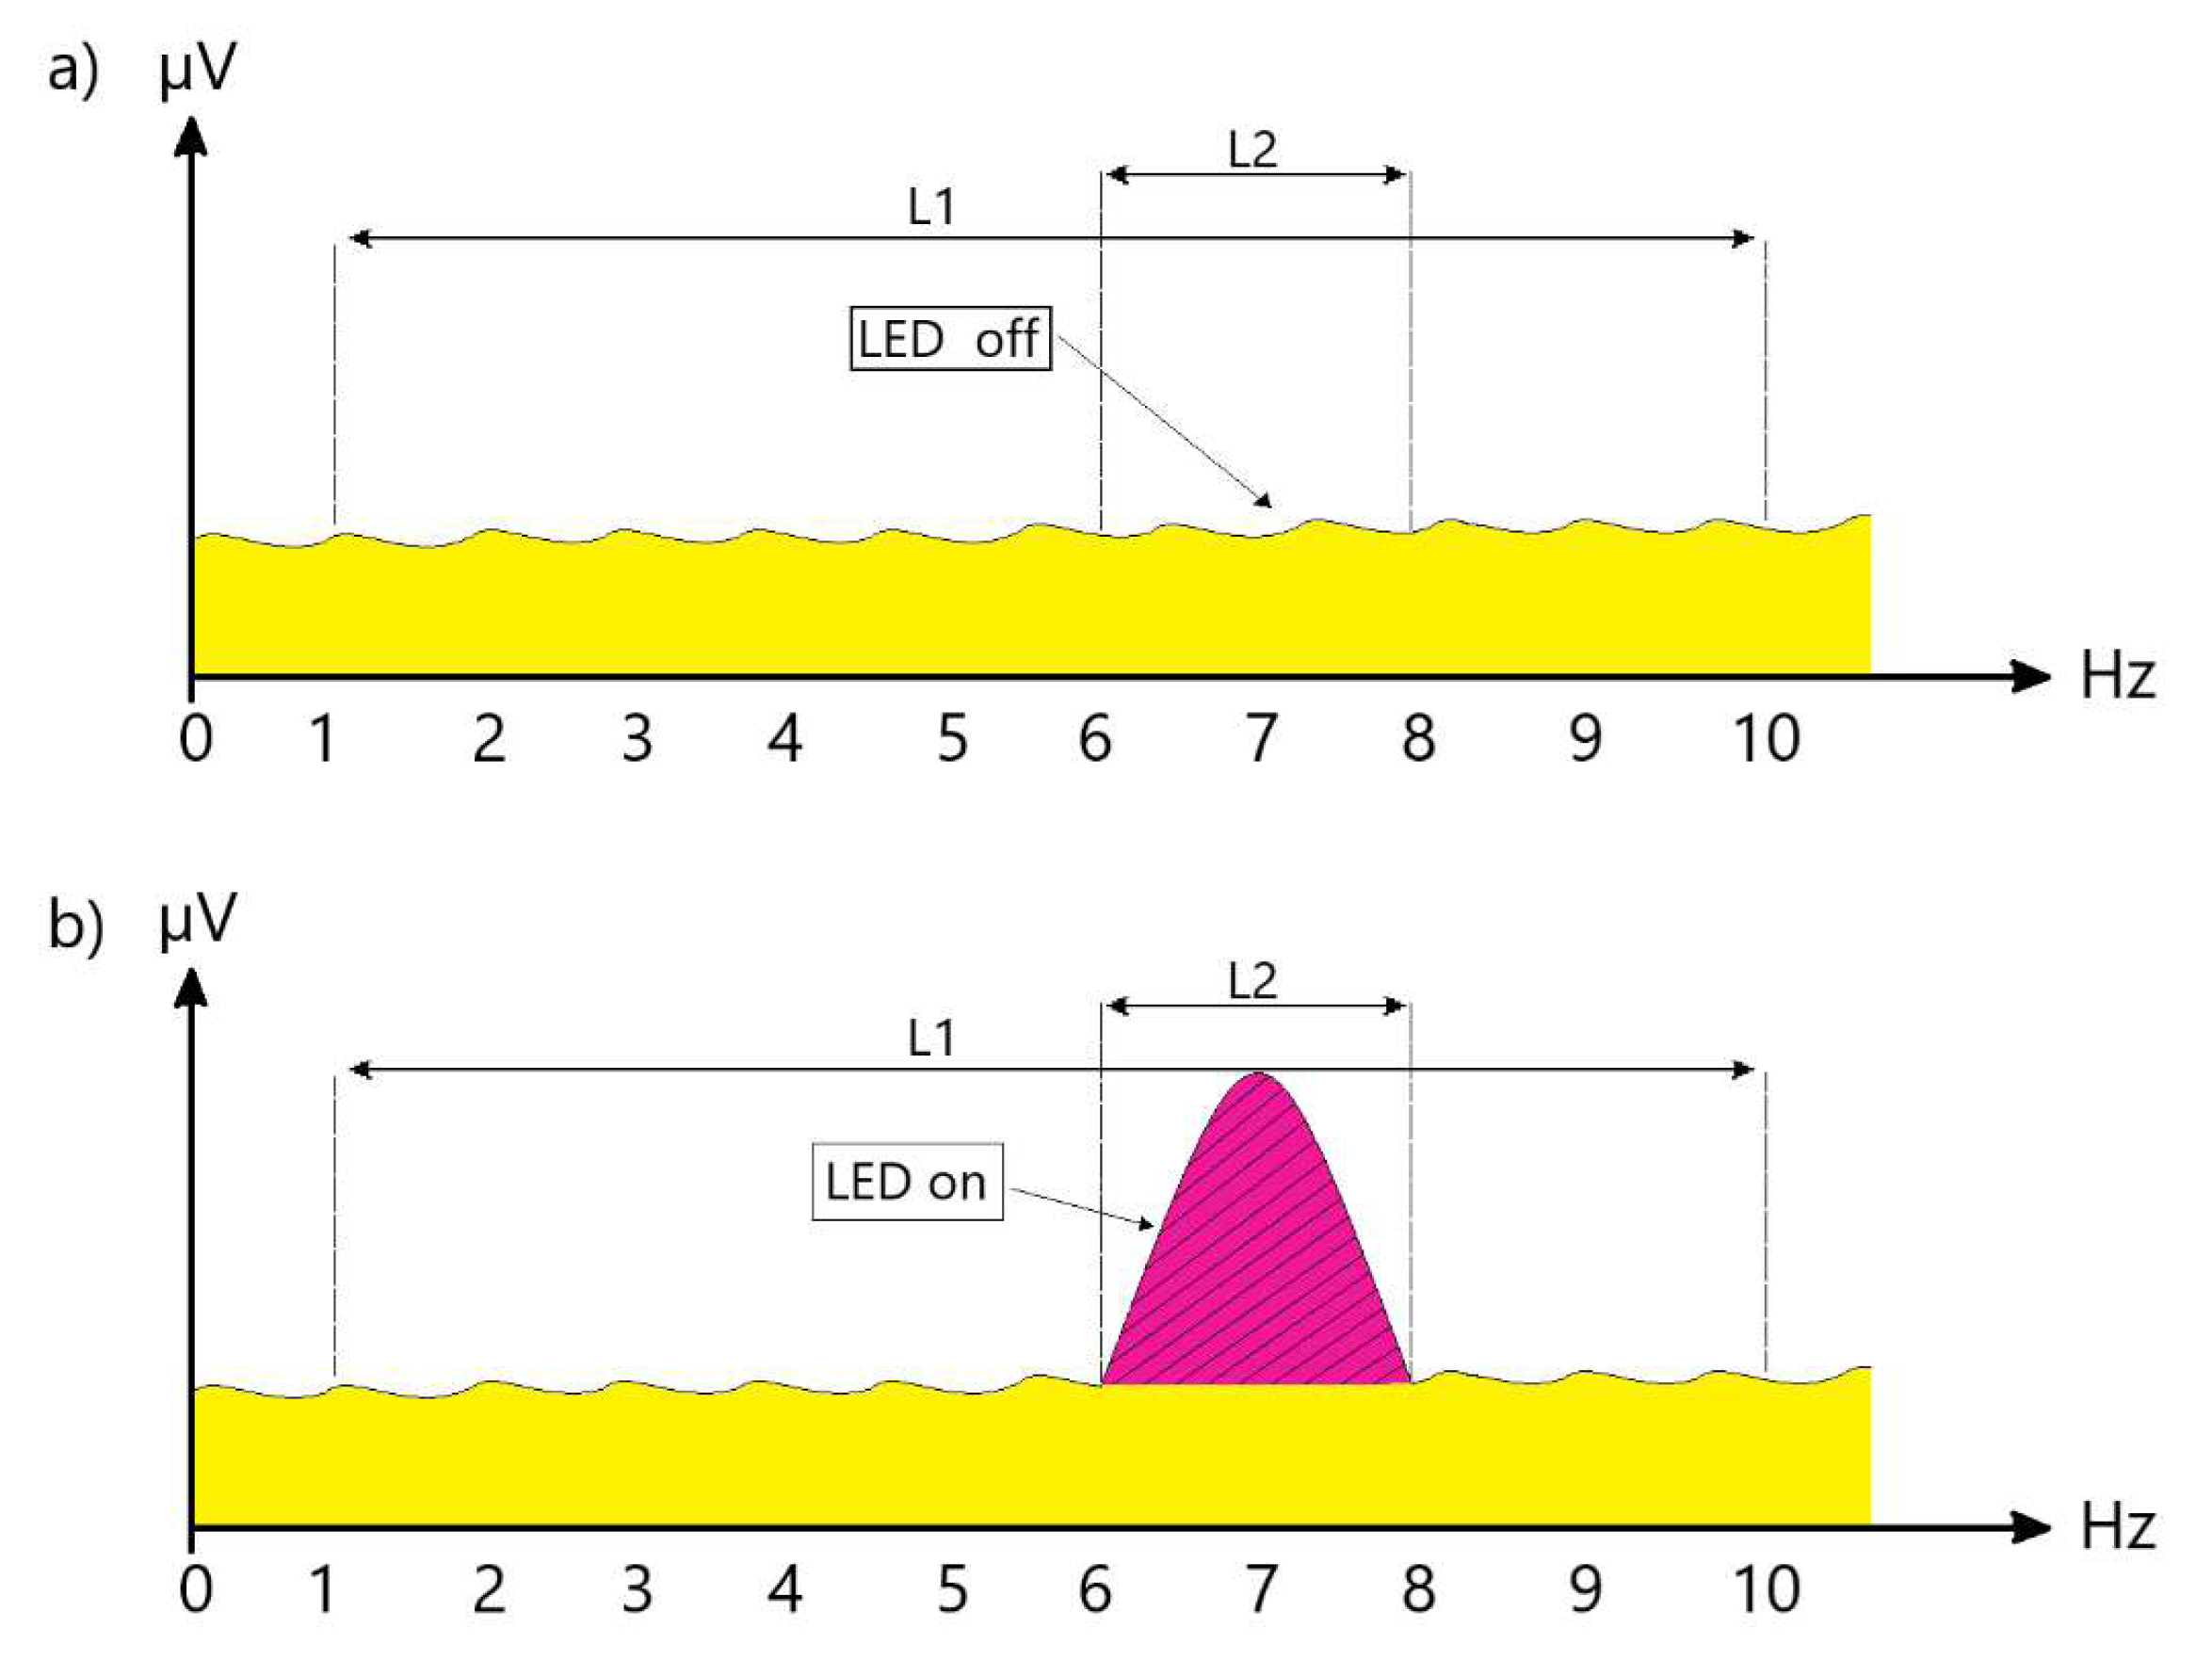
Figure 14.
SSVEP potentials occurring in the LED off position (a) and LED on (b) positions.
Figure 14.
SSVEP potentials occurring in the LED off position (a) and LED on (b) positions.
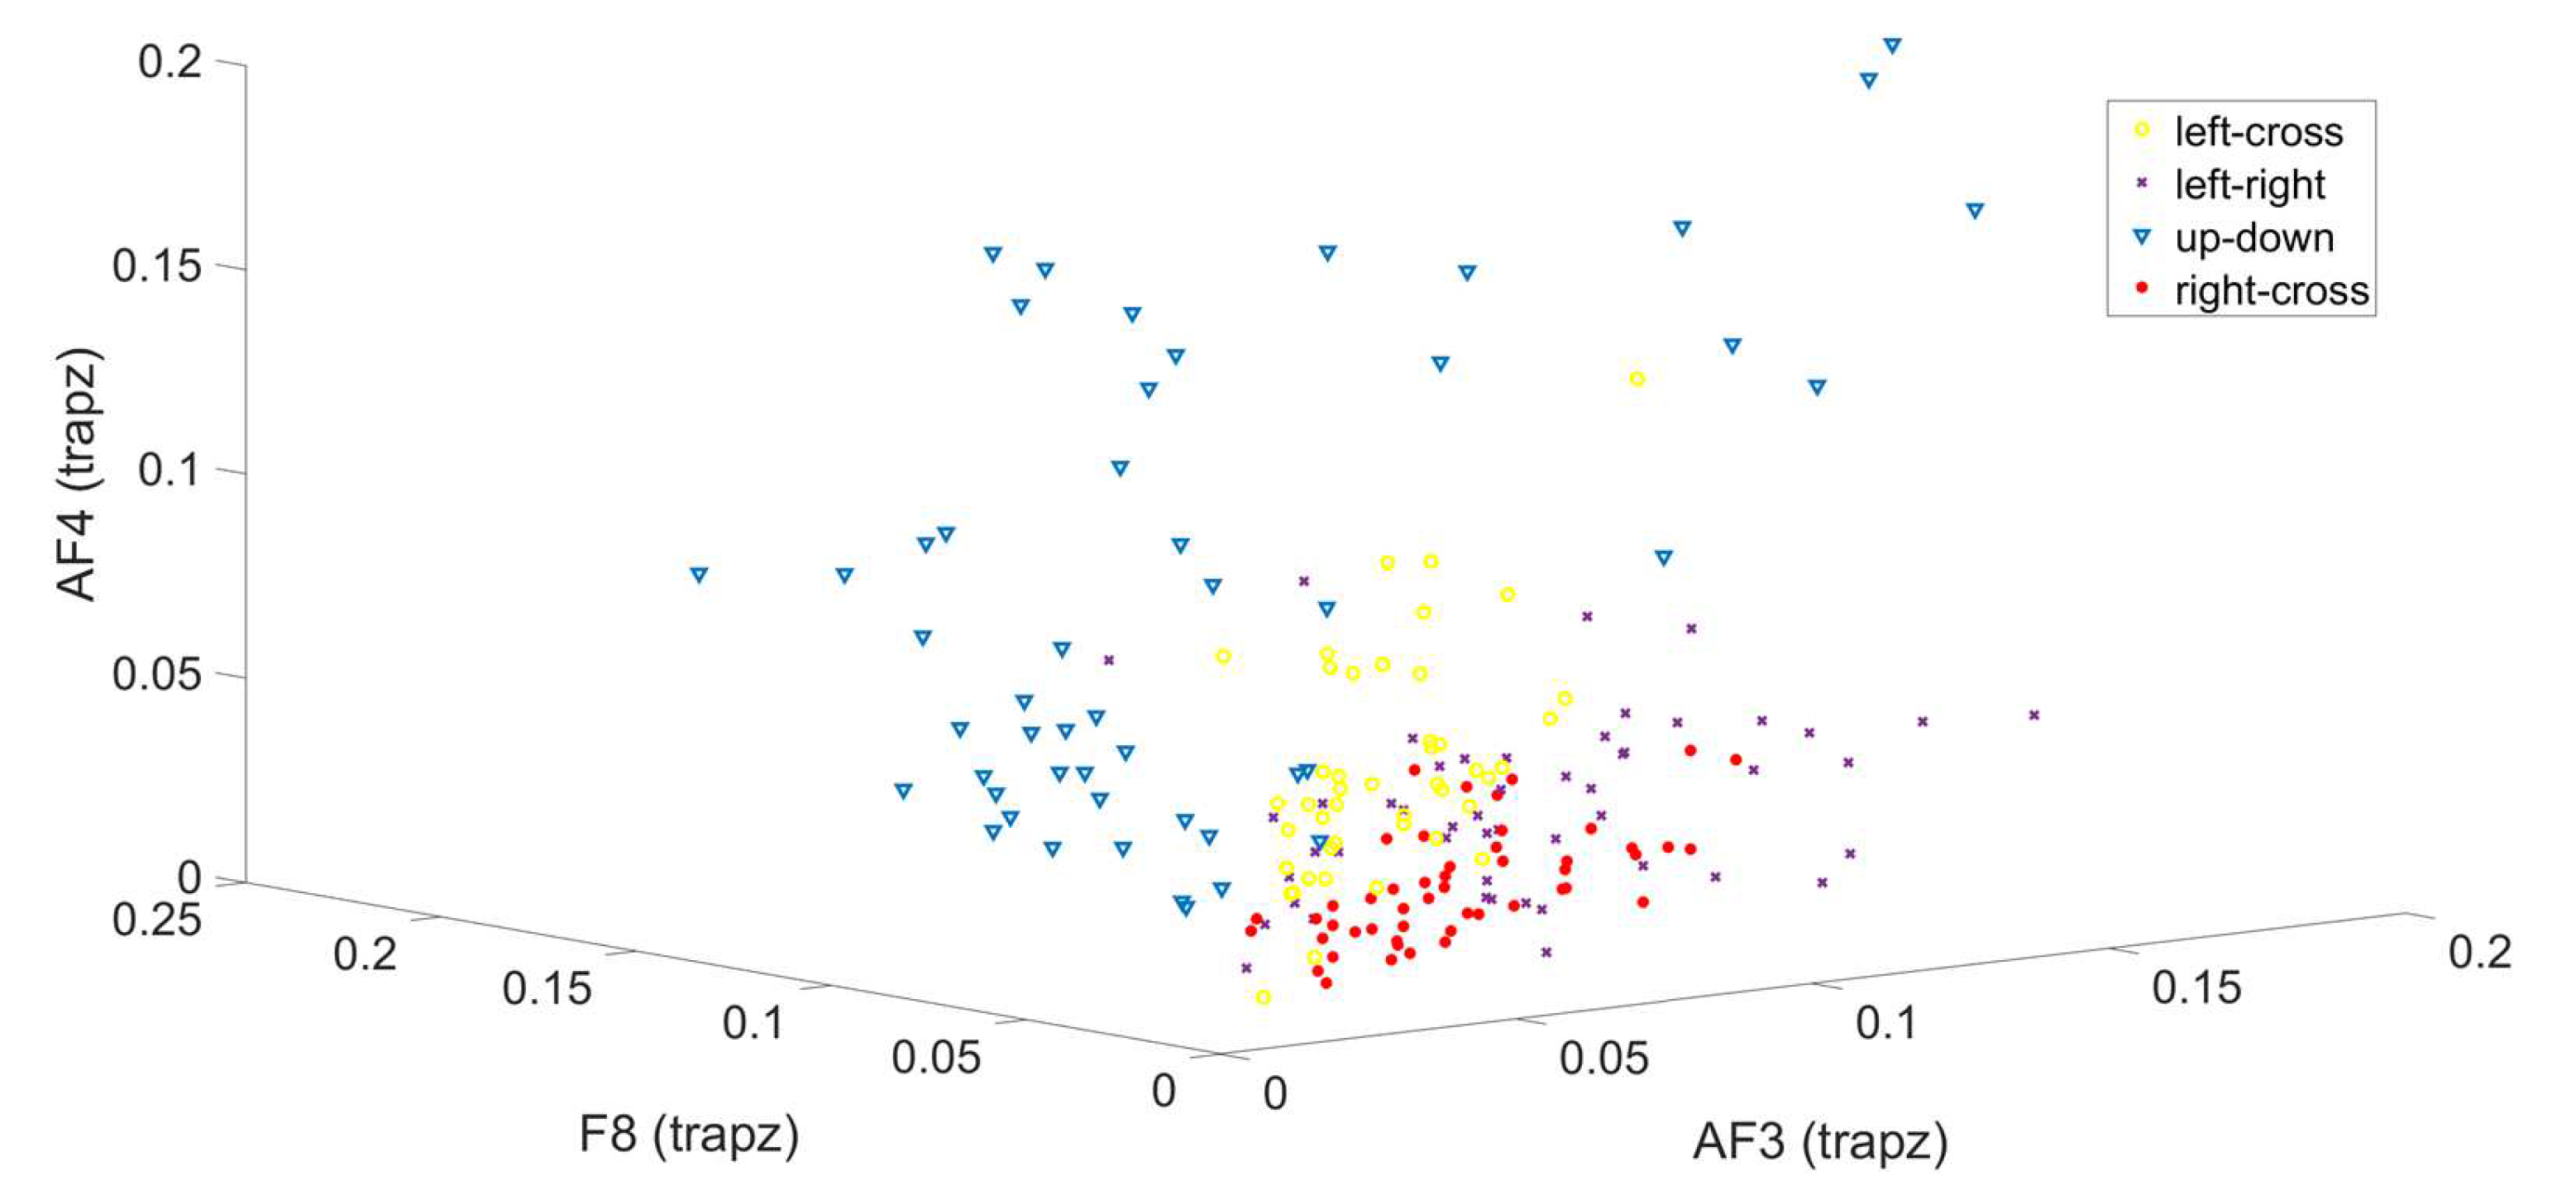
Figure 15.
3D feature scatter plot created using channels AF3, F8, and AF4.
Figure 15.
3D feature scatter plot created using channels AF3, F8, and AF4.
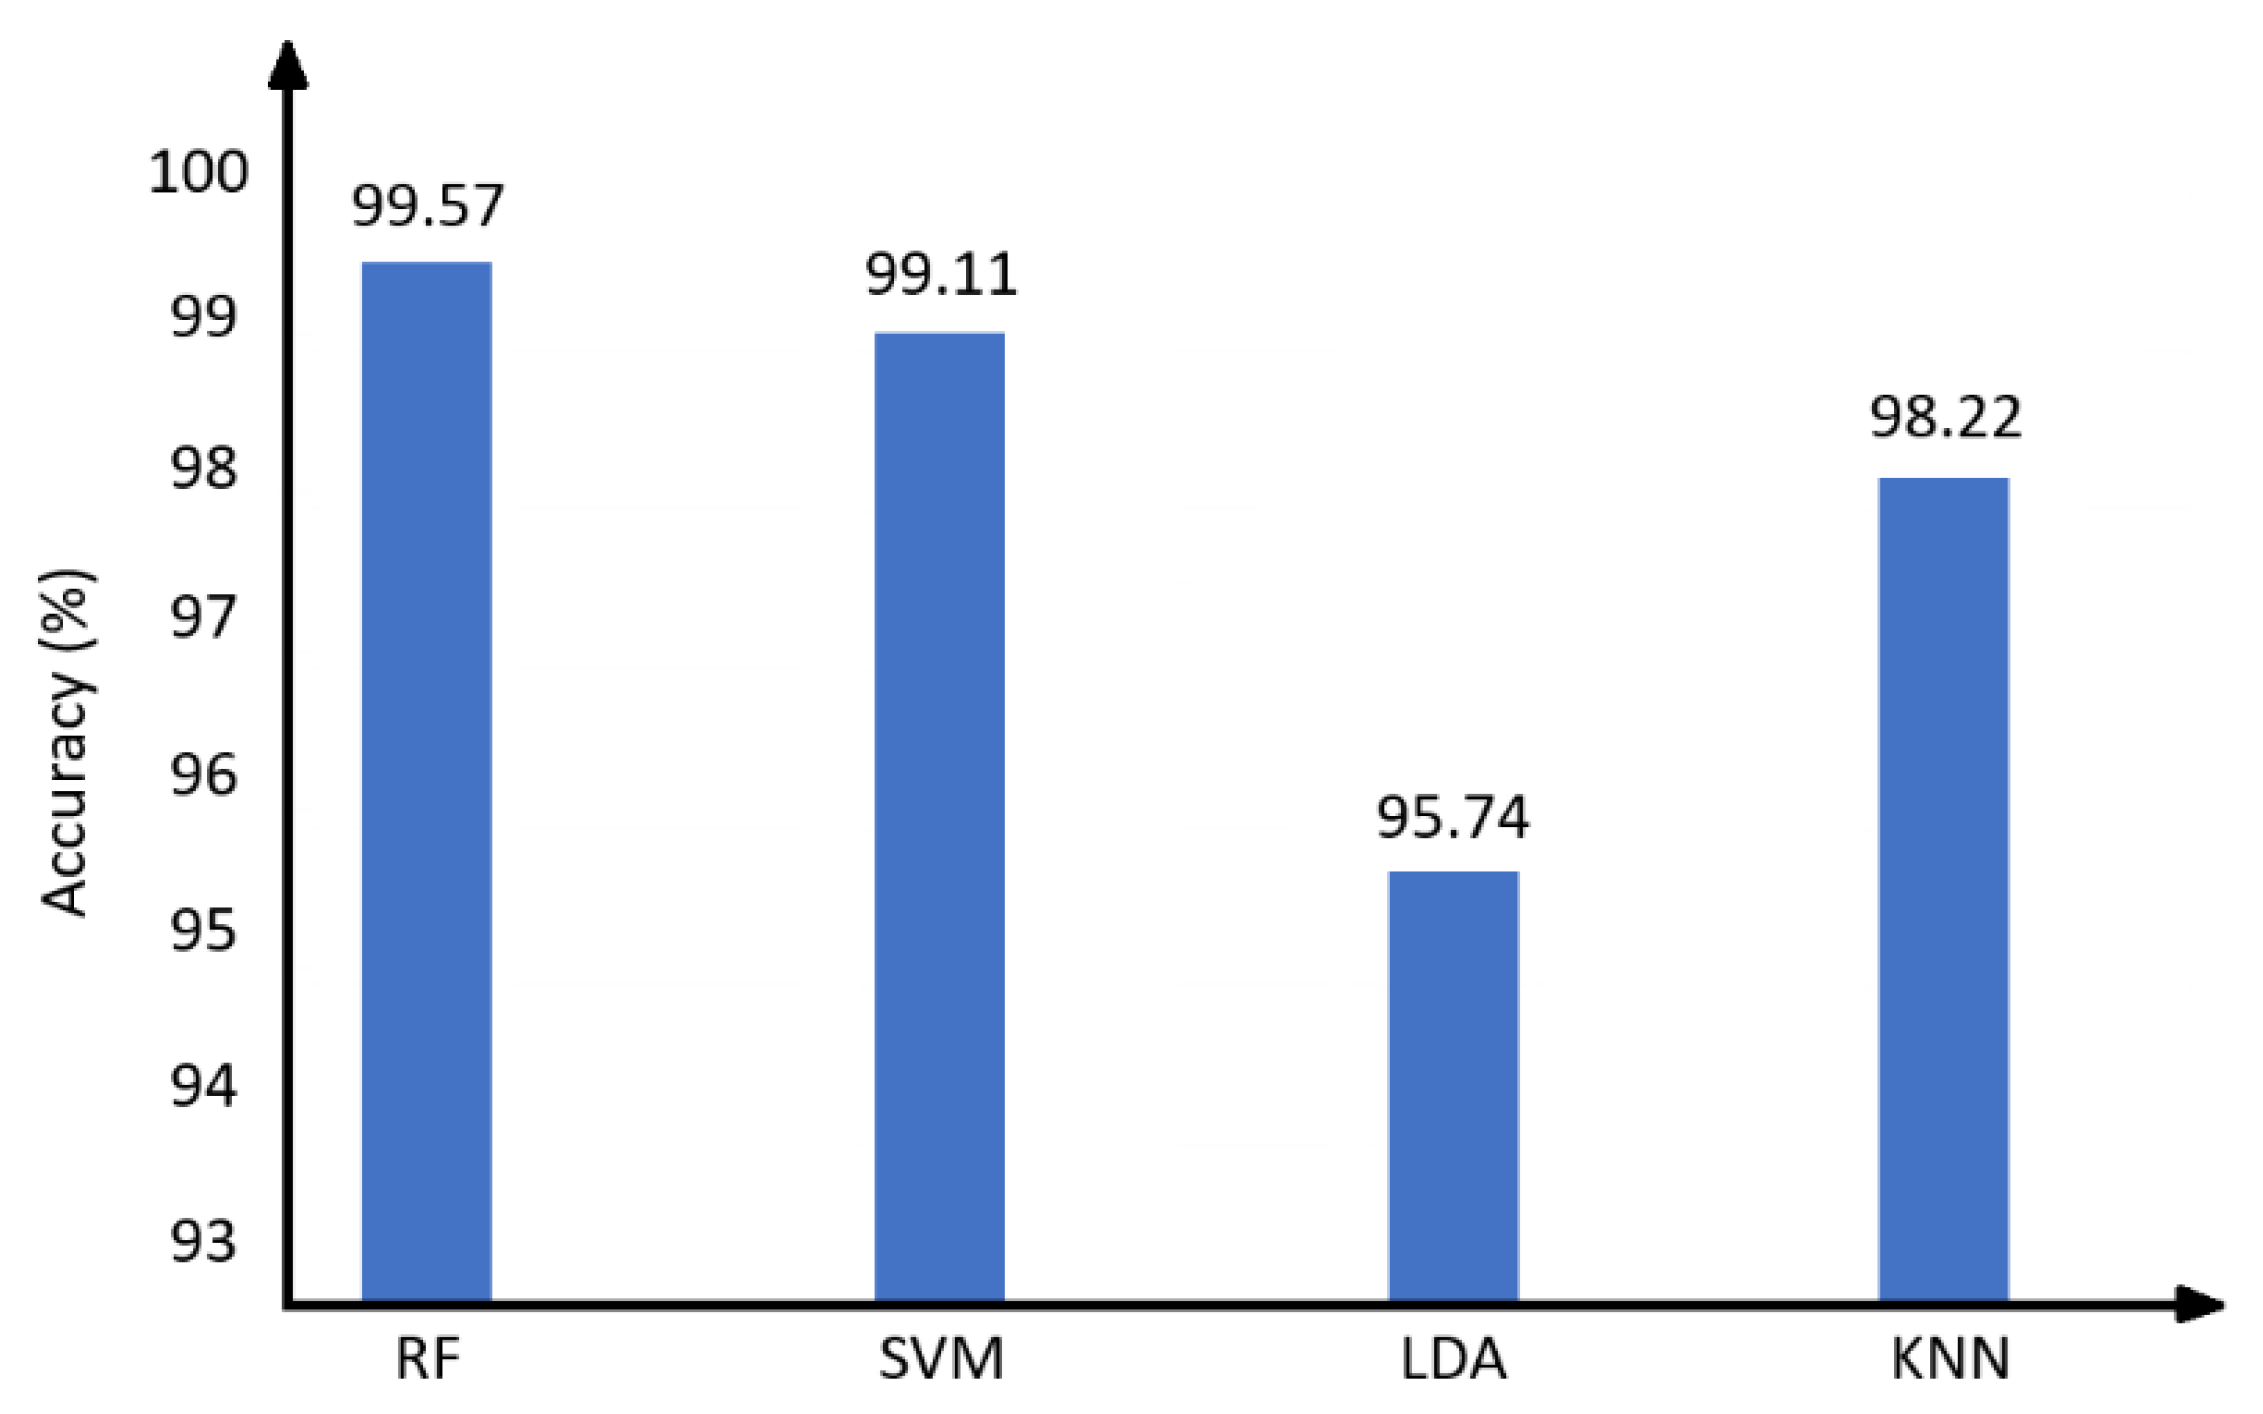
Figure 16.
Classification accuracy rate results for illuminated and non-illuminated data.
Figure 16.
Classification accuracy rate results for illuminated and non-illuminated data.
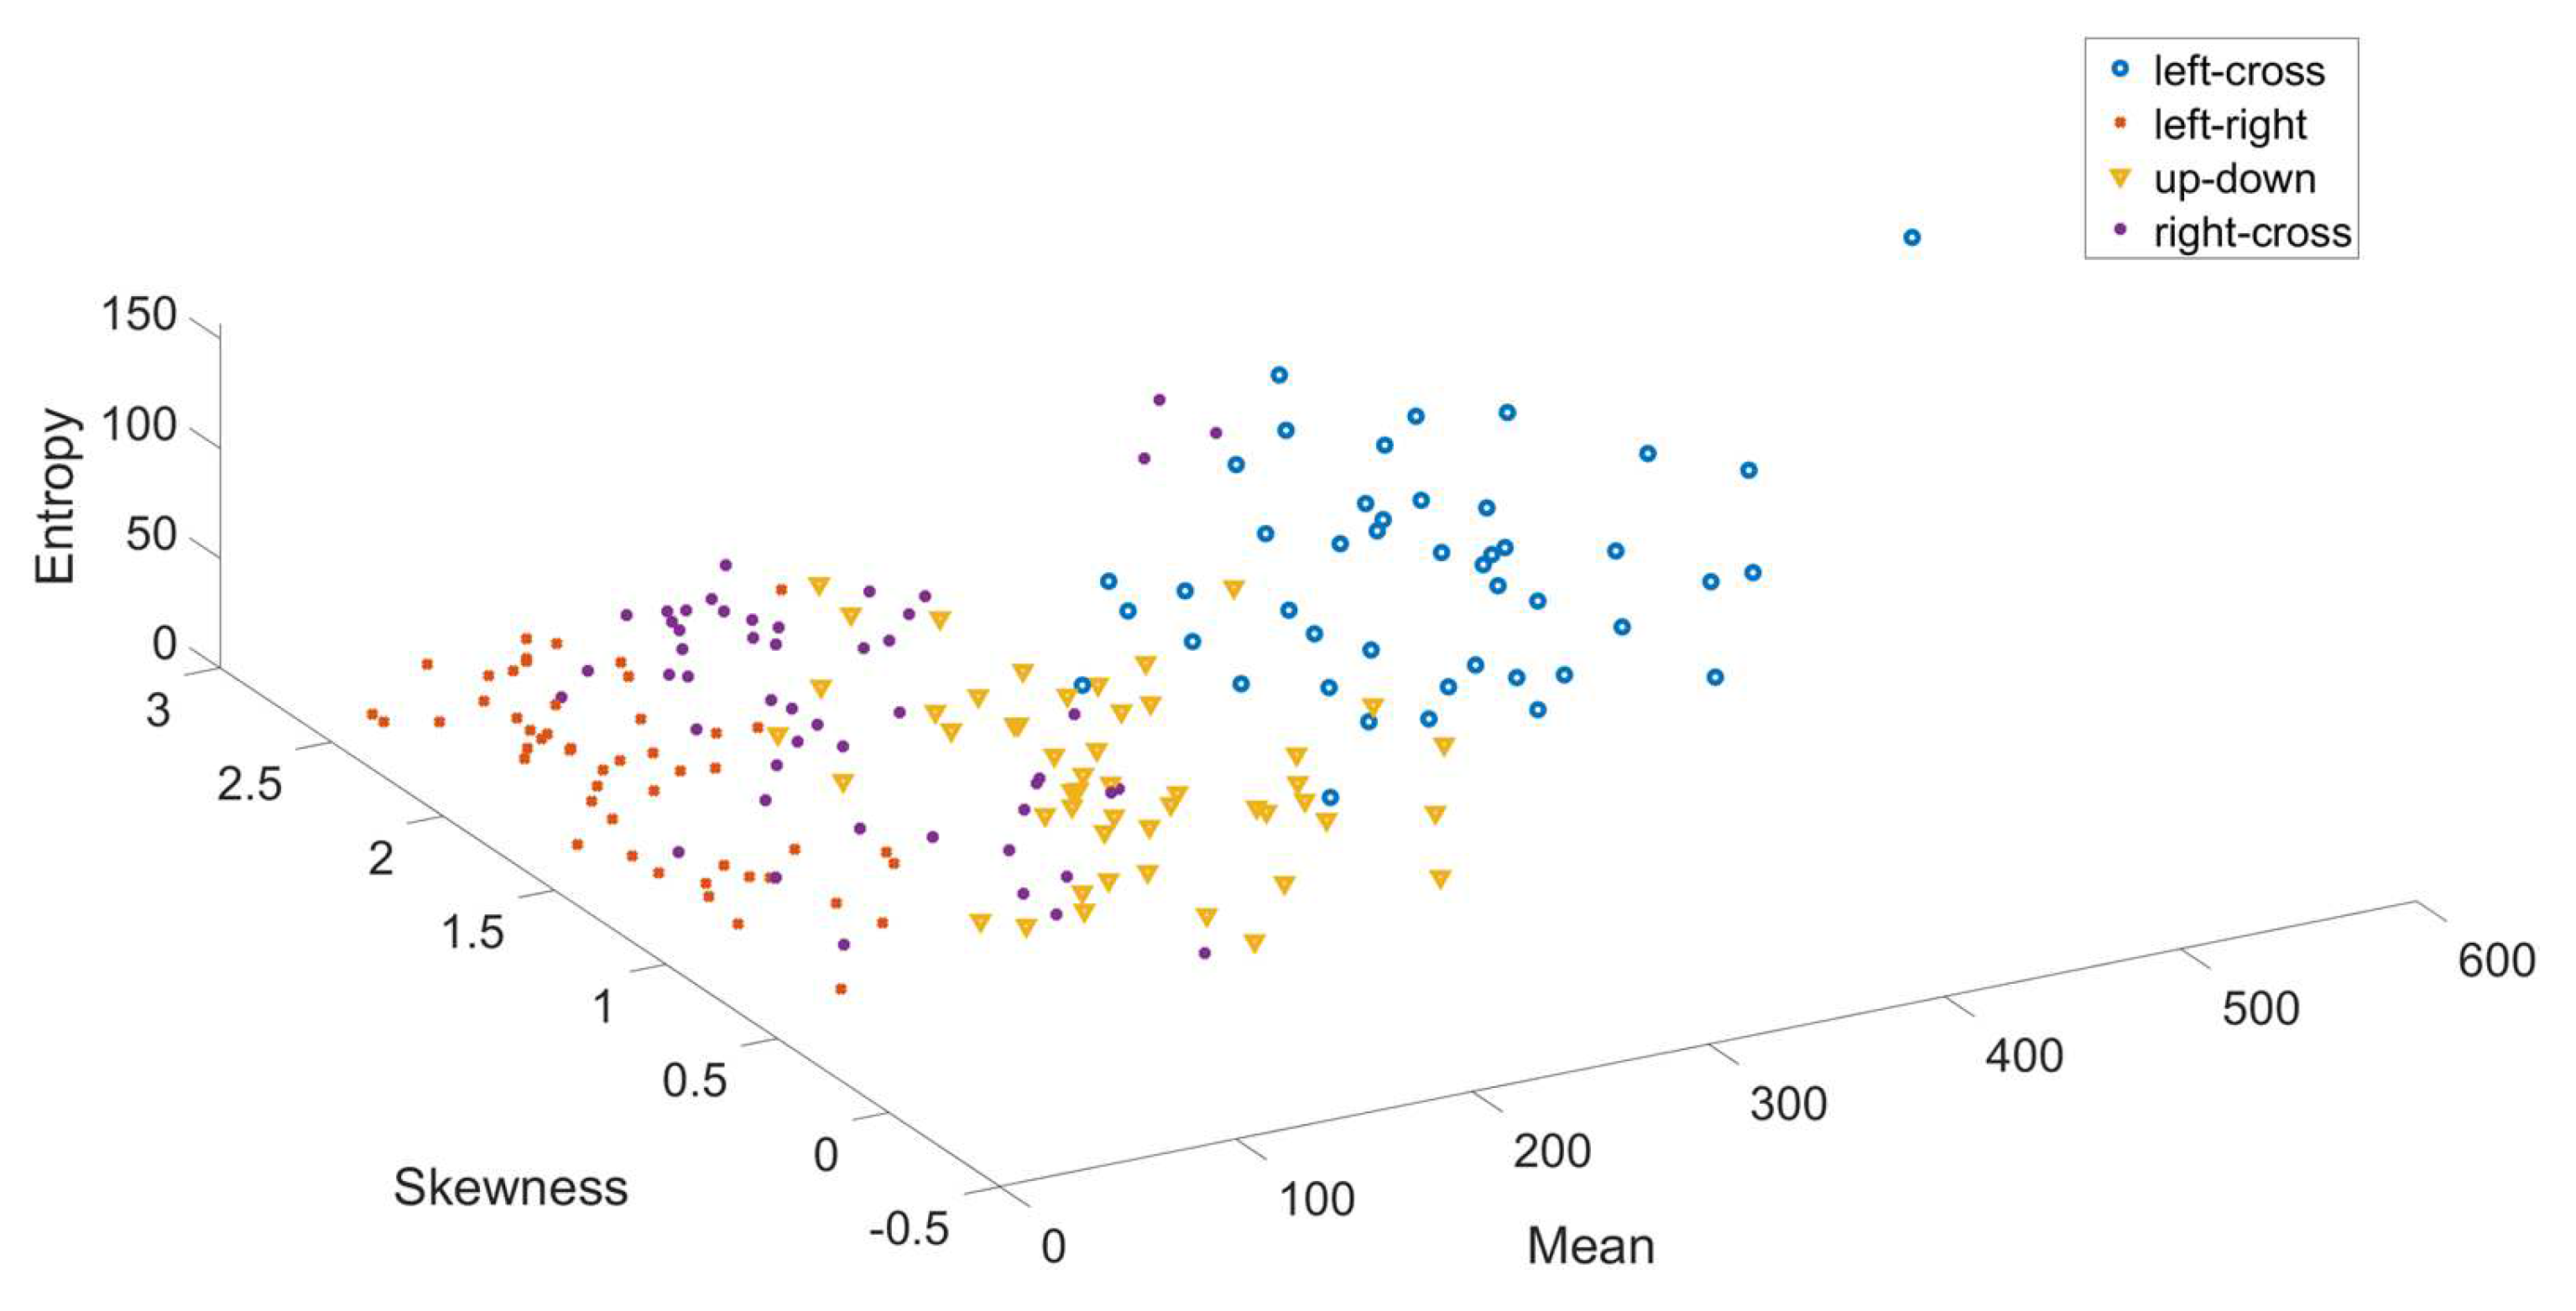
Figure 17.
3D scatter plot of entropy, skewness, and mean features for illuminated data from channel AF3.
Figure 17.
3D scatter plot of entropy, skewness, and mean features for illuminated data from channel AF3.
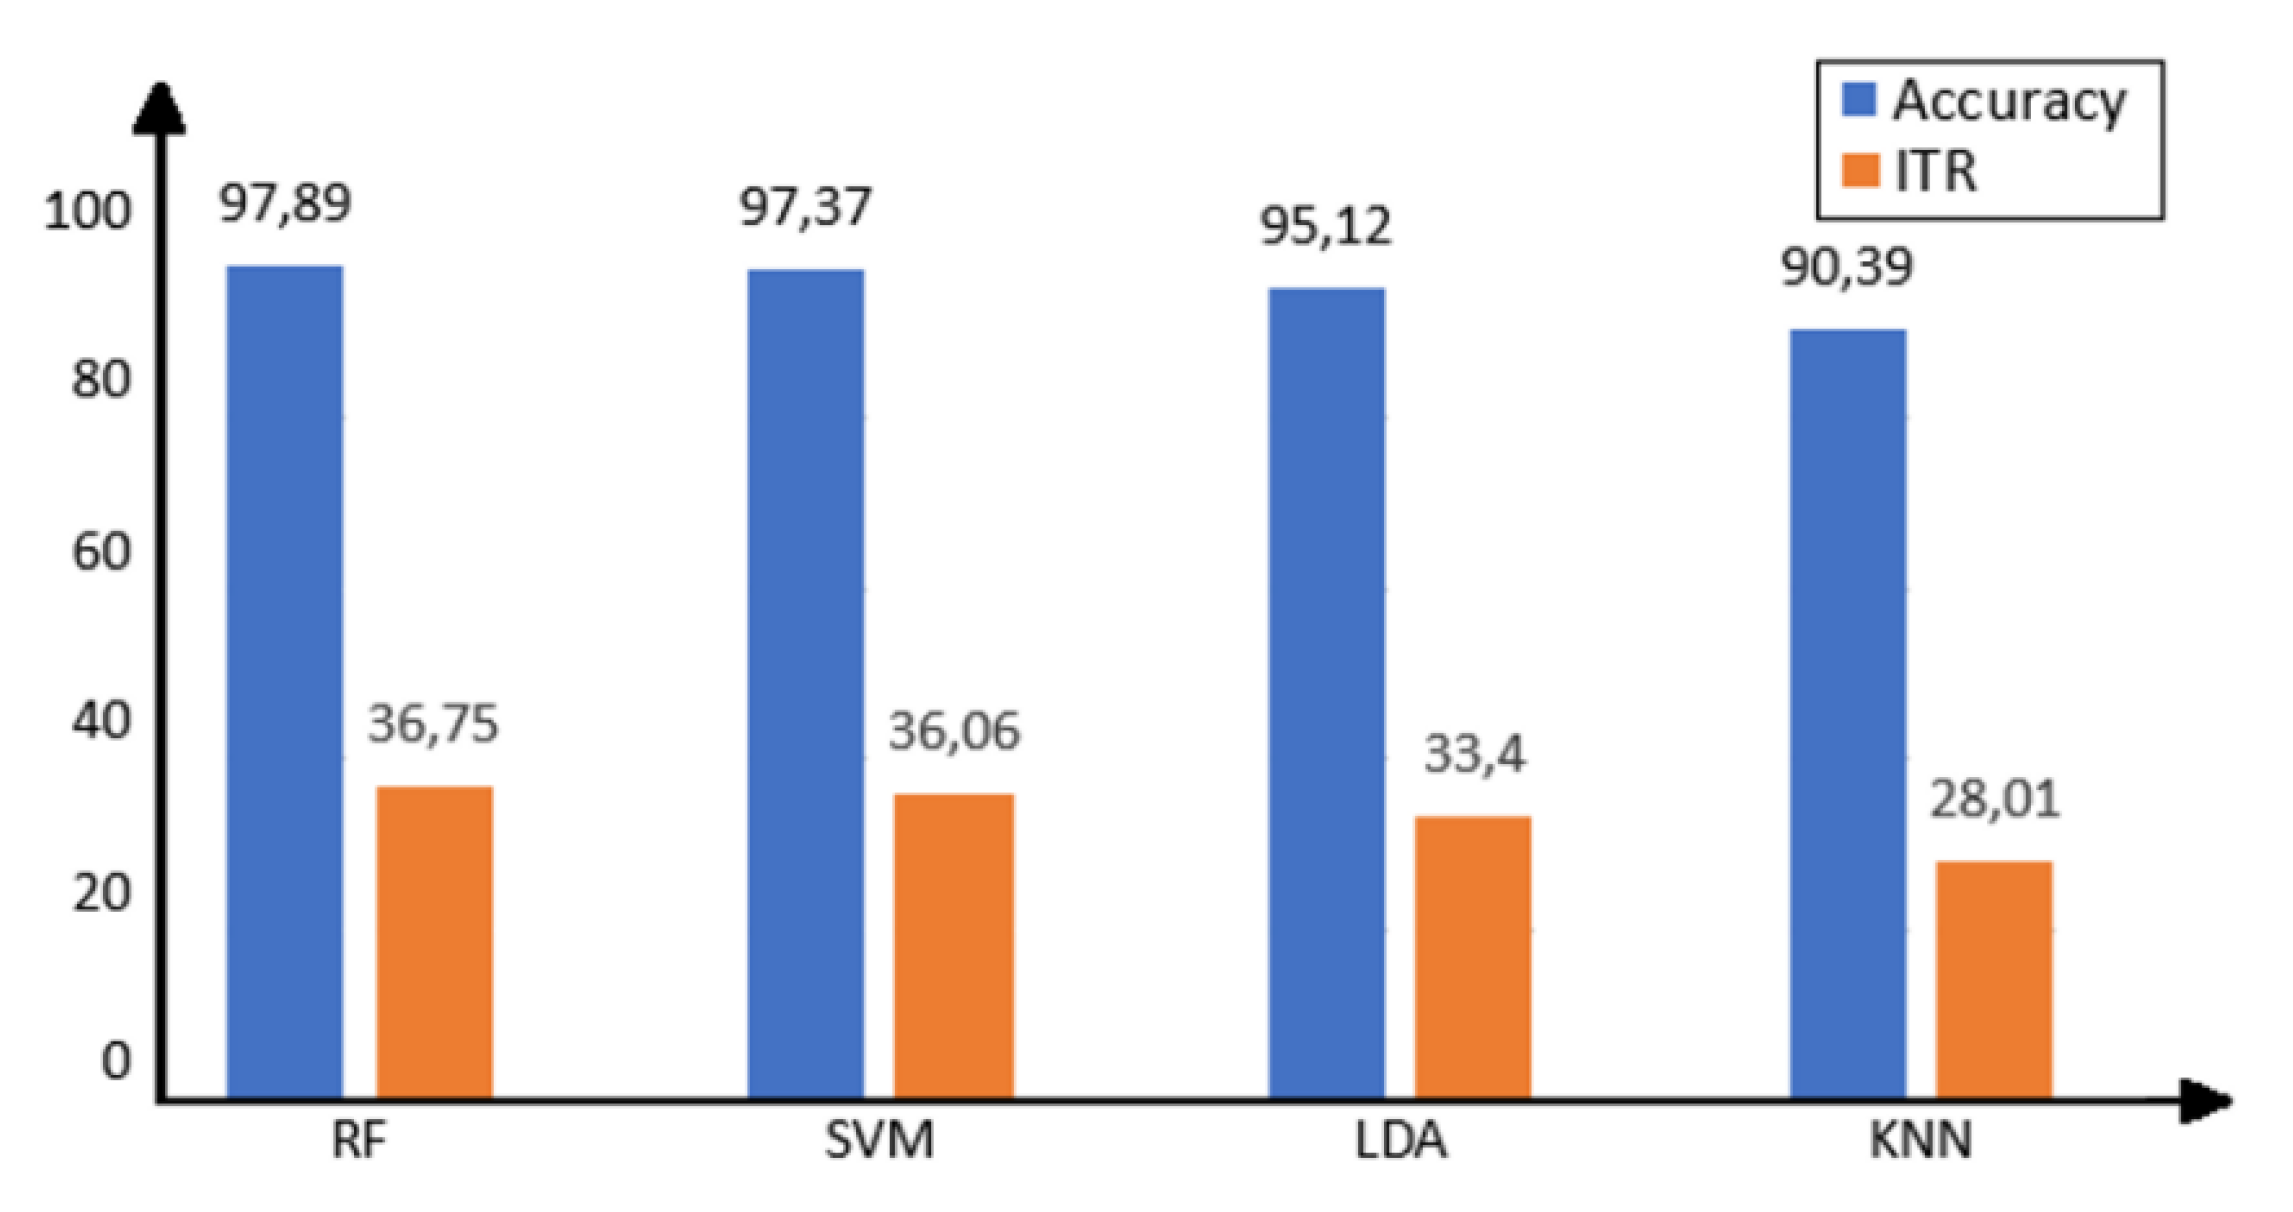
Figure 18.
Classification results of illuminated data.
Figure 18.
Classification results of illuminated data.
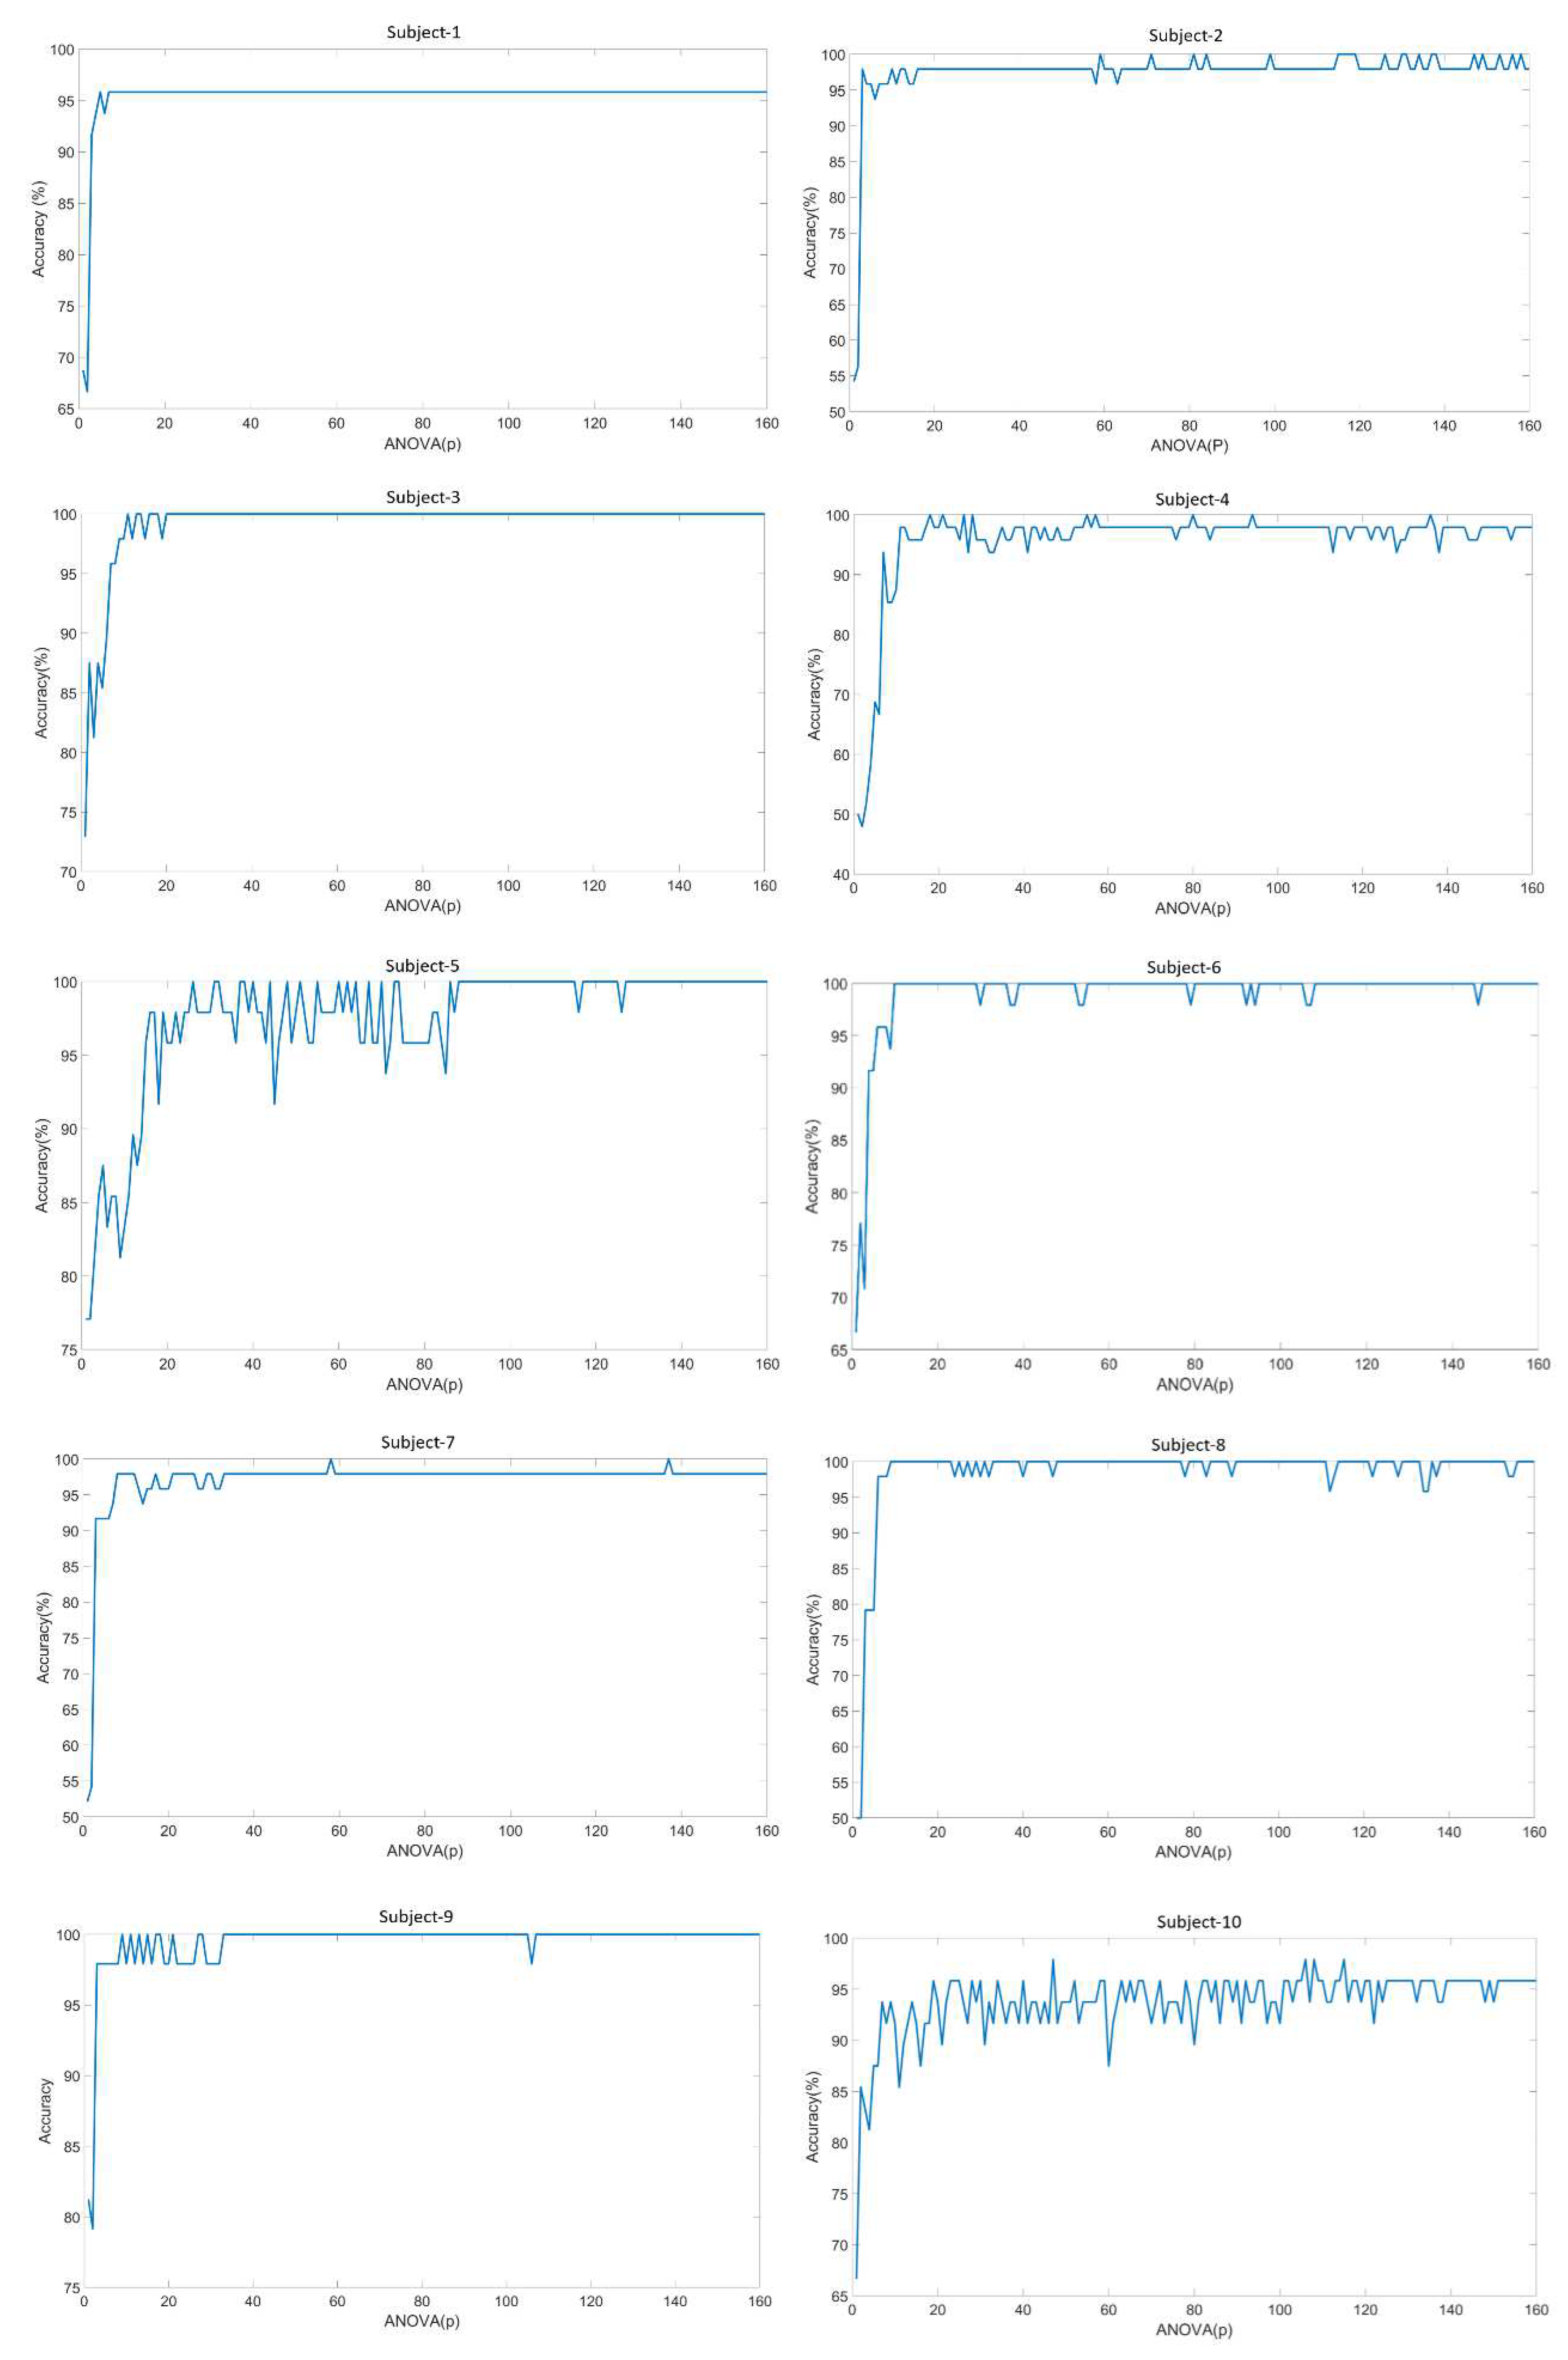
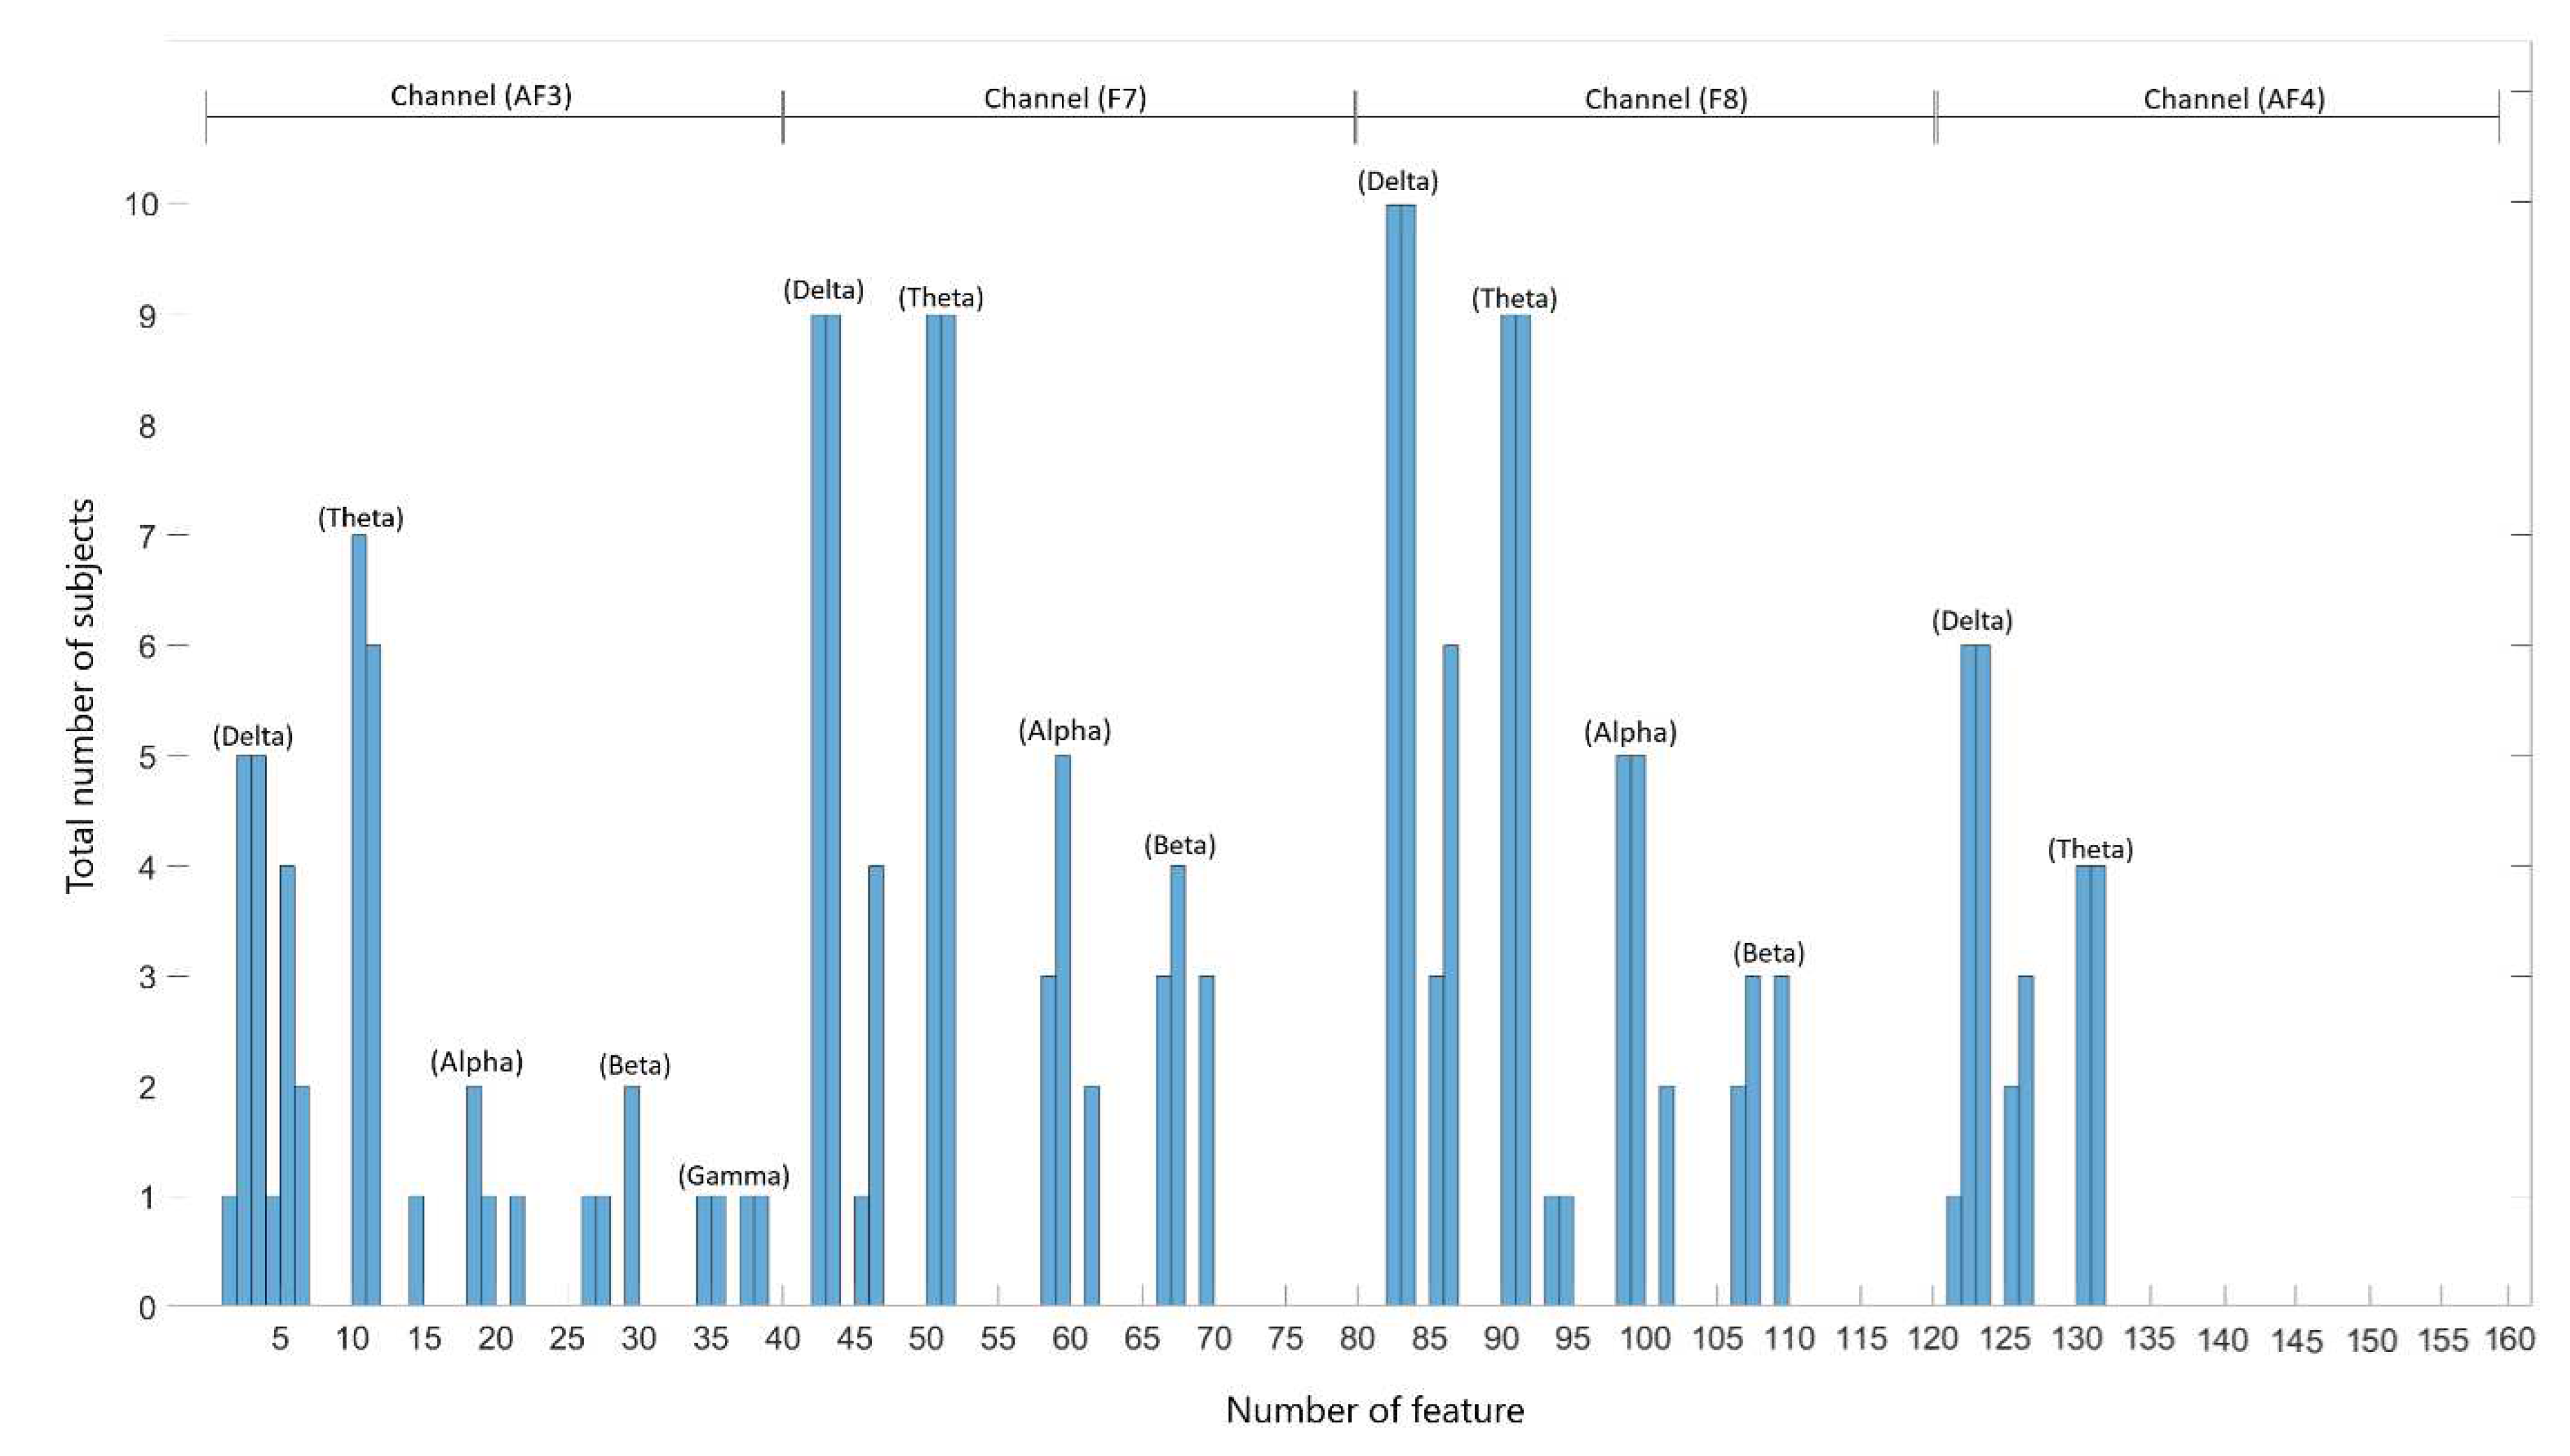
Figure 19.
When the 160 features are ranked according to their ANOVA scores, the number of occurrences of the top 20 features with the highest ANOVA scores in the participants.
Figure 19.
When the 160 features are ranked according to their ANOVA scores, the number of occurrences of the top 20 features with the highest ANOVA scores in the participants.
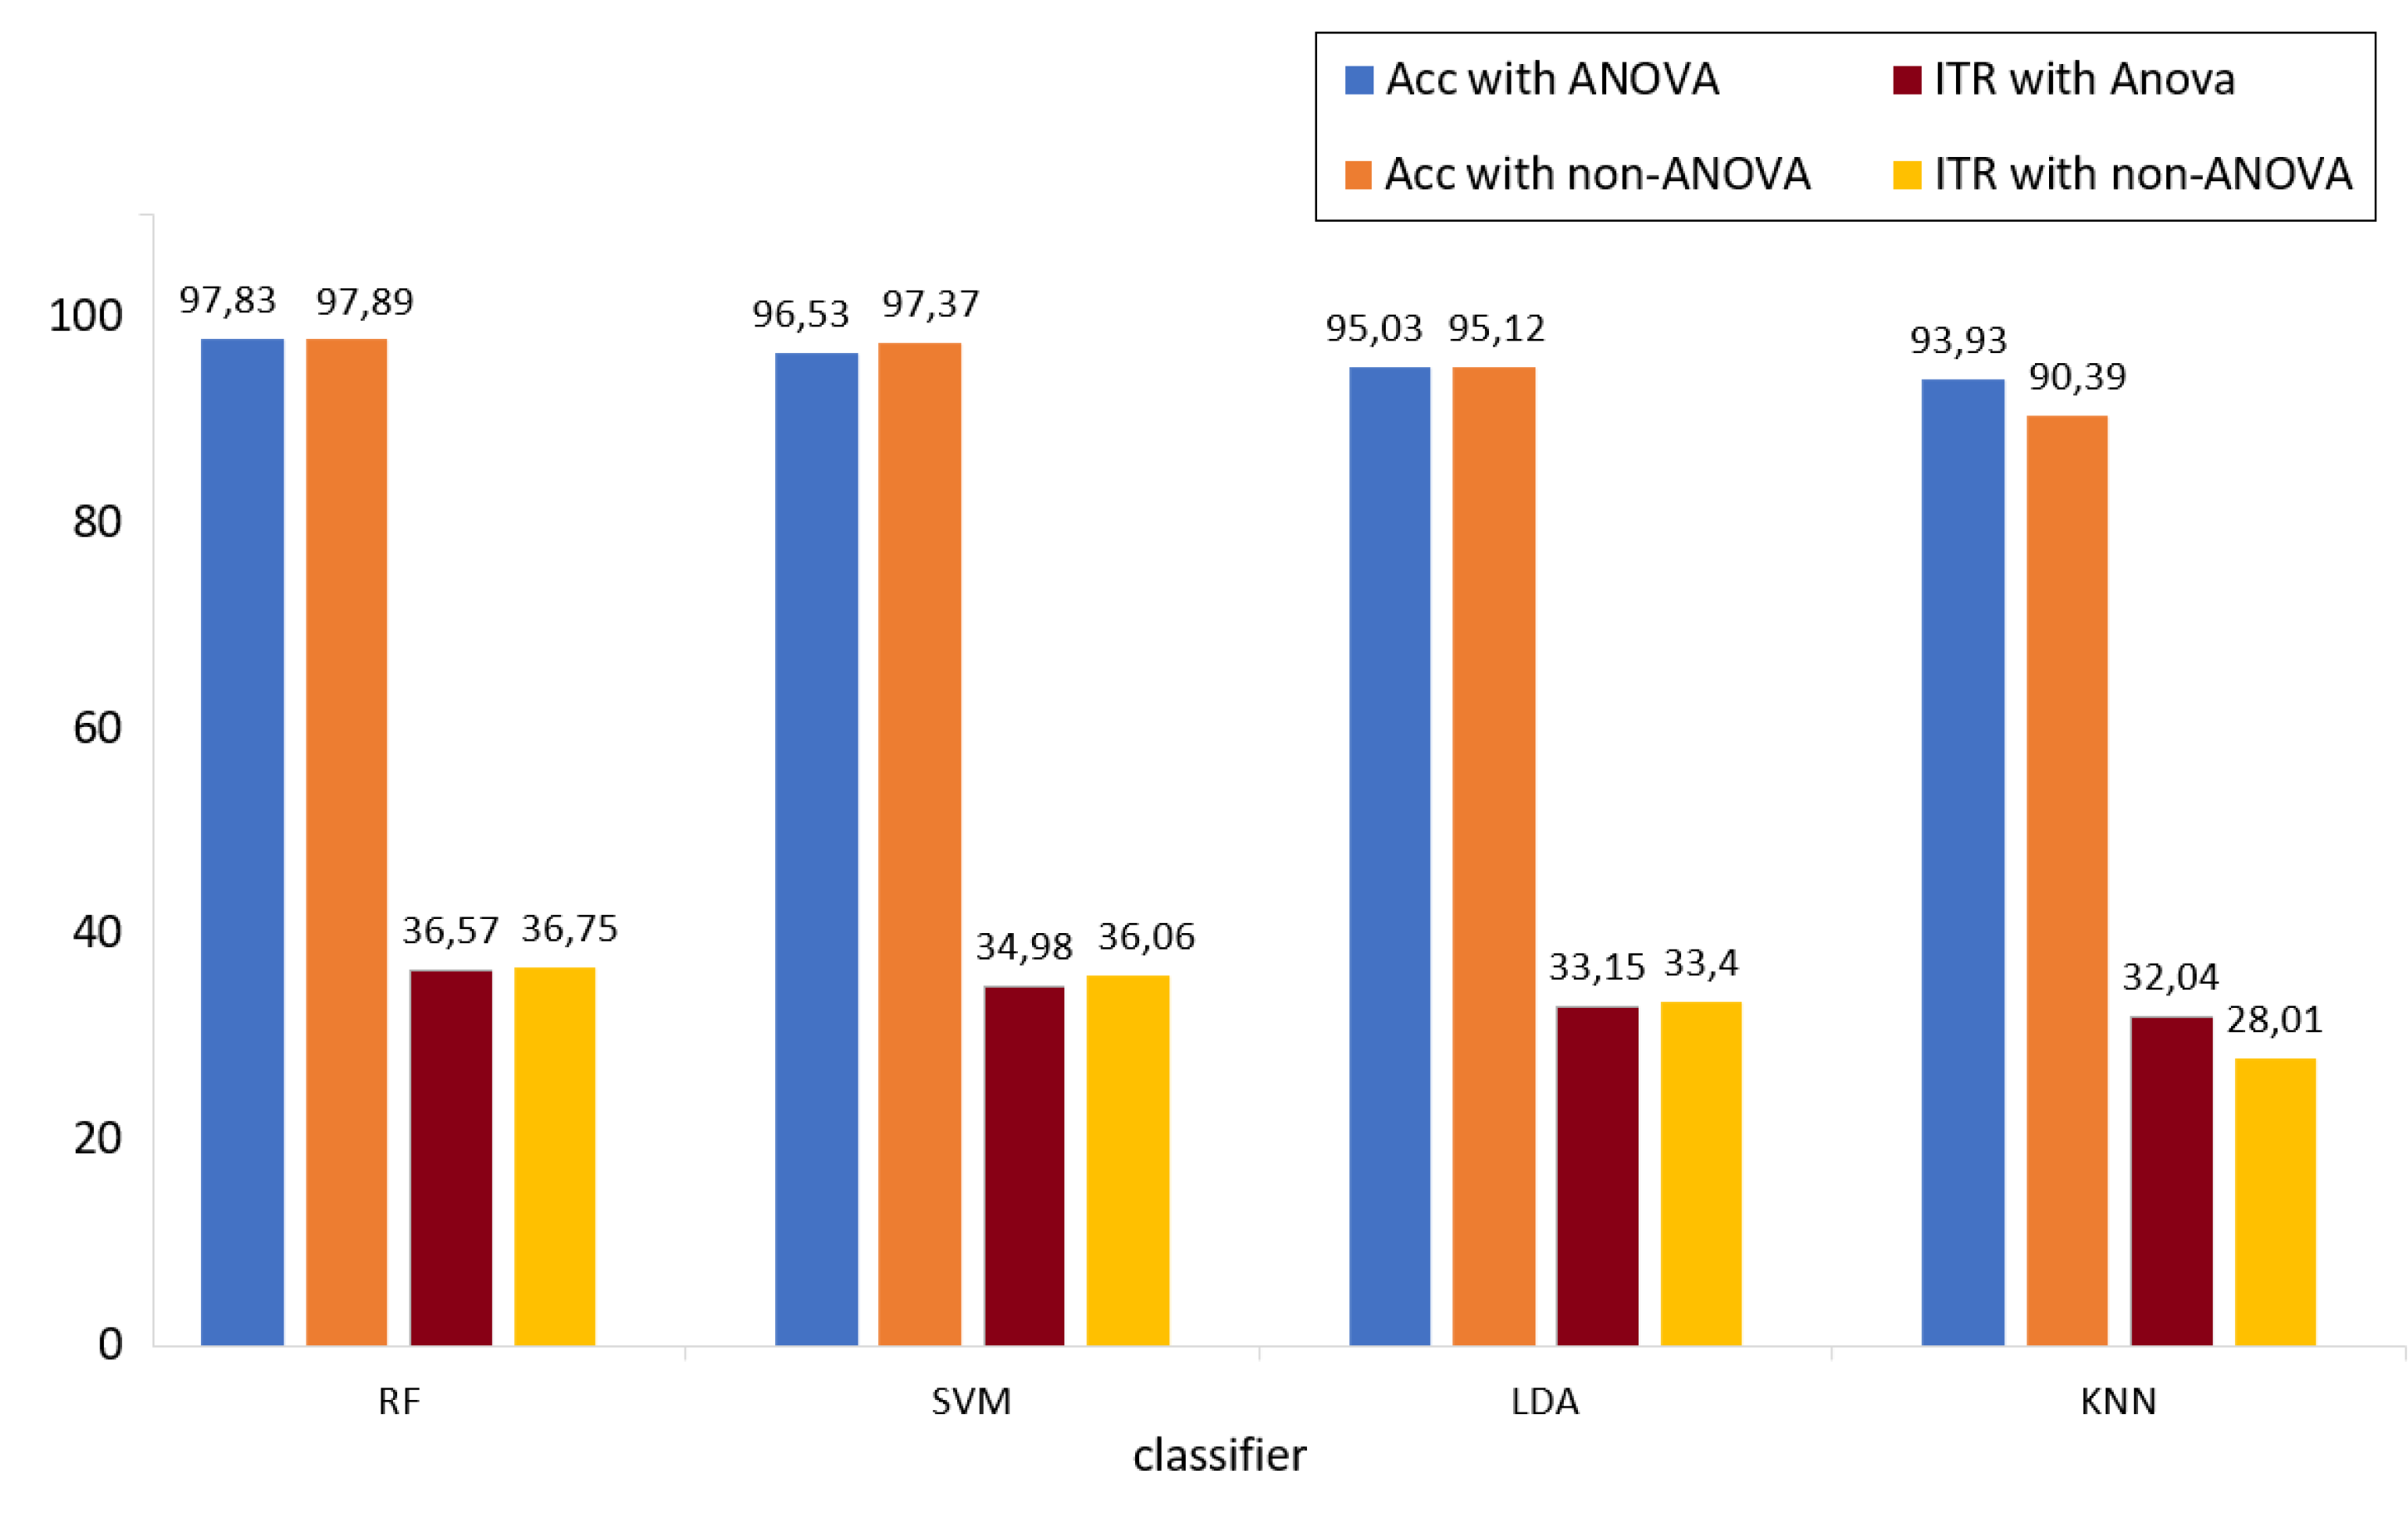
Figure 20.
Comparison of the results of the illuminated (moving objects) classification stage before and after ANOVA accuracy rate and ITR value.
Figure 20.
Comparison of the results of the illuminated (moving objects) classification stage before and after ANOVA accuracy rate and ITR value.
Table 1.
Characteristics of EEG wave bands.
Table 1.
Characteristics of EEG wave bands.
| Wave |
Frequency Range (Hz) |
Amplitude Range (μV) |
| Delta (δ) |
0.5-4 |
1-120 |
| Theta (θ) |
4-7 |
20-100 |
| Alfa (α) |
7-12 |
30-50 |
| Beta (β) |
12-30 |
5-30 |
| Gamma (γ) |
30+ |
variable |
Table 2.
Maximum eye angles of the subject on the X-Y axes as a function of Z distance.
Table 2.
Maximum eye angles of the subject on the X-Y axes as a function of Z distance.
| Axis |
X |
Y |
Z |
| Distance (cm) |
61 |
34 |
120 |
| Gaze Angle (°) |
28.5 |
16.1 |
- |
Table 3.
Angle changes caused by movement trajectories in the eye axes.
Table 3.
Angle changes caused by movement trajectories in the eye axes.
| Trajectory |
X axis |
Y axis |
| Right-left |
right |
left |
right |
left |
| +14,2 |
-14,2 |
0 |
0 |
| Up-down |
up |
down |
up |
down |
| 0 |
0 |
+8,1 |
-8,1 |
| Right-cross |
top right |
bottom left |
top right |
bottom left |
| +14,2 |
-14,2 |
+8,1 |
-8,1 |
| Left-cross |
top left |
bottom right |
top left |
bottom right |
| -14,2 |
+14,2 |
+8,1 |
-8,1 |
Table 4.
Classification accuracy rate results of Holdout test and training data of a randomly selected subject (subject-2) to measure the robustness of the system.
Table 4.
Classification accuracy rate results of Holdout test and training data of a randomly selected subject (subject-2) to measure the robustness of the system.
| Classifier |
Holdout data |
Trial -1 |
Trial-2 |
Trial-3 |
Trial-4 |
Trial-5 |
Trial-6 |
Trial-7 |
Trial-8 |
Trial-9 |
Trial-10 |
Avg. (%) |
| SVM |
train |
100.0 |
99.34 |
100.0 |
100.0 |
100.0 |
100.0 |
99.34 |
100.0 |
100.0 |
99.34 |
99.80 |
| test |
100.0 |
100.0 |
97.92 |
97.92 |
97.92 |
100.0 |
97.92 |
97.92 |
100.0 |
97.92 |
98.75 |
| k-NN |
train |
100.0 |
98.02 |
95.83 |
98.02 |
98.02 |
98.02 |
100.0 |
100.0 |
100.0 |
99.34 |
98.72 |
| test |
95.83 |
89.58 |
91.67 |
93.75 |
93.75 |
93.75 |
93.75 |
95.83 |
95.83 |
97.92 |
94.16 |
| LDA |
train |
98.68 |
99.34 |
99.34 |
100.0 |
99.34 |
99.34 |
98.68 |
99.34 |
100.0 |
99.34 |
99.34 |
| test |
97.92 |
100.0 |
100.0 |
100.0 |
100.0 |
97.92 |
97.92 |
97.92 |
97.92 |
97.92 |
98.75 |
| RF |
train |
99.34 |
100.0 |
100.0 |
100.0 |
100.0 |
100.0 |
100.0 |
100.0 |
100.0 |
100.0 |
99.93 |
| test |
100.0 |
100.0 |
95.83 |
100.0 |
95.83 |
97.92 |
97.92 |
97.92 |
100.0 |
100.0 |
98.54 |
Table 5.
Classification accuracy rates of illuminated and non-illuminated data using all features channels AF3, F7, F8, and AF4.
Table 5.
Classification accuracy rates of illuminated and non-illuminated data using all features channels AF3, F7, F8, and AF4.
| Classifier |
Classes |
Sub-1 |
Sub-2 |
Sub-3 |
Sub-4 |
Sub-5 |
Sub-6 |
Sub-7 |
Sub-8 |
Sub-9 |
Sub-10 |
Avg. (%) |
| SVM |
Class 1 |
100.0 |
100.0 |
99.37 |
100.0 |
99.68 |
97.50 |
100.0 |
100.0 |
100.0 |
99.37 |
99.59 |
| Class 2 |
97.08 |
100.0 |
100.0 |
100.0 |
100.0 |
100.0 |
95.20 |
95.41 |
98.75 |
100.0 |
98.64 |
| Acc. |
98.54 |
100.0 |
99.68 |
100.0 |
99.37 |
98.75 |
97.60 |
97.70 |
99.37 |
99.68 |
99.11 |
| k-NN |
Class 1 |
100.0 |
100.0 |
98.95 |
100.0 |
98.95 |
100.0 |
100.0 |
98.95 |
100.0 |
98.95 |
99.58 |
| Class 2 |
96.45 |
98.95 |
100.0 |
99.79 |
100.0 |
96.45 |
98.95 |
100.0 |
99.79 |
100.0 |
99.03 |
| Acc. |
98.22 |
99.47 |
99.79 |
99.89 |
99.47 |
98.22 |
99.47 |
99.79 |
99.89 |
99.47 |
99.30 |
| LDA |
Class 1 |
96.12 |
97.50 |
99.11 |
100.0 |
100.0 |
99.37 |
100.0 |
98.95 |
98.95 |
100.0 |
99.00 |
| Class 2 |
92.00 |
91.66 |
94.37 |
96.04 |
89.58 |
92.29 |
91.45 |
89.37 |
95.20 |
92.91 |
92.48 |
| Acc. |
94.06 |
94.58 |
96.74 |
98.02 |
94.79 |
95.83 |
95.72 |
94.16 |
97.07 |
96.45 |
95.74 |
| RF |
Class 1 |
100.0 |
99.37 |
100.0 |
99.79 |
100.0 |
99.68 |
99.79 |
98.95 |
100.0 |
98.95 |
99.65 |
| Class 2 |
100.0 |
100.0 |
98.54 |
100.0 |
99.37 |
98.75 |
100.0 |
100.0 |
98.33 |
100.0 |
99.49 |
| Acc. |
100.0 |
99.68 |
99.27 |
99.89 |
99.68 |
99.21 |
99.89 |
99.47 |
99.16 |
99.47 |
99.57 |
Table 6.
Illuminated data classification accuracy results using channels AF3, F7, F8, and AF4.
Table 6.
Illuminated data classification accuracy results using channels AF3, F7, F8, and AF4.
| Classifier |
Classes |
Sub-1 |
Sub-2 |
Sub-3 |
Sub-4 |
Sub-5 |
Sub-6 |
Sub-7 |
Sub-8 |
Sub-9 |
Sub-10 |
Avg. (%) |
| SVM |
Class 1 |
93.33 |
100.0 |
97.50 |
95.83 |
97.50 |
94.16 |
99.16 |
100.0 |
97.50 |
97.50 |
97.24 |
| Class 2 |
100.0 |
100.0 |
92.50 |
99.16 |
95.00 |
91.66 |
100.0 |
98.33 |
100.0 |
90.00 |
96.66 |
| Class 3 |
100.0 |
100.0 |
100.0 |
100.0 |
99.16 |
100.0 |
100.0 |
100.0 |
100.0 |
100.0 |
99.91 |
| Class 4 |
91.66 |
98.33 |
95.00 |
93.33 |
95.00 |
99.16 |
95.00 |
97.50 |
100.0 |
91.66 |
95.66 |
| Acc. |
96.25 |
99.58 |
96.25 |
97.08 |
96.66 |
96.25 |
98.54 |
98.95 |
99.37 |
94.79 |
97.37 |
| ITR |
34.44 |
39.28 |
34.46 |
35.52 |
35.04 |
34.58 |
37.66 |
38.20 |
38.92 |
32.58 |
36.06 |
| k-NN |
Class 1 |
89.58 |
98.33 |
83.33 |
100.0 |
91.67 |
91.67 |
91.67 |
70.83 |
78.33 |
98.33 |
89.37 |
| Class 2 |
93.64 |
90.83 |
91.67 |
91.67 |
83.33 |
75.00 |
83.33 |
100.0 |
91.25 |
75.83 |
87.65 |
| Class 3 |
100.0 |
100.0 |
100.0 |
100.0 |
100.0 |
100.0 |
100.0 |
100.0 |
100.0 |
100.0 |
100.0 |
| Class 4 |
95.83 |
87.50 |
83.33 |
75.00 |
75.00 |
91.67 |
91.67 |
83.33 |
77.08 |
85.00 |
84.54 |
| Acc. |
94.76 |
94.16 |
89.58 |
91.67 |
87.50 |
89.58 |
91.67 |
88.54 |
86.66 |
89.79 |
90.39 |
| ITR |
32.54 |
32.04 |
27.05 |
29.08 |
25.46 |
27.05 |
29.08 |
26.10 |
24.43 |
27.25 |
28.01 |
| LDA |
Class 1 |
83.33 |
100.0 |
100.0 |
95.00 |
100.0 |
89.16 |
90.0 |
96.66 |
100.0 |
94.16 |
94.83 |
| Class 2 |
93.33 |
100.0 |
91.66 |
92.50 |
96.66 |
83.33 |
95.83 |
97.50 |
98.33 |
70.00 |
91.91 |
| Class 3 |
100.0 |
100.0 |
100.0 |
100.0 |
100.0 |
100.0 |
100.0 |
100.0 |
100.0 |
100.0 |
100.0 |
| Class 4 |
90.00 |
95.00 |
100.0 |
95.00 |
81.66 |
95.83 |
95.83 |
97.50 |
91.66 |
95.00 |
93.74 |
| Acc. |
91.66 |
98.75 |
97.91 |
95.62 |
94.58 |
92.08 |
95.41 |
97.91 |
97.50 |
89.79 |
95.12 |
| ITR |
29.32 |
37.93 |
36.58 |
33.98 |
32.29 |
29.97 |
33.44 |
36.78 |
36.18 |
27.59 |
33.40 |
| RF |
Class 1 |
95.83 |
100.0 |
100.0 |
98.33 |
97.50 |
95.00 |
98.33 |
97.50 |
100.0 |
96.66 |
97.91 |
| Class 2 |
100.0 |
100.0 |
97.50 |
98.33 |
98.33 |
93.33 |
98.33 |
96.66 |
98.33 |
95.00 |
97.58 |
| Class 3 |
100.0 |
100.0 |
100.0 |
100.0 |
100.0 |
100.0 |
100.0 |
100.0 |
100.0 |
100.0 |
100.0 |
| Class 4 |
93.33 |
95.83 |
98.33 |
96.66 |
96.66 |
91.66 |
95.00 |
99.16 |
99.16 |
95.00 |
96.07 |
| Acc. |
97.29 |
98.96 |
98.95 |
98.33 |
98.12 |
95.00 |
97.91 |
98.33 |
99.37 |
96.66 |
97.89 |
| ITR |
35.88 |
38.20 |
38.20 |
37.30 |
37.06 |
32.91 |
36.78 |
37.42 |
39.00 |
34.80 |
36.75 |
Table 7.
Classification results of features obtained from illuminated data using ANOVA with channels AF3, F7, F8, and AF4.
Table 7.
Classification results of features obtained from illuminated data using ANOVA with channels AF3, F7, F8, and AF4.
| Classifier |
Classes |
Sub-1 |
Sub-2 |
Sub-3 |
Sub-4 |
Sub-5 |
Sub-6 |
Sub-7 |
Sub-8 |
Sub-9 |
Sub-10 |
Avg. (%) |
| SVM |
Class 1 |
93.33 |
98.33 |
93.33 |
90.0 |
94.16 |
95.0 |
99.16 |
96.66 |
100.0 |
99.16 |
95.91 |
| Class 2 |
100.0 |
100.0 |
85.83 |
96.66 |
96.66 |
91.66 |
96.66 |
94.16 |
99.16 |
90.0 |
95.07 |
| Class 3 |
100.0 |
100.0 |
100.0 |
100.0 |
99.16 |
100.0 |
100.0 |
100.0 |
100.0 |
100.0 |
99.91 |
| Class 4 |
95.0 |
96.66 |
93.33 |
93.33 |
98.33 |
95.0 |
97.5 |
96.66 |
99.16 |
87.5 |
95.24 |
| Acc (%) |
97.08 |
98.75 |
93.12 |
95.0 |
97.08 |
95.41 |
98.33 |
96.87 |
99.58 |
94.16 |
96.53 |
| ITR |
35.44 |
37.93 |
30.79 |
32.91 |
35.79 |
33.43 |
37.21 |
35.25 |
39.28 |
31.81 |
34.98 |
| k-NN |
Class 1 |
97.5 |
100.0 |
96.66 |
97.5 |
91.66 |
92.5 |
90.0 |
93.33 |
92.5 |
99.16 |
95.08 |
| Class 2 |
79.16 |
99.16 |
91.66 |
99.16 |
91.66 |
80.0 |
87.5 |
90.0 |
95.83 |
85.83 |
89.99 |
| Class 3 |
100.0 |
100.0 |
100.0 |
100.0 |
100.0 |
100.0 |
100.0 |
100.0 |
100.0 |
100.0 |
100.0 |
| Class 4 |
90.0 |
95.83 |
95.83 |
95.83 |
73.33 |
91.66 |
90.0 |
90.83 |
96.66 |
86.66 |
90.66 |
| Acc (%) |
91.66 |
98.75 |
96.04 |
98.12 |
89.16 |
91.04 |
91.87 |
93.54 |
96.25 |
92.91 |
93.93 |
| ITR |
29.35 |
37.93 |
34.10 |
37.20 |
26.84 |
28.73 |
29.85 |
31.33 |
34.43 |
30.69 |
32.04 |
| LDA |
Class 1 |
86.66 |
97.5 |
98.33 |
92.5 |
95.83 |
90.0 |
93.33 |
90.0 |
99.16 |
91.66 |
93.49 |
| Class 2 |
95.83 |
98.33 |
85.0 |
95.0 |
99.16 |
86.66 |
97.5 |
92.5 |
96.66 |
83.33 |
92.99 |
| Class 3 |
100.0 |
100.0 |
100.0 |
100.0 |
100.0 |
100.0 |
100.0 |
100.0 |
100.0 |
100.0 |
100.0 |
| Class 4 |
88.33 |
99.16 |
85.83 |
92.5 |
86.66 |
90.0 |
95.83 |
98.33 |
100.0 |
100.0 |
93.66 |
| Acc (%) |
92.70 |
98.75 |
92.29 |
95.0 |
95.41 |
91.66 |
96.66 |
95.20 |
98.95 |
93.75 |
95.03 |
| ITR |
30.39 |
37.93 |
30.11 |
32.84 |
33.50 |
29.18 |
35.04 |
33.07 |
38.29 |
31.27 |
33.15 |
| RF |
Class 1 |
93.33 |
98.33 |
98.33 |
94.16 |
98.33 |
94.16 |
99.16 |
95.83 |
100.0 |
95.0 |
96.66 |
| Class 2 |
100.0 |
100.0 |
95.83 |
100.0 |
97.5 |
96.66 |
95.83 |
99.16 |
100.0 |
98.33 |
98.33 |
| Class 3 |
100.0 |
100.0 |
100.0 |
100.0 |
100.0 |
100.0 |
100.0 |
100.0 |
100.0 |
100.0 |
100.0 |
| Class 4 |
93.33 |
97.5 |
96.66 |
95.83 |
94.16 |
96.66 |
97.5 |
96.66 |
100.0 |
95.0 |
96.33 |
| Acc (%) |
96.66 |
98.95 |
97.70 |
97.5 |
97.5 |
96.87 |
98.12 |
97.91 |
100.0 |
97.08 |
97.83 |
| ITR |
35.01 |
38.20 |
36.22 |
36.04 |
36.15 |
35.28 |
36.94 |
36.58 |
40.0 |
35.35 |
36.57 |
Table 8.
General performance table of the system including all classification stages.
Table 8.
General performance table of the system including all classification stages.
| Classifier |
Parameter |
Sub-1 |
Sub-2 |
Sub-3 |
Sub-4 |
Sub-5 |
Sub-6 |
Sub-7 |
Sub-8 |
Sub-9 |
Sub-10 |
Avg. |
| SVM |
Acc. |
95.63 |
98.75 |
92.80 |
95.0 |
96.46 |
94.20 |
95.94 |
94.64 |
98.95 |
93.85 |
95.62 |
| ITR |
33.43 |
37.66 |
30.25 |
32.68 |
34.46 |
31.77 |
33.81 |
32.27 |
37.98 |
31.38 |
33,56 |
| k-NN |
Acc. |
90.00 |
98.22 |
95.83 |
98.01 |
88.68 |
89.41 |
91.38 |
93.34 |
96.14 |
92.41 |
93.34 |
| ITR |
27.45 |
36.85 |
33.67 |
36.55 |
26.22 |
26.89 |
28.79 |
30.82 |
34.05 |
29.84 |
31,11 |
| LDA |
Acc. |
87.19 |
93.39 |
89.28 |
93.11 |
90.43 |
78.95 |
87.68 |
85.37 |
91.62 |
88.07 |
88.49 |
| ITR |
24.89 |
30.88 |
26.77 |
30.57 |
27.86 |
18.47 |
25.32 |
23.32 |
29.03 |
25.67 |
26.27 |
| RF |
Acc. |
96.66 |
98.63 |
96.98 |
97.39 |
97.18 |
96.10 |
98.01 |
97.39 |
99.16 |
96.56 |
97.42 |
| ITR |
34.71 |
37.47 |
35.13 |
35.68 |
35.40 |
34.01 |
36.55 |
35.68 |
38.33 |
34.58 |
35.75 |
Table 9.
Comparison of the current study with previous studies using the Emotiv EPOC EEG device.
Table 9.
Comparison of the current study with previous studies using the Emotiv EPOC EEG device.
| Ref. |
Year |
Method |
Datasets |
Number of participants |
Acc(%)
|
ITR(bits/min)
|
| [61] |
2024 |
SVM |
Own data |
3 |
90.1 |
27.3 |
| [62] |
2024 |
CNN |
Own data |
16 |
97.6 |
- |
| [63] |
2024 |
SVM |
Own data |
28 |
88.4 |
27.7 |
| [64] |
2023 |
R-CNN |
Own data |
4 |
84.0 |
15.8 |
| [65] |
2023 |
CNN-LSTM |
Guinea-Bissau and Nigeria epilepsy |
- |
92.5 |
- |
| [66] |
2023 |
k-NN |
arXiv (1901.02942) |
23 |
89.5 |
- |
| [67] |
2023 |
CNN |
Own data |
25 |
75.1 |
17.1 |
| [68] |
2022 |
SVM |
Own data |
15 |
91.0 |
28.4 |
| [35] |
2021 |
LSTM |
Own data |
5 |
96.9 |
40.3 |
| Our Work |
2024 |
RF |
Our data |
10 |
97.9 |
36.7 |