
Submitted:
10 February 2025
Posted:
13 February 2025
You are already at the latest version
Abstract
The investigation of solid waste around Port Harcourt, Rivers State Nigeria was carried out to acquire information on the condition of the soil and the types of waste as well as the nature of leachates produced within the environment. It aims at predicting hydrogeologic site conditions and contaminating transport potential. Samples were collected at three locations using hand auger at depths of 1 m, 2 m and 3 m and laboratory analyses conducted. Results of the soil analyses revealed medium grained sands with average permeability of 10-3mm3/s while the chemical analyses of leachates indicated high concentration of the waste derivates which have been degraded. Among the parameters measured, the average values of pH, 8.8; conductivities 1750 mS/cm and total dissolved solids (TDS)1150 mg/L of the boreholes (BHI, BH2 and BH3) are above the world health organization (WHO) standards of 8.0, 1500 mS/cm and 450 mg/L respectively. The government of Rivers State and Port Harcourt municipality should design, construct and control dumpsites and their associated leachates.
Keywords:
Borehole
; Conductivity
; Dissolved Solids
; Dumpsite
; Hand Auger
; Leachates
; Permeability
; Solid Waste
1.0. Introduction
The rapid urbanization and population growth in many developing cities, including Port Harcourt, Nigeria, have significantly intensified challenges regarding solid waste management. The inadequate management of solid waste poses serious threats to environmental integrity, public health, and urban sustainability (Gedefaw (2015). Rumueme, a suburban area within Port Harcourt, is notably affected by uncontrolled solid dumpsites, where various types of waste accumulate, leading to adverse environmental consequences. Such sites can generate harmful leachates and greenhouse gases (GHGs) while contributing to the proliferation of vector-borne diseases, particularly in low-income communities that often lack access to proper waste disposal methods (Nwugha et al., 2021).
Solid waste dumpsites are signs of highly populated environments that are actively involved in the use of solid materials (Birhanu and Berisa, 2015; Awino and Apitz, 2023). Chemicals both harmful and non-harmful are used up and discarded at any nearby dumpsite or even waterways. The ones that are not useful to them or those that have been used very well and the remaining are thrown to the dustbin. These dustbins at roadsides in many cities serve as dump sites. These open dump sites can cause severe impact on soil and groundwater quality and in turn affect human health.
In most cities in Nigeria, the environments are littered with solid wastes; they include bio-degradable and non-degradable wastes (Adekola et al., 2021). The indiscriminate dumping of refuse is usually disgusting to behold and generally pollutes the environment with toxic gases and destructive compounds, (Kebede, 2016).
As waste management is poorly organized, especially during the wet season, the rains carry most of these materials to nearby streams and rivers thereby contaminating the water body. Groundwater level is near to the ground surface in most parts of the south-south and southeast regions of Nigeria that they infiltrate into the groundwater body (Okeke et al., 2023a). People, through water from boreholes in various homes take in poisons that deteriorate their health (Besufekad, 2020).
There is a need to study the environments where dumpsites are located to find out the major substances contained in the soil and water to provide solutions to proper management of waste disposal.
The dumpsite is operational and serves as the main landfill site even as there are many settlers around it. The health of the people is at stake as the soil and water are prone to contamination since the quality affects the plants and animals within the vicinity (Okeke et al., 2023b). The danger is that groundwater is highly mobile in that it can affect people of distant communities (Beyene and Banerjee, 2011). The leachate may contain substances that are dangerous to humans, plants and animals.
This study aims to evaluate the environmental impacts of solid dumpsites in Rumueme by analyzing the physical, chemical, and biological characteristics of the accumulated waste and its effects on the surrounding environment. Understanding these impacts will provide critical data necessary for formulating effective waste management policies that can enhance urban environmental sustainability in Port Harcourt. Furthermore, the study will investigate community awareness regarding waste management practices and environmental health, identifying necessary interventions for education and improvement (Leveson, 1980).
The findings of this study are expected to underscore the pressing need for efficient waste management strategies and community involvement to mitigate the adverse effects of solid dumpsites, ultimately leading to improved living conditions for the residents of Rumueme and the wider Port Harcourt area.
1.1. Location, Topography, Climate And Drainage Pattern of the Area
The study area is the neighborhood around Amadi Street, off Ikwerre road at Mile 4 market, located in Port Harcourt the capital city of Rivers State in Nigeria. The topography is characterized by features such as: low-lying area, relatively flat and is prone to flooding, especially during the rainy season. The area is close to several rivers and tributaries which are part of the Niger Delta region. The area’s topography is heavily influenced by its location within this delta, with numerous creeks, lagoons and wetlands.
The soil in the area tend is alluvial, which is typical for delta regions. These soils are generally fertile but can vary in drainage capacity. As an urban area, Rumueme has undergone significant residential and commercial development, which includes roads, buildings, and other infrastructure. Urbanization has altered some of the natural topographical features. The climate is tropical characterized by High Humidity: The region experiences high humidity levels throughout the year due to its proximity to the Atlantic Ocean and numerous water bodies. The climatic condition of the study area is that of alternating dry and rainy seasons. The dry season is characterized by warm to high temperature which lasts from November to March while the wet season is cold weather, high humidity and low temperature that lasts from April to October with July and September often seeing the heaviest rainfall. During this period. Annual rainfall is over 180 cm (IIoeje, 1972).
The relief of the area is mainly flat lowlands with some areas showing a gentle undulating landscape developed on young sedimentary rocks with an average elevation of about 80 meters above sea level. Wogba River drains this area of Port Harcourt into the Atlantic Ocean in the south. The average annual temperature hovers around 25℃ to 32℃ with only slight variation throughout the year. The vegetation in Rumueme and its surroundings is largely influenced by its tropical climate and proximity to water bodies. The topography, climate and vegetation of Rumueme reflect its unique position within the Niger Delta and human development.
1.2. Geology and Hydrogeology of the Area
The study area is in the Niger Delta sedimentary Basin which is one of the largest deltas in the world. It is situated on the continental margin of the Gulf of Guinea in equatorial West Africa. It is between 3˚N and 6˚N and Longitudes 5˚E and 8˚E. It has Clastic fill of about 1200m (Etu-Efeotor,1997). Geology is primarily composed of recent pleistocene-age sediments. The dominant lithological units in the area are clays, silts, and sands, with each layer reflecting different depositional environments. The clays can be highly clastic, while sandy layers may pose stability challenges during construction due to the depositional environment, geological structures: fault lines, fractures due to tectonic activity associated with larger geological basin, fossil fuels. Hydrogeology is characterized by several aquifer systems formed within the deltaic sediments. The primary aquifers consist of sand layers interbedded with clay, which can vary in thickness and lateral continuity. The groundwater quality can be impacted by various factors, including urbanization, pollution from industrial activities, and oil spills, which are common due to the region’s oil extraction activities. Salinity intrusion can also occur due to proximity to the Atlantic Ocean. The hydraulic properties include higher permeability and high recharge and discharge with the multi aquifer systems with shallow and deep aquifers. The geology and hydrogeology of the area is marked by significant sedimentation and the presence of both freshwater aquifers and saltwater influence.
2.0. Materials and Method
The study was conducted at the dumpsite within Rumueme which has been operational for quite a long time and spans an area of about 10 m2.
2.1. Materials
Sampling equipment:
Water sampling kit consisting of sterilized bottles for water sampling; Soil Sampling Tools: Hand augers and soil cores for collection of soil samples; Electrodes: For vertical electrical sounding (VES) measurements; pH Meter: For measuring pH levels in soil and water samples. Weighing balance (Scale), Cans and Oven.
Conductivity Meter: For assessing electrical conductivity of water samples.
Chemical Reagent Kits: For desired chemical analyses (e.g., sulphate, sulphide, chloride).
Field sampling: Instruments and devices used for sample collection include hand gloves, safety boots, shovel, hand auger, black cellophane bags, plastic containers to collect leachate.
2.2. Methods
2.2.1. Water Sample Collection and Analysis
1. Sampling Locations: Water samples were collected from three places around the dumpsite.
2. Collection procedures: Water samples were collected using clean sterilized bottles, ensuring that samples were taken at varying depths to capture vertical stratification. Each collection was labelled, and the time and location were recorded.
3. Laboratory Analyses: The samples were analyzed within 24 hours of collection. The water samples were tested for the following chemical parameters: Electrical Conductivity (EC), pH, Dissolved Oxygen (DO), Total Dissolved Solids (TDS),
Chloride, Biochemical Oxygen Demand (BOD). Heavy metals (Lead, Cadmium and Arsenic).
Analytical techniques employed included (e.g., spectrophotometry, titration, atomic absorption spectroscopy) as per standard methods outlined in (reference to specific standard method guidelines, such as APHA).
2.2.2. Soil Sample Collection and Analysis
1. Sampling Techniques: Soil samples were collected using a hand auger from (number) locations with samples taken at depth intervals of 1 m, 2 m and 3 m.
2. Preparation and Testing: Collected soil samples were air-dried, sifted through a 2 mm mesh, and analyzed for: Soil pH, Electrical Conductivity (EC), Organic Matter Content, Nutrients (Nitrate and Phosphate). Trace Metals: Soil Texture (by hydrometeror sieve method)
Like water analyses, soil parameter assessments were done following (reference to standard methods).
2.2.3. Vertical Electrical Sounding (VES)
1. VES Methodology: Vertical electrical sounding was conducted using ABEM SAS 1000 Terrameter.
2. Electrode Arrangement: An electrode array of Schlumberger was established, with electrodes placed at intervals according to the spacing distance.
3. Data Acquisition: Measurements were recorded to determine the resistivity of subsurface materials, which aids in lithological interpretation. The process was repeated at different locations within the dumpsite.
4. Data Analysis: Resistivity data were analyzed using IPI2WIN to generate models of the subsurface lithology.
5. Data from all the measurements were analyzed by using software to analyze and describe the statistics (mean, standard deviation and correlations between soil and water quality parameters).
2.2.4. Laboratory Tests and Analyses
Procedure: mass of empty plastic containers was determined, then the weight of the container with the samples were also recorded. The sample was dried in air for about 12 hours, then the container and the sample were removed and weighed to determine the mass of dry sample. The moisture content was computed with this formula:
(i) Mass of container + wet soil - (mass of Container + dry soil) = mass of water (Mw or Ww)
(ii) Mass of dry Soil + Container- Mass of Container=Mass of dry soil (Ms or Ws)
Water content = (Mw/Ms) x 100
2.2.5. Wet Sieving
Wet sieving was carried out to determine the percentage of clay present in the soil sample.
The soil was put in the 200 cm mesh sieve and washed thoroughly with water to clearness and labeled.
The wet sample and Container were put in the oven to dry.
The dried sample and the container were weighed to determine the weight of the dry sample.
Clay Percentage (%) = mass passing – sieve 200 cm x 100/mass of sample after washing.
Sand Percentage (%) =mass retained on sieve 200 x 100/ Mass of sample before washing.
2.2.6. Particle Size Analysis
Procedure:
- i.
- Empty sieves were weighed and their weights recorded.
- ii.
- The oven dry soil from the wet sieving was used, the soil was pulverized to separate into individual grain sizes.
- iii.
- The stock of sieves was arranged with the pan at the bottom.
- iv.
- The sample was poured into the topmost sieve, covered with a lid and shaken for about ten minutes into various sizes.
- v.
- The individual sieves with their retained particles were weighed and results were recorded.
2.2.7. The Leachate Analysis:
The parameters analysed include Sulphate, Sulphide, pH, Conductivity, Total dissolved solid (TDS), Chloride and Biochemical oxygen demand.
Using a hand auger, soil samples were taken from each of the three locations within the dumpsite at intervals of one meter down to a depth of three meters. For use in laboratory experiments using black cellophanes, they were appropriately stored. At every borehole on the dumpsite, the leachates were gathered in bottles and transported to the lab within twenty-four hours. A weighing scale, an oven, and mesh sieves of different sizes are the fundamental tools used for the analysis.
The moisture content of the soil samples was determined using oven and weighing balance. The sample was kept in the oven for 24 hours heated to dryness to remove any water that may be in the sample and thereby determine the water or moisture content of the samples.
Wet sieving was done to determine the percentage of clay in the sample using 200 cm mesh sieves, weighing balance and water.
The fraction of clay content or mass passing through 200 cm sieve determines the sand content. The clay percentage is the amount of mass passing through sieve 200 cm multiplied by 100 of the total mass of samples. The sand percentage is the mass retained.
3.0. Results and Discussion
3.1. Moisture Content
In many environmental studies, such as those pertaining to waste management, groundwater recharge, and agricultural production, an understanding of the moisture content of soil is essential. This analysis will assess the moisture contents of soil samples taken from three different boreholes across three distinct locations. The measured moisture contents are expressed in percentage, reflecting the proportion of water present in the soil relative to its dry weight.
This is the amount of moisture in the soils at the dumpsite. The results are presented in Table 1.
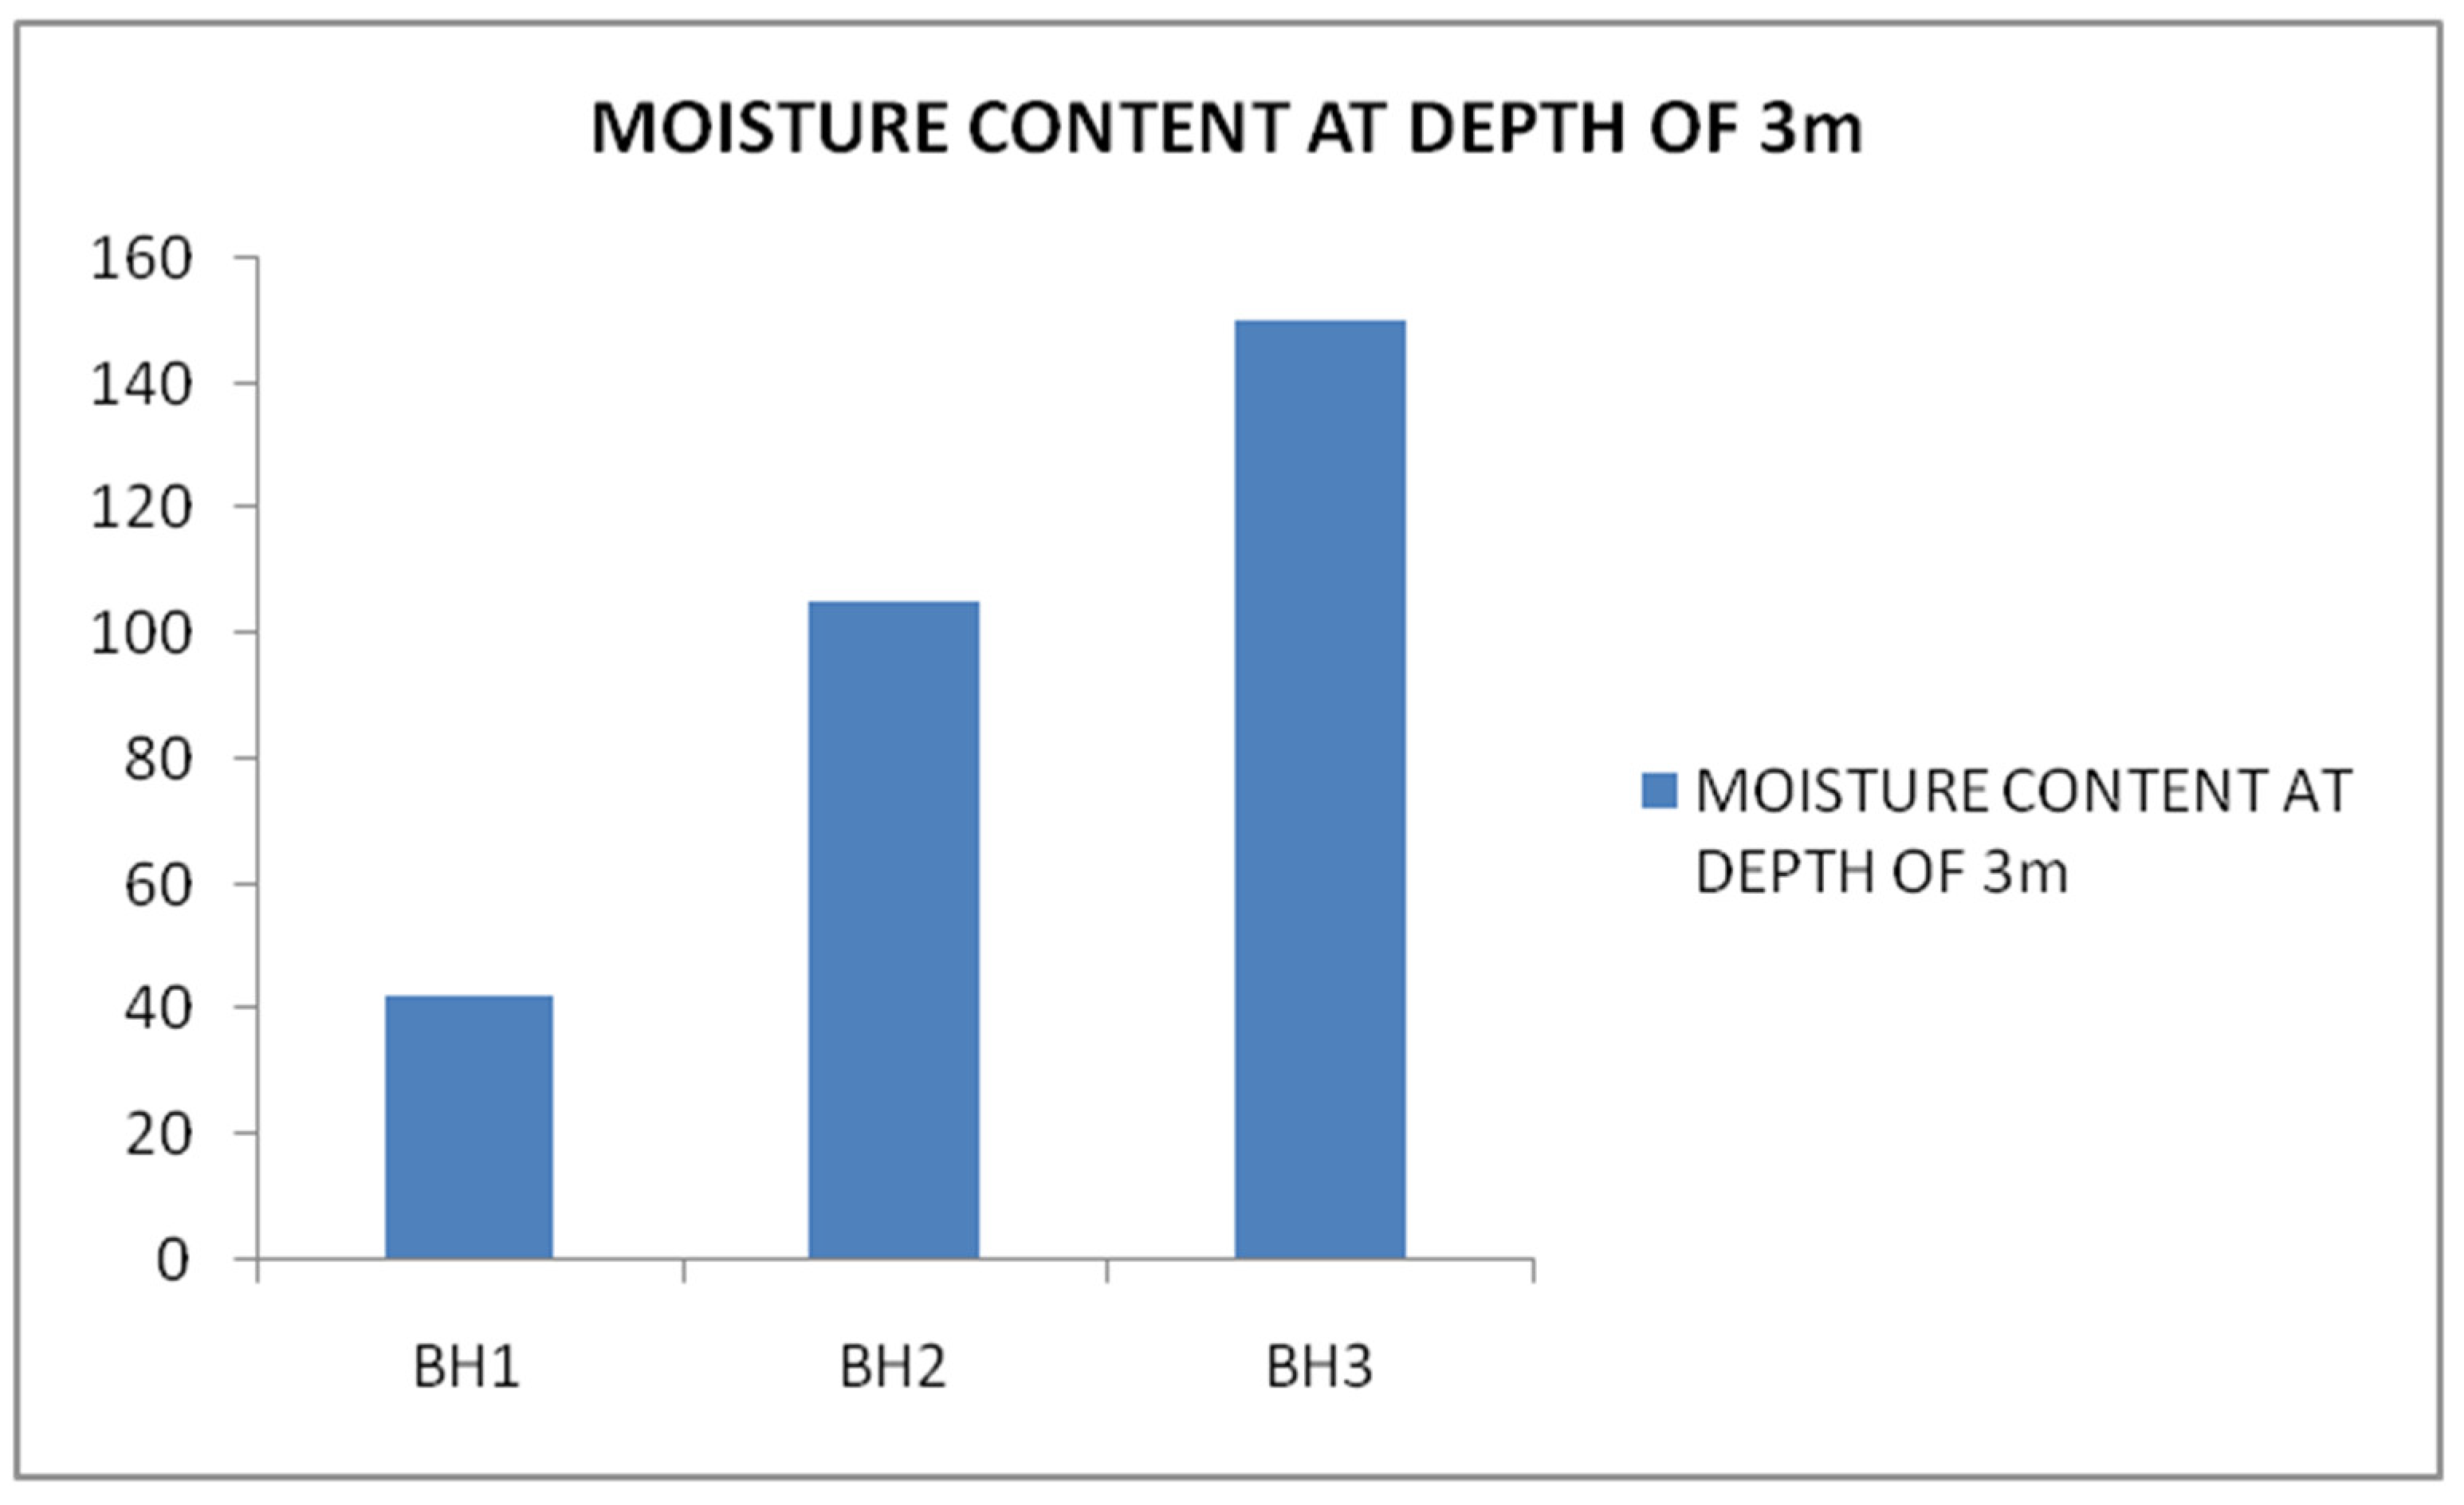
It was observed that the moisture content increases at depth as shown in Figure 1, Figure 2, and Figure 3. Additionally, the maximum water content was found in borehole 3 (BH3).
Figure 1.
Location of the study area.
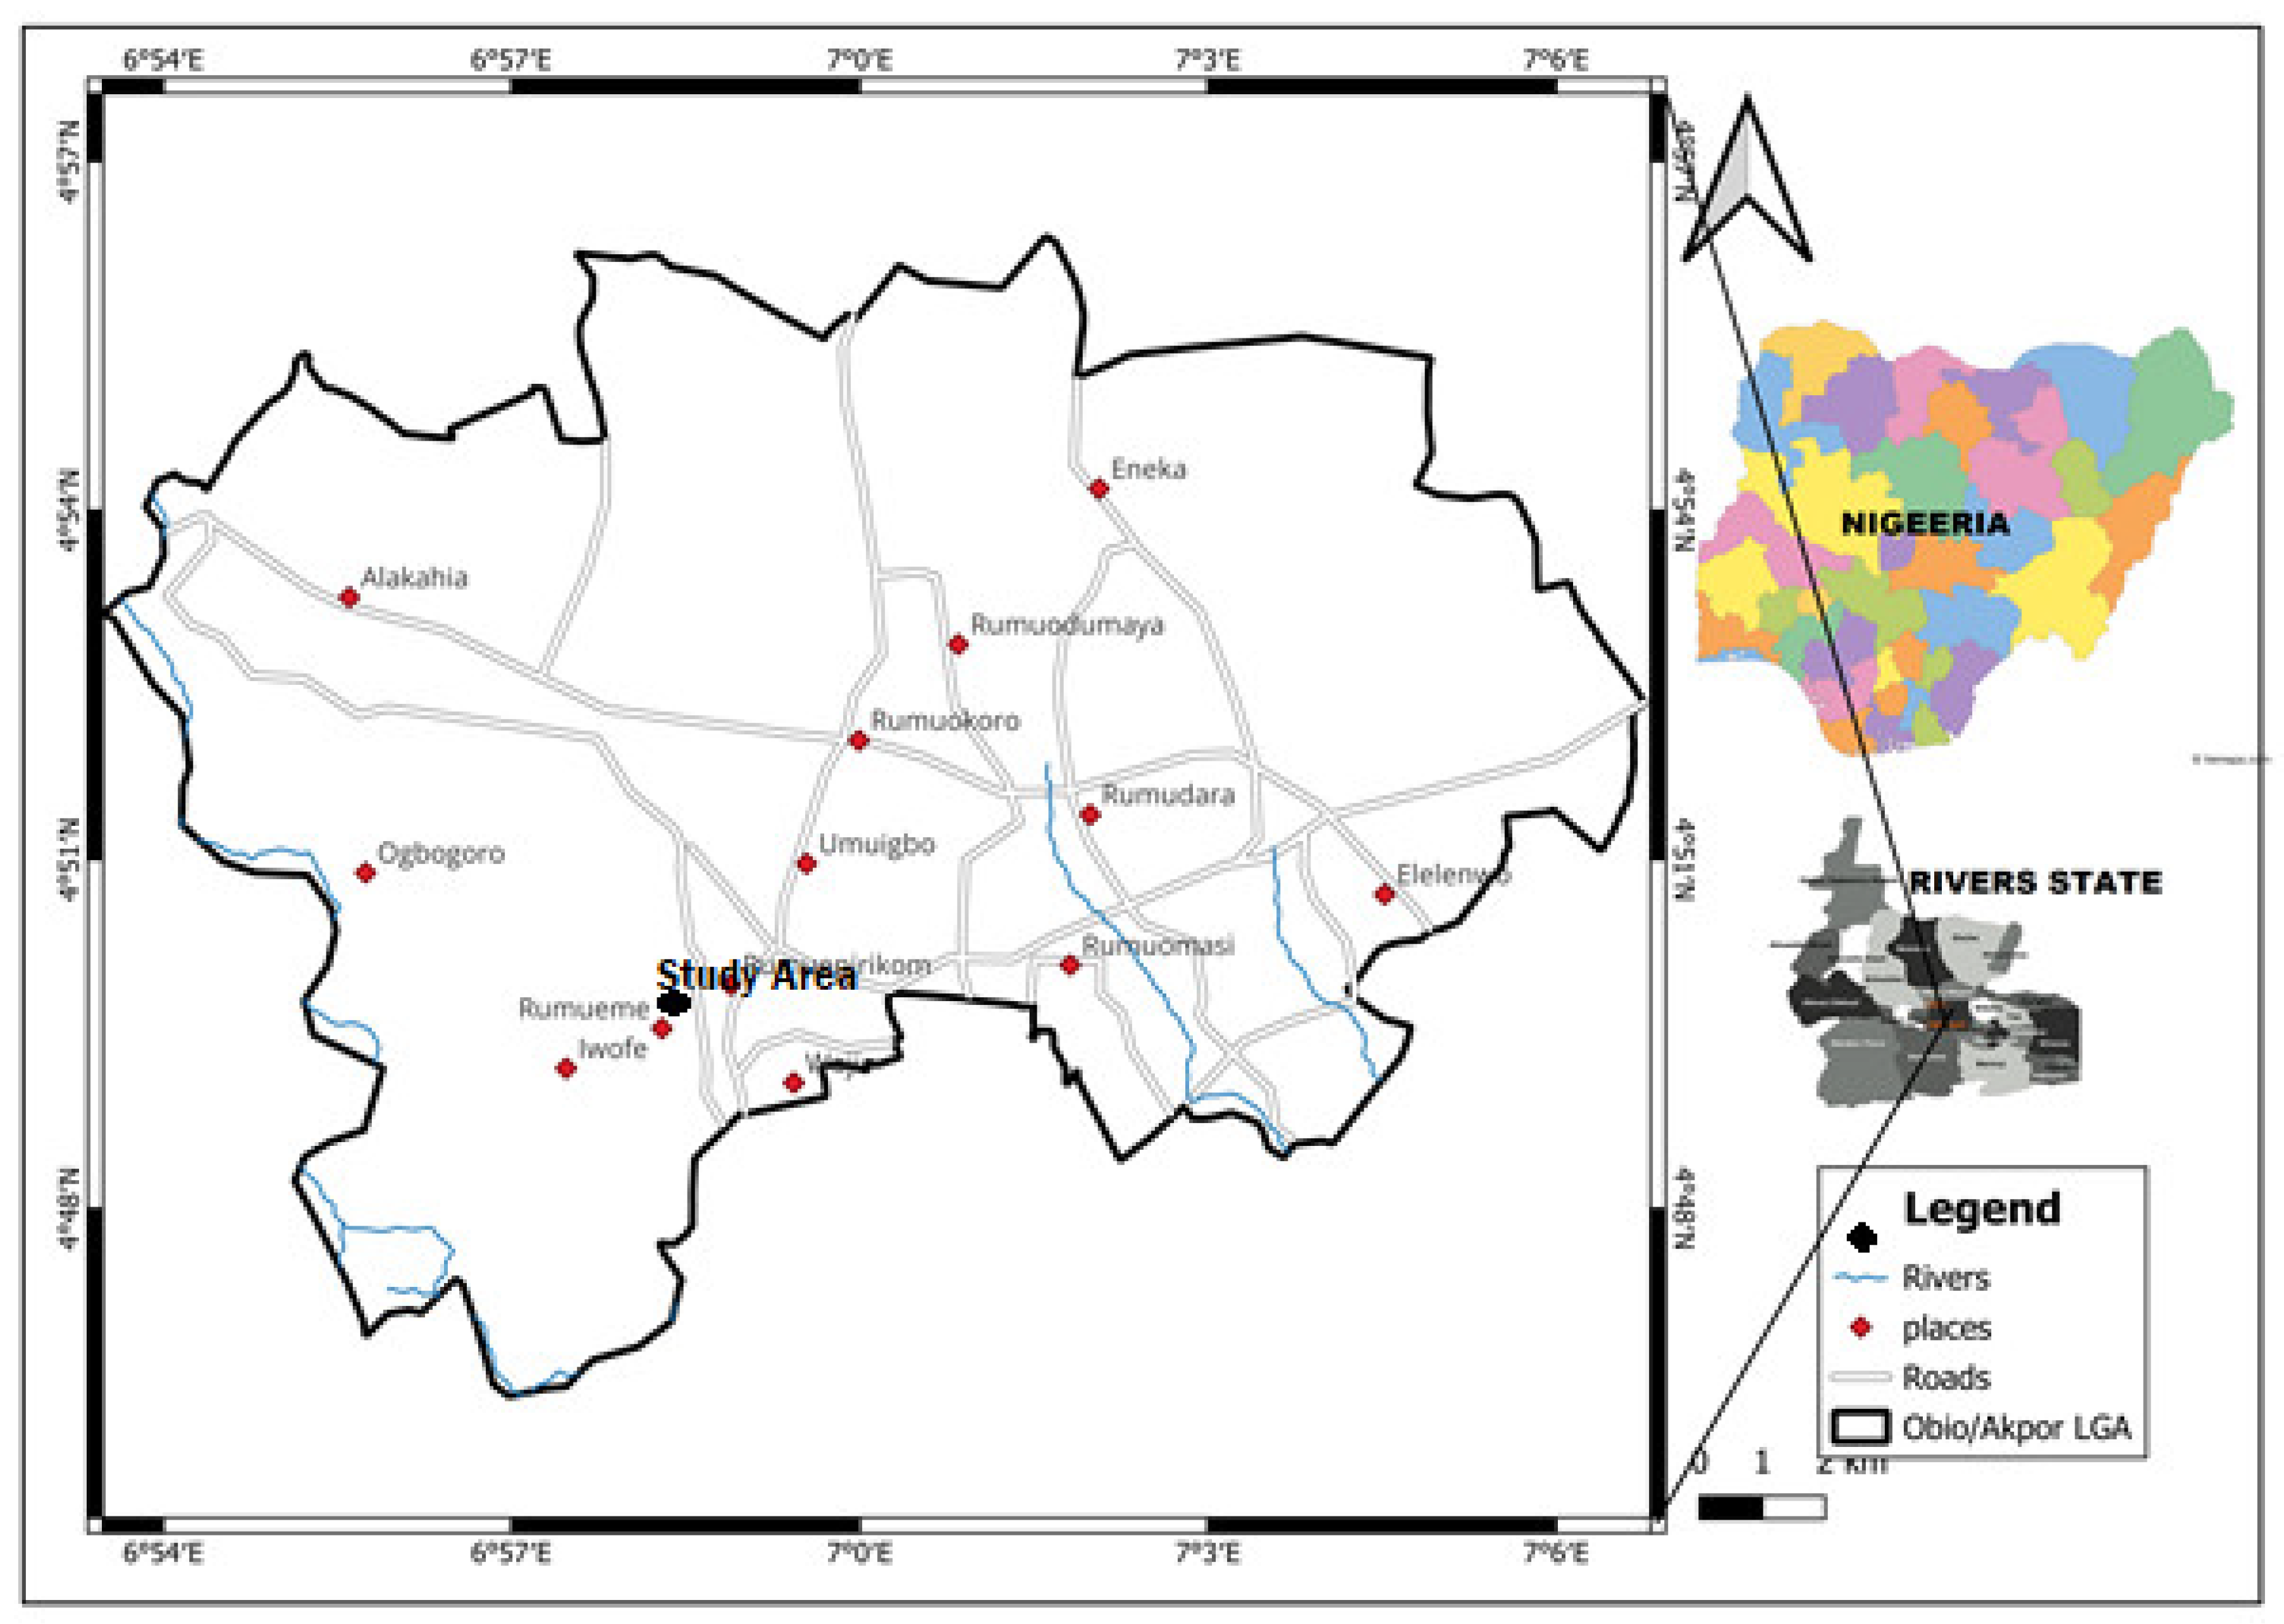
Figure 2.
Hydrology of the study area.
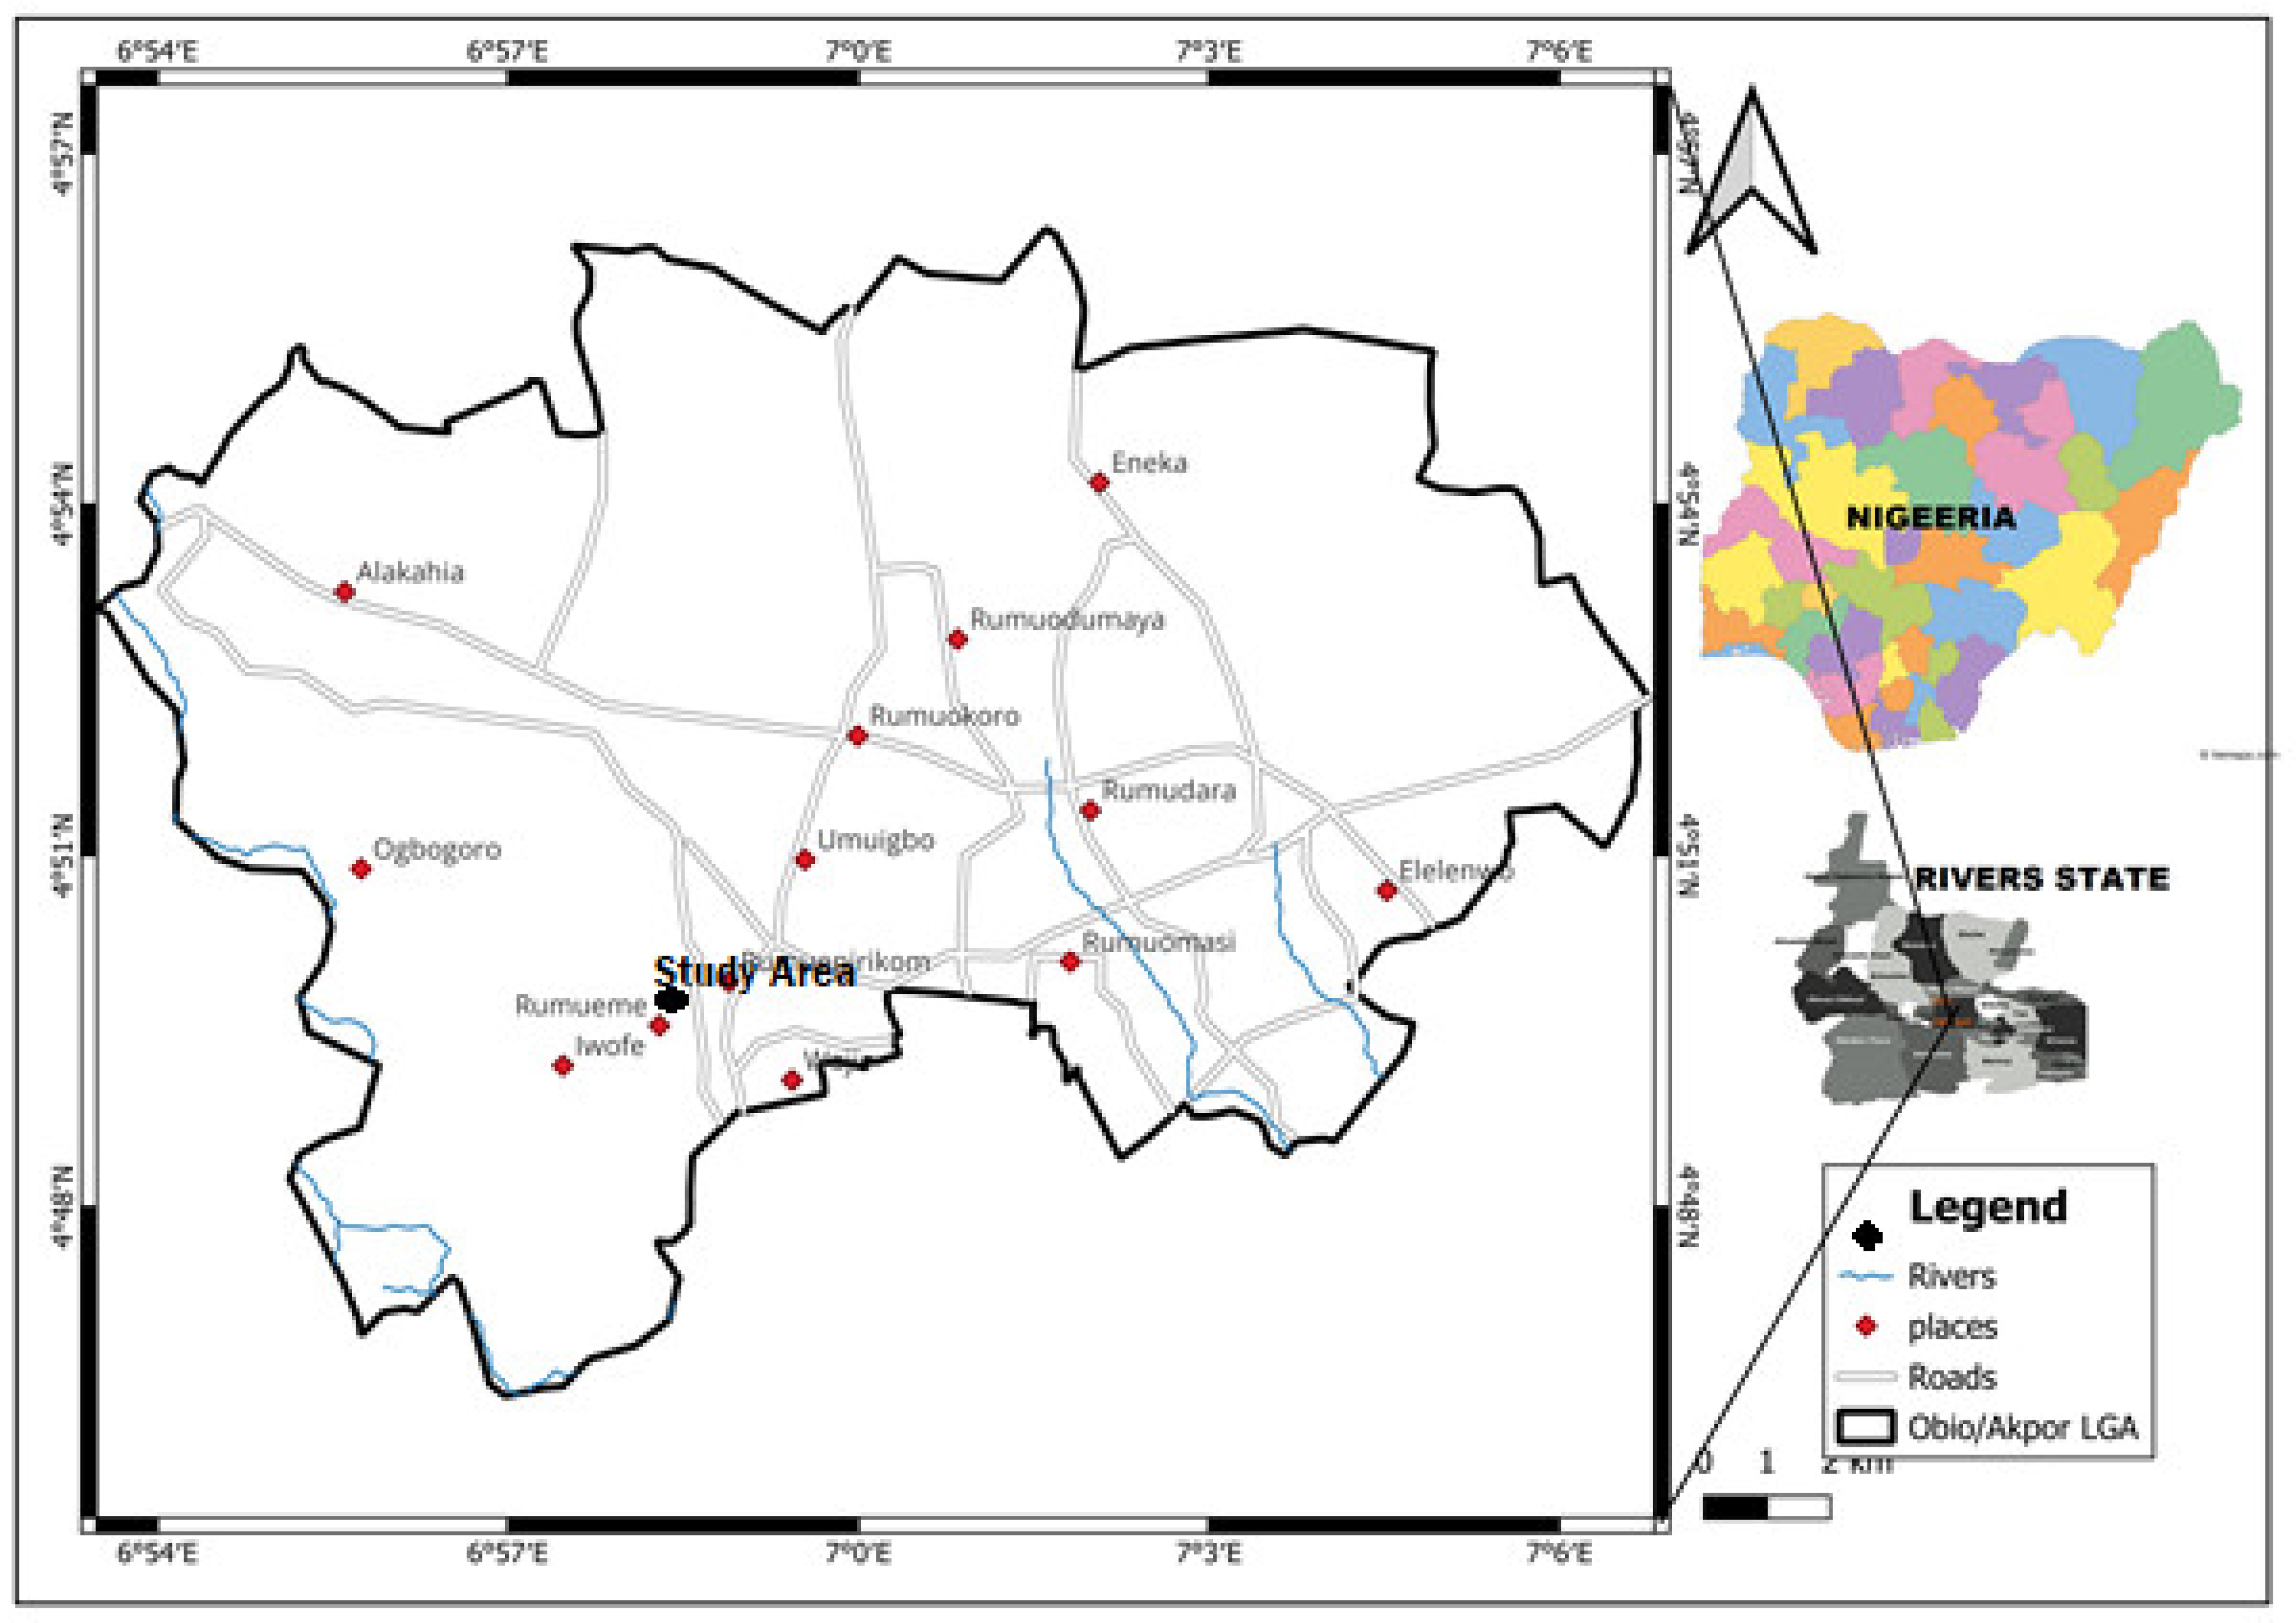
Figure 3.
The moisture contents of Boreholes 1, 2, and 3 at the depth of 1 m of the dumpsite.
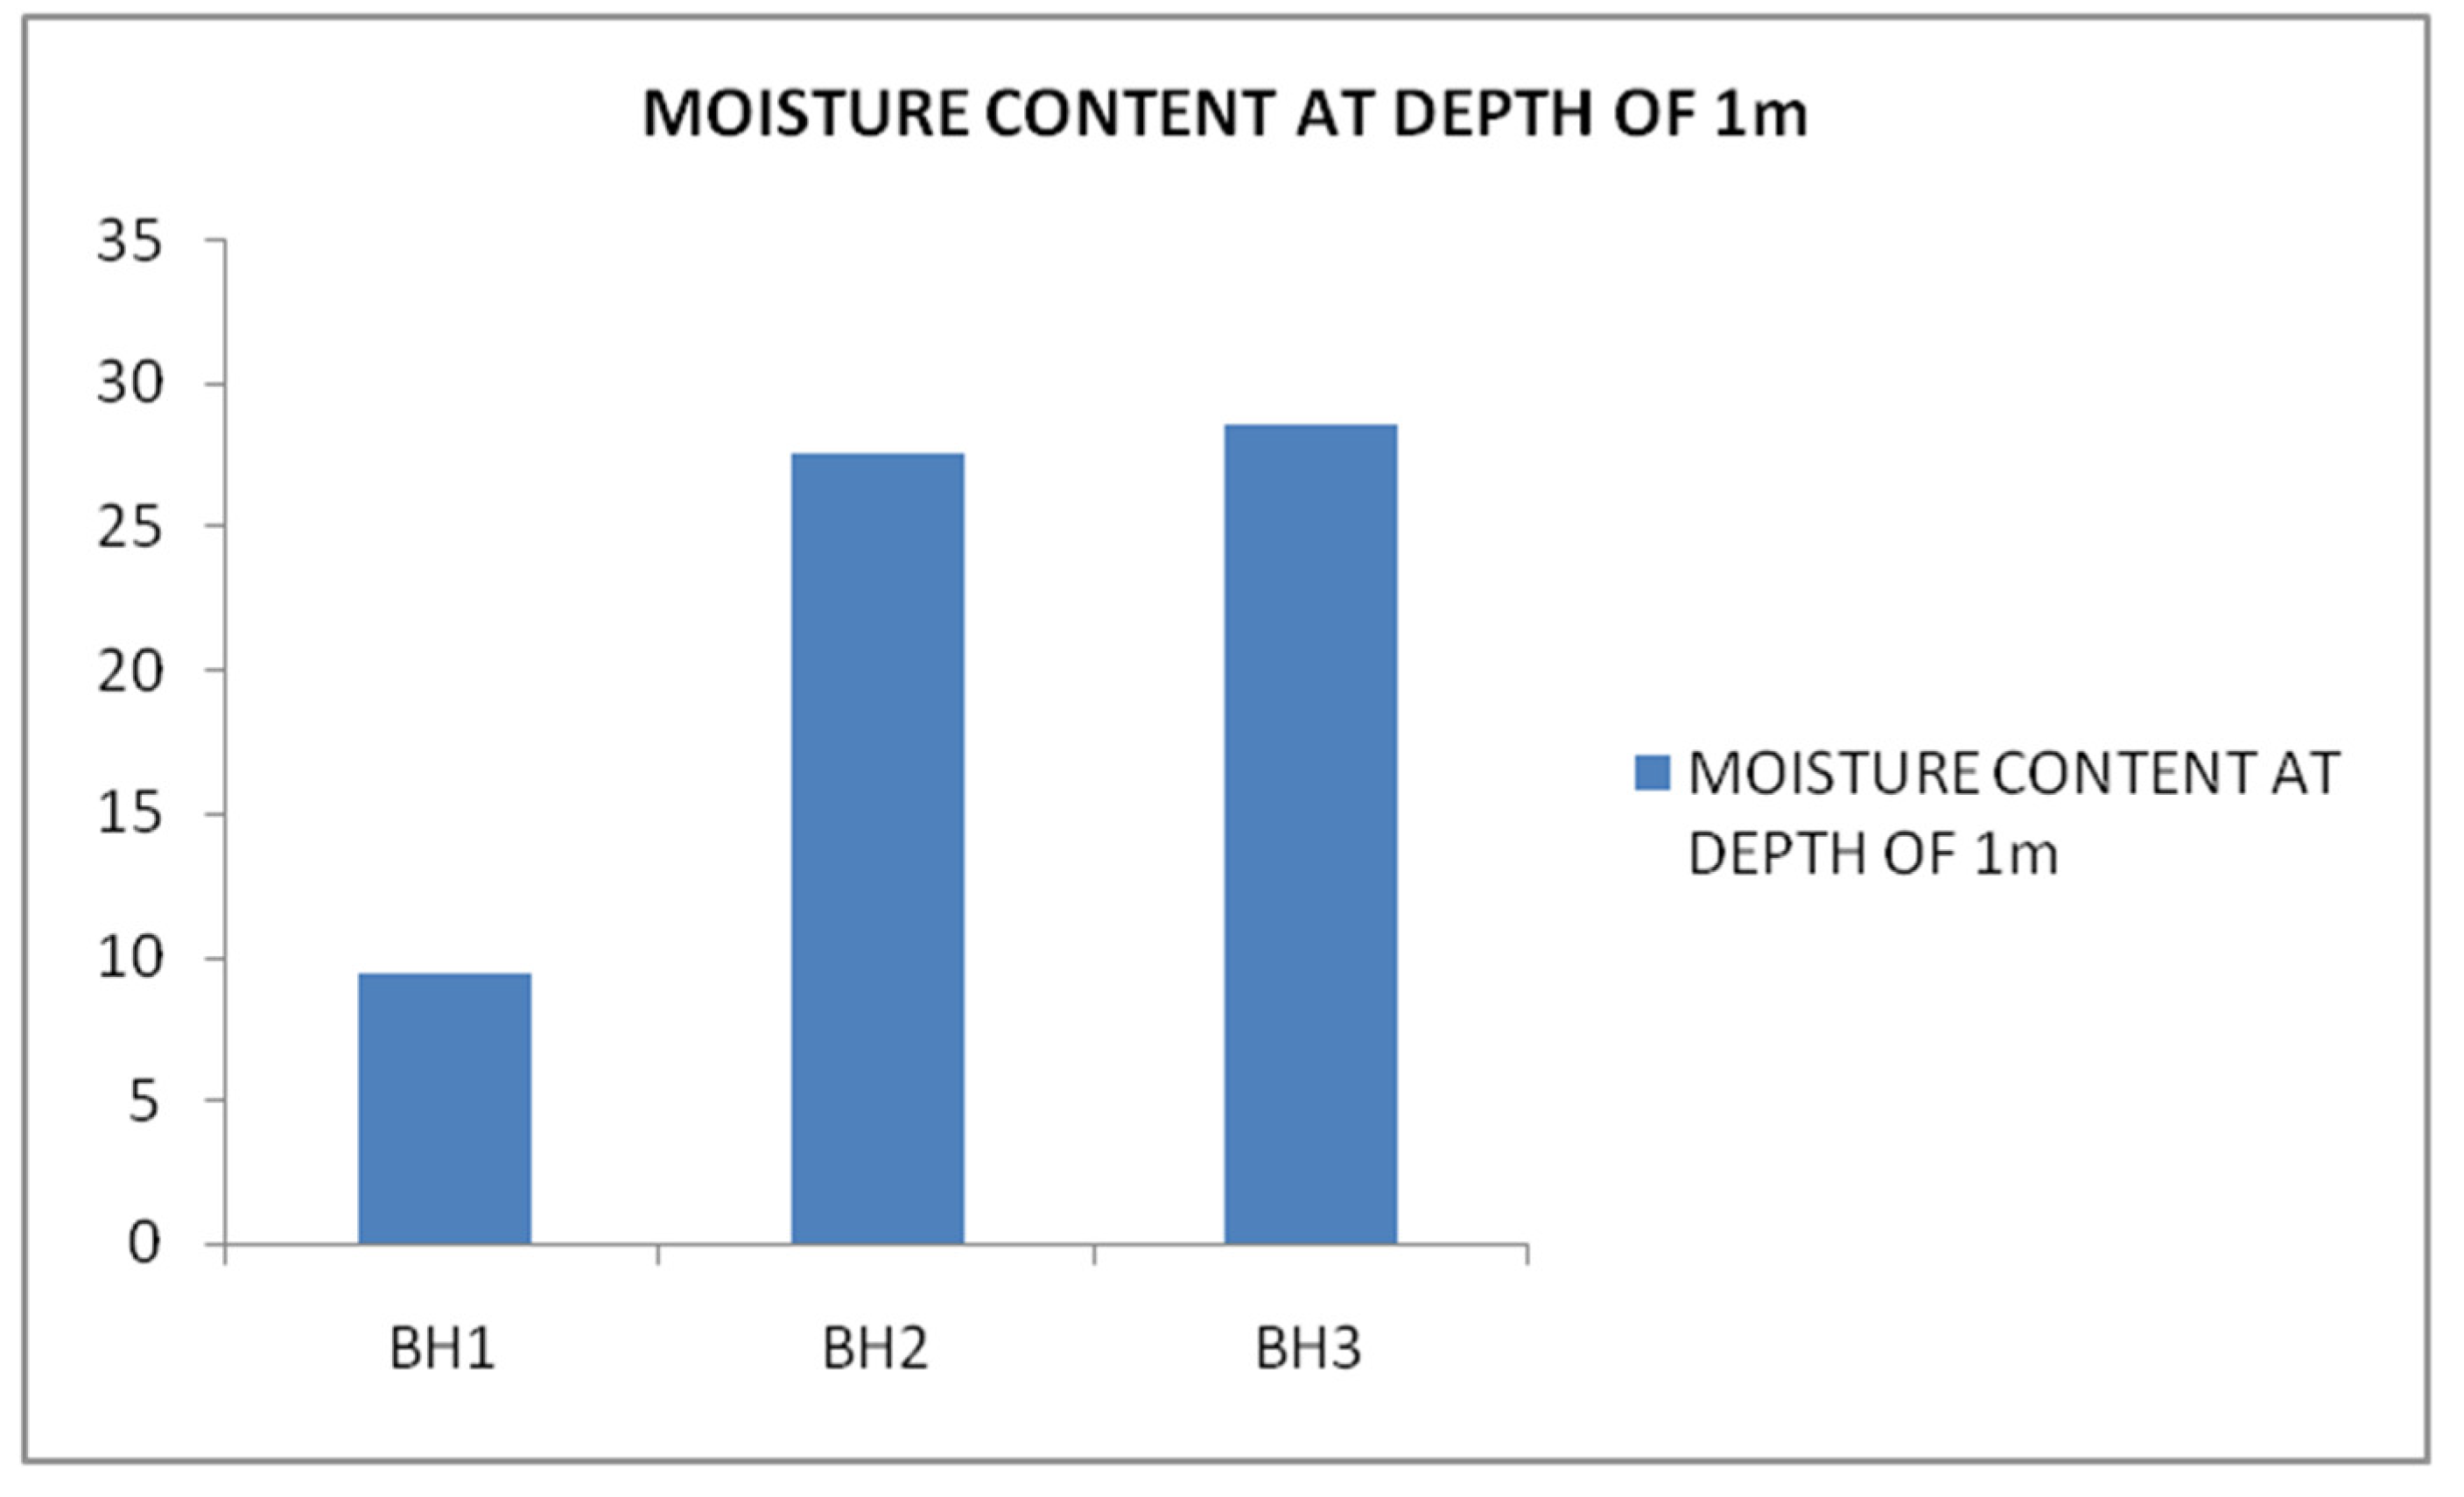
Figure 4.
The moisture contents of Boreholes 1, 2, and 3 at the depth of 2 m of the dumpsite.
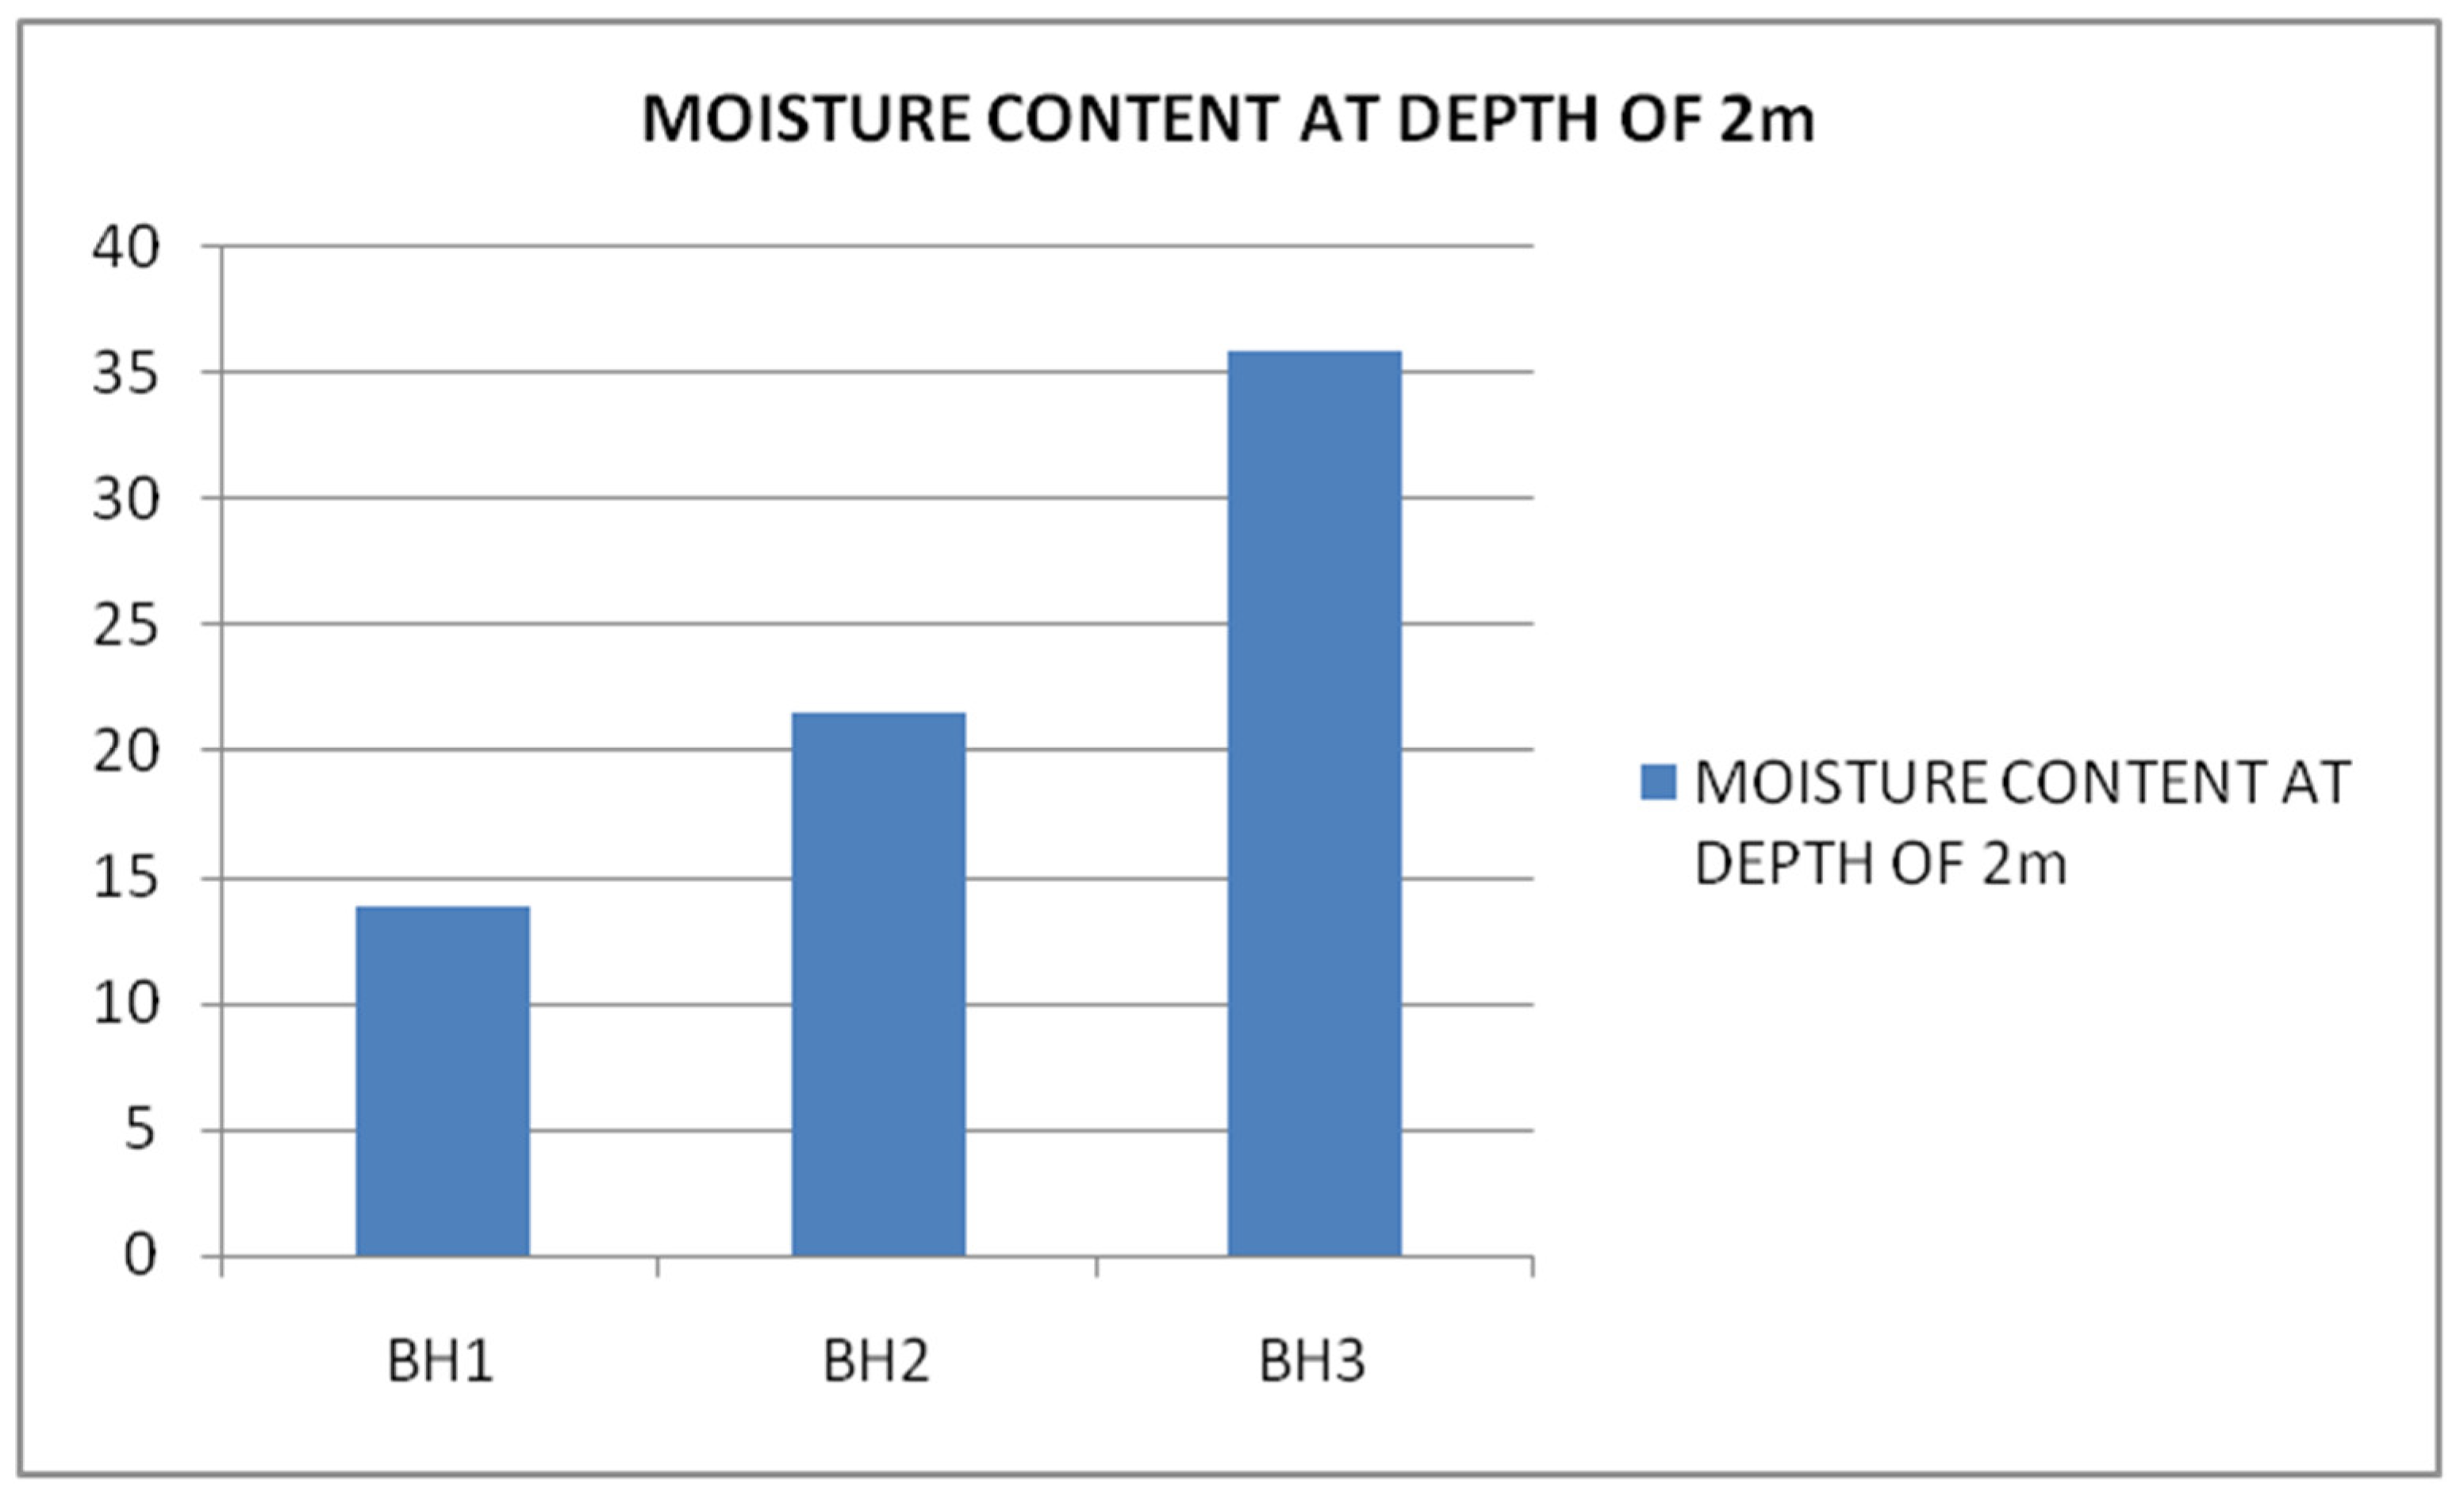
Figure 5.
The moisture contents of Boreholes 1, 2, and 3 at the depth of 3 m of the dumpsite.
Analysis
General Trends:
Across the three locations, moisture content varies significantly. The third location displays notably higher moisture levels compared to the first two locations.
Location 1:
The moisture contents are relatively low, with values ranging from 9.46 % in Borehole 1 to 28.6 % in Borehole 3. This variance suggests a possible drainage issue or low water retention in this area. The relatively higher content in Borehole 3 compared to Borehole 1 indicates variations in soil characteristics, such as texture or compaction, which may influence water retention capacity.
Location 2:
Moisture content increases overall, with values ranging from 13.9 % to 35.9 %. This increase may indicate better soil fertility or organic matter presence in Location 2 compared to Location 1. As the moisture content rises, one can infer enhanced water availability, potentially leading to improved agricultural productivity if this land was cultivated.
Location 3:
The moisture contents are exceedingly high, particularly in Boreholes 2 and 3, with values of 105.5 % and 150.3 %, respectively. These values exceed 100 %, which indicates a measurement anomaly, suggesting either saturation of the soil or the presence of waterlogged conditions. This might reflect an inability of the soil to drain efficiently or a high-water table in the area. The presence of such high moisture content could severely impact any construction or agricultural activities and suggest the need for proper drainage solutions.
3.2. The Particle size analysis Results
The particle size analyses are given in the PSD curve. The results of the parameters are presented in Table 2.
Constituents of the sample from BH1 at 2 m and 3 m have D10 values, other samples from other BH do not have values meaning that fine to coarse sands are more abundant within this location. The coefficient of uniformity (CU) for BH1 is 4.2 to 3.66 and they are moderately permeable in the range of 1 to 1.44.
The leachate is believed to contain substances that are dangerous and are likely to migrate downward to pollute the groundwater as the aquifer system is unconfined.
3.3. Hydrogeological Data
The depth of water table within this study location is 35ft (10.67 m) (Etu-Efeotor, 1997). The lithologic log of the Auger hole to the depth of 3 m is shown in Figure 6. It consists of clayey sand and the clayey nature suggests that the vertical permeability will be low.
3.4. Chemical Analysis Data
Comparing the standard and the results from the boreholes, the average pH of the leachates is 8.8 while the control is 8.0. They are alkaline, showing the absence of carbon dioxide in the dumpsite as the alkalinity is increasing. The average conductivity of the samples is 1750 µS/cm indicating the presence of objectionable taste. The total dissolved solids in the samples are high. High TDS average value of 1150 mg/L compared to the standard showed that the water is not fresh. The average chloride and sulphate concentrations of 76.0 mg/L and 16.7 mg/L respectively are quite low compared to the universal standard of 200 mg/L and 195 mg/L respectively. This means that the presence of salt in the leachate is low. The results are shown in Figure 7.
4.0. Summary
The type of solid waste found around Rumueme dumpsite includes pans, plastics, metal containers, glass bottles, snail shells, wood etc. The soil is mainly clayey sand as shown in the litholog constructed from samples obtained with the Auger. The hydrogeology shows that the area has multi aquifer systems with shallow water tables from 35 feet. The results of chemical analyses of parameters are at variance with the WHO standards. The pH values and TDS are higher than the WHO values while the figures for sulphates and chlorides from samples are lower than the stated standard. The implications are high alkalinity and objectionable tastes of the samples.
Recommendations
Proper disposal of solid waste should take place in geologically appropriate locations. To stop it from contaminating groundwater, such sites should have impermeable subsurface materials like shale and clay.
Further investigations into soil composition, texture, and existing hydrological conditions are recommended to fully understand the implications of these moisture levels and guide appropriate land management and agricultural practices
5.0. Conclusion
The analysis of moisture content from the three boreholes across different locations reveals significant variability. The increasing trend in moisture contents from the first to the third location indicates differing soil characteristics that could affect land use. However, the observation of moisture contents exceeding 100 % raises concerns about the methodology or soil conditions at Location 3. The effects of solid waste on the environment and management play a critical role in maintaining environmental quality. Improper handling and disposal of solid waste can lead to a myriad of environmental issues among which include soil contamination; improperly disposed solid waste can leach toxic substances into the soil affecting soil health and contamination of crops. Heavy metals and organic pollutants can persist in the soil, leading to bioaccumulation in food chains (Parekh, 2019).
Water pollution: Landfills and open dumping sites can lead to leachates formation, which contains hazardous chemicals that can contaminate groundwater and surface water bodies. This pollution can affect drinking water sources and aquatic ecosystems (Karamonz 2018).
Air pollution: Decomposing wastes generate odour and release harmful gases such as methane and carbon dioxide, which contribute to climate change. Open burning of waste also releases toxic air pollutants (Uddins, (2020).
Biodiversity loss: The intrusion of solid waste into natural habitats can lead to habitat destruction, endangering local flora and fauna. Wildlife may ingest plastics or become entangled in waste, leading to injury or death (Gall & Thompson, 2015).
Climate change: Organic waste decomposition in landfills generates methane, a potent greenhouse gas. This contributes directly to global warming, exacerbating climate change impacts (IPCC, 2021).
Human health issues: Improper waste management practices can lead to increased exposure to pathgens and hazardous substances, impacting human health. Respiratory diseases and other health issues can arise especially in communities near dumping sites, (Kaza, 2018).
Author Contributions
Conceptualization- Nwugha,V. N.; Methodology- Okeke, P. I. ; Investigation, Chinyem, F. I.; Writing:original draft preparation- Nwugha, V. N.; writing review and editing- Amanze, K. O.; Data curation- Nwokoma, M. C. Supervision- Okore, G. J. All authors have read and agreed to publish the manuscript.
Funding
This research received no external funding.
Data Availability Statement
The original contributions presented in this study are included in the 271 articles. Further inquiries can be directed at the corresponding author
Conflicts of Interest
The authors declare no conflict of interest.
References
- Adekola, P. O., Iyalomhe, F. O., Paczoski, A., Abebe, S. T., Pawłowska, B., Bąk, M. & Cirella, G. T. (2021). Public perception and awareness of waste management from Benin City, Nature Research, 11:307. [CrossRef]
- Awino, F. B. and Apitz, S. E. (2023). Solid waste management in the context of the waste hierarchy and circular economy frameworks: An international critical review. Integr Environ Assess Manag 2024:9–35. [CrossRef]
- Beyene, H and Banerjee, S. (2011). Assessment of the pollution status of the solid waste disposal site of Addis Ababa City with Some selected trace elements, Ethiopia. World Appl. Sci. J., 14 (7): 1048-1057.
- Birhanu, Y. and Berisa. G. (2015). Assessment of solid waste management practices and the role of public participation in Jigjiga Town, Somali regional State, Ethiopia. Inter J Envtl Protect & Policy, 3(5): 153-168. [CrossRef]
- Etu-Efeotor J., O. (1997) Fundamentals of petroleum geology, paragraphics, Port Harcourt, Nigeria. 51-63.
- Gall, S.C., & Thompson, R.C. (2015). The impact of debris on marine life. Marine Pollution Bulletin, 92(1-2), 170-179. [CrossRef]
- Gedefaw. M. (2015). Assessing the current status of solid waste management of Gonder Town, Ethopia.: Scientific and Technology Research. 4, 9, 28-36.
- IIoeje N. P. (1972) A new geography of Nigeria, Longman of Nigeria 221 pages.
- IPCC (2021). Climate Change 2021: The Physical Science Basis: Contribution of Working Group I to the sixth assessment Report of the intergovernmental Panel on climate change. Cambidge University Press. [CrossRef]
- Karamonz, M., Naziti, S. & Hossain, M. (2018). Landfill leachate: Environmental Implications and Management. Environmental science and pollution Research, 25, 2, 1551-1560. [CrossRef]
- Kaza, S., Yao L.C., and Bhada-Tata P. (2018). What a waste 2.0: A Global Snapshot of solid waste Management to 2050. [CrossRef]
- Kebede, A. A., Olani, D.D. and Edesa, T.G. (2016) Heavy metal contact and physic-chemical properties of soil around solid waste disposal sites. American Journal of Scientific and Industrial Research. 7, 5, 129-139.
- Leveson, D. 1980. Geology and the Urban environment, Oxford University Press New York pp 351.
- Mekonnen, B., Haddis A., Zeine W., (2020) Assessment of the Effect of solid waste dumpsite on surrounding soil and River Water Quality in Tepi, Southwest Ethopia. Hindawi Journal of Environmental and Public Health, Article ID 5157046, 1-9. [CrossRef]
- Nwugha V. N., Ezebunanwa A. C., Okeke P. I., Chinaka A. I. (2021) Environmental Implications of Leachates of Sewage Dumpsites in Some Parts of Owerri, Southeastern Nigeria. The Pacific Journal of Science and Technology. 22 (1) 254-261. ISSN 1551-7624. Available online: http://www.akamaiuniversity.us/PJST.htm.
- Okeke P. I., Nwugha V. N., Nleonu N. E.,Okore G. J., Okeke P. O. (2023a) Assessment of Groundwater Quality in Owerri and Its Environments, Southeast Nigeria. Science View Journal, Volume 4, Issue 3, pages 334-338. ISSN (Online): 2734-2638. [CrossRef]
- Okeke Pamela, I., Nwugha Victor N, Nleonu Emmanuel Chile, Christian Ebere Enyoh, and Ngozi-Olehi Linda C. (2023b) Evaluation of Physicochemical and Geoelectrical Parameters of Soil and Water around Electronic Dumpsites in Selected Locations of Aba, Nigeria. Taylor and Francis, Environmental Forensics. Pages 1-12.
- Parekh, M. Bhattacharya, J., and Das, B. (2019). Impact of solid waste on soil Quality: A case study. Journal of Environment Management, 240, 249-259. [CrossRef]
- Uddins, S., Hossain, M.S., & Rahman, M.M. (2020). Air Quality and Health Risks Associated with open Burning of Solid Waste. Waste Management, 101, 10-25. [CrossRef]
Figure 6.
The lithological log of the Borehole at Rumueme Dumpsite.
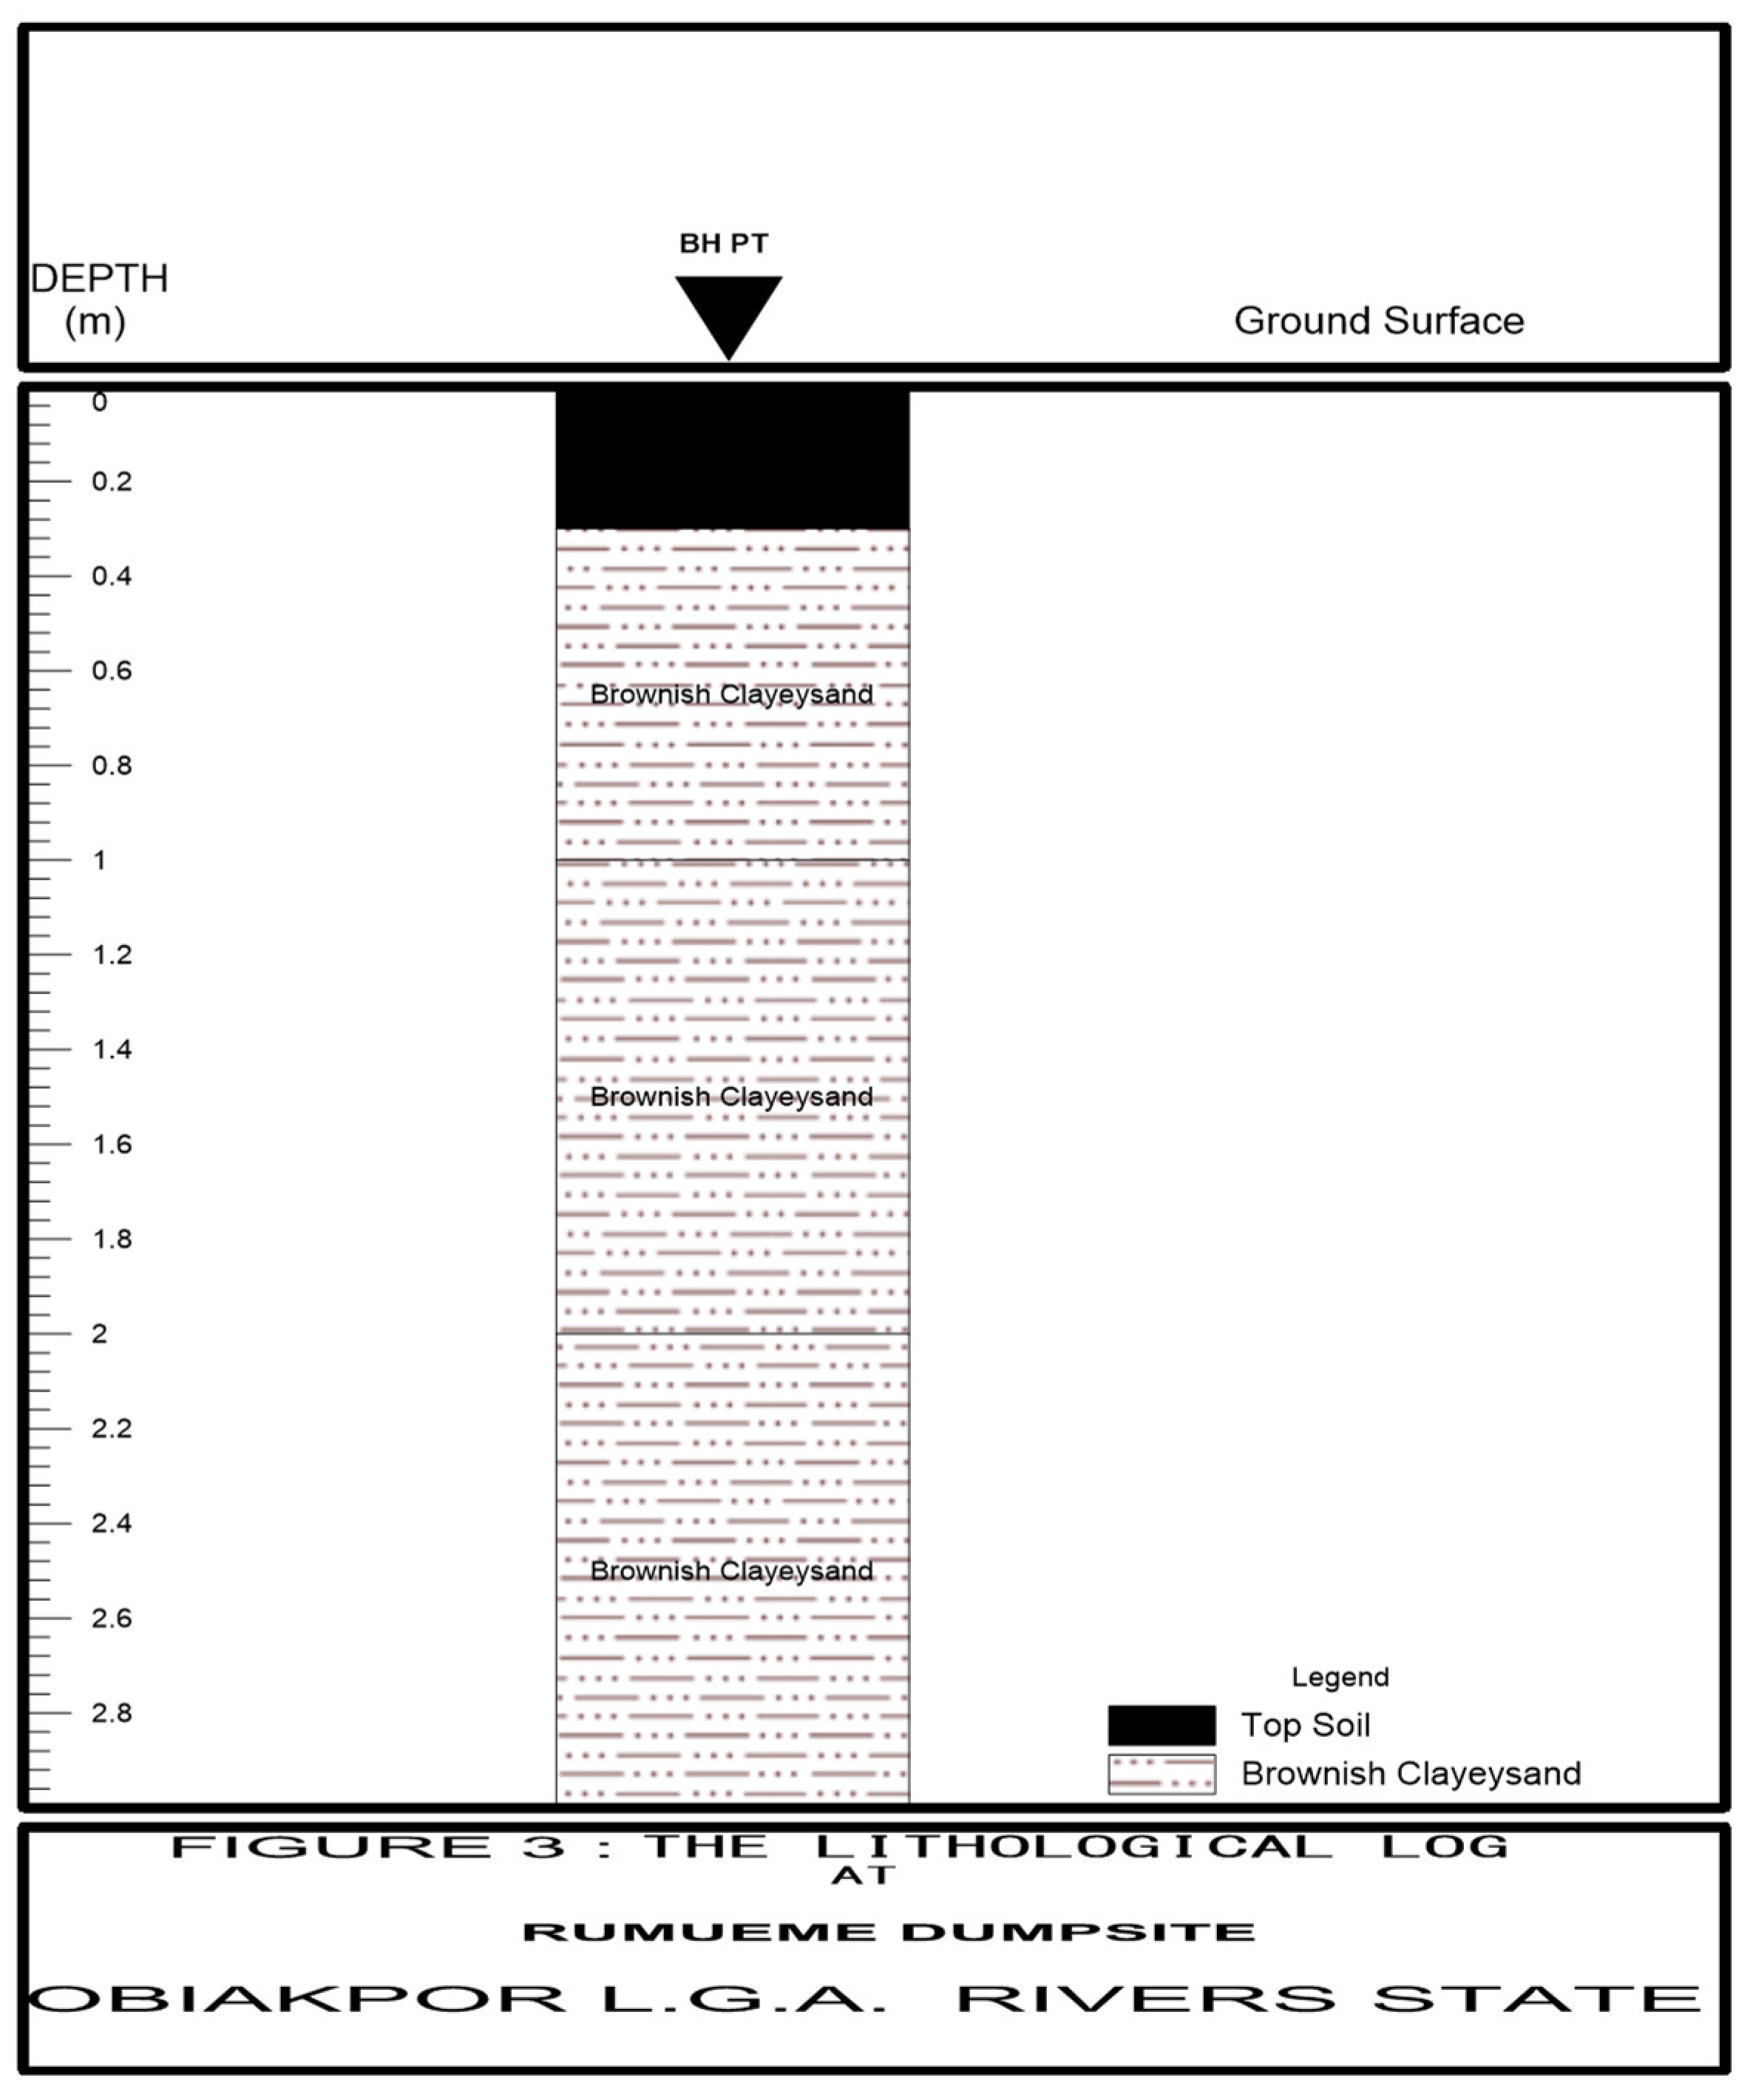
Figure 7.
Chemical Analysis of water from boreholes within rumueme dumpsite.
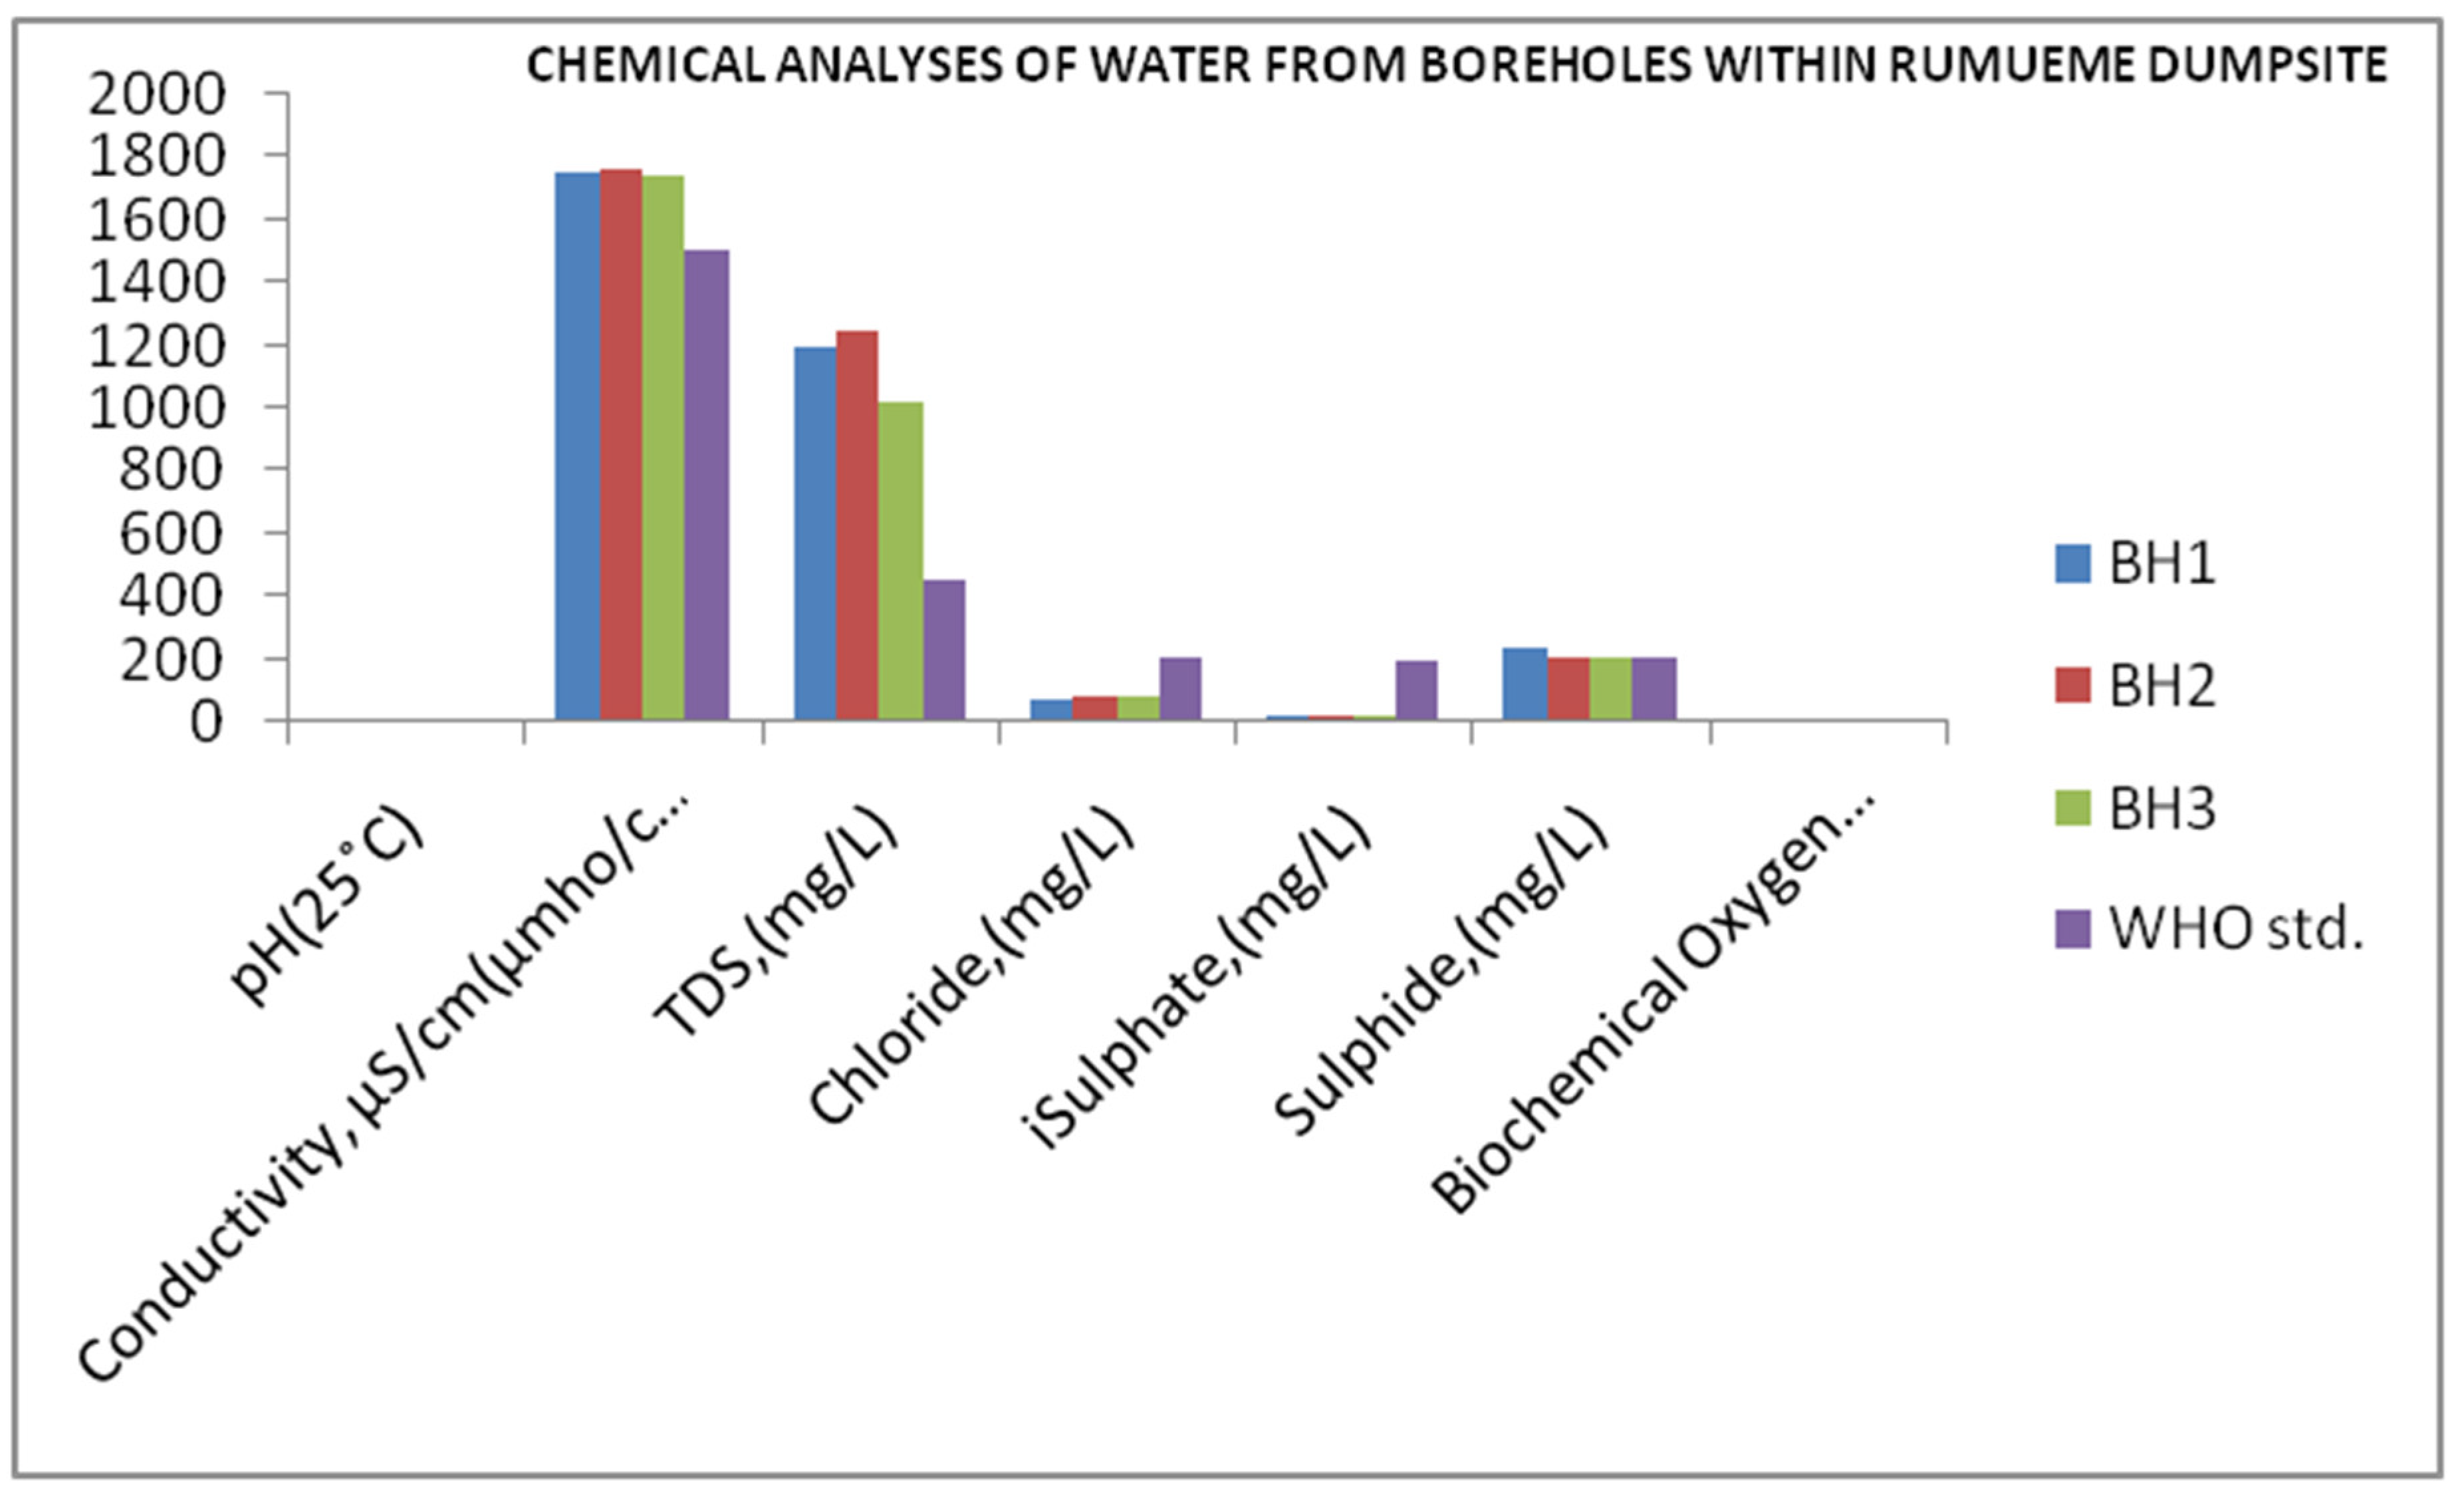

Table 1.
Moisture content of samples at depths of 1 m, 2 m and 3 m.
| BH NO. | DEPTH (m) | MOISTURE CONTENT (%) |
|---|---|---|
| 1 | 1 | 9.46 |
| 2 | 27.6 | |
| 3 | 28.6 | |
| 2 | 1 | 13.9 |
| 2 | 21.6 | |
| 3 | 35.9 | |
| 3 | 1 | 42.2 |
| 2 | 105.5 | |
| 3 | 150.3 |
Table 2.
The Results of sieve analyses of soils and derived parameters.
| BH | SAMPLE DEPTH(m) | 2mm | 1mm | 0.425 | 0.150 | 0.075 | D10 | D30 | D60 | CU | MnK/Sec |
|---|---|---|---|---|---|---|---|---|---|---|---|
| 1 | 1 | 92.4 | 88.0 | 68.1 | 31.5 | 28.7 | - | 0.14 | 0.38 | - | - |
| 2 | 97.8 | 91.1 | 59.4 | 14.2 | 7.4 | 0.10 | 0.28 | 0.42 | 4.2 | 1 | |
| 3 | 99.4 | 92.8 | 62.3 | 14.6 | 4.0 | 0.12 | 0.38 | 0.44 | 3.66 | 1.44 | |
| 2 | 1 | 93.0 | 85.2 | 55.8 | 18.0 | 13.9 | - | 0.27 | 0.45 | - | |
| 2 | 98.2 | 93.8 | 74.0 | 38.9 | 32.4 | - | 0.26 | 0.44 | - | ||
| 3 | 93.0 | 84.7 | 54.5 | 19.3 | 15.5 | - | 0.19 | 0.35 | - | ||
| 3 | 1 | 94.8 | 89.7 | 66.1 | 34.8 | 31.4 | - | - | 0.37 | - | |
| 2 | 94.0 | 90.2 | 68.9 | 24.1 | 16.0 | - | 0.19 | 0.35 | - | ||
| 3 | 89.8 | 83.4 | 59.5 | 56.1 | 51.8 | - | - | 0.42 | - |
Table 3.
Result of chemical analysis of water from BHs around Rumueme dumpsite.
| Parameter/Unit | BH1 | BH2 | BH3 | WHO std. |
|---|---|---|---|---|
| pH (25˚C) | 9.2 | 8.8 | 8.4 | 8.0 |
| Conductivity, µS/cm (µmho/cm) | 1750 | 1760 | 1740 | 1500 |
| TDS (mg/L) | 1200 | 1245 | 1020 | 450.0 |
| Chloride (mg/L) | 74.0 | 77.5 | 76.5 | 200 |
| iSulphate (mg/L) | 17.0 | 17.2 | 15.9 | 195 |
| Sulphide (mg/L) | 240 | 200 | 208 | 200 |
| Biochemical Oxygen Demand BOD | 11 | 9.0 | 10 | 9.5 |
Disclaimer/Publisher’s Note: The statements, opinions and data contained in all publications are solely those of the individual author(s) and contributor(s) and not of MDPI and/or the editor(s). MDPI and/or the editor(s) disclaim responsibility for any injury to people or property resulting from any ideas, methods, instructions or products referred to in the content. |
© 2025 by the authors. Licensee MDPI, Basel, Switzerland. This article is an open access article distributed under the terms and conditions of the Creative Commons Attribution (CC BY) license (http://creativecommons.org/licenses/by/4.0/).
Copyright: This open access article is published under a Creative Commons CC BY 4.0 license, which permit the free download, distribution, and reuse, provided that the author and preprint are cited in any reuse.


