
Submitted:
11 February 2025
Posted:
12 February 2025
You are already at the latest version
Abstract
In response to the global prioritization of environmental protection, nations increasingly focus on transitioning to low-carbon economies as a central strategy for achieving sustainable socio-economic growth. This study introduces a novel framework designed to evaluate, cluster, and map urban carbon policies by employing an integrated methodology that hybrid Multi-Objective Optimization (MOO), Multi-Criteria Decision-Making (MCDM), and Particle Swarm Optimization - Self Organizing Map (PSOM) techniques. Furthermore, a machine learning model utilizing the Random Forest algorithm is developed to enhance predictive capabilities, incorporating adaptive weighting and dynamic clustering for expert-informed analysis of sustainability strategies. Applying this hybrid approach to testing the dataset reveals that the predictive results can effectively guide city-level carbon trading strategies, thereby supporting government initiatives based on technology-based policy-making. The findings demonstrate that the proposed framework can robustly analyze and visualize complex datasets, contributing to mapping carbon trading policies against cities. Future research directions include exploring the integration of Internet of Thinks (IoT) systems to refine carbon trading strategies further, thus advancing the development of smart cities and promoting a more adaptive and sustainable urban environment.
Keywords:
carbon trade
; multi-objective optimization
; multi-criteria decision-making
; machine learning
1. Introduction
The paper concerns novel techniques, Countries worldwide are increasingly prioritizing environmental protection through the policies of each government in formulating relevant laws to control carbon emissions [1,2]. Global concerns about climate change have also prompted the development of policies to reduce carbon emissions [3]. The transition to a low-carbon economy has emerged as a crucial strategy for achieving sustainable social and economic development [4]. While Foreign Direct Investment (FDI) can drive economic growth and increase carbon emissions, trade openness contributes to economic development while limiting the increase in carbon emissions as part of the transition to carbon neutrality [5].
Generally, carbon trading programs are supported by government initiatives, as it is known that carbon markets also contribute to encouraging technological innovation and promoting sustainable development. The enforcement of fines and penalties for non-compliance with carbon emission regulations provides a robust incentive for companies to adopt more stringent production controls and enhance their monitoring systems. Enhanced management and monitoring mechanisms contribute to greater transparency and efficiency in production and foster motivation for research and development in low-carbon technologies [6]. Carbon trading has emerged as an important mechanism to address environmental problems, especially in reducing carbon emissions. Research by Nasir [7] shows that the implementation of carbon trading policies has had a positive impact on various aspects of socio-economic development. Research by G. Chen [8] also found that carbon trading policies positively influence the total factor productivity of power companies through mechanisms such as external cost compensation, internal low-carbon technology innovation, and optimized resource allocation.
Carbon trading can positively impact regional sustainable development, environmental governance, and increase carbon productivity [9]. The transition to a low-carbon economy can positively impact international trade by improving sustainability, mitigating trade risks, and encouraging new trade prospects, especially in the environmental protection sector [10]. For developing countries, efforts to achieve rapid development are often accompanied by high consumption of fossil fuels, causing severe environmental damage [11]. Consequently, achieving reductions in pollution and carbon emissions is crucial. The implementation of carbon trading policies significantly contributes to improving energy efficiency, demonstrating a positive impact on overall environmental performance [12], this significantly promotes emission reduction, enhances technology absorption capacity, and assesses the effectiveness of carbon emissions trading in minimizing economic losses associated with climate mitigation in a region.
Rapid economic development, the scale of energy consumption continues to increase, and the carbon emissions caused by this consumption have various impacts on the environment [13]. Although greater carbon emission pressures are exerted on developing cities, the impact of trade restrictions on carbon emissions is weakened due to an absolute decline in emissions intensity between regions over time [14]. Mapping carbon trade regulations for each region is an important tool that can help manage environmental policies, achieve carbon emission reduction targets, and support sustainable economic, social, and environmental development [15]. It positively impacts the transition to a low-carbon economy that can improve trade sustainability, reduce associated risks, and create new economic, social, political, and environmental opportunities. Therefore, this study proposes a model that can be used to implement a sustainable policy of carbon trade that can balance the influence between these aspects.
Implementing carbon trading policies requires a MCDM approach, as these policies affect a wide range of stakeholders and cover diverse sustainability dimensions. Research by Chang and Zhao [16] discusses the impact of carbon trading policies on green technology innovation, emphasizing the need for a micro perspective that considers the spatial and temporal effects of utilizing MCDM techniques. Meanwhile, C. Wang [17] use a difference-in-difference model to evaluate the impact of carbon trading policies on environmental and economic outcomes, which is relevant to understanding the MCDM process. The complexity of decision-making in the carbon market is underscored by the interplay of economic, environmental, and social factors, necessitating careful evaluation of diverse criteria to achieve optimal outcomes. This highlights the critical role of scientific and rational decision-making tools in enhancing companies' competitiveness in carbon trading [18].
A context-based policy mix is proposed for areas with high concentrations of pollutants or specifically highlighted pollutants, aimed at resolving potential conflicts between policy interventions targeting different air pollutants. In this context, the study evaluates the effectiveness of carbon trading policies across various regions, providing insights into how such policies influence emissions reductions and economic performance. By employing an advanced analytical approach, the study develops a comprehensive assessment framework, which serves as a guideline for effective regional policy implementation. The objectives of this research as innovations are as follows:
- To find the optimal solution by considering several criteria that may be conflicting so as to help balance the influence of economic, social, environmental and political growth aspects on carbon trading using MOO.
- To determine the priority scale for carbon trade policy is based on criteria for each aspect using the MDCM.
- To identify patterns in data related to the effectiveness of carbon trading policies in various regions through mapping and grouping data using a hybrid PSOM.
- To predict the feasible carbon trading policies to be implemented in a city as a step to prepare for the future using a machine learning algorithm.
Adopting and strategically optimizing carbon trading policies are critical to advancing sustainable development and reducing the environmental impact of economic growth. This study emphasizes the necessity of utilizing MOO and MCDM frameworks to design balanced carbon trade policies considering economic, social, environmental, and political factors. Through innovative analytical techniques, such as hybrid PSOM, the study enables a detailed examination of policy effectiveness across regions, providing insights into regional patterns and informing predictive models for future urban implementations. These methodologies collectively underscore the potential of carbon trading mechanisms to increase regional carbon productivity, strengthen environmental governance, and facilitate sustainable economic advancement. This comprehensive framework thus contributes significantly to the transition toward a low-carbon economy, aligning regional development objectives with global climate mitigation goals.
2. Related Work
The integration of MOO, MCDM, clustering, and mapping methods has become essential in addressing complex urban challenges, particularly in carbon trading policy. This literature review summarizes recent findings and emphasizing its application to urban carbon trading policies.
2.1. Carbon Trade Policy
Carbon trade involves the buying and selling of carbon credits, which grant companies the right to emit a specified amount of carbon dioxide or other greenhouse gases, with one carbon credit representing a reduction of 1 ton of CO2 emissions, typically used when emissions exceed a set limit. The club's concept approach not only provides incentives for the participation of other countries but also helps level the playing field for domestic industries that face competition from countries with less stringent regulations [19]. The concept of a carbon club is particularly relevant in discussions regarding international trade agreements, as seen in the EU-Mercosur trade agreement, which aims to align trading practices with sustainability goals [20].
Empirical evidence suggests that carbon pricing can significantly reduce emissions when implemented effectively. For example, research shows that countries like Sweden, which is part of Scandinavia, have successfully integrated carbon taxes with emissions trading systems, resulting in a significant decoupling between economic growth and greenhouse gas emissions [21]. In addition, the volatility of carbon prices can significantly influence companies' decisions regarding the green transition, as companies must address the uncertainties associated with carbon price fluctuations [22]. The effectiveness of carbon trading policies depends on establishing the same framework as the carbon club, a careful plan of pricing mechanisms to manage volatility, and developing public support through transparent and fair policy measures.
2.2. MOO and MCDM in Urban Policy
Research shows an increasing interest in combining MOO and MCDM to enhance sustainability assessments in urban contexts. Ferdous [23] developed a decision tree that integrates MOO under uncertainty, addressing the need for structured methodologies in sustainability assessments, especially where data uncertainty is prevalent. Supporting this, Alvarez Gallo and Maheut [24] identified frameworks for MCDM applications in urban logistics, demonstrating that these methods could be adapted to evaluate city-level carbon trading policies. Applications of MCDM in urban planning are also well-documented. For instance, Reyes-Norambuena [25] proposed a Gray MCDM model to optimize pedestrian path selection, thus reducing environmental impact and enhancing urban mobility. Similarly, Keshavarz-Ghorabaee [26] reviewed MCDM's role in assessing urban transport, emphasizing its utility in developing public transportation policies that align with sustainability goals. These findings suggest that MCDM offers a structured approach for urban planners to assess the impacts of carbon trading policies on mobility and infrastructure.
2.3. Applications in Energy and Emission Reduction
Several studies focus on carbon trading policies and emissions reduction. Xia [27] provided empirical evidence of carbon trading’s role in emission reductions within construction and land use, highlighting the necessity of multi-criteria evaluation frameworks like MOO-MCDM. Zinatizadeh [28] also emphasized MCDM’s role in urban sustainability assessments, suggesting that integrating MOO and MCDM can evaluate carbon trading policies by balancing environmental sustainability, economic feasibility, and social equity. In energy system optimization, Kokkinos [29] developed a decision-making tool for decarbonization policies, though they noted a need for further exploration of social and behavioural impacts on household-level energy choices. Similarly, Esmat [30] designed a model for selecting decentralized heating resources, showcasing how MCDM assists urban planners in balancing economic and environmental objectives. These studies reveal a gap in understanding how carbon trading policies can influence individual decision-making.
2.4. Advances in Hybrid Models and Future Directions
Research into hybrid multi-objective models continues to advance strategies for carbon reduction in energy systems and trading markets. Bian [31] explored optimal bidding strategies for photovoltaic (PV) and Battery Energy Storage Systems (BESSs) within energy and frequency regulation markets, emphasizing the revenue potential and carbon trading benefits of these systems. However, the study calls for further development of a multi-objective optimization approach that balances carbon reduction goals with profitability, highlighting a gap that warrants additional research. Qin [32] recommended simplifying and scaling the model to reduce computational demands while preserving performance, thus addressing practical challenges in the operational efficiency of carbon trading systems.
Recent research has made strides in developing hybrid multi-criteria models for energy and carbon reduction systems. Baars [33] introduced an integrated multi-criteria assessment model to evaluate electric vehicle batteries, balancing technical, socio-economic, and environmental trade-offs. The study calls for further development of Multi-Objective Optimization techniques to enhance model applicability, thereby facilitating sustainability-focused economic decision-making. Similarly, Cao [34] proposed a low-carbon dispatch model for regional energy systems that uses a chaotic artificial hummingbird algorithm to optimize economic and environmental objectives in line with carbon neutrality targets. However, the study suggests further refinement to clarify prioritization strategies within the dispatch algorithm, which could enhance the model’s practical applicability.
In the context of carbon emissions management, Ding [35] applied a multi-agent model integrated with the SAACPSO optimization method to manage emissions across supply chains. This research highlights the need for sector-specific regulatory models to improve adaptability and recommends tailoring models to meet unique regulatory requirements. Similarly, Wu and He [36] proposed a multi-objective optimization model to reduce CO₂ emissions in urban energy systems, emphasizing economic cost considerations. The study posits that incorporating economic factors alongside carbon reduction could significantly increase the model’s relevance for urban planning decision-makers. Despite significant progress, many empirical studies, such as those by Li and Dong [37], predominantly rely on historical data and static models. This approach has limitations, particularly in reflecting rapidly changing market conditions and policy impacts. As a result, there is a growing need for dynamic models that incorporate real-time data, which could significantly enhance adaptive clustering and decision-making frameworks in carbon trading.
Empirical research plays a critical role in assessing the effectiveness of carbon trading policies. For instance, the impact of carbon trading on land use emissions in China can be analyzed using quasi-natural experiments and synthetic control methods [38]. Their findings demonstrate that carbon trading policies can substantially reduce emissions by optimizing regional energy structures. This underscores the importance of clustering studies focused on policy effectiveness and regional heterogeneity, which is essential for understanding the broader implications of carbon trading systems.
2.5. Contribution of The Proposed MOO-MCDM-PSOM Framework
This literature highlights the potential of the MOO-MCDM hybrid model in urban sustainability. However, existing studies often lack flexibility in handling complex, context-specific urban criteria and may rely on conventional clustering methods. The proposed framework bridges these gaps by integrating Fuzzy Delphi Method (FDM) for criteria identification, Stepwise Weight Assessment Ratio Analysis (SWARA) for adaptive weighting, Multi Attributive Border Approximation Area Comparison (MABAC) for data preparation, and PSOM for optimized clustering and mapping by incorporating Random Forest for predictive modelling. This framework provides a more accurate, adaptable method for clustering cities based on diverse urban characteristics, supporting city-specific carbon trade policies. The literature suggests that a hybrid MOO-MCDM-PSOM approach can balance environmental and economic goals while adapting to sector-specific needs, offering a scalable and versatile tool for optimizing city-level carbon trading policies and advancing urban sustainability.
3. Materials and Methods
This section explains the proposed MOO-MDCM-PSOM hybrid model through practical cases in major cities to show how the proposed methodology can assist city planners in implementing carbon trade policies and evaluate the impact of different policies on technology choices in the long term.
3.1. Identification of Aspect and Criteria
Based on a review of several previous studies, several aspects are summarized, including economics [39] involving Gross Domestic Product (GDP), Industrial Composition (IC), Energy Efficiency (EE), Innovation Capabilities (ICA), and Infrastructure Quality (IQ) as criteria. The next, social aspect [40] involves Population Density (PD), Equity and Inclusion (EI), Public Transport Quality (PTQ), and Urban Planning (UP). Environmental aspect [41,42] involves Per Capita Emissions (PCE), Energy Mix Renewable (IMR), Waste to Energy (W2E), Land Use Planning (LUP), Climate Resilience Plans (CRP), and Green Infrastructure (GI) as criteria. Finally, the political aspect [43] involves the Regulatory Support (RS) criterion related to implementing carbon trade policies for a city.
3.2. Proposed Hybrid MOO-MCDM-PSOM
MOO and MCDM are operations research disciplines that aim to help make the best decisions in complex problems [44]. The process of assigning weights to criteria employs the reciprocal methodology, which computes the magnitude of the weight values, taking into account the varying significance of the indices order [45]. The Fuzzy Delphi offers a resilient framework adept at managing uncertainties and ambiguities, acknowledging that decision-making processes are often hindered by incomplete or imprecise information [46,47]. The effectiveness of the fuzzy decision-making method is assessed by evaluating the equilibrium between convergence and the diversity of non-dominated solutions, employing criteria distinct from conventional quality performance indicators. The research design is illustrated in Figure 1.
The approach of Fuzzy Delphi - SWARA is particularly relevant for organizations and policymakers who want to strategize based on uncertain data but still want to get reliable results [48]. The SWARA method is an efficient approach to evaluating criteria by prioritizing criteria in ascending order based on expected meaning through consultation with experts [49,50]. Furthermore, Lorenzoni [54] supports it, stating that the FDM enables comprehensive analysis without additional computational load and steep learning curves compared to more complex methods. The explanation of decision-making using the hybrid approach of MOO-MCDM-PSOM based on the flowchart is as follows:
Step 1. The threshold value is determined using the equation:
The dataset utilizes triangular fuzzy numbers to determine a threshold value (d). The threshold value (d) must adhere to the condition of being less than or equal to 0.2.
Step 2. Determining the value of the fuzzy score using the equation:
where, “” is the number of experts. Variable “”, “”, and “” are the aggregated lower bound, middle bound, and upper bound, respectively.
MCDM makes it easy for participants to express their opinions and achieve the best computer solution [51]. The SWARA method is an efficient approach to evaluating criteria based on knowledge, experience, and implicit information, as well as the opinions of experts or group interests on the importance of the weighting process [52].
Step 3. Do the summation of expert/expert assessments for each criterion and find the average value in each opinion value [53], as written using the equation:
Step 4. Finding the Comparative Value (Sj) and value of the coefficient (Kj) using the equation:
Step 5. Recalculate the weight of qj using the equation:
Step 6. Determine the weight using the equation:
After assigning weights to each criterion, the next step is to apply the procedure to the MABAC method as follows [54]:
Step 7. Formating matrix (X) by evaluation of “m” alternatives according to “n” criteria, which the alternatives in the form of vectors , where Is the value of the “I -th” alternative according to the “j -th” criterion (), and calculated using the equation:
Step 8. Normalization of the elements from the initial matrix using the equation:
Step 9. Determining the elements of the normalized matrix (N) using the equation:
Step 10. Calculate the elements from the weighted matrix (V) using the equation:
where is the elements of the normalized matrix (N), and is the weight coefficients of the factor and criteria.
Step 11. Determining the border approximation area matrix “G” for each criterion using the equation:
Step 12. Calculating the distance of the alternative from the border approximation area for the matrix elements (Q) using the equation:
Q = V - G
A Self-Organizing Map (SOM) neural network is a competitive, unsupervised learning model capable of self-regulation and independent learning [55]. This study applies the Particle Swarm Optimization (PSO) algorithm to produce the optimal initial weight used in the SOM clustering process. PSO can be easily adapted and modified to suit different optimization problems [56]. The PSO method can improve the parameter optimization process and allow for efficient exploration of weight values [57], resulting in increased convergence speed and accuracy in neural network models. Stages are as follows:
Step 13. Evaluate the quality of the SOM clustering by calculating the quantization error using the equation:
where,
QE: The quantization error.
N: The number of data points.
xi: The input data point.
wj: The weight of the neuron.
This error quantifies how well the SOM has mapped the data, with lower values indicating better clustering performance.
Step 14. Adjust the SOM weights based on the training data using the equation:
where,
x: The input data.
wj(t) : The weight of neuron j at time t.
σ(t): Represents the width of the neighbourhood at time t.
This equation adjusts the weights of neurons in the SOM based on their proximity to the input data point, with closer neurons having a larger influence.
Step 15. Update particle position and velocity using the equation:
where,
Vi(t+1) : The new velocity of particle i.
Vi(t) : The current velocity of particle i.
pBest(i) : The best position found by particle i.
gBest : The global best position found by all particles.
rand() : Generates a random value.
The values of “w”, “c1”, and “c2” are constants controlling the influence of previous velocity and the attraction to the best-known positions. This update ensures particles move toward promising regions in the solution space based on personal and collective experiences.
Step 16. Update the position of particle based on its new velocity using the equation:
where,
Xi(t+1) : The updated position of the particle.
Xi(t) : The current position of particle i.
Vi(t+1) : The updated velocity of particle i.
The equation moves particle through the solution space toward optimal solutions.
Step 17. Finding the shortest distance from each output neuron to the input data using the equation:
where, “Di” is the distance from the input data point xi to the weight vector wi.
This equation helps identify the best-matching neuron (BMU) for each input point, a core process in SOM.
Step 18. Update the neighbouring weight for each weight (wij) using the equation:
where,
Wij(t) : The weight of the neuron j at time t.
α(t) : The learning rate at time t.
h(t) : The function that controls the range of influence of the BMU.
Xi(t) : The input data point at time t.
This equation adjusts the weights of neurons in the BMU to help the SOM map the data more accurately.
Step19. The centroid of each cluster is simply the final weight of the neurons, written using the equation:
where, is Wjk is the weight vector of neuron “j” in cluster k.
Centroidk = Weightjk
The FDM, SWARA, MABAC, and PSOM grouping logic form a robust and adaptive model that ensures consistent performance across various urban contexts. This integrated approach comprehensively evaluates carbon trading policies, facilitating more informed decision-making for city planners and policymakers.
3.3. Data Collection
The sources of information used in the proposed methodology hybrid analysis process include, the Indonesian Ministry of Environment and Foresti, Central Bureau of Statistics, Local Government Report, World Bank, and Academic Research. Specifically, some of the data collection techniques carried out are as follows:
- Collection of data from a variety of sources, including policy documents, urban economic indicators, and environmental impact reports from municipalities.
- Cities are selected based on criteria such as their participation in carbon trading markets, availability of emissions data, and variation in policy implementation to ensure a representative sample for the MCDM process.
- The PSOM algorithm is used to optimize data extraction from various sources with adjustments based on feedback rounds to fine-tune policy impact modelling. In addition, qualitative data from stakeholder interviews will be integrated using the MCDM framework to align carbon policy trade-offs with city-level priorities.
The strength of the data is ensured through cross-verification with official sources to ensure that the multi-purpose model accurately reflects the impact of the policy.
4. Result and Discussion
This section explains the proposed hybrid models through practical cases in major cities in Indonesia. This case study aims to show how the methodology we developed can assist city planners in implementing carbon trade policies and evaluate the impact of different policies on technology choices in the long term. Furthermore, providing information to policymakers to prioritize environmental interests.
4.1. Application of hybrid MOO-MCDM-PSOM
MOO effectively improves decision-making processes in engineering applications, showcasing the potential for solving complex decision problems with conflicting objectives in production environments. This study involves experts in determining the index priority scale of each criterion that has been compiled using the FDM with the fuzzy scale:
Totally Agree (T) = 5{1.0;0.8;0.6}
Agree (A) = 4{0.8;0.6;0.4}
Simply Agree (S) = 3{0.6;0.4;0.2}
Less Agree (L) = 2{0.4;0.2;0.0}
Disagree (D) = 1{0.2;0.0;0.0}
The scoring results and the calculation of the consensus value of each criterion are displayed in Table 1.
The comparison of the optimization results of each criterion using NSGA-II and FDM is shown in Figure 2.
The optimization results for each criterion, as depicted in Figure 2, show that the FDM method shows a more comprehensive optimization over a wider range of criteria. In contrast, the NSGA-II algorithm shows limited optimization to a narrower subset of criteria. Therefore, each criterion's index decision is determined as EE, PCE, GDP, IC, EI, PD, ICA, RS, GI, IMR, LUP, CRP, W2E, UP, IQ, and PTQ.
The first step in implementing MCDM is to determine the weight of each criterion using the SWARA method, where an index between 1 and 16 influences the weight value of each criterion, as shown in Table 2. The MABAC method is applied using the weight of each criterion in the 6th column.
Based on the data in Table 3, it is stated that each sub-criterion consists of a benefit or cost category, where the value is determined based on the character of a criterion [58]. Each criterion consists of a set of subcriteria, as shown in Table 4.
After determining the weight and scale of the assessment based on the criteria and subcriteria, the test data of each city was calculated using the MABAC method. The score data for each city is shown in Table 5.
Table 5 displays carbon emission reduction data for several cities listed in Indonesia's Nationally Determined Contribution (NDC). However, due to the confidentiality agreement, acquiring up-to-date data for some variables cannot be acquired. The next stage is to determine the value of the decision matrix for each city based on criteria. The results are shown in Table 6.
The next stage is to calculate estimated the border area matrix (G) against 16 criteria (1/16), where the results are as follows: G ={EE: 0.336}; {PCE: 0.178); {GDP: 0.146}; {IC: 0.121}; {EI: 0.179}; {PD: 0.132}; {ICA: 0.106}; {RS: 0.114}; {GI: 0.047}; {IMR: 0.048}; {LUP: 0.030}; {CRP:0.025}; {W2E: 0.030}; {UP: 0.020}; {IQ: 0.035}; {PTQ: 0.032}. The border area matrix values are used to determine the values of the alternative distance matrix elements of the approximate border area (Q). Result of the calculation is shown in Figure 3
Based on the illustration of the results of the MABAC method calculation in Figure 3, it can group the cities into three approximate border areas that reflect aspect in economic, social, political, and environmental performance:
- Positive Border Area:
Includes Jakarta, Surabaya, Bandung, and Semarang, reflecting high-performance areas that likely serve as central hubs for development and resources. These cities are likely to be well-developed and attractive for investments and workforce inflows, offering strong infrastructure and better socio-political stability. Each recommended city should focus on sustaining growth and addressing emerging urbanization and resource needs challenges.
- Intermediate Border Area:
Includes Yogyakarta, Makassar, and Palembang, which represent transitional zones, showing moderate levels of development and stability. This cluster is a bridge between core and peripheral areas with growth potential. It could benefit from spillover effects from core cities and targeted policies to enhance infrastructure and economic opportunities. Each recommended city should focus on Providing fiscal incentives to attract industries in the manufacturing, tourism, and tech sectors. Furthermore, Engage local communities in development planning to ensure equitable resource distribution.
- Negative Border Area:
Includes Medan, Pontianak, Denpasar, and Banjarmasin, which represent areas with weaker economic and social indicators that are potentially limited by resource constraints or geographic isolation. These cities may face more significant barriers to development. They might require special support and intervention to improve infrastructure, governance, and economic opportunities, helping to integrate them with more developed regions. It is recommended that each city carry out policy priorities that include the problem of fundamental disparities and encourage inclusive growth.
Next, the values generated by grouping cities based on indicators serve as the input for the clustering process of each city's carbon trade policy using PSOM. These carbon trade policies are represented through distinct clusters: Policy-A (C1) involves carbon trading with fiscal incentives for green industries, Policy-B (C2) implements carbon trading with strict regulations and penalties for violators, and Policy-C (C3) adopts a flexible cap-and-trade scheme for carbon trading.
The data from the calculation of the distance matrix element in Table 7 and Table 8 are determined as an input to the clustering process using PSOM, which is done repeatedly until it reaches convergence. The PSO optimization process involves the following:
- Particle initialization is when particles are initialized with random positions as small random weights and speeds, allowing hordes to explore the solution space.
- Speed and position update, where each particle updates its velocity based on three components: inertia, cognitive influence, and social influence, where the balance between exploration and convergence helps the swarm refine the search.
- Fitness evaluation is that each particle position is evaluated with a fitness function, where if a new position of a particle results in a lower quantization error than the previously known position, then its most famous position and score to be updated.
- The swarm's global best position and score are updated if any particle finds a new minimum quantization error.
Once the iteration is complete, the global best position represents the weight configuration with the lowest quantization error, corresponding to the optimal weight for the SOM. These weights are reshaped to fit the 1x3 SOM grid, resulting in the final configuration: [0.592; 0.688; 0.781], [0.640; 0.270; 0.288], [0.428; 0.689; 0.641]. This configuration effectively minimizes quantization errors, providing optimal mapping of data sets to SOM structures. The centroid cluster values in the last iteration are shown in Table 9.
Based on the results of testing all stages, illustrated in Table 9, the analysis connects each city’s characteristics to its respective cluster and policy, demonstrating a tailored approach to carbon trading policies:
- Policy-A, with Fiscal Incentives:
Applied to cities with high sustainability potential but emerging economic and infrastructure indicators. This policy encourages green industry growth through targeted incentives.
- Policy-B, with Strict Regulations:
Implemented in cities with balanced development across all dimensions. Penalties are used to enforce sustainable practices and discourage non-compliance.
- Policy-C, with Flexible Cap-and-Trade:
Designed for economically advanced cities with less developed sustainability infrastructure, allowing these cities to adapt to carbon targets gradually
4.2. Sensitivity Test
In evaluating the effectiveness of carbon trade policies using MCDM, sensitivity tests can help identify how sensitive changes in the weight of criteria are to carbon trade policy outcomes. Changes in the weight of the criteria based on 4 aspects are shown in Table 10.
The test is carried out by adding a value of 0.5 to each criterion in an aspect. Given an example:
Input = [EE;0.75], [PCE;6], [GDP;40000], [IC;0.5], [EI;0.8], [PD;15000], [ICA;0.7],[RS; 0.85], [GI;0.8], [IMR;0.25], [LUP;0.7], [CRP;0.85], [W2E;0.3], [UP;0.8], [IQ;0.8], [PTQ;0.07].
Decision Matrix (X):
EE (0.5) = (0.297-0.3966) / (0.178-0.3966)
PCE (0) = (0.389-0.3966) / (0.389-0.3966)
Weighted matrix Border(V):
EE (1.063) = (1.063 * 0.68753) + 1.063.
Element Border (Q):
EE (-0.072) = 1.063 – 1.135.
Score (S) = (-0.072) + (0.111) + (0.531) + (0.521) + (-0.012) + 0.020 + (-0.164) + (-0.011) + (-0.009) + (-0.018) + (-0.006) + (-0.005) + (-0.013) + (-0.005) + (1.009) + (-0.006)
= 1.8728 (Positive Area).
As shown in Table 10, weight adjustments were analyzed across several cities, suggesting that an enhanced hybrid approach with SWARA's adaptive weighting mechanism can respond effectively to different priorities. This confirms the resilience of the methodology in representing the diverse urban characteristics in the evaluation framework. The results of the calculation of each aspect and criterion are illustrated in Figure 4.
Based on the results of the calculation, it is known that the economic criteria affect the carbon trade policy in the city of Medan. Furthermore, the social aspect affects carbon trade policies in Jakarta, Medan, Denpasar, Balikpapan, Yogyakarta, Malang, Batam, Banjarmasin, and Pontianak. The cities that were not affected by the change in the weight of the criteria were Surabaya and Bandung. Overall, the division of cities by decision matrix area is shown in Table 11.
Overall, data in Table 11 shows that aspect of economic performance is strong, but social, environmental, and political issues need attention for balanced development.
4.3. Identification of Patterns in Policy Effectiveness Using PSOM
Changes in the results of carbon trade policy mapping are influenced by the input value of each criterion that describes the condition of a city from the perspective of implementing carbon trade policy. The PSOM process involves preparing and normalizing data, optimizing the weights with PSO, training data, identifying centroids, and analyzing cities in clusters with SOM. The results are shown in Table 12.
Based on the results of calculating the centroid value of PSOM for each city based on various aspects, it is known that all cities have diverse economic, social, environmental, and political profiles. The result is illustrated in Figure 5.
4.4. Comparative analysis
In order to gain knowledge related to the performance of the proposed methodology, this study compared PSOM with K-Medoid, Fuzzy C-Means (FCM) and K-Means. The stage calculation process in each method uses the data in Table 7 and Table 8 as input data. The overall test results are shown in Table 13.
Based on the comparison of clustering results using PSOM, K-Medoid, and K-Means in Table 13, it is known that cities tend to be in cluster C3 (76.9%), which recommends that the government implement carbon trade with Flexible Cap-and-Trade. The visualization result is shown in Figure 6.
By visualization in Figure 6, it is known that PSOM provides a two-dimensional grid that can be visualized, making it easier to interpret and understand the structure and distribution of the data. This visual representation helps identify data patterns, clusters, and relationships. K-Means and K-Medoid do not inherently offer a visual representation of the data distribution, making them less intuitive for understanding complex data structures [59]. PSOM offers significant advantages in topological preservation, handling non-linear data, flexibility, scalability, and visualization capabilities for complex clustering tasks and data exploration [60].
4.5. Machine Learning-Based Prediction Technique for Mapping Carbon Trade Policy
The clustering results using machine learning techniques are used to apply the developed model framework to predict the impact of low-carbon policies based on historical data and emerging trends. This data-driven predictive model approach allows for more accurate analysis so that the resulting decisions can provide more precise recommendations for policymakers. Considering the projected impacts in various scenarios, this approach is expected to support the formulation of effective and responsive low-carbon policies to environmental and economic dynamics.
The prediction technique in this study uses the random forest method by involving Table 5 as input data and Table 9 as predictor labels to help test the model with a wide variety of data.
Based on the illustration in Figure 7, an example of the calculation stages that occur on the Root Node: Top Node: x{4} <= 0.755 is explained as follows:
Calculate Gini for left note:
=
=
Calculate Gini for right note:
= =
Calculate the weighted Gini impurity for the split:
Gini = = .
The Gini impurity for the split at X{4}=0.755 is approximately 0.5102. This value represents this split's "impurity" level, and lower values indicate better class separation. The prediction model is applied by testing data from other cities, as shown in Table 14.
The calculation process uses the random forest method involving the test data in Table 14, where machine learning predicts and maps each city's carbon trade policy.
The analysis results presented in Figure 8 indicate that each policy can achieve optimal impact when adapted to individual cities' specific characteristics and needs. Policy-A, which provides fiscal incentives for the development of green industries, is particularly advantageous for cities such as Bogor and Ambon, which are characterized by relatively low economic scores. In these cases, the policy promotes sustainable economic growth by facilitating investments in green industries. Conversely, Policy-B, which imposes stringent regulations and sanctions for non-compliance, enhances governance structures and environmental quality in cities like Samarinda and Kendari, where there is a pronounced need for environmental improvements. Policy-C, employing a flexible cap-and-trade approach, is well-suited to cities such as Padang and Kupang that exhibit balanced scores across various dimensions, enabling them to implement emissions policies effectively while sustaining economic growth. This targeted policy framework allows each city to advance environmental, economic, and social objectives in alignment with their unique local capacities and priorities, thereby supporting broader climate change mitigation goals. The results of testing data testing using machine learning on training data formed through the MOO-MCDM-PSOM hybrid show that the prediction results can be a guide in mapping carbon trade in each city, which supports the government's application of IoT as a technological tool in decision-making.
5. Conclusions
This research demonstrates that integrating MCDM-MOO-PSOM and Random Forest methods creates a robust and adaptable framework for evaluating and mapping carbon trading policies across urban environments. By transforming this hybrid approach into a predictive machine learning model, the framework enhances decision-making by categorizing cities based on readiness, potential, and current conditions. This mapping facilitates more tailored and effective policy interventions, ensuring that strategies align closely with each city’s unique characteristics and local contexts.
The proposed model accommodates a broad range of economic, social, environmental, and political criteria, advancing beyond traditional single-method approaches by optimizing clustering precision and computational efficiency particularly valuable for large-scale, data-intensive applications. Compared to standalone methods like MCDM or SOM, the hybrid model demonstrates several distinct advantages. The MOO component effectively balances conflicting objectives, while the MCDM layer enables rigorous prioritization based on expert-weighted criteria. Furthermore, the PSOM method improves clustering performance by optimizing initial weight determination and reducing quantization errors, thus enhancing both accuracy and convergence speed. This efficiency supports real-time policy modeling, making the framework suitable for large and varied urban datasets where high levels of data variability are common.
In practical terms, this study provides actionable tools for city managers and policymakers, enabling them to implement carbon trading policies designed to directly support urban sustainability goals. The model's capacity to integrate real-time data facilitates continuous policy adjustments in response to evolving urban conditions, positioning it as a valuable asset for cities pursuing smart and sustainable growth. Additionally, the model’s scalability allows it to adapt to cities with varying infrastructure levels and data availability, making it highly versatile for diverse urban management contexts.
Nevertheless, this research is limited by data confidentiality constraints and integration challenges associated with combining MOO-MCDM-PSOM methods, which may complicate implementation. Furthermore, it is necessary to reach a consensus with the source researchers to build uniformity of views and terminology used by experts from different specialities. Future research should explore integrating this framework with IoT technologies to advance Smart City initiatives, particularly in carbon trade policy implementation. Ultimately, this approach holds promise for creating more sustainable urban environments by supporting informed, adaptive management of carbon trading policies responsive to real-time conditions and evolving urban needs.
Author Contributions
For research articles with several authors, a short paragraph specifying their individual contributions must be provided. The following statements should be used Conceptualization, M.F. and T.K.A.R; methodology, E.M.H.; software, D.D; validation, M.F, B.E.W.A and H.D.; formal analysis, R.N.; investigation, N.U.; resources, N.A.; data curation, S.W.; writing—original draft preparation, F.A.; writing—review and editing, S.Z.; visualization, M.F.; supervision, H.G; project administration, T.K.A.R; funding acquisition, S.W. All authors have read and agreed to the published version of the manuscript.
Funding
This research received no external funding.
Institutional Review Board Statement
Not applicable.
Informed Consent Statement
Not applicable.
Data Availability Statement
Data are contained within the article.
Conflicts of Interest
The authors declare no conflicts of interest.
References
- Cui, Y.; Feng, W.; Gu, X. Research on the Spatial Spillover Effect of Carbon Trading Market Development on Regional Emission Reduction. Front. Environ. Sci. 2024, 12. [Google Scholar] [CrossRef]
- Feng, X.; Zhao, Y.; Yan, R. Does Carbon Emission Trading Policy Has Emission Reduction Effect? —An Empirical Study Based on Quasi-Natural Experiment Method. J. Environ. Manage. 2024, 351, 119791. [Google Scholar] [CrossRef] [PubMed]
- Adetama, D. S.; Fauzi, A.; Juanda, B.; Hakim, D. B. A Policy Framework and Prediction on Low Carbon Development in the Agricultural Sector in Indonesia. Int. J. Sustain. Dev. Plan. 2022, 17(7), 2209–2219. [Google Scholar] [CrossRef]
- Wang, M.; Wang, X.; Liu, Z.; Han, Z. How Can Carbon Trading Promote the Green Innovation Efficiency of Manufacturing Enterprises? Energy Strateg. Rev. 2024, 53, 101420. [Google Scholar] [CrossRef]
- Wang, Q.; Wang, L.; Li, R. Trade Openness Helps Move towards Carbon Neutrality—Insight from 114 Countries. Sustain. Dev. 2023, 32(1), 1081–1095. [Google Scholar] [CrossRef]
- Wang, X.; Cho, S.-H.; Scheller-Wolf, A. Green Technology Development and Adoption: Competition, Regulation, and Uncertainty—A Global Game Approach. Manage. Sci. 2021, 67(1), 201–219. [Google Scholar] [CrossRef]
- Nasir, M.; Nguyen, C. P.; Le, T. N. L. Environmental Degradation &Amp; Role of Financialisation, Economic Development, Industrialisation and Trade Liberalisation. J. Environ. Manage. 2021, 277, 111471. [Google Scholar] [CrossRef] [PubMed]
- Chen, G. The Impact of Carbon Emissions Trading on the Total Factor Productivity of China’s Electric Power Enterprises—An Empirical Analysis Based on the Differences-in-Differences Model. Sustainability 2024, 16(7), 2832. [Google Scholar] [CrossRef]
- Shen, L.; Wang, X.; Liu, Q.; Wang, Y.; Lv, L.; Tang, R. Carbon Trading Mechanism, Low-Carbon E-Commerce Supply Chain and Sustainable Development. Mathematics 2021, 9(15), 1717. [Google Scholar] [CrossRef]
- Mao, T. The Impact of Carbon Emission and Carbon Price on International Trade Volume. Adv. Econ. Manag. Polit. Sci. 2024, 67(1), 7–11. [Google Scholar] [CrossRef]
- Han, J.; Yang, Y.; Yang, X.; Wang, D.; Wang, X.; Sun, P. Exploring Air Pollution Characteristics from Spatio-Temporal Perspective: A Case Study of the Top 10 Urban Agglomerations in China. Environ. Res. 2023, 224, 115512. [Google Scholar] [CrossRef]
- Hu, S.; Li, D.; Wang, X. Study on the Influence of Carbon Trading Pilot Policy on Energy Efficiency in Power Industry. Int. J. Clim. Chang. Strateg. Manag. 2023, 15(2), 159–175. [Google Scholar] [CrossRef]
- Wang, H.; Zhao, A.; Khan, M. Q.; Sun, W. Optimal Operation of Energy Hub Considering Reward-Punishment Ladder Carbon Trading and Electrothermal Demand Coupling. Energy 2024, 286, 129571. [Google Scholar] [CrossRef]
- Du, M.; Liu, Q.; MacDonald, G. K.; Liu, Y.; Lin, J.; Cui, Q.; Feng, K.; Chen, B.; Adeniran, J. A.; Yang, L.; Li, X.; Lyu, K.; Liu, Y. Examining the Sensitivity of Global CO 2 Emissions to Trade Restrictions over Multiple Years. Environ. Sci. Technol. Lett. 2022, 9(4), 293–298. [Google Scholar] [CrossRef]
- Kang, J.; Zhao, M. Agricultural Economic Evidence and Policy Prospects under Agricultural Trade Shocks and Carbon Dioxide Emissions. J. Environ. Public Health 2022, 2022, 1–9. [Google Scholar] [CrossRef]
- Chang, H.; Zhao, Y. The Impact of Carbon Trading on the “Quantity” and “Quality” of Green Technology Innovation: A Dynamic QCA Analysis Based on Carbon Trading Pilot Areas. Heliyon 2024, 10(3), e25668. [Google Scholar] [CrossRef] [PubMed]
- Wang, C.; Xia, Z.; Fan, S.; Gong, W. Energy Conservation and Emission Reduction Effect and Potential Emission Reduction Mechanism of China’s Thermal Power Generation Industry – Evidence from Carbon Emission Trading Policy. Polish J. Environ. Stud. 2023, 32(5), 4825–4839. [Google Scholar] [CrossRef] [PubMed]
- Liu, L.; He, Y.; Yang, D.; Liu, S. A Novel Three-Way Decision-Making Method for Logistics Enterprises’ Carbon Trading Considering Attribute Reduction and Hesitation Degree. Inf. Sci. (Ny). 2024, 658, 119996. [Google Scholar] [CrossRef]
- Asiva Noor Rachmayani. Comparing Different Approaches to Tackle the Challenges of Global Carbon Pricing; WTO Working Papers; 2022. [CrossRef]
- Nahtigal, M. Pathways from the (Semi) Periphery: Early Assessment of EU Mercosur Trade Agreement in Principle. Am. J. Trade Policy 2023, 10(2), 53–64. [Google Scholar] [CrossRef]
- Ma, W. A Comparative Study of Carbon Pricing Policies in China and the Scandinavian Countries: Lessons for Effective Climate Change Mitigation with a Focus on Sweden. E3S Web Conf. 2023, 424, 04005. [Google Scholar] [CrossRef]
- Wu, X.; Li, Z.; Tang, F. The Effect of Carbon Price Volatility on Firm Green Transitions: Evidence from Chinese Manufacturing Listed Firms. Energies 2022, 15(20), 7456. [Google Scholar] [CrossRef]
- Ferdous, J.; Bensebaa, F.; Milani, A. S.; Hewage, K.; Bhowmik, P.; Pelletier, N. Development of a Generic Decision Tree for the Integration of Multi-Criteria Decision-Making (MCDM) and Multi-Objective Optimization (MOO) Methods under Uncertainty to Facilitate Sustainability Assessment: A Methodical Review. Sustainability 2024, 16(7), 2684. [Google Scholar] [CrossRef]
- Alvarez Gallo, S.; Maheut, J. Multi-Criteria Analysis for the Evaluation of Urban Freight Logistics Solutions: A Systematic Literature Review. Mathematics 2023, 11(19), 4089. [Google Scholar] [CrossRef]
- Reyes-Norambuena, P.; Martinez-Torres, J.; Nemati, A.; Hashemkhani Zolfani, S.; Antucheviciene, J. Towards Sustainable Urban Futures: Integrating a Novel Grey Multi-Criteria Decision Making Model for Optimal Pedestrian Walkway Site Selection. Sustainability 2024, 16(11), 4437. [Google Scholar] [CrossRef]
- Keshavarz-Ghorabaee, M.; Amiri, M.; Zavadskas, E. K.; Turskis, Z.; Antuchevičienė, J. MCDM APPROACHES FOR EVALUATING URBAN AND PUBLIC TRANSPORTATION SYSTEMS: A SHORT REVIEW OF RECENT STUDIES. Transport 2022, 37(6), 411–425. [Google Scholar] [CrossRef]
- Xia, Q.; Li, L.; Dong, J.; Zhang, B. Reduction Effect and Mechanism Analysis of Carbon Trading Policy on Carbon Emissions from Land Use. Sustainability 2021, 13(17), 9558. [Google Scholar] [CrossRef]
- Zinatizadeh, S.; Azmi, A.; Monavari, S. M.; Sobhanardakani, S. Multi-Criteria Decision Making for Sustainability Evaluation in Urban Areas: A Case Study for Kermanshah City, Iran. Appl. Ecol. Environ. Res. 2017, 15(4), 1083–1100. [Google Scholar] [CrossRef]
- Kokkinos, K.; Karayannis, V.; Moustakas, K. Circular Bio-Economy via Energy Transition Supported by Fuzzy Cognitive Map Modeling towards Sustainable Low-Carbon Environment. Sci. Total Environ. 2020, 721, 137754. [Google Scholar] [CrossRef]
- Esmat, A.; Ghiassi-Farrokhfal, Y.; Gunkel, P. A.; Bergaentzlé, C.-M. A Decision Support System for Green and Economical Individual Heating Resource Planning. Appl. Energy 2023, 347, 121442. [Google Scholar] [CrossRef]
- Bian, J.; Song, Y.; Ding, C.; Cheng, J.; Li, S.; Li, G. Optimal Bidding Strategy for PV and BESSs in Joint Energy and Frequency Regulation Markets Considering Carbon Reduction Benefits. J. Mod. Power Syst. Clean Energy 2024, 12(2), 427–439. [Google Scholar] [CrossRef]
- Qin, M.; Xu, Q.; Liu, W.; Xu, Z. Low-carbon Economic Optimal Operation Strategy of Rural Multi-microgrids Based on Asymmetric Nash Bargaining. IET Gener. Transm. Distrib. 2024, 18(1), 24–38. [Google Scholar] [CrossRef]
- Baars, J.; Cerdas, F.; Heidrich, O. An Integrated Model to Conduct Multi-Criteria Technology Assessments: The Case of Electric Vehicle Batteries. Environ. Sci. Technol. 2023, 57(12), 5056–5067. [Google Scholar] [CrossRef]
- Cao, J.; Yang, Y.; Qu, N.; Xi, Y.; Guo, X.; Dong, Y. A Low-Carbon Economic Dispatch Method for Regional Integrated Energy System Based on Multi-Objective Chaotic Artificial Hummingbird Algorithm. Sci. Rep. 2024, 14(1), 4129. [Google Scholar] [CrossRef]
- Ding, J. Design of a Low Carbon Economy Model by Carbon Cycle Optimization in Supply Chain. Front. Ecol. Evol. 2023, 11. [Google Scholar] [CrossRef]
- He, H.; Wu, K. Research on Multi-Objective Optimization of Energy Power System under Low Carbon Constraints. J. Phys. Conf. Ser. 2023, 2442(1), 012022. [Google Scholar] [CrossRef]
- Li, L.; Dong, J.; Song, Y. Impact and Acting Path of Carbon Emission Trading on Carbon Emission Intensity of Construction Land: Evidence from Pilot Areas in China. Sustainability 2020, 12(19), 7843. [Google Scholar] [CrossRef]
- Zhang, X.; Tang, D.; Kong, S.; Wang, X.; Xu, T.; Boamah, V. The Carbon Effects of the Evolution of Node Status in the World Trade Network. Front. Environ. Sci. 2022, 10. [Google Scholar] [CrossRef]
- Chen, L.; Liu, Y.; Gao, Y.; Wang, J. Carbon Emission Trading Policy and Carbon Emission Efficiency: An Empirical Analysis of China’s Prefecture-Level Cities. Front. Energy Res. 2021, 9. [Google Scholar] [CrossRef]
- Yao, R.; Fei, Y.; Wang, Z.; Yao, X.; Yang, S. The Impact of China’s ETS on Corporate Green Governance Based on the Perspective of Corporate ESG Performance. Int. J. Environ. Res. Public Health 2023, 20(3), 2292. [Google Scholar] [CrossRef] [PubMed]
- Yu, W.; Luo, J. Impact on Carbon Intensity of Carbon Emission Trading—Evidence from a Pilot Program in 281 Cities in China. Int. J. Environ. Res. Public Health 2022, 19(19), 12483. [Google Scholar] [CrossRef] [PubMed]
- Li, C.; Li, N.; Zhang, Z.; Zhang, L.; Li, Z.; Liu, Y. Modeling Intercity CO2 Trading Scenarios in China: Complexity of Urban Networks Integrating Different Spatial Scales. Complexity 2022, 2022, 1–16. [Google Scholar] [CrossRef]
- Wang, T.; Sun, Y.; Wang, Y.; Yang, Y. Does Carbon Emissions Trading Facilitate Carbon Unlocking? Empirical Evidence from China. J. Econ. Stat. 2023. [Google Scholar] [CrossRef]
- Neira-Rodado, D.; Jimenez-Delgado, G.; Crespo, F.; Morales Espinosa, R. A.; Plazas Alvarez, J. R.; Hernandez, H. A Hybrid MOO/MCDM Optimization Approach to Improve Decision-Making in Multiobjective Optimization. In Lecture Notes in Computer Science (including subseries Lecture Notes in Artificial Intelligence and Lecture Notes in Bioinformatics); 2023; Vol. 14056 LNCS, pp 100–111. [CrossRef]
- Faisal, M.; Rahman, T. K. A. Optimally Enhancement Rural Development Support Using Hybrid Multy Object Optimization (MOO) and Clustering Methodologies: A Case South Sulawesi - Indonesia. Int. J. Sustain. Dev. Plan. 2023, 18(6), 1659–1669. [Google Scholar] [CrossRef]
- Mohammed, R. T.; Yaakob, R.; Sharef, N. M.; Abdullah, R. Unifying The Evaluation Criteria Of Many Objectives Optimization Using Fuzzy Delphi Method. Baghdad Sci. J. 2021, 4 (Suppl.)), 1423. [Google Scholar] [CrossRef]
- Faisal, M.; Rahman, T. K. A.; Mulyadi, I.; Aryasa, K.; Irmawati; Thamrin, M. A Novelty Decision-Making Based on Hybrid Indexing, Clustering, and Classification Methodologies: An Application to Map the Relevant Experts Against the Rural Problem. Decis. Mak. Appl. Manag. Eng. 2024, 7 (2), 132–171. [CrossRef]
- Thompson, E. A.; Kofi Alimo, P.; Abudu, R.; Lu, P. Towards Sustainable Freight Transportation in Africa: Complementarity of the Fuzzy Delphi and Best-Worst Methods. Sustain. Futur. 2024, 8, 100371. [Google Scholar] [CrossRef]
- Sarvari, H.; Baghbaderani, A. B.; Chan, D. W. M.; Beer, M. Determining the Significant Contributing Factors to the Occurrence of Human Errors in the Urban Construction Projects: A Delphi-SWARA Study Approach. Technol. Forecast. Soc. Change 2024, 205, 123512. [Google Scholar] [CrossRef]
- Faisal, M.; Irmawati, .; Rahman, T. K. A.; Jufri, .; Sahabuddin, .; Herlinah, .; Mulyadi, I. A Hybrid MOO, MCGDM, and Sentiment Analysis Methodologies for Enhancing Regional Expansion Planning: A Case Study Luwu - Indonesia. Int. J. Math. Eng. Manag. Sci. 2025, 10 (1), 163–188. [CrossRef]
- Carneiro, J.; Alves, P.; Marreiros, G.; Novais, P. Group Decision Support Systems for Current Times: Overcoming the Challenges of Dispersed Group Decision-Making. Neurocomputing 2021, 423, 735–746. [Google Scholar] [CrossRef]
- Lorenzoni, L. P.; Marchesan, T. B.; Siluk, J. C. M.; Rediske, G.; Ricci, M. R. Steps and Maturity of a Bioinput for Biological Control: A Delphi-SWARA Application. Biol. Control 2024, 191, 105477. [Google Scholar] [CrossRef]
- Soltani, E.; Mirzaei Aliabadi, M. Risk Assessment of Firefighting Job Using Hybrid SWARA-ARAS Methods in Fuzzy Environment. Heliyon 2023, 9(11), e22230. [Google Scholar] [CrossRef] [PubMed]
- Dai, X.; Li, H.; Zhou, L.; Wu, Q. The SMAA-MABAC Approach for Healthcare Supplier Selection in Belief Distribution Environment with Uncertainties. Eng. Appl. Artif. Intell. 2024, 129, 107654. [Google Scholar] [CrossRef]
- Qu, N.; Chen, J.; Zuo, J.; Liu, J. PSO–SOM Neural Network Algorithm for Series Arc Fault Detection. Adv. Math. Phys. 2020, 2020, 1–8. [Google Scholar] [CrossRef]
- Peng, J.; Shiliang, S.; Yi, L.; He, L. Research on Risk Identification of Coal and Gas Outburst Based on PSO-CSA. Math. Probl. Eng. 2023, 2023, 1–12. [Google Scholar] [CrossRef]
- Ge, A.; Lei, J.; Sun, M. Transformer Fault Diagnosis Based on Chaotic Particle Swarm Optimization RBF Neural Network. J. Phys. Conf. Ser. 2023, 2625(1), 012074. [Google Scholar] [CrossRef]
- Jufri, A. B. A. R. and H. S. Exploring the Impact of Social Media on Political Discourse: A Case Study of the Makassar Mayoral Election. Int. J. Adv. Technol. Eng. Explor. 2024, 11 (114). [CrossRef]
- Faisal, M.; Rahman, T. K. A. Optimally Enhancement Rural Development Support Using Hybrid Multy Object Optimization (MOO) and Clustering Methodologies: A Case South Sulawesi - Indonesia. Int. J. Sustain. Dev. Plan. 2023, 18(6), 1659–1669. [Google Scholar] [CrossRef]
- Faisal, M.; Rahman, T. K. A.; Mulyadi, I.; Aryasa, K.; Irmawati; Thamrin, M. A Novelty Decision-Making Based on Hybrid Indexing, Clustering, and Classification Methodologies: An Application to Map the Relevant Experts Against the Rural Problem. Decis. Mak. Appl. Manag. Eng. 2024, 7 (2), 132–171. [CrossRef]
Figure 1.
Research Design.
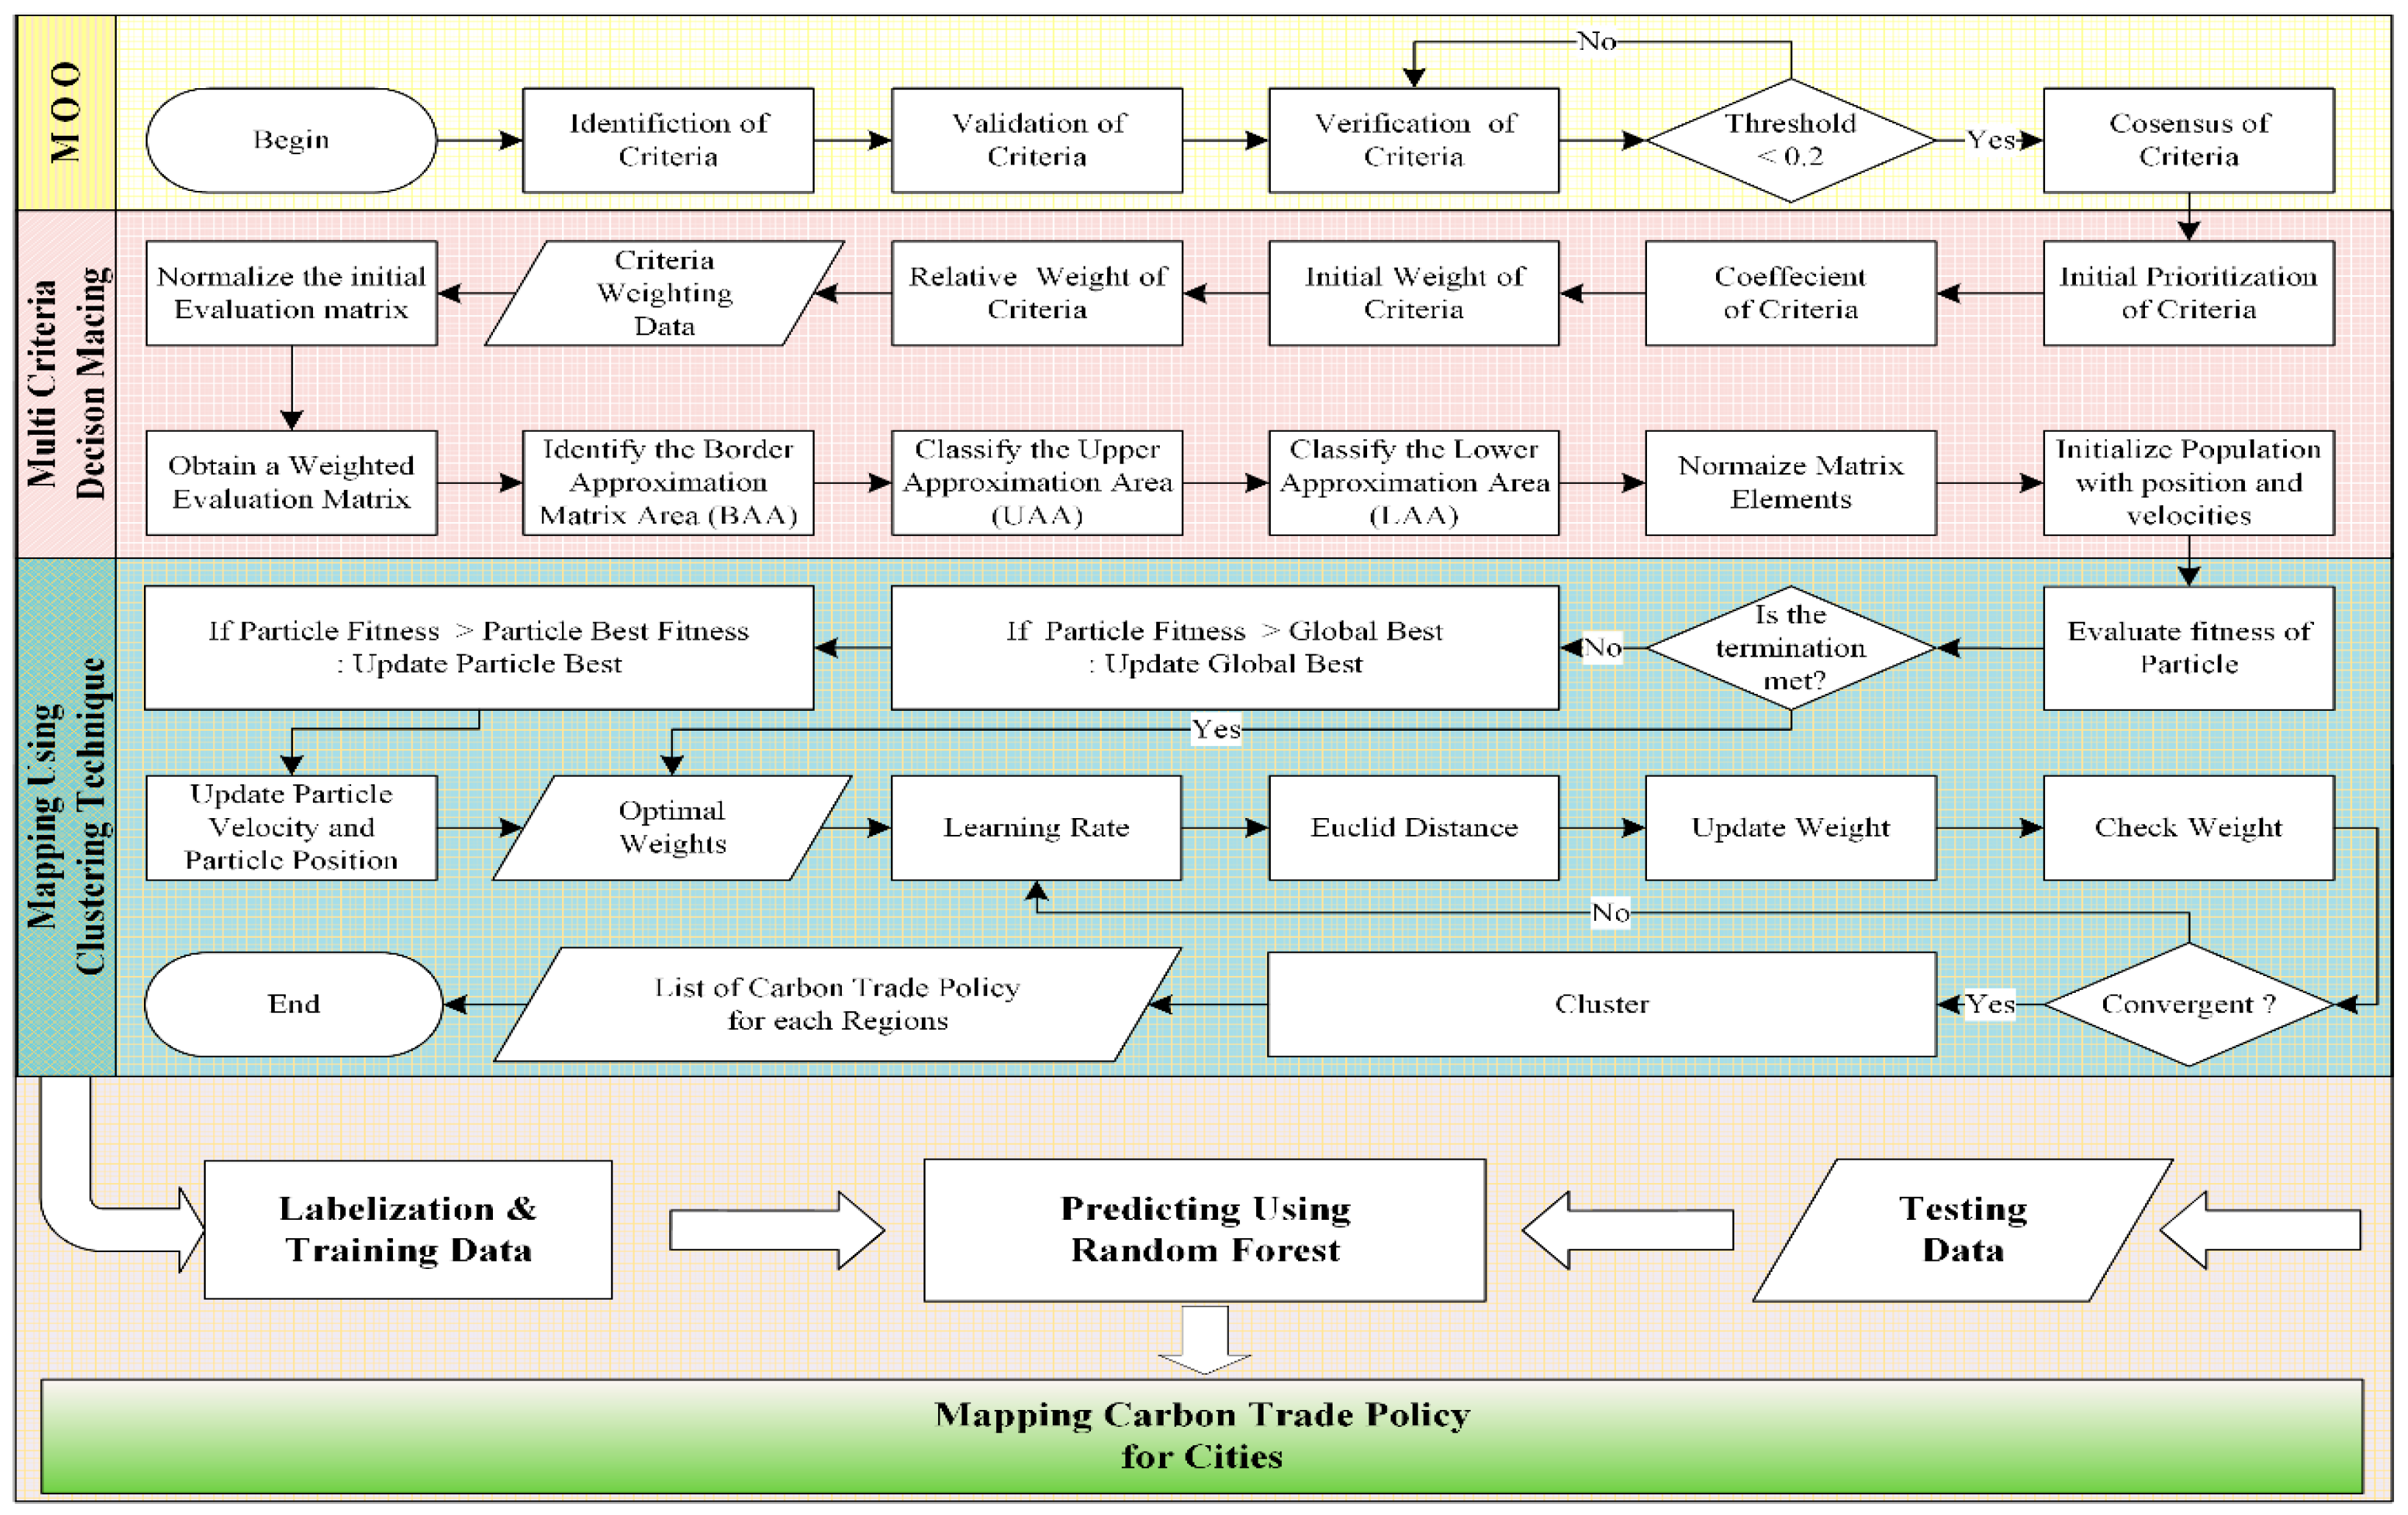
Figure 2.
The result of MOO for each criterion is NSGA-II and FDM.
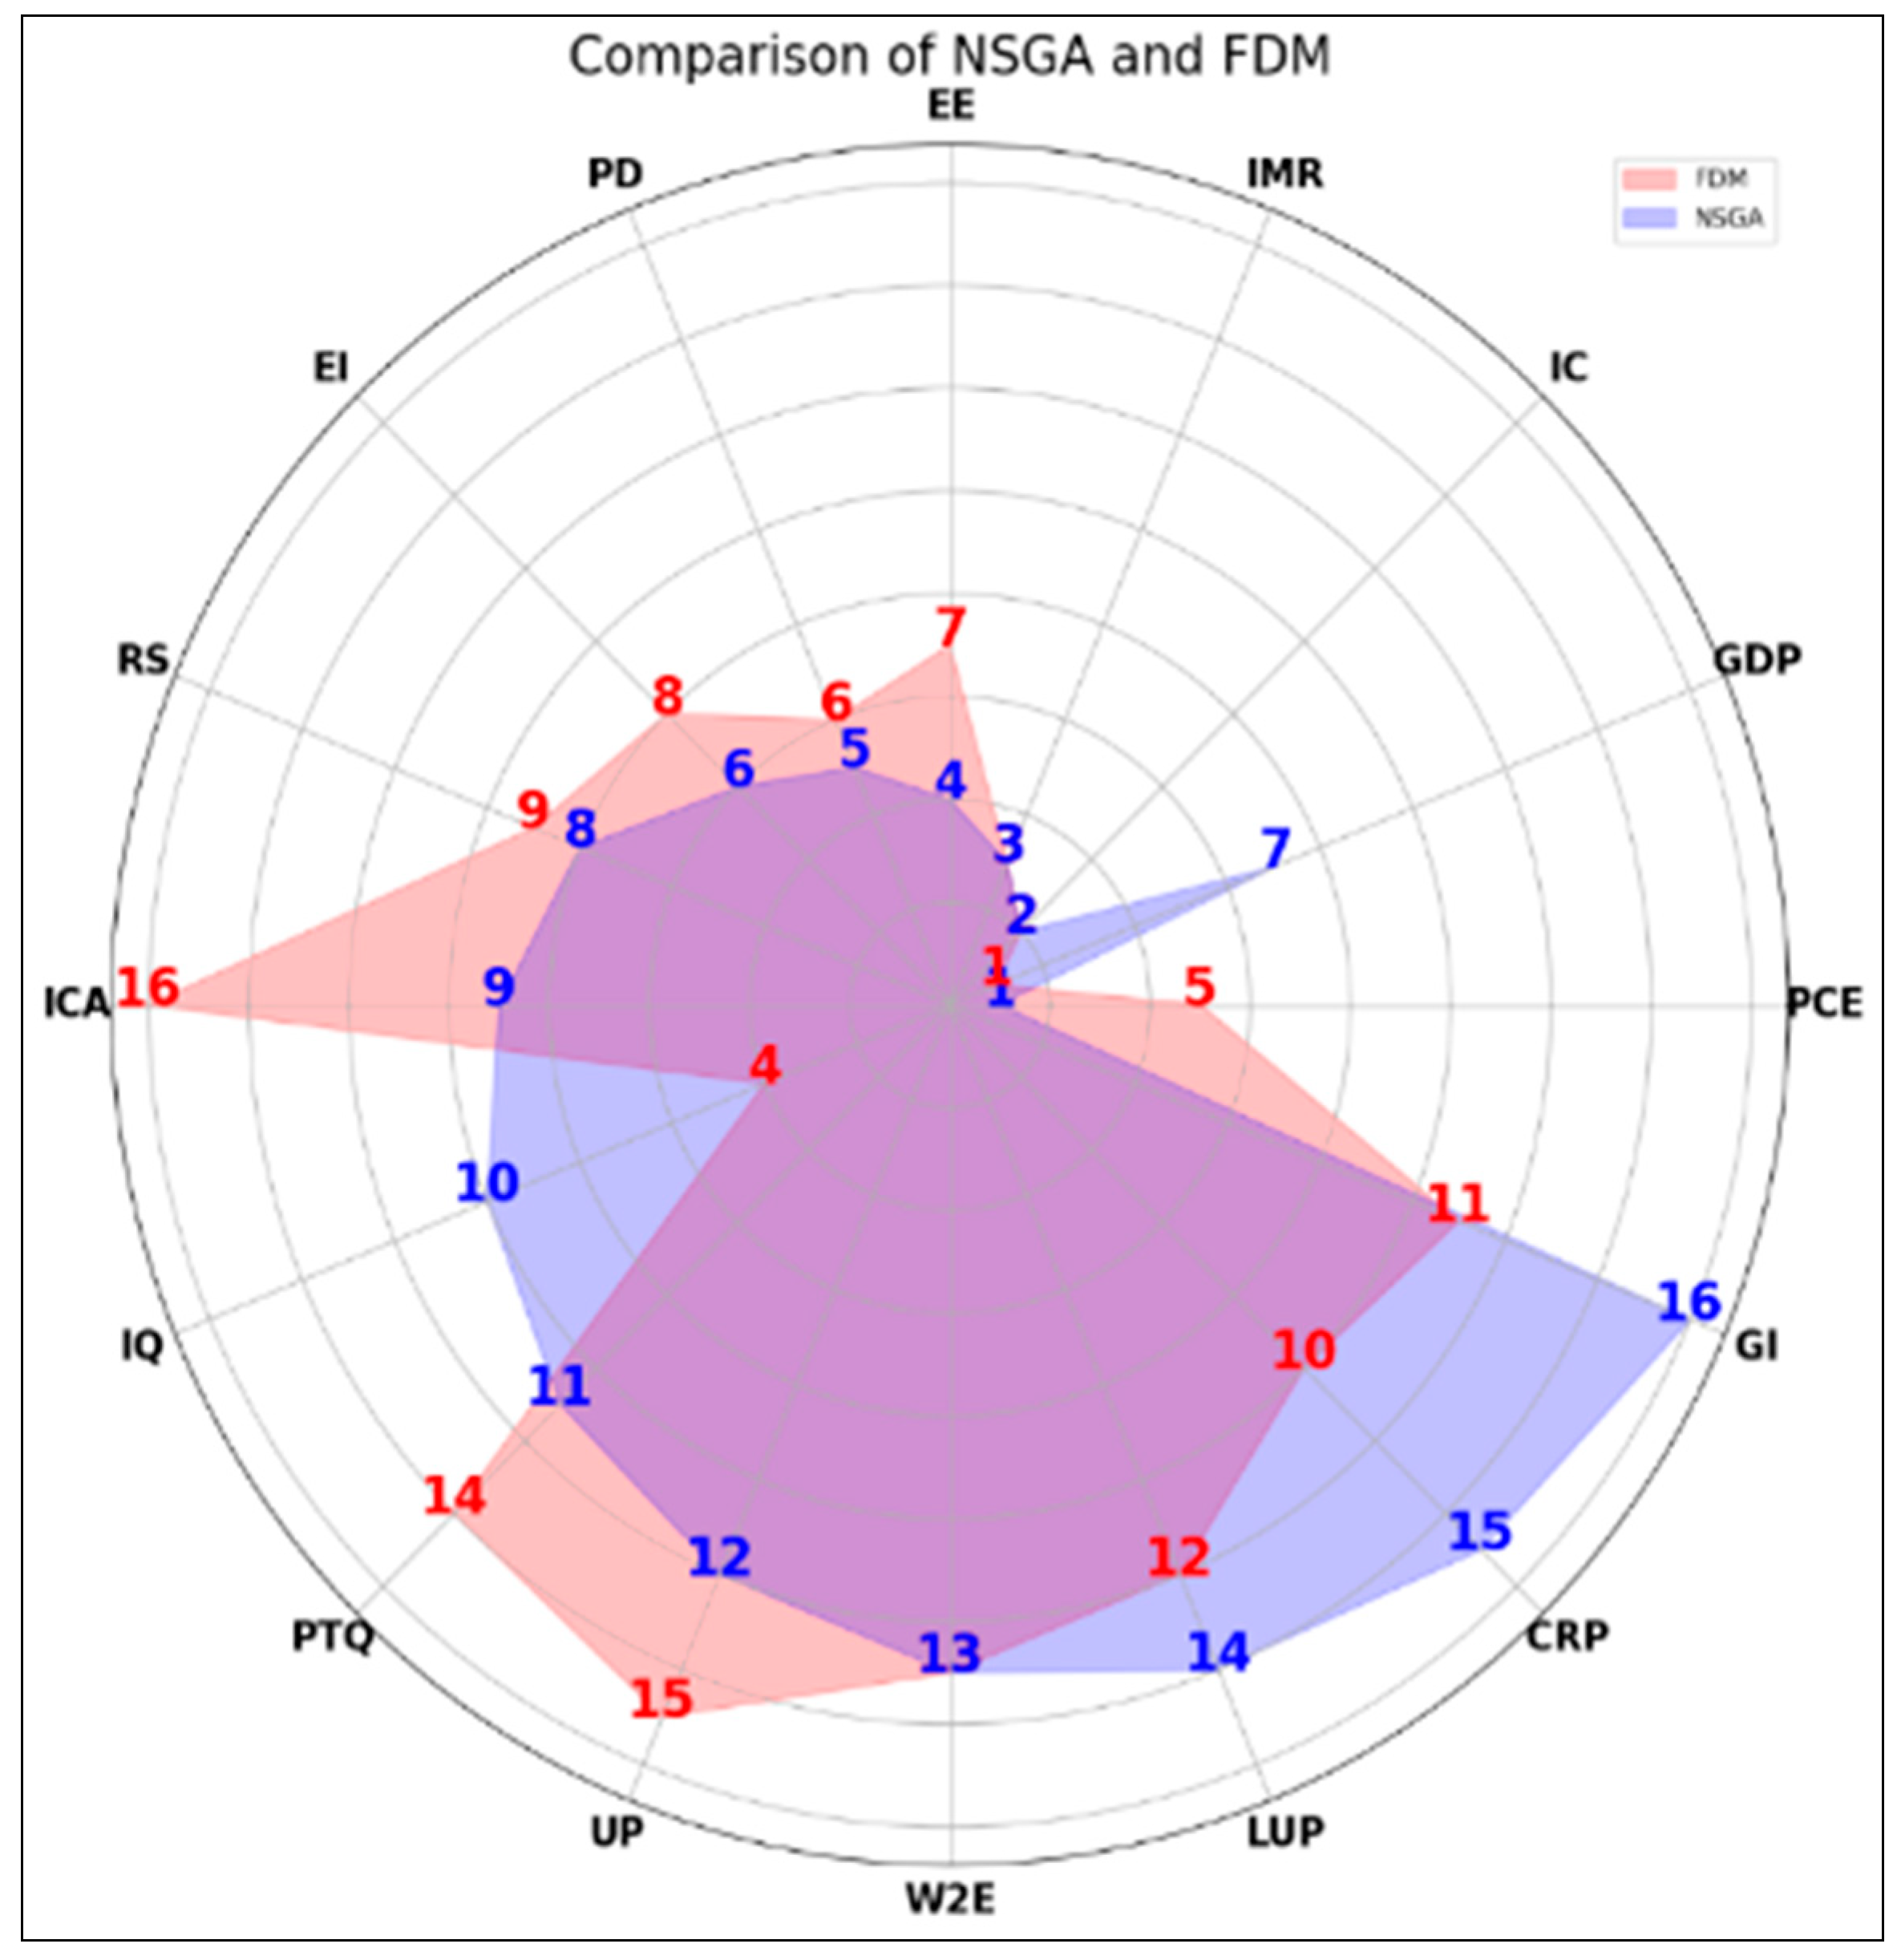
Figure 3.
Visualization of the value of the approximate border area (Q).
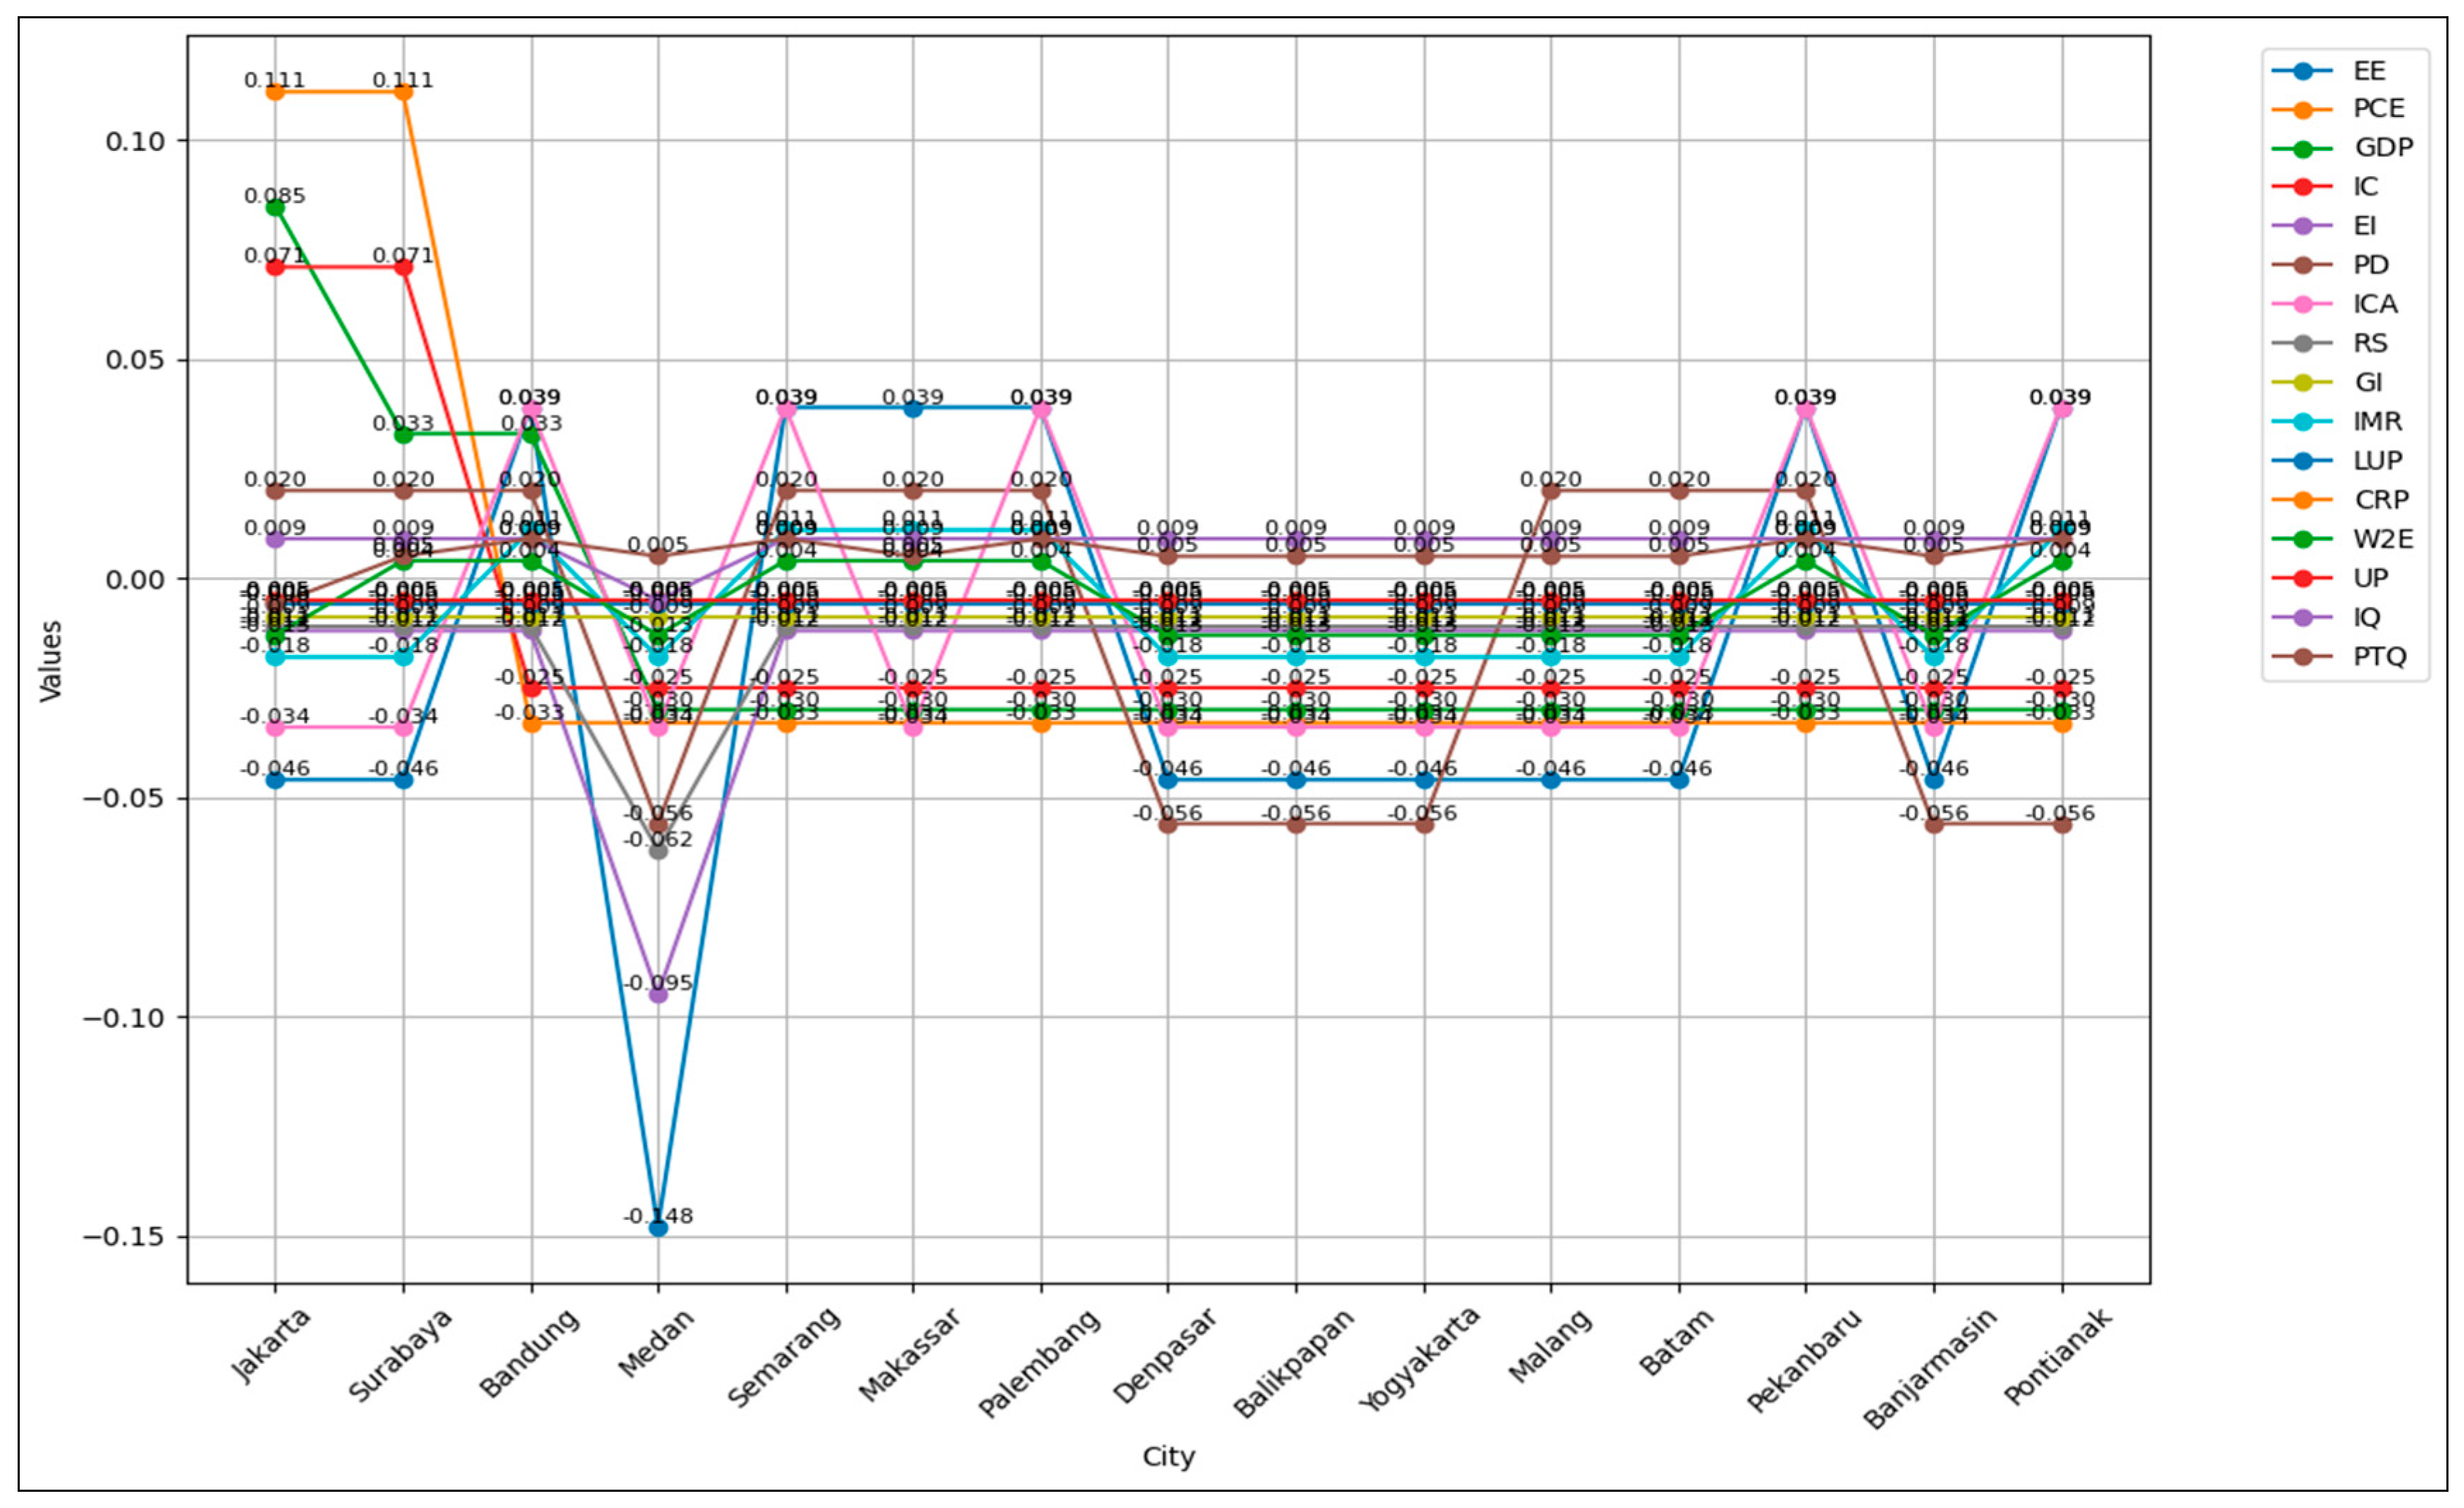
Figure 4.
Result of sensitivity test for each aspect and criteria.
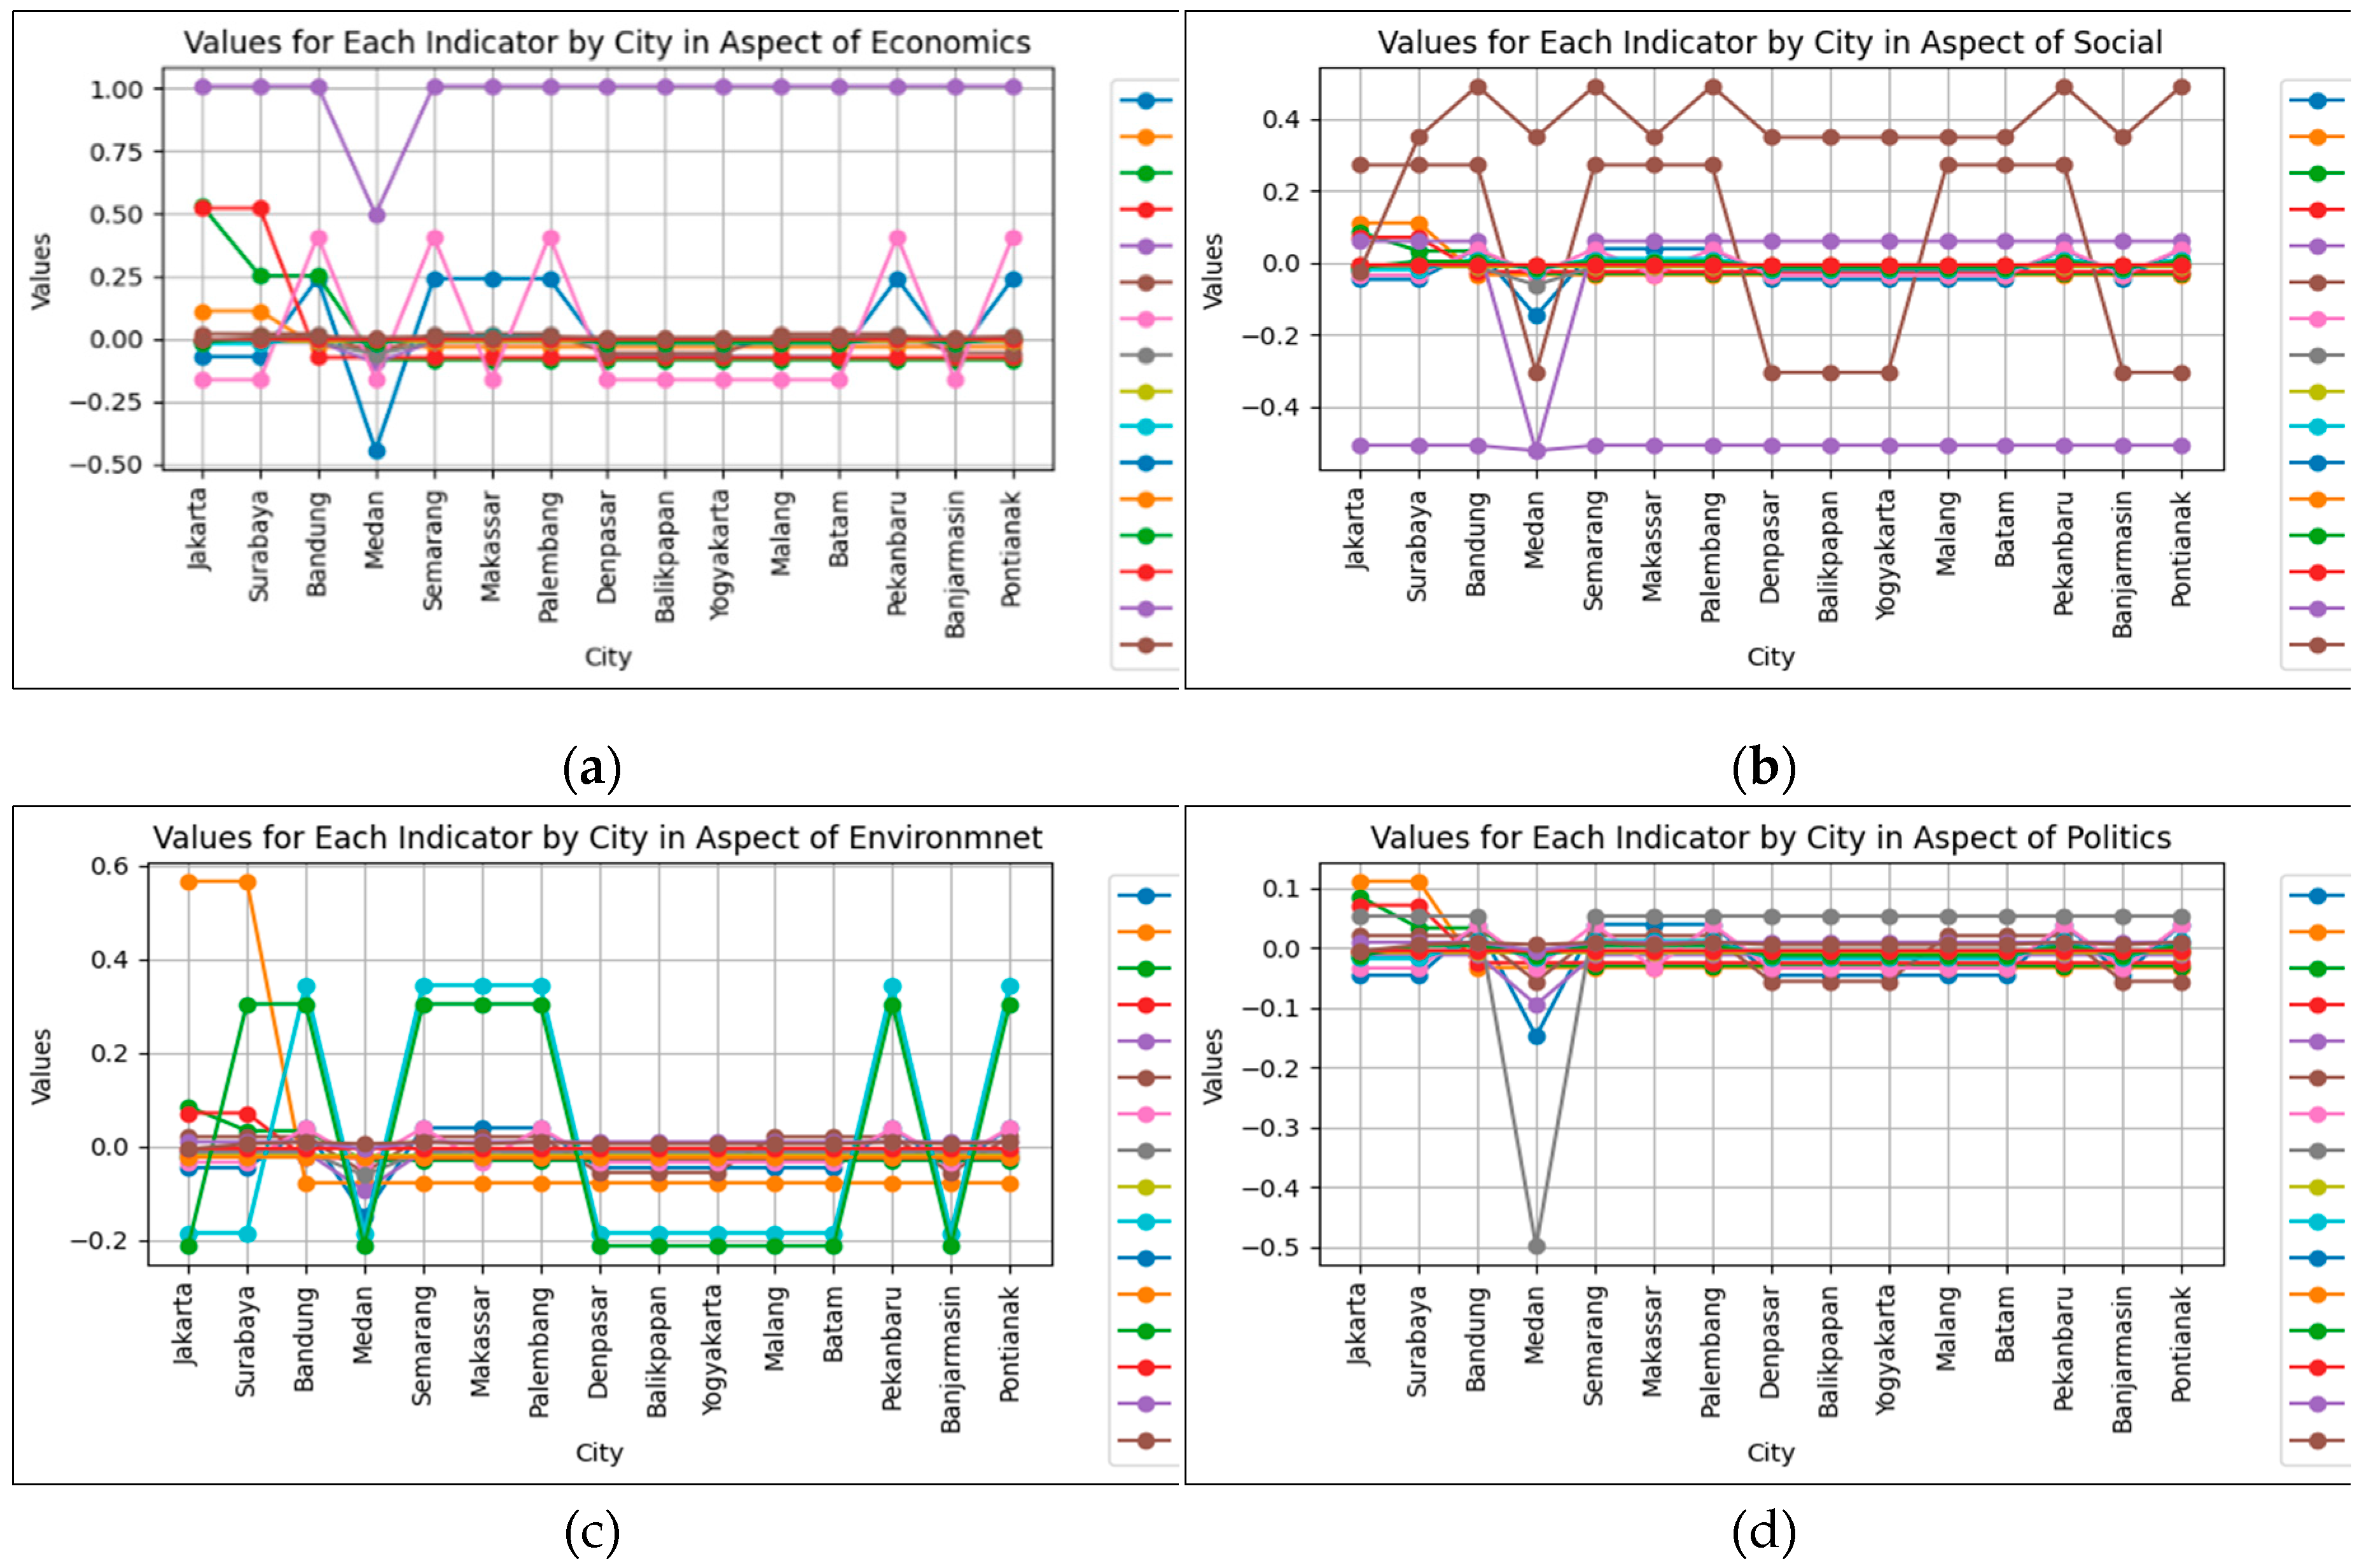
Figure 5.
Result of mapping carbon trade policy in each city based on aspects.
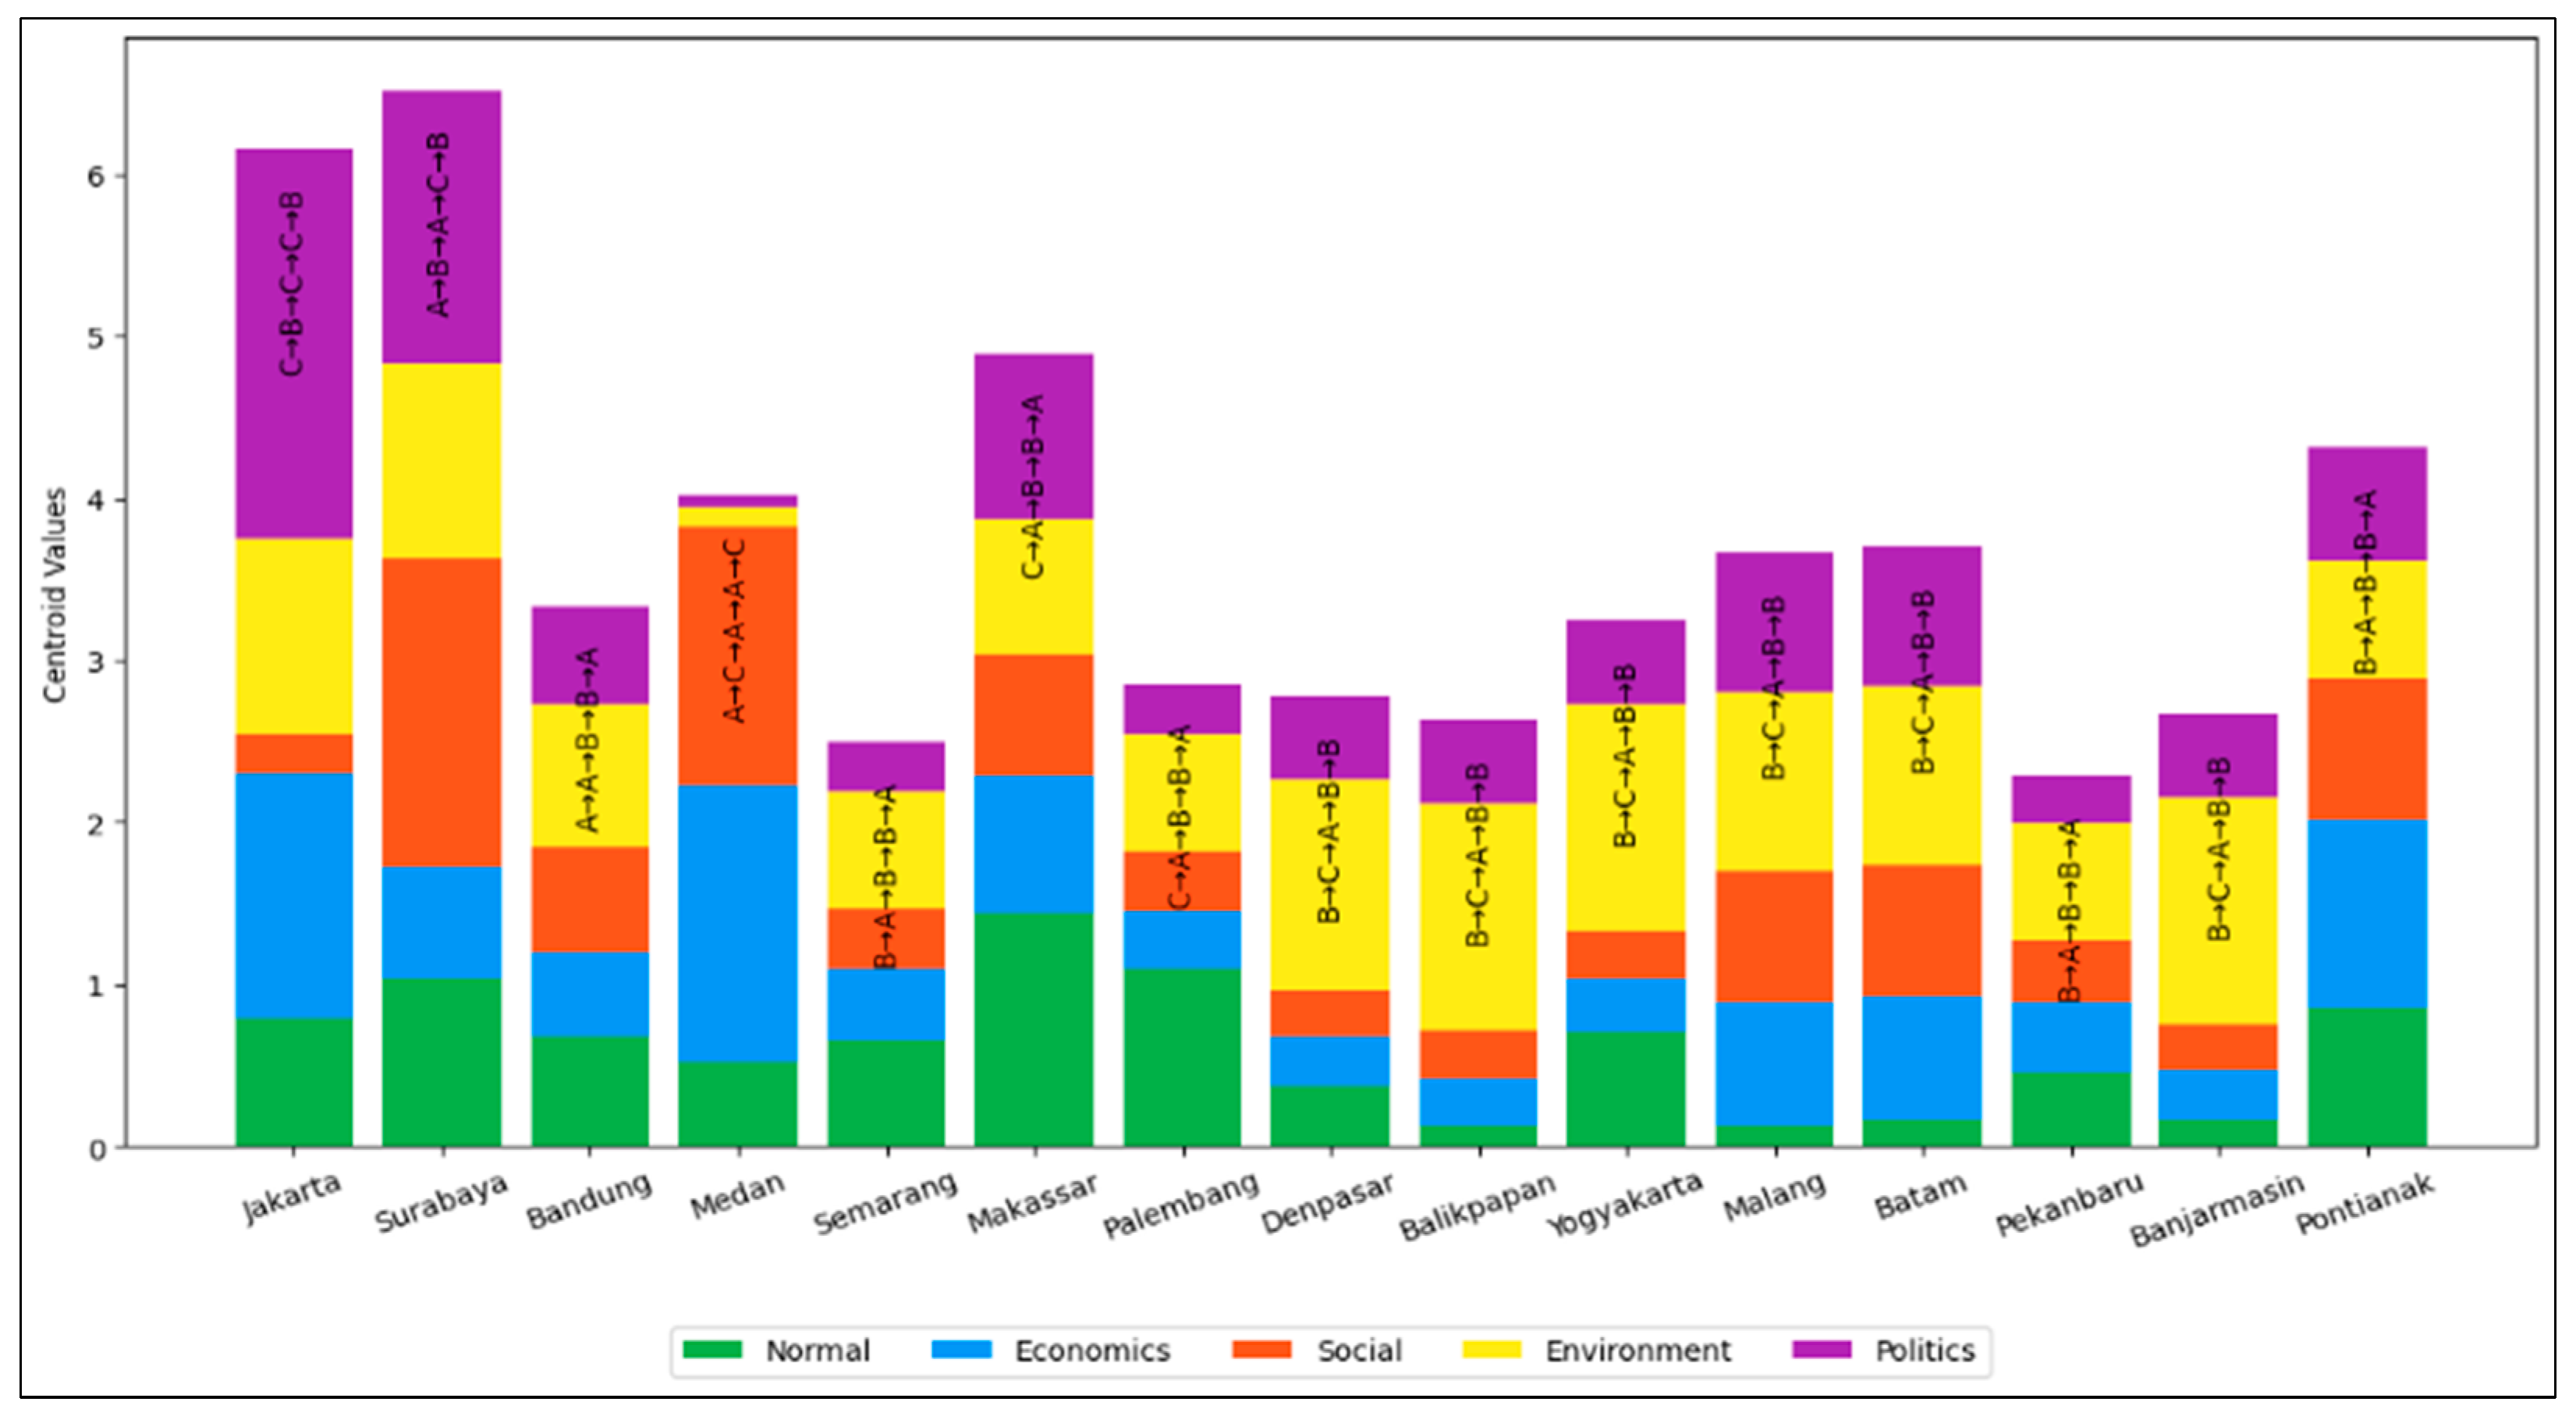
Figure 6.
Visualization of clustering using PSOM, K-Medoid, and K-Means.
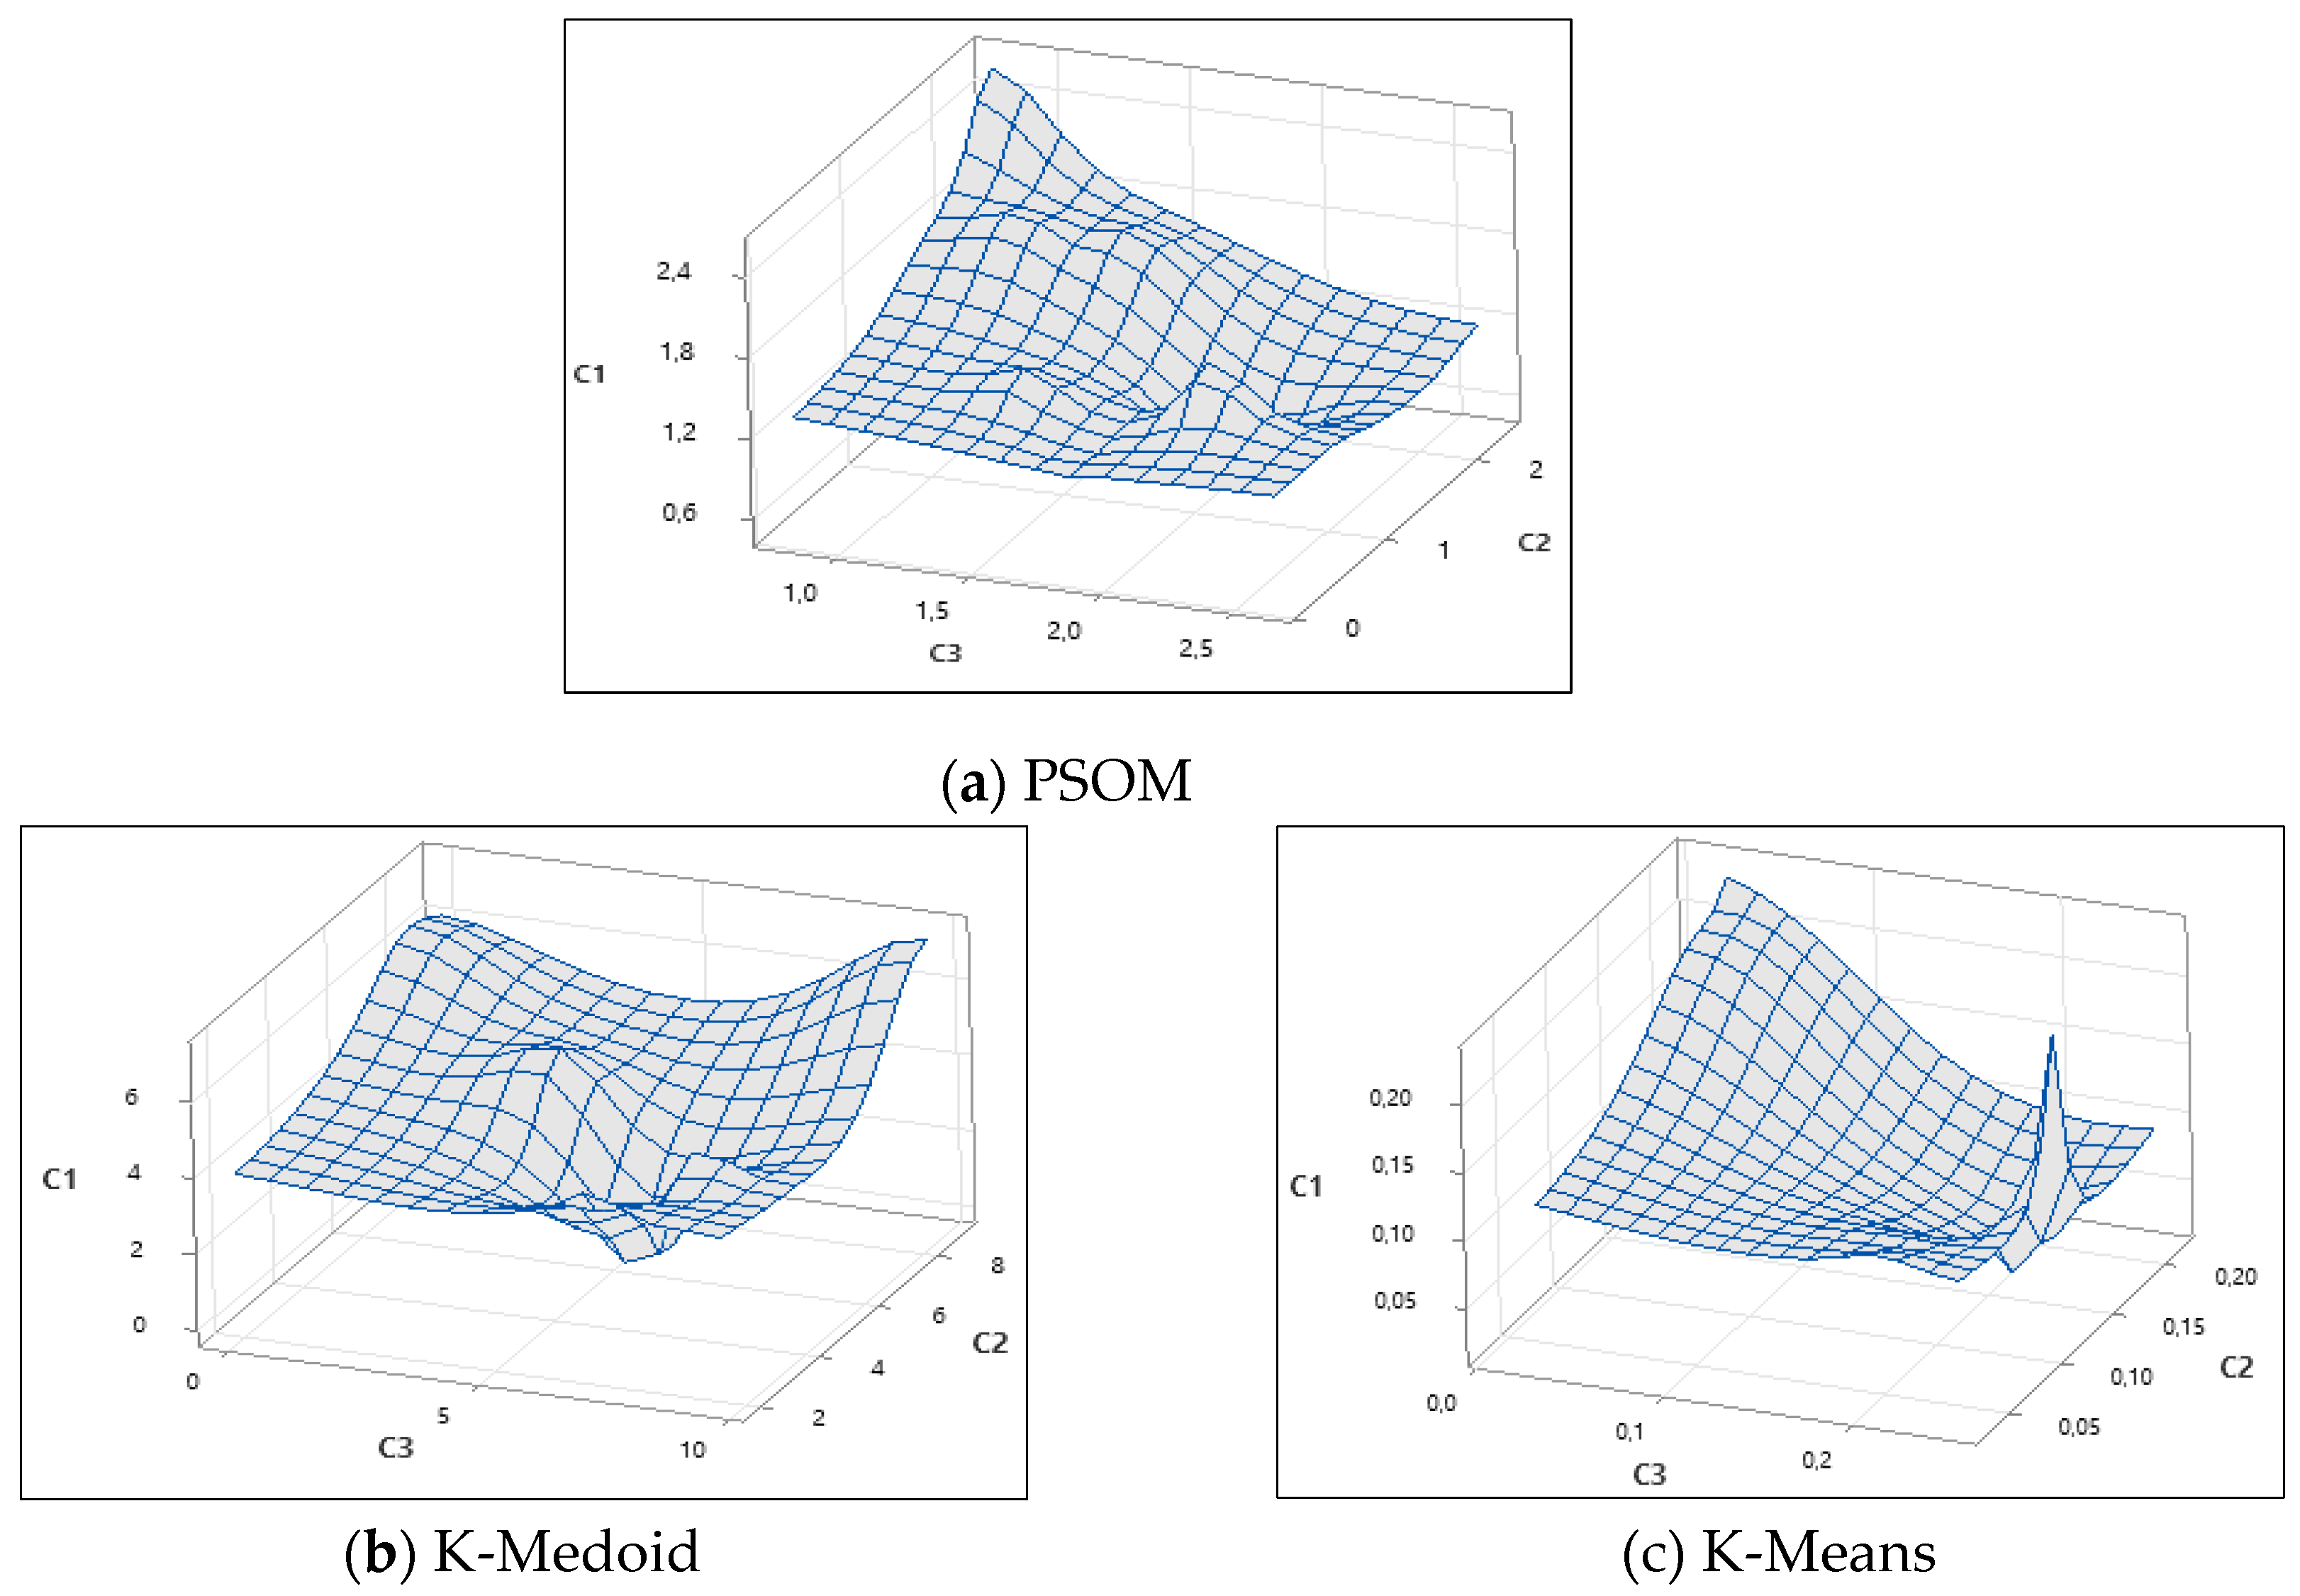
Figure 7.
The visual illustration of the tree formation process in random forest.
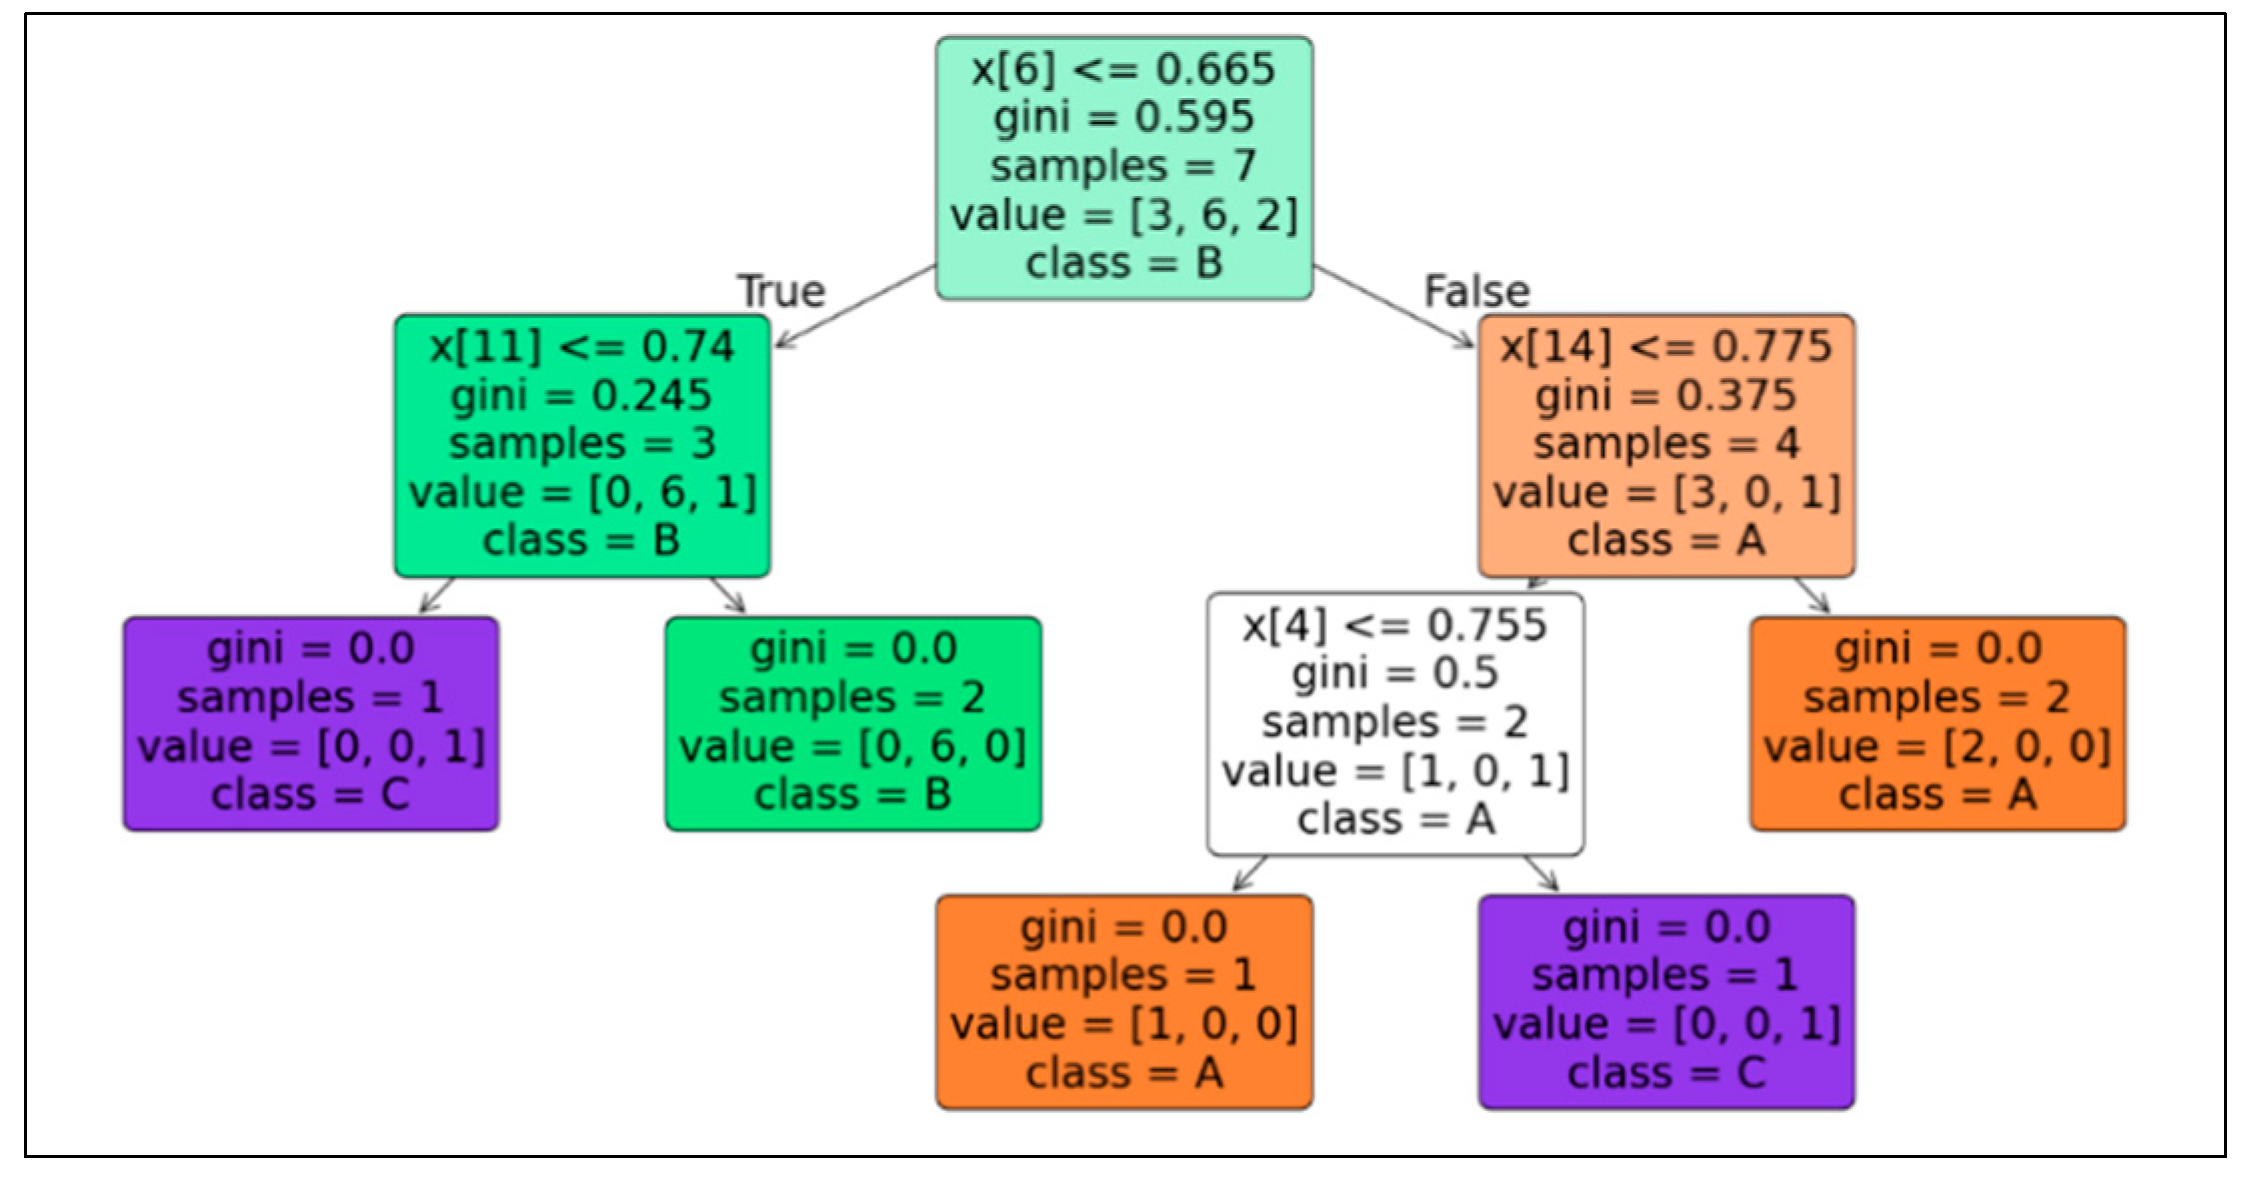
Figure 8.
Mapping carbon trade policy using machine learning random forest.


Table 1.
Scoring data and consensus value.
| Expert | PCE | GDP | IC | IMR | EE | PD | EI | RS | ICA | IQ | PTQ | UP | W2E | LUP | CRP | GI |
|---|---|---|---|---|---|---|---|---|---|---|---|---|---|---|---|---|
| 1 | T | A | T | T | T | T | T | T | A | T | A | S | A | T | A | T |
| 2 | S | A | T | T | T | T | T | T | A | T | A | S | A | S | A | T |
| 3 | T | T | A | T | T | T | A | T | A | A | A | A | A | S | T | T |
| 4 | T | T | T | T | T | T | A | S | A | T | A | T | S | S | T | S |
| 5 | T | T | T | A | A | T | A | S | A | T | A | S | T | T | T | A |
| 6 | A | T | T | T | A | T | T | T | A | T | S | S | T | T | T | T |
| 7 | T | T | T | T | T | T | T | T | A | T | T | A | A | A | T | A |
| 8 | T | T | T | T | A | T | T | T | A | T | S | A | A | A | A | A |
| 9 | A | T | A | T | T | T | T | A | A | T | A | A | T | A | A | A |
| 10 | T | T | T | T | T | A | T | A | A | T | A | A | A | A | A | T |
| 11 | T | T | T | A | T | A | T | T | A | A | A | A | T | T | A | T |
| 12 | T | T | T | A | T | A | T | T | A | T | A | A | A | A | T | A |
| 13 | T | T | T | A | A | A | A | A | A | A | T | T | A | T | T | S |
| 14 | T | T | A | T | T | T | T | T | S | T | A | A | A | A | T | T |
| 15 | T | T | A | T | A | A | A | A | A | A | T | T | S | A | A | A |
| 16 | A | T | T | T | A | A | A | A | A | A | S | T | A | T | A | A |
| Threshold | 0.09 | 0.04 | 0.07 | 0.08 | 0.09 | 0.09 | 0.09 | 0.10 | 0.02 | 0.08 | 0.07 | 0.10 | 0.08 | 0.12 | 0.10 | 0.11 |
| F-Evaluation | 11.8 | 12.4 | 12 | 12 | 11.6 | 11.6 | 11.6 | 11.6 | 9.4 | 11.8 | 9.6 | 9.6 | 10 | 10.2 | 11.2 | 10.8 |
| F-Number | 0.74 | 0.78 | 0.75 | 0.75 | 0.72 | 0.72 | 0.72 | 0.72 | 0.58 | 0.75 | 0.6 | 0.6 | 0.62 | 0.63 | 0.70 | 0.67 |
| Construction | 0.086 | |||||||||||||||
| Consensus | 0.960 | |||||||||||||||
Table 2.
Result of weighted criteria based on SWARA.
| Criteria | Index | Sj | Kj | Qi | Wi |
|---|---|---|---|---|---|
| EE | 1 | 0 | 0 | 1 | 0.18753 |
| PCE | 2 | 0.30 | 1.30 | 0.7692 | 0.14425 |
| GDP | 3 | 0.25 | 1.25 | 0.6154 | 0.11540 |
| IC | 4 | 0.20 | 1.20 | 0.5128 | 0.09617 |
| EI | 5 | 0.15 | 1.15 | 0.4459 | 0.08362 |
| PD | 6 | 0.10 | 1.10 | 0.4054 | 0.07602 |
| ICA | 7 | 0.05 | 1.05 | 0.3861 | 0.07240 |
| RS | 8 | 0.40 | 1.40 | 0.2758 | 0.05172 |
| GI | 9 | 0.35 | 1.35 | 0.2043 | 0.03831 |
| IMR | 10 | 0.30 | 1.30 | 0.1571 | 0.02947 |
| LUP | 11 | 0.25 | 1.25 | 0.1257 | 0.02357 |
| CRP | 12 | 0.20 | 1.20 | 0.1048 | 0.01964 |
| W2E | 13 | 0.15 | 1.15 | 0.0911 | 0.01708 |
| UP | 14 | 0.10 | 1.10 | 0.0828 | 0.01553 |
| IQ | 15 | 0.05 | 1.05 | 0.0789 | 0.01479 |
| PTQ | 16 | 0.02 | 1.02 | 0.0773 | 0.01450 |
Table 3.
Result of weighted subcriteria based on SWARA.
| Subcriteria ([Benefit] ; [Cost]) | Sj | Kj | Qi | Result |
|---|---|---|---|---|
| [Extremely High] ; [Low] | 0 | 1 | 1 | 0.3966 |
| [High] ; [Average] | 0.3333 | 1.3333 | 0.75 | 0.2974 |
| Moderate | 0.6666 | 1.6666 | 0.45 | 0.1784 |
| [Average] ; [High] | 1 | 2 | 0.225 | 0.0892 |
| [Low] ; [Extremely High] | 1.3333 | 2.3333 | 0.0964 | 0.0382 |
Table 4.
Level of potential scoring for each criterion.
| Criteria | Low | Average | Moderat | High | Extremely High |
|---|---|---|---|---|---|
| EE | < 0.50 | 0.50 - 0.60 | 0.60 - 0.70 | 0.70 - 0.80 | > 0.80 |
| PCE | < 1 ton | 1 - 4 ton | 4 - 7 ton | 7 - 10 ton | > 10 ton |
| GDP | < $5000 | $5000 - $10000 | $10000 - $20000 | $20000 - $30000 | > $30000 |
| IC | < 0.10 | 0.10 - 0.20 | 0.20 - 0.35 | 0.35 - 0.50 | > 0.50 |
| EI | < 0.30 | 0.30 - 0.50 | 0. 50 - 0.70 | 0.70 - 0.90 | > 0.90 |
| PD | < 2000 | 2000 - 4000 | 4000 - 7000 | 7000 - 10000 | > 10000 |
| ICA | < 0.10 | 0.10 - 0.30 | 0.30 - 0.50 | 0.50 – 0.70 | > 0.70 |
| RS | 0 - 0.10 | 0.10 - 0.30 | 0.30 - 0.50 | 0.50 - 0.70 | > 0.70 |
| GI | < 0.05 | 0.05 - 0.15 | 0.15 - 0.30 | 0.30 - 0.50 | > 0.50 |
| IMR | < 0.05 | 0.05 - 0.15 | 0.15 - 0.30 | 0.30 - 0.50 | > 0.50 |
| LUP | < 0.10 | 0.10 - 0.20 | 0.20 - 0.30 | 0.30 - 0.40 | > 0.40 |
| CRP | < 0.05 | 0.05 - 0.15 | 0.15 - 0.30 | 0.30 - 0.50 | > 0.50 |
| W2E | < 0.10 | 0.10 - 0.30 | 0.30 - 0.50 | 0.50 - 0.70 | > 0.70 |
| UP | < 0.05 | 0.05 - 0.15 | 0.15 - 0.30 | 0.30 - 0.50 | > 0.50 |
| IQ | < 0.10 | 0.10 - 0.30 | 0.30 - 0.50 | 0.50 - 0.70 | > 0.70 |
| PTQ | < 0.10 | 0.10 - 0.30 | 0.30 - 0.50 | 0.50 - 0.70 | > 0.70 |
Table 5.
Criteria score through carbon trade policy for each city.
| City | EE | PCE | GDP | IC | EI | PD | ICA | RS | GI | IMR | LUP | CRP | W2E | UP | IQ | PTQ |
|---|---|---|---|---|---|---|---|---|---|---|---|---|---|---|---|---|
| Jakarta | 0.75 | 6.0 | $40000 | 0.50 | 0.80 | 15000 | 0.70 | 0.85 | 0.80 | 0.25 | 0.70 | 0.85 | 0.30 | 0.80 | 0.80 | 0.07 |
| Surabaya | 0.80 | 4.5 | $30000 | 0.40 | 0.75 | 12000 | 0.65 | 0.80 | 0.75 | 0.30 | 0.65 | 0.80 | 0.35 | 0.75 | 0.75 | 0.65 |
| Bandung | 0.85 | 3.5 | $25000 | 0.30 | 0.85 | 14000 | 0.80 | 0.75 | 0.85 | 0.35 | 0.80 | 0.75 | 0.40 | 0.85 | 0.85 | 0.80 |
| Medan | 0.70 | 4.0 | $20000 | 0.35 | 0.70 | 10000 | 0.60 | 0.70 | 0.70 | 0.20 | 0.60 | 0.70 | 0.25 | 0.70 | 0.70 | 0.60 |
| Semarang | 0.90 | 3.0 | $15000 | 0.25 | 0.90 | 11000 | 0.75 | 0.90 | 0.90 | 0.40 | 0.75 | 0.90 | 0.45 | 0.90 | 0.90 | 0.75 |
| Makassar | 0.82 | 3.2 | $16000 | 0.30 | 0.82 | 10500 | 0.68 | 0.78 | 0.82 | 0.32 | 0.68 | 0.78 | 0.32 | 0.82 | 0.82 | 0.68 |
| Palembang | 0.84 | 3.7 | $18000 | 0.33 | 0.84 | 10800 | 0.72 | 0.82 | 0.84 | 0.34 | 0.72 | 0.82 | 0.37 | 0.84 | 0.84 | 0.72 |
| Denpasar | 0.78 | 2.8 | $14000 | 0.28 | 0.78 | 9500 | 0.66 | 0.76 | 0.78 | 0.28 | 0.66 | 0.76 | 0.28 | 0.78 | 0.78 | 0.66 |
| Balikpapan | 0.80 | 2.9 | $14500 | 0.29 | 0.80 | 9800 | 0.70 | 0.80 | 0.80 | 0.30 | 0.70 | 0.80 | 0.30 | 0.80 | 0.80 | 0.70 |
| Yogyakarta | 0.75 | 2.6 | $13000 | 0.26 | 0.75 | 8600 | 0.65 | 0.75 | 0.75 | 0.25 | 0.65 | 0.75 | 0.25 | 0.75 | 0.75 | 0.65 |
| Malang | 0.77 | 3.1 | $15500 | 0.31 | 0.77 | 10200 | 0.69 | 0.77 | 0.77 | 0.27 | 0.69 | 0.77 | 0.27 | 0.77 | 0.77 | 0.69 |
| Batam | 0.80 | 3.3 | $16500 | 0.35 | 0.80 | 10700 | 0.70 | 0.80 | 0.80 | 0.30 | 0.70 | 0.80 | 0.30 | 0.80 | 0.80 | 0.70 |
| Pekanbaru | 0.83 | 3.4 | $17000 | 0.32 | 0.83 | 10900 | 0.73 | 0.83 | 0.83 | 0.33 | 0.73 | 0.83 | 0.33 | 0.83 | 0.83 | 0.73 |
| Banjarmasin | 0.79 | 3.0 | $15000 | 0.30 | 0.79 | 9000 | 0.67 | 0.79 | 0.79 | 0.29 | 0.67 | 0.79 | 0.29 | 0.79 | 0.79 | 0.67 |
| Pontianak | 0.81 | 2.7 | $13500 | 0.27 | 0.81 | 9300 | 0.71 | 0.81 | 0.81 | 0.31 | 0.71 | 0.81 | 0.31 | 0.81 | 0.81 | 0.71 |
Table 6.
Results of the calculation of the decision matrix.
| City | EE | PCE | GDP | IC | EI | PD | ICA | RS | GI | IMR | LUP | CRP | W2E | UP | IQ | PTQ |
|---|---|---|---|---|---|---|---|---|---|---|---|---|---|---|---|---|
| Jakarta | 0.290 | 0.289 | 0.231 | 0.192 | 0.167 | 0.152 | 0.072 | 0.103 | 0.038 | 0.029 | 0.024 | 0.020 | 0.017 | 0.016 | 0.030 | 0.015 |
| Surabaya | 0.290 | 0.289 | 0.178 | 0.192 | 0.167 | 0.152 | 0.072 | 0.103 | 0.038 | 0.029 | 0.024 | 0.020 | 0.034 | 0.016 | 0.030 | 0.025 |
| Bandung | 0.375 | 0.144 | 0.178 | 0.096 | 0.167 | 0.152 | 0.145 | 0.103 | 0.038 | 0.059 | 0.024 | 0.020 | 0.034 | 0.016 | 0.030 | 0.029 |
| Medan | 0.188 | 0.144 | 0.115 | 0.096 | 0.084 | 0.076 | 0.072 | 0.052 | 0.038 | 0.029 | 0.024 | 0.020 | 0.017 | 0.016 | 0.015 | 0.025 |
| Semarang | 0.375 | 0.144 | 0.115 | 0.096 | 0.167 | 0.152 | 0.145 | 0.103 | 0.038 | 0.059 | 0.024 | 0.020 | 0.034 | 0.016 | 0.030 | 0.029 |
| Makassar | 0.375 | 0.144 | 0.115 | 0.096 | 0.167 | 0.152 | 0.072 | 0.103 | 0.038 | 0.059 | 0.024 | 0.020 | 0.034 | 0.016 | 0.030 | 0.025 |
| Palembang | 0.375 | 0.144 | 0.115 | 0.096 | 0.167 | 0.152 | 0.145 | 0.103 | 0.038 | 0.059 | 0.024 | 0.020 | 0.034 | 0.016 | 0.030 | 0.029 |
| Denpasar | 0.290 | 0.144 | 0.115 | 0.096 | 0.167 | 0.076 | 0.072 | 0.103 | 0.038 | 0.029 | 0.024 | 0.020 | 0.017 | 0.016 | 0.030 | 0.025 |
| Balikpapan | 0.290 | 0.144 | 0.115 | 0.096 | 0.167 | 0.076 | 0.072 | 0.103 | 0.038 | 0.029 | 0.024 | 0.020 | 0.017 | 0.016 | 0.030 | 0.025 |
| Yogyakarta | 0.290 | 0.144 | 0.115 | 0.096 | 0.167 | 0.076 | 0.072 | 0.103 | 0.038 | 0.029 | 0.024 | 0.020 | 0.017 | 0.016 | 0.030 | 0.025 |
| Malang | 0.290 | 0.144 | 0.115 | 0.096 | 0.167 | 0.152 | 0.072 | 0.103 | 0.038 | 0.029 | 0.024 | 0.020 | 0.017 | 0.016 | 0.030 | 0.025 |
| Batam | 0.290 | 0.144 | 0.115 | 0.096 | 0.167 | 0.152 | 0.072 | 0.103 | 0.038 | 0.029 | 0.024 | 0.020 | 0.017 | 0.016 | 0.030 | 0.025 |
| Pekanbaru | 0.375 | 0.144 | 0.115 | 0.096 | 0.167 | 0.152 | 0.145 | 0.103 | 0.038 | 0.059 | 0.024 | 0.020 | 0.034 | 0.016 | 0.030 | 0.029 |
| Banjarmasin | 0.290 | 0.144 | 0.115 | 0.096 | 0.167 | 0.076 | 0.072 | 0.103 | 0.038 | 0.029 | 0.024 | 0.020 | 0.017 | 0.016 | 0.030 | 0.025 |
| Pontianak | 0.375 | 0.144 | 0.115 | 0.096 | 0.167 | 0.076 | 0.145 | 0.103 | 0.038 | 0.059 | 0.024 | 0.020 | 0.034 | 0.016 | 0.030 | 0.029 |
Table 7.
Input data for application of PSOM.
| City | EE | PCE | GDP | IC | EI | PD | ICA | RS |
|---|---|---|---|---|---|---|---|---|
| Jakarta | -0.046 | 0.111 | 0.085 | 0.071 | -0.012 | 0.020 | -0.034 | -0.011 |
| Surabaya | -0.046 | 0.111 | 0.033 | 0.071 | -0.012 | 0.020 | -0.034 | -0.011 |
| Bandung | 0.039 | -0.033 | 0.033 | -0.025 | -0.012 | 0.020 | 0.039 | -0.011 |
| Medan | -0.148 | -0.033 | -0.030 | -0.025 | -0.095 | -0.056 | -0.034 | -0.062 |
| Semarang | 0.039 | -0.033 | -0.030 | -0.025 | -0.012 | 0.020 | 0.039 | -0.011 |
| Makassar | 0.039 | -0.033 | -0.030 | -0.025 | -0.012 | 0.020 | -0.034 | -0.011 |
| Palembang | 0.039 | -0.033 | -0.030 | -0.025 | -0.012 | 0.020 | 0.039 | -0.011 |
| Denpasar | -0.046 | -0.033 | -0.030 | -0.025 | -0.012 | -0.056 | -0.034 | -0.011 |
| Balikpapan | -0.046 | -0.033 | -0.030 | -0.025 | -0.012 | -0.056 | -0.034 | -0.011 |
| Yogyakarta | -0.046 | -0.033 | -0.030 | -0.025 | -0.012 | -0.056 | -0.034 | -0.011 |
| Malang | -0.046 | -0.033 | -0.030 | -0.025 | -0.012 | 0.020 | -0.034 | -0.011 |
| Batam | -0.046 | -0.033 | -0.030 | -0.025 | -0.012 | 0.020 | -0.034 | -0.011 |
| Pekanbaru | 0.039 | -0.033 | -0.030 | -0.025 | -0.012 | 0.020 | 0.039 | -0.011 |
| Banjarmasin | -0.046 | -0.033 | -0.030 | -0.025 | -0.012 | -0.056 | -0.034 | -0.011 |
| Pontianak | 0.039 | -0.033 | -0.030 | -0.025 | -0.012 | -0.056 | 0.039 | -0.011 |
Table 8.
Input data for application of PSOM (Continued).
| City | GI | IMR | LUP | CRP | W2E | UP | IQ | PTQ |
|---|---|---|---|---|---|---|---|---|
| Jakarta | -0.009 | -0.018 | -0.006 | -0.005 | -0.013 | -0.005 | 0.009 | -0.006 |
| Surabaya | -0.009 | -0.018 | -0.006 | -0.005 | 0.004 | -0.005 | 0.009 | 0.005 |
| Bandung | -0.009 | 0.011 | -0.006 | -0.005 | 0.004 | -0.005 | 0.009 | 0.009 |
| Medan | -0.009 | -0.018 | -0.006 | -0.005 | -0.013 | -0.005 | -0.005 | 0.005 |
| Semarang | -0.009 | 0.011 | -0.006 | -0.005 | 0.004 | -0.005 | 0.009 | 0.009 |
| Makassar | -0.009 | 0.011 | -0.006 | -0.005 | 0.004 | -0.005 | 0.009 | 0.005 |
| Palembang | -0.009 | 0.011 | -0.006 | -0.005 | 0.004 | -0.005 | 0.009 | 0.009 |
| Denpasar | -0.009 | -0.018 | -0.006 | -0.005 | -0.013 | -0.005 | 0.009 | 0.005 |
| Balikpapan | -0.009 | -0.018 | -0.006 | -0.005 | -0.013 | -0.005 | 0.009 | 0.005 |
| Yogyakarta | -0.009 | -0.018 | -0.006 | -0.005 | -0.013 | -0.005 | 0.009 | 0.005 |
| Malang | -0.009 | -0.018 | -0.006 | -0.005 | -0.013 | -0.005 | 0.009 | 0.005 |
| Batam | -0.009 | -0.018 | -0.006 | -0.005 | -0.013 | -0.005 | 0.009 | 0.005 |
| Pekanbaru | -0.009 | 0.011 | -0.006 | -0.005 | 0.004 | -0.005 | 0.009 | 0.009 |
| Banjarmasin | -0.009 | -0.018 | -0.006 | -0.005 | -0.013 | -0.005 | 0.009 | 0.005 |
| Pontianak | -0.009 | 0.011 | -0.006 | -0.005 | 0.004 | -0.005 | 0.009 | 0.009 |
Table 9.
Clustering results using PSOM.
| City | C1 | C2 | C3 | Cluster | Policy |
|---|---|---|---|---|---|
| Jakarta | 2.5791 | 2.3419 | 0.7960 | 3 | C |
| Surabaya | 1.0409 | 1.7120 | 2.6131 | 1 | A |
| Bandung | 0.6810 | 1.3807 | 2.1166 | 1 | A |
| Medan | 0.5233 | 1.1751 | 2.0222 | 1 | A |
| Semarang | 1.1352 | 0.6548 | 1.8289 | 2 | B |
| Makassar | 1.8333 | 1.8541 | 1.4470 | 3 | C |
| Palembang | 1.9556 | 1.7045 | 1.0995 | 3 | C |
| Denpasar | 1.0735 | 0.3752 | 1.7772 | 2 | B |
| Balikpapan | 1.0996 | 0.1237 | 1.8631 | 2 | B |
| Yogyakarta | 1.4825 | 0.7092 | 1.4648 | 2 | B |
| Malang | 1.1821 | 0.1242 | 1.8760 | 2 | B |
| Batam | 1.2125 | 0.1593 | 1.8829 | 2 | B |
| Pekanbaru | 1.2075 | 0.4581 | 1.5841 | 2 | B |
| Banjarmasin | 1.2125 | 0.1593 | 1.8829 | 2 | B |
| Pontianak | 1.7270 | 0.8534 | 2.1285 | 2 | B |
Table 10.
Weight of aspect and criteria for the sensitivity test.
| Aspect | Criteria | Initial Weight | Type | Sensitivity Weight |
|---|---|---|---|---|
| Economics | GDP | 0.11540 | Benefit | 0.61540 |
| IC | 0.09617 | Cost | 0.59617 | |
| EE | 0.18753 | Benefit | 0.68753 | |
| ICA | 0.07240 | Benefit | 0.57240 | |
| IQ | 0.01479 | Benefit | 0.51479 | |
| Social | PD | 0.07602 | Cost | 0.57602 |
| EI | 0.08362 | Benefit | 0.58362 | |
| PTQ | 0.01450 | Benefit | 0.51450 | |
| UP | 0.01553 | Benefit | 0.51553 | |
| Environment | PCE | 0.14425 | Cost | 0.64425 |
| IMR | 0.02947 | Benefit | 0.52947 | |
| W2E | 0.01708 | Benefit | 0.51708 | |
| LUP | 0.02357 | Benefit | 0.52357 | |
| CRP | 0.01964 | Benefit | 0.51964 | |
| GI | 0.03831 | Benefit | 0.53831 | |
| Politics | RS | 0.05172 | Benefit | 0.55172 |
Table 11.
Result of MCDM accumulation based on the aspect.
| City | Aspects | ||||
|---|---|---|---|---|---|
| Normal | Economics | Social | Environment | Politics | |
| Jakarta | 0.1332 | 1.8728 | -0.0949 | 0.1776 | 0.1971 |
| Surabaya | 0.1083 | 1.6207 | 0.2419 | 0.6527 | 0.1722 |
| Bandung | 0.0590 | 1.7986 | 0.3309 | 0.6034 | 0.1229 |
| Medan | -0.5406 | -0.5737 | -1.4070 | -0.9961 | -0.9766 |
| Semarang | -0.0040 | 1.4630 | 0.2679 | 0.5405 | 0.0600 |
| Makassar | -0.0804 | 0.8865 | 0.0532 | 0.4641 | -0.0164 |
| Palembang | -0.0040 | 1.4630 | 0.2679 | 0.5405 | 0.0600 |
| Denpasar | -0.2882 | 0.4515 | -0.6546 | -0.7437 | -0.2242 |
| Balikpapan | -0.2882 | 0.4515 | -0.6546 | -0.7437 | -0.2242 |
| Yogyakarta | -0.2882 | 0.4515 | -0.6546 | -0.7437 | -0.2242 |
| Malang | -0.2122 | 0.5275 | -0.0786 | -0.6677 | -0.1482 |
| Batam | -0.2122 | 0.5275 | -0.0786 | -0.6677 | -0.1482 |
| Pekanbaru | -0.0040 | 1.4630 | 0.2679 | 0.5405 | 0.0600 |
| Banjarmasin | -0.2882 | 0.4515 | -0.6546 | -0.7437 | -0.2242 |
| Pontianak | -0.0800 | 1.3869 | -0.3081 | 0.4645 | -0.0160 |
Table 12.
The determination of carbon trade policy in each city is based on various aspects.
| City | Aspects | ||||
|---|---|---|---|---|---|
| Normal | Economics | Social | Environment | Politics | |
| Jakarta | 0.7960 | 1.5100 | 0.2442 | 1.2000 | 2.4000 |
| Surabaya | 1.4090 | 0.6824 | 1.9000 | 1.2000 | 1.6900 |
| Bandung | 0.6810 | 0.5176 | 0.6479 | 0.8781 | 0.6105 |
| Medan | 0.5233 | 1.7000 | 1.6000 | 0.1233 | 0.0663 |
| Semarang | 0.6548 | 0.4382 | 0.3777 | 0.7237 | 0.3020 |
| Makassar | 1.4470 | 0.8460 | 0.7389 | 0.8418 | 1.0200 |
| Palembang | 1.0995 | 0.3502 | 0.3777 | 0.7237 | 0.3020 |
| Denpasar | 0.3752 | 0.3013 | 0.2912 | 1.3000 | 0.5154 |
| Balikpapan | 0.1237 | 0.3002 | 0.2912 | 1.4000 | 0.5154 |
| Yogyakarta | 0.7092 | 0.3286 | 0.2912 | 1.4000 | 0.5154 |
| Malang | 0.1242 | 0.7651 | 0.8118 | 1.1000 | 0.8657 |
| Batam | 0.1593 | 0.7663 | 0.8118 | 1.1000 | 0.8657 |
| Pekanbaru | 0.4581 | 0.4288 | 0.3777 | 0.7237 | 0.3020 |
| Banjarmasin | 0.1593 | 0.3074 | 0.2912 | 1.4000 | 0.5154 |
| Pontianak | 0.8534 | 1.1600 | 0.8710 | 0.7237 | 0.7065 |
Table 13.
Results of comparison of PSOM - KMeans - KMedoid methods.
| City | PSOM | K-Means | K-Medoid | ||||||
|---|---|---|---|---|---|---|---|---|---|
| C1 | C2 | C3 | C1 | C2 | C3 | C1 | C2 | C3 | |
| Jakarta | 2.5791 | 2.3419 | 0.7960 | 0.2308 | 0.2159 | 0.0279 | 6.4981 | 7.8268 | 0.0000 |
| Surabaya | 1.0409 | 1.7120 | 2.6131 | 0.2112 | 0.1938 | 0.0279 | 5.3791 | 5.7606 | 3.9550 |
| Bandung | 0.6810 | 1.3807 | 2.1166 | 0.0553 | 0.1533 | 0.2102 | 4.9053 | 1.8555 | 7.2203 |
| Medan | 0.5233 | 1.1751 | 2.0222 | 0.2315 | 0.1234 | 0.2526 | 7.2022 | 8.8650 | 9.7004 |
| Semarang | 1.1352 | 0.6548 | 1.8289 | 0.0204 | 0.1397 | 0.2267 | 4.5407 | 4.2146 | 7.8268 |
| Makassar | 1.8333 | 1.8541 | 1.4470 | 0.0631 | 0.1191 | 0.2145 | 3.8589 | 2.3931 | 6.9846 |
| Palembang | 1.9556 | 1.7045 | 1.0995 | 0.0204 | 0.1397 | 0.2267 | 4.5407 | 4.2146 | 7.8268 |
| Denpasar | 1.0735 | 0.3752 | 1.7772 | 0.1272 | 0.0296 | 0.2091 | 0.0000 | 4.5407 | 6.4981 |
| Balikpapan | 1.0996 | 0.1237 | 1.8631 | 0.1272 | 0.0296 | 0.2091 | 0.0000 | 4.5407 | 6.4981 |
| Yogyakarta | 1.4825 | 0.7092 | 1.4648 | 0.1272 | 0.0296 | 0.2091 | 0.0000 | 4.5407 | 6.4981 |
| Malang | 1.1821 | 0.1242 | 1.8760 | 0.1110 | 0.0579 | 0.1948 | 2.0412 | 4.0561 | 6.1692 |
| Banjarmasin | 1.2125 | 0.1593 | 1.8829 | 0.1272 | 0.0296 | 0.2091 | 0.0000 | 4.5407 | 6.4981 |
| Pontianak | 1.7270 | 0.8534 | 2.1285 | 0.0653 | 0.1306 | 0.2391 | 4.0561 | 2.0412 | 8.0886 |
Table 14.
Testing data for predicting and mapping carbon trade policy.
| City | EE | PCE | GDP | IC | EI | PD | ICA | RS | GI | IMR | LUP | CRP | W2E | UP | IQ | PTQ |
|---|---|---|---|---|---|---|---|---|---|---|---|---|---|---|---|---|
| Bogor | 0.63 | 1.8 | 12000 | 0.45 | 0.52 | 14000 | 0.50 | 0.52 | 0.53 | 0.12 | 0.58 | 0.54 | 0.18 | 0.53 | 0.49 | 0.56 |
| Manado | 0.67 | 2.1 | 11500 | 0.43 | 0.55 | 10500 | 0.52 | 0.56 | 0.51 | 0.13 | 0.59 | 0.51 | 0.22 | 0.58 | 0.55 | 0.60 |
| Samarinda | 0.71 | 2.3 | 13500 | 0.39 | 0.60 | 12000 | 0.60 | 0.61 | 0.65 | 0.22 | 0.65 | 0.61 | 0.30 | 0.63 | 0.62 | 0.66 |
| Jambi | 0.62 | 1.7 | 12500 | 0.35 | 0.48 | 11000 | 0.49 | 0.54 | 0.50 | 0.10 | 0.57 | 0.49 | 0.16 | 0.52 | 0.50 | 0.51 |
| Padang | 0.69 | 2.5 | 16000 | 0.47 | 0.63 | 15000 | 0.58 | 0.63 | 0.61 | 0.21 | 0.69 | 0.60 | 0.27 | 0.68 | 0.64 | 0.62 |
| Kupang | 0.55 | 1.9 | 11000 | 0.33 | 0.47 | 9800 | 0.44 | 0.5 | 0.42 | 0.09 | 0.50 | 0.47 | 0.14 | 0.49 | 0.44 | 0.49 |
| Mataram | 0.68 | 2.4 | 14500 | 0.48 | 0.64 | 16000 | 0.59 | 0.64 | 0.67 | 0.24 | 0.70 | 0.65 | 0.28 | 0.71 | 0.69 | 0.72 |
| T.Pinang | 0.66 | 2.1 | 13000 | 0.38 | 0.54 | 12500 | 0.53 | 0.58 | 0.54 | 0.12 | 0.63 | 0.54 | 0.20 | 0.57 | 0.56 | 0.60 |
| Kendari | 0.72 | 2.0 | 14000 | 0.44 | 0.61 | 9000 | 0.62 | 0.66 | 0.68 | 0.20 | 0.66 | 0.64 | 0.25 | 0.66 | 0.62 | 0.64 |
| Palu | 0.74 | 2.6 | 16000 | 0.46 | 0.66 | 11000 | 0.65 | 0.67 | 0.70 | 0.23 | 0.72 | 0.68 | 0.30 | 0.70 | 0.71 | 0.68 |
| Ambon | 0.59 | 1.5 | 3000 | 0.37 | 0.51 | 10500 | 0.49 | 0.53 | 0.47 | 0.11 | 0.55 | 0.51 | 0.17 | 0.54 | 0.51 | 0.55 |
| Bengkulu | 0.65 | 2.3 | 14500 | 0.42 | 0.57 | 9500 | 0.56 | 0.61 | 0.61 | 0.18 | 0.63 | 0.59 | 0.26 | 0.61 | 0.60 | 0.61 |
Disclaimer/Publisher’s Note: The statements, opinions and data contained in all publications are solely those of the individual author(s) and contributor(s) and not of MDPI and/or the editor(s). MDPI and/or the editor(s) disclaim responsibility for any injury to people or property resulting from any ideas, methods, instructions or products referred to in the content. |
© 2025 by the authors. Licensee MDPI, Basel, Switzerland. This article is an open access article distributed under the terms and conditions of the Creative Commons Attribution (CC BY) license (http://creativecommons.org/licenses/by/4.0/).
Copyright: This open access article is published under a Creative Commons CC BY 4.0 license, which permit the free download, distribution, and reuse, provided that the author and preprint are cited in any reuse.


