Preprint
Article

This version is not peer-reviewed.

Transforming LCT Pegmatite Targeting Models into AI-Powered Predictive Maps of Lithium Potential for Western Australia and Ontario: Approach, Results and Implications

A peer-reviewed article of this preprint also exists.

Submitted:

12 February 2025

Posted:

12 February 2025

You are already at the latest version

Abstract

Lithium-cesium-tantalum (LCT) pegmatites account for circa one-third of global lithium resources and two-thirds of global lithium production. Western Australia, the world's largest supplier of hardrock lithium ores, and Ontario, an emerging lithium mining jurisdiction, have significant endowments that will be critical to the ‘green revolution’ given the predicted transition to lithium-based electromobility. In addition, both jurisdictions show excellent potential for future lithium discoveries given they cover large areas of favorable geology that, by and large, have recorded only limited lithium exploration. Here, we developed holistic LCT pegmatite targeting models for these important jurisdictions, informed by a detailed review of this deposit type and framed in the context of a mineral systems approach. Artificial intelligence (AI)-powered mineral potential modelling (MPM), using multiple, complimentary techniques and guided by the mappable elements of the LCT pegmatite genetic model, not only delivered the first regional scale views of lithium potential across the Archean to Proterozoic terrains of Western Australia and Ontario but also delivered compelling targets for future exploration and though-provoking insights, such as the statistically verifiable proximity relationship between lithium, gold and nickel occurrences. Overall, this study also served to demonstrate the power of precompetitive, high-quality geoscience data, not only for regional scale targeting but also the development of camp-scale targets that are concise enough to be investigated using conventional prospecting techniques.

Keywords: 
;  ;  ;  ;  ;  ;  ;  

1. Introduction

Lithium deposits can be grouped into three principal types: Brine-, clay-, and hardrock-hosted. Lithium-cesium-tantalum (LCT) pegmatites, which fall into the hardrock category, are formed by orogenic processes at convergent plate boundaries. More specifically, they are products of extreme crystal-melt fractionation whereby the fractional crystallization of a parental granitic melt leads to enrichment in lithium, cesium and tantalum ± boron, beryllium, fluorine, gallium, hafnium, manganese, niobium, phosphorous, rubidium and tin in the residual pegmatitic facies. From a commercial perspective, the most important lithium mineral in LCT pegmatites is spodumene [1-3].
LCT pegmatites constitute a major economic resource of lithium. For example, in 2022, this deposit type accounted for almost 30% of global lithium resources and 60% of global lithium production [4]. LCT pegmatites in the Precambrian terrains of Western Australia (Australia) and Ontario (Canada), the subject of this study, are very well endowed with regards to lithium:
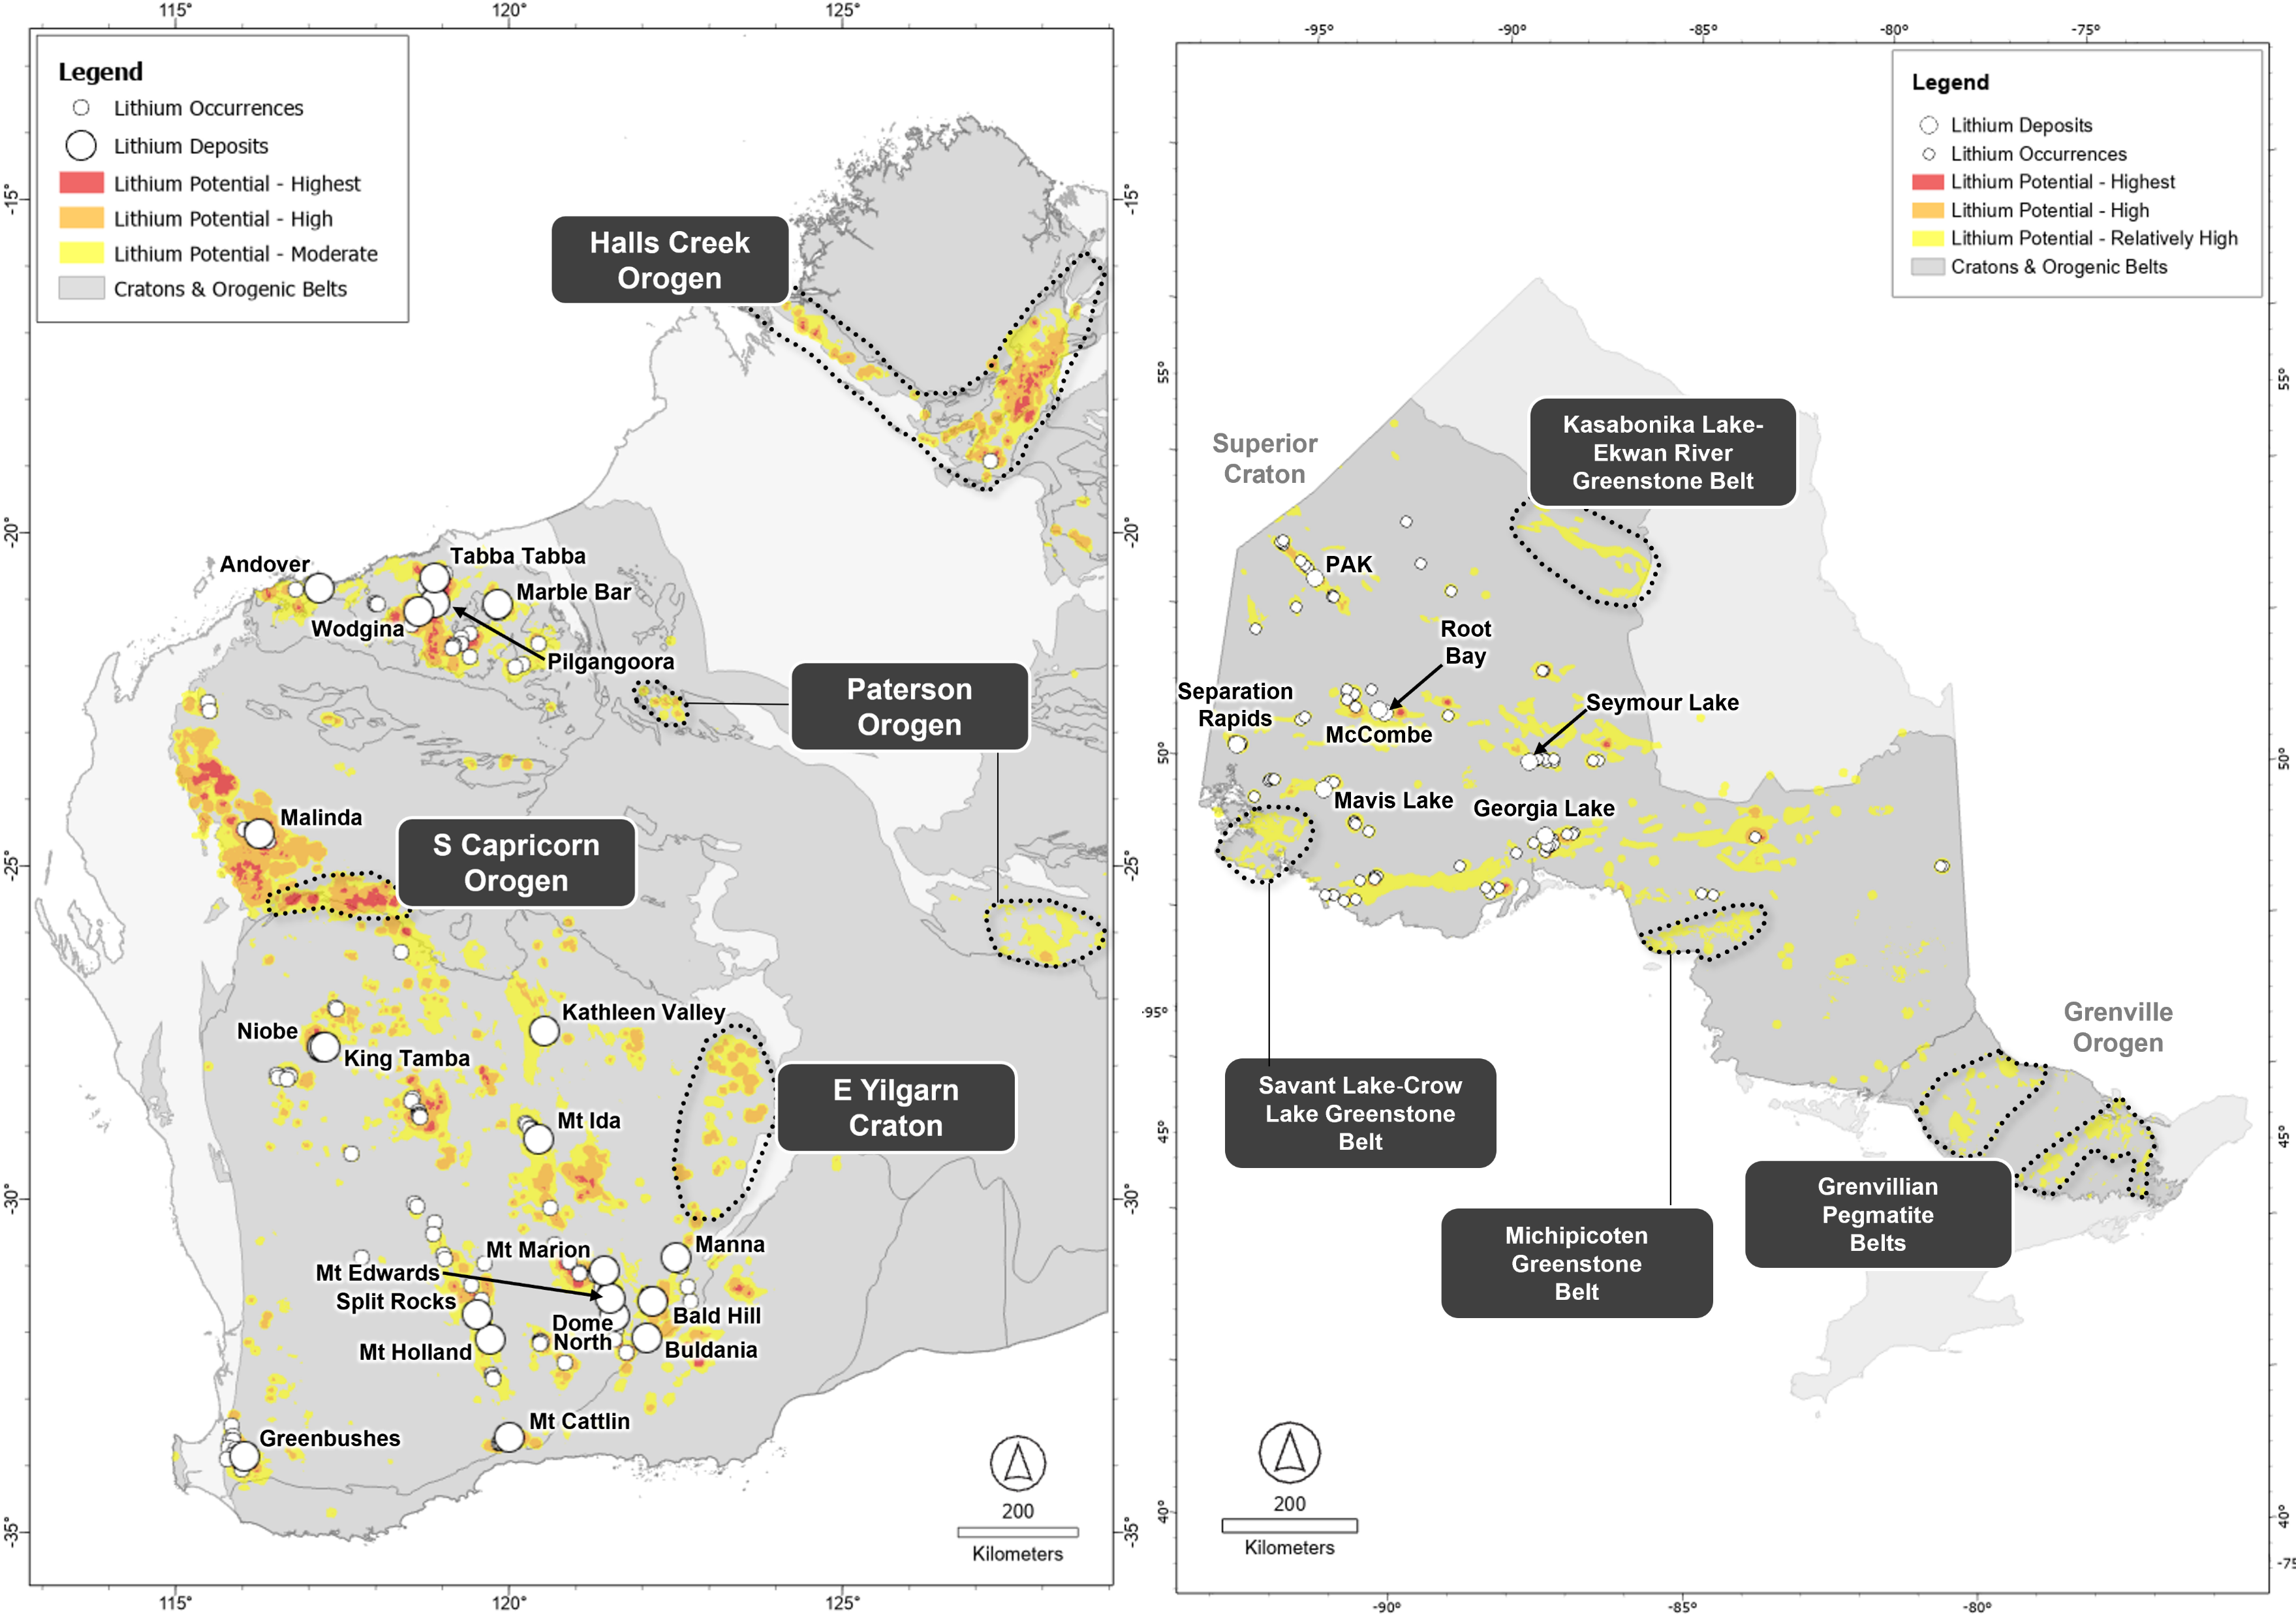
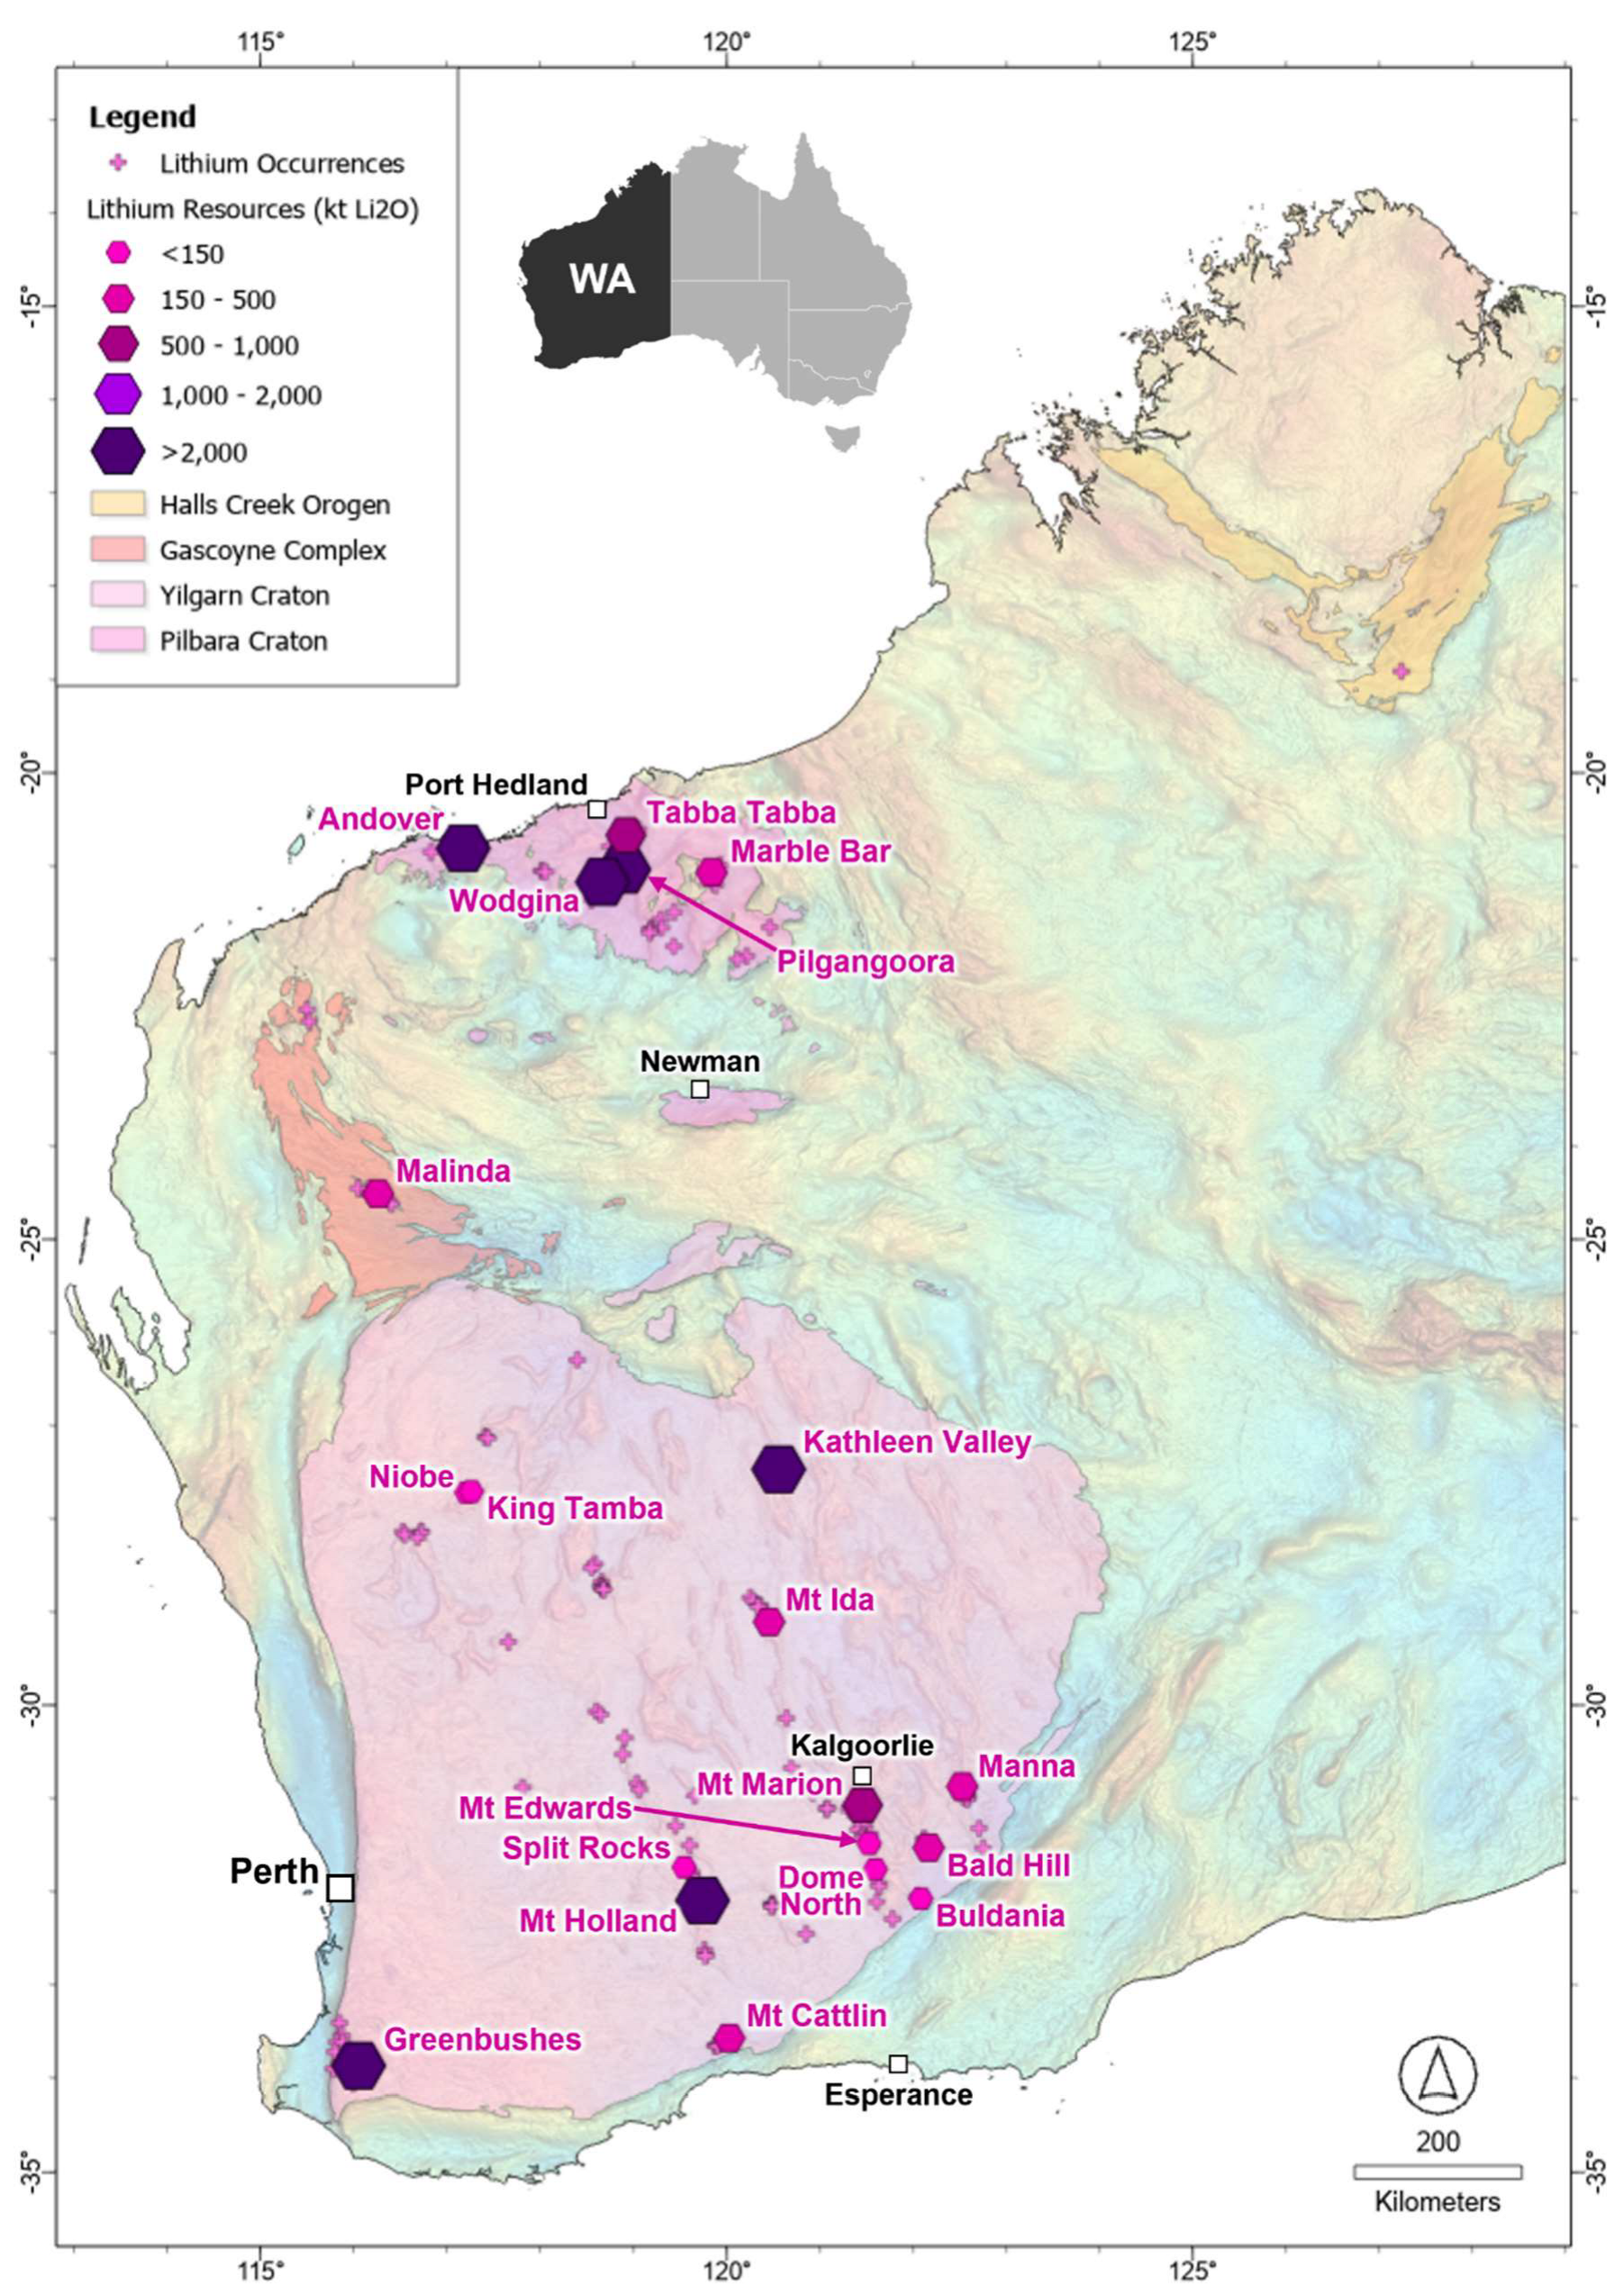
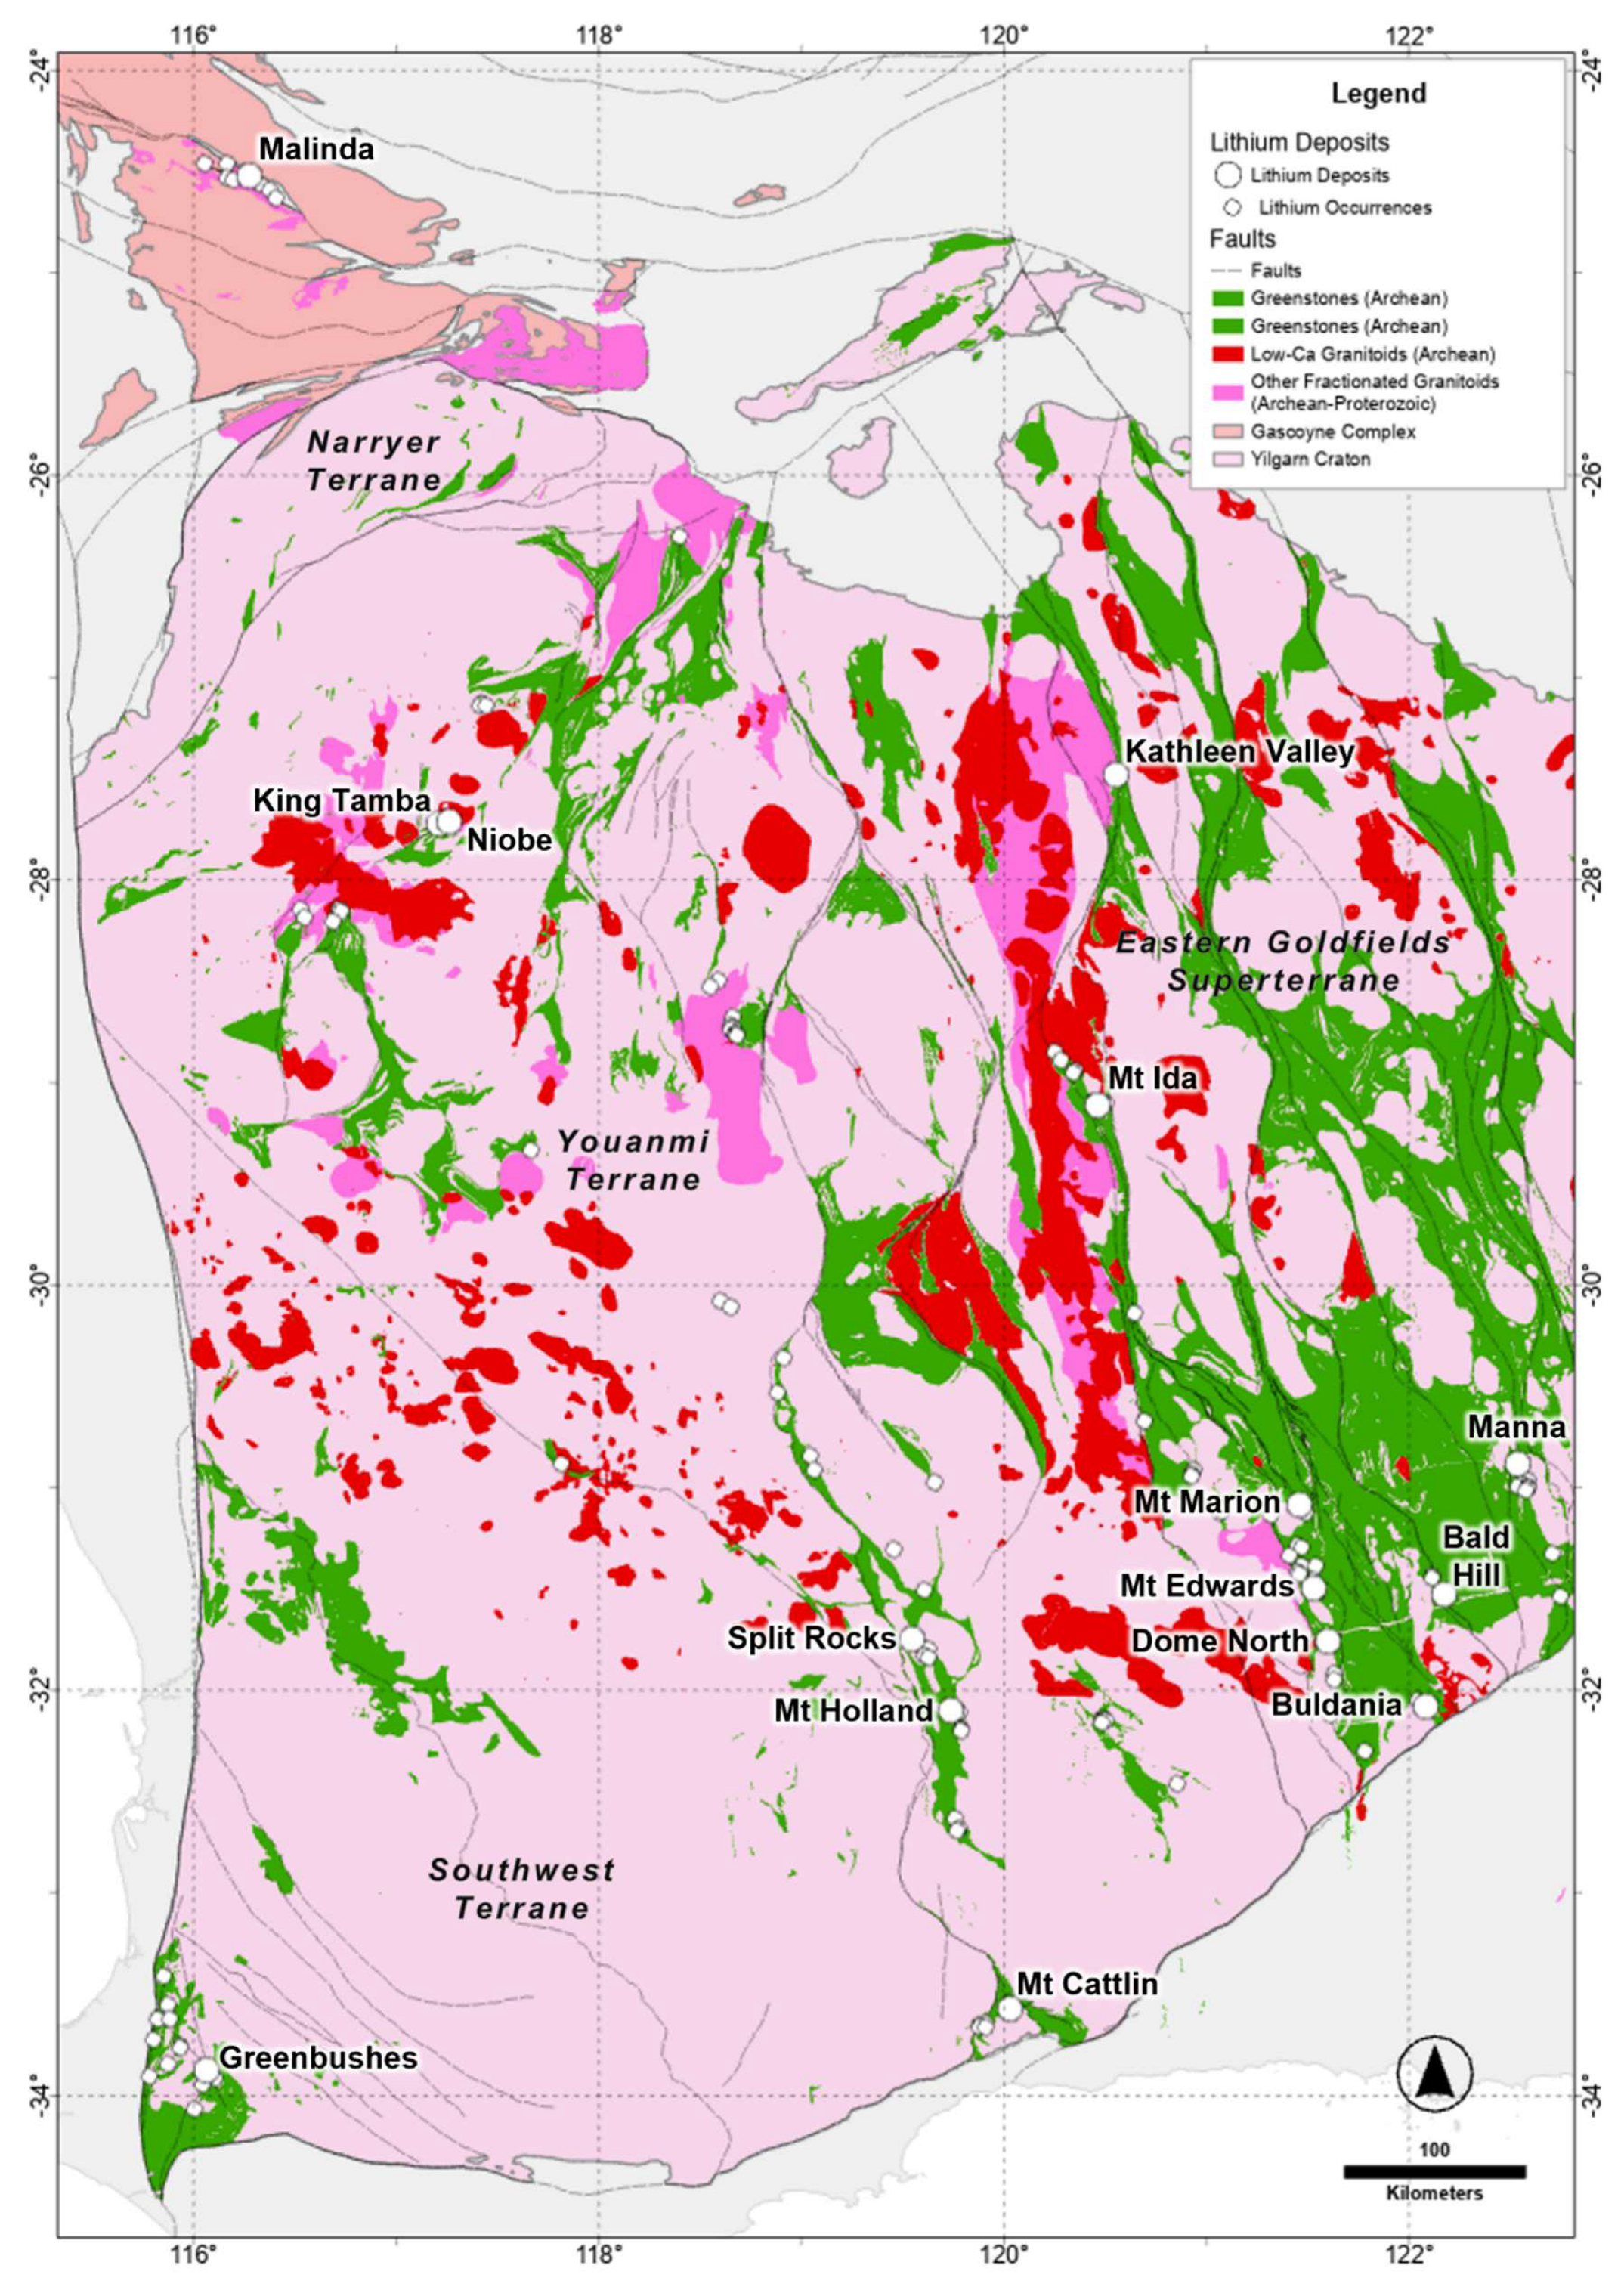
  • Western Australia ranks fourth in terms of global lithium resource endowment and is the world’s largest lithium supplier. Total resources amount to ~2,000 Mt of ore for 26 Mt of contained lithium oxide (Li2O), or lithia, contained in 19 LCT pegmatite deposit clusters (Figure 1; Table 1) [5]. The lithium mined in Western Australia to date has come entirely from LCT pegmatites of the Archean Pilbara and Yilgarn cratons. These two cratons host almost the entire Western Australian lithium endowment except for the Malinda lithium resource, which is hosted in LCT pegmatites of the Proterozoic Gascoyne Orogen. Greenbushes, located in the southwestern Yilgarn Craton, is not only the largest LCT pegmatite deposit in Western Australia but also the largest operating hard-rock lithium mine in the world [5-6].
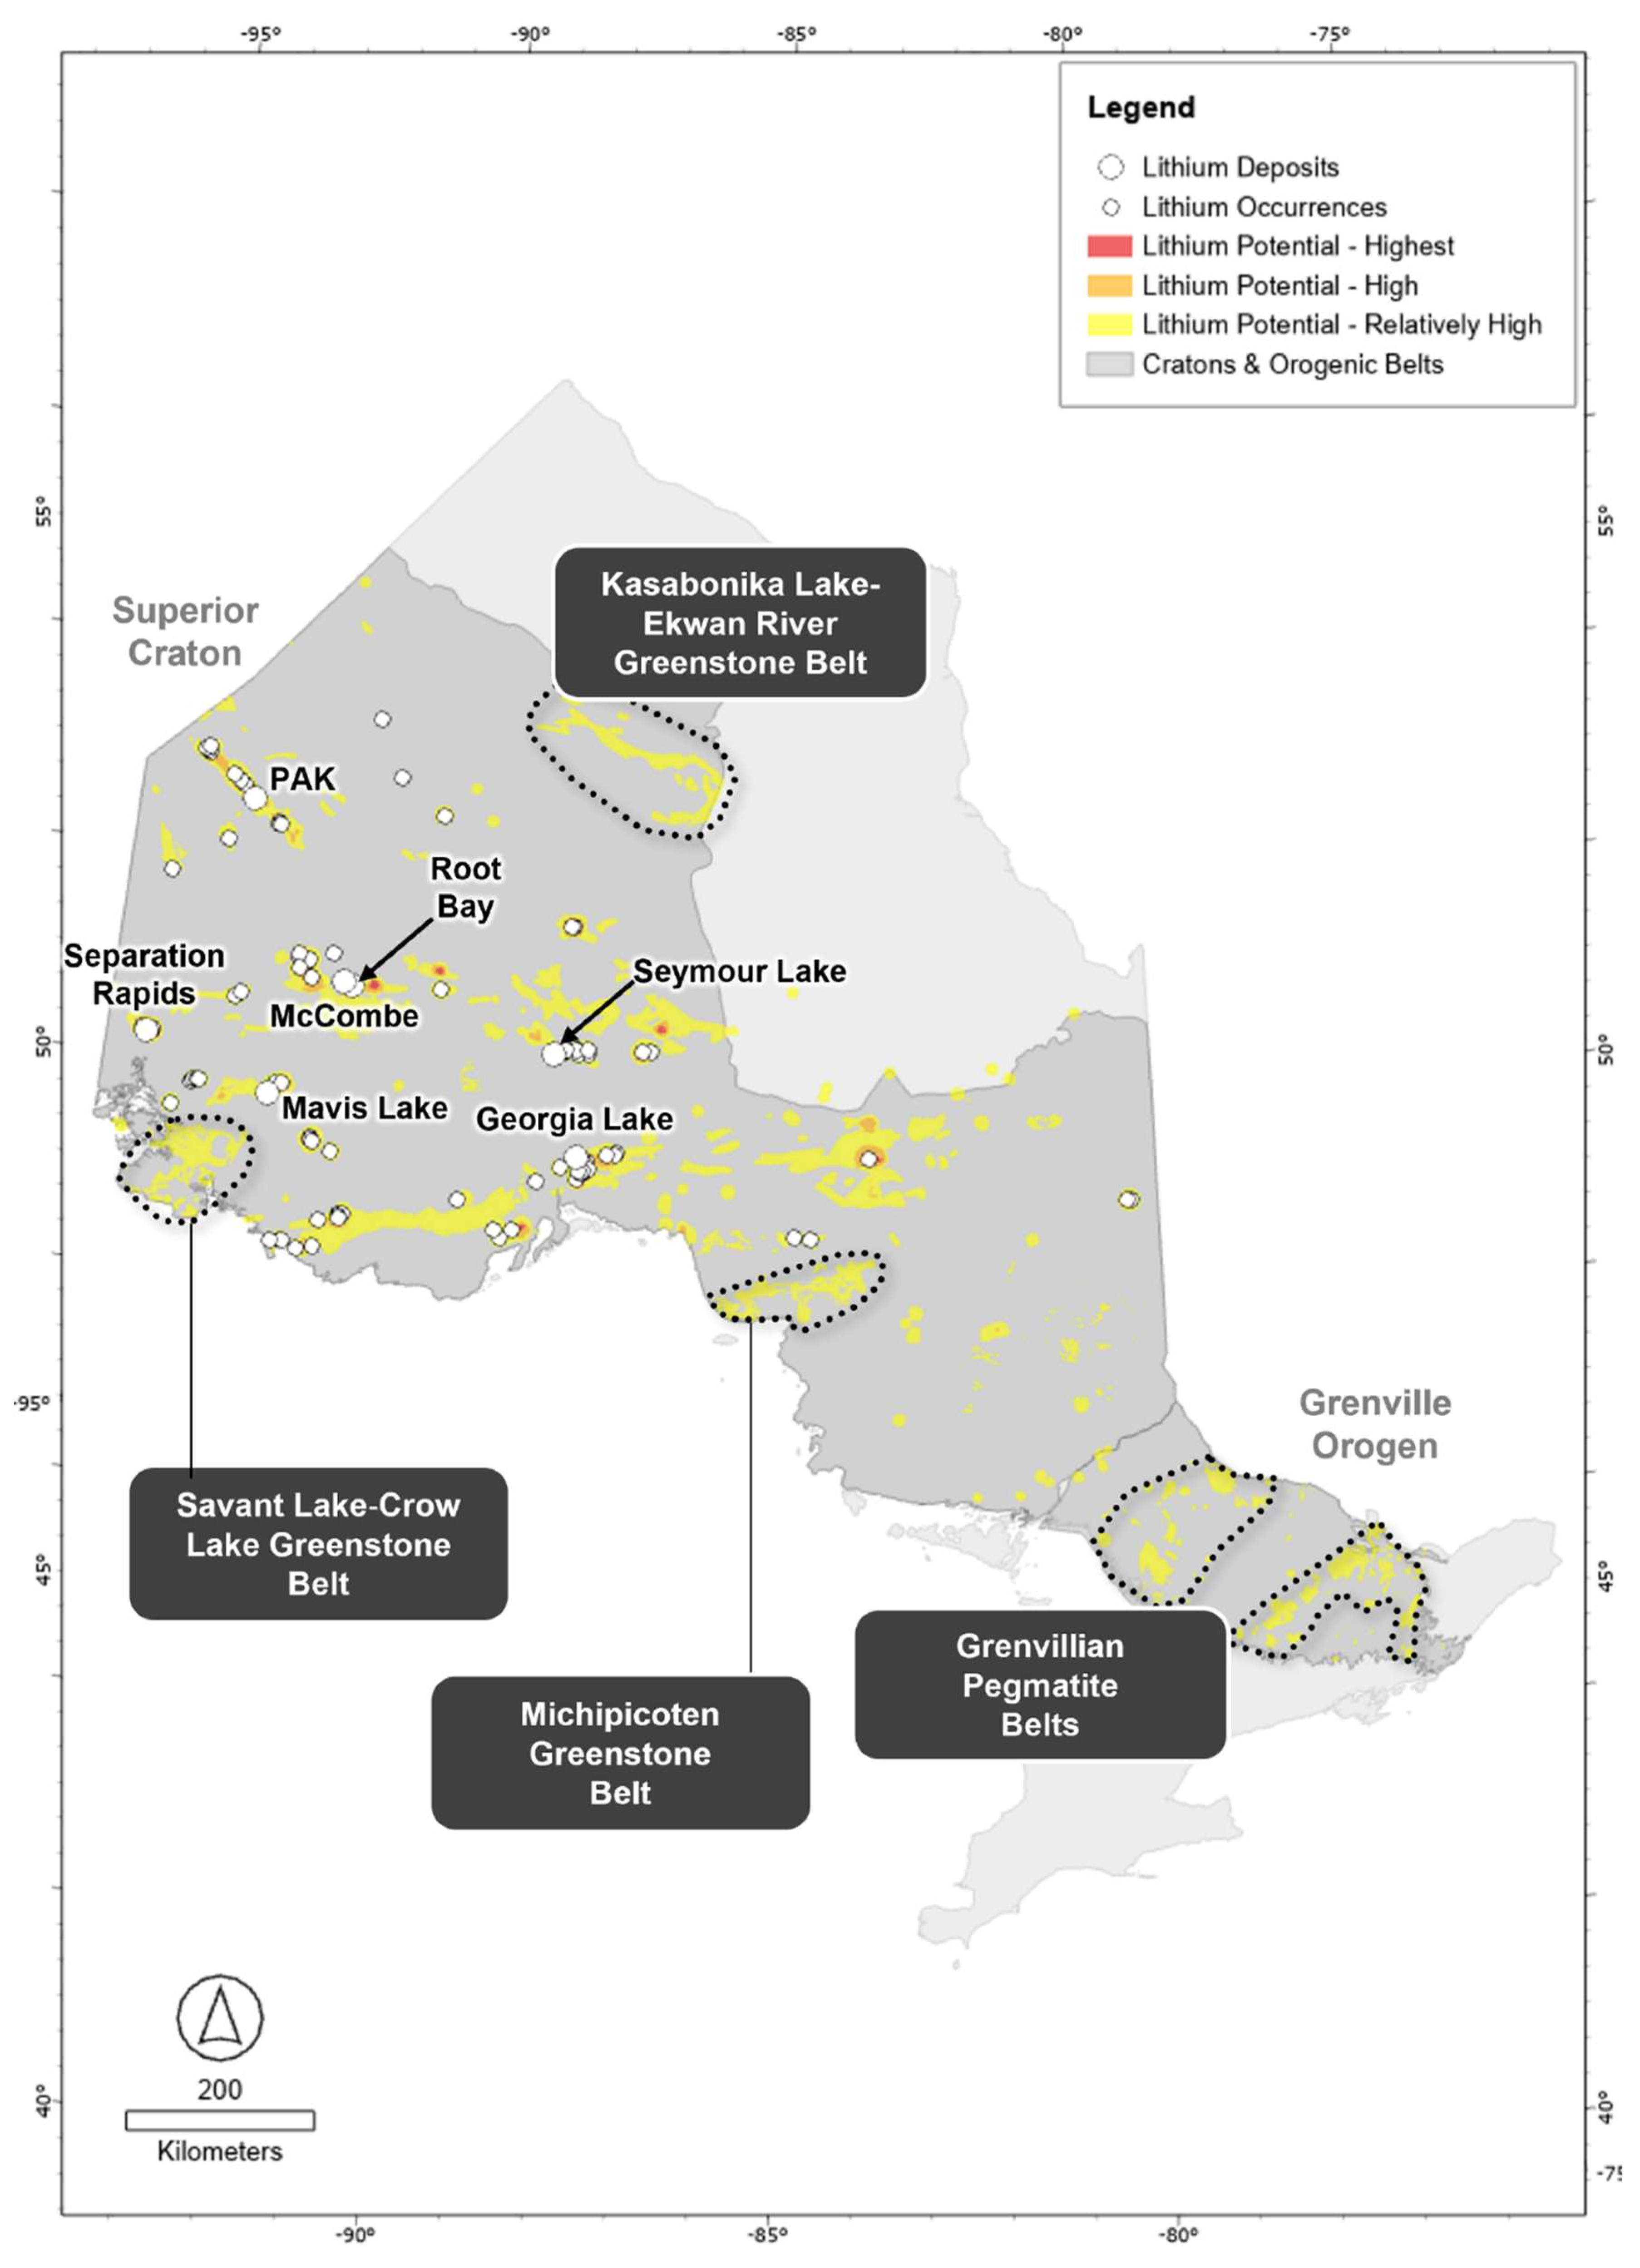
  • Ontario, on the other hand, does not have any producing lithium mines although it is host to a number of advanced projects [10-11], some of which are moving towards production. Total resources are estimated at just under 120 Mt of ore for ~1.5 Mt Li2O contained in seven LCT pegmatite deposit clusters (Figure 2; Table 2), all located in the Archean Superior Craton.
Table 2. LCT pegmatite lithium resources, Ontario.
Project Province Ore (Mt) Grade (% Li2O) Li2O (kt) Status Owner
PAK SC 58.5 1.49 871 Feasibility Frontier Lithium / Mitsubishi
Separation Rapids SC 12.9 1.36 175 Exploration Avalon / SCR-Sibelco
Georgia Lake SC 14.8 0.91 93 Pre-Feasibility RockTech Lithium
Root Bay SC 10.1 1.29 130 Exploration Green Technology Metals
Seymour Lake SC 10.3 1.03 106 Feasibility Green Technology Metals
Mavis Lake SC 8.0 1.07 86 Exploration Critical Resources
McCombe SC 4.5 1.01 45 Exploration Green Technology Metals
Totals 119 1,549
All figures are rounded. All resources are LCT pegmatite-hosted and either JORC 2012 or NI 43-101 compliant. Mineral resources compiled from [12] for PAK, [13] for Separation Rapids, [14] for Root Bay, Seymour Lake and McCombe, [15] for Georgie Lake, and [16] for Mavis Lake. Key to abbreviations: Avalon = Avalon Advanced Materials; SC = Superior Craton (Archean).
In addition to their existing lithium resource endowments, both Western Australia and Ontario show excellent potential for future discoveries given they host large areas of favorable geology, which, by and large, have recorded only limited historic lithium exploration activity, and keep attracting significant lithium exploration spent, which, in the last couple of years alone, has resulted in a series of demonstrably and potentially significant finds such as Andover (Azure Minerals) and Tabba Tabba (Wildcat Resources) in Western Australia as well as Case Lake (Power Metals) and Falcon Lake (Battery Age Minerals) in Ontario. Recent, more speculative and yet to be drilled, or more comprehensively drill tested, finds include, for example, Big Red (Future Battery Metals), Kobe (Greentech Metals), Farson (WIN Metals), Andover South (Raiden Resources) and Andover West (Errawarra Resources) in Western Australia as well as Despard (Green Technology Metals), Victory (Beyond Lithium), Gorman (Patriot Lithium), Livyatan (Blaze Minerals), and SBC (Libra Lithium) in Ontario.
Whilst the LCT pegmatite systems of Western Australia and Ontario have featured in several government reports and journal publications [e.g., 17-24], no formal assessments exist in the public domain of the lithium prospectivity of these important jurisdictions, both of which have significant lithium endowment and undiscovered resource potential and, thus, are vital in meeting future lithium demand.
This study set out to generate artificial intelligence (AI)-driven mineral potential models, conveying the prospectivity for LCT pegmatite-hosted lithium mineralisation across the entire state of Western Australia and province of Ontario. The approach taken here was broadly similar to those employed by [25-26]:
  • A detailed review was undertaken of the underlying mineral deposit model, in this case of LCT pegmatite-hosted lithium deposits;
  • A mineral systems approach [27-29] was used to frame the preparation of a targeting model with an emphasis on the critical processes of LCT pegmatite genesis and their mappable expressions; and
  • A multi-technique approach to mineral potential mapping (MPM) was adopted, using continuous as well as data- and knowledge-driven mathematical techniques, thereby facilitating cross-validation and comparing of the resulting prospectivity maps.
The study results, which include the first lithium prospectivity maps of Western Australia and Ontario, served:
  • To capture the current understanding of the genesis of and controls on LCT pegmatite mineralizing systems as well as their mappable expressions;
  • To delineate both the known as well as new areas lithium prospectivity, including extensions to the existing lithium occurrences clusters and greenfield areas not previously explored for lithium;
  • As a basis for discussion, for example, on what work may be required to improve exploration targeting of LCT pegmatite systems, in particular with regards to the publicly available and missing datasets;
  • To compare geological, data and exploration aspects unique to Western Australia and Ontario;
  • To determine the most effective spatial proxies for targeting LCT pegmatite mineralizing systems; and
  • To compare the results obtained from continuous, knowledge-driven and data-driven MPM.
Figure 1. Map of LCT pegmatite-hosted lithium occurrences and deposits of Western Australia. See Table 1 for grade-tonnage estimates. The map also shows the outlines of the geological regions that host these lithium pegmatites: The Archean Yilgarn and Pilbara cratons and the Proterozoic Gascoyne Complex and Halls Creek Orogen. Background image: Bouguer gravity of Western Australia (https://catalogue. data.wa.gov.au/).
Preprints 149132 g001
Figure 2. Map of LCT pegmatite-hosted lithium occurrences and deposits of Ontario. See Table 2 for grade-tonnage estimates. The map also shows the outline of the Superior Craton, the geological region that hosts these lithium pegmatites. Background image: Bouguer gravity of Ontario (https://www.geologyontario.mines. gov.on.ca).

2. About Lithium: Discovery, Applications & Markets

Lithium, a member of the alkali metals group, was first discovered in 1817 by Swedish chemist Johan August Arfvedson, who isolated the element from the mineral petalite, a lithium aluminum phyllosilicate found in certain pegmatites [1]. However, demand for lithium, initially a relatively obscure mineral commodity with limited industrial uses, remained modest until the 1950s to 1960s, when new healthcare and defense sector applications gave rise to surging demand. A second boom in the 1980s to 1990s was underpinned by the rise of portable electronic devices powered by lithium-ion batteries. However, these earlier booms pale in comparison to the latest, which is underpinned by lithium’s critical role in the green energy revolution. This latest boom, which gathered momentum in the mid-2010s, has seen dramatic rises (and falls) in lithium demand and product prices, largely driven by the rapid expansion of the global electric vehicle market [1,30].
What makes lithium such an attractive battery material is that it is lightweight, able to store large amounts of energy and an excellent electrical conductor. Whilst lithium is a relatively abundant metallic element, commercially exploitable lithium deposits are relatively rare. Hardrock-hosted lithium deposits, in particular spodumene-bearing LCT pegmatites, are currently the best and most sought-after deposit type for commercial production [31]. Spodumene, due to its relative abundance and high lithium content, is the principal economic hardrock lithium mineral mined [32]. In addition, lithium extraction from spodumene typically offers lower capital costs and a shorter time from discovery to production in comparison to brine operations whilst commercial lithium production from clay-hosted deposits is yet to be achieved [31,33]. Other lithium minerals that are mined from LCT pegmatites include lepidolite, petalite, eucryptite and amblygonite. Whilst the latter is widespread, it is rarely of economic significance. The former are typically much less common in LCT pegmatites compared to spodumene or amblygonite [34].

3. Materials and Methods

3.1. Data Sources

The geoscience and exploration data used in this study were almost entirely sourced from open-access repositories maintained by the Geological Survey of Western Australia (GSWA) and the Ontario Geological Survey (OGS) (Table 3).
In addition to their proven lithium endowment and potential, it was the excellent quality and broad coverage of the publicly available geoscience data provided by the state of Western Australia and the province of Ontario that made these jurisdictions highly attractive and amenable to a mineral prospectivity study such as presented in this contribution.

3.2. Mineral Systems Concept

The targeting model developed in this study was generated in the framework of a mineral systems approach [27-29,35-36] and in a manner described in more detail by [37-40]. Briefly, the mineral systems concept views mineral deposits as small-scale expressions of a series of geological processes operating at different temporal and spatial scales:
  • Source processes extract the essential mineral deposit components (i.e., melts and/or fluids, metals and ligands) from their crustal or mantle sources;
  • Transport processes drive the transfer of the essential components from source to trap regions via melts and/or fluids;
  • Trap processes focus melt and/or fluid flow into physically and/or chemically responsive, deposit-scale sites;
  • Deposition processes drive the efficient extraction of metals from melts and/or fluids passing through the traps; and
  • Preservation processes act to preserve the accumulated metals through time.
In situations where one or more of these processes fail to operate, a mineral deposit cannot form or will not be preserved. The probabilistic principle at the core of this concept is one of the key strengths of the mineral systems approach, and one that works well in combination with a mathematical method such as MPM [37-38,40]. An additional key strength of the mineral systems approach is that it provides a robust yet flexible framework for formulating a holistic, process-based targeting model, and observing, mapping and/or querying in the available geoscience data the expressions of the critical processes of mineral deposit formation [35,41].

3.3. Mineral Potential Modelling (MPM)

MPM, first developed and applied in the late 1980s in conjunction with the arrival of geographic information systems (GIS) [42,43], has since evolved into a powerful, time- and cost-effective targeting tool capable of big data analytics. In other words. MPM is capable of simultaneously handling, integrating, processing and modelling the typically diverse and often very substantial geological, geochemical, geophysical, remote sensing and drilling data generated and used in mineral exploration. It is also a tool that is well-suited for efficient screening of and target generation within large search areas, be it a mineral district or belt, or an entire country or continent. In summary, MPM is a multi-stage process that includes the following steps [29,41,44-47]:
  • Genetic model stage: Identification of the geological processes that are essential in the formation of the targeted deposit type to build a conceptual deposit model.
  • Targeting model stage: Translation of the genetic model into a targeting model in which the essential processes are reflected by mappable targeting criteria (also referred to as targeting elements, predictors, predictor maps or spatial proxies).
  • Mathematical model stage: Allocation of weights to combine the various spatial proxies using mathematical algorithms.
  • Target identification and prioritized stage: Mapping and prioritization of the most prospective areas.
Concerning the mathematical modelling, the prevailing methods can be broadly subdivided into data-driven, knowledge-driven, hybrid knowledge- and data-driven and continuous approaches employing logistic functions [44, 48-49]. The selection as to which weighting technique should be used is strongly guided by data availability, specifically the number of known mineral occurrences in support of the targeting model, commonly referred to as prospect locations (PL). For example, un- or underexplored ‘greenfields’, ‘grassroots’ or ‘frontier’ regions are typically data poor and may contain only few, if any, mineral occurrences of the target type. In such search spaces, a knowledge-driven approach is often a must with MPM reliant on expert opinion. ‘Brownfields’ regions, on the other hand, are typically well explored, at least in places, and, thus, data-rich, in particular in the vicinity of known mineral deposits. For such regions, the weighting is commonly data-driven [44,48]. In contrast, continuous weighting methods require neither expert opinion nor PLs with continuous spatial evidence offering superior predictive capability compared to discretized evidence [49].
Here, we adopted a multi-technique approach to MPM [26] comprised of continuous (data-driven index overlay [50], fuzzy gamma [51], geometric average [52]), knowledge-driven BWM-MARCOS [47] and data-driven random forest [53] approaches.

4. Lithium-Cesium-Tantalum (LCT) Pegmatites

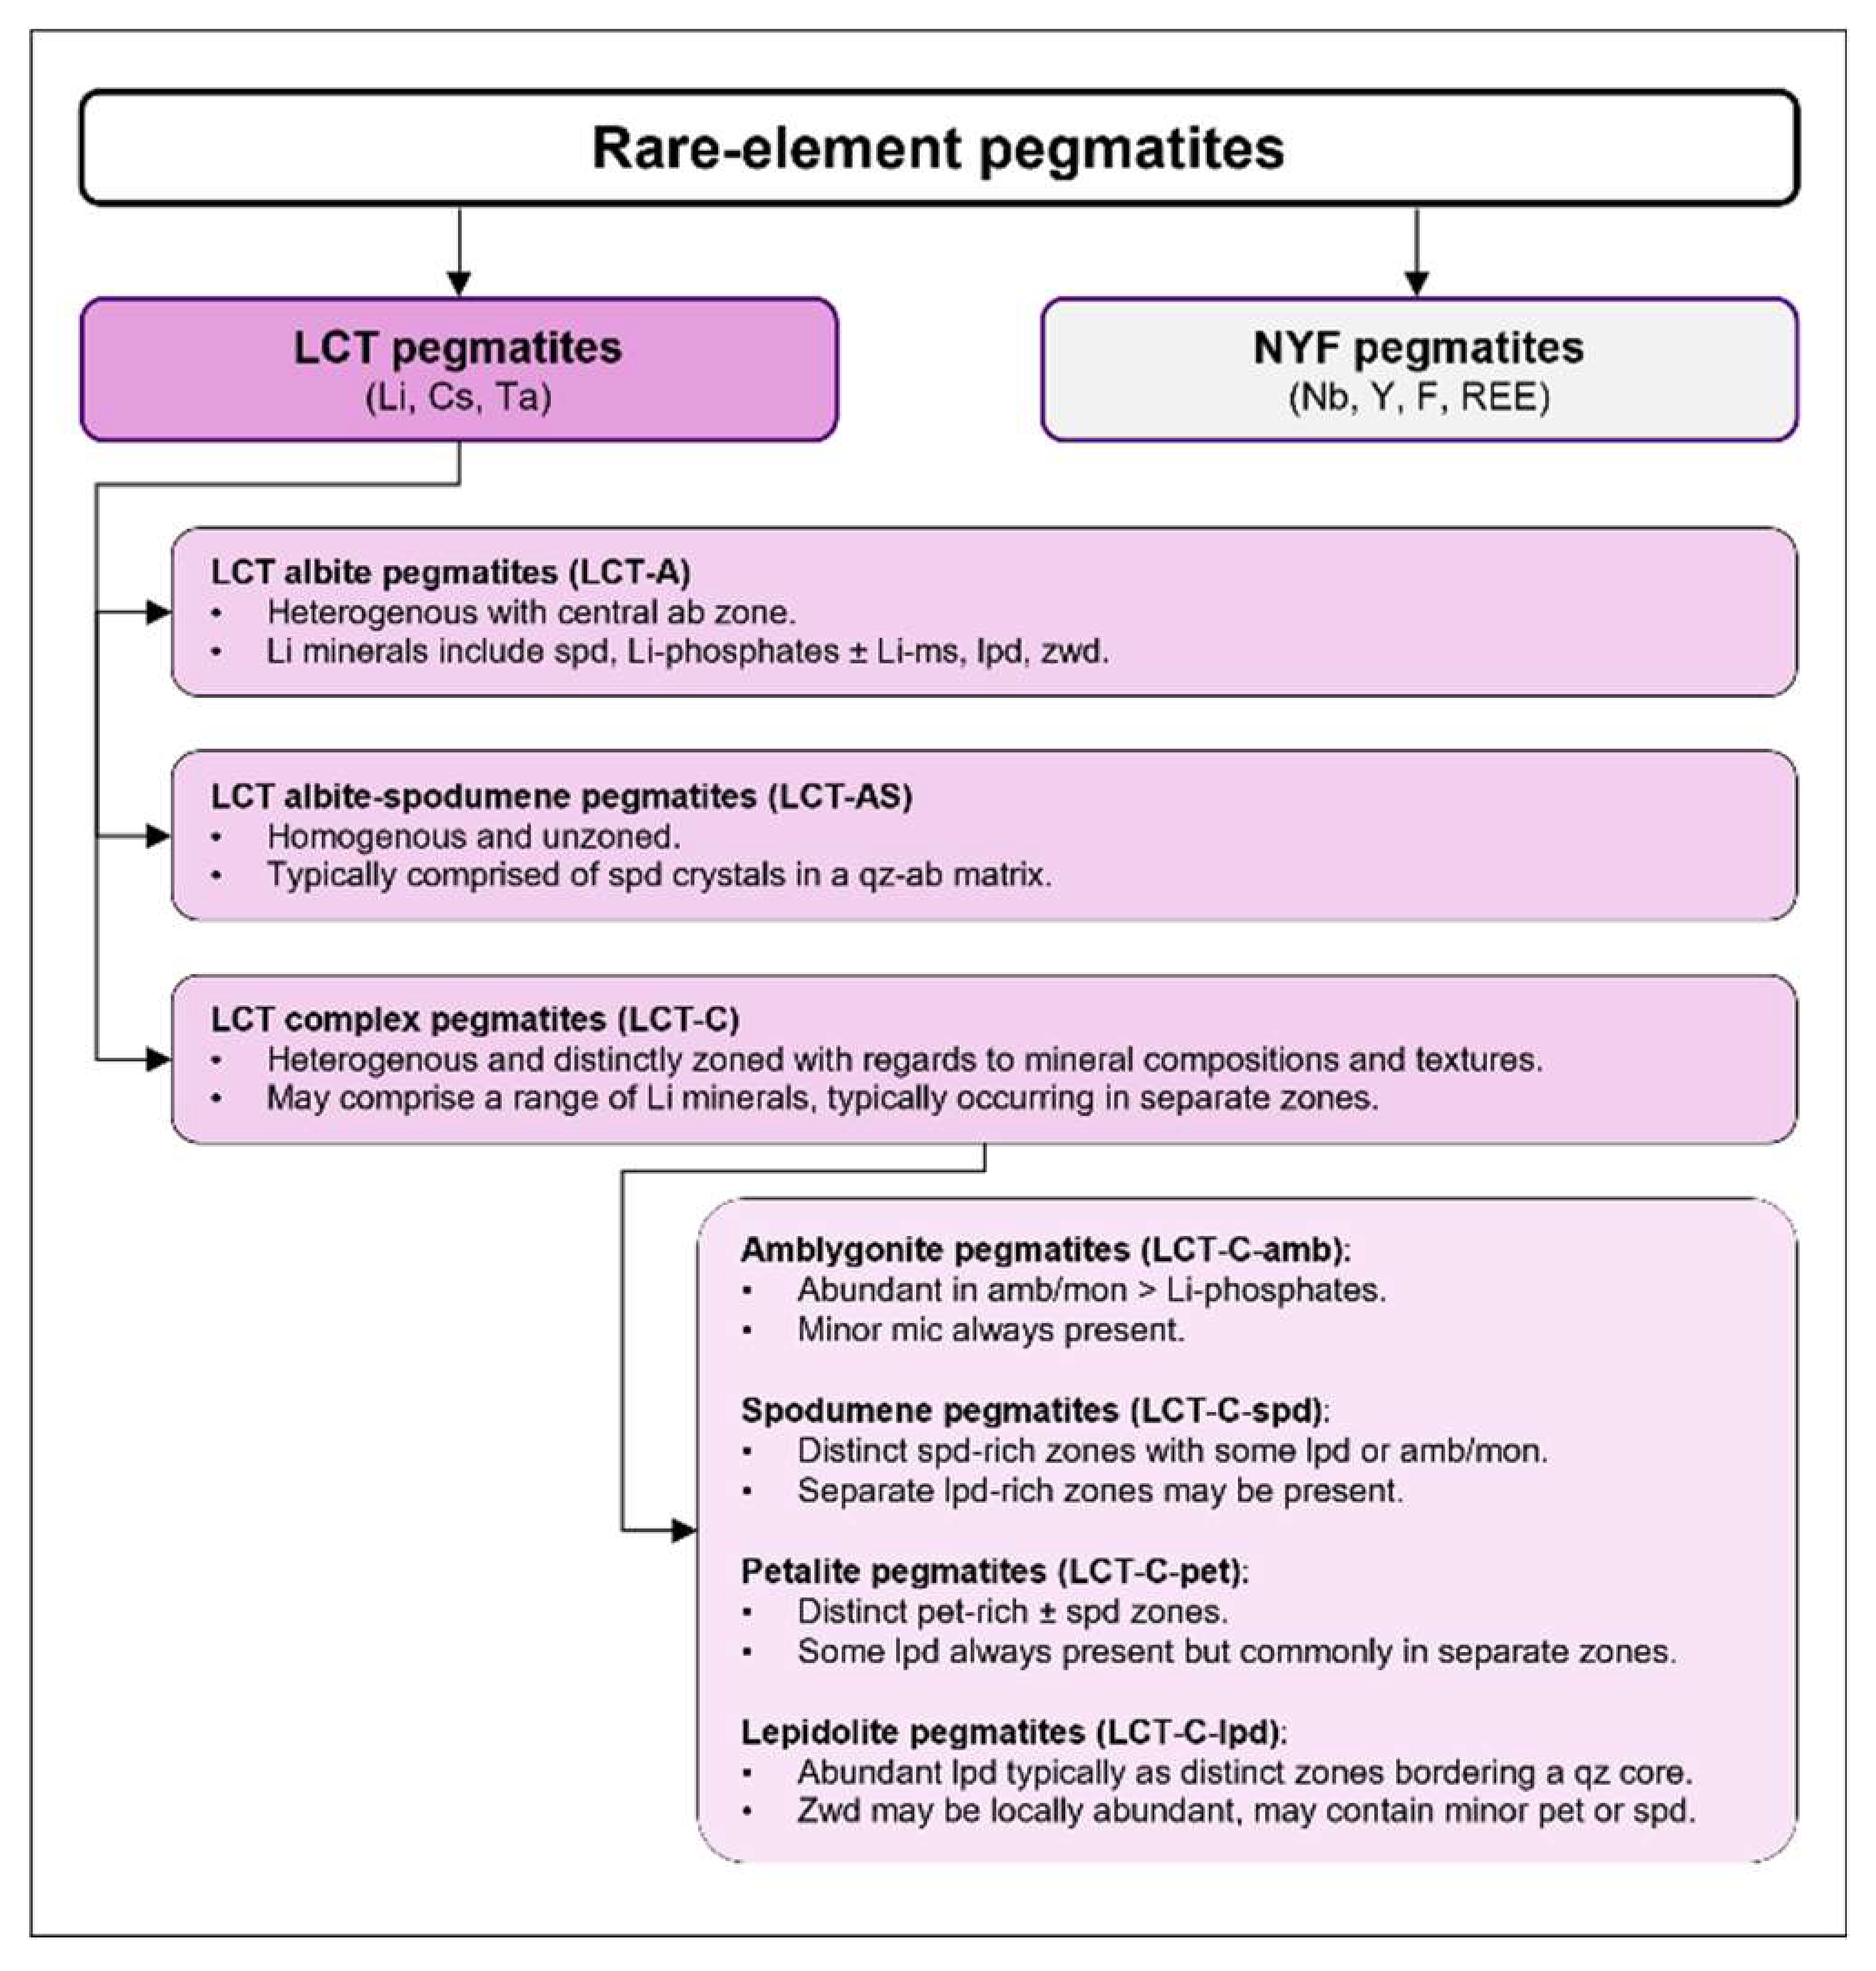
4.1. Descriptive LCT Pegmatite Deposit Model

The Collins Dictionary of Geology [54] defines pegmatite as “very coarse-grained igneous rock, typically found around the margins of large, deep-seated plutons, usually extending from the pluton itself into the surrounding country rocks” and “a volatile-rich, late stage in the crystallization of a magma” that is typically granitic in composition.
Only ~0.1% of all granitic pegmatites on Earth classify as rare-element pegmatites [23], distinguishable from common pegmatites by their typically more complex mineralogy and compositional zoning and variably anomalous contents of beryllium, cesium, lithium, niobium, rare earth elements, rubidium, tantalum, tin, and uranium, yttrium and zirconium [55]. The class of rare-element granitic pegmatites has two end-members: LCT pegmatites, and niobium-yttrium-fluorine (NYF) pegmatites [55-56] (Figure 3). In contrast to LCT pegmatites, which can host significant deposits of beryllium, cesium, lithium, tantalum and/or tin, NYF pegmatites are, by and large, of little consequence to the global economy with only few representatives of this pegmatite family known to contain any mineable resources; in these cases small- to modest-sized deposits of niobium, uranium and/or rare earth elements [55].
LCT pegmatites can be found on all continents and range in age from Meso-Archean (Pilgangoora, Western Australia: ~2,879 Ma) to Cenozoic (Fonte del Prete, Italy: ~7 Ma). Most pegmatites are hosted by belts of sedimentary and igneous rocks that have been deformed and metamorphosed to upper greenschist to amphibolite facies grades. Whilst it is common to observe LCT pegmatites that lack any apparent source granite, there are many belts worldwide where a continuum can be observed from ‘parental’ granites to their pegmatite ‘offspring’ (Figure 4), or a genetic link can be inferred between the two based on textural, mineralogical, geochemical, isotopic, and geochronological evidence. The interpreted source intrusions are commonly relatively small, chemically and texturally evolved, and spatially and genetically associated with the waning stages of much more voluminous felsic magmatism. In addition, in many cases, the pegmatite offspring shows a district-scale zoning pattern with respect to the parental granite, with the greatest enrichment in incompatible elements characteristically recorded in the more distal pegmatites [2,57-58]. Overall, the geological features and spatial and temporal distribution of LCT pegmatites are consistent with their genesis in zones of crustal thickening along convergent plate boundaries, triggered by subduction or continental collision but most likely contemporaneous with post-tectonic crustal relaxation of the thickened crust [2,21,59]. However, according to [59], LCT pegmatites can theoretically form in any setting in which the crust contains previously unmelted, mica-rich metamorphic source rocks, regardless of tectonic regime.
LCT pegmatites can be very large in size as exemplified by Western Australia’s Greenbushes lithium-tantalum-tin deposit, which is centered upon a group of pegmatites that are traceable along strike for up to 3,500 m, have maximum widths of up to 300 m and are interpreted to persist to vertical depths of at least 600 m [60]. In terms of their geometries, LCT pegmatites can take the form of flat-lying tabular sills, variably dipping tabular dykes, lenticular bodies or oddly shaped masses that commonly occur in groups (i.e., pegmatite swarms, fields or districts). Dykes are often vertically stacked [2] (Figure 5, Figure 6 and Figure 7).
The degree of internal compositional zoning in LCT pegmatites ranges from relatively homogeneous types with relatively simple mineral assemblages (e.g., Pilgangoora, Western Australia) to distinctly zoned types with complex mineralogical assemblages (e.g., Greenbushes, Western Australia) (Figure 3). Mineralogically, LCT pegmatites comprise mostly of quartz, potassium feldspar, albite, and muscovite. Biotite, garnet, tourmaline and apatite are typical accessories. The principal components of economic interest are the lithium-bearing minerals spodumene, petalite, and/or lepidolite, the cesium-bearing mineral pollucite, the tantalum-bearing columbite-tantalite group of minerals, the tin-bearing mineral cassiterite and the beryllium-bearing mineral beryl [2].
Global examples of prominent LCT pegmatite systems are Greenbushes (Australia), Tanco (Canada), King’s Mountain (USA), Manono-Kitotolo (DRC) and Jiajika (China) [2].

4.2. LCT Pegmatites of Western Australia

4.2.1. Geological Background and Distribution of Endowment

Western Australia records a greater four-billion-year history of assembly and breakup of cratonic elements, tied to global supercontinent cycles, that shaped the Australian continent and its mineral resources [61].
The oldest crustal elements of Western Australia, the Archean-age Yilgarn (~3,730 to 2,660 Ma) and Pilbara (~3,530 to 2,930 Ma) cratons (Figures 1, 8-9), comprised of extensive granite-greenstone and high-grade metamorphic gneiss terrains, are thought to have formed by either crustal overturn, sagduction or tectonic processes more analogous to modern plate tectonics. During early Proterozoic times, these Archean nuclei were amalgamated and incorporated into the broader Western Australian Craton, driven by a series of orogenies between ~2,215 and 1,950 Ma. The subsequent collision of the West Australian Craton with the North Australian Craton, a previously formed amalgamation of several Archean to Paleoproterozoic (pre-1,840 Ma) tectonic elements, lead to a complex series of tectono-thermal events concurrent with the final assembly of the Columbia/Nuna Supercontinent between 1,950 and 1,770 Ma [62-65].
The entire Western Australian lithium endowment and all but one of the known lithium occurrences are contained within the West Australian Craton, particularly its Archean nuclei, the Yilgarn and Pilbara cratons (Figures 1, 8-9). The Paleoproterozoic Gascoyne Block (Figures 1, 8), also located in the West Australian Craton, represents an emerging lithium province. The only known lithium occurrence outside of the West Australian Craton is found in the Paleoproterozoic Halls Creek Orogen (Figure 1) of the North Australian Craton. No lithium occurrences have been identified thus far in any of the other Proterozoic orogenic belts of Western Australia. Many of the Phanerozoic geological regions in the state are composed of unmetamorphosed basin sequences and, consequently, would have little to no LCT pegmatite potential (cf. [2]).

4.2.2. LCT Pegmatites of the Archean Yilgarn Craton

Eastern Yilgarn Craton LCT pegmatites are hosted in greenstone belts close to granite-greenstone contacts. They typically occur no more than 10 km from major faults or lineaments, often substantial structures marking domain or terrane boundaries, and generally show a preference for mafic or ultramafic host rocks metamorphosed at greenschist to amphibolite grade [66] (Figure 8; Table 4). Whilst the LCT pegmatites in the Eastern Goldfields Superterrane tend to cluster along first-order faults that separate individual terranes or lithostructural domains, those in the Murchison and Southern Cross terranes tend to be associated with less substantial second- or third-order faults. They also tend to be smaller in size compared to those in the Eastern Goldfields Superterrane.
Age-wise, the eastern Yilgarn Craton LCT pegmatites fall within a relatively narrow bracket of ~2,650 to 2,600 Ma, contemporaneous with a major period of global pegmatite emplacement [2,66-67]. No S-type granites exist in the Yilgarn Craton that would indicate the melting of sedimentary crustal sources [68], a key ingredient in the widely accepted LCT pegmatite deposit model (cf. [2]). However, in the Yilgarn Craton, the 2,650 to 2,600 Ma interval correlates with the formation of voluminous low-Ca granite melts of I-type affinity and with chemistries indicative of crustal melting. Granites of this igneous suite are potassic in composition, with high LILE and HFSE contents, and illustrate features indicative of late-magmatic fluid movements, such as miarolitic cavities and common pegmatites [66-67,69]. Witt [70] documented a plausible genetic link between some low-Ca granites and LCT pegmatites in the Kalgoorlie Terrane of the eastern Yilgarn Craton. More specifically, the author demonstrated that the geochemical and petrographic characteristics of the inferred parental granites are comparable to those of demonstrated lithium source granites in pegmatite provinces elsewhere on Earth. Recent work by [68] and [71] demonstrated that the low-Ca granites are progressively more radiogenic and enriched in lithium close to granite-greenstone contacts, typically marked by fault systems. The enrichment was interpreted as the signature of a preconditioned crust, which, at the time, was primed for biotite-dehydration melting at relatively shallow greenstone-root levels [68,71].
Compositionally and mineralogically, most eastern Yilgarn Craton LCT pegmatites classify as albite-spodumene pegmatites (Figure 3; Table 4), a category that is reserved for homogenous, unzoned LCT pegmatites, predominantly comprised of spodumene crystals in a quartz-albite matrix. If present, other lithium minerals, such as petalite, amblygonite, eucryptite, lepidolite or zinnwaldite, are not abundant enough in these pegmatites to be of economic interest. Albite-spodumene LCT pegmatites commonly take the form of subhorizontal to gently-dipping, sheet-like bodies [23,66], which, in the eastern Yilgarn Craton, can have strike lengths of >3 km (Manna) and maximum thicknesses of up to 100 m (Mt Holland). With proven distances of >2 km (Mt Holland), down-dip extents can be equally impressive.
The giant Greenbushes LCT pegmatite in the southwestern Yilgarn Craton (Figure 8; Table 1) does not fit the general mold. Rather, it is dated at ~2,527 Ma and, therefore, postdates the period of eastern Yilgarn Craton LCT pegmatite emplacement by about 75 to 100 m.y. Moreover, Greenbushes lacks an apparent causative parental intrusion, was emplaced syntectonically into a 150 km-long, regional-scale shear zone and is extensively deformed. It crystallized at upper amphibolite facies temperature and pressure conditions, which are higher than those recorded for its eastern Yilgarn Craton counterparts and displays an atypical, complex mineralogical zonation pattern [66,72] (Table 4).

4.2.3. LCT Pegmatites of the Archean Pilbara Craton

Pilbara Craton LCT pegmatites (Figure 9) are in many respects like those found in the eastern Yilgarn, including their preference for mafic-ultramafic, greenschist to amphibolite facies grade host rocks, proximity to granite-greenstone contacts and major faults and lineaments, and prevalence of albite-spodumene LCT pegmatites. Yet, the Pilbara Craton LCT pegmatites are older (~2,880 to 2,830 Ma) and, by and large, illustrate stronger spatial, geochemical, geochronological and, thus, genetic links to their inferred source intrusions: Highly fractionated, high silica monzogranites, with high LILE and HFSE contents and low K/Rb ratios, of the ~2,850 to 2,830 Ma post-tectonic Split Rock Supersuite (Figure 9; Table 4) [66].

4.2.4. LCT Pegmatites in Proterozoic Terrain

Little information exists in the public domain about LCT pegmatites in the Proterozoic terrains of Western Australia, and few such occurrences have been identified to date. The largest known system occurs at Malinda in the Yinnetharra LCT pegmatite district of the Paleoproterozoic Gascoyne Complex (Figure 8; Table 4). Here, multiple gently south- and north-dipping pegmatites cut a Paleoproterozoic basement of folded amphibolite and sedimentary schist, metamorphosed at upper greenschist to lower amphibolite facies conditions. The pegmatites are located along a greater 200 km-long, mantle tapping fault system and immediately adjacent to a composite intrusive body dominated by porphyritic monzogranite and leucocratic tourmaline-bearing granite of the Neoproterozoic (995 to 939 Ma) Thirty-Three Supersuite. This igneous suite, which was emplaced during and immediately after the Edmundian Orogeny (1,030 to 955 Ma), is interpreted as a possible causative intrusion [73-74]. The Malinda LCT pegmatites are sheet-like bodies that pinch and swell with the thicker parts of the pegmatites mineralised. Over 5 km of combined strike length of pegmatites has been defined to date. Individual pegmatites are up to 1.8 km long and have maximum widths up to >100 m and down-dip extents of >400 m. Lithium minerals within the pegmatites are predominantly spodumene, with subordinate lepidolite and trilithionite. Gangue minerals are mainly quartz and albite, with some microcline and muscovite [74].

4.3. LCT Pegmatite Systems of Ontario

4.3.1. Geological Background and Distribution of Endowment

The Superior Craton of eastern Canada and the north-central United States consists of extensive granite-greenstone, clastic sediment-dominated and high-grade metamorphic gneiss terrains. It represents the world's largest preserved piece of Archean crust, which forms the core of the much larger Canadian Shield. The craton was assembled between 2,720 and 2,680 Ma by amalgamation of continental blocks with rocks as old as ~3,800 Ma and intervening tracts of oceanic crust, most likely by tectonic processes analogous to modern plate tectonics. By and large, the Superior Craton has been tectonically stable since 2,600 Ma, following progressive north to south assembly of its terranes into a coherent craton during the Kenoran Orogeny [93-96].
Ontario’s entire lithium endowment, including all known lithium occurrences, is contained within the Archean Superior Craton (Figure 10; Tables 1, 5). No lithium occurrences have been identified thus far in the Proterozoic orogenic belts of Ontario (i.e., 2,200 to 1,850 Ma Penokean and 1,300 to 1,000 Ma Grenville orogens) although discovery potential may exist. Widespread Paleozoic to Mesozoic basin sequences in northern and southern Ontario are unmetamorphosed [97-98] and, consequently, would have little to no LCT pegmatite potential [2].

4.3.2. LCT Pegmatites of the Archean Superior Craton

Like in the Western Australian Yilgarn and Pilbara cratons, LCT pegmatites in the Superior Craton are hosted in greenstone belts close to granite-greenstone contacts and typically occur no more than 10 km from prominent faults or lineaments. These are often substantial structures marking domain or terrane boundaries. They also display a similar preference for mafic or ultramafic host rocks metamorphosed at greenschist to amphibolite grade and fall into a broadly similar Neoarchean age bracket as the eastern Yilgarn LCT pegmatites of ~2,670 to 2,640 Ma [18-19] (Figure 10; Table 5). Where most of the Archean LCT pegmatite systems in Ontario differ from those in Western Australia is in the following aspects:
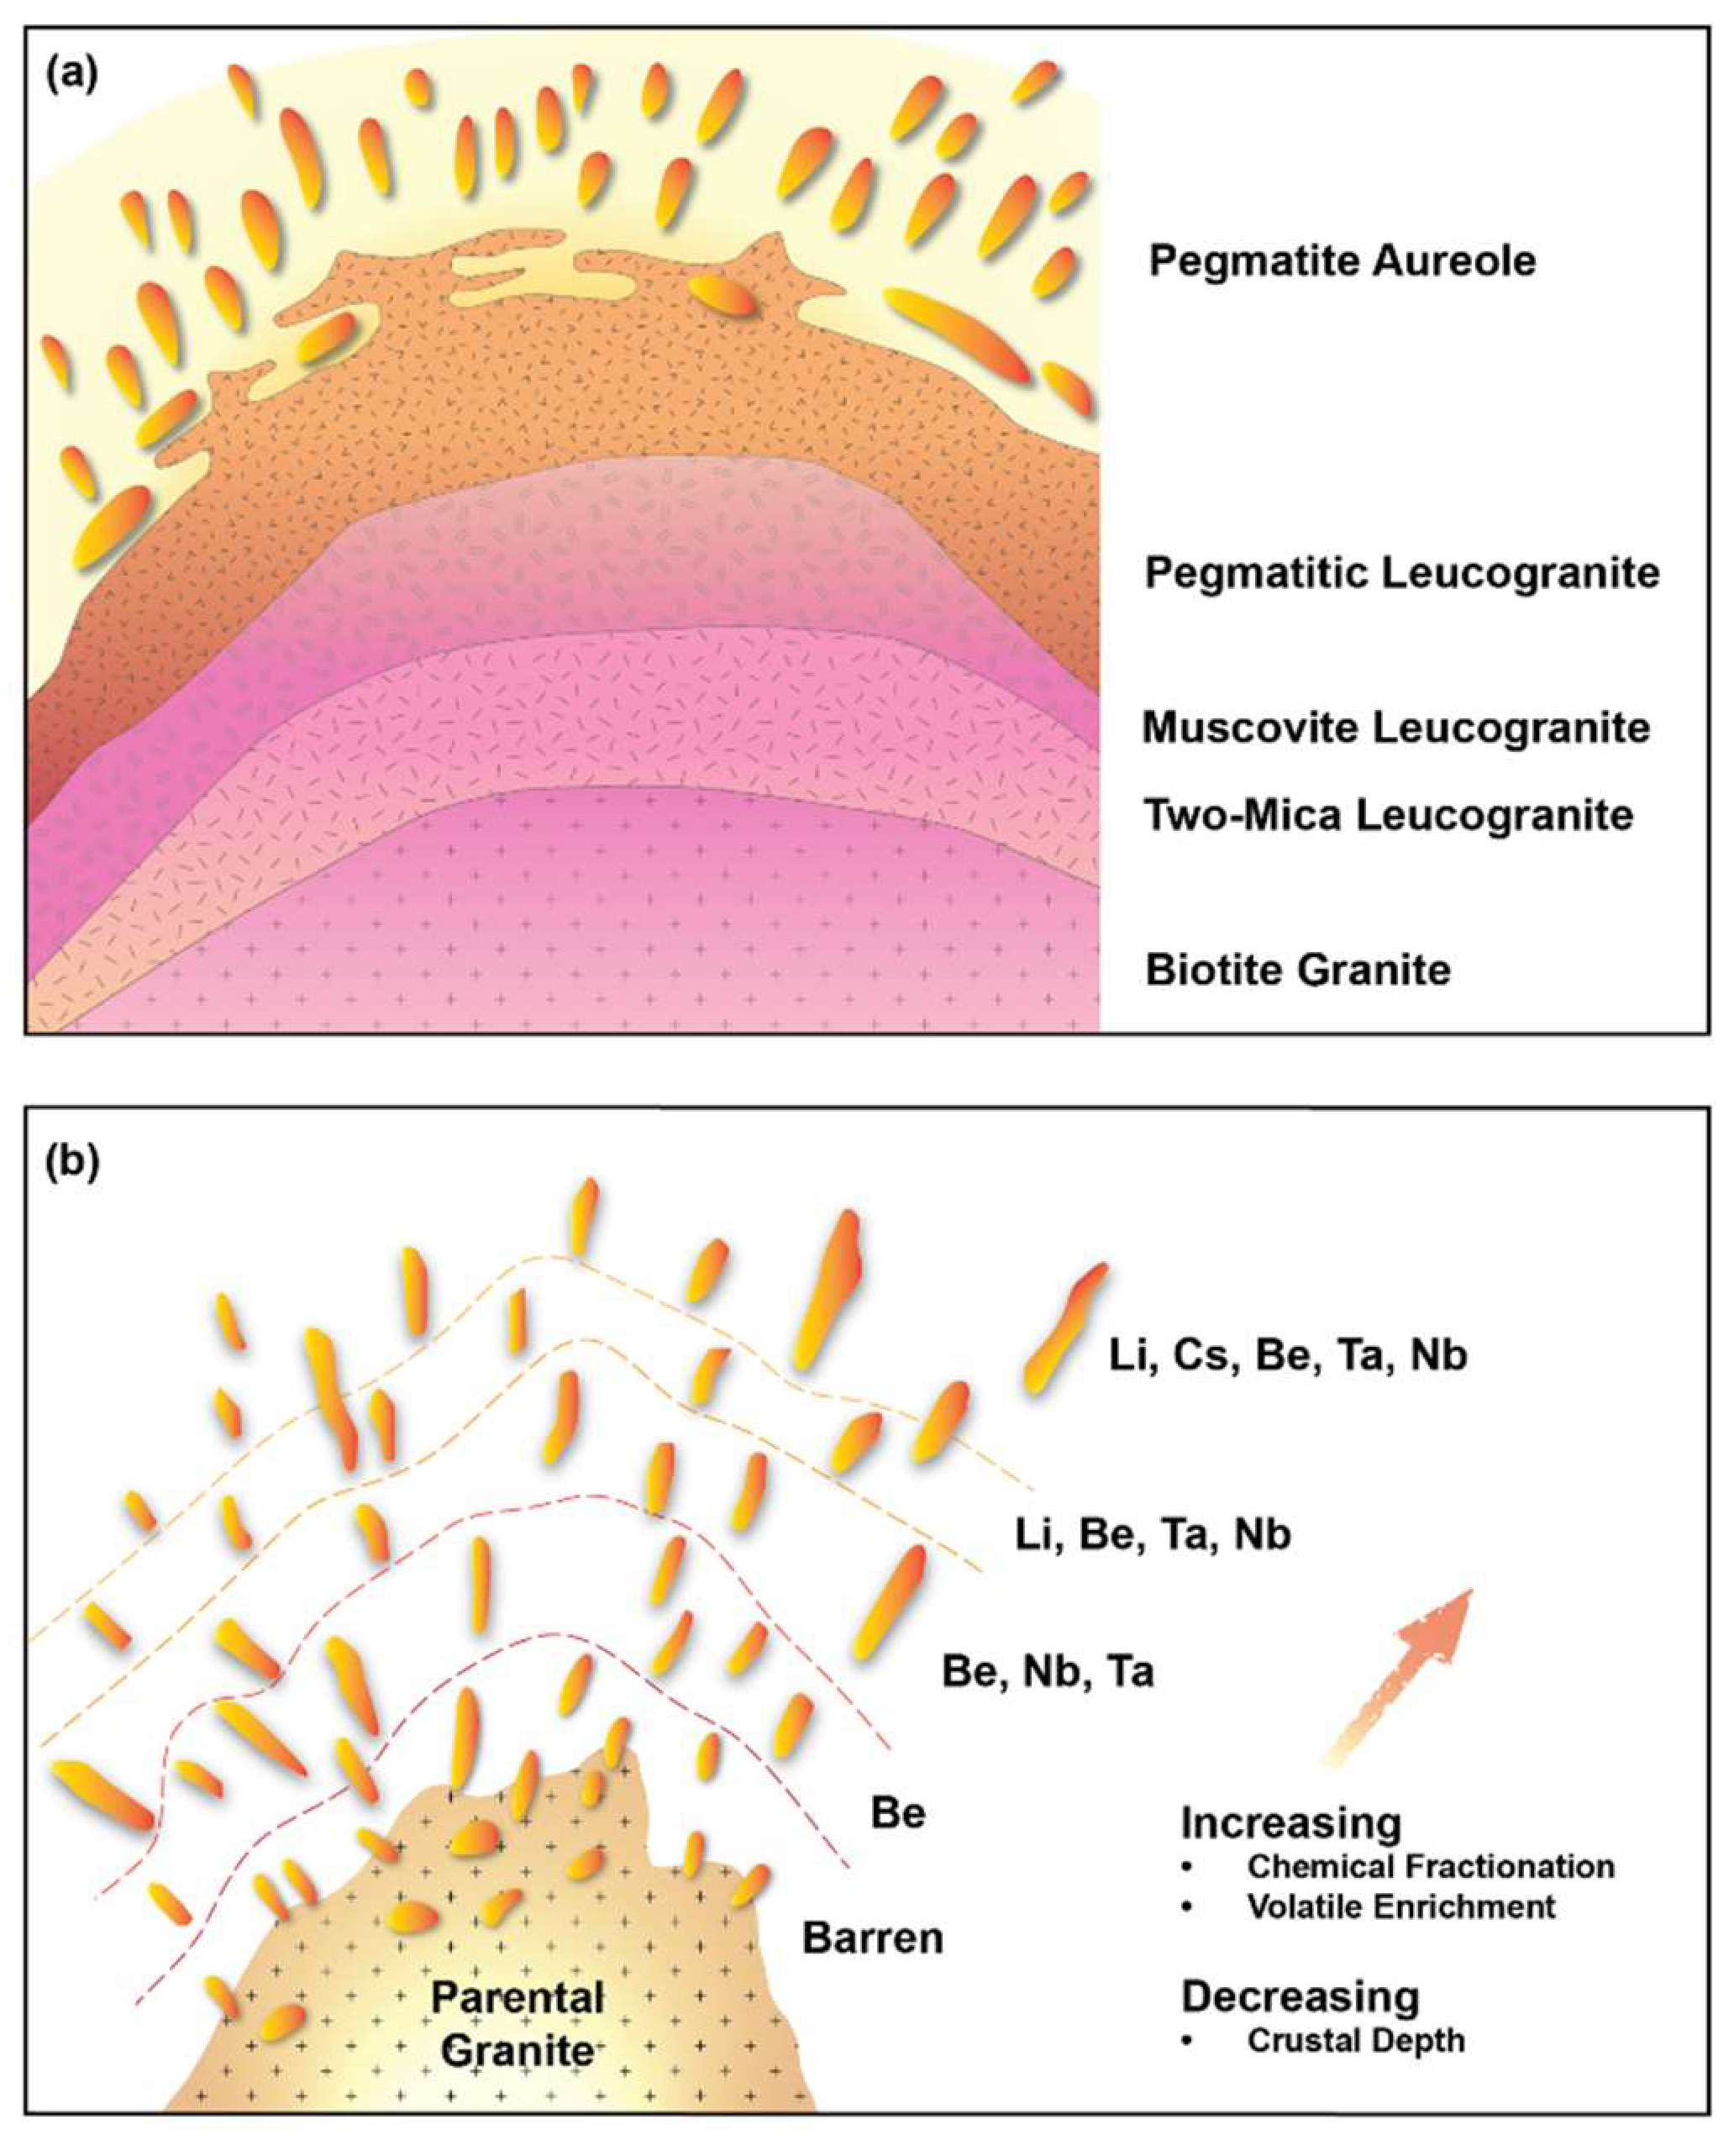
  • There is good evidence in the Superior Craton of Ontario of a genetic link between fertile parental granites and spatially associated LCT pegmatites. The fertile, peraluminous, Neoarchean-age (2,680 to 2,640 Ma) S-type granites, derived from the partial melting of a thickened sedimentary crustal source, are most abundant in the metasediment-dominant English River and Quetico terranes. Well documented examples of lithium source granites and their related pegmatites are the Ghost Lake Batholith and Mavis Lake pegmatites and the Separation Rapids Pluton and Separation Rapids pegmatites, which typically occur no more than 15 km from the margins of their parental intrusions [18-19,99]. Terranes that lack these S-type granites are largely devoid of LCT pegmatites (Figure 10).
  • Most LCT pegmatites in the Superior Craton of Ontario classify as complex pegmatites, whereas this subtype is less common in the Archean cratons of Western Australia. Interestingly, the two largest lithium resources in Ontario, hosted by the PAK and Separation Rapids LCT pegmatite systems, both classify as complex petalite types, a category of LCT pegmatite that is rare in Western Australia. On the other hand, Ontario has few known LCT pegmatites of the albite-spodumene type, which is a common type in Western Australia where pegmatites of this type can host substantial lithium resources.
  • LCT pegmatites in Ontario have a preponderance for steep to subvertical dip angles (e.g., PAK, Separation Rapids) whilst their Western Australian counterparts are typically gently-dipping to subhorizontal in nature. There also appear to be more examples of LCT pegmatites in Ontario that (i) are tectonically deformed or strongly deformed (e.g., PAK is schistose [100], Separation rapids is complexly folded, strongly schistose and locally mylonitized [101]), and (ii) have lenticular or prolate (e.g., PAK, Separation Rapids) rather than sheet-like geometries, which is more common in Western Australia. Pegmatite footprints are commonly more modest than in Western Australia with the larger Ontarian systems (i.e., PAK, Separations Rapids) characterized by strike lengths of between 1.5 and 2.3 km, maximum widths of between 70 and 125 m and proven down-dip extents of between 275 to 400 m. The smaller systems have strike lengths in the range from 0.2 to 1.3 km, maximum thicknesses of 10 to 25 m and proven down-dip extents of 300 to 950 m. As in Western Australia, stacked pegmatite systems are common.
  • Ontario’s known LCT pegmatites have a combined lithium resource endowment of 1,549 kt Li2O, which amounts to only 6% of the combined Western Australian lithium resource endowment of 25,998 kt Li2O (Table 1). Even at the craton level, the Superior Craton in Ontario hosts significantly less lithium than the Yilgarn (13,916 kt Li2O) or Pilbara (11,839 kt Li2O) cratons of Western Australia despite its size of ~595,000 km2 (the entire Superior Craton has a size of 1 572 000 km2, comprising almost a quarter of the Earth’s exposed Archean crust [93]), which is comparable to that of the Yilgarn Craton (~609,000 km2) and several times larger than that of the Pilbara Craton (~57,000 km2). Looking at individual deposits, PAK, the largest lithium resource in Ontario would only rank at number eight amongst the Western Australian lithium resources. To a certain degree, this discrepancy may be a function of exploration maturity but the latter is unlikely to account for the large variability . Rather, it is more likely that the specific conjunction of critical geological factors, including some of those mentioned above, had an important role to play.
Table 5. LCT pegmatite systems, Ontario.
System Sub-Type Province Age Geology & Structure Mineralogy References
PAK LCT-C-pet SC Neoarchean
(~2,670 Ma)
HR: felsic to ultramafic volcano-sedimentary rocks, granite; SC: shear zone corridor; SR: peraluminous two-mica granite; MG: amphibolite facies pet, spd, cot,
wod, csd
[2,24,100,
102]
Separation
Rapids
LCT-C-pet SC Neoarchean
(~2,644 Ma)
HR: basalt (± pillowed); SC: shear zone corridor; SR: Separation Rapids Pluton; MG: lower to middle amphibolite facies pet, spd, euc,
cot, wod, lpd,
cst, brl
[2,24,101]
Root Bay LCT-C-spd SC Neoarchean HR: basalt (± pillowed); SC: shear zone corridor; SR: genetic linkage not well established, possible linkage with Allison Lake Batholith; MG: upper greenschist to lower amphibolite facies(?) spd [103]
Seymour Lake LCT-C-spd SC Neoarchean
(~2,666 Ma)
HR: pillow basalt ± amphibolite, dolerite, gabbro; SC: poorly defined and described; SR: no obvious causative intrusion; MG: upper greenschist to lower amphibolite facies(?) spd; pol, lpd,
Cs-brl, cot
[2,24,103]
Georgia Lake LCT-AS SC Neoarchean HR: sedimentary rocks, granite; SC: poorly defined and described; SR: Glacier Lake and Barbara Lake batholiths; MG: upper greenschist to lower amphibolite facies(?) spd, brl,
cot, cst
[104]
Mavis Lake LCT-AS SC Neoarchean
(~2,665 Ma)
HR: mafic volcanic rock; SC: shear zone corridor; SR: Ghost Lake Batholith; MG: upper greenschist to lower amphibolite facies(?) spd, tri,
cot
[2,24,105]
McCombe LCT-C-spd SC Neoarchean HR: basalt (± pillowed); SC: shear zone corridor; SR: peraluminous two-mica granite; MG: upper greenschist to lower amphibolite facies(?) spd, lpd, tlt, col, pet, mic, brl [103]
Key to abbreviations: Sub-Types: LCT-AS = LCT albite-spodumene pegmatite, LCT-C-pet = LCT complex pegmatite, petalite-type, LCT-C-spd = LCT complex pegmatite, spodumene-type. Province: SC = Superior Craton. Geology & Structure: HR = host rock, MG = metamorphic grade, SC = structural control, SR = source rock. Mineralogy: brl = beryl; col = columbite; cot = columbite-tantalite; Cs = cesium; cst = cassiterite; euc = eucryptite; lpd = lepidolite; mic = microlite; pet = petalite; pol = pollucite; spd = spodumene; tlt = tantalite; tri = triphylite; wod = wodginite.

4.4. LCT Pegmatite Targeting Model

Table 6 provides a summary of the processes deemed critical in the genesis of the LCT pegmatite-hosted lithium deposits using the information summarized above and succinctly presented in [1-2,20-21].
Here, we followed the approach of [29], according to which the critical processes of a mineral system are translated into targeting criteria. In essence, this is done by (i) breaking down the critical processes into their constituent processes, (ii) gathering the geological evidence that reflects the constituent processes, and (iii) developing targeting criteria that can be used to detect the targeting elements, either directly or by proxy.
Importantly, any expressions of a mineral system that cannot be mapped in the obtainable exploration geoscience data cannot be honored in MPM. And, ideally, the datasets that reflect the predictors should have relatively uniform, unbiased coverage of the target area [106].

5. Mineral Potential Modelling (MPM)

5.1. Statistical Assesment of Spatial Proxies

The predictive capacity of each spatial proxy was statistically assessed against a set of prospect locations (PL) and non-prospect locations (NPL) with the Western Australian dataset comprising 208 PL and an equal number of NPL and the Ontarian dataset comprises 122 PL and an equal number of NPL. The PL data represent a mix of significant mineralized drillhole intersections as well as lithium deposits and occurrences whilst the NPL were selected according to the following rules: The must (i) be located outside of the lithium permissive tracts; (ii) not be located close to any of the PL; and (iii) have a random spatial distribution.
Two procedures were used in the statistical assessment of the spatial proxies, namely the (i) area under the receiver operating characteristic curve (AUC) (Figures A1-A2) [107-109], and (ii) index of normalized density (Nd) [110]. Prediction-area (P-A) plots (Figures A3-A4) served to define the best-performing spatial proxies for targeting lithium mineralised systems in Western Australia and Ontario. Any spatial proxies that fulfilled the statistical requirements of AUC > 0.50 [107] and Nd > 1.00 [110] were considered adequate for use in MPM (Table 7 and Table 8).

5.2. Continuous Data-Driven Index Overlay, Continuous Fuzzy Gamma, Geometric Average Approaches

Three continuous modelling functions, data-driven index overlay [50], fuzzy gamma [51] and geometric average [52], were utilized to model the lithium potential of Western Australia and Ontario. Large and small fuzzification functions [111-112] were utilized to assign weights to the spatial proxies with the resulting fuzzy scores of the evidential values in the range [0,1] (Figures A5–A24).
The MPM results for Western Australia and Ontario, as computed by these modelling functions are illustrated in Figures 11a-c and 12a-c.

5.2.1. Data-Driven Index Overlay

Mathematically, the data-driven index overlay approach can be expressed as follows [50]:
D I O = i n W v i W i i n W i
where, for individual cells, Wi is the weight of the ith individual spatial proxy computed utilizing P-A plots and DIO is the resulting score from the data-driven index overlay procedure. In the same equation, Wvi indicates the cell value of the ith spatial proxy assigned continuously through a fuzzification function. For the purpose of this study, Equation 1 was rewritten for Western Australia (WA) as Equation 2 and for Ontario (ON) as Equation 3:
D I O ( WA ) = W V 1 W 1 + W V 2 W 2 + . . . + W V 12 W 12 W 1 + W 2 + . . . + W 12
D I O ( ON ) = W V 1 W 1 + W V 2 W 2 + . . . + W V 10 W 10 W 1 + W 2 + . . . + W 10
where W1, W2, …,W12 and W1, W2, …,W10 represent the weights of the spatial proxies assigned pursuant to corresponding P-A plots (Figures A3-A4). The parameters WV1, WV2, …,WV12 and WV1, WV2, …,WV10 are the continuously assigned weights of evidential values of cells in the corresponding individual spatial proxies.
Statistically, proximity to mapped pegmatites is the most important predictor for targeting LCT pegmatites in both Western Australia and Ontario, while proximity to metamorphic rocks (Western Australia) and domains of greater density of Bouguer gravity breaks (Ontario) present the least significant predictors (Table 7 and Table 8).

5.2.2. Continuous Fuzzy Gamma Approach

Continuously-weighted fuzzy spatial proxies can be synthesized utilizing fuzzy operators [48]. In this study, we utilized a fuzzy gamma operator that uses the PRODUCT and SUM operators, which provide delicate adjustment of the diverse input components [45]:
μ C = [ 1 i = 1 n ( 1 μ i ) ] γ × [ i = 1 n μ i ] 1 γ
where for each cell, μ i is the ith input spatial proxy's fuzzy score, μ C is the potential score resulting from the combination process and ( 0 γ < = 1 ) . Here, we used a gamma value of 0.9.

5.2.3. Geometric Average

Geometric average is a multiple-criteria decision-making technique for synthesizing weighted spatial proxies in MPM. Pursuant to Equation 5, the geometric average, GA, is calculated for each cell as the nth root of the value products [52]:
G A ( F 1 , F 2 , . . . , F n ) = i = 1 n F i n = F 1 F 2 . . . F n n
where for each cell, n is the number of spatial proxies and Fi is the fuzzy weight assigned for the ith spatial proxy. Here, Equation 5 was rewritten for Western Australia (WA) as Equation 6 and for Ontario (ON) as Equation 7:
G Lit h ium ( WA ) ( F 1 , F 2 , . . . , F 12 ) = i = 1 12 F i 12 = F 1 F 2 . . . F 12 12
G Lit h ium ( ON ) ( F 1 , F 2 , . . . , F 10 ) = i = 1 10 F i 10 = F 1 F 2 . . . F 10 10
where F1, F2, …, F12 and F1, F2, …, F10 are fuzzy scores of evidential values in the corresponding spatial proxies. After computing the GLithium(WA) and GLithium(ON) values for each unit cell of the study areas, the cells were mapped to develop geometric average lithium potential models.

5.3. Knowledge-Driven BWM-MARCOS Approach

Among the various knowledge-driven approaches to MPM, multi-criteria decision-making (MCDM) techniques are highly regarded due to their effectiveness [113-116]. In the MCDM approach, the weighting of spatial proxies is either comparison- or matrix-based. Whilst novel, the best-worth method (BWM: [117]) and Measurement of Alternatives and Ranking according to COmpromise Solution (MARCOS: [118]) comparison- and matrix-based MCDM techniques have been successfully applied in MPM [47, 113-116]. Here, we used a hybrid MCDM approach known as BWM-MARCOS [47] in combination with the overall performance (Op) index [119,120]. The latter is computed via an improved P-A plot incorporating three principal criteria: (i) PL prediction rate curve, (ii) occupied area curve and (iii) NPL prediction rate curve [119].

5.3.1. Western Australian BWM-MARCOS Model

Here, the BWM technique was applied to objectively delineate the weights of the decision criteria embodied by the spatial proxies (Table 7). The Op index served to determine spatial proxy weights as well as the worst and best spatial proxies (Figure A25, Table 9). Following this initial step, others-to-worst (OW) and best-to-others (BO) vectors were defined according to the Op values given in Table 9. According to these parameters, problem 3 of [47] can be formulated as shown in the following Equation 8:
min ξ s . t . W 8 7 W 1 ξ , forall j W 8 8 W 2 ξ , forall j W 8 9 W 3 ξ , forall j W 8 5 W 12 ξ , forall j W 1 3 W 3 ξ , forall j W 2 2 W 3 ξ , forall j W 4 2 W 3 ξ , forall j W 12 5 W 3 ξ , forall j j W j = 1 W j 0 , forall j
Next, optimal weights ( W B * , W 1 * , . . . , W W * ) and ξ * were specified by solving Equation 8. For a B W = a 83 = 9 , the obtained consistency index was 5.23 [47] whilst the consistency ratio was 0.062/5.23 = 0.011, showing appropriate consistency. After allocating weights to the spatial proxies, the MARCOS technique was applied to rank the alternatives. To achieve this, an initial decision matrix B 1758143 × 12 was generated that contains 1,758,143 decision alternatives, each linked to an individual cell with a particular coordinate in the corresponding spatial proxies, and 12 decision criteria. The alternatives were then ranked via the MARCOS step-by-step process, previously described by [47].
The BWM-MARCOS lithium potential model for Western Australia is shown in Figure 11d.

5.3.2. Ontarian BWM-MARCOS Model

For Ontario, the same approach was followed as for Western Australia with the relevant modelling information provided in Figure A26 and Table 8. As for Western Australia, problem 3 of [47] can be formulated as per the following Equation 9:
min ξ s . t . W 8 2 W 1 ξ , forall j W 8 9 W 2 ξ , forall j W 8 4 W 3 ξ , forall j W 8 5 W 7 ξ , forall j W 1 8 W 2 ξ , forall j W 3 6 W 2 ξ , forall j W 4 8 W 2 ξ , forall j W 7 5 W 2 ξ , forall j j W j = 1 W j 0 , forall j
Subsequently, the optimal weights ( W B * , W 1 * , . . . , W W * ) and ξ * were defined by solving Equation 9. For a B W = a 83 = 9 , the obtained consistency index was 5.23 [47] whilst the consistency ratio was 0.062/5.23 = 0.011, showing suitable consistency. As for Western Australia, the MARCOS technique was applied to rank the alternatives using an initial decision matrix B 1526806 × 8 with 1,526,806 decision alternatives linked to 8 decision criteria. The alternatives were again ranked by the MARCOS step-by-step process.
The BWM-MARCOS lithium potential model for Ontario is illustrated in Figure 12d.
Table 10. BWM-MARCOS efficiency statistics for competent spatial proxies, Ontario MPM.
Competent Spatial Proxies Parameters
Pm Pn 100-Pm 100-Pn TPr FPr Op
Proximity to mapped pegmatites (DC8) 87 44 13 56 0.87 0.44 0.43
Proximity to LCT pegmatite indicator minerals (DC4) 89 47 11 53 0.89 0.47 0.42
Proximity to fractionated granitic rock units (DC1) 86 47 14 53 0.86 0.47 0.39
Proximity to mafic-ultramafic rocks (DC3) 65 38 35 62 0.65 0.38 0.27
Proximity to Au occurrences (DC5) 69 43 31 57 0.69 0.43 0.26
Proximity to Ni occurrences (DC6) 68 43 32 57 0.68 0.43 0.25
Domains of greater density of major crustal boundaries (DC7) 68 48 32 52 0.68 0.48 0.20
Proximity to Bouguer gravity breaks (DC2) 51 50 49 50 0.51 0.50 0.01
Key to abbreviations: See Table 9.

5.4. Data-Driven Random Forest (RF) Approach

A growing body of evidence [e.g., 26,40,121-126] has demonstrated that RF is more effective than and consistently outperforms other supervised machine learning algorithms applied to MPM. This is because the RF algorithm mitigates the problem of overfitting and improves model efficiency by way of a bagging procedure [53]. As an ensemble-based machine learning method [126], RF adopts a resampling strategy that generates each set of random training samples of an unpruned decision tree [53]. For MPM, a bootstrapping procedure is applied that collects sub-samples by resampling, with replacement, the spatial proxies for PL and NPL, referred to as labeled data. Decision trees are trained using in-bag samples, which include two-thirds of the labeled data. Decision tree impurity, termed out-of-bag (OOB) error, is measured by the remaining labeled data, termed OOB samples. As such, RF presents an aggregation of unpruned decision trees, each of which is developed in accordance with a distinct set of so-called existent patterns.
Executing RF requires (i) the number of trees (n) to be grown and (ii) the number of predictor variables (m) to be entered at each node [53]. These parameters should be tuned so that decision tree impurity is minimized. The mean decrease in the Gini impurity index (MG) and accuracy (Ma) can be employed to assess the relative importance of the predictor variables. MG is a measure of how each variable contributes to the homogeneity of the nodes and the final RF model, while Ma is defined by the computation of the OOB error. According to [53], the higher the values of Ma and MG, the more important a predictor map.

5.4.1. Western Australian RF Model

As a first step, the original (non-transformed) spatial proxies (Figures A5a-A12a and A14a-A16a) were normalized via the following equation [127]:
X i = x i x m i n x m i n m a x
where Xi for per cell is the normalized score of the indicator value, xi is the indicator value for the cell of the ith spatial proxy and xmax and xmin are the largest and smallest indicator values pertaining to the ith spatial proxy. Hence, spatial proxy indicator values fall within a range of [0, 1]. Next, an n value of 1,000 and m value of 4 were opted in accordance with the procedure provided by [122]. Figure A27 illustrates the significance of the predictor variables in the RF modelling according to the mean decrease in the accuracy and Gini impurity index. Pursuant to this figure, the proximity to metamorphic rocks is the least significant spatial proxy in the RF MPM of Western Australia’s lithium potential while the proximity to mapped pegmatites is the most significant one.
Figure 11e illustrates the RF lithium potential model for Western Australia, which was developed with normalized spatial proxies and a training error curve as indicated in Figure A28. Pursuant to the latter, the error rate of modelling is progressively alleviated as the number of decision trees rises, with a mean squared error rate of ~0.115 for the first decision tree and 0.05 for the 1,000th iteration.

5.4.2. Ontarian RF Model

After normalizing the original spatial proxies (Figures A17a-21a, A23a-24a) by Equation (10), an m value of 3 and n value of 1,000 were chosen in accordance with [122]. Figure A29 illustrates the significance of the predictor variables in RF modelling according to the mean decrease in the accuracy and Gini impurity index with proximity to LCT pegmatite indicator minerals the most significant spatial proxy and proximity to Bouguer gravity breaks the least significant one.
Figure 12e illustrates the RF lithium potential model for Ontario which was developed with normalized spatial proxies and a training error curve as indicated in Figure A30. Pursuant to the latter, the error rate of modelling is progressively alleviated as the number of decision trees rises, with a mean squared error rate of ~0.09 for the first decision tree and 0.042 for the 1,000th iteration.

6. Discussion

6.1. Mineral Potential Mapping (MPM)

6.1.1. Criticisms, Limitations & Opportunities

Mineral exploration is fundamentally a search problem, and an information problem associated with significant stochastic and systemic uncertainty in that our decision making is influenced by heuristics and biases and reliant on inferences, extrapolations and predictions revolving around sparse or heavily clustered data points. This is particularly true for mineral exploration targeting [128-129].
Modern computer systems, paired with AI approaches, are ideally suited to help tackle the many challenges in mineral exploration targeting. MPM offers such an approach [130-131]. Whilst often criticized for being biased toward mature, well-explored areas and tending toward the generation of excessively large areas of high prospectivity, these issues are not regarded as limitations in the MPM algorithms but shortcomings in the input data that, in many cases, could be easily avoided [106].
It would be unwise to treat MPM output as ‘treasure maps’ given MPM typically identifies more than a few areas of high potential. Rather, the output should be taken as the starting point for a ‘treasure hunt’ and regarded as just another tool in the ‘exploration toolbox’. That is to say, MPM results (i) should be regarded as decision-support tools for delineating, ranking, and prioritizing exploration targets based on the underlying modelled prospectivity and, (ii) present a snapshot in time of the conceptual understanding of the targeted mineral deposit type in combination with the quality, quantity and variety of the data available to map the deposit footprints, and (iii) form the starting point for additional analyses such as of previously unrecognized areas of modelled high potential [41,132]. It is also important to understand that neither MPM nor any alternative targeting approach can discriminate between targets that may host a small mineral occurrence and those that may host a world-class mineral deposit [133].
Given the current limitations, the most effective way of harnessing the power of advanced computer systems and AI in mineral exploration may be intelligence amplification (IA) rather than a sole reliance on AI. In other words, the best approach may be a hybrid of subjective human input and objective, machine-based analysis, informing and balancing each other [106]. In a practical sense and where targeting projects are industry-funded, this could be achieved by addressing shortcomings in the predictor maps through geological interpretation and/or manual targeting by individuals or teams to augment GIS-driven MPM [134]. In such a two-pronged IA approach, multiple scenarios can be investigated, and a range of decision aids can be generated in support of the final targeting decisions [45,129].

6.1.2. Spatial Proxy Performance

Stochastic and systemic errors present significant sources of uncertainty affecting MPM. The former is typically linked to the nature and quality of the input data and can manifest in inappropriate targeting criteria. The latter primarily pertains to spatial proxies and how they are integrated for MPM. Hence, appropriate, well-performing spatial proxies and robust, fit-for-purpose modelling tools are critical aids in minimizing systemic uncertainty in MPM [106].
In the same vein, utilizing only one statistical approach to appraise predictor maps is insufficient for a comprehensive analysis of their performance. Here, we used a combination of the AUC and Nd techniques to analyze and categorize the predictor maps and measure their performance. One of the key advantages of using a combination of statistical analysis tools is that such an approach provides a means for comparing predictor maps according to various performance metrics (Table 7 and Table 8). For instance, whilst both the “proximity to LCT pegmatite indicator minerals” (spatial proxy E1) and “proximity to pegmatitic or pegmatite-bearing rock units” (spatial proxy E2) predictor maps achieved high AUC scores of 0.84, their Nd scores set them apart in that proxy E1 scored an Nd value that is ~1.4 times higher than that of spatial proxy E2. Moreover, proxy E1 demonstrated superior statistical efficacy compared to E2 in that it achieved a greater prediction rate pertaining to a smaller area.

6.1.3. Comparative Model Performance

As demonstrated by the pertinent body of literature, modelers typically only use one modelling technique for MPM of their study areas. In contrast, examples of studies that used two or more different modelling techniques are rare [26]. However, there are several benefits to a multi-technique approach to MPM such as the ability to (i) better constrain exploration targets by integrating the results from different numerical models, (ii) compare, contrast and cross-validate MPM results, (iii) ensure optimal use of the available empirical and conceptual information, and (iv) recognize and reduce stochastic and systemic uncertainties [26,106]. As clearly illustrated in [26,40,47,135], a multi-technique approach to MPM can (i) generate more robust targets, (ii) deliver insights that cannot be derived from a single modelling technique, and even (iii) aid in the development and calibration of new tools and techniques.
In addition to the above benefits, employing a multi-technique approach and developing a variety of lithium potential models (Figure 11 and Figure 12) also supports assessment of model performance. For this, we used the improved P-A plot procedure of [119]. According to the performance statistics listed in Table 11 and Table 12, the RF approach to MPM delivered the best-performing lithium potential models for both Western Australia (overall performance, Op = 0.53) and Ontario (Op = 0.63) (Figures 11d, 12d). As the top ranked modelling technique and given the relatively high Op values of the RF models, it is clear that RF-driven MPM presents the tool of choice for targeting new lithium discoveries in these jurisdictions, and likely elsewhere.
It is striking that the top-performing RF method produced a lithium prospectivity pattern that is unlike those generated by the other techniques (Figure 11 and Figure 12). The reason for this characteristic distinctive result is likely due to the specific mechanics of RF, a robust ensemble machine-learning algorithm that is ideally suited to modelling complex, multistage nonlinear systems, such as mineral systems.

6.1.4 Geological Validity & Insights

The lithium potential models generated in this study delivered new, regional views of the lithium prospectivity of Western Australia and Ontario, two of the world’s best endowed jurisdictions with regards to LCT pegmatite hosted lithium deposits. The validity of the models, in particular the best-performing RF model (TPr: Western Australia: 97%; TPr Ontario: 98%), is demonstrated by the fact that most known lithium deposits, camps and districts plot within areas of elevated to very high lithium favorability. In addition, the models identified several areas that contain all ingredients for LCT pegmatite-hosted lithium mineralisation that are mappable at the regional scale of our investigation but which may have been overlooked by previous explorers.
Our study, which included a comprehensive review of LCT pegmatite systems in Western Australia and Ontario, also delivered insights worthy of further analysis, in particular the statistically verifiable proximity relationship between lithium, gold and nickel occurrences (Figure 13; Table 7 and Table 8). At this stage, the underlying reason for this relationship is speculative in nature but it seems plausible that the clustering of lithium, gold and nickel occurrences is linked to common ingredients of the respective mineral systems models such as the presence of deep-seated faults and mafic-ultramafic rock sequences. Interestingly, [136] postulated a genetic link between the Goulamina LCT pegmatite system, a globally significant hardrock lithium deposit located in Mali, and gold mineralisation. The authors argued that albitization, elevated arsenic and magmatic loellingite in the Goulamina pegmatites are also prominent features of gold deposits in the region, such as Morila (8 Moz Au), both of which formed during a period of felsic magmatism at ~2,100 Ma.
Also worthy of closer investigation may be some of the geological regions that have few LCT pegmatite lithium occurrences, or none, but were identified by MPM as having moderate to very high lithium potential. In Western Australia, these include, for example, the Proterozoic-age Halls Creek, southern Capricorn and Paterson orogens as well as the eastern Archean-age Yilgarn Craton (Figure 14). Ontarian examples include the Kasabonika Lake-Ekwan River, Savant Lake-Crow Lake and Michipicoten greenstone belts of the Archean-age Superior Craton and the pegmatite belts of the Proterozoic Grenville Orogen in southern Ontario (Figure 15).
Another aspect to consider here are the differences in geological information collected from and available Western Australia and Ontario (Table 3). For example, the bedrock geology of Ontario, compiled at a scale of 1:250,000, includes a unit named ‘muscovite-bearing granitic rocks’, which captures all known Archean two-mica granites, many of which are recognized as parental lithium source intrusions and many more are likely lithium pegmatite sources. The Western Australian bedrock geology, on the other hand, is delivered at a scale of 1:500,000 and lacks a breakdown of Archean and Proterozoic granitoids according to their fractionation state. Hence, compiling a map of granitoids that may have lithium source potential is not a straightforward exercise. Having said that, Western Australia offers a pegmatite database (work in progress) and much more detailed structural and geophysical data than Ontario. These differences are reflected in the underlying MPM predictor maps, which differ somewhat between Western Australia and Ontario given certain spatial proxies are better supported by either the Western Australian or Ontarian datasets and, thus, more effective if backed by better quality data (Table 9 and Table 10).

6.2. Mineral Exploration Implications

6.2.1. Exploration Search Space Concept

Given that lithium was a niche market up to the 2010s [137], most geoscientists have never had the opportunity to work in lithium exploration and only few resources companies had owned and operated lithium assets prior to this time. Hence, until recently, there has been a general lack of practical and theoretical know-how amongst explorationists when it comes to LCT pegmatites as well as a lack of modern systematic exploration of this mineral deposit type. As such, the lithium exploration booms of the late 2010s and early 2020s opened an entirely new search space [138] because only very few districts worldwide had ever recorded any noteworthy lithium exploration. Even belts that had received significant previous exploration and, thus, were relatively mature with regards to other metals became highly attractive as lithium had never constituted a valid exploration target and, consequently, had been ignored or the mineralization not been recognized. The worldwide search efforts triggered by the recent lithium price booms of the late 2010s and early 2020s resulted in a ‘golden period of discovery’ with numerous, new and globally significant hardrock lithium (re-)discovered in short succession (e.g., Shaakichiuwaanaan, Quebec; Andover and Tabba Tabba, Western Australia; Ewoyaa, Ghana). A great example to illustrate the above is that of the world-class Mt Holland lithium deposit, which underlies the former Earl Grey gold mine and, locally, truncates the gold mineralisation. Prior to its discovery in 2016, the Mt Holland pegmatite system was not understood to be spodumene-bearing and, thus, was never assayed for lithium. A review of the historical drill core eventually confirmed the lithium potential as demonstrated by pegmatite occurrences with a combined strike length of >25 km with true widths up to 50 m and interval grades of up to 2.6% Li2O. Subsequent drilling programs delivered one of the largest lithium hardrock resources in Australia [78,139].

6.2.2. Exploration Maturity & Potential

Whilst both Western Australia and Ontario may both still be considered exploration frontiers in the search for LCT pegmatite hosted lithium deposits (see 6.2.1. above), Western Australia has, by and large, seen much more exploration drilling than Ontario, in particular when it comes to the highly lithium fertile and endowed Archean greenstone belts. In contrast to Western Australia, many of northern Ontario’s greenstone belts remain significantly underexplored.
For example, in the >300 km-long Southern Cross Greenstone Belt, Yilgarn Craton, Western Australia, which hosts Mount Holland, one of the world’s largest hard rock lithium deposits, there are >66,000 publicly recorded drillholes (Figure 16a). In comparison, there are only <610 publicly recorded drillholes in the >230 km-long Favorable Lake Greenstone Belt of the Superior Craton of Ontario and neighboring Manitoba (Figure 16b). Large segments, up to 45 km long, of the Favorable Lake Greenstone Belt have never been drilled. That is despite the Favorable Lake Greenstone Belt hosting the PAK deposit cluster, one of the largest and highest-grade hardrock lithium resources in North America. LCT pegmatites have been identified over ~110 km-long sections of both the Southern Cross and Favorable Lake greenstone belts.
Whilst the PAK (or Pakeagama Lake) pegmatite was discovered in 1999 and has been subject to decades of intermittent lithium exploration, only <100 publicly recorded drillholes have been completed since the maiden drilling program in 2013. The adjacent Spark and Bolt lithium pegmatites were discovered in 2018 and 2020, respectively [100], whilst the Gorman and Livyatan lithium pegmatite clusters, ~70 km northwest and ~40 km southeast of PAK, respectively, were only located in 2023. The conduct of exploration programs and development of mining operations in the Favorable Lake Greenstone Belt are challenged, amongst other things, by the remote nature of the area, lack of infrastructure and long and harsh winters, all of which combine to create a high-cost environment. Added challenges are presented by widespread transported till cover, which may conceal the geochemical signals of the prospective bedrock, and thick brush, which may hide outcrops and make it difficult to get around other than by helicopter.
The lithium mineralised Bounty and Earl Grey pegmatites at Mt Holland, on the other hand, were brought into production in 2024, only eight years after their discovery given the existing gold mine infrastructure, a granted mining lease and access to an existing mining workforce. Another important aspect was the rapid conversion of the 2016 lithium pegmatite discovery to a world-class lithium resource in under five months [140], aided by the existence of 100s of previous gold-focused drillholes (<600 publicly recorded) that had intersected the pegmatites but had not been assayed for lithium and related pathfinder elements.
Overall, given the (i) results of our MPM, (ii) large size of the Superior Craton in Ontario compared to the Western Australian cratons (Superior Craton: ~595,000 km2; Yilgarn Craton: ~609,000 km2; Pilbara Craton: ~57,000 km2), (iii) occurrence of globally significant hardrock lithium deposits across the Canadian Superior Craton (e.g., Tanco in Manitoba, PAK in Ontario and Shaakichiuwaanaan in Quebec), and (iv) underexplored nature of the Ontarian greenstone belts, in particular those in northern Ontario, the province should be able to deliver additional lithium pegmatite discoveries in the future as should Western Australia.

6.2.3. Target Example

The following example of a target generated by this lithium MPM, the Pinderi Hills area in Western Australia (Figure 17), also serves to provide a more detailed look at the modelling results and how MPM can facilitate the rapid recognition of areas of high potential that lack any known mineral occurrences of the targeted type, in this case of potentially lithium mineralised LCT pegmatites.
The Pinderi Hills target is located in the western part of the Archean Pilbara Craton, ~40 km southwest of the globally significant Andover lithium deposit and ~32 km southwest of the recent Andover South discovery. The east-west-striking Scholl Shear Zone lies 17 km to the north whilst the north-northwest-east-southeast-striking Maitland Shear Zone runs straight through the target area. The project geology is dominated by the Munni Munni and Maitland intrusions, two adjoining mafic-ultramafic complexes, and felsic to mafic volcanic rocks of the Whundo Group. The mineral exploration tenure over Pinderi Hills is subject to an earn-in joint venture between Errawarra Resources and Alien Metals announced in April 2024. Exploration is at a very early stage. Nevertheless, work undertaken by Errawarra Resources to date delivered encouraging results: (i) Satellite imagery analysis identified a group of linear geomorphic features interpreted as pegmatites; and (ii) field reconnaissance and surface geochemistry surveys returned anomalous rock chips, including an assay of 288 ppm Li2O (associated with elevated cesium, tantalum and niobium) from an outcropping pegmatite, and identified several up to >1 km-long, linear soil anomalies with peak anomalies of up to >100 ppm Li2O [141]. Further investigation is required to demonstrate the lithium potential of the Pinderi Hills area but the limited work undertaken to date suggests that the MPM generated a valid target.

7. Summary & Conclusions

In this study, we developed the first predictive models of hardrock lithium potential for two of the world’s best-endowed jurisdictions, Western Australia and Ontario. The main conclusions and insights gained from this study can be summarized as follows:
  • Western Australia has known resources of ~26 Mt Li2O contained in 19 lithium-cesium-tantalum (LCT) pegmatite deposit clusters. One of these clusters is in the Gascoyne Complex and is Proterozoic in age. The remainder is hosted by the Yilgarn and Pilbara cratons and formed during Archean times. Ontario has a much smaller endowment of ~1.5 Mt Li2O contained in seven LCT pegmatite deposit clusters, all of which are in the Superior Craton and Archean in age.
  • Even the best-endowed lithium pegmatite system in Ontario, PAK, would only rank eighth among the Western Australian lithium pegmatite resources. This size discrepancy may be taken to imply that either the Ontarian LCT pegmatites have lesser endowments than their Western Australian counterparts or several very substantial pegmatite-hosted lithium resources are yet to be discovered in Ontario, or to be fully delineated by further drilling.
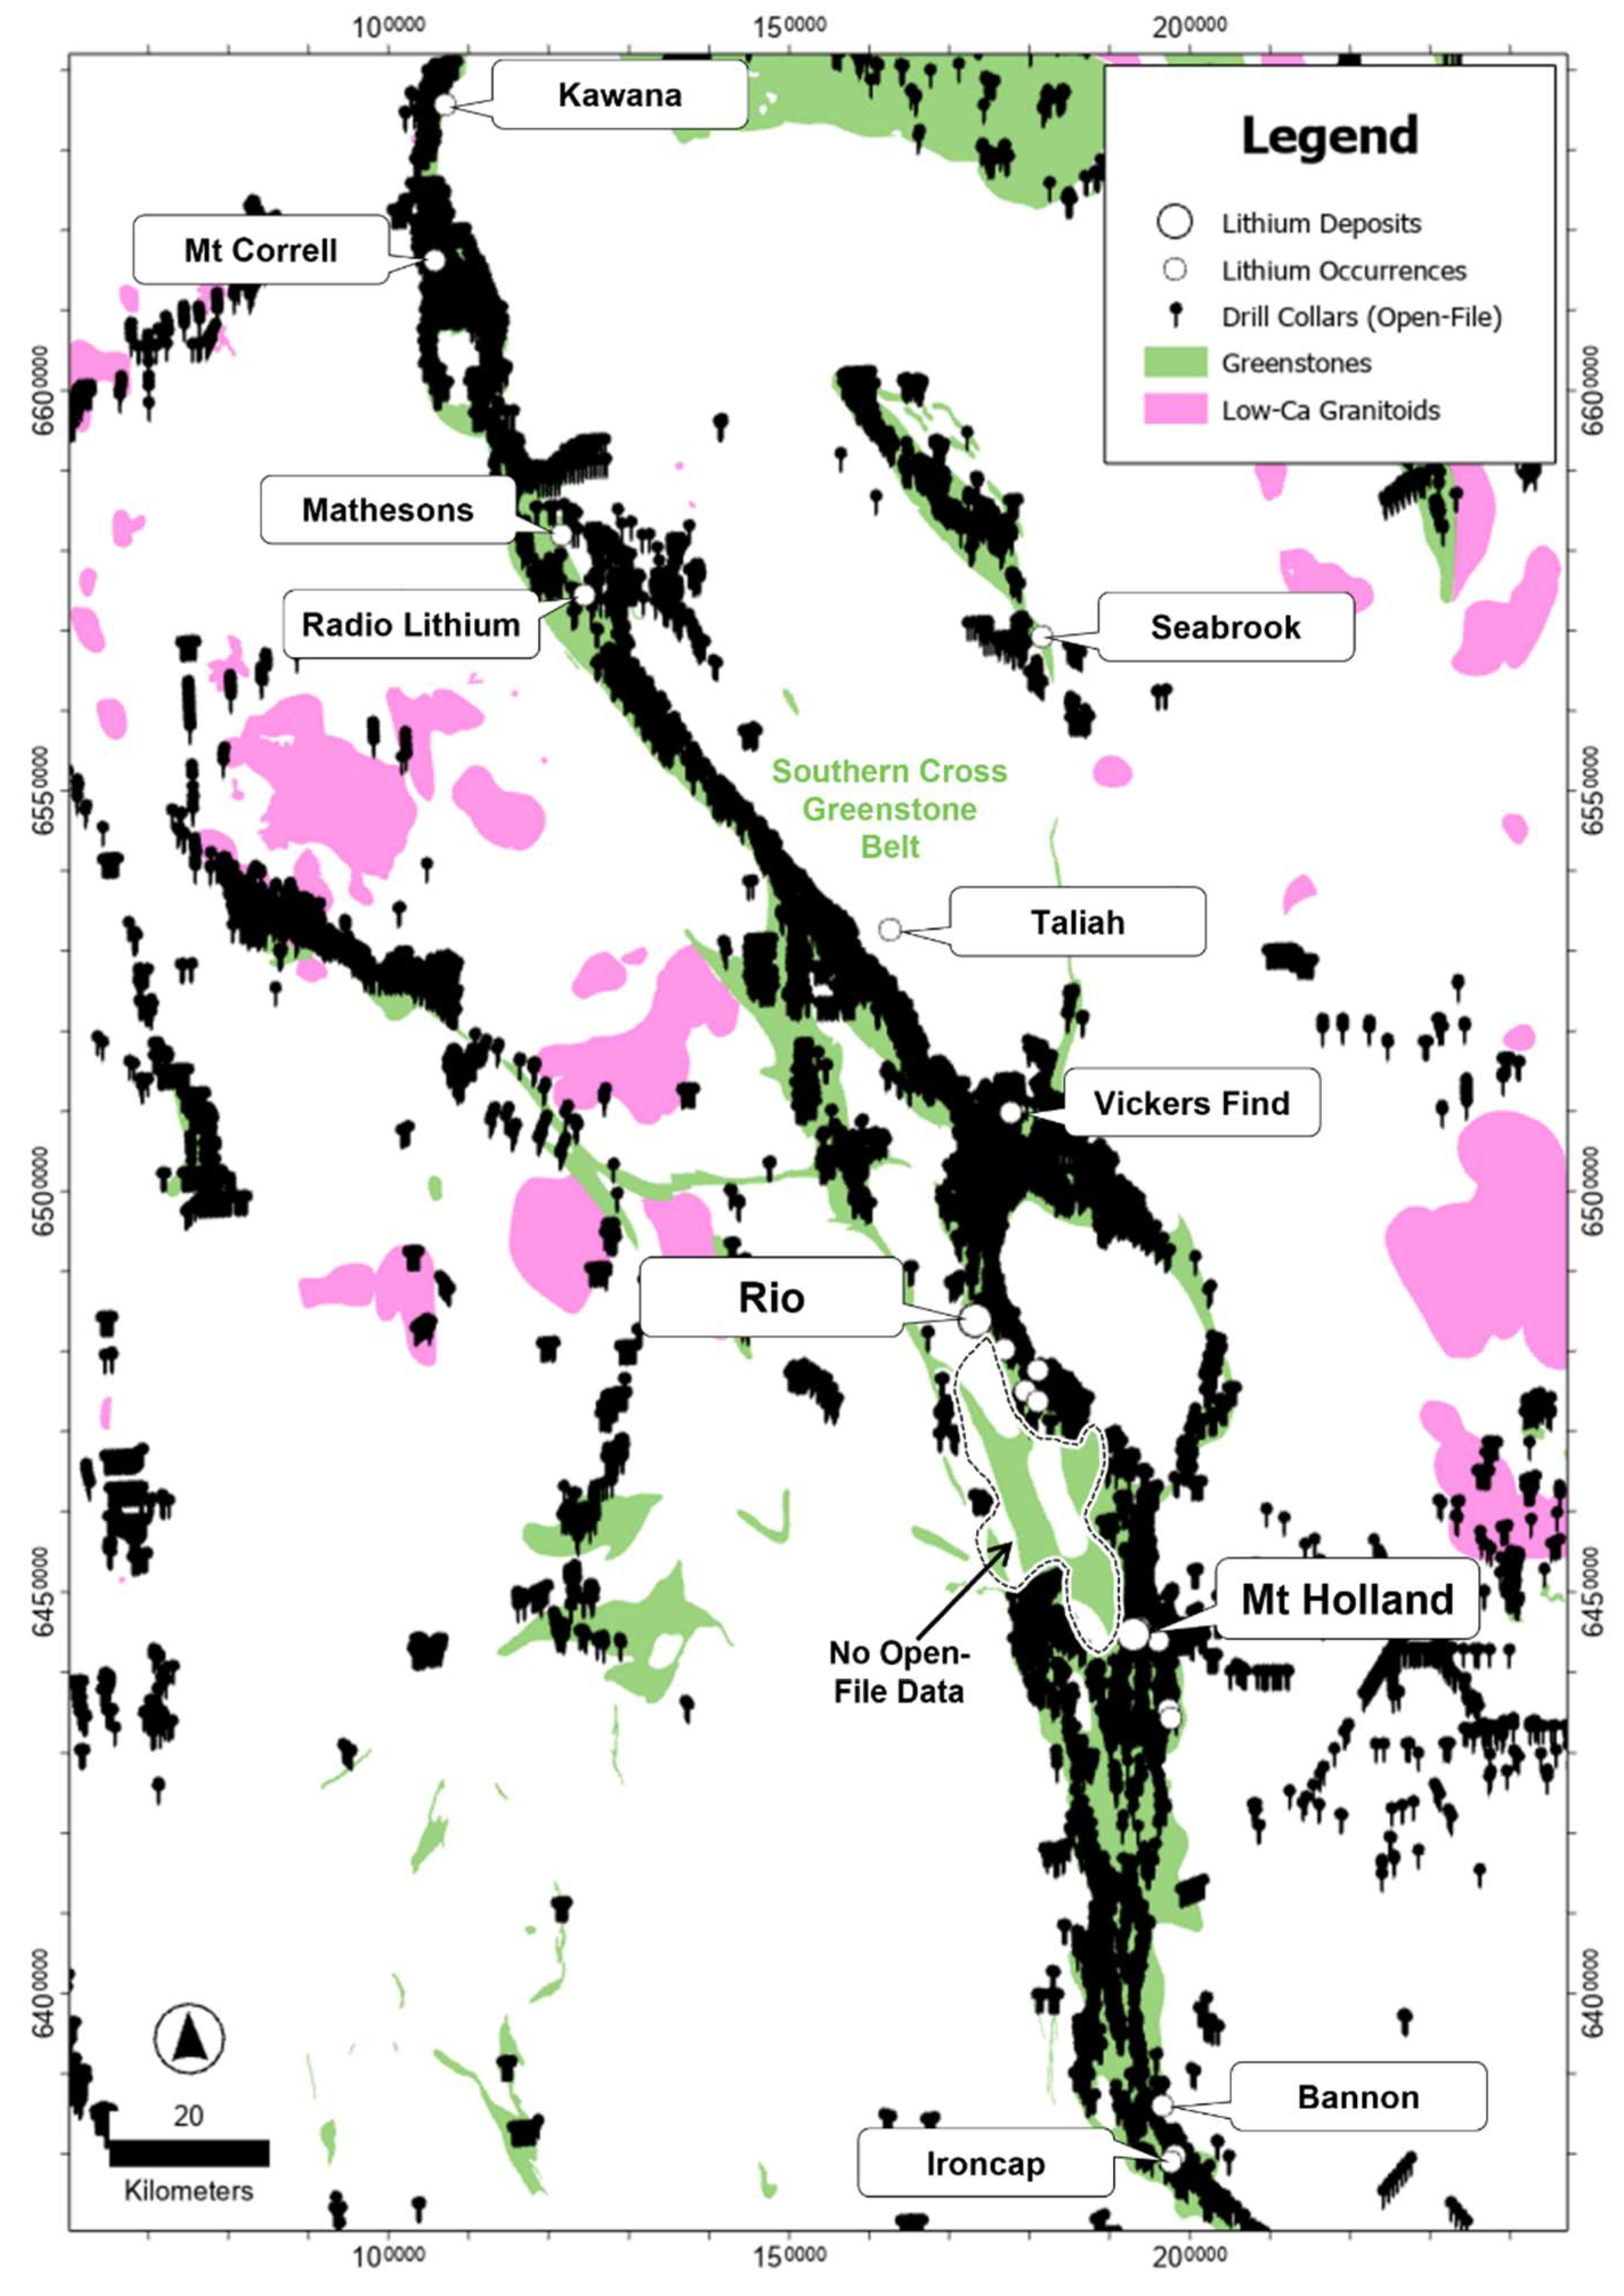
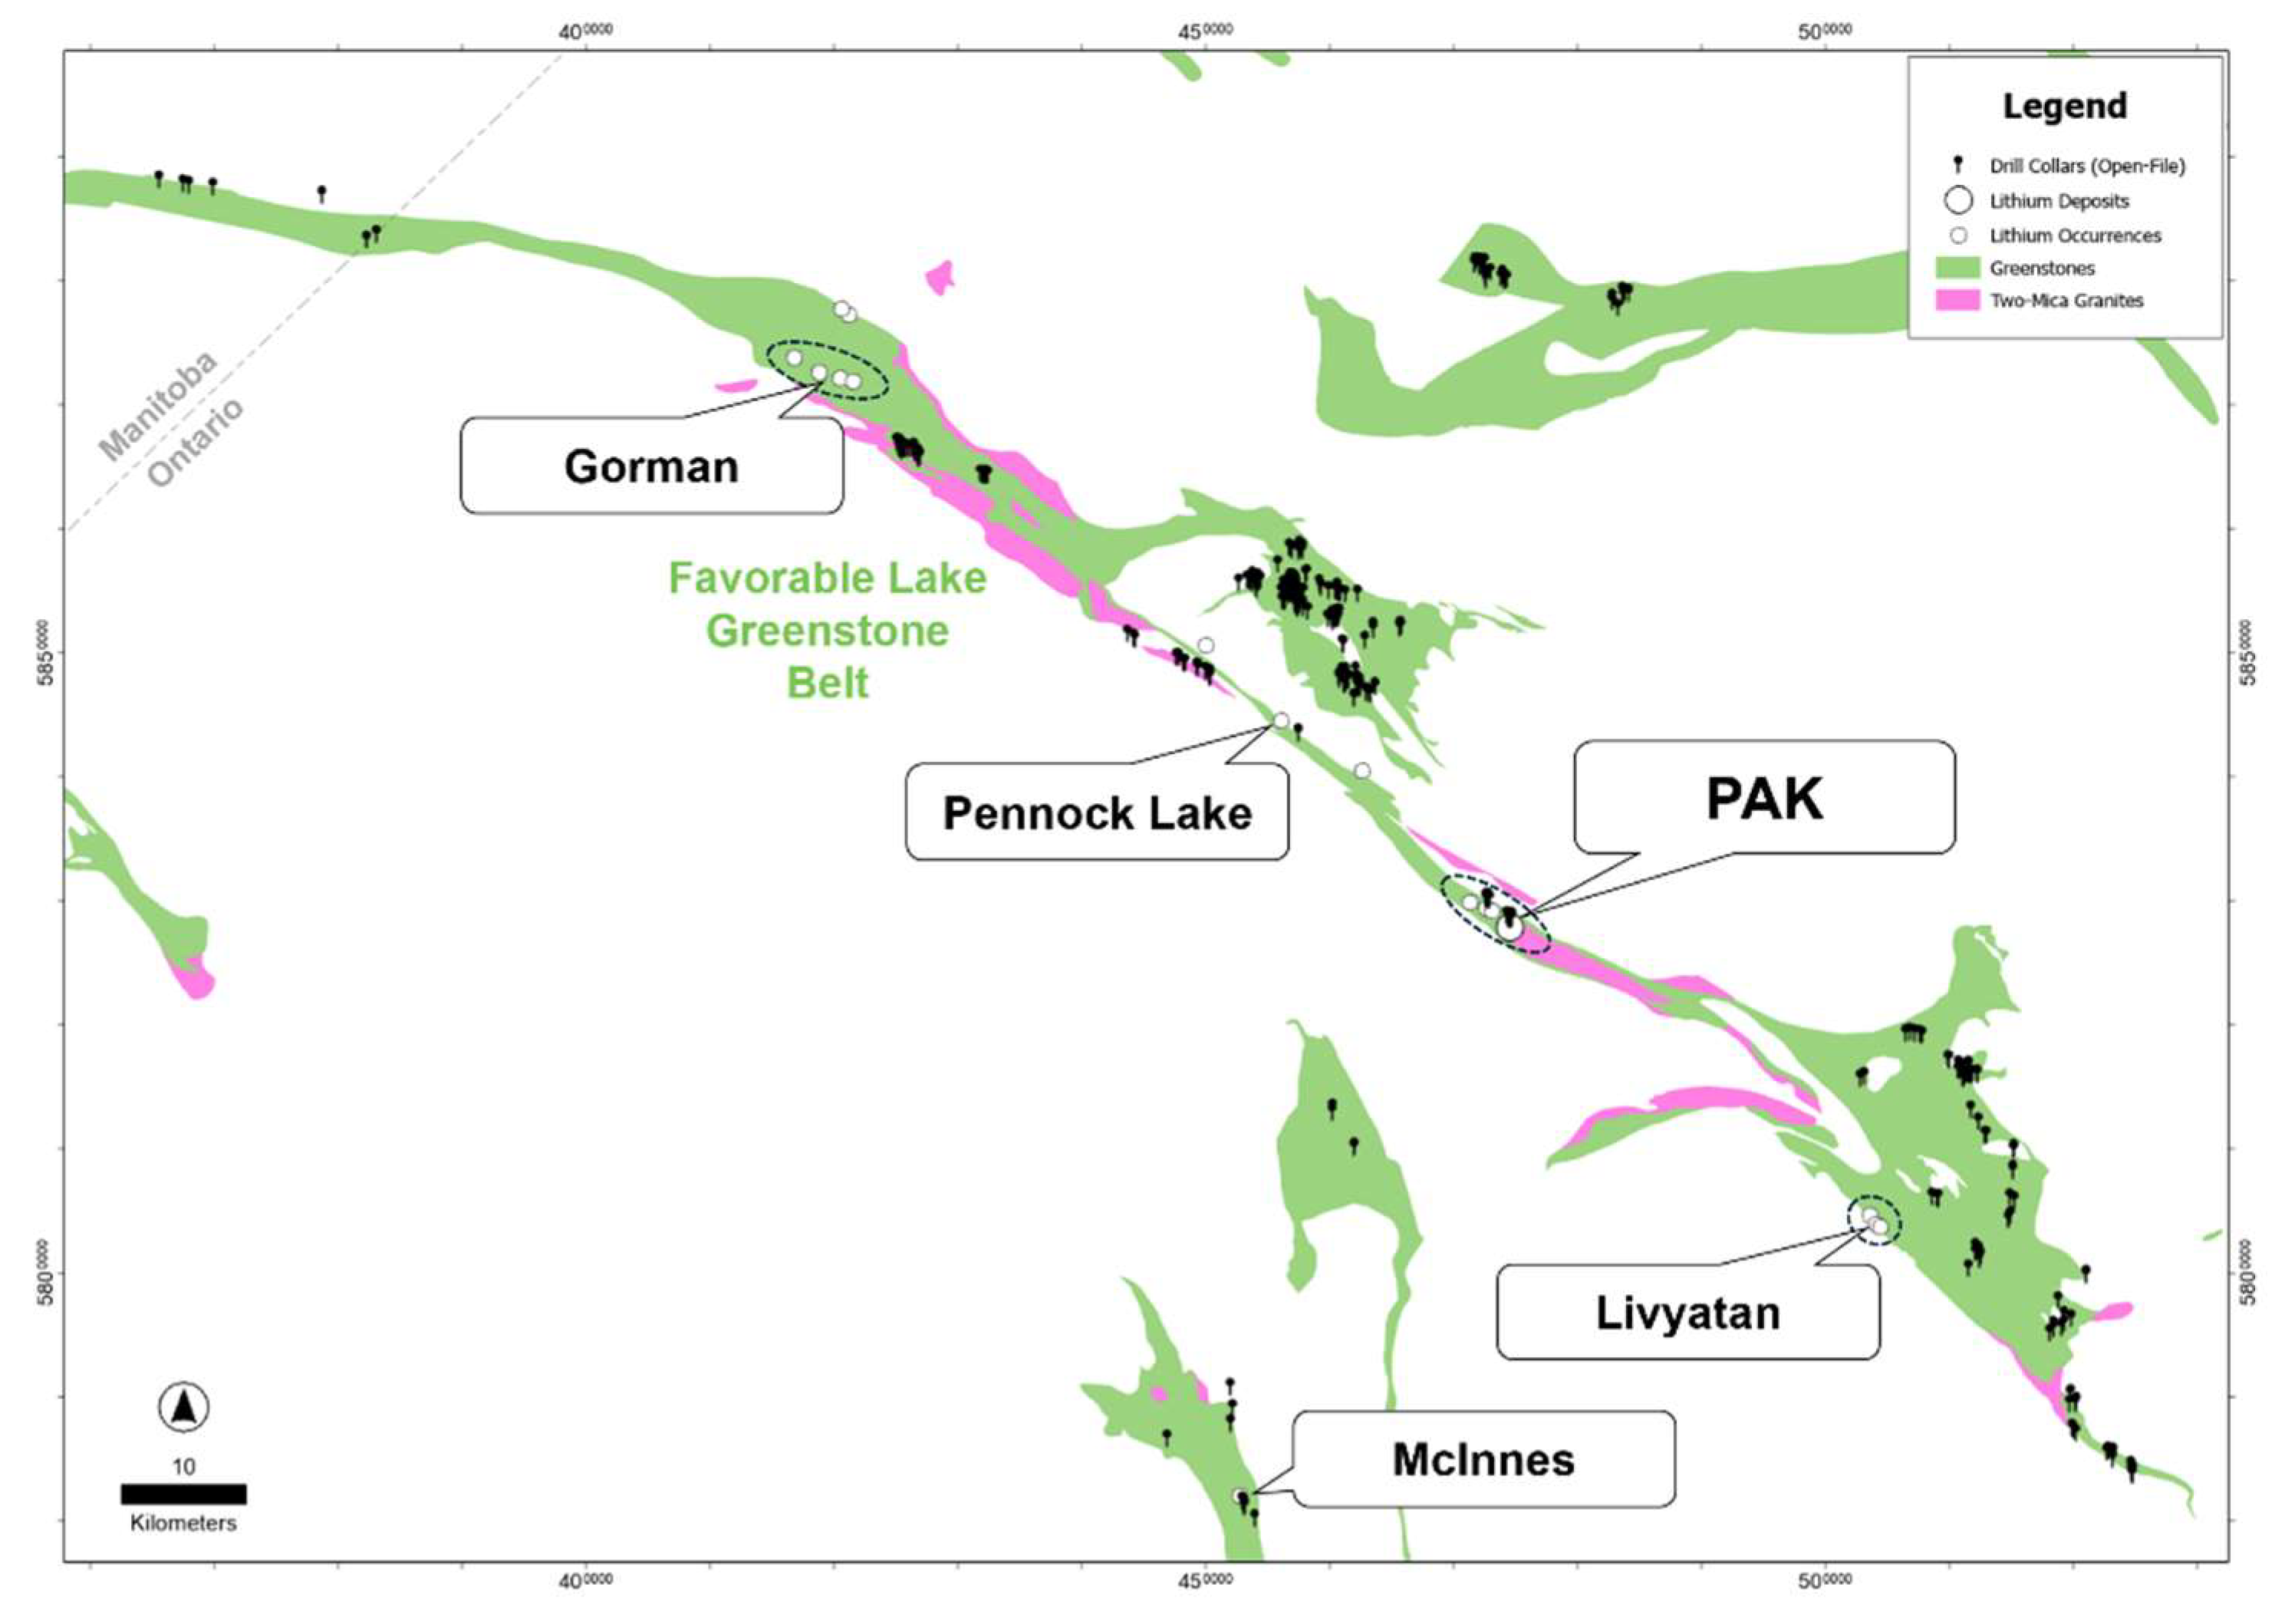
  • As demonstrated for the Favorable Lake Greenstone Belt of northern Ontario, large tracts of the Archean Superior Craton are significantly underexplored compared to the Archean cratons of Western Australia. Government records indicate that <610 drillholes were completed along the >230 km-long Favorable Lake Greenstone Belt. That is despite the presence of the PAK pegmatite cluster, one of the largest and highest-grade hardrock lithium resources in North America. In contrast there are >66,000 publicly recorded drillholes that were completed along the >300 km-long Southern Cross Greenstone Belt, Yilgarn Craton, which hosts one of the world’s largest hard rock lithium deposits at Mount Holland. Large segments, up to 45 km long, of the Favorable Lake Greenstone Belt have never been drilled. No such large undrilled search spaces exist near world-class mineralised systems in the Archean Yilgarn and Pilbara cratons of Western Australia.
  • In contrast to the Western Australian LCT pegmatites, the Ontarian systems often illustrate clear genetic links to S-type parental granitoids. Terranes that lack S-type granitoids are typically devoid of LCT pegmatites. Given this perceived genetic link, it is not surprising that Ontarian LCT pegmatites are often complexly zoned whereas LCT complex pegmatite types are less common in the Archean cratons of Western Australia, which are dominated by more homogeneous LCT albite-spodumene pegmatite types.
  • LCT pegmatites in Ontario have a preponderance for steep to subvertical dip angles and lenticular or prolate geometries (e.g., PAK, Separation Rapids) whilst their Western Australian counterparts are typically sheet-like and gently-dipping to subhorizontal in nature (e.g., Mt Holland, Mt Cattlin, Tabba Tabba). To our knowledge, no previous studies have been undertaken, focusing on the likely structural and genetic controls on these architectures and their economic implications.
  • Common expressions of LCT pegmatite systems and controls on lithium deposit formation include the following: (i) High degrees of melting of a fertile protolith, typically a sedimentary crustal source (as represented by the S-type, two-mica granitoids of the Superior Craton), or biotite dehydration melting at relatively shallow greenstone-root levels (as potentially represented by the evolved I-type, low-Ca granitoids of the Yilgarn Craton). In all cases investigated in this study, the crustal melting was spatially associated with convergent margin tectonic settings (ii) Extreme fractionation of the granitic melts that formed the pegmatites. (iii) A high degree of crustal permeability, typically associated with active deformation along first- and second-order fault systems, typically localized along belt margins. (iv) Presence of mafic to ultramafic rock sequences that have been metamorphosed at greenschist to amphibolite facies grade.
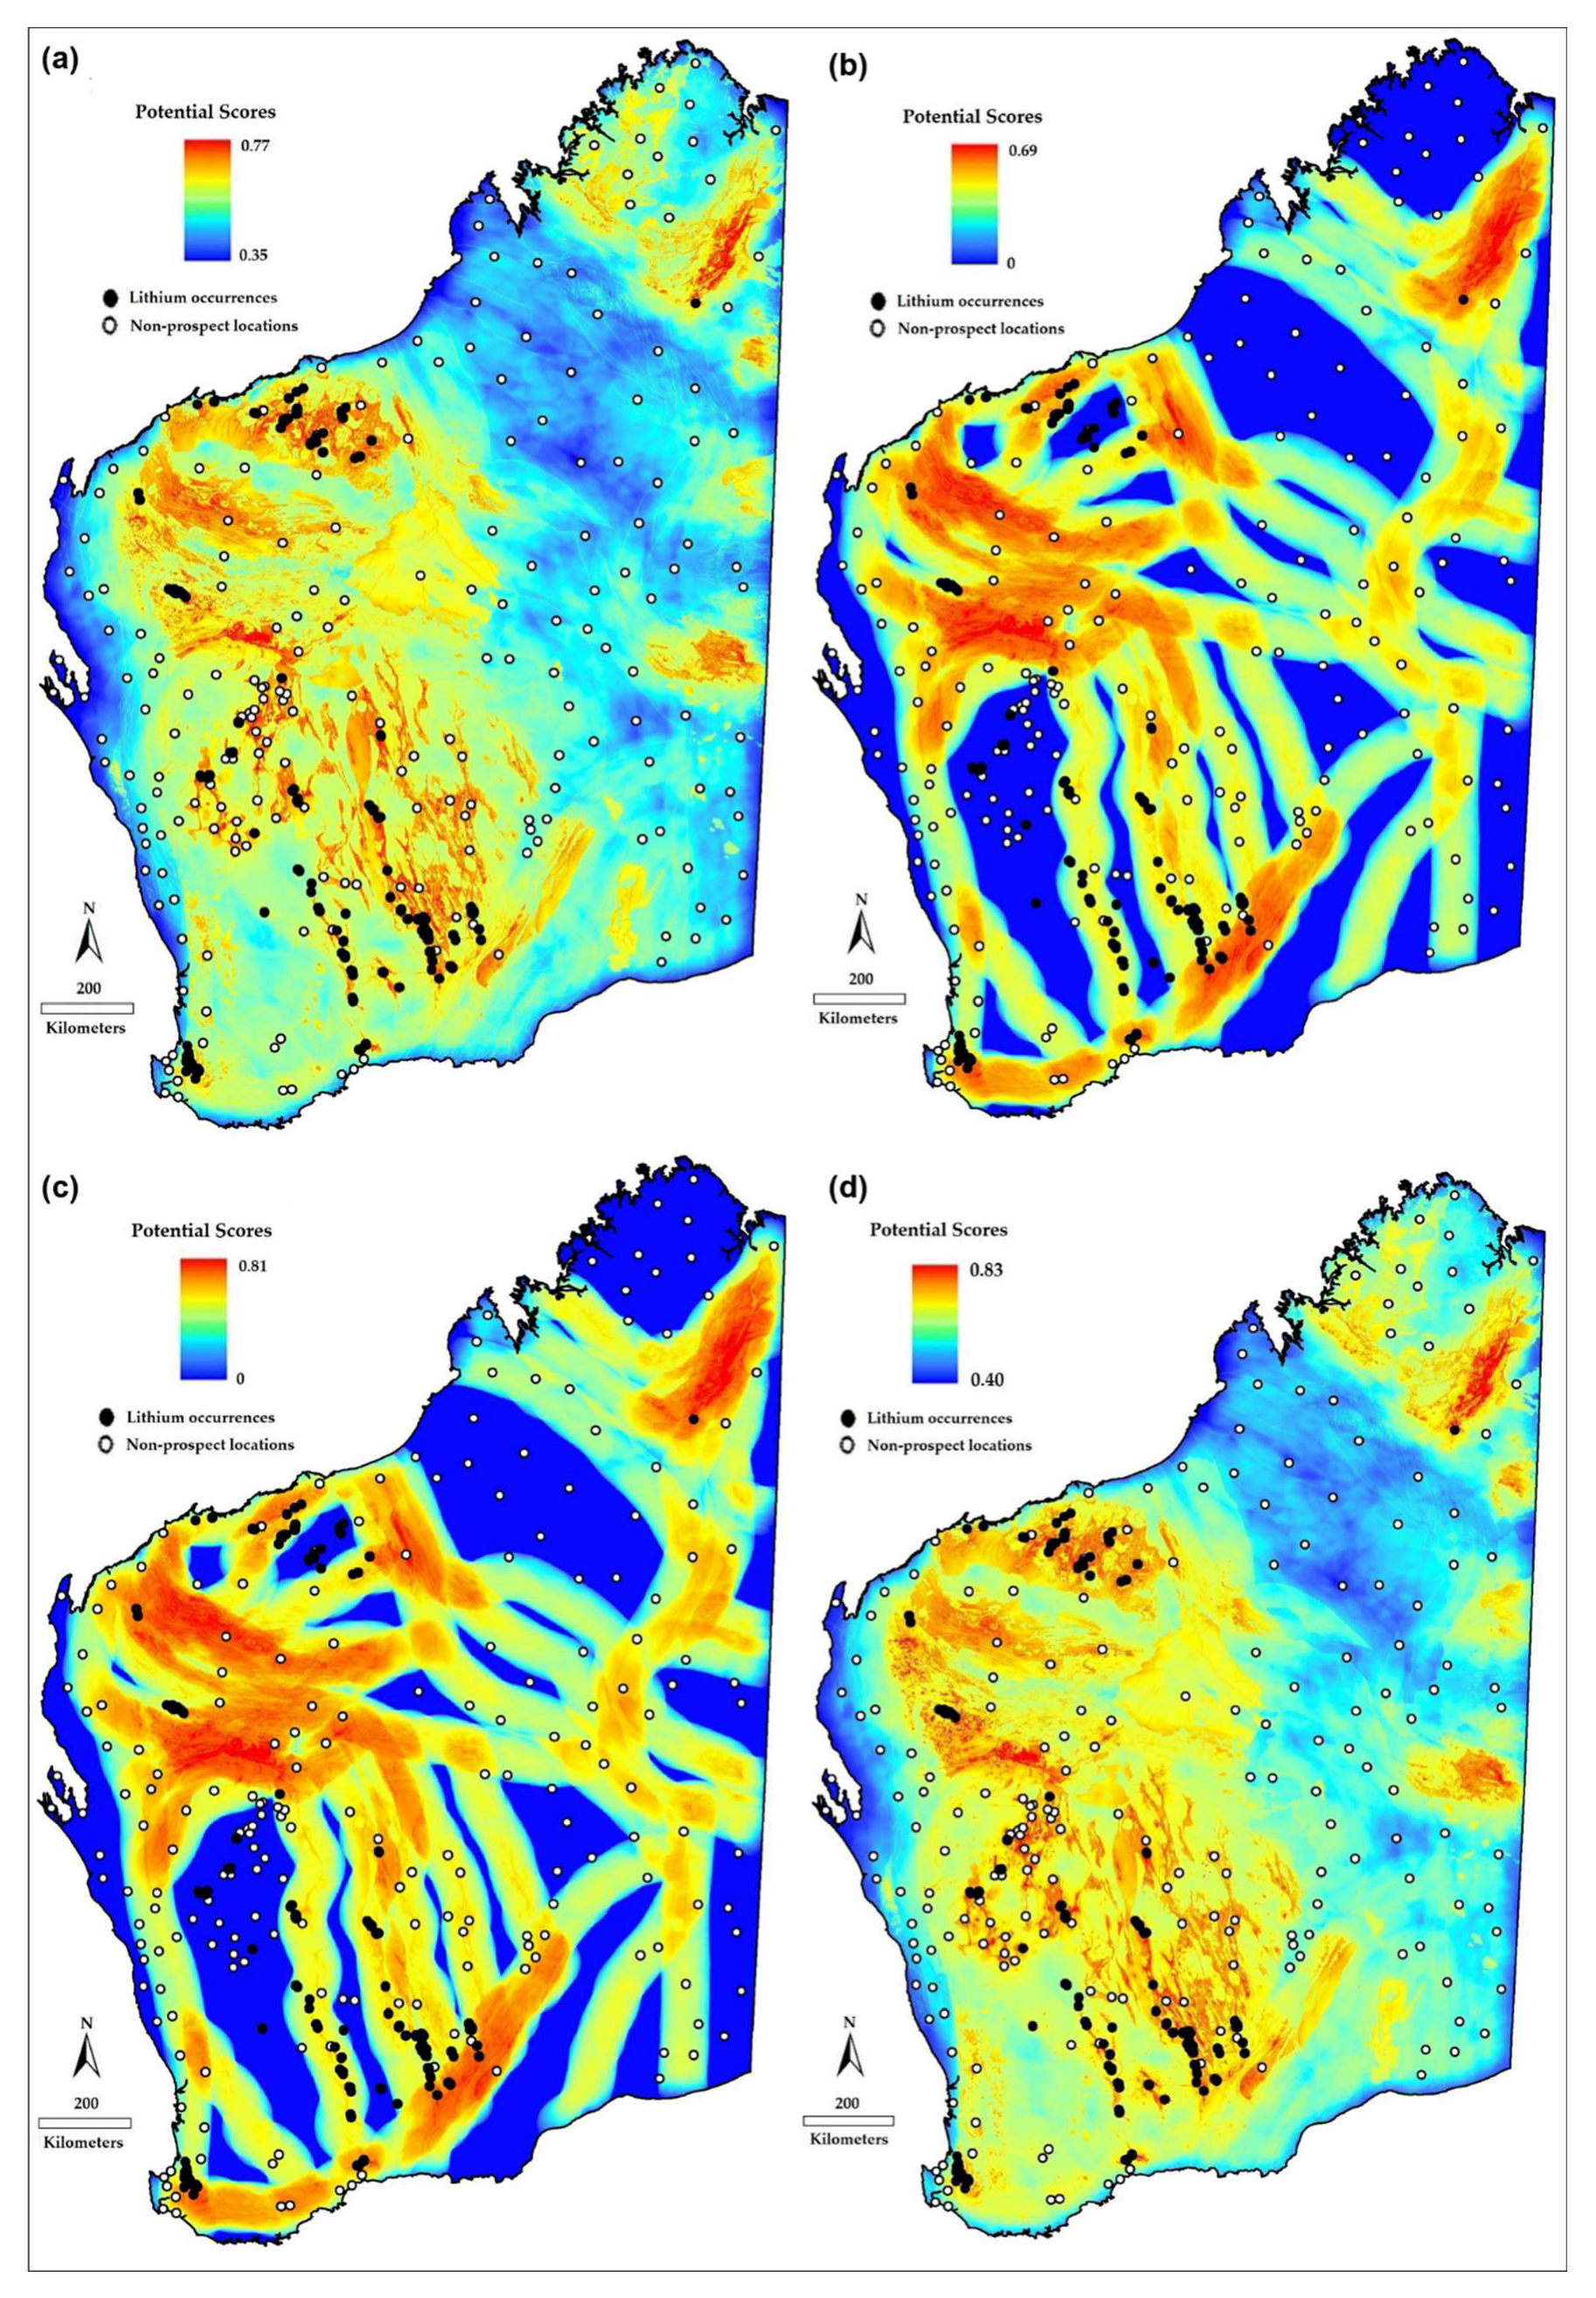
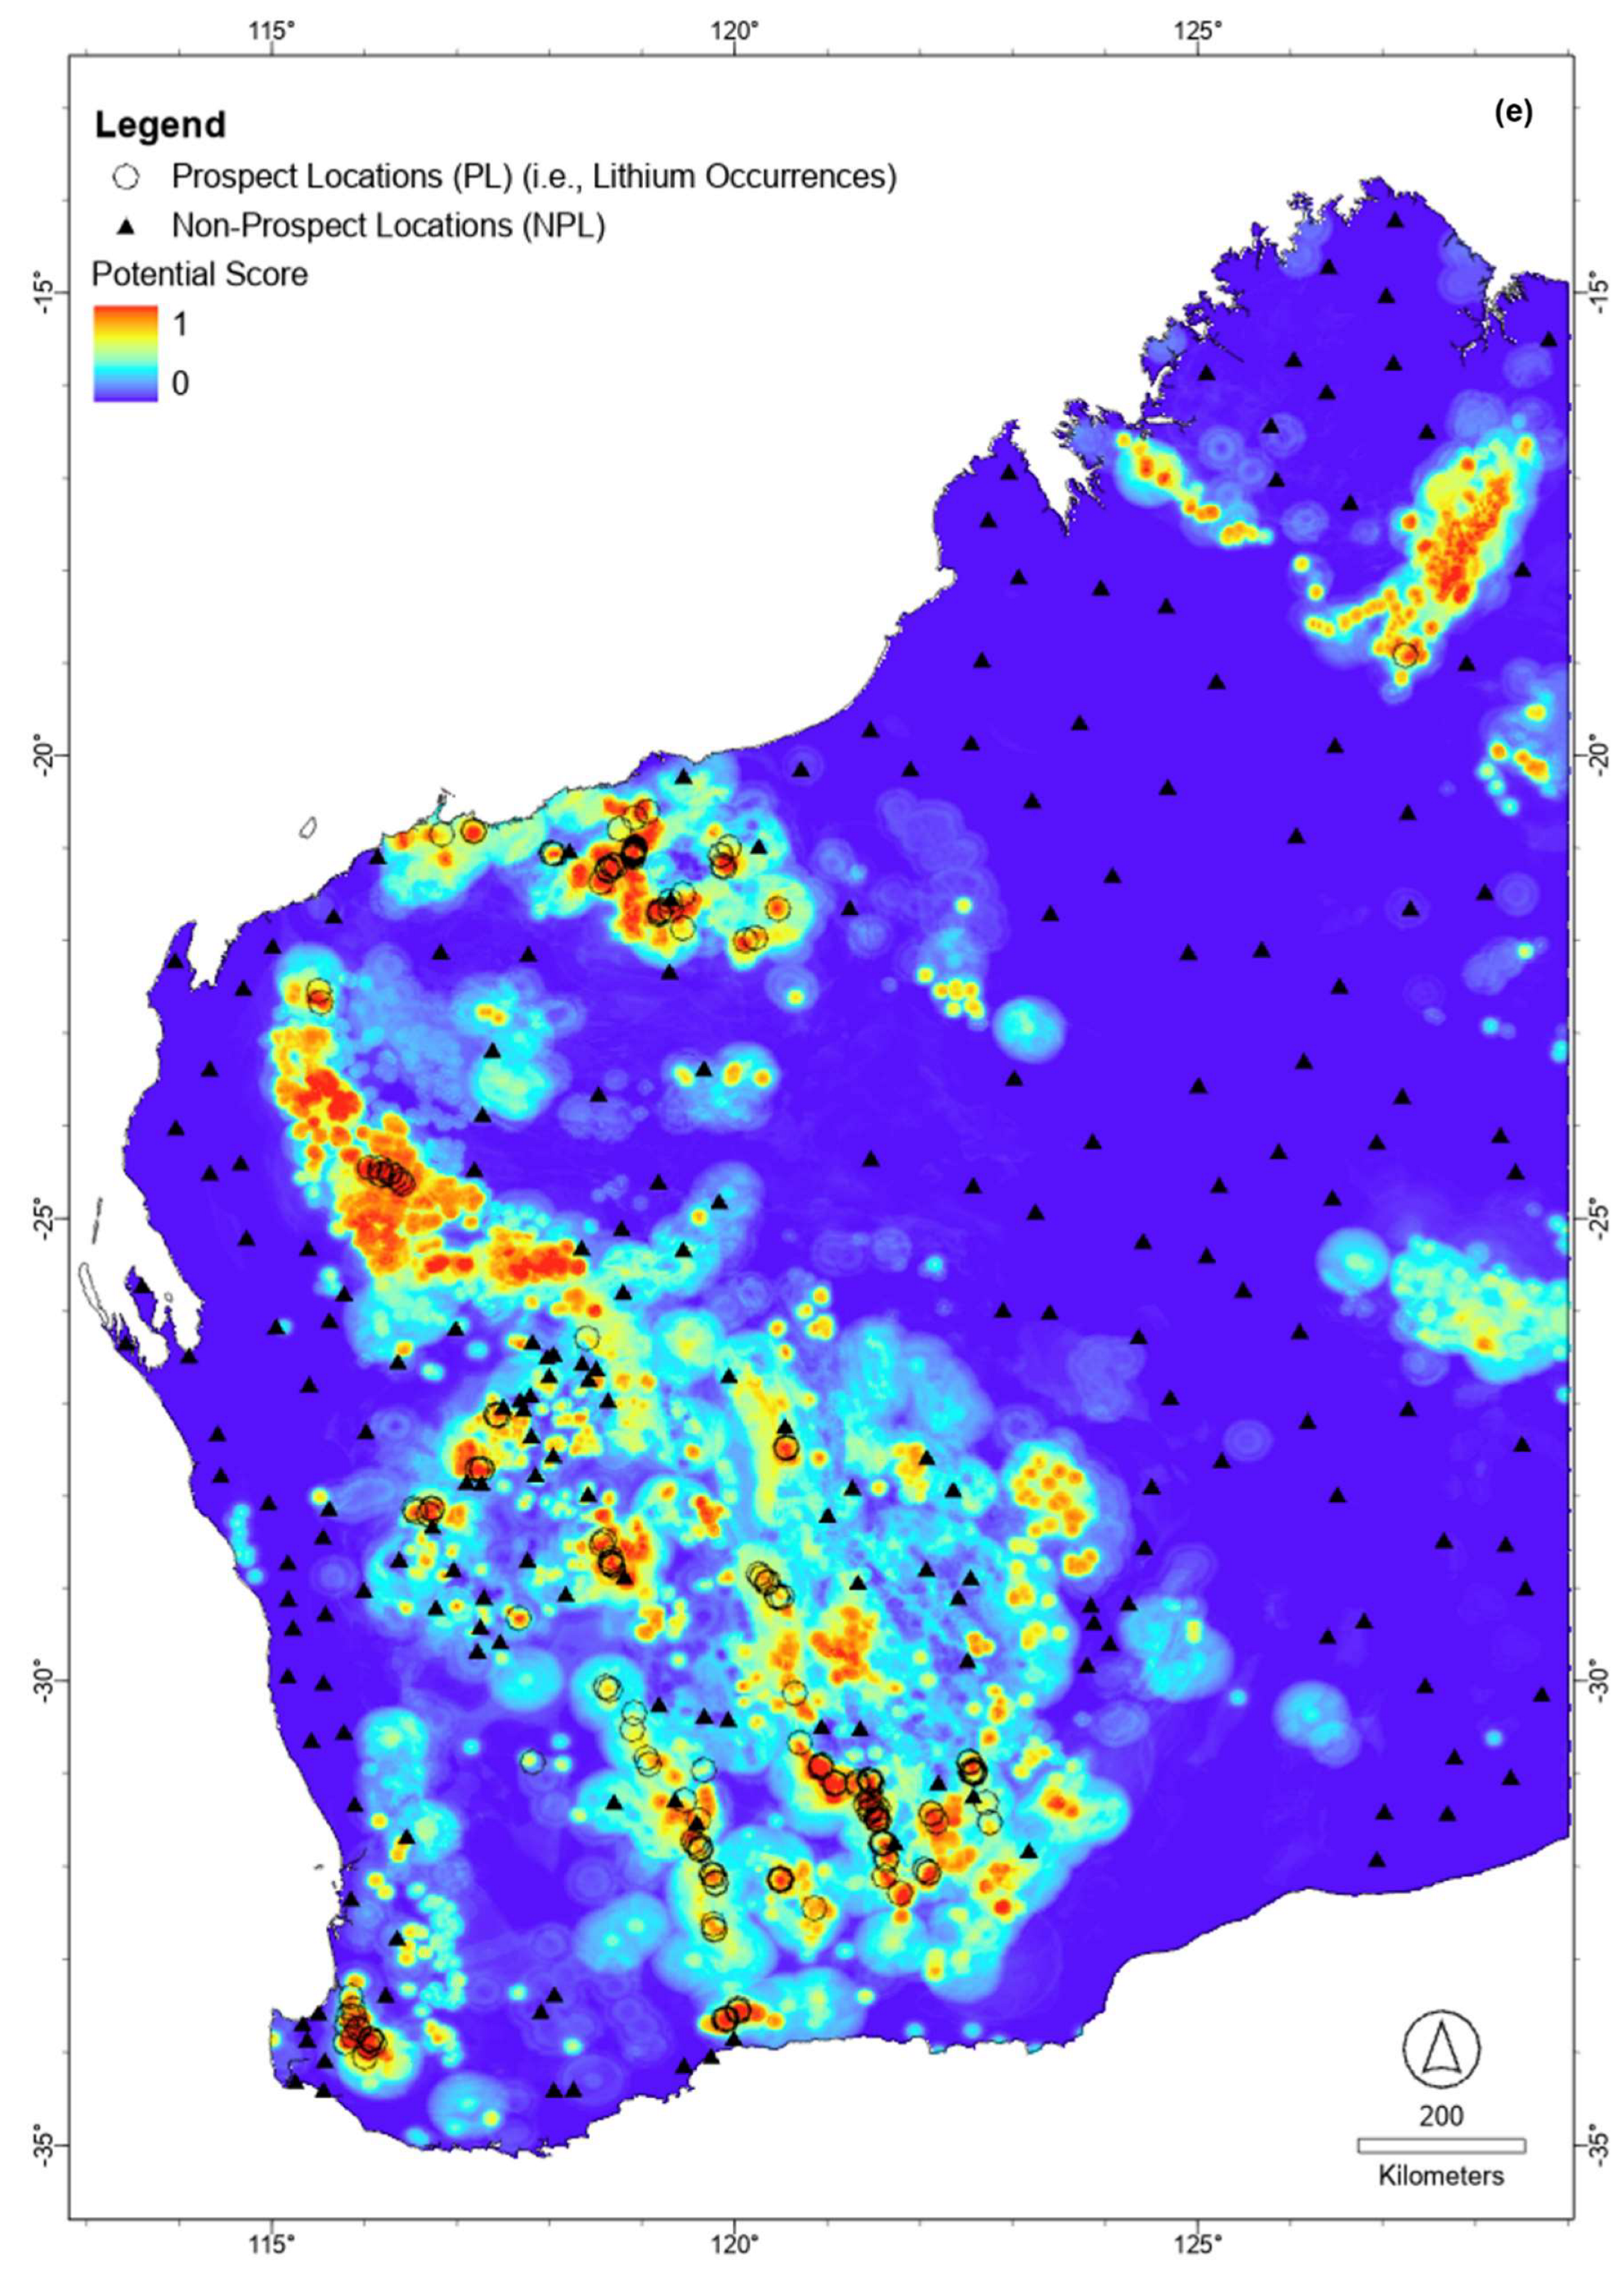
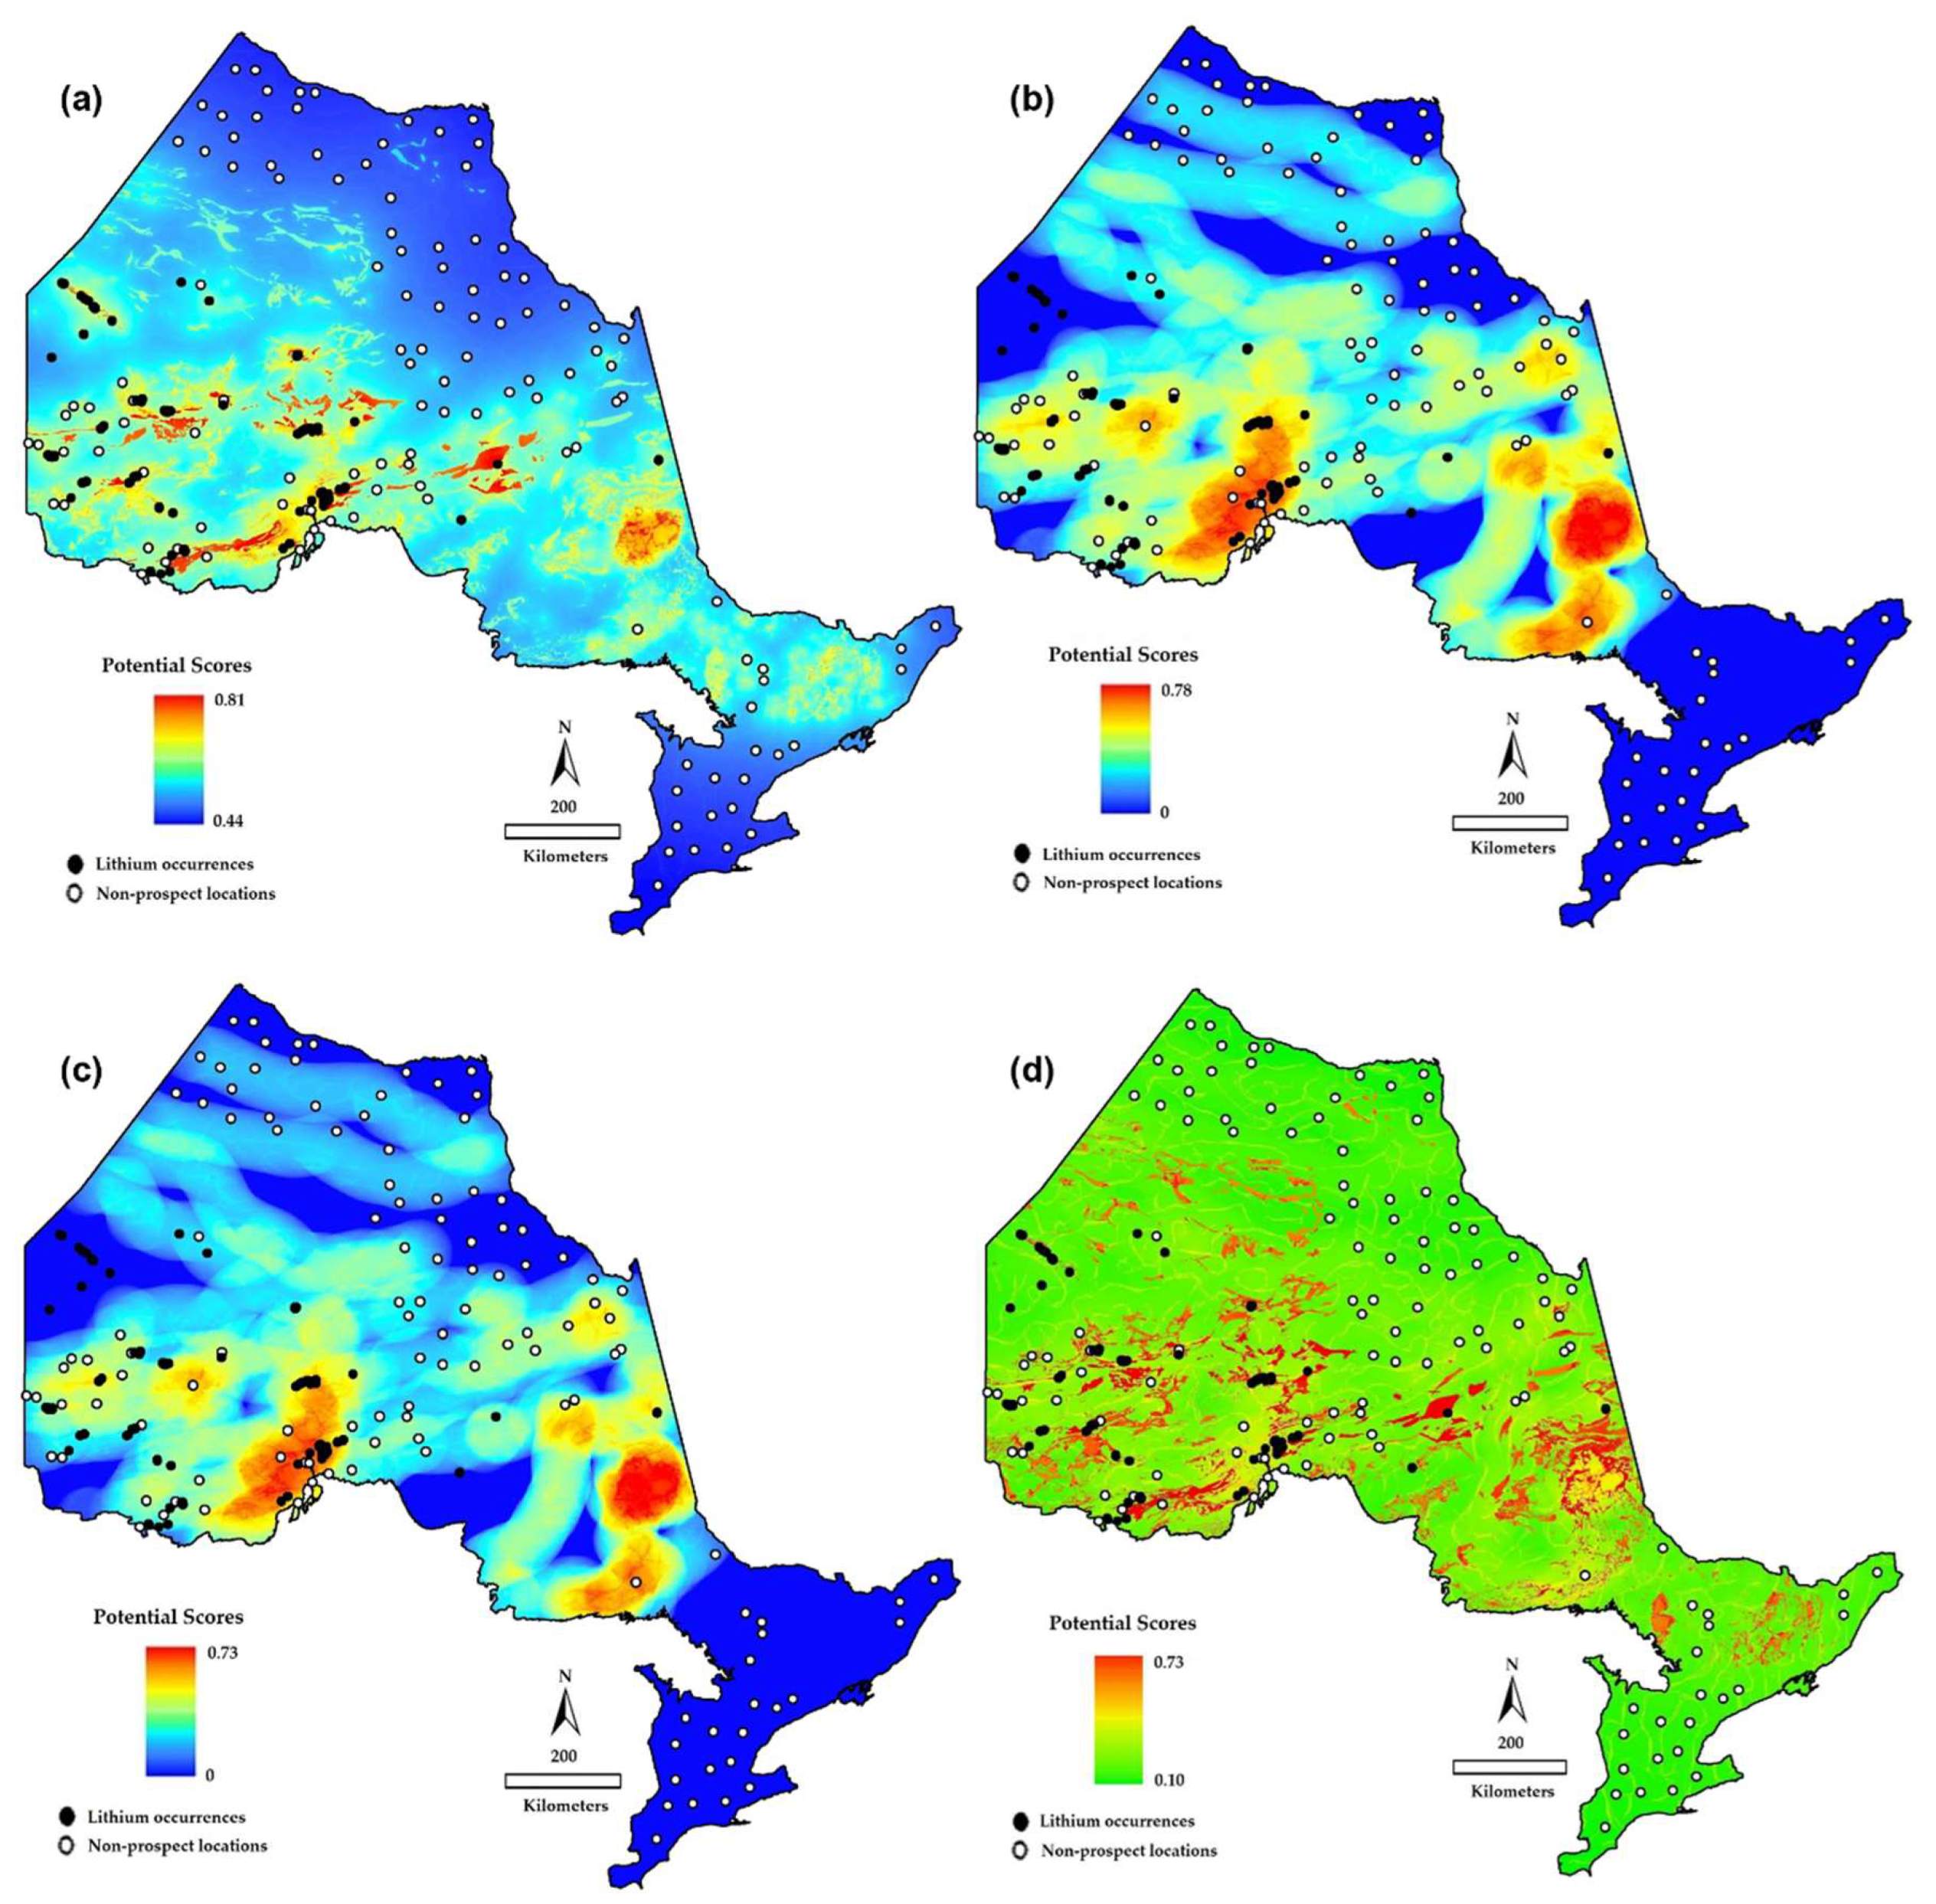
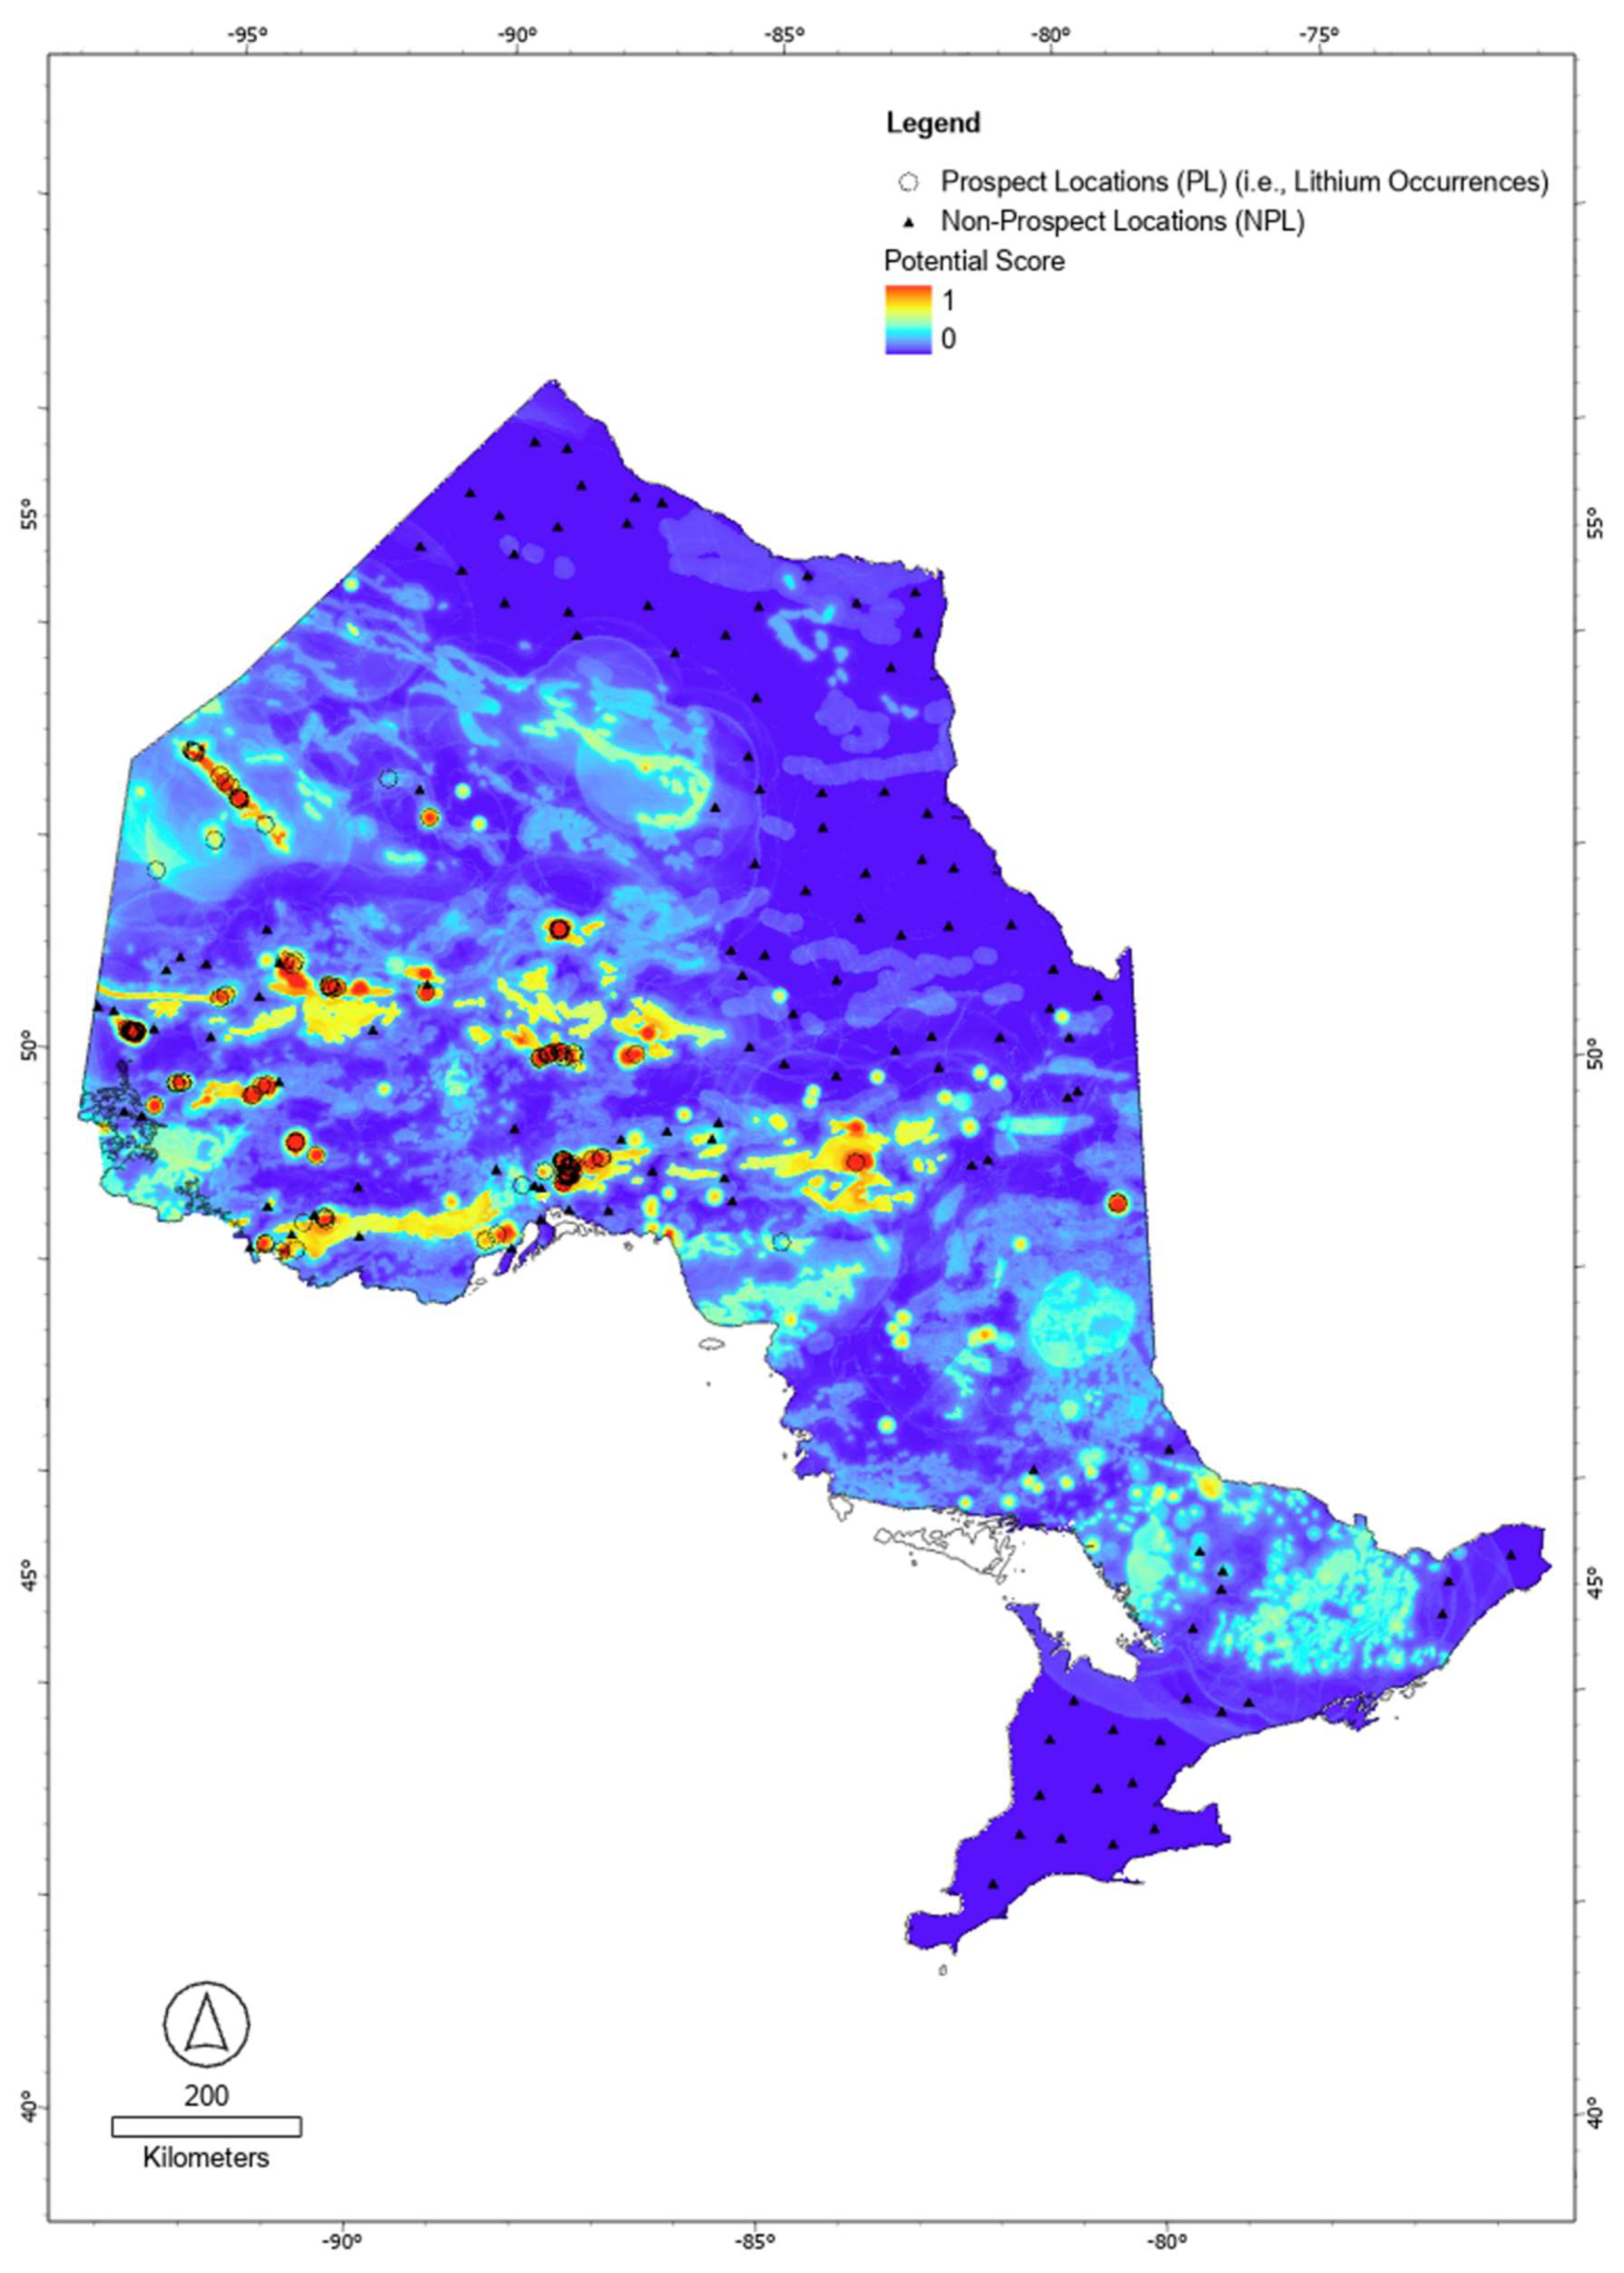
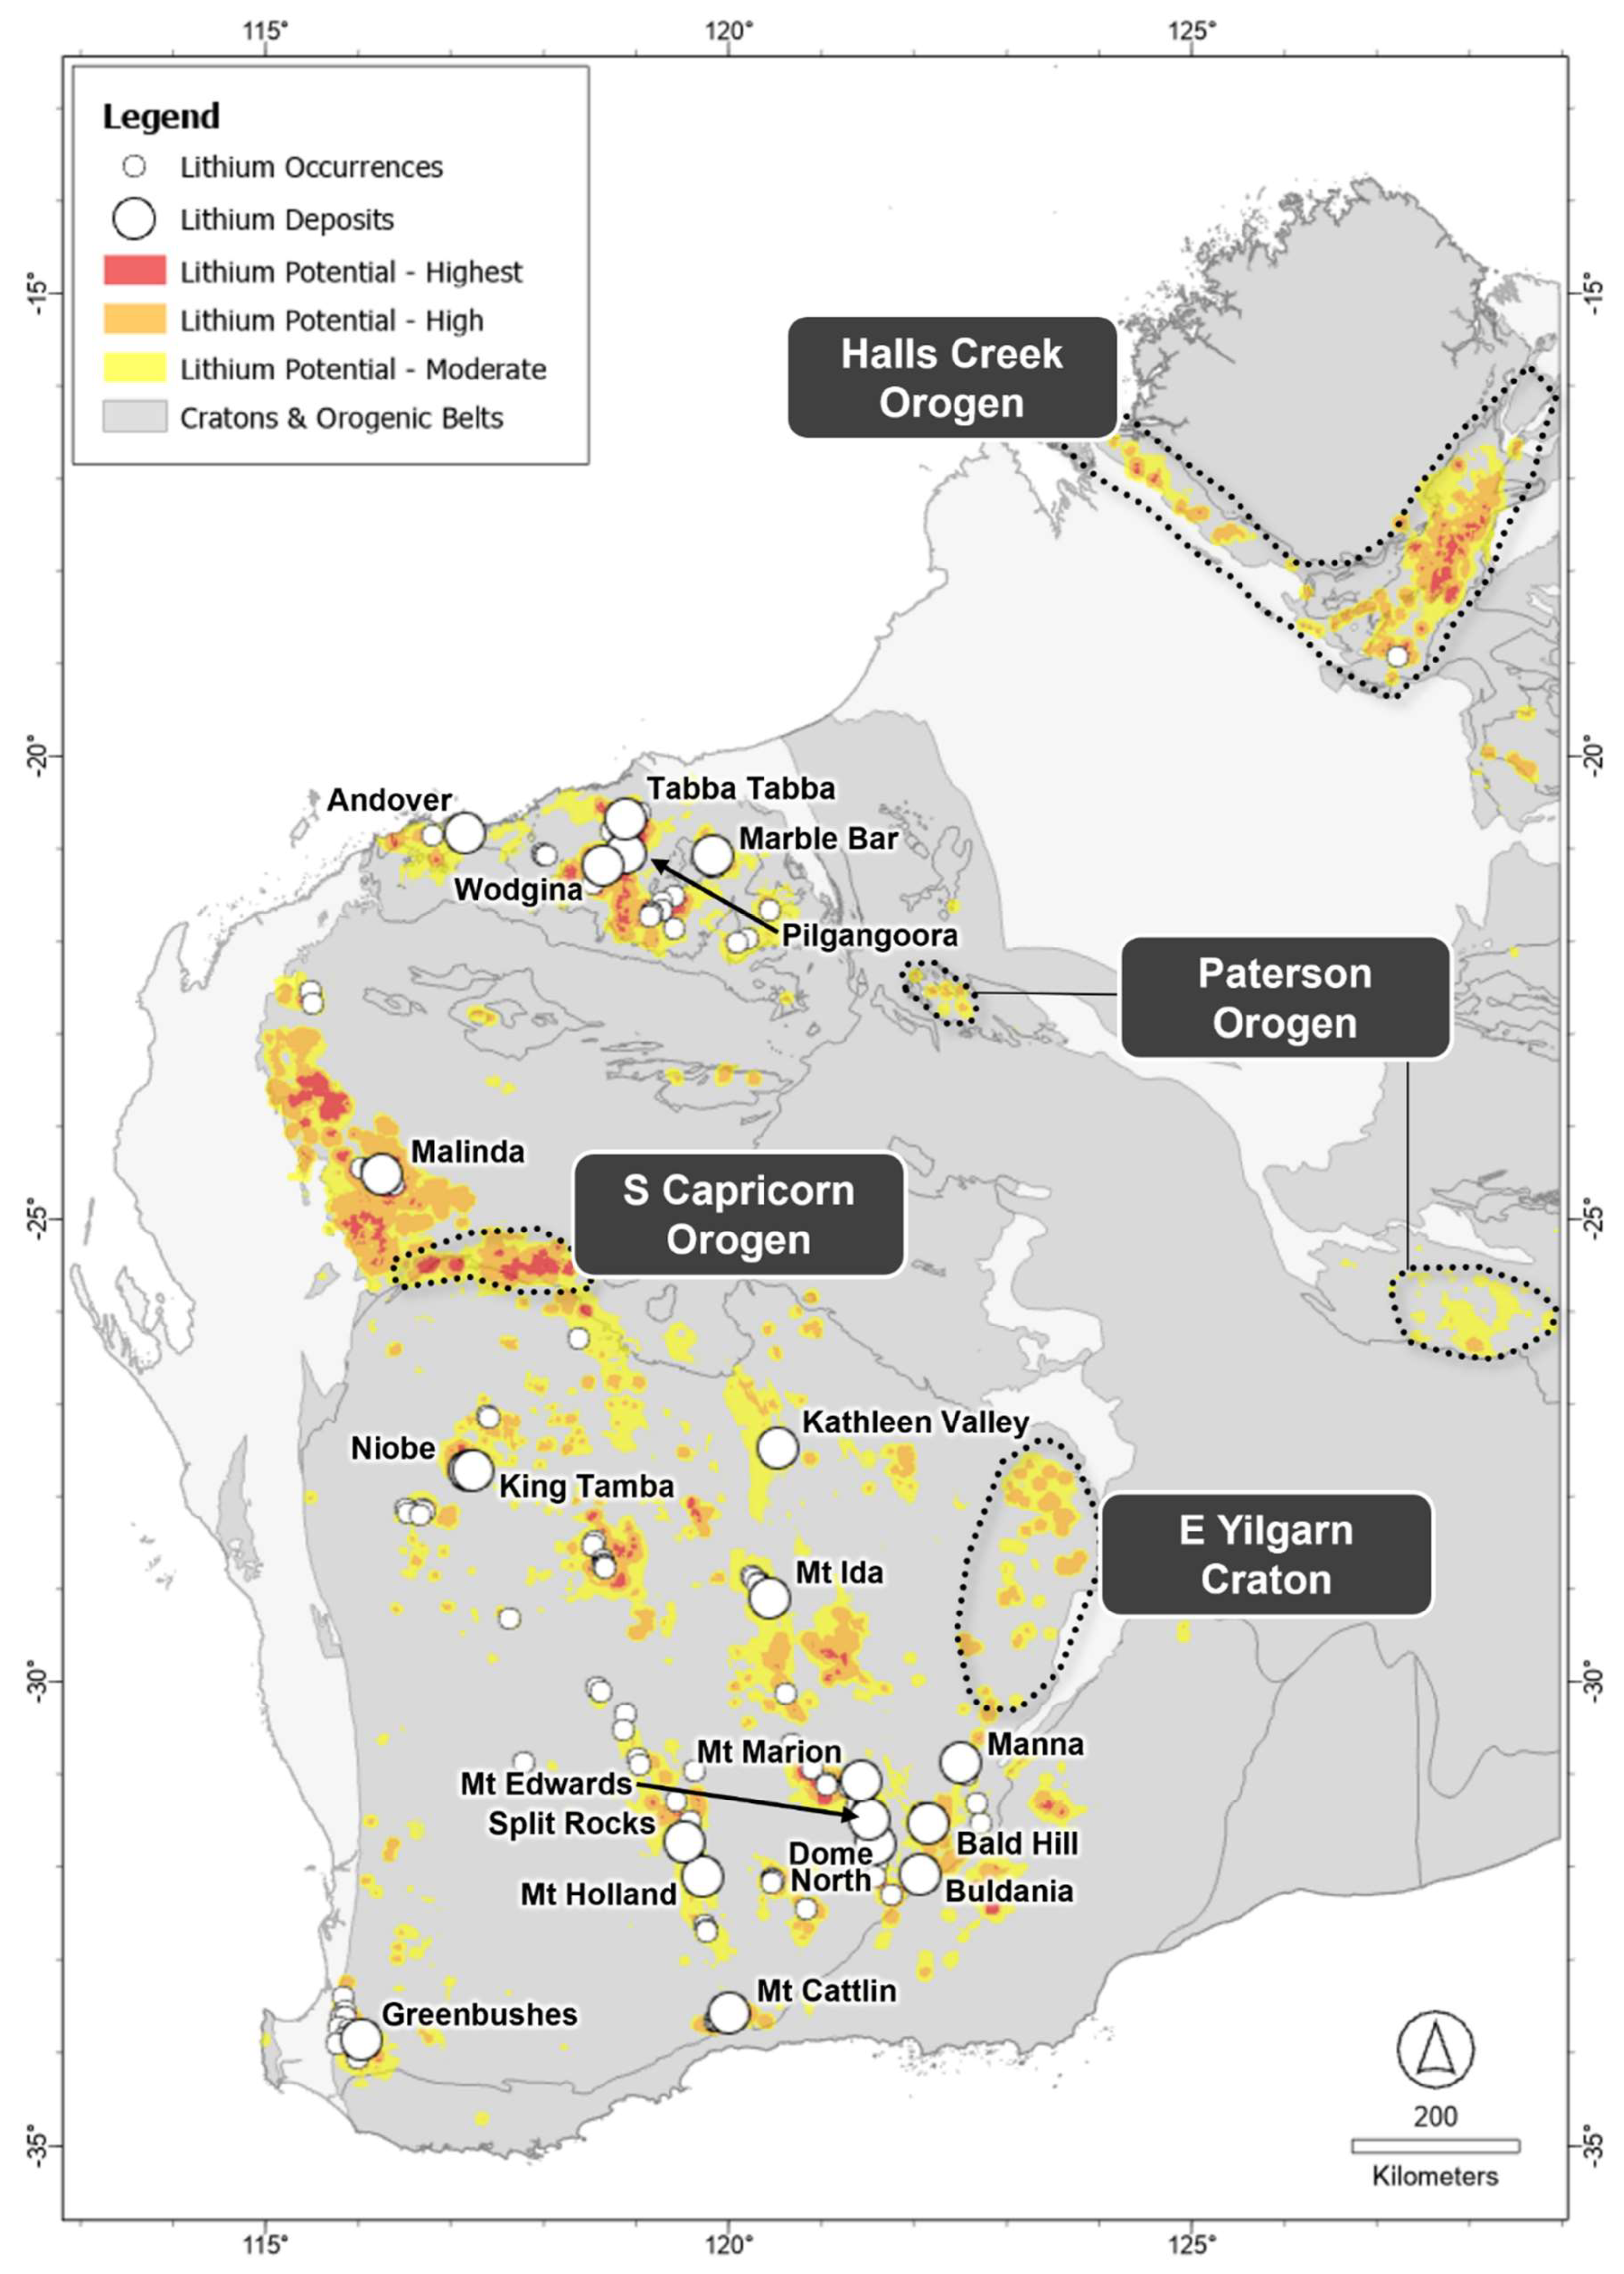
  • We adopted a best-practice multi-technique approach to mineral potential mapping (MPM) of LCT pegmatite system in Western Australia and Ontario, which included the use of five different methods spanning the spectrum between traditional MPM algorithms and artificial intelligence (AI). The best-performing method, random forest (RF) machine-learning AI technique, achieved excellent overall performance (Op) metrics (Western Australia: Op = 0.53; Ontario: Op = 0.63), outclassing all other methods by ~3.3 times for Western Australia and ~2.5 times for Ontario. The validity of the RF model is also demonstrated by most of the known lithium deposits, camps and districts plotting within areas of elevated to very high lithium favorability as identified by this modelling approach.
  • MPM also identified certain belts that have few LCT pegmatite lithium occurrences, or none, but have moderate to very high lithium potential. In Western Australia, these include, for example, the Proterozoic Halls Creek, southern Capricorn and Paterson orogens as well as the eastern Archean Yilgarn Craton. Ontarian examples include the Kasabonika Lake-Ekwan River, Savant Lake-Crow Lake and Michipicoten greenstone belts of the Archean Superior Craton and the pegmatite belts of the Proterozoic Grenville Orogen in southern Ontario. In our opinion, these belts warrant closer investigation as to their LCT pegmatite potential.
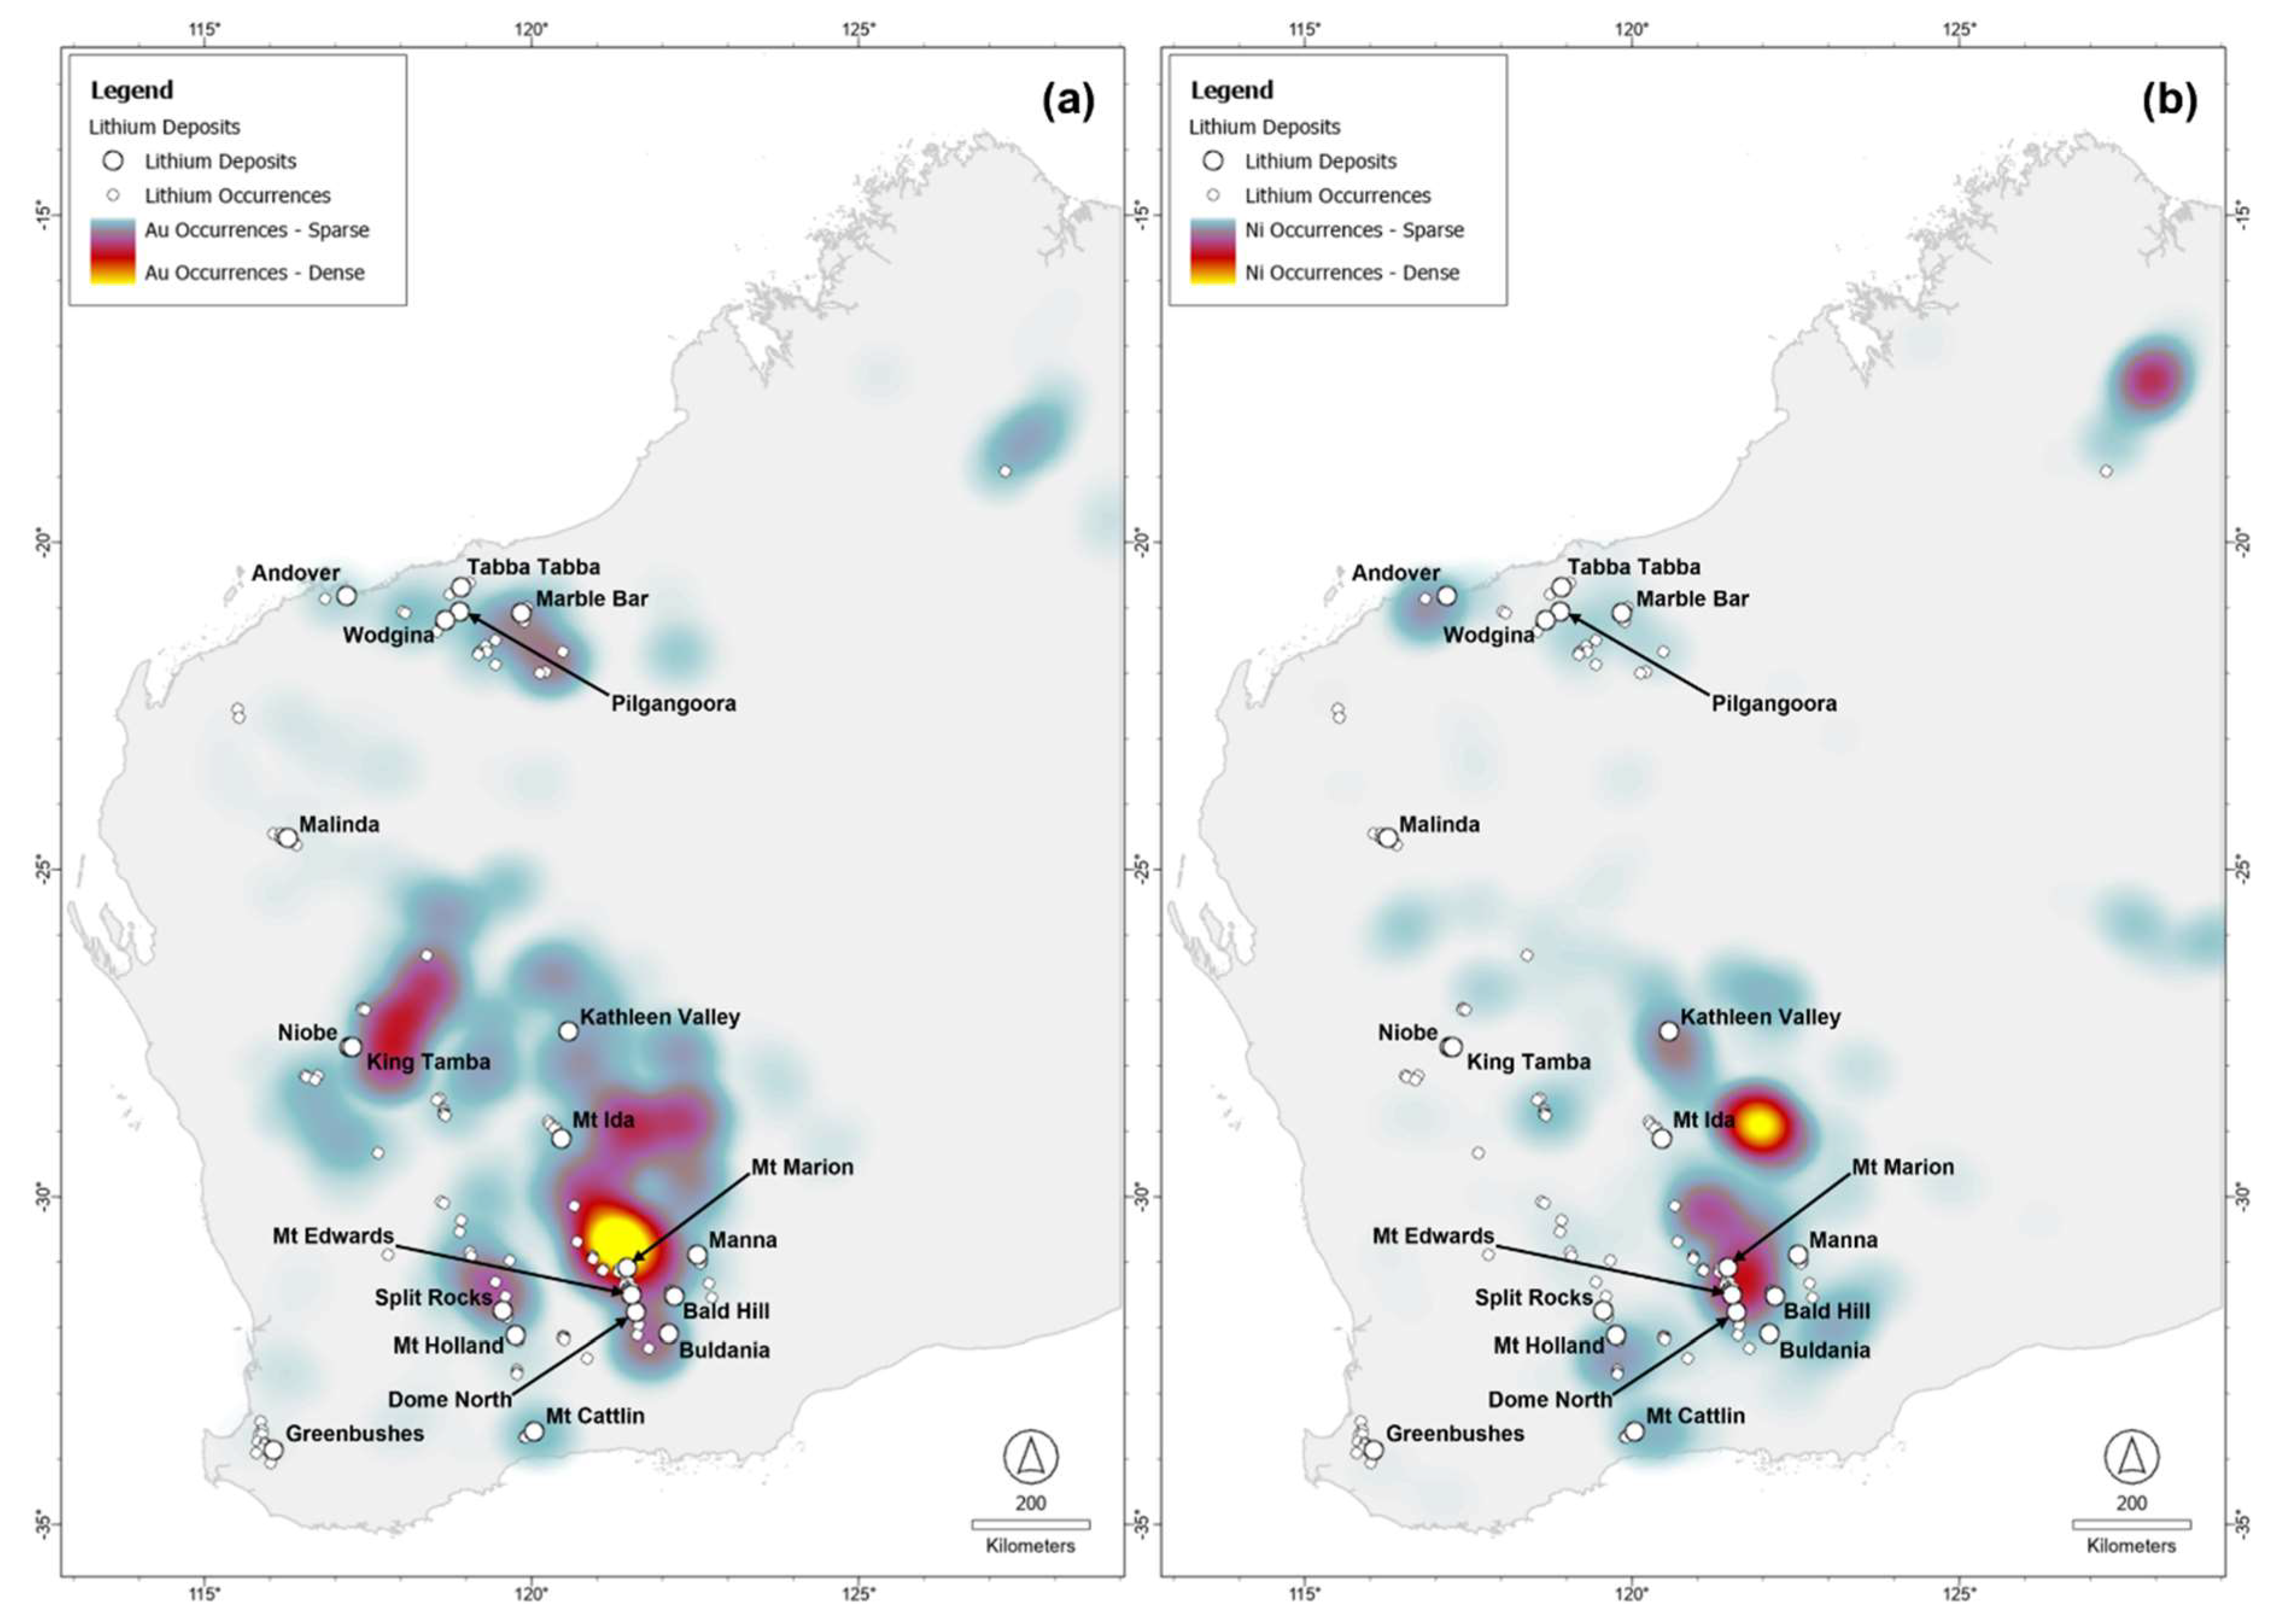
  • In addition, our modelling revealed a statistically verifiable proximity relationship between lithium, gold and nickel occurrences. At this stage, the underlying reason for this relationship is speculative but it seems plausible that the clustering of these different mineral deposit types is linked to their common spatial association with deep-seated faults and mafic-ultramafic rock sequences.

Supplementary Materials

The following supporting information can be downloaded at the website of this paper posted on Preprints.org.

Author Contributions

Conceptualization, O.P.K.; methodology, O.P.K. and B.R.; software, O.P.K. and B.R..; validation, B.R.; formal analysis, O.P.K. and B.R.; investigation, O.P.K. and B.R..; resources, O.P.K. and B.R.; data curation, O.P.K. and B.R.; writing—original draft preparation, O.K. and B.R.; writing—review and editing, O.P.K.; visualization, O.P.K. and B.R.; project administration, O.P.K. All authors have read and agreed to the published version of the manuscript.

Funding

This research received no external funding.

Data Availability Statement

Publicly available datasets were analyzed in this study. The data sources are specified in Table 3.

Acknowledgments

The governments of Western Australia and Ontario are acknowledged for providing free and unrestricted access to high-quality geoscience and exploration data without which a regional, country-wide study like this one would be impossible.

Conflicts of Interest

The authors declare no conflicts of interest.

References

  1. Bradley, D.C.; Stillings, L.L.; Jaskula, B.W.; Munk, LeeAnn; McCauley, A.D. Lithium. In Critical mineral resources of the United States—economic and environmental geology and prospects for future supply; Schulz, K.J.; DeYoung, J.H., Jr.; Seal, R.R., II; Bradley, D.C.; Eds.; U.S. Geological Survey: Reston, Virginia, USA, 2017, Professional Paper 1802, pp. K1–K21.
  2. Bradley, D.C.; McCauley, A.D.; Stillings, L.M. Mineral-deposit model for lithium-cesium-tantalum pegmatites. In Mineral deposit models for resource assessment. U.S. Geological Survey: Reston, Virginia, USA, 2017, Scientific Investigations Report 2010–5070–O, pp 1–48.
  3. Bradley, D.C. Tectonic and paleoclimatic controls of lithium-cesium-tantalum (LCT) pegmatite genesis, exhumation, and preservation in the Appalachians. The Canadian Mineralogist 2019, 57, 715–717. [Google Scholar] [CrossRef]
  4. RCF Ambrian. Lithium commodity market report, August 2023; RCF Ambrian: London, UK, 2023; 53p. [Google Scholar]
  5. Geological Survey of Western Australia. Lithium investment opportunities, December 2023; Government of Western Australia, Department of Energy, Mines, Industry Regulation and Safety: Perth, Australia; 2p.
  6. Hard rock lithium deposits. Available online: https://www.geologyforinvestors.com/hard-rock-lithium-deposits/ (accessed on 14 December 2024).
  7. Wildcat Resources Limited. Wildcat delivers Australia’s largest undeveloped lithium resource of 74 Mt @ 1.0% Li2O at Tabba Tabba, WA. Australian Securities Exchange (ASX) announcement dated 18 November 2024, 42 p.
  8. Global Lithium Resources Limited. GL1 delivers transformative 50.7 Mt lithium resource base. Australian Securities Exchange (ASX) announcement dated 15 December 2022, 37 p.
  9. Azure Minerals Limited. Exploration target–Andover lithium project. Australian Securities Exchange (ASX) announcement dated 07 August 2023, 19 p.
  10. Critical minerals analysis, Ontario Mining Association, 2022. Available online: https://oma.on.ca/en/ontario-mining/2022_OMA _Mineral_Profiles.pdf (accessed on 14 December 2024).
  11. Ontario Geological Survey. An introduction to Ontario’s critical minerals, with highlights from the Ontario Mineral Inventory; Ministry of Northern Development, Mines, Natural Resources and Forestry: Sudbury, Ontario, Canada, 2022. [Google Scholar]
  12. Frontier Lithium Inc. Corporate presentation, 25 November 2024, 20 p. Available online: https://www.frontierlithium.com/investors-1/ (accessed on 11 December 2024).
  13. Avalon Advanced Materials Inc. Avalon announces a substantive 20% increase in deposit size at its flagship Separation Rapids joint-venture lithium project. Toronto Securities Exchange (TSX) announcement dated 10 August 2023, 7 p.
  14. Green Technology Metals Limited. Significant resource and confidence level increase at Root, global resource inventory now at 24.5 Mt. Australian Securities Exchange (ASX) announcement dated 17 October 2023, 89 p.
  15. AMC Mining Consultants (Canada) Limited. Technical report, Georgia Lake lithium project pre-feasibility study, RockTech Lithium Inc. Vancouver, Canada, 01 October 2022, 350 p.
  16. Critical Resources Limited. 8.0 Mt at 1.07% Li2O maiden mineral resource at Mavis Lake. Australian Securities Exchange (ASX) announcement dated 05 May 2023, 25 p.
  17. Sweetapple, M.T.; Collins, P.L. ; Genetic framework for the classification and distribution of Archean rare metal pegmatites in the north Pilbara Craton, Western Australia. Economic Geology 2002, 97, 873–895. [Google Scholar] [CrossRef]
  18. Breaks, F.W.; Selway, J.B.; Tindle, A.G. ; Fertile peraluminous granites and related rare-element mineralization in pegmatites, Superior Province, northwest and northeast Ontario: operation treasure hunt. Ontario Geological Survey Open File Report 2003, 6099, 179. [Google Scholar]
  19. Selway, J.B.; Breaks, F.W.; Tindle, A.G. ; A review of rare-element (Li-Cs-Ta) pegmatite exploration techniques for the Superior Province, Canada, and large worldwide tantalum deposits. Exploration and Mining Geology 2005, 14, 1–30. [Google Scholar] [CrossRef]
  20. Sweetapple, M.T.; A review of the setting and internal characteristics of lithium pegmatite systems of the Archaean north Pilbara and Yilgarn cratons, Western Australia. In Extended Abstracts (Australian Institute of Geoscientists Bulletin, 65, 113–117), Granites 2017 Conference, Benalla, Victoria, 25-28 September 2017.
  21. Duuring, P. ; Rare-element pegmatites: a mineral systems analysis. Geological Survey of Western Australia Record 2020, 2020, 6. [Google Scholar]
  22. Phelps-Barber, Z.; Trench, A.; Groves, D.I. ; Recent pegmatite-hosted spodumene discoveries in Western Australia: insights for lithium exploration in Australia and globally. Applied Earth Science 2022, 131, 100–113. [Google Scholar] [CrossRef]
  23. Wells, M.; Aylmore, M. ; McInnes, B; MRIWA Report M532the geology, mineralogy and geometallurgy of EV materials deposits in Western Australia. Geological Survey of Western Australia Report 2022, 228, 187. [Google Scholar]
  24. Sweetapple, M.T.; Vanstone, P.J.; Lumpkin, G.R.; Collins, P.L. F; A review of lithogeochemical dispersion haloes of LCT pegmatites, and their application to rare metal exploration, with special reference to lithium in an Australian context. Australian Journal of Earth Sciences 2024, 71, 1050–1084. [Google Scholar] [CrossRef]
  25. Bruce, M.; Kreuzer, O.P.; Wilde, A.; Buckingham, A.; Butera, K.; Bierlein, F. Unconformity-type uranium systems: a comparative review and predictive modelling of critical genetic factors. Minerals 2020, 10, 738. [Google Scholar] [CrossRef]
  26. Roshanravan, B.; Kreuzer, O.P.; Buckingham, A.; Keykhay-Hosseinpoor, M.; Keys, E. Mineral potential modelling of orogenic gold systems in the Granites-Tanami Orogen, Northern Territory, Australia: a multi-technique approach. Ore Geology Reviews 2023, 152, 105224. [Google Scholar] [CrossRef]
  27. Wyborn, L.A.I.; Heinrich, C.A.; Jaques, A.L. Australian Proterozoic mineral systems: essential ingredients and mappable criteria. In Proceedings of the 1994 AusIMM Annual Conference: Australian mining looks north—the challenges and choices, Darwin, Northern Territory, Australia, 5-9 August 1994; pp. 109–115. [Google Scholar]
  28. Knox-Robinson, C.M.; Wyborn, L.A.I. Knox-Robinson, C.M.; Wyborn, L.A.I.; Towards a holistic exploration strategy: using geographic information systems as a tool to enhance exploration. Australian Journal of Earth Sciences 1997, 44, 453–463. [Google Scholar] [CrossRef]
  29. McCuaig, T.C.; Beresford, S.; Hronsky, J. Translating the mineral systems approach into an effective exploration targeting system. Ore Geology Reviews 2010, 38, 128–138. [Google Scholar] [CrossRef]
  30. Understanding lithium prices: Past, present, and future. Available online: https://carboncredits.com/understanding-lithium-prices-past-present-and-future/ (accessed on 14 December 2024).
  31. Global Lithium Resources (GL1) equity report, Shaw and Partners Financial Services, 22 July 2022. Available online: https://globallithium.com.au/wp-content/uploads/2022/07/CR_MC_GL1_20220722_33f5dcaf1946447ab0a14be0a5a0ae1e.pdf (accessed on 07 January 2025).
  32. Dessemond, C.; Lajoie-Leroux, F.; Soucy, G.; Laroche, N.; Magnan, J.F. Spodumene: the lithium market, resources and processes. Minerals 2019, 9, 1–17. [Google Scholar] [CrossRef]
  33. Spodumene makes a comeback in the rush for lithium. Available online: https://feeco.com/spodumene-makes-a-comeback-in-the-rush-for-lithium/ (accessed on 07 January 2025).
  34. Lithium—Western Australia's drive to green energy technologies. Available online: https://storymaps.arcgis.com/stories/cb3f1d1d26834850a7b804d446313569?ref=dmirsbookshop (accessed on 07 January 2025).
  35. McCuaig, T.C.; Hronsky, J.M.A. ; The mineral system concept—the key to exploration targeting. Society of Economic Geologists Special Publication 2014, 18, 153–175. [Google Scholar] [CrossRef]
  36. Hagemann, S.G.; Lisitsin, V.A.; Huston, D.L. ; Mineral system analysis: quo vadis. Ore Geology Reviews 2016, 76, 504–522. [Google Scholar] [CrossRef]
  37. Kreuzer, O.P.; Etheridge, M.A.; Guj, P.; McMahon, M.E.; Holden, D.J. ; Linking mineral deposit models to quantitative risk analysis and decision-making in exploration. Economic Geology 2008, 103, 829–850. [Google Scholar] [CrossRef]
  38. Kreuzer, O.P.; Miller, A.V.; Peters, K.J.; Payne, C.; Wildman, C.; Partington, G.A.; Puccioni, E.; McMahon, M.E.; Etheridge, M. A; Comparing prospectivity modelling results and past exploration data: a case study of porphyry Cu–Au mineral systems in the Macquarie Arc, Lachlan Fold Belt, New South Wales. Ore Geology Reviews 2015, 71, 516–544. [Google Scholar] [CrossRef]
  39. Kreuzer, O.P.; Buckingham, A.; Mortimer, J.; Walker, G.; Wilde, A. ; Appiah, K; An integrated approach to the search for gold in a mature, data-rich brownfields environment: a case study from Sigma-Lamaque, Quebec. Ore Geology Reviews 2019, 111, 102977. [Google Scholar] [CrossRef]
  40. Roshanravan, B.; Kreuzer, O.P.; Bruce, M.; Davis, J. ; Briggs, M; Modelling gold potential in the Granites-Tanami Orogen, NT, Australia: a comparative study using continuous and data-driven techniques. Ore Geology Reviews 2020, 125, 103661. [Google Scholar] [CrossRef]
  41. Kreuzer, O.P.; Yousefi, M.; Nykänen, V. ; Introduction to the special issue on spatial modelling and analysis of ore-forming processes in mineral exploration targeting. Ore Geology Reviews 2020, 119, 103391. [Google Scholar] [CrossRef]
  42. Agterberg, F.P. ; Computer programs for mineral exploration. Science 1989, 245, 76–81. [Google Scholar] [CrossRef] [PubMed]
  43. Bonham-Carter, G.F.; Agterberg, F.P.; Wright, D. F. Bonham-Carter, G.F.; Agterberg, F.P.; Wright, D. F.; Integration of geological datasets for gold exploration in Nova Scotia. Digital Geologic and Geographic Information Systems 1989, 10, 15–23. [Google Scholar]
  44. Carranza, E.J.M. Geochemical anomaly and mineral prospectivity mapping in GIS—handbook of exploration and environmental geochemistry 11; Elsevier: Amsterdam, The Netherlands, 2008; 351p. [Google Scholar]
  45. Joly, A.; Porwal, A.K.; McCuaig, T.C. ; Exploration targeting for orogenic gold deposits in the Granites-Tanami Orogen: mineral system analysis, targeting model and prospectivity analysis. Ore Geology Reviews 2012, 48, 349–383. [Google Scholar] [CrossRef]
  46. Porwal, A.K.; Carranza, E.J.M. ; Introduction to the special issue: GIS-based mineral potential modelling and geological data analyses for mineral exploration. Ore Geology Reviews 2015, 71, 477–483. [Google Scholar] [CrossRef]
  47. Roshanravan, B.; Kreuzer, O.P.; Buckingham, A. ; BWM-MARCOS: a new hybrid MCDM approach for mineral potential modelling. Journal of Geochemical Exploration 2025, 269, 107639. [Google Scholar] [CrossRef]
  48. Bonham-Carter, G.F. Geographic information systems for geoscientists: modelling with GIS. Pergamon: Oxford, United Kingdom, 1994; 416p.
  49. Yousefi, M.; Nykänen, V. ; Data-driven logistic-based weighting of geochemical and geological evidence layers in mineral prospectivity mapping. Journal of Geochemical Exploration 2016, 164, 94–106. [Google Scholar] [CrossRef]
  50. Yousefi, M.; Carranza, E.J.M. ; Data-driven index overlay and Boolean logic mineral prospectivity modeling in greenfields exploration. Natural Resources Research 2016, 25, 3–18. [Google Scholar] [CrossRef]
  51. Yousefi, M.; Carranza, E.J.M. Fuzzification of continuous-value spatial evidence for mineral prospectivity mapping. Computers & Geosciences 2015, 74, 97–109. [Google Scholar]
  52. Yousefi, M.; Carranza, E.J.M. Geometric average of spatial evidence data layers: a GIS-based multi-criteria decision-making approach to mineral prospectivity mapping. Computers & Geosciences 2015, 83, 72–79. [Google Scholar]
  53. Breiman, L. Random forests. Machine learning 2001, 45, 5–32. [Google Scholar] [CrossRef]
  54. Lapidus, D.F. Collins dictionary of geology, 1st ed.; HarperCollins: London and Glasgow, United Kingdom, 1990; 565p. [Google Scholar]
  55. London, D. ; Rare-element granitic pegmatites. Reviews in Economic Geology 2016, 18, 165–193. [Google Scholar]
  56. Černý, P.; Ercit, T.S. ; The classification of granitic pegmatites revisited. The Canadian Mineralogist 2005, 43, 2005–2026. [Google Scholar] [CrossRef]
  57. London, D. ; Ore-forming processes within granitic pegmatites. Ore Geology Reviews 2018, 101, 349–383. [Google Scholar] [CrossRef]
  58. Steiner, B.M. ; Tools and workflows for grassroots Li-Cs-Ta (LCT) pegmatite exploration. Minerals 2019, 9, 499. [Google Scholar] [CrossRef]
  59. Černý, P.; London, D.; Novák, M. ; Granitic pegmatites as reflections of their sources. Elements 2012, 8, 289–294. [Google Scholar] [CrossRef]
  60. Behre Dolbear Australia Pty Limited. Competent persons report, Greenbushes lithium mine‒Western Australia, Australia, and Cuola lithium project‒Sichuan, People’s Republic of China, Tianqi Lithium Corporation. North Sydney, New South Wales, Australia, 30 June 2022, 195 p.
  61. Blewett, R.S.; Kennett, B.L.N.; Huston, D.L. Australia in time and space. In Shaping a nation: a geology of Australia; Blewett, R.S., Ed.; Geoscience Australia and Australian National University (ANU) E Press: Canberra, Australia, 2012; pp. 47–119. [Google Scholar]
  62. Cawood, P.A.; Korsch, R. J. ; Assembling Australia: Proterozoic building of a continent. Precambrian Research 2008, 166, 1–35. [Google Scholar] [CrossRef]
  63. Huston, D.L.; Blewett, R.S.; Champion, D.C. ; Australia through time: a summary of its tectonic and metallogenic evolution. Episodes 2012, 35, 23–43. [Google Scholar] [CrossRef]
  64. Johnson, S.P. The birth of supercontinents and the Proterozoic assembly of Western Australia. Geological Survey of Western Australia, Perth, Australia, 2013, 78p.
  65. Aitken, A.R.A.; Occhipinti, S.A.; Lindsay, M.D.; Joly, A.; Howard, H.M.; Johnson, S.P.; Hollis, J.A.; Spaggiari, C.V.; Tyler, I.M.; McCuaig, T.C.; Dentith, M.C. ; The tectonics and mineral systems of Proterozoic Western Australia: relationships with supercontinents and global secular change. Geoscience Frontiers 2018, 9, 295–316. [Google Scholar] [CrossRef]
  66. Sweetapple, M.T. Granitic pegmatites as mineral systems: examples from the Archaean. In PEG2017—8th International Symposium on Granitic Pegmatites. NGF Abstracts and Proceedings of the Geological Society of Norway, Kristiansand, Norway, 13-15 June 2017, pp. 139–142.
  67. Dittrich, T.; Seifert, T.; Schulz, B.; Hagemann, S.; Gerdes, A.; Pfaender, J. Archean rare-metal pegmatites in Zimbabwe and Western Australia. Springer: Cham, Switzerland, 2019; 125p.
  68. GSWA Open Day 2024 | A Li-pegmatite paradigm consistent with Western Australia’s Archean geology. Available online: https://youtu.be/9pqPLwDUYQA?si=4TbVCaBQZFRRGOUF (accessed on 17 January 2025).
  69. Champion, D.C.; Sheraton, J.W. ; Geochemistry and Nd isotope systematics of Archaean granites of the Eastern Goldfields, Yilgarn Craton, Australia: implications for crustal growth processes. Precambrian Research 1997, 83, 109–132. [Google Scholar] [CrossRef]
  70. Witt, W.K. Heavy-mineral characteristics, structural setting, and parental granites of pegmatites in Archean rocks of the eastern Yilgarn Craton; Geological Survey of Western Australia: Perth, Australia, Record 1992/10, 61p.
  71. Korhonen, F.J.; Kelsey, D.E.; Ivanic, T.J.; Blereau, E.R.; Smithies, R.H.; De Paoli, M.C.; Fielding, I.O. ; Radiogenic heat production provides a thermal threshold for Archean cratonization process. Geology 2024. [Google Scholar] [CrossRef]
  72. Partington, G.A. Greenbushes tin, tantalum and lithium deposit. In Australian ore deposits; Phillips, N., Ed.; The Australasian Institute of Mining and Metallurgy, Carlton, Victoria, Australia, 2017, Monograph 32, pp. 153–157.
  73. Sheppard, S; Johnson, S.P.; Wingate, M.T.D.; Kirkland, C.L.; Pirajno, F. Explanatory notes for the Gascoyne Province; Geological Survey of Western Australia: Perth, Australia, 2010; 336p. [Google Scholar]
  74. Delta Lithium Limited. Yinnetharra lithium project maiden mineral resource estimate. Australian Securities Exchange (ASX) announcement dated 27 December 2023, 28p.
  75. Holmes, J. Discovery and geology of the Pilgangoora Li-Ta pegmatite deposit, Western Australia. Centre for Exploration Targeting (CET) Members Day, Perth, Australia, 28 November 2022.
  76. Tabba Tabba pegmatite (Tabba Tabba tantalum mine), East Pilbara Shire, Western Australia, Australia. Available online: https://www.mindat.org/loc-12495.html/ (accessed on 10 January 2025).
  77. Global Lithium Resources Limited. Prospectus. Australian Securities Exchange (ASX) announcement dated 04 May 2021, 198 p.
  78. Sociedad Química y Minera de Chile. Technical report summary, Mt. Holland lithium project. 25 April 2022, 115 p.
  79. Kathleen Valley - Kathleens Corner, Mount Mann. Available online: https://portergeo.com.au/database/mineinfo.asp?mineid=mn1781 (accessed on 10 January 2025).
  80. Liontown Resources Limited. Kathleen Valley confirmed as a world-class lithium deposit as mineral resource increases to 156Mt @ 1.4% Li2O. Australian Securities Exchange (ASX) announcement dated 11 May 2020, 25 p.
  81. Ross, J.R.; Smith, B. Mount Marion lithium pegmatite deposit. In Australian ore deposits; Phillips, N., Ed.; The Australasian Institute of Mining and Metallurgy, Carlton, Victoria, Australia, 2017, Monograph 32, pp. 161–162.
  82. Mount Marion. Available online: https://portergeo.com.au/database/mineinfo.asp?mineid=mn1543 (accessed on 10 January 2025).
  83. Global Lithium Resources Limited. 9.9 million tonnes @ 1.14% Li2O and 49 ppm Ta2O5, maiden Manna project lithium resource. Australian Securities Exchange (ASX) announcement dated 17 February 2022, 17 p.
  84. Global Lithium Resources Limited. Manna ore sorting trial confirms excellent results across range of ore grades. Australian Securities Exchange (ASX) announcement dated 04 July 2024, 24 p.
  85. Delta Lithium Limited. Mt Ida lithium project mineral resource estimate upgrade. Australian Securities Exchange (ASX) announcement dated 03 October 2023, 23 p.
  86. Mining Plus Pty Limited. SEC technical report summary, Mt. Cattlin lithium project, Allkem Limited. Brisbane, Australia, 31 August 2023, 310 p.
  87. Liontown Resources Limited. Liontown announces maiden mineral resource estimate for its 100%-owned Buldania lithium project, WA. Australian Securities Exchange (ASX) announcement dated 08 November 2019, 16 p.
  88. Develop Global Limited. Updated scoping study shows Pioneer Dome set to generate strong free cashflow. Australian Securities Exchange (ASX) announcement dated 07 May 2024, 38 p.
  89. Zenith Minerals Limited. Maiden lithium minerals resource. Australian Securities Exchange (ASX) announcement dated 28 September 2023, 34 p.
  90. Widgie Nickel Limited. 375% growth in Faraday-Trainline lithium mineral resource. Australian Securities Exchange (ASX) announcement dated 08 November 2024, 34 p.
  91. Mount Farmer mine (Niobe prospect), Yalgoo Shire, Western Australia, Australia. Available online: https://www.mindat.org/loc-248995.html (accessed on 10 January 2025).
  92. King Tamba specialty metals project. Available online: https://www.ktaresources.com/king-tamba-speciality-metals-project/ (accessed on 10 January 2025).
  93. Thurston, P.C. Archean geology of Ontario: introduction. In Geology of Ontario; Thurston, P.C., Williams, H.R., Sutcliffe, R.H., Stott, G.M., Eds.; Ontario Geological Survey, Ministry of Northern Development and Mines: Toronto, Canada, 1991. [Google Scholar]
  94. Percival, J.A.; Sanborn-Barrie, M.; Skulski, T.; Stott, G.M.; Helmstaedt, H.; White, D.J. Tectonic evolution of the western Superior Province from NATMAP and Lithoprobe studies. Canadian Journal of Earth Sciences 2006, 43, 1085–1117. [Google Scholar] [CrossRef]
  95. Percival, J.A. Geology and metallogeny of the Superior Province, Canada. In Mineral deposits of Canada: a synthesis of major deposit-types, district metallogeny, the evolution of geological provinces, and exploration methods; Goodfellow, W.D., Ed.; Geological Association of Canada, Mineral Deposits Division, St. John's, Newfoundland, Canada, 2007; Special Publication 5, pp. 903–928.
  96. Bjorkman, K.E. 4D crust-mantle evolution of the Western Superior Craton: implications for Archaean granite-greenstone petrogenesis and geodynamics. Ph.D. Thesis, The University of Western Australia, Perth, Australia, 2017. [Google Scholar]
  97. Fyon, J.A.; Bennett, G.; Jackson, S.L.; Garland, M.I.; Easton, R.M. Thurston, P.C., Williams, H.R., Sutcliffe, R.H., Stott, G.M., Eds.; Metallogeny of the Proterozoic eon, northern Great Lakes region, Ontario. In Geology of Ontario; Special Volume 4, Part 2; Ontario Geological Survey, Ministry of Northern Development and Mines: Toronto, Canada, 1991; pp. 1177–1215. [Google Scholar]
  98. Easton, R.M.; Fyon, J.A. Thurston, P.C., Williams, H.R., Sutcliffe, R.H., Stott, G.M., Eds.; Metallogeny of the Grenville Province. In Geology of Ontario; Special Volume 4, Part 2; Ontario Geological Survey, Ministry of Northern Development and Mines: Toronto, Canada, 1991; pp. 1217–1252. [Google Scholar]
  99. Larbi, Y.; Stevenson, R.; Breaks, F.; Machado, N.; Gariépy, C. Age and isotopic composition of late Archean leucogranites: implications for continental collision in the western Superior Province. Canadian Journal of Earth Sciences 1999, 36, 495–510. [Google Scholar] [CrossRef]
  100. BBA E&C Inc. NI 43-101 technical report, pre-feasibility study for the PAK project, northwestern Ontario, Canada, Frontier Lithium Inc, 14 July 2023, 657 p.
  101. Micon International Limited. NI 43-101 technical report on the preliminary economic assessment of lithium hydroxide production, Separation Rapids lithium project, Kenora, Ontario, Avalon Advanced Materials Inc. Toronto, Ontario, Canada, 10 November 2016, 262 p.
  102. Frontier Lithium Inc. Frontier Lithium announces expansion of Spark deposit—18.8 Mt in indicated and 29.7 Mt in inferred categories. TSX Venture Exchange (TSXV) announcement dated 28 February 2023, 3 p.
  103. Green Technology Metals Limited. Prospectus. Australian Securities Exchange (ASX) announcement dated 08 November 2021, 305 p.
  104. AMC Mining Consultants (Canada) Limited. Technical report, Georgia Lake lithium project pre-feasibility study, RockTech Lithium Inc. Vancouver, British Columbia, Canada, 01 October 2022, 350 p.
  105. Critical Resources Limited. 8.0 Mt at 1.07% Li2O maiden mineral resource at Mavis Lake. Australian Securities Exchange (ASX) announcement dated 05 May 2023, 25 p.
  106. Hronsky, J.M.; Kreuzer, O.P. ; Applying spatial prospectivity mapping to exploration targeting: fundamental practical issues and suggested solutions for the future. Ore Geology Reviews 2019, 107, 647–653. [Google Scholar] [CrossRef]
  107. Nykänen, V.; Lahti, I.; Niiranen, T.; Korhonen, K. ; Receiver operating characteristics (ROC) as validation tool for prospectivity models—a magmatic Ni-Cu case study from the central Lapland greenstone belt, northern Finland. Ore Geology Reviews 2015, 71, 853–860. [Google Scholar] [CrossRef]
  108. Roshanravan, B.; Agajani, H.; Yousefi, M.; Kreuzer, O.P. Generation of a geochemical model to prospect podiform chromite deposits in North of Iran. Generation of a geochemical model to prospect podiform chromite deposits in North of Iran. In 80th EAGE Conference and Exhibition, Copenhagen, Denmark, 11-14 June 2018.
  109. Roshanravan, B.; Kreuzer, O.P.; Buckingham, A.; Keys, E. On data quality in mineral potential modelling: a case study using random forest and fractal techniques. In 84th EAGE Annual Conference & Exhibition, Vienna, Austria, 5-8 June 2023.
  110. Mihalasky, M.J.; Bonham-Carter, G.F. ; Lithodiversity and its spatial association with metallic mineral sites, Great Basin of Nevada. Natural Resources Research 2001, 10, 209–226. [Google Scholar] [CrossRef]
  111. Tsoukalas, L.H.; Uhrig, R.E. Fuzzy and Neural Approaches in Engineering; John Wiley & Sons: New York, USA, 1997. [Google Scholar]
  112. Nykänen, V.; Groves, D.I.; Ojala, V.J.; Eilu, P.; Gardoll, S.J. ; Reconnaissance-scale conceptual fuzzy-logic prospectivity modelling for iron oxide copper-gold deposits in the northern Fennoscandian Shield, Finland. Australian Journal of Earth Sciences 2008, 55, 25–38. [Google Scholar] [CrossRef]
  113. Karbalaei-Ramezanali, A.; Feizi, F.; Jafarirad, A.; Lotfi, M. ; Application of best-worst method and additive ratio assessment in mineral prospectivity mapping: a case study of vein-type copper mineralization in the Kuhsiah-e-Urmak Area, Iran. Ore Geology Reviews 2020, 117, 103268. [Google Scholar] [CrossRef]
  114. Feizi, F.; Karbalaei-Ramezanali, A.A.; Farhadi, S. ; FUCOM-MOORA and FUCOM-MOOSRA: new MCDM-based knowledge-driven procedures for mineral potential mapping in greenfields. SN Applied Sciences 2021, 3, 1–19. [Google Scholar] [CrossRef]
  115. Aryafar, A.; Roshanravan, B. BWM-SAW: a new hybrid MCDM technique for modeling of chromite potential in the Birjand district, east of Iran. Journal of Geochemical Exploration 2021, 231, 106876. [Google Scholar] [CrossRef]
  116. Riahi, S.; Fathianpour, N.; Tabatabaei, S.H. ; Improving the accuracy of detecting and ranking favorable porphyry copper prospects in the east of Sarcheshmeh copper mine region using a two-step sequential Fuzzy-Fuzzy TOPSIS integration approach. Journal of Asian Earth Sciences 2023, 10, 100166. [Google Scholar] [CrossRef]
  117. Rezaei, J. ; Best-worst multi-criteria decision-making method. Omega 2015, 53, 49–57. [Google Scholar] [CrossRef]
  118. Stević, Ž.; Pamučar, D.; Puška, A.; Chatterjee, P. Sustainable supplier selection in healthcare industries using a new MCDM method: measurement of alternatives and ranking according to COmpromise solution (MARCOS). Computers & Industrial Engineering 2020, 140, 106231. [Google Scholar]
  119. Roshanravan, B.; Aghajani, H.; Yousefi, M.; Kreuzer, O.P. ; An improved prediction-area plot for prospectivity analysis of mineral deposits. Natural Resources Research 2019, 28, 1089–1105. [Google Scholar] [CrossRef]
  120. Aryafar, A.; Roshanravan, B. Improved index overlay mineral potential modeling in brown- and green-fields exploration using 1324 geochemical, geological and remote sensing data. Earth Science Informatics 2020, 1–17. [Google Scholar]
  121. Carranza, E.J.M.; Laborte, A.G. Random forest predictive modeling of mineral prospectivity with small number of prospects and data with missing values in Abra (Philippines). Computers & Geosciences 2015, 74, 60–70. [Google Scholar]
  122. Rodriguez-Galiano, V.F.; Chica-Olmo, M.; Chica-Rivas, M. ; Predictive modelling of gold potential with the integration of multisource information based on random forest: a case study on the Rodalquilar area, Southern Spain. International Journal of Geographical Information Science 2014, 28, 1336–1354. [Google Scholar] [CrossRef]
  123. Sun, T.; Chen, F.; Zhong, L.; Liu, W.; Wang, Y. ; GIS-based mineral prospectivity mapping using machine learning methods: A case study from Tongling ore district, eastern China. Ore Geology Reviews 2019, 109, 26–49. [Google Scholar] [CrossRef]
  124. Xiang, J.; Xiao, K.; Carranza, E.J.M.; Chen, J.; Li, S. ; 3D mineral prospectivity mapping with random forests: a case study of Tongling, Anhui, China. Natural Resources Research 2020, 29, 395–414. [Google Scholar] [CrossRef]
  125. Zhang, S.; Carranza, E.J.M.; Xiao, K.; Wei, H.; Yang, F.; Chen, Z.; Xiang, J. ; Mineral prospectivity mapping based on isolation forest and random forest: implication for the existence of spatial signature of mineralization in outliers. Natural Resources Research 2022, 31, 1981–1999. [Google Scholar] [CrossRef]
  126. Parsa, M. ; A data augmentation approach to XGboost-based mineral potential mapping: an example of carbonate-hosted ZnPb mineral systems of Western Iran. Journal of Geochemical Exploration 2021, 228, 106811. [Google Scholar] [CrossRef]
  127. Bishop, C.M. Neural Networks for pattern recognition; Oxford University Press, United Kingdom: 1997.
  128. Hronsky, J.M.; Groves, D.I. ; Science of targeting: definition, strategies, targeting and performance measurement. Australian Journal of Earth Sciences 2008, 55, 3–12. [Google Scholar] [CrossRef]
  129. McCuaig, T.C.; Sherlock, R.L.; Exploration targeting. In Proceedings of Exploration 17: Sixth Decennial International Conference on Mineral Exploration, Toronto, Ontario, Canada, October 22-25, 2017, 75–82.
  130. Yang, F.; Zuo, R.; Kreuzer, O.P. Artificial intelligence for mineral exploration: A review and perspectives on future directions from data science. Earth-Science Reviews 2024, 104941. [Google Scholar] [CrossRef]
  131. Zuo, R.; Yang, F.; Cheng, Q.; Kreuzer, O.P. ; A novel data-knowledge dual-driven model coupling artificial intelligence with a mineral systems approach for mineral prospectivity mapping. Geology 2024. [Google Scholar] [CrossRef]
  132. Porwal, A.K.; Kreuzer, O.P. ; Introduction to the special issue: mineral prospectivity analysis and quantitative resource estimation. Ore Geology Reviews 2010, 38, 121–127. [Google Scholar] [CrossRef]
  133. Jaireth, S.; Huston, D. Metal endowment of cratons, terranes and districts: insights from a quantitative analysis of regions with giant and super-giant deposits. Ore Geology Reviews 2010, 38, 288–303. [Google Scholar] [CrossRef]
  134. Kreuzer, O.P.; Porwal, A.K.; Markwitz, V.; McCuaig, T.C. A continent-wide study of Australia’s uranium potential. In Proceedings of the Australian Uranium Conference, Fremantle, Australia, 22-23 July 2009. [Google Scholar]
  135. Roshanravan, B.; Kreuzer, O.P.; Mohammadi, S.; Bruce, M.; Davis, J.; Briggs, M. ; Cuckoo optimization algorithm for support vector regression potential analysis: an example from the Granites-Tanami Orogen, Australia. Journal of Geochemical Exploration 2021, 230, 106858. [Google Scholar] [CrossRef]
  136. Wilde, A.; Otto, A.; McCracken, S. Geology of the Goulamina spodumene pegmatite field, Mali. Ore Geology Reviews 2021, 134, 104162. [Google Scholar] [CrossRef]
  137. Salakjani. N.K. Extraction of lithium from spodumene. PhD Thesis, Murdoch University, Perth, Australia, September 2019.
  138. Hronsky, J.M. The exploration search space concept: key to a successful exploration strategy. Centre for Exploration Targeting (CET) Quarterly Newsletter 2009, 8, 14–15.
  139. Kidman Resources Limited. Review highlights Mt Holland’s outstanding lithium potential. Australian Securities Exchange (ASX) announcement dated 5 July 2016, 7 p.
  140. Kidman Resources Limited. Fast-tracking a world-class lithium resource in Western Australia. Australian Securities Exchange (ASX) announcement dated 25 May 2017, 23 p.
  141. Errawarra Resources Limited. Quarterly activities report for the period ending 31 December 2024. Australian Securities Exchange (ASX) announcement dated 30 January 2025, 17 p.
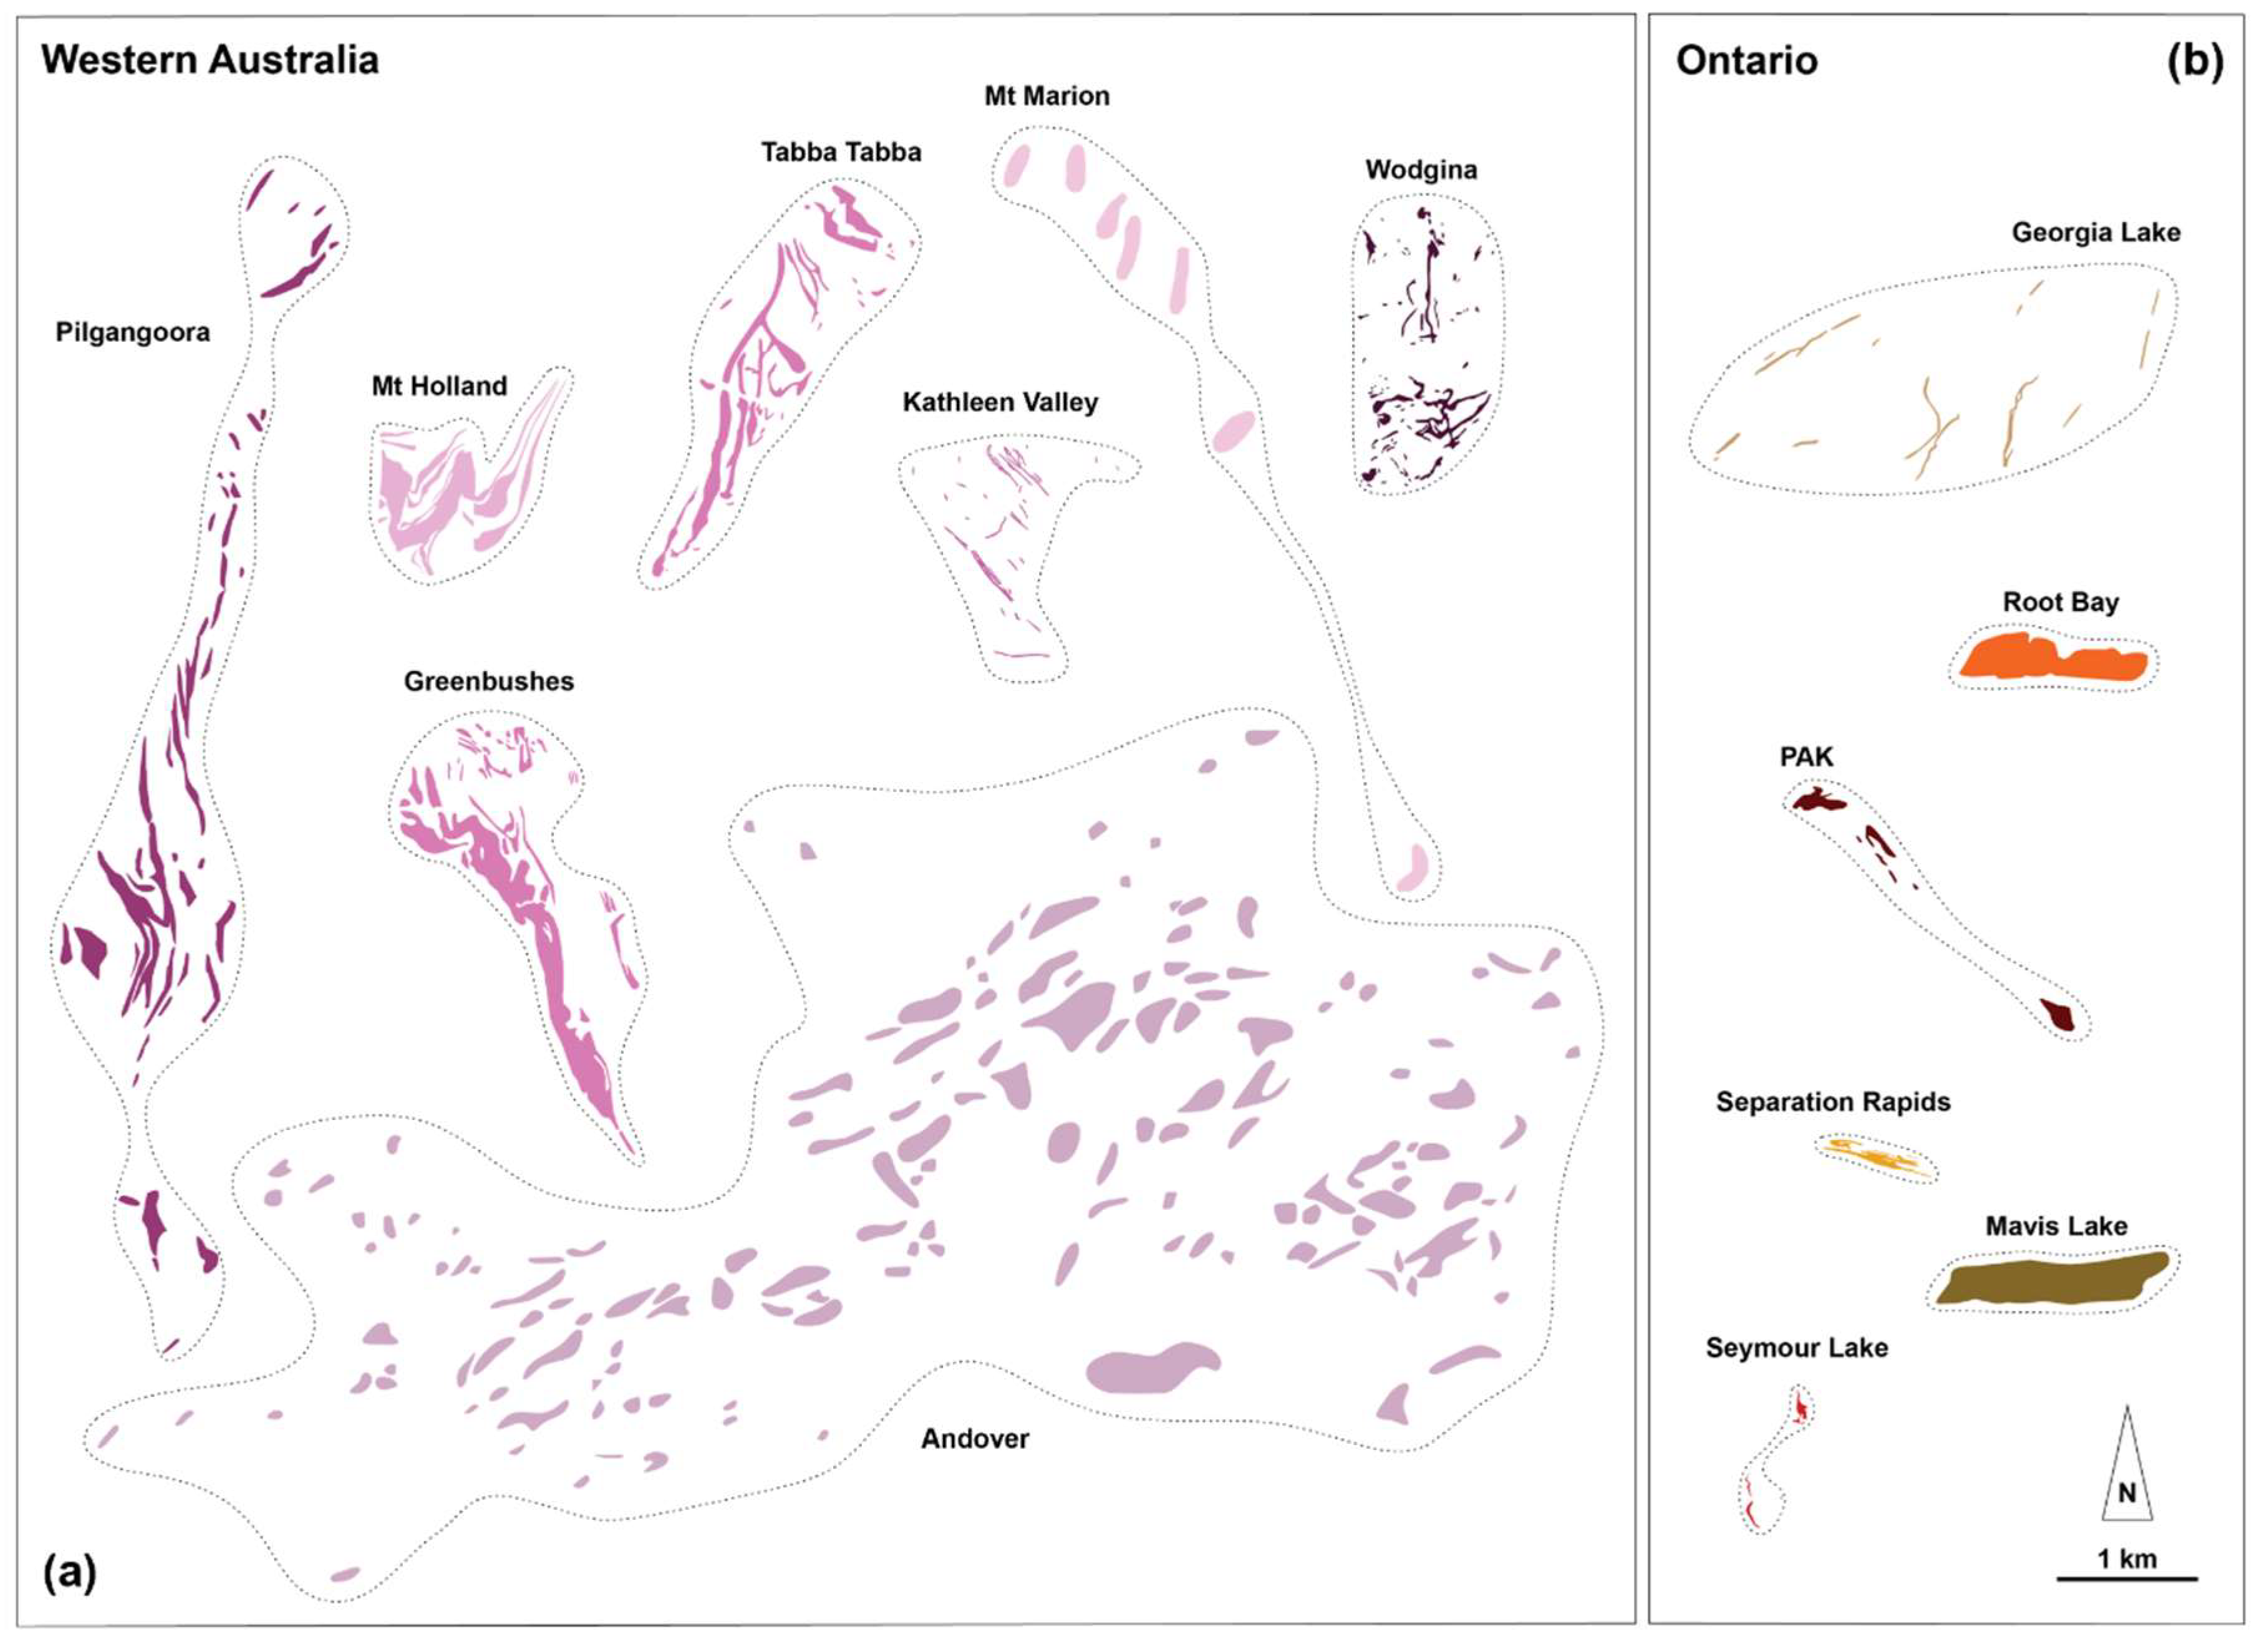
Figure 3. Summary of the classification of rare-element pegmatites [23].
Preprints 149132 g003
Figure 4. Regional zoning in fertile granite-pegmatite systems [18]. (a) Regional zonation of a fertile granite with an aureole of external pegmatites. (b) Schematic representation of regional zoning in a cogenetic granite-pegmatite system with the pegmatites increasingly fractionated with increasing distance from the parent granite.
Preprints 149132 g004
Figure 5. Two-dimensional (2D) footprints of the best-endowed LCT pegmatite camps in (a) Western Australia and (b) Ontario. The footprints are presented at the same scale, in plan view and orientated according to geographic north. Stippled lines provide approximate camp boundaries although, in many cases, the true extent of the LCT pegmatite systems has not been defined yet. Grade-tonnage and geological information as well as source references are provided in Table 1 and Table 2 and 4-5.
Preprints 149132 g005
Figure 6. Geological and lithium block models of the Tabba Tabba LCT pegmatite system, Pilbara Craton, Western Australia [8], illustrating, in 3D, the stacked nature and gently-dipping geometries that are typical of many Archean LCT pegmatites in Western Australian. (a) Isometric view of the current lithium resource envelope with plunge extents identified as targets for future exploration drilling. (b) Long section of the block model showing individual mineralised pegmatite domains. Mineralised blocks <1.0% Li2O are not shown to demonstrate continuity of thick high-grade mineralisation. (c) Cross Sections (>0.2% Li2O) through a plan view of a conceptual open pit at Leia (>0.45% Li2O).
Preprints 149132 g006
Figure 7. Wireframe model of the lithium mineralised Spark pegmatite, which forms part of the PAK LCT pegmatite system, Superior Craton, Ontario (see Table 5 for references). The 3D model serves to illustrate the vertical geometry of this pegmatite, which is typical of several of the well-mineralised Archean LCT pegmatites in Ontario, such as PAK and Separation Rapids.
Preprints 149132 g007
Figure 8. Map of lithium deposits and occurrences in the western and central Archean Yilgarn Craton and southern Proterozoic Gascoyne Complex, Western Australia. The map also shows the spatial distribution of potentially lithium fertile, fractionated felsic intrusions and greenstone host sequences. Most LCT pegmatites in the Yilgarn Craton were emplaced at ~2,650 to 2,600 Ma, contemporaneous with the low-Ca granites. The giant Greenbushes LCT pegmatite in the Southwest Terrane is dated at ~2,527 Ma and, therefore, postdates the low-Ca felsic igneous event. It lacks an apparent causative parental intrusion, was emplaced syntectonically into a regional-scale shear zone and is extensively deformed.
Preprints 149132 g008
Figure 9. Map of lithium deposits and occurrences in the Archean Pilbara Craton, Western Australia. The map also shows the spatial distribution of potentially lithium fertile, fractionated felsic intrusions and greenstone host sequences. Most of the fractionated intrusions form part of the ~2,850 to 2,830 Ma Split Rock Supersuite, which aligns along a broad north-northwest trend. Split Rock Supersuite intrusive rocks are believed to be genetically associated with the ~2,880 to 2,830 Ma LCT pegmatites at Wodgina, Pilgangoora and Tabba Tabba as well as other LCT pegmatite occurrences. No fractionated intrusions are known within a radius of 55 km from the Andover deposit, a highly significant, relatively recent discovery. However, Andover is located proximal to the Sholl Shear Zone, a regionally extensive, terrane-bounding fault zone.
Preprints 149132 g009
Figure 10. Map of lithium deposits and occurrences in the Archean Superior Craton of Ontario. There is good evidence in this part of the Superior Craton of a strong genetic link between peraluminous S-type magmas, represented by a suite of 2,680 to 2,640 Ma two-mica granites, and LCT pegmatite formation between ~2,670 and 2,640 Ma. Spatially, both two-mica granites and associated LCT pegmatites are concentrated within two broad, approximately east-west-trending lithostructural zones: The metasediment-dominant English River, Quetico and some of their adjacent terranes.
Preprints 149132 g010
Figure 11. Lithium potential maps, Western Australia. (a) Data-driven index overlay. (b) Fuzzy gamma. (c) Geometric average. (d) BMW-MARCOS. (e) Random forest.
Preprints 149132 g011aPreprints 149132 g011b
Figure 12. Lithium potential maps, Ontario. (a) Data-driven index overlay. (b) Fuzzy gamma. (c) Geometric average. (d) BMW-MARCOS. (e) Random forest.
Preprints 149132 g012aPreprints 149132 g012b
Figure 13. Maps illustrating the statistically verifiable proximity relationship between lithium and (a) gold and (b) nickel occurrences (Table 7 and Table 8).
Preprints 149132 g013
Figure 14. Map of the moderate to highest lithium potential of Western Australia (RF model), also illustrating newly identified lithium prospective domains in eastern Archean Yilgarn Craton and the Proterozoic southern Capricorn, Halls Creek and Paterson orogens.
Preprints 149132 g014
Figure 15. Map of the moderate to highest lithium potential of Ontario (RF model), also illustrating newly identified lithium prospective greenstone belts in the Archean Superior Craton and the Proterozoic Grenville Orogen.
Preprints 149132 g015
Figure 16. (a) Simplified map of part of the >300 km-long Southern Cross Greenstone Belt, Archean Yilgarn Craton, showing LCT pegmatite occurrences and deposits as well as >66,000 publicly recorded drillholes completed in the area, mostly focused on gold and nickel. The globally significant Mt Holland lithium deposit was only discovered in 2016, postdating most of the prior drilling. However, this drilling helped to quickly evaluate the deposit and district potential. (b) Simplified map of part of the >230 km-long Favorable Lake Greenstone Belt, Archean Superior Craton, showing LCT pegmatite occurrences and deposits as well as the <610 publicly recorded drillholes. Large segments, up to 45 km long, of the Favorable Lake Greenstone Belt have never been drilled. That is despite the Favorable Lake Greenstone Belt hosting the PAK deposit cluster, one of the largest and highest-grade hardrock lithium resources in North America.
Preprints 149132 g016aPreprints 149132 g016b
Figure 17. Example of a MPM (RF model) generated target in the Archean Pilbara Craton, referred to as Pinderi Hills. At the time of modelling, no LCT pegmatites were known to exist at Pinderi Hills, which is only ~32 km southwest of the globally significant Andover lithium deposit. Recent exploration work at Pinderi Hills has identified lithium and associated cesium, tantalum and niobium anomalism in rock chips, soils and stream sediments over large areas, which may point to the presence of a poorly outcropping LCT pegmatite swarm. Andover South is a recent LCT pegmatite discovery that postdates our MPM but falls within a domain of highest lithium potential.
Preprints 149132 g017
Table 1. LCT pegmatite lithium resources, Western Australia.
Project Province Ore (Mt) Grade (% Li2O) Li2O (kt) Status Owner
Greenbushes YC 445.5 1.48 6,547 Operating Albemarle / Tianqi / IGO
Pilgangoora PC 413.9 1.16 4,802 Operating Pilbara Minerals
Andover PC 240.0 1.50 3,600 Exploration SQM / Hancock Prospecting)
Mt Holland YC 186.0 1.53 2,846 Operating SQM / Wesfarmers
Wodgina PC 217.4 1.16 2,517 Operating Albemarle / Mineral Resources
Kathleen Valley YC 156.0 1.35 2,100 Operating Liontown Resources
Mt Marion YC 64.8 1.43 924 Operating Ganfeng / Mineral Resources
Tabba Tabba PC 74.1 1.00 740 Pre-feasibility Wildcat Resources
Manna YC 51.6 1.00 515 Pre-feasibility Global Lithium Resources
Bald Hill YC 26.5 0.97 256 Operating Lithco No. 2
Malinda GO 24.7 0.98 243 Exploration Delta Lithium
Marble Bar PC 18.0 1.00 180 Exploration Global Lithium Resources
Mt Ida YC 14.6 1.22 178 Exploration Delta Lithium
Mt Cattlin YC 13.3 1.29 172 Operating Arcadium Lithium
Buldania YC 15.0 0.97 145 Exploration Liontown Resources
Dome North YC 11.1 1.15 128 Scoping Develop Global
Split Rocks YC 11.9 0.72 86 Exploration Zenith Minerals
Mt Edwards YC 2.0 0.69 13 Exploration WIN Metals
Niobe YC 4.6 0.07 3 Exploration Aldoro Resources
King Tamba YC 5.0 0.05 3 Exploration Krakatoa Resources
Totals 1,996 25,998
All figures are rounded. All projects are LCT pegmatite-hosted. All resources are JORC 2012 compliant except for Mt Holland, which is CRIRSCO compliant. Tabba Tabba resource compiled from [7]. Manna resource compiled from [8]. Andover is a pre-resource stage discovery with a JORC 2012 compliant exploration target range of 100 to 240 Mt @ 1.0 to 1.5% Li2O for 1,000 to 3,600 kt Li2O [9] that was included here given its very significant size potential and exploration upside. All other resource figures compiled from [5]. Key to abbreviations: GO = Gascoyne Orogen (Proterozoic); PC = Pilbara Craton (Archean); YC = Yilgarn Craton (Archean).
Table 3. Data sources.
Repository Datasets Website URL
Geological Survey of Western Australia (GSWA)
Data and Software Centre Mines and mineral deposits (MINEDEX)
Mineral exploration reports (WAMEX)
Mineral systems atlas: Rare-element pegmatite systems
Open-file mineral exploration drillholes
Geochronology
Surface geochemistry
Field observations (WAROX)
Regolith, surface and interpreted bedrock geology
Tectonic units
Airborne geophysics (gravity, magnetics, radiometrics)
Multiscale edges from gravity and magnetics
Tenements
https://dasc.dmirs.wa.gov.au/
eBookshop Books, reports and maps https://dmpbookshop.eruditetechnologies.com.au/
Ontario Geological Survey (OGS)
OGSEarth Mines and mineral deposits (OMI)
Mineral exploration activity reports (OAFD)
Open-file mineral exploration drillholes (ODHD)
Geochronology
Surface geochemistry
Surface and interpreted bedrock geology
Airborne geophysics (gravity, magnetics)
Tenements
Books, reports and maps
https://www.geologyontario.mndm.gov.on.ca/ogsearth.html
Table 4. LCT pegmatite systems, Western Australia.
System Sub-Type Province Age Geology & Structure Mineralogy References
Pilgangoora LCT-AS PC Mesoarchean
(~2,879 Ma)
HR: basalt, dolerite, undifferentiated ultramafic rock; SC: shear zone corridor; SR: Kadgewarrina & Poocatche Monzogranite, Split Rock Supersuite; MG: upper greenschist to lower amphibolite facies spd, lpd, cot, cst, tlt, tap, brl [2,24,75]
Andover LCT-AS PC Mesoarchean HR: peridotite, dunite; SC: poorly defined and/or described but proximal to shear zone corridor; SR: no obvious causative intrusion; MG: upper greenschist to lower amphibolite facies spd, lpd, brl, cot, cst [9]
Wodgina LCT-A +
LCT-AS
PC Mesoarchean
(~2,829 Ma)
HR: komatiite (Wodgina), metasedimentary sequence (Mt Cassiterite); SC: shear zone corridor; SR: Numbana Monzogranite, Split Rock Supersuite; MG: upper greenschist to lower amphibolite facies cot, wod, Cs-brl, Li-mica, lit [2,24,67]
Tabba Tabba LCT-AS PC Mesoarchean
(~2,877 Ma)
HR: dolerite sill, siliciclastic rocks; SC: shear zone corridor, schistosity; SR: Split Rock Supersuite; MG: upper greenschist to lower amphibolite facies(?) spd, pet, Li-mica, brl, cot, cst, tlt [7,76]
Marble Bar LCT-AS(?) PC Mesoarchean HR: amphibolite, dolerite, basalt; SC: shear zone corridor; SR: Moolyella MonzograniteMt Edgar Batholith (Split Rock Supersuite); MG: upper greenschist to lower amphibolite facies(?) spd [77]
Greenbushes LCT-C-spd YC Neoarchean
(~2,527 Ma)
HR: amphibolite, ultramafic schist, granofels; SC: shear zone corridor; SR: no obvious causative intrusion; MG: upper amphibolite facies spd, brl, cot, cst, wod [2,24,60]
Mt Holland LCT-AS YC Neoarchean HR: komatiite, dolerite, basalt, andesite; SC: shear zone corridor, folding; SR: post-tectonic, low-Ca granite; MG: upper greenschist to lower amphibolite facies spd, pet [78]
Kathleen Valley LCT-C-spd YC Neoarchean HR: gabbro, basalt, conglomerate; SC: shear zone corridor; SR: post-tectonic, low-Ca granite(?); MG: upper greenschist to lower amphibolite facies spd, tlt, lpd [79,80]
Mt Marion LCT-AS +
LCT-C-spd
YC Neoarchean HR: amphibolite, serpentinite, ultramafic schist, basalt, carbonaceous black shale; SC: folding, shear zone corridor; SR: Depot Granodiorite; MG: lower amphibolite facies spd, cot, cst, brl, lpd [81-82]
Manna LCT-AS(?) YC Neoarchean HR: gabbro, basalt; SC: shear zone corridor; SR: Cardunia Granite; MG: lower to middle amphibolite facies(?) spd, lpd [83-84]
Bald Hill LCT-AS YC Neoarchean HR: schist, greywacke, granite; SC: schistosity, shear zone corridor; SR: post-tectonic, low-Ca granite(?); MG: upper greenschist to lower amphibolite facies spd, lpd, tlt [23]
Mt Ida LCT-AS(?) YC Neoarchean HR: anorthosite-leucogabbro; SC: shear zone corridor, folding; SR: post-tectonic, low-Ca Oberwyl Granite; MG: upper greenschist to lower amphibolite facies spd, lpd [85]
Mt Cattlin LCT-AS YC Neoarchean
(~2,625 Ma)
HR: intermediate to mafic volcanic rocks, dolerite, tonalite; SC: shear zone corridor; SR: post-tectonic, fractionated, low-Ca granite; MG: greenschist to amphibolite facies spd, cot, lpd, tlt, cst, tap, brl [23,86]
Buldania LCT-C-spd(?) YC Neoarchean HR: komatiite, basalt, dolerite, carbonaceous shale; SC: shear zone corridor; SR: post-tectonic, fractionated, low-Ca granite; MG: upper greenschist to middle amphibolite facies spd [87]
Dome North LCT-C-pet YC Neoarchean HR: komatiite, basalt, sedimentary rock sequence; SC: shear zone corridor; SR: Pioneer Monzogranite; MG: upper greenschist to lower amphibolite facies pol, pet, lpd, spd, lpd [88]
Split Rocks LCT-C-pet(?) YC Neoarchean HR: undifferentiated mafic rock; SC: shear zone corridor; SR: post-tectonic, fractionated, low-Ca granite(?); MG: lower amphibolite facies(?) euc, spd, pet, lpd [89]
Mt Edwards LCT-AS(?) YC Neoarchean HR: komatiite, basalt; SC: shear zone corridor; SR: post-tectonic, fractionated, low-Ca granite(?); MG: middle to upper amphibolite facies spd [90]
Niobe LCT-C-lpd(?) YC Neoarchean HR: gabbro; SC: poorly defined and/or described; SR: post-tectonic, fractionated, low-Ca Walganna Suite granite(?); MG: greenschist to amphibolite facies lpd, zwd, mic, brl, spd(?) [91]
King Tamba LCT-C-lpd(?) YC Neoarchean HR: dolerite, sedimentary schist; SC: shear zone corridor, folding; SR: post-tectonic, fractionated low-Ca Walganna Suite granite(?); MG: greenschist to amphibolite facies tap, tlt, cst, lpd, mic, zwd, brl [92]
Malinda LCT-AS(?) GO Neoproterozoic HR: volcano (mafic)-sedimentary sequence; SC: shear zone corridor, folding; SR: Thirty-Three Supersuite granite; MG: upper greenschist to lower amphibolite facies spd, lpd, pet, tlt, cst [74]
Key to abbreviations. Sub-Types: LCT-A = LCT albite pegmatite, LCT-AS = LCT albite-spodumene pegmatite, LCT-C-lpd = LCT complex pegmatite, lepidolite-type, LCT-C-pet = LCT complex pegmatite, petalite-type, LCT-C-spd = LCT complex pegmatite, spodumene-type. Province: GO = Gascoyne Orogen, PC = Pilbara Craton, YC = Yilgarn Craton. Geology & Structure: HR = host rock, MG = metamorphic grade, SC = structural control, SR = source rock. Mineralogy: brl = beryl; cot = columbite-tantalite; Cs = cesium; cst = cassiterite; euc = eucryptite; Li = lithium; lit = lithiophilite; lpd = lepidolite; mic = microlite; pet = petalite; pol = pollucite; spd = spodumene; tap = tapiolite; tlt = tantalite; wod = wodginite; zwd = zinnwaldite.
Table 6. LCT pegmatite targeting model adopted in this study.
Critical
Processes
Constituent
Processes
Targeting
Criteria
Targeting Elements
(Predictor Maps)
Source LCT pegmatites are products of extreme fractionation of granitic magmas and acquire most of their compositional attributes at source.
Their genesis requires a high degree of crustal melting to form fertile granitic magmas as a source for fluids, metals and energy to drive the mineral system.
The genetic link between LCT pegmatites and S-type or evolved I-type granitic magmas and their tectonic settings is well established.
Convergent plate margin settings.
Granite stocks, plutons or batholiths of S-type or evolved I-type affinity.
Proximity to fractionated granitic rock units.
Proximity to pegmatitic or pegmatite-bearing rock units.
Transport Granitic melts ascent into the upper crust along zones of structural weakness.
Upper crustal fault-fracture systems act as conduits for focusing large volumes of melts and fluids over short periods of time
First- and second-order fault systems.
High degree of crustal permeability.
Domains of greater density of Bouguer gravity breaks.
Proximity to Bouguer gravity breaks.
Domains of greater density of RTP magnetic breaks.
Domains of greater density of major crustal boundaries.
Proximity to faults and lineaments.
Trap Given their affinity with convergent plate margin settings and emplacement of source granites at midcrustal levels, LCT pegmatites cut and solidify in metamorphosed supra-crustal rocks. Metamorphosed terrains at greenschist to amphibolite facies grade. Proximity to metamorphic rocks.
LCT pegmatites have a distinct preference for mafic or ultramafic host rocks; likely a function of favorable physico-chemical parameters that serve to enhance trap and depositional processes. Mafic and ultramafic rock sequences. Proximity to mafic-ultramafic rocks.
LCT pegmatites have statistically valid abundance and proximity relationships
with gold and nickel occurrences; likely a function of loosely comparable transport and trap processes (this study).
Clusters of gold and/or nickel occurrences. Proximity to Au occurrences.
Proximity to Ni occurrences.
Deposition Extreme fractional crystallization of parental granitic magmas.
Concentration of incompatible rare elements and volatiles in residual LCT pegmatite melts.
LCT pegmatite melt solidification, magmatic-hydrothermal transition and rare metals mineralisation.
Confirmed LCT pegmatites.
Presence of indicator minerals (e.g., beryl, tourmaline or garnet in pegmatites or holmquistite in country rocks).
Lithogeochemical dispersion halos (e.g., Li, Rb, Cs) in country rocks.
Geochemical anomalism (e.g., Li, Cs, Ta).
Fractionation indicators (e.g., very low K/Rb, K/Cs, Nb/Ta or Mg/Li ratios).
Proximity to mapped pegmatites.
Proximity to LCT pegmatite indicator minerals.
Preservation Metasomatic alteration processes can result in selective to complete replacement of primary spodumene by secondary minerals (e.g., albite, cookeite or kaolinite). Sub-solidus hydrothermal alteration.
Post-magmatic hydrothermal activity.
Not mappable at the scale of this investigation.
Tectonic and/or climatic and erosional forces can have positive (e.g., LCT pegmatite exhumation) or negative (e.g., complete destruction of LCT pegmatites) effects. For example, topographic highs formed by outcropping, weathering-resistant LCT pegmatites.
Table 7. Statistical parameters of the spatial proxies used in the Western Australian lithium MPM.
Spatial Proxy Pr (%) Oa (%) Nd AUC ln(Nd)
Proximity to mapped pegmatites 86 14 6.14 0.95 1.82
Proximity to LCT pegmatite indicator minerals 84 16 5.25 0.92 1.66
Proximity to mafic-ultramafic rocks 78 22 3.55 0.94 1.27
Proximity to Au occurrences 76 24 3.17 0.84 1.15
Proximity to Ni occurrences 74 26 2.85 0.86 1.05
Proximity to fractionated granitic rock units 70 30 2.33 0.81 0.85
Proximity to pegmatitic or pegmatite-bearing rock units 69 31 2.23 0.84 0.80
Proximity to faults and lineaments 67 33 2.03 0.67 0.71
Domains of greater density of RTP magnetic breaks 65 35 1.86 0.66 0.62
Domains of greater density of Bouguer gravity breaks 63 37 1.70 0.66 0.53
Domains of greater density of major crustal boundaries 58 42 1.38 0.59 0.32
Proximity to metamorphic rocks 57 43 1.33 0.55 0.28
Key to abbreviations: Pr = prediction rate, Oa = prediction area, Nd = Pr/Oa, AUC = area under the receiver operating characteristic curve, ln(Nd) = weight.
Table 8. Statistical parameters of the spatial proxies used in the Ontarian lithium MPM.
Spatial Proxy Pr (%) Oa (%) Nd AUC ln(Nd)
Proximity to LCT pegmatite indicator minerals 89 11 8.09 0.96 2.09
Proximity to mapped pegmatites 87 13 6.69 0.94 1.90
Proximity to fractionated granitic rock units 86 14 6.14 0.94 1.82
Proximity to Au occurrences 69 31 2.23 0.76 0.80
Domains of greater density of major crustal boundaries 68 32 2.13 0.73 0.75
Proximity to mafic-ultramafic rocks 65 35 1.86 0.90 0.62
Proximity to Ni occurrences 68 32 2.13 0.78 0.75
Proximity to Bouguer gravity breaks 51 49 1.04 0.54 0.04
Key to abbreviations: See Table 7.
Table 9. BWM-MARCOS efficiency statistics for competent spatial proxies, Western Australia MPM.
Competent Spatial Proxies Parameters
Pm Pn 100-Pm 100-Pn TPr FPr Op
Proximity to mapped pegmatites (DC8) 86 49 14 51 0.86 0.49 0.37
Proximity to LCT pegmatite indicator minerals (DC10) 84 52 16 48 0.84 0.52 0.32
Proximity to mafic-ultramafic rocks (DC9) 78 50 22 50 0.78 0.50 0.28
Proximity to Au occurrences (DC11) 76 52 24 48 0.76 0.52 0.24
Proximity to Ni occurrences (DC12) 74 50 26 50 0.74 0.50 0.24
Proximity to pegmatitic or pegmatite-bearing rock units (DC7) 69 52 31 48 0.69 0.52 0.17
Proximity to fractionated granitic rock units (DC1) 70 53 30 47 0.70 0.53 0.17
Domains of greater density of RTP magnetic breaks (DC6) 65 50 35 50 0.65 0.50 0.15
Domains of greater density of Bouguer gravity breaks (DC5) 63 50 37 50 0.63 0.50 0.13
Proximity to faults and lineaments (DC4) 67 55 33 45 0.67 0.55 0.12
Proximity to metamorphic rocks (DC2) 57 47 43 53 0.57 0.47 0.10
Domains of greater density of major crustal boundaries (DC3) 58 49 42 51 0.58 0.49 0.09
Key to abbreviations: Pm = hits, Pn = false alarms, 100-Pm = misses, 100-Pn = correct rejections, TPr = true positive rate, FPr = false positive rate, Op = overall performance, DC = decision criterion.
Table 11. Improved P-A plot parameters for the Western Australian lithium potential models.
Fuzzy Gamma Geometric Average Index Overlay BWM-MARCOS RF
Pm (Hits) 65 64 87 89 97
Pn (False Alarms) 48 48 50 48 44
100-Pm (Misses) 35 36 13 11 3
100-Pn (Correct Rejection) 52 52 50 52 56
True Positive Rate (TPr) 0.65 0.64 0.87 0.89 0.97
False Positive Rate (FPr) 0.48 0.48 0.50 0.48 0.44
Overall Performance (Op) 0.17 0.16 0.37 0.41 0.53
Table 12. Improved P-A plot parameters for the Ontarian lithium potential models.
Fuzzy Gamma Geometric Average Index Overlay BWM-MARCOS RF
Pm (Hits) 74 75 91 88 98
Pn (False Alarms) 49 49 43 49 35
100-Pm (Misses) 26 25 9 12 2
100-Pn (Correct Rejection) 51 51 57 51 65
True Positive Rate (TPr) 0.74 0.75 0.91 0.88 0.98
False Positive Rate (FPr) 0.49 0.49 0.43 0.49 0.35
Overall Performance (Op) 0.25 0.26 0.48 0.39 0.63
Disclaimer/Publisher’s Note: The statements, opinions and data contained in all publications are solely those of the individual author(s) and contributor(s) and not of MDPI and/or the editor(s). MDPI and/or the editor(s) disclaim responsibility for any injury to people or property resulting from any ideas, methods, instructions or products referred to in the content.
Copyright: This open access article is published under a Creative Commons CC BY 4.0 license, which permit the free download, distribution, and reuse, provided that the author and preprint are cited in any reuse.
Prerpints.org logo

Preprints.org is a free preprint server supported by MDPI in Basel, Switzerland.

Subscribe

Disclaimer

Terms of Use

Privacy Policy

Privacy Settings

© 2025 MDPI (Basel, Switzerland) unless otherwise stated