Submitted:
11 February 2025
Posted:
12 February 2025
You are already at the latest version
Abstract
With the advancement of global digital transformation, data trading has become a pivotal element in value circulation and innovation among enterprises. In particular, pricing strategies in the industrial chain's data trading process critically influence the cooperation and market competitiveness of upstream and downstream enterprises. To address this issue, this study develops a B2B data transaction pricing model tailored to a single industry chain. The model incorporates factors such as data scarcity, encryption protection efforts, and market demand dynamics. By employing a Stackelberg dynamic model, the study systematically examines the pricing strategies of upstream and downstream enterprises under various incentive mechanisms and evaluates the impact of encryption protection efforts and incentive mechanism coefficients on the profitability of the industry chain. Experimental results reveal that introducing incentive mechanisms for downstream enterprises modestly increases the profits of both upstream and downstream entities. However, incentivizing upstream enterprises yields a multiplier effect, significantly boosting their profits while causing a slight decline in downstream enterprises' profitability.
Keywords:
data trading
; single industrial chain
; pricing strategy
; incentive mechanism
1. Introduction
With the rapid advancements in the Internet, IoT, and cloud computing technologies, data generation has exhibited unprecedented exponential growth. This trend is profoundly reshaping the structure and operational models of traditional industries, accelerating their transformation into intelligent and data-driven systems [1]. Today, for industries reliant on data flow, efficiently and reasonably pricing and trading data have become core challenges in the era of the digital economy [2]. Against this backdrop, the global data-trading market has emerged as a critical hub, linking upstream and downstream enterprises within industrial chains. However, due to the complexities of information asymmetry, privacy sensitivity, and data diversity, traditional commodity pricing theories prove inadequate for data-trading scenarios [3]. The value of data extends beyond supply-and-demand relationships, influenced by factors such as encryption-protection costs, data scarcity, and market demand fluctuations. In B2B data transactions, data pricing affects not only the economic interests of participants but also the value creation and distribution patterns of the entire industrial chain.
In the digital economy era, data is regarded as a key factor of production. Developing reasonable pricing mechanisms for data has become a pressing concern for both academia and industry [4]. Unlike traditional commodities, data possess unique attributes such as intangibility, replicability, and non-exclusivity, making their pricing mechanisms significantly more complex [5]. Zhang et al. [6] proposed a fundamental data-pricing framework based on supply-and-demand dynamics, highlighting the importance of considering the preferences of both suppliers and consumers, as well as the role of market structure in determining data value. However, unlike traditional commodities, data cannot achieve optimal pricing solely through supply-and-demand equilibrium, as they are influenced by additional variables. Liang et al. [7] further emphasized that data pricing is affected not only by market dynamics but also by data characteristics, complexity, and their practical value in specific scenarios. For instance, high-quality data with broad coverage and fast response times often command a premium in B2B markets. Furthermore, data pricing must account for their potential future value and the benefits of application across multiple scenarios. Surbakti et al. [8] demonstrated that the market value of data increases exponentially with their versatility.
With the growing importance of data privacy and security, encryption-protection measures have become a crucial determinant of data market value [9]. For highly sensitive data, robust encryption not only elevates market value but also enhances transaction security. Encryption technologies enable operations directly on encrypted data, allowing data processing without decryption and ensuring privacy and integrity during transmission and transactions. This is especially beneficial in multi-node and untrusted environments [10]. Selective encryption further optimizes processing efficiency by encrypting only sensitive data components, reducing computational and transmission overheads while preserving privacy protection in large-scale and real-time data transactions [11]. Integrating encryption with blockchain technology enhances the security and transparency of multi-source data transactions, ensuring secure data flow and traceability in complex, distributed scenarios [12]. Hybrid encryption techniques strike a balance between efficiency and security, providing a scalable solution for large-scale data transactions by protecting sensitive data during key exchanges and transmissions [13]. Additionally, encryption measures ensure compliance with international regulations, mitigating risks associated with cross-border data transactions [14].
While encryption-protection measures safeguard transaction security and data privacy, achieving efficient data circulation ultimately hinges on appropriate pricing. For instance, By constructing pricing models grounded in market mechanisms and transaction scenarios, researchers have examined the unique characteristics of data, incorporating risk costs and scenario-adjustment coefficients to refine data-pricing strategies[15]. Tian et al. [16] utilized the Shapley value from cooperative game theory to quantify the marginal contribution of data to machine-learning models. This approach evaluates data value based on its marginal return, promoting fair value distribution among transaction participants. Luo et al. [17] introduced a risk-averse game model, leveraging Stackelberg and Bertrand game theories to enhance pricing flexibility and accuracy amidst market uncertainties. Bin et al. [18] proposed a dynamic data-pricing model that integrates credit evaluations with pricing strategies, achieving dynamic pricing mechanisms and stabilizing market fluctuations. Their results indicate a 96% success rate in data transactions.
Despite these advancements, most studies emphasize static supply-and-demand relationships and game strategies, often overlooking the dynamic interactions between upstream and downstream entities in varying scenarios. Moreover, while encryption technologies ensure transaction security, their influence on pricing remains underexplored. Addressing these gaps, this paper develops a B2B data-transaction pricing model tailored to a single industrial chain. The model incorporates factors such as data scarcity, encryption-protection costs, and market demand dynamics, using a dynamic game approach to analyze complex interactions between upstream and downstream enterprises. By introducing incentive mechanisms and encryption-protection efforts, the study optimizes data-transaction decisions, maximizing data value and enhancing transaction efficiency.
2. Theoretical Analysis
To conduct research on B2B data-transaction pricing, it is essential to first clarify the theoretical concepts surrounding B2B data, including its definition, ownership relationships, and marketization. Additionally, the design of an allocation mechanism for B2B data property rights should be developed in alignment with the coordination and requirements of the industrial chain.
2.1. Definition of B2B Data
In 1988, Goodhue et al. [19] conducted research on enterprise data management, categorizing data into various types, including business, operational, analytical, and access data. From the perspective of data association, Deng et al. [20] proposed that B2B data resources can be grouped into three module sets: basic description, content description, and external links. However, due to the absence of a systematic definition and detailed description, the fundamental nature of B2B data and its ownership relationships remains unclear [21]. Subsequently, Xu et al. [22] and Li [23] provided a comprehensive analysis of the concept of data assets and their statistical accounting, which helped standardize and unify the definition of data.
2.2. Ownership of B2B Data
To clarify the relationships among data resources and ensure their effective development and utilization, defining property rights is essential [24]. Property rights encompass elements such as ownership, possession, management, and usufruct. Notably, data ownership can vary across different stages of the data lifecycle [24]. To address the issue of unclear ownership, both legal frameworks [25] and technological solutions [26] have been applied. Additionally, concepts such as joint construction, joint governance, and shared governance [27,28] have been introduced to navigate the complex, multi-level, and dynamic nature of data ownership relationships. Hu et al. [29] further categorized data-resource ownership-sharing relationships into three types—core-core members, core-non-core members, and non-core-non-core members—and conducted studies on governance models for these ownership structures.
2.3. Data Marketization
For a resource to be considered an asset, it must meet the criteria of clear ownership, scarcity, and the potential to generate economic benefits [30]. Ambiguous property rights and high transaction costs are key factors hindering the marketization of data as a production factor [31]. To address the operation mechanisms within the data ownership framework [32], Gao [33] introduced the theory of data production, offering a theoretical foundation for the allocation of data rights. This theory establishes an order of utilization, beginning with the original data producer, followed by the data set producer, and ultimately the data analyst. Furthermore, the rise of various trading platforms has significantly accelerated the marketization of data [34].
2.4. B2B Data Property Rights Allocation Under the Coordination of the Industrial Chain
Data marketization has significantly accelerated the growth of platform economies, reshaping supply chain collaboration. This, in turn, facilitates the empowerment of entities through data, optimizes data allocation, and further promotes marketization [35] (Figure 1).
2.4.1. B2B Data Participant Ownership Allocation
In B2B contexts, data ownership can belong to organizations [36], collectors [37], controllers [19], or even individuals [38]. Tang [39] argued that enterprises typically have limited ownership over cleaned datasets. Wen [40] introduced the concept of "push-data property rights" as a meta-framework for defining data ownership. Following this framework, data control rights are allocated to users, while data management rights are allocated to enterprises. These rights encompass relative possession, productive use, autonomy in business operations, and incremental income rights. The allocation of data property rights reflects the interplay between participation and control, which, when coordinated within the supply chain, contributes to the development of B2B data operational models.
2.4.2. B2B Data Operation Mode and Unified Property Configuration
An operational model combines established standards and rules to manage resource allocation and ensure smooth data flow. It serves as a mechanism for expressing property rights in market circulation and realizing the configuration of data as a production factor [41]. Kauremaa et al. [42] proposed a framework encompassing horizontal and vertical proprietary standards. Chen (2021) [43] advanced this idea by introducing a supply chain ecosystem defined as a "digital-service-product package," mapping the relationships among B2B data operations, property rights (Figure 2), and the rights boundaries of developers, operators, providers, and stakeholders [44].
Building on the governance principles of joint construction, joint governance, and shared ownership [45,46], we further refine the operational framework. The B2B operational mode [47] evolves into a three-dimensional model of data-revenue operations (Figure 3), designed to achieve openness [48], innovation [49], and profitability [42]. This model aligns with the structural industrial chain to unify B2B operational modes with data property allocation. It clarifies the multi-level, dynamic ownership mechanisms of data subjects and establishes a robust B2B data property allocation system.
2.4.3. Ownership Allocation and Relationships
Ownership allocation factors are represented symbolically by A, B, and C, with combinations such as AB, BC, and AC illustrating relationships of co-construction, co-governance, and shared ownership, respectively. These combinations encapsulate the operational dynamics and governance structures required for effective data marketization and collaborative supply chain coordination.
3. Transaction Parameter Description
Focusing on a single industry chain of B2B data as the research object, the data-trading process (Figure 4) involves the upstream industry generating datasets U that are transmitted through two distinct channels. A proportion (P1) of sensitive data is transmitted via Channel 1 to the downstream industry, requiring additional investment in encryption and protection efforts . In contrast, a proportion (P2) of non-sensitive data is transmitted via Channel 2, which does not require such protections. Ultimately, the downstream industry receives a dataset Dd that is a subset of the upstream data Du.
In this process, data flow is influenced by several factors, including data scarcity S, potential market demand Md, market sensitivity Ms to the value of the data, and the data discount rate . These factors collectively determine the efficiency, value, and dynamics of the data-trading process within the industry chain.
When analyzing the impact of data-encryption protection efforts and incentives on the profits of upstream and downstream industries under different market structures, we introduce a series of symbols to describe the parameters in the model, as shown in Table 1. First, represents the effort level of data-encryption protection, of which the value range is , used to quantify the participants’ input intensity. represents the degree of data discount, and the value range is , to evaluate the price loss of the data in the transaction process. represents the data acquisition cost, which reflects the cost incurred by the data provider in data collection, processing, and transmission. represents the potential market demand and measures the potential purchase intention and scale of the market demand for the data. The data-encryption protection cost coefficient is used to describe the sensitivity of the cost during the data-encryption process (i.e., how the data protection cost fluctuates with the level of protection effort). and represent the decision price of the data provider and demand side, respectively, reflecting the pricing strategy and game of both parties in the data transaction. is used to quantify the sensitivity of the market to the price fluctuations of data, but represents the scarcity of data, indicating the availability and scarcity of data in the market. represents the transaction proportion of sensitive data in the market, and the value range is ; it is used to quantify the proportion of sensitive data in overall market transactions. Finally, the incentive mechanism coefficient within a range describes the strong influence of the incentive mechanism on the behavior of all participants in the market.
To analyze the impact of data-encryption protection efforts and incentive mechanisms on the profits of upstream and downstream industries under different market structures, we introduce a set of symbols to define the model parameters, as detailed in Table 1:
These parameters form the basis for evaluating how encryption efforts, data-related costs, market demand, and incentive mechanisms influence the profitability and dynamics of data transactions in upstream and downstream industries under varying market structures.
4. Data Transaction Pricing Model
4.1. Model Description and Hypotheses
Hypothesis 1: The upstream and downstream entities within a single industry can fully access each other's pricing strategies and make informed decisions during the pricing game. For simplicity, sensitive data are assumed to be equivalent to non-sensitive data.
Hypothesis 2: The upstream data provider operates two distinct trading channels, one for sensitive data and the other for non-sensitive data. Data market demand, data discount rates, and data scarcity are key factors in this system. Encryption-protection efforts applied to sensitive data can significantly enhance data security, thereby reducing the discount requirements of the demand side. Based on these assumptions, the sensitive data demand function is , and the non-sensitive data demand function is .
Hypothesis 3: During data transactions between upstream and downstream industries, the cost of encryption protection for sensitive data is assumed to be borne by the downstream industry. The cost function is expressed as , where represents the level of encryption protection effort.
Hypothesis 4: The additional profits generated by the incentive mechanism are assumed to be funded by a third party. These funds are sourced independently, such as through government subsidies, financial support from industry associations, or specialized innovation incentive funds, rather than being deducted from transaction revenue or profits within the industrial chain.
4.2. Pricing Model Without Incentive Mechanism
Based on the above assumptions, we construct a Stackelberg model to analyze the data-transaction process between the upstream industry (data provider) and the downstream industry (data demander). In this model, the data provider acts as the leader, making its decision first. Subsequently, the data demander, as the follower, adjusts its corresponding decisions p and based on the provider's initial decision. The profit functions for the data provider and the data demander are expressed as follows:
Proposition 1: No incentive mechanism exists for bilateral transactions, and if the condition is satisfied, then the optimal decision satisfies (11), (12), and (13).
Evidence: Solve the Stackelberg equilibrium solution by reverse induction and find the first order derivative of parameters and in equation (4):
According to equation (4), the corresponding plug matrix is
As the negative determination condition of the matrix is , so that the optimal solution can be and , then the optimal reaction function sums of the downstream industry demand side are and . Subsequently, substitute and into the upstream industry data provider profit function:
when , profits are maximization and equilibrium:
Substitute into the optimal reaction functions and , and obtain
Joint (8), (9), and (10) are the solution to
4.3. Pricing Model of the Incentive Mechanism for Downstream Industries
In the game between the upstream industry-data provider and downstream industry-data demander, the cost of data-encryption protection is borne by the downstream industry; this may put the downstream industry at a disadvantage, especially when the market has high requirements for data security. To balance this disadvantage, we adjust the downstream benefit distribution by introducing an incentive mechanism coefficient, and at this time, the new downstream industry demand side profit function is .
Proposition 2: Adding an incentive mechanism to downstream industries, the optimal decision satisfies (19), (20), and (21).
Evidence: The reverse induction method is used to solve, and the downstream industry demand side profit function is taken as the first-order derivative of :
The second-order derivative is ; then, is a strictly concave function of , and the pricing strategy is unique.
Let , solution to
.
The downstream industry demand side profit function is taken the first-order derivative of .
The second-order derivative is ; then, is a strictly concave function of , and the pricing strategy is unique.
Let , solution to .
Substitute and into function and obtain
The upstream industry profit function is taken the first-order derivative of , that is, The second-order derivative is ; then, is a strictly concave function of . Let , solution to:
Finally, combine , and , obtain the optimal solution of three reaction functions:
Corollary 1: According to the calculation, obtain . When , , then,
Corollary 1 shows that when motivating downstream industries, the upstream industry usually increases pricing, while the downstream industry pricing remains unchanged, mainly because incentives increase the demand of downstream for upstream products and motivating upstream companies to increase earnings by raising prices. With the increase of the incentive coefficient, the downstream increasing demand for upstream data products, upstream enterprises further increase the price ( increases). This is because upstream enterprises see higher market demand and profit space and use their market pricing power to make more profit. Downstream enterprises, under competitive pressure to maintain market share and customer relations, choose not to adjust the price.
4.4. Pricing Model of the Incentive Mechanism for the Upstream Industry
Although high-quality data need to be provided, the upstream industry is often in a relatively weak position in the environment of fierce market competition, especially when the downstream industry is relatively strong. Downstream industries often have greater bargaining power and can demand lower prices or higher data discounts, thereby weakening the profits of upstream providers. In this context, the upstream industry profit function with the incentive mechanism is constructed as .
Proposition 3: An incentive mechanism is added to the upstream industry, and is satisfied, that is, the optimal decision meets (27), (28), and (29).
Evidence: The profit function of the incentive mechanism is as follows:
According to (3), (4), and (5), obtain the optimal reaction function sums of the downstream industry as and . Then, substitute into and obtain
The reverse induction method is used to solve, and the upstream industry provider profit function is taken as the first-order and second-order derivative of .
As , is a strictly concave function of . Let , solution to:
Simultaneously, , , and are obtained:
Corollary 2: When , , then, ,,,.
Corollary 2 shows that the continuous incentive for upstream industries will lead to higher pricing for both upstream and downstream industries, and the pricing further increases with the increase of the incentive coefficient. This is because motivating upstream industries is usually designed to enhance their data production and supply capacity; this directly increases the value of data and market demand, and therefore, they can make higher profits by increasing pricing. In the face of the price increase of upstream data, the purchase cost of downstream increases. For such industries to maintain their own profit margin and competitiveness, the pricing of their own products or services must be improved.
Additionally, the increase of incentive coefficient means that the upstream industry’s innovation ability will be significantly improved, which further increases the value of data in the market and makes the parties in data transactions more intense. This also greatly improves the pricing power of the upstream industry and promotes the pricing increase of the downstream industry through the transmission effect. This upward trend will be more significant with the increase in the incentive coefficient.
5. Numerical Simulation
Building on the above model, we can derive the behavioral patterns and pricing strategies of upstream and downstream industries in data trading under various market conditions and incentive mechanisms. To enhance the practical applicability of the results, we will perform a numerical simulation of the model parameters and analyze the optimal pricing decisions and profit variations for both parties. The parameters used in the simulation are detailed in Table 2, with values assigned based on actual market research data and theoretical assumptions to closely represent the dynamics of the pricing game in a real market environment.
Figure 5 illustrates the dynamic effects of data encryption protection efforts on the profits of upstream and downstream industries, as well as overall market profits, in the absence of an incentive mechanism. As the variable increases from 0 to 1, the upstream industry maintains consistent profitability, with profit values remaining stable above 60. This indicates that the upstream industry enjoys strong profitability and a relatively stable market position in the data trading process.
In contrast, the downstream industry's profitability is weaker, with profit values stabilizing around 55. This reflects its vulnerability and relative market disadvantage, particularly in absorbing the costs associated with data encryption protection.
The total profit curve exhibits a steady upward trend across the range of , suggesting that overall market profitability is primarily driven by the upstream industry's strong performance. In comparison, the downstream industry's profit has a relatively minor impact on the total market profit. This highlights the upstream industry's dominant role in supporting the market's overall economic gains.
Figure 6 and Figure 7 illustrate the varying effects of data-encryption protection efforts on the profits of upstream and downstream industries, as well as overall market benefits, under different incentive mechanisms.
In Figure 6, as the level of data-encryption protection efforts increases, the downstream industry's profit remains stable at approximately 60, while the upstream industry’s profit remains around 80 with a modest growth rate. This reflects a balanced but limited impact of encryption efforts on profits for both industries.
In contrast, Figure 7 shows a scenario with the same range of effort levels but with significantly different results. The upstream industry's profit increases sharply from approximately 180 to 200, while the downstream industry's profit remains stable at around 25. Compared to the non-incentive mechanism scenario, introducing an incentive mechanism targeted at the downstream industry results in an increase in overall market profits. However, this comes at the cost of slightly weakening the upstream industry's profitability. The downstream industry experiences only a marginal improvement in its profit levels, maintaining relative stability.
Conversely, when the incentive mechanism is directed toward the upstream industry, the results differ notably. While this negatively impacts the downstream industry's profits, the upstream industry's profits increase significantly, reaching nearly double the level observed under the non-incentive mechanism. This substantial growth in upstream profitability also drives an increase in overall market profits.
These findings suggest that under upstream-focused incentives, enhanced data-encryption protection efforts not only boost the upstream industry's profit levels but also contribute to the overall growth of market profits. This achieves the dual objectives of optimizing market efficiency and enhancing overall economic benefits.
Figure 8 and Figure 9 highlight the differentiated effects of varying incentive mechanism coefficients on the profits of stakeholders under two market structures: “upstream-downstream (incentive)” and “upstream (incentive)-downstream.”
In Figure 8, as the incentive mechanism coefficient increases from 0 to 0.9, the profits of all parties show an upward trend. Notably, the profit curves of the upstream and downstream industries gradually converge, reflecting a clear trend of synergistic development. This suggests that incentivizing downstream industries not only enhances the profitability of the upstream industry but also fosters steady growth in the downstream industry’s profits, thereby driving the collective advancement of the overall market.
In Figure 9, for the same range of incentive mechanism coefficients, the downstream industry’s profit remains stable at approximately 25. Meanwhile, the upstream industry’s profit exhibits significant non-linear growth, with a sharp increase beyond a coefficient of 0.7. This non-linear growth indicates that once the incentive mechanism coefficient surpasses a critical threshold, the benefits for the upstream industry expand rapidly, demonstrating high market-income elasticity. However, the downstream industry remains in a stable but low-profit state. This highlights the downstream industry's relative vulnerability in the “upstream (incentive)-downstream” market structure, where its development is heavily influenced by the upstream industry’s growth.
These results underline the importance of tailoring incentive mechanisms to promote balanced development. While upstream-focused incentives can drive significant growth in upstream profitability and market efficiency, they risk leaving the downstream industry in a weaker position unless complementary measures are implemented.
Figure 10 illustrates the dynamic changes in the profits of upstream and downstream industries under the combined influence of data-encryption protection efforts and the incentive mechanism coefficient, specifically when the downstream industry is incentivized. As both EE and λλ increase, the profits of both industries show an upward trend, but notable differences emerge in their relative profit levels.
The upstream industry experiences steady profit growth, starting at an initial value of 70 and reaching approximately 110. In contrast, the downstream industry begins with an initial profit of 50, peaking at around 95. While the introduction of the incentive mechanism enhances the downstream industry's profits, its growth rate aligns closely with that of the upstream industry.
These findings highlight that, under similar conditions, the upstream industry achieves greater profit accumulation due to its stronger market position and control over resources. Conversely, despite the downstream industry benefiting from incentives, its profit growth remains significantly constrained, reflecting the limitations imposed by its subordinate role in the market structure. This underscores the persistent imbalance in profit distribution between upstream and downstream industries, even with targeted interventions.
Figure 11 illustrates the dynamic changes in profits for upstream and downstream industries under the combined influence of data-encryption protection efforts and the incentive mechanism coefficient, specifically when the upstream industry is incentivized.
For upstream enterprises, profits exhibit exponential growth as both and λ increase. In the high-value ranges of these variables, profits surge dramatically, reaching nearly 1,000. This reflects the synergistic effect of the incentive mechanism and data-encryption protection, creating a clear multiplier impact. By strengthening data control and protection, upstream enterprises bolster their market position and significantly expand their profit potential.
In stark contrast, the downstream industry's profits show a substantial downward trend under the same conditions. Initially at 26, profits gradually decline to 16 as and λ increase. This indicates that while the incentive mechanism and encryption efforts generate significant profit growth for upstream enterprises, they simultaneously impose additional pressures on downstream enterprises, further constraining their profit margins.
This dynamic underscore a critical imbalance: although data-encryption protection enhances the overall security of data transactions, its benefits disproportionately favor upstream enterprises. These enterprises gain increased pricing power and market dominance, while downstream enterprises are unable to achieve corresponding profit growth. This highlights the downstream industry's vulnerability in scenarios where upstream-focused incentives and enhanced protection measures dominate the market structure.
6. Parameter Confirmatory Test
Table 3 presents a descriptive statistical analysis based on responses from 94 enterprises involved in related industries. The survey evaluates the perceived importance of key parameters such as data encryption protection, decision price, and the incentive mechanism. The statistical results for each parameter include the mean, standard deviation, rank, and minimum and maximum values, offering insights into the central tendencies and variability of each factor within the sample. This analysis provides a foundational understanding of the key factors influencing the data trading market.
Key Findings:
- High-Mean Parameters: Parameters such as data encryption protection cost, data encryption protection effort, and data acquisition cost have higher mean values, indicating their significant perceived importance among respondents. These factors play a critical role in market decision-making.
- Low-Variance Parameters: The selling price has the lowest standard deviation (0.986), suggesting that respondents have a consistent perception of its importance.
- High-Variance Parameters: Data scarcity shows a higher standard deviation (1.223), reflecting diverse opinions on its significance, likely due to varying situational factors affecting respondents' evaluations.
- Concentration of Ratings: Most responses cluster around values of 4 and 5, indicating that the majority of respondents regard these parameters as highly important in data transactions.
- This statistical analysis highlights the critical parameters and their perceived importance in the data trading market, providing a valuable reference for understanding industry trends and decision-making priorities.
Table 4 presents the Pearson correlation coefficient matrix for the data-trading market, quantifying the linear correlation strengths between various parameters. This matrix serves to identify potential synergies or independent relationships among factors, offering a quantitative foundation for a deeper understanding of how these parameters influence data-trading behaviors. By analyzing these correlations, the matrix provides insights into the interdependencies and interactions that shape decision-making and market dynamics.
Overall, most correlation coefficients between the parameters fall within the range of 0.4–0.6, indicating medium correlation. This suggests that while these factors exhibit a degree of interdependence in market decision-making, they also retain distinct characteristics. Notably, the correlation between data value sensitivity, data-encryption protection efforts, and the incentive mechanism coefficient with upstream and downstream pricing is significant, highlighting their critical influence on pricing strategies. These factors play a pivotal role in shaping and regulating prices in the data-trading market.
Key Observations:
-
Data-Encryption Protection Efforts and Pricing:
- ○
- The correlation coefficient between data-encryption protection efforts and upstream pricing is 0.437, and with downstream pricing, it is 0.419.
- ○
- This indicates that as data-encryption protection efforts increase, both upstream and downstream pricing tend to rise, particularly upstream.
- ○
- This relationship suggests that enhanced data-encryption measures improve data security and market confidence, thereby creating opportunities for higher premiums in data transactions.
-
Incentive Mechanism Coefficient and Pricing:
- ○
- The incentive mechanism coefficient shows a moderate positive correlation with upstream pricing (0.456) and downstream pricing (0.468).
- ○
- This reflects that incentive mechanisms encourage upstream data providers to adopt more active pricing strategies while also increasing the downstream demand side’s willingness to pay, thereby elevating the overall pricing levels in the market.
These findings emphasize the interplay between data protection measures, incentive mechanisms, and pricing strategies, underscoring their importance in driving market efficiency and value creation.
Figure 12 depicts the importance scores of data-encryption protection efforts and incentive mechanism coefficients as perceived by respondents, in relation to upstream and downstream pricing. The boxplot visually conveys the distribution of scores, illustrating the relative impact of these two factors on market pricing decisions. This analysis provides insights into the distinct roles of data protection and incentives in shaping pricing strategies.
Key Observations:
-
Data-Encryption Protection Efforts (Figure 12a):
- ○
-
The importance of data-encryption protection efforts in upstream pricing increases significantly with higher scores.
- ■
- When the encryption effort score is 1, the median upstream pricing score is 1.
- ■
- At a score of 5, the median upstream pricing score rises to 4.
- ■
- This indicates that high levels of encryption protection are crucial for increasing upstream pricing.
- ■
- For downstream pricing, the scoring trends for encryption efforts are similar but overall slightly lower.
- ■
- This reflects respondents' perception that encryption protection has a less pronounced role in the downstream market compared to upstream.
-
Incentive Mechanism Coefficient (Figure 12b):
- ○
-
The influence of the incentive mechanism coefficient on pricing also increases steadily with higher scores.
- ■
- As the incentive score increases from 1 to 5, the median upstream pricing score rises from 3.5 to 5.
- ■
- For downstream pricing, the median score increases from 3.5 to nearly 4.
- ■
- This suggests that while the incentive mechanism positively affects both upstream and downstream pricing, its impact is more significant for upstream pricing.
Summary:
Overall, data-encryption protection efforts are perceived to have greater importance for upstream pricing, while incentives play a relatively smaller but still significant role in downstream pricing. These findings underscore the differential impact of these factors on market positioning, highlighting their strategic importance in pricing decisions for upstream and downstream market segments.
7. Conclusion
This study has reached the following conclusions:
-
Impact of Incentive Mechanisms on Pricing Strategies:The introduction of incentive mechanisms significantly influences the pricing strategies of upstream and downstream industries. While incentives applied to both upstream and downstream industries enhance overall profitability, the effects differ based on their position in the industrial chain:
- ○
- Incentives targeting the downstream industry promote steady and sustainable growth in overall market profits.
- ○
- Incentives directed at the upstream industry lead to non-linear amplification of upstream profits but constrain downstream profitability, creating an imbalance in profit distribution.
-
Pricing Behavior Under Different Incentive Scenarios:
- ○
- When incentives are applied exclusively to the downstream industry, both upstream and downstream enterprises tend to maximize profits by increasing their pricing.
- ○
- In contrast, when only the upstream industry is incentivized, upstream enterprises prefer to raise prices to capitalize on their strengthened market position. Meanwhile, downstream enterprises often maintain stable pricing to retain market share and competitiveness, mitigating the impact of upstream price increases and fluctuations in market demand.
- Effect of Data-Encryption Protection:Strengthened data-encryption protection significantly enhances the value and security of upstream enterprises' data, granting them greater market dominance and increased pricing power. However, this creates added capital pressures for downstream enterprises due to the higher costs associated with encryption protection. As a result, downstream enterprises face limited flexibility in adjusting their pricing strategies, further accentuating the disparity in market dynamics between the two segments.
Author Contributions
W.Z. designed the ideas, frameworks, and approach, and edited the draft of the manuscript. H.Y. edited the draft of the manuscript and M.C.W. contributed to the modification of the manuscript. All authors have read and agreed to the published version of the manuscript.
Funding
This research was supported by National Social Science Foundation (No. 22BGL007), from the National Office for Philosophy and Social Sciences of China.
Informed Consent Statement
All subjects gave their informed consent for inclusion before they participated in the study.
Data Availability Statement
The original contributions presented in the study are included in the article/supplementary material, and further inquiries can be directed to the corresponding author.
Acknowledgments
The authors would like to thank the reviewers and editors for improving this manuscript.
Conflicts of Interest
The authors declare no conflicts of interest.
Ethics approval and consent to participate: The study has been confirmed that does not involve personal privacy and other issues, nor does it involve personal ethics by the ethics committee of School of Internet Economics and Business o Fujian University of Technology.
References
- Xiang, X.; Mofei, Z.; Tao, L.; et al. Data Factor and Enterprise Innovation: The perspective of R & D competition. Economic Research 2023, 58, 39–56. [Google Scholar]
- Pei, J. A Survey on Data Pricing: From Economics to Data Science. IEEE Transactions on Knowledge and Data Engineering 2022, 34, 4586–4608. [Google Scholar] [CrossRef]
- Shen, Y.C.; Guo, B.; Shen, Y.; et al. A Pricing Model for Big Personal Data. Tsinghua Science and Technology 2016, 21, 482–490. [Google Scholar] [CrossRef]
- Hao, J.; Deng, Z.Y.; Li, J.P. The evolution of data pricing: From economics to computational intelligence. Heliyon 2023, 9. [Google Scholar] [CrossRef] [PubMed]
- Zhang, M.; Lu, X.; Wu, Y. Data Factor Economics: Characteristics, Right Confirmation, Pricing and Transaction. The Economist 2024, 35–44. [Google Scholar]
- Zhang, M.X.; Beltrán, F.; Liu, J.M. A Survey of Data Pricing for Data Marketplaces. IEEE Transactions on Big Data 2023, 9, 1038–1056. [Google Scholar] [CrossRef]
- Liang, J.; Yuan, C.H. Data Price Determinants Based on a Hedonic Pricing Model. Big Data Research 2021, 25, 100249. [Google Scholar] [CrossRef]
- Surbakti, F.P.S.; Wang, W.; Indulska, M.; et al. Factors influencing effective use of big data: A research framework. Information & Management 2020, 57, 103146. [Google Scholar]
- Thenmozhi, R.; Shridevi, S.; Mohanty, S.N.; et al. Attribute-Based Adaptive Homomorphic Encryption for Big Data Security. Big Data 2021. [Google Scholar] [CrossRef]
- Jin b Jiang, D.S.; Xiong, J.B.; et al. D2D Data Privacy Protection Mechanism Based on Reliability and Homomorphic Encryption. IEEE Access, 2018, 6, 51140–51150. [Google Scholar]
- Qiu, H.; Qiu, M.K.; Liu, M.Q.; et al. Lightweight Selective Encryption for Social Data Protection Based on EBCOT Coding. Ieee Transactions on Computational Social Systems, 2020, 7, 205–214. [Google Scholar] [CrossRef]
- Xuz, *!!! REPLACE !!!*; Caos, X. Multi-Source Data Privacy Protection Method Based on Homomorphic Encryption and Blockchain. Cmes-Computer Modeling in Engineering & Sciences, 2023, 136, 861–881. [Google Scholar]
- PINGH Network Information Security Data Protection Based on Data Encryption Technology. Wireless Personal Communications, 2022, 126, 2719–2729. [CrossRef]
- Liu, Y.; Yang, C.S.; Liu, Q.; et al. PDPHE: Personal Data Protection for Trans-Border Transmission Based on Homomorphic Encryption. Electronics, 2024, 13, 1959. [Google Scholar] [CrossRef]
- Zhang, Y. Pricing model of data elements based on market mechanism and transaction scenario. Social Scientist 2023, 72-6+84. [Google Scholar]
- Tian, Y.J.; Ding, Y.R.; Fu, S.J.; et al. Data Boundary and Data Pricing Based on the Shapley Value. IEEE Access, 2022, 10, 14288–14300. [Google Scholar] [CrossRef]
- Luos, Z.; Xingl, N. Neutrosophic game pricing methods with risk aversion for pricing of data products. Expert Systems 2021, 38. [Google Scholar]
- Bin, Z.; Jiqun, Z.; Wei, C.; et al. A dynamic evaluation model of data price based on game theory. Peer-to-Peer Networking and Applications, 2023, 16, 2073–2088. [Google Scholar] [CrossRef]
- Goodhue, D.L.; Quillard, J.A.; Rockart, J.F. Managing the data resource: A contingency perspective. MIS quarterly 1988, 373–392. [Google Scholar] [CrossRef]
- Deng, L.; Li, C. Research on Similarity Calculation Method for Associated Data Resource Set. Information studies: Theory & Application, 2012, 35, 112–116. [Google Scholar]
- Wang, Y.; Cai, S. Towards a Big Data Model for Social Media Platform. Journal of Management, 2018, 15, 1064–1071. [Google Scholar]
- Xu, X.; Zhang, Z.; Hu, Y. Research on Deriving Measures of Data Assets in National Accounts. Journal of Management World, 2022, 38, 16–30 + 2. [Google Scholar]
- Li, J. Research on Reconding Data Asset in National Accounts. Statistical Research, 2020, 37, 3–14. [Google Scholar]
- Duan, Z.; Wu, Y. Property Right Structure and System Construction of Big Data Resources. E-government 2017, 23–30. [Google Scholar]
- Zhou, P. The Boundary of Practice and Deconstruction for Right and Interest on Data Transaction. Electronic Intellectual Property Rights 2020, 67–77. [Google Scholar]
- Guo, Q.; Wang, B.; Tian, N.; Sun, H.; Wen, B. Data Transactions in Energy Internet: Architecture and Key Technologies. Journal of Electrical Technology, 2020, 35, 2285–2295. [Google Scholar]
- Zhu, G. China's new Governance Concept in the Process of Comprehensively Deepening Reform. Social Sciences of China 2017, 27–39. [Google Scholar]
- Fang, J. Xi Jinping Thought on Socialism with Chinese Characteristics for a New Era. Comparison of economic and social systems 2019, 1–8. [Google Scholar]
- Hu, Y.; Gao, C.; Zhang, S. Data Resources Sharing Relationship and Modeling Analysis in Big Data Alliance. Information studies: Theory & Application 2018, 28–33. [Google Scholar]
- Mu, Y.; Wang, W.; Zhao, Y.; et al. Research on the Status Quo, Problems and Countermeasures of Asset Management of Data Resources in China. E-government 2017, 66–74. [Google Scholar]
- Yangdong. The Marketization of Data Elements Reinforces the Government Governance Model. Peoples Forum, 2020, 12, 60–62. [Google Scholar]
- Koutris, P.; Upadhyaya, P.; Balazinska, M.; et al. Query-based Data Oricing. Journal of the ACM, 2015, 62, 43. [Google Scholar] [CrossRef]
- Gao, F. Data production theory —— Basic theory of data resource rights allocation. SJTU Law Review 2019, 5–19. [Google Scholar]
- Lee, S.-H.; Wenpiety. Research on the Profit Models of Big Data Transaction in China. Journal of Intelligence, 2020, 39, 180–186 + 179. [Google Scholar]
- Chen, G.; Ren, M.; Wei, Q.; Guo, X.; Yi, C. Data-Intelligence Empowerment: A New Leap of Information Systems Research. Journal of Management World, 2022, 38, 180–196. [Google Scholar]
- Culliton, B.J. Authorship, data ownership examined. Science, 1988, 242, 658–659. [Google Scholar] [CrossRef]
- Singh, P.J.; Vipra, J. Economic Rights Over Data: A Framework for Community Data Ownership. Development, 2019, 62, 53–57. [Google Scholar] [CrossRef]
- McGuire, A.L.; Roberts, J.; Aas, S.; et al. Who Owns the Data in a Medical Information Commons? The Journal of Law, Medicine & Ethics, 2019, 47, 62–69. [Google Scholar]
- Qi, T. Study on the Property Right Issues in Big Data Trade. Library and Information 2016, 38–45. [Google Scholar]
- Wen, Y. Paradigm Shift, Concept Selection and the Owner of Data Rights Establishment. Journal of Northeast Normal University (Philosophy and Social Sciences), 2019, 69–78. [Google Scholar]
- Hong, Y. Realizing the Reform of Market-oriented Allocation of Factors. The Economist, 2020, 2, 5–14. [Google Scholar]
- Kauremaa, J.; Tanskanen, K. Designing interorganizational information systems for supply chain integration: A framework. The International Journal of Logistics Management, 2016, 27, 71–94. [Google Scholar] [CrossRef]
- Chen, J.; Liu, Y. Operation Management Innovation Enabled by Digitalization and Intellectualization: From Supply Chain to Supply Chain Ecosystem. Journal of Management World 2021, 37, 227–240. [Google Scholar]
- Jiang, J. Cultivate and Develop the Difficult Problems and Legal Response of the Data Element Market. Library and Information 2020, 3, 22–24. [Google Scholar]
- Yan, X.; Li, X. A Study on the Governance Concept of Socialism with Chinese Characteristics. Research on Socialism with Chinese Characteristics 2014, 5, 27–31. [Google Scholar]
- Kang, X. The theoretical characteristics of Xi Jinpings modern national governance view. Studies on Marxism 2016, 10, 59–65. [Google Scholar]
- Hong, I.B. A new framework for interorganizational systems based on the linkage of participants roles. Information & Management 2002, 39, 261–270. [Google Scholar]
- Immonen, A.; Ovaska, E.; Paaso, T. Towards certified open data in digital service ecosystems. Software Quality Journal 2018, 26, 1257–1297. [Google Scholar] [CrossRef]
- Majchrzak, A.; Markus, M.L.; Wareham, J. Designing for Digital Transformation: Lessons for Information Systems Research from the Study of ICT and Societal Challenges. MIS Quarterly 2016, 40, 267–277. [Google Scholar] [CrossRef]
Figure 1.
Relationship diagram.
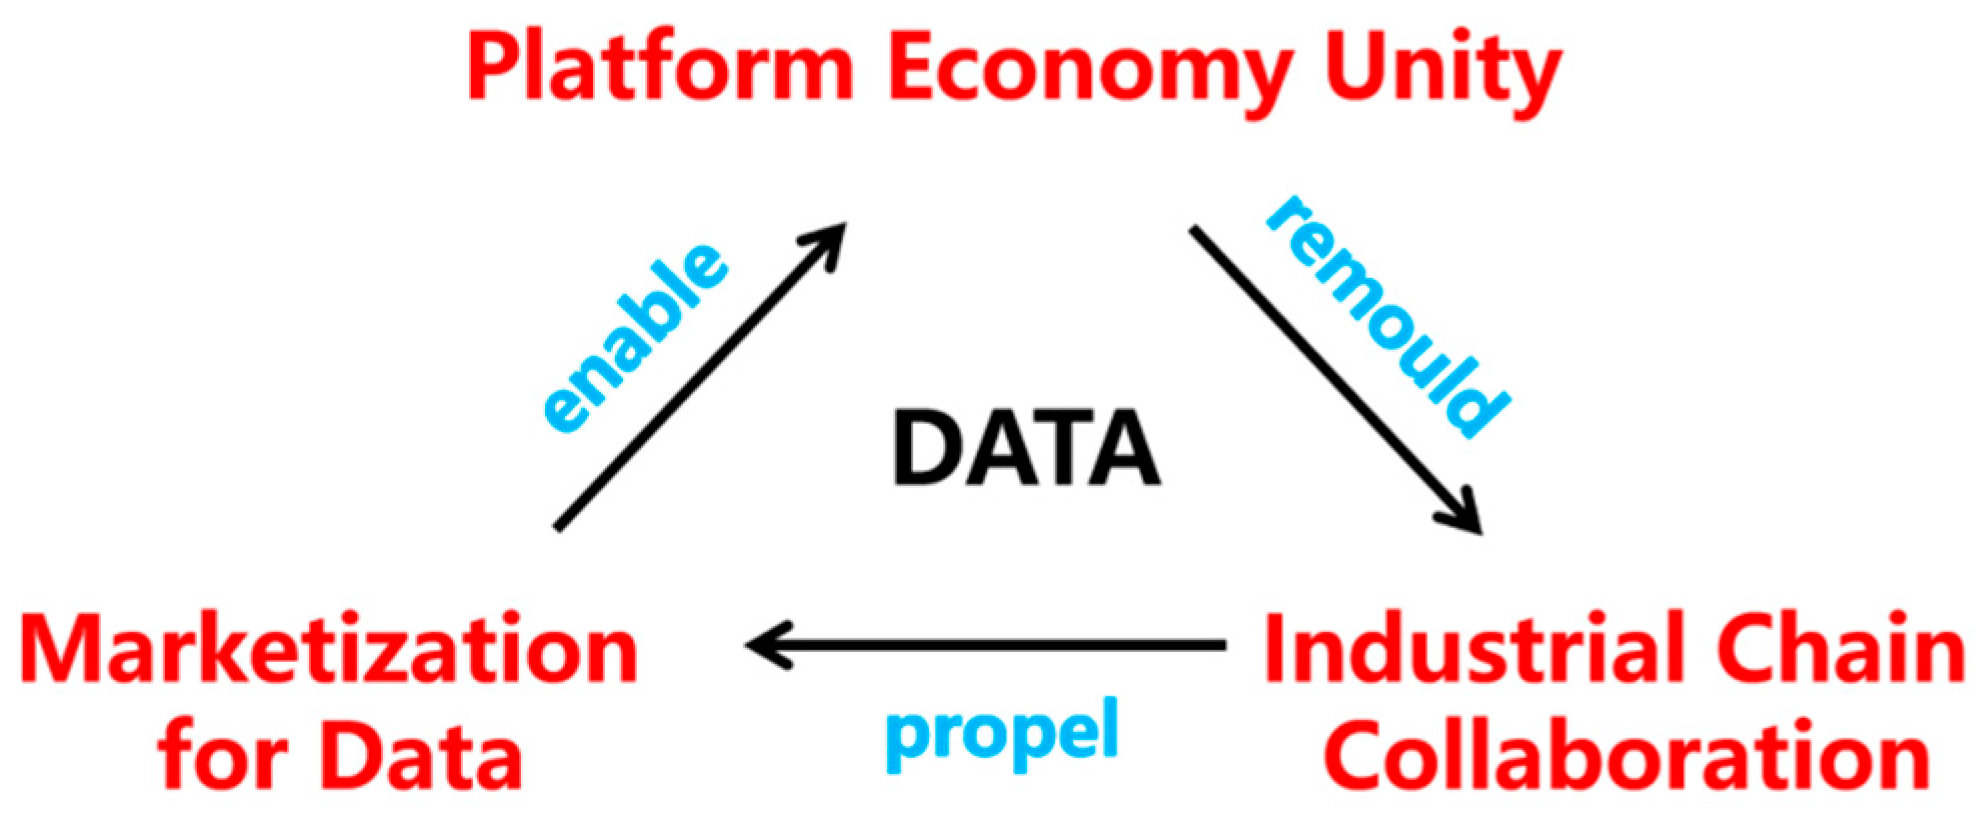
Figure 2.
B2B Triangle mapping framework of data operation and data ownership.
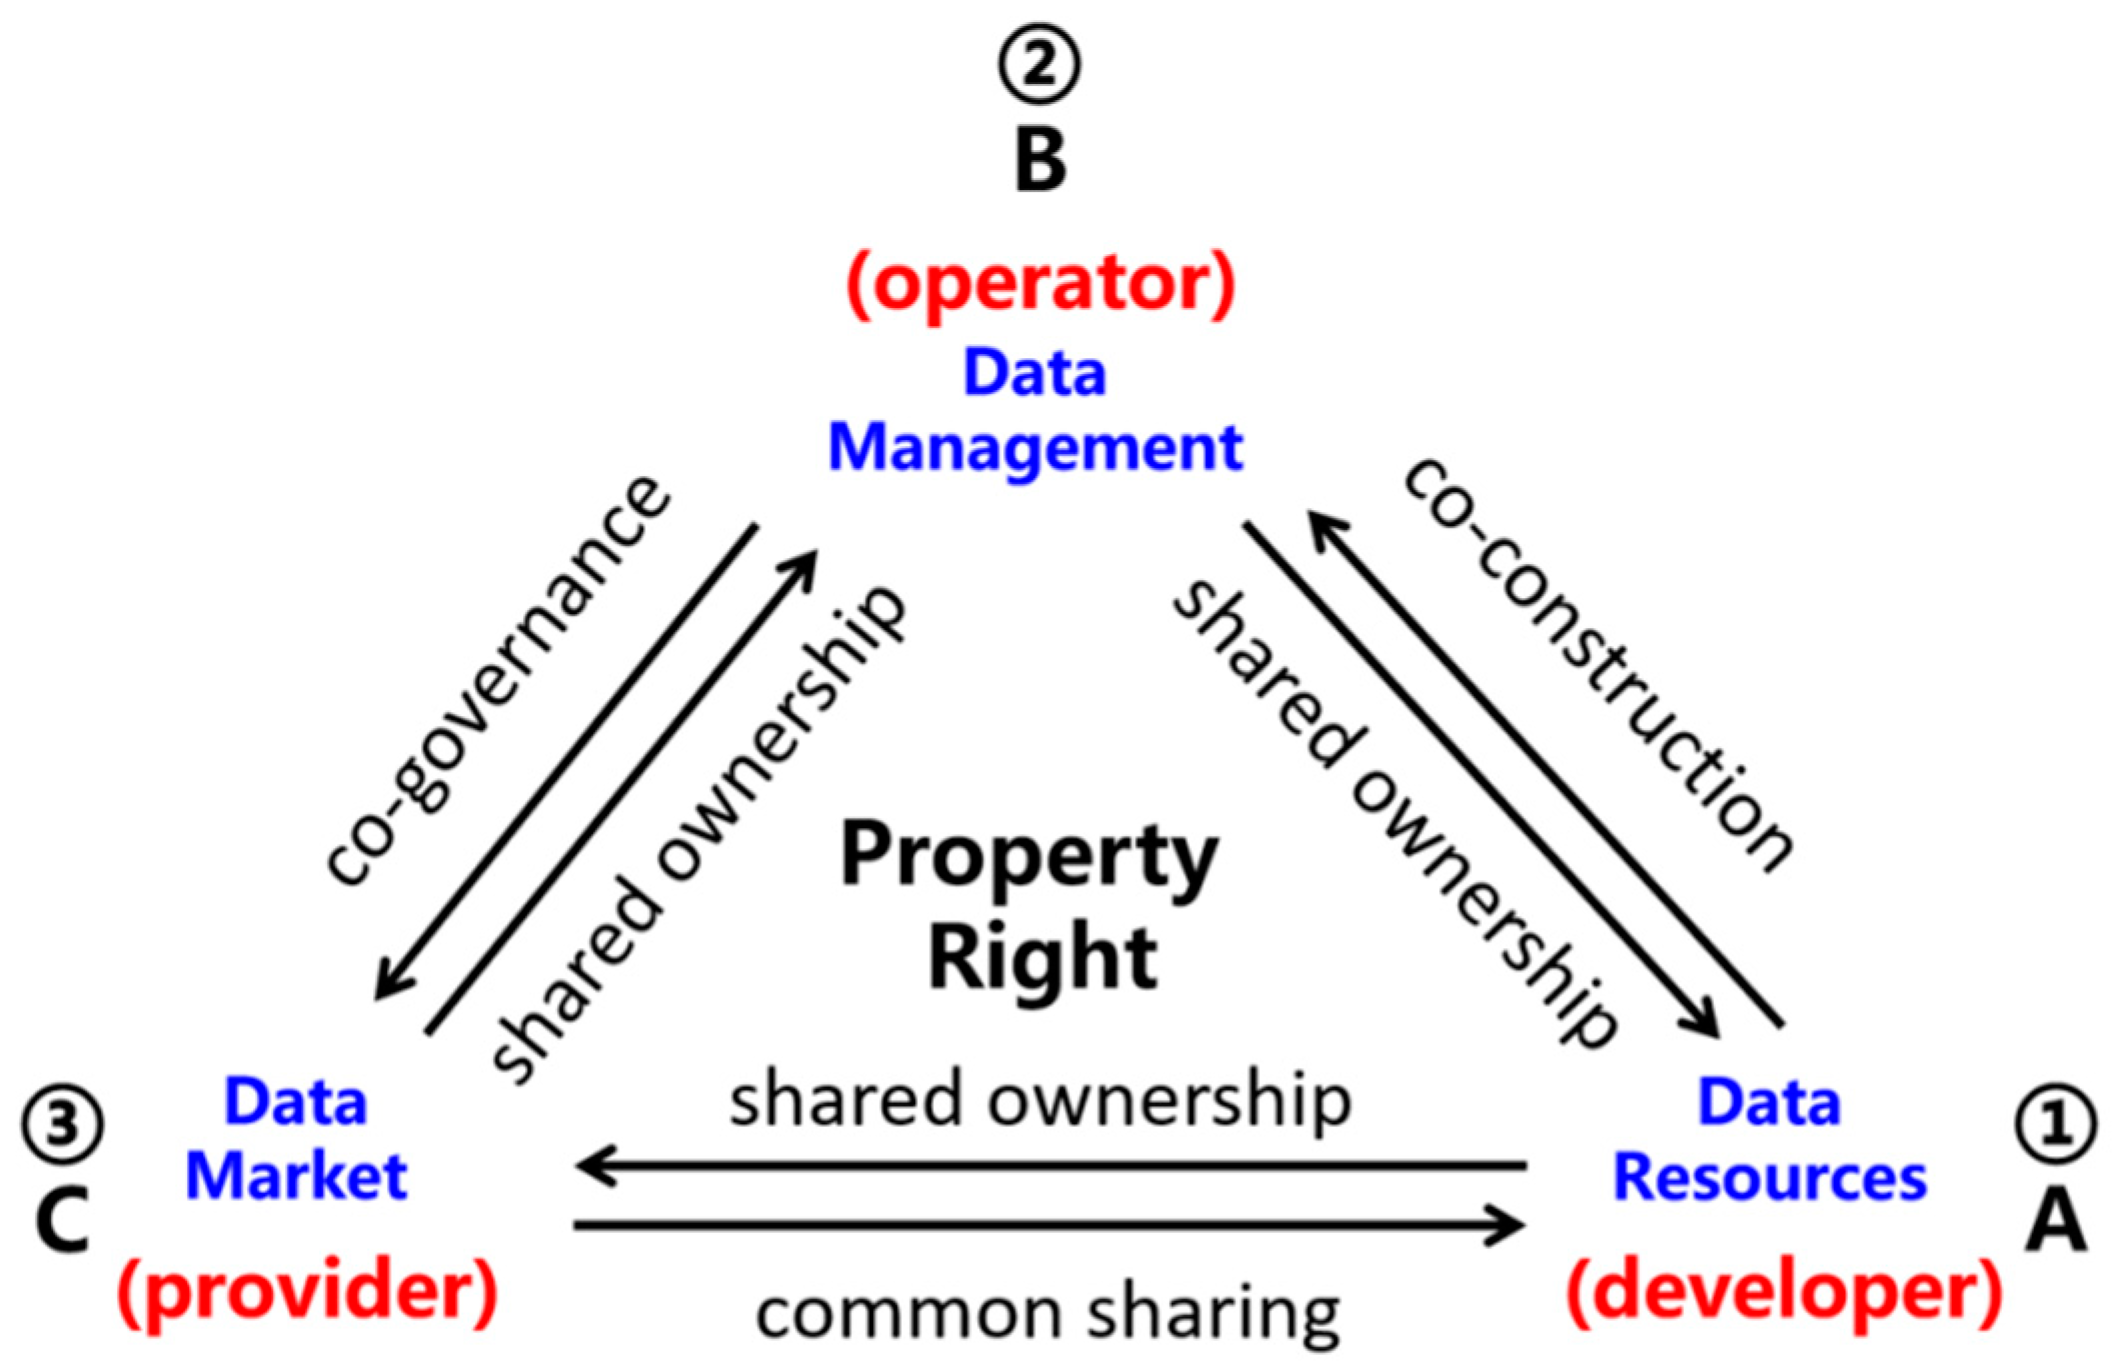
Figure 3.
B2B data revenue operation mode for industrial chain collaboration.
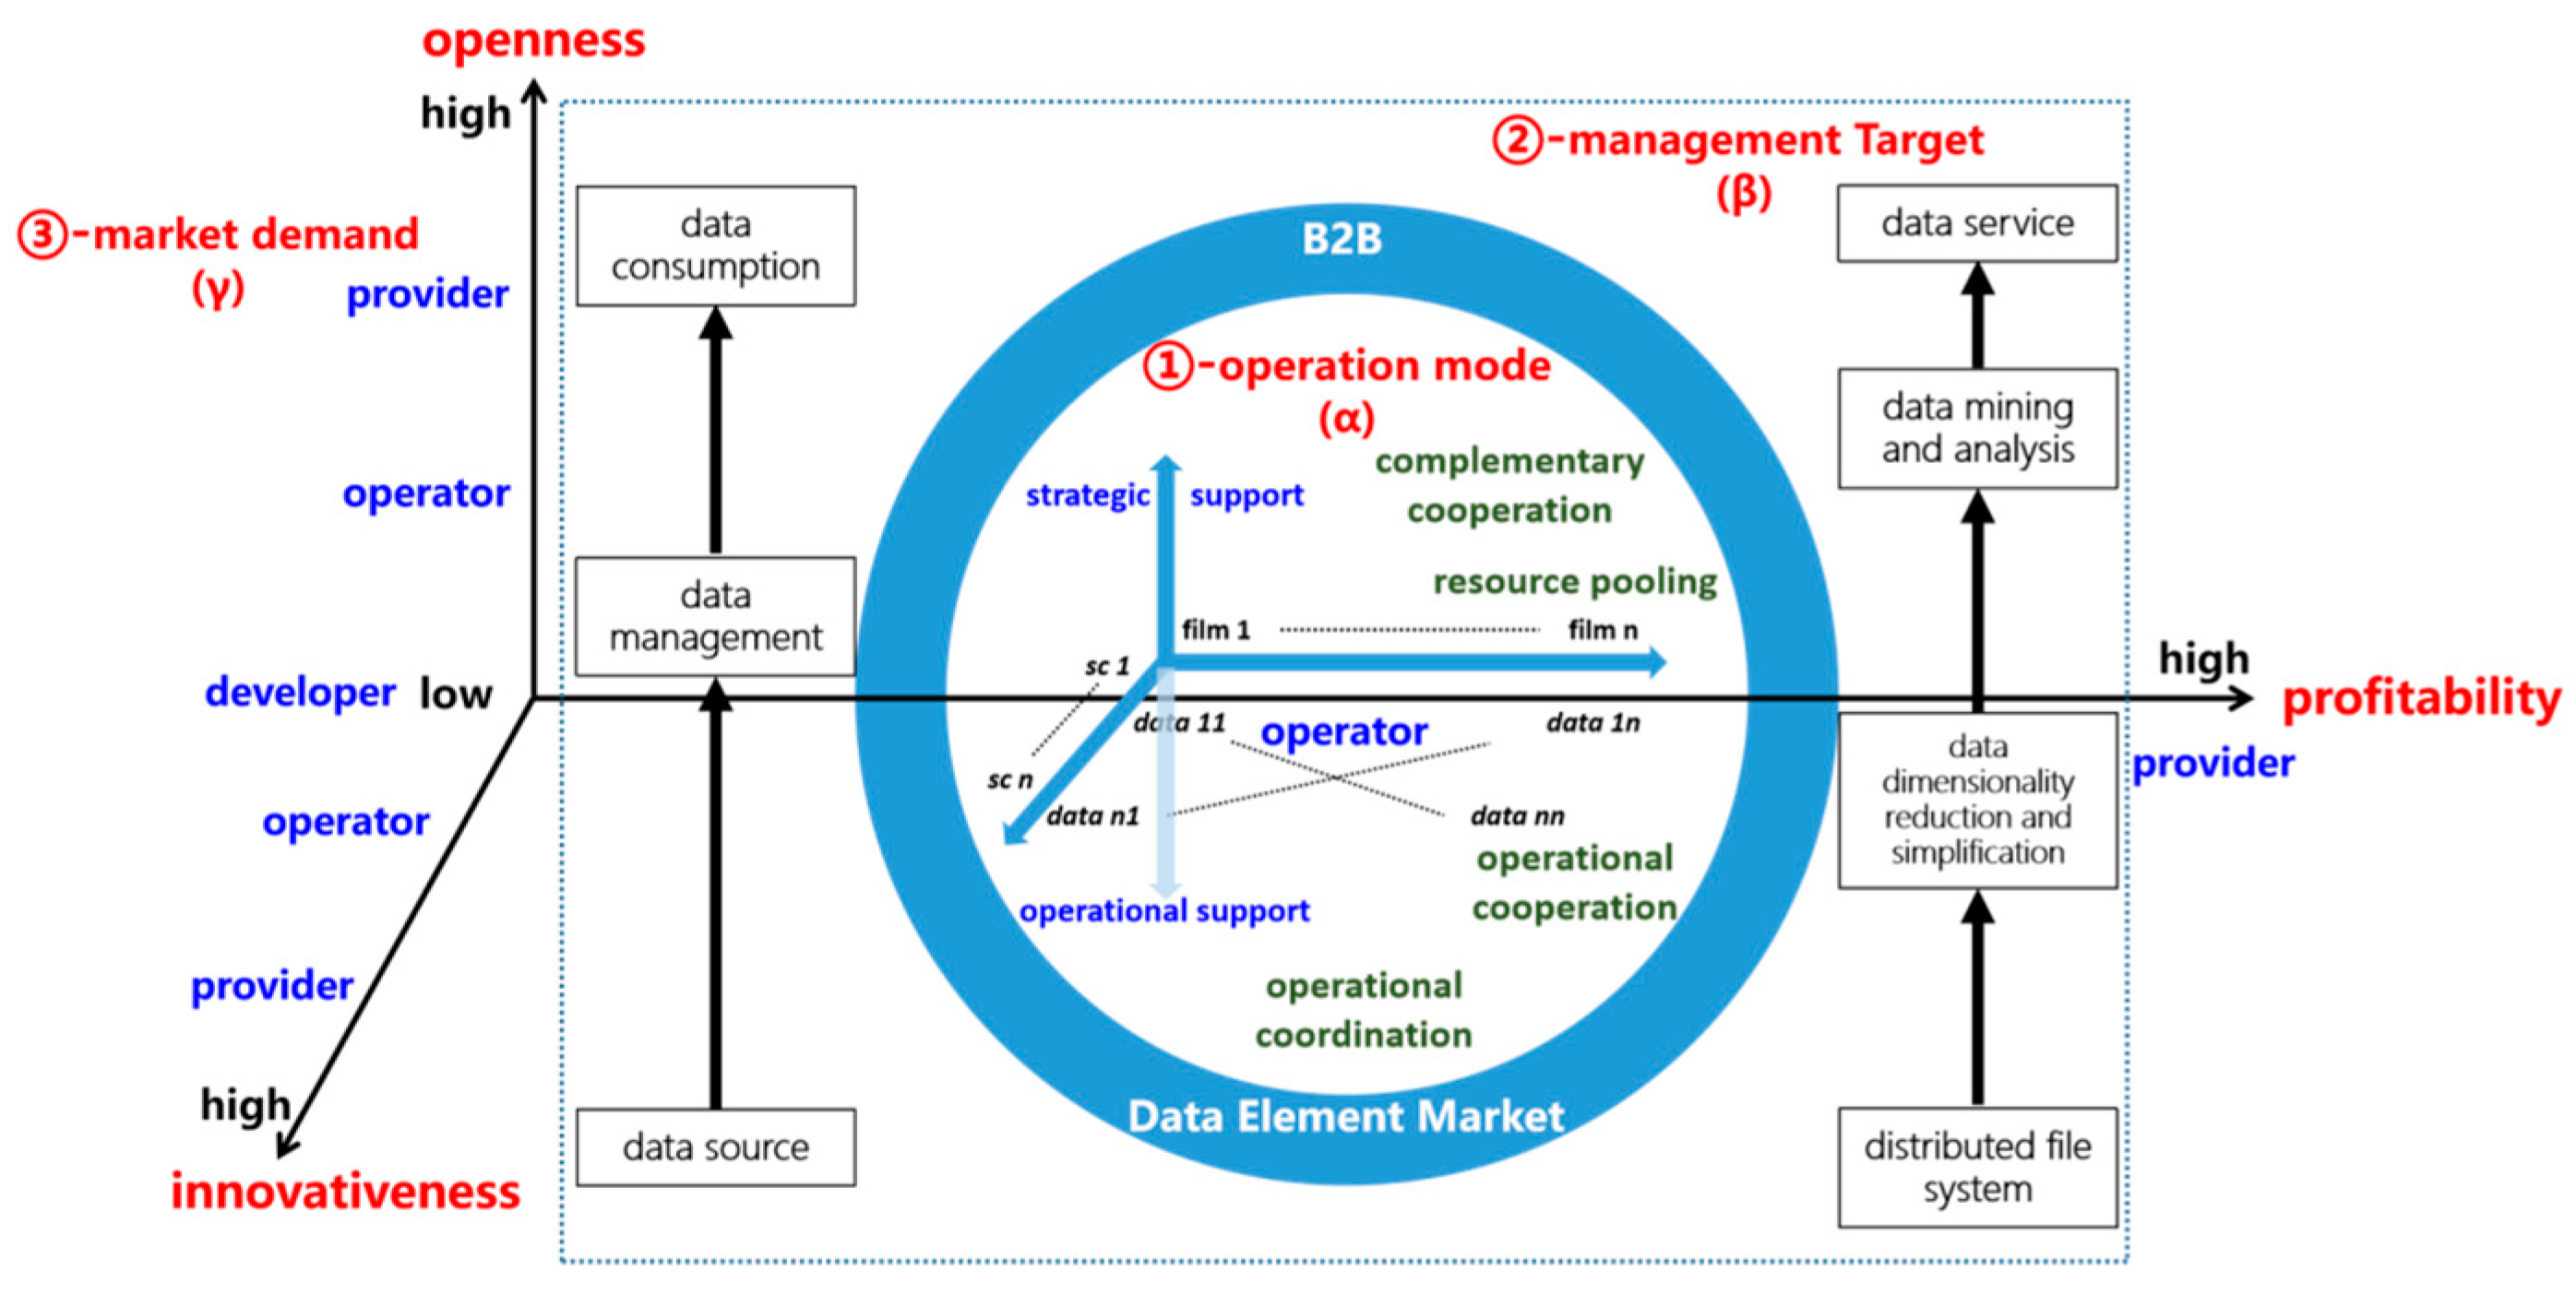
Figure 4.
Flow chart of data transactions.

Figure 5.
Impact of data encryption protection efforts on profit without incentive mechanism.
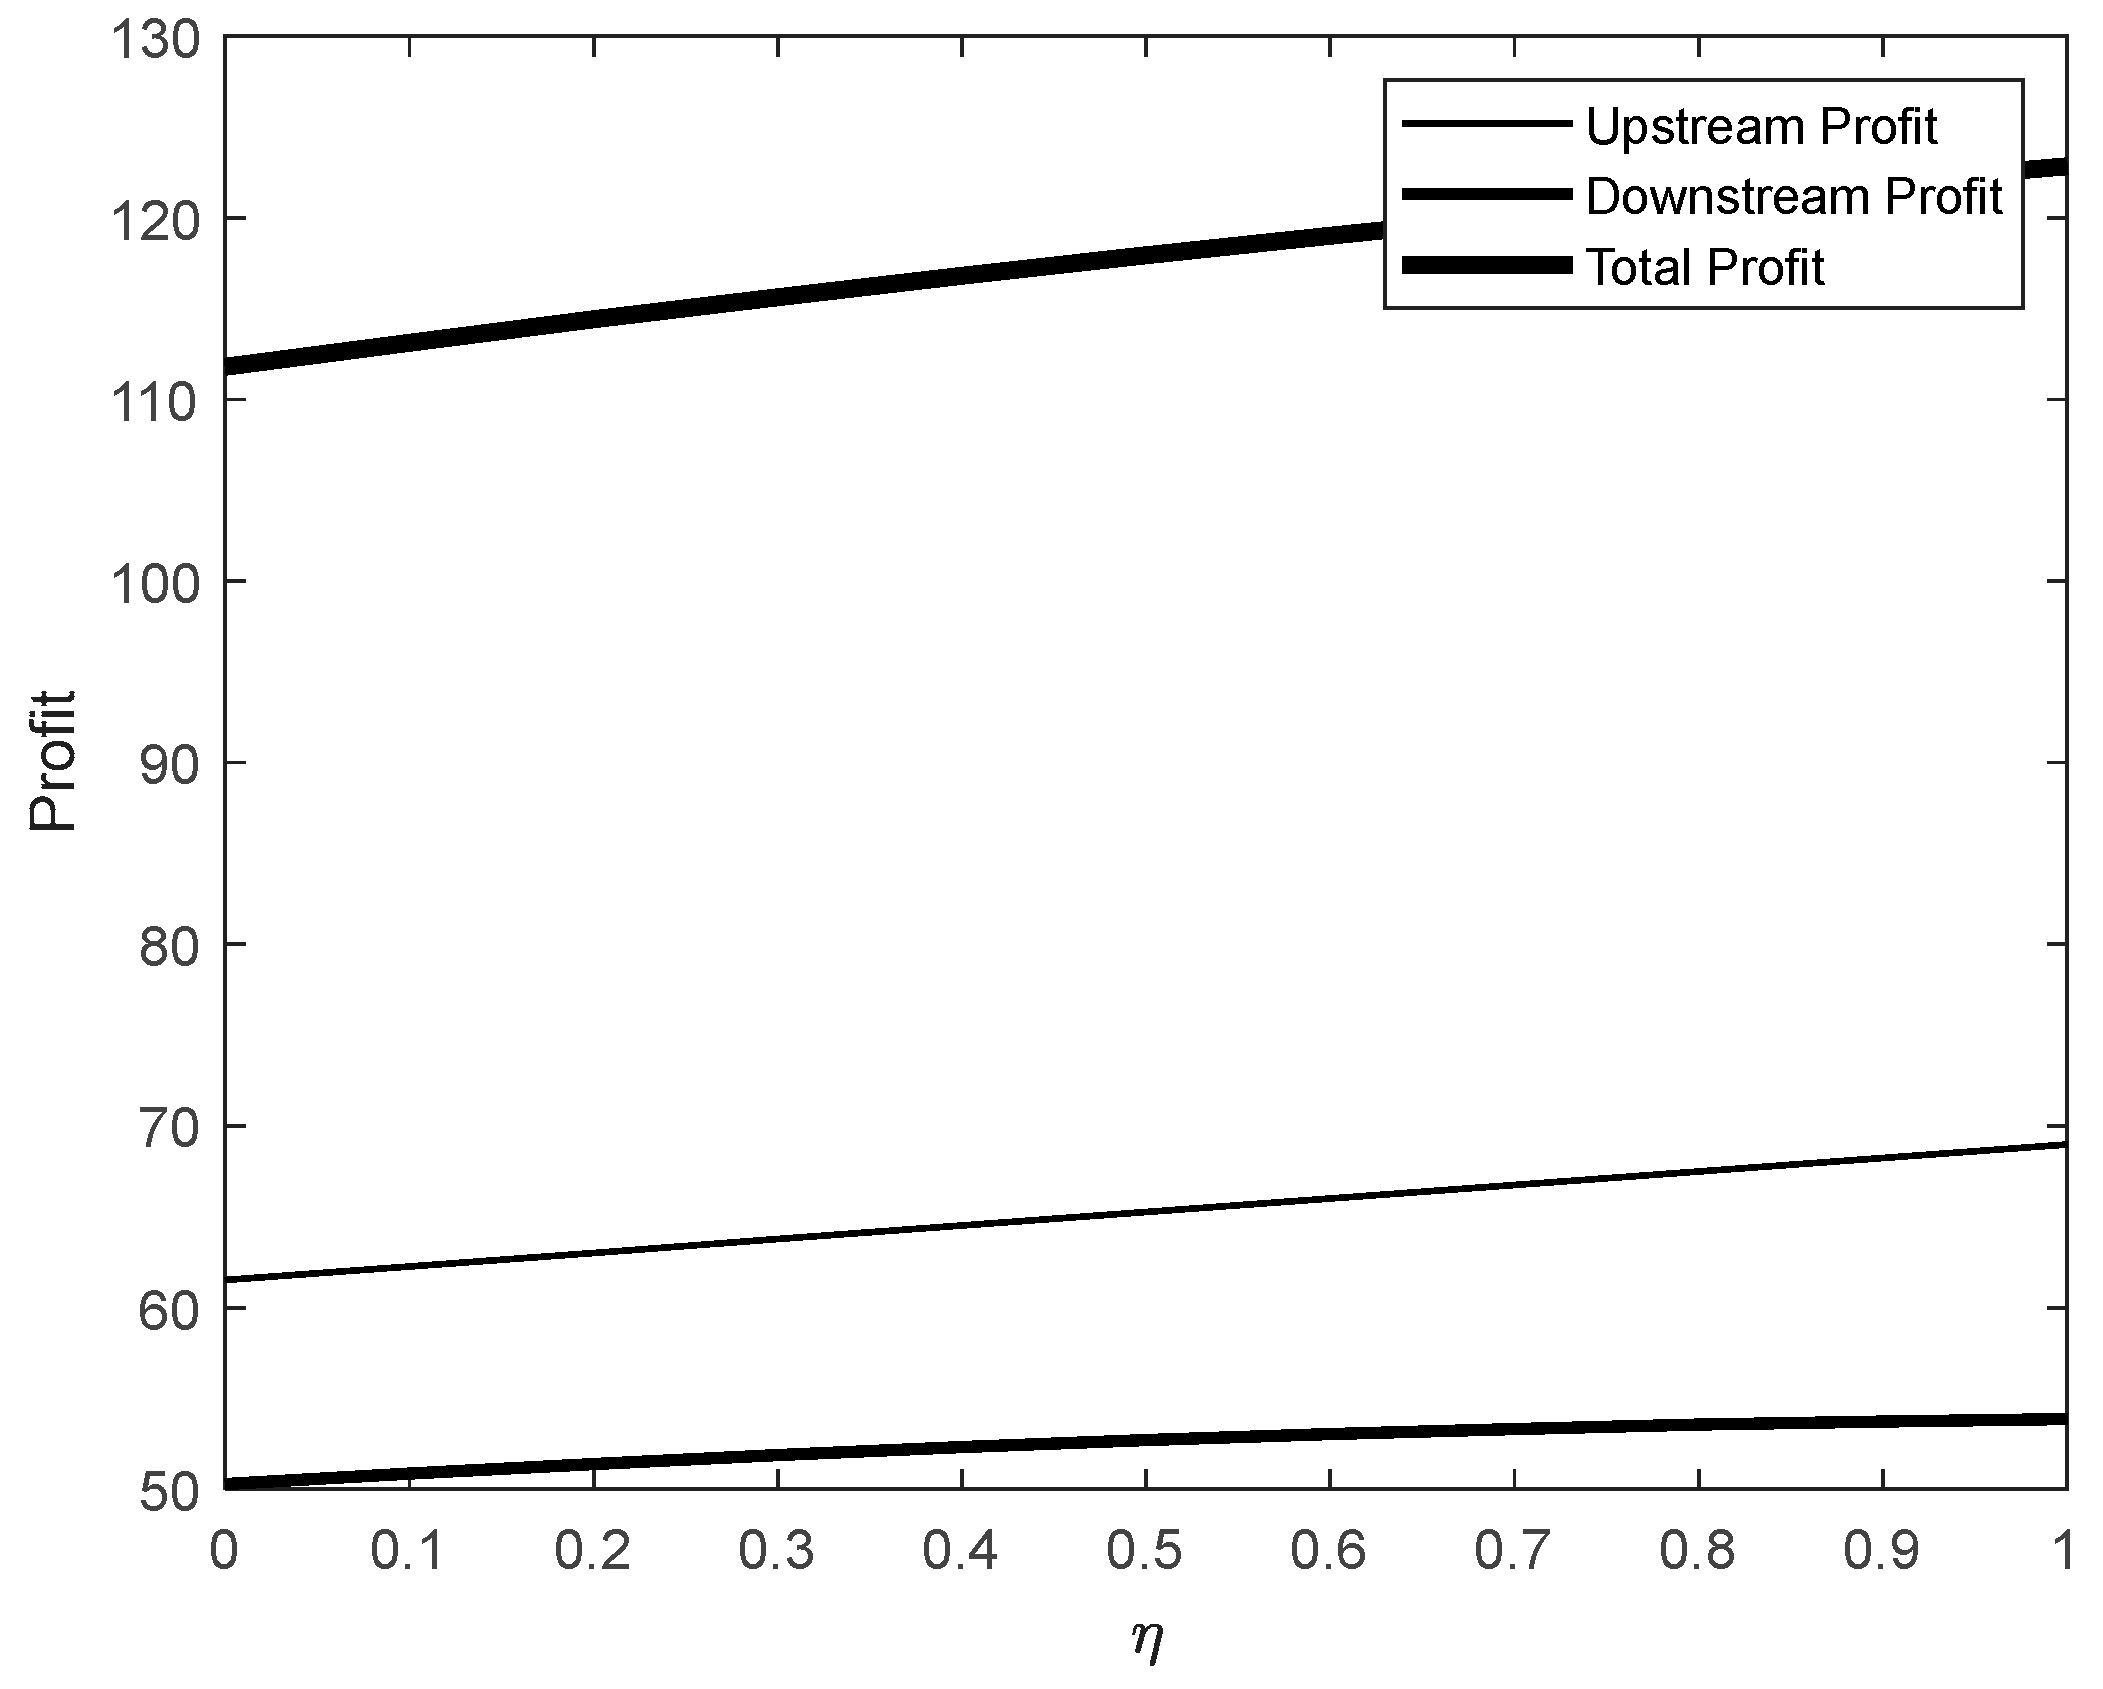
Figure 6.
The impact of data-encryption protection efforts on profits under downstream industry incentives.
Figure 6.
The impact of data-encryption protection efforts on profits under downstream industry incentives.
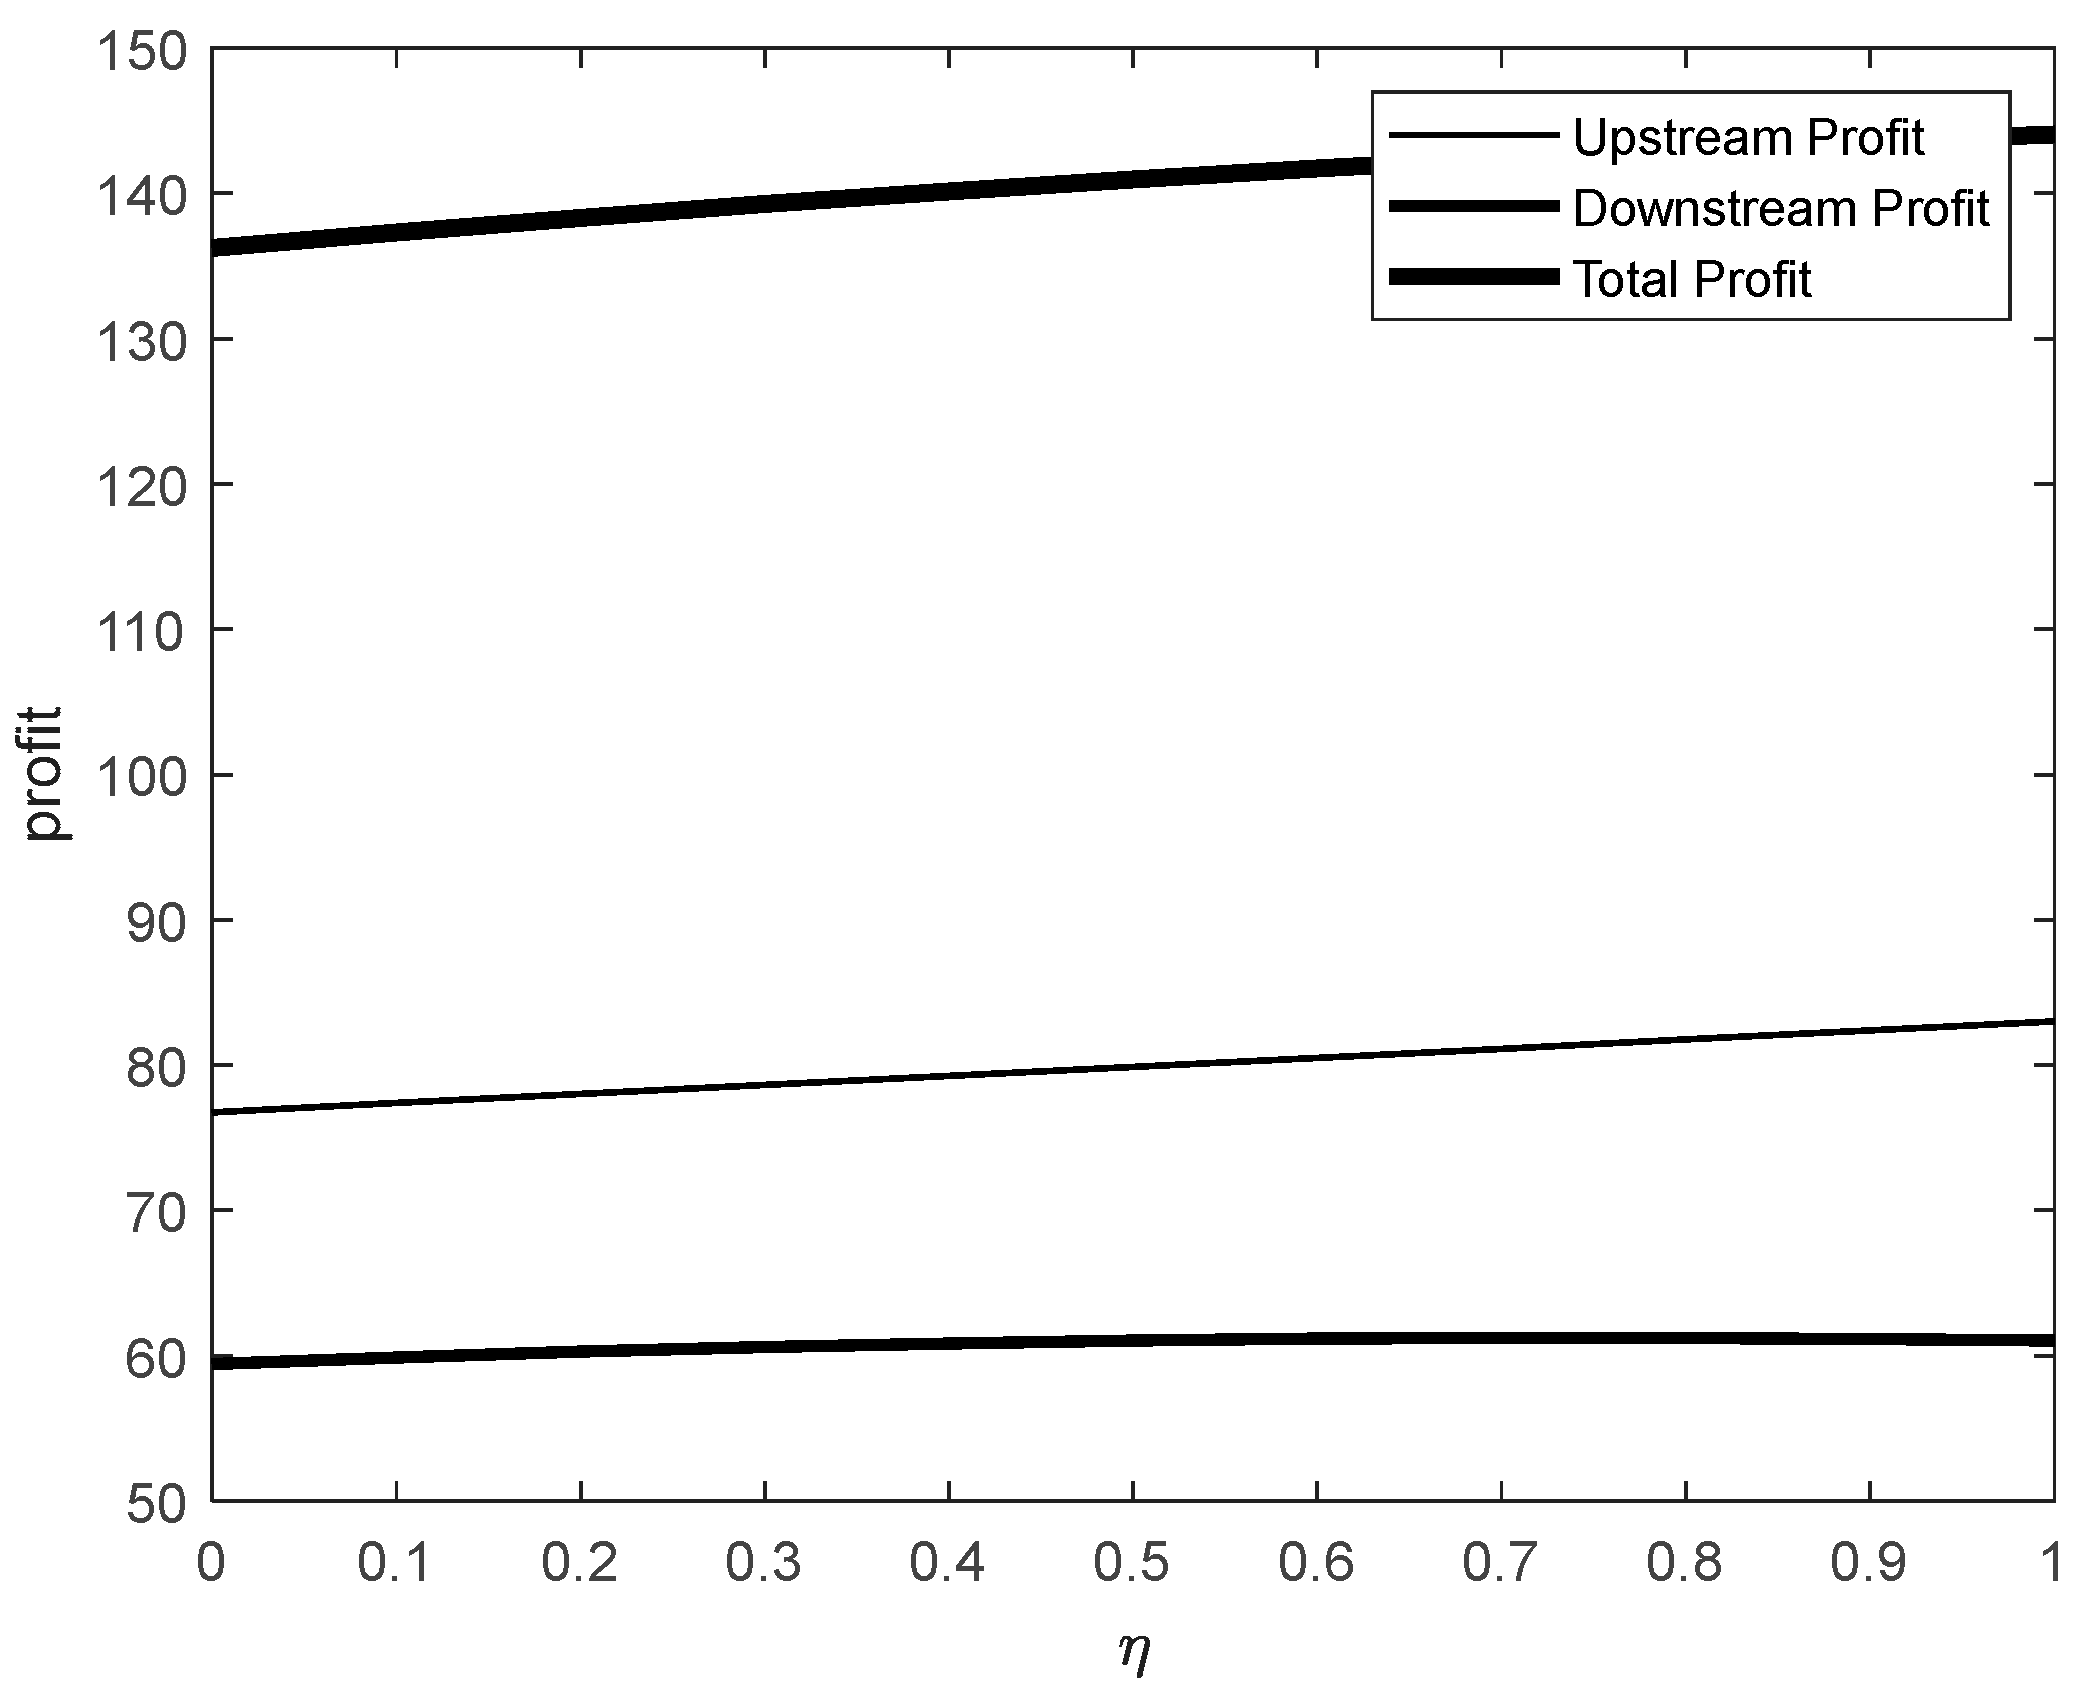
Figure 7.
The impact of data-encryption protection efforts on profits under upstream industry incentives.
Figure 7.
The impact of data-encryption protection efforts on profits under upstream industry incentives.
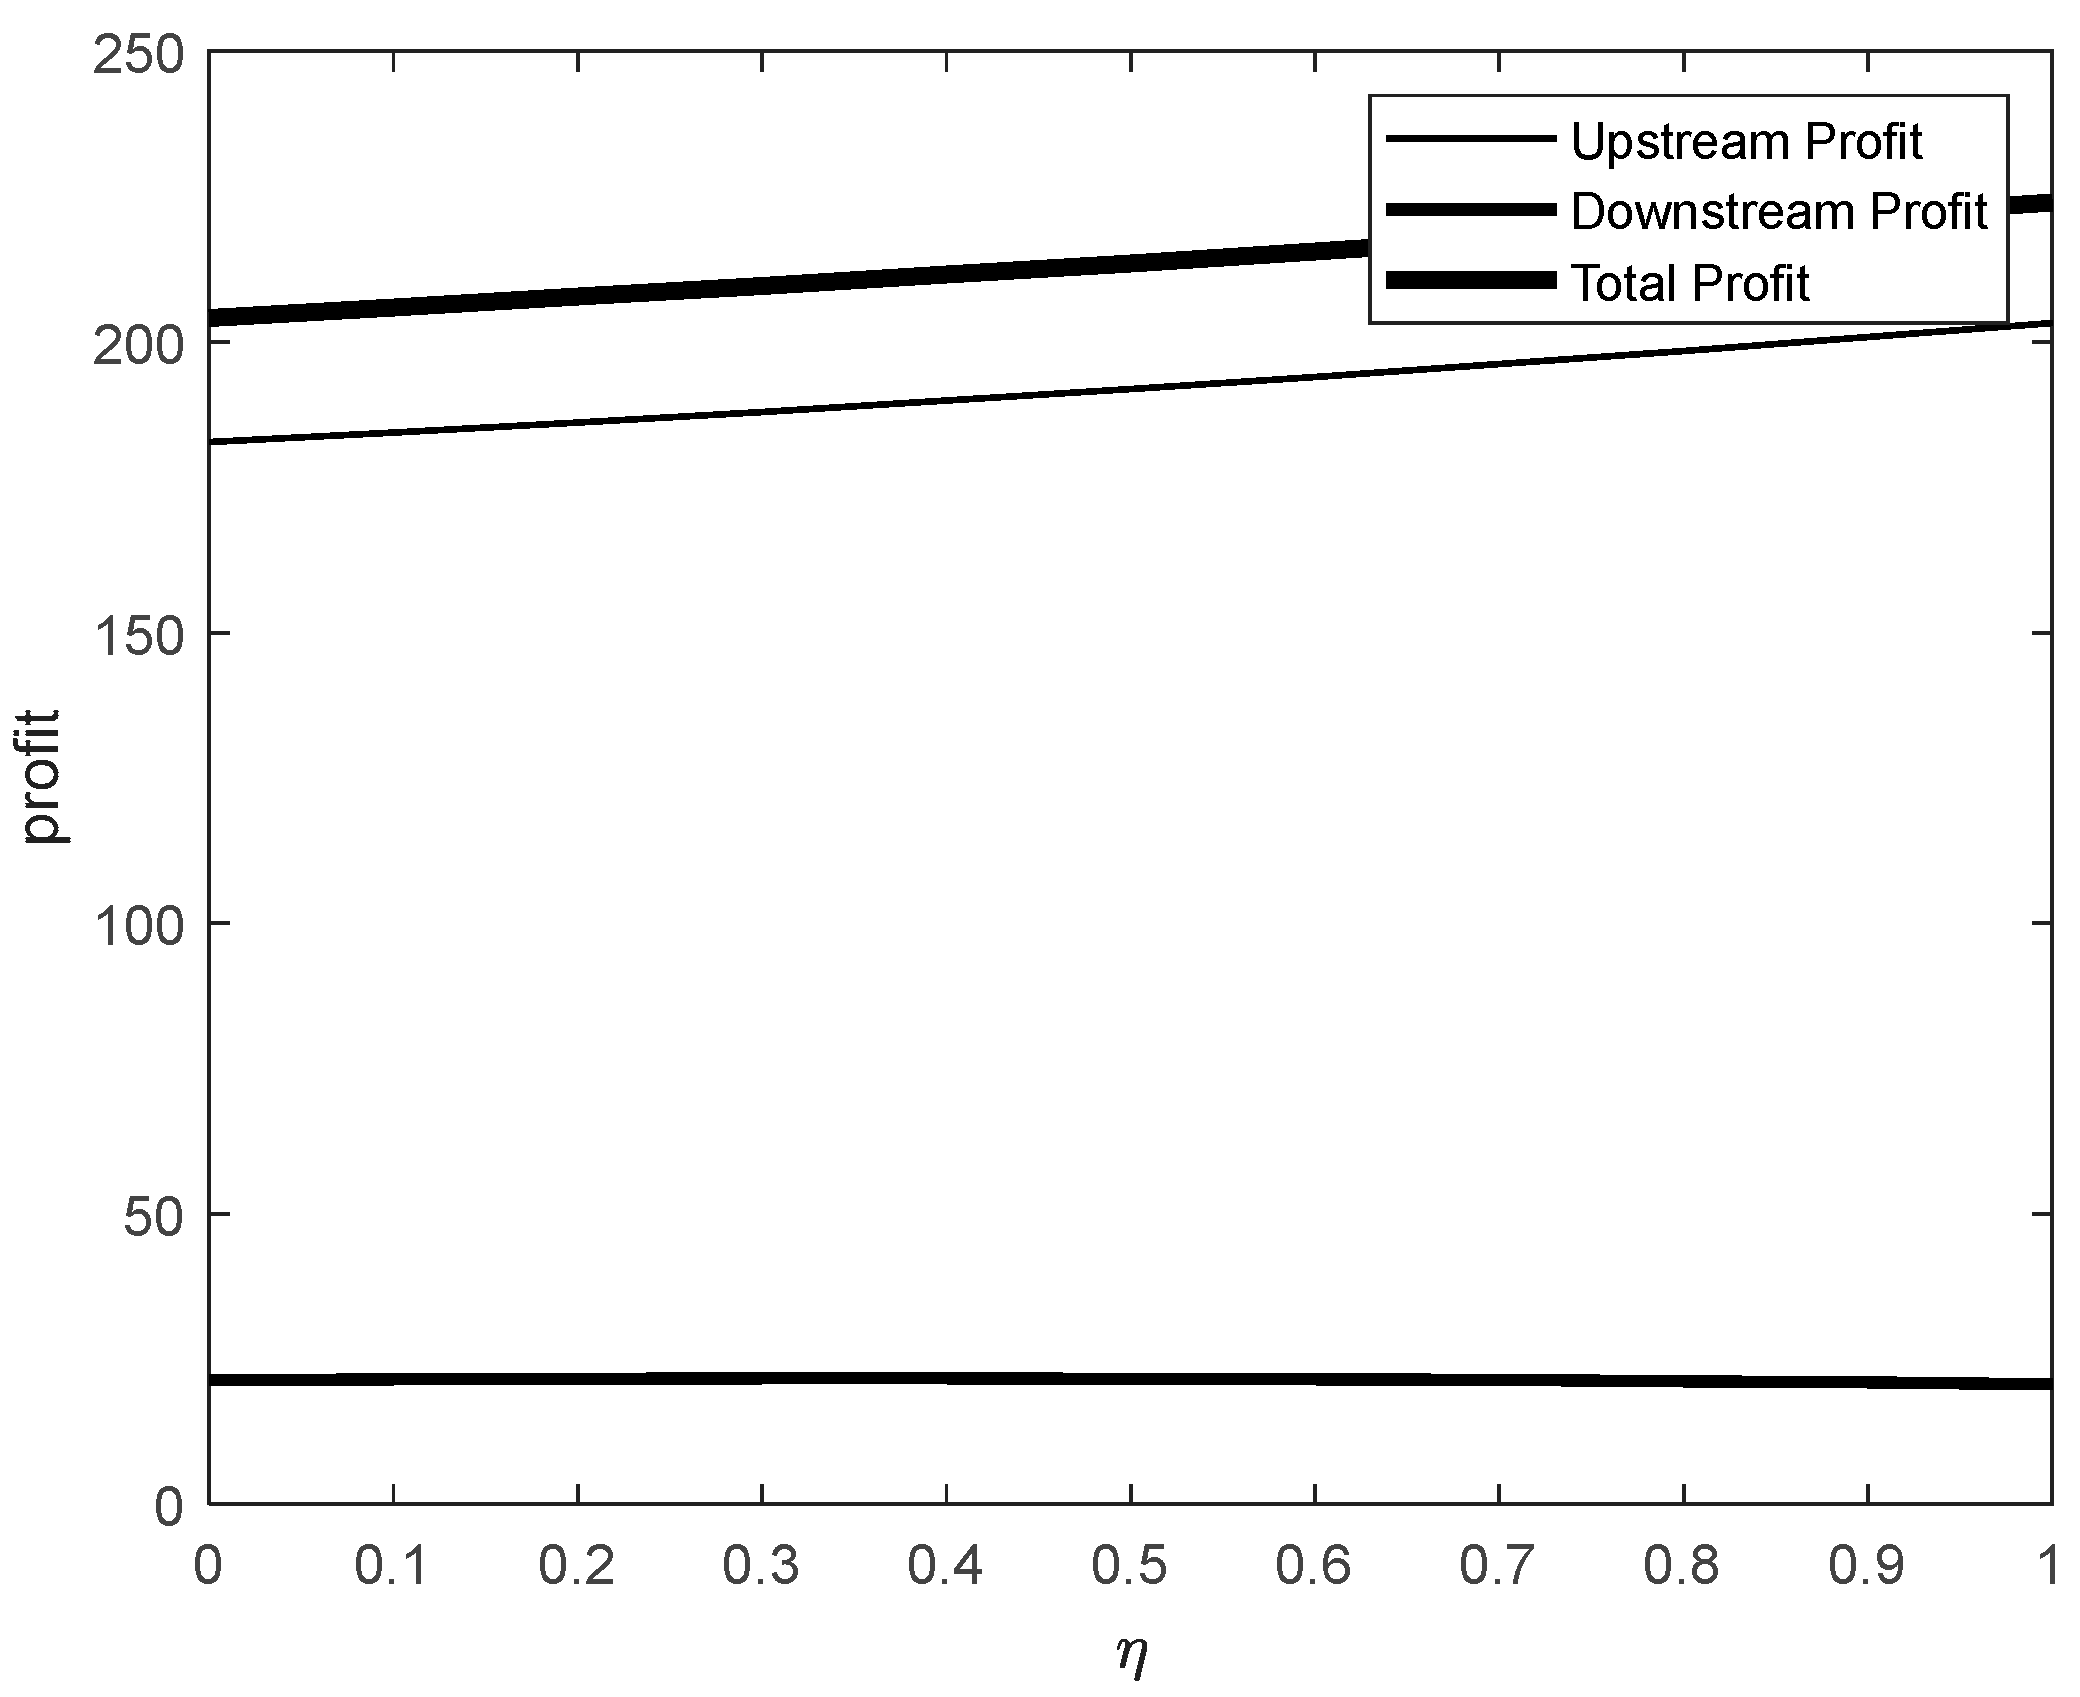
Figure 8.
The effect of the incentive mechanism coefficient of the upstream-downstream (incentive) on profit.
Figure 8.
The effect of the incentive mechanism coefficient of the upstream-downstream (incentive) on profit.
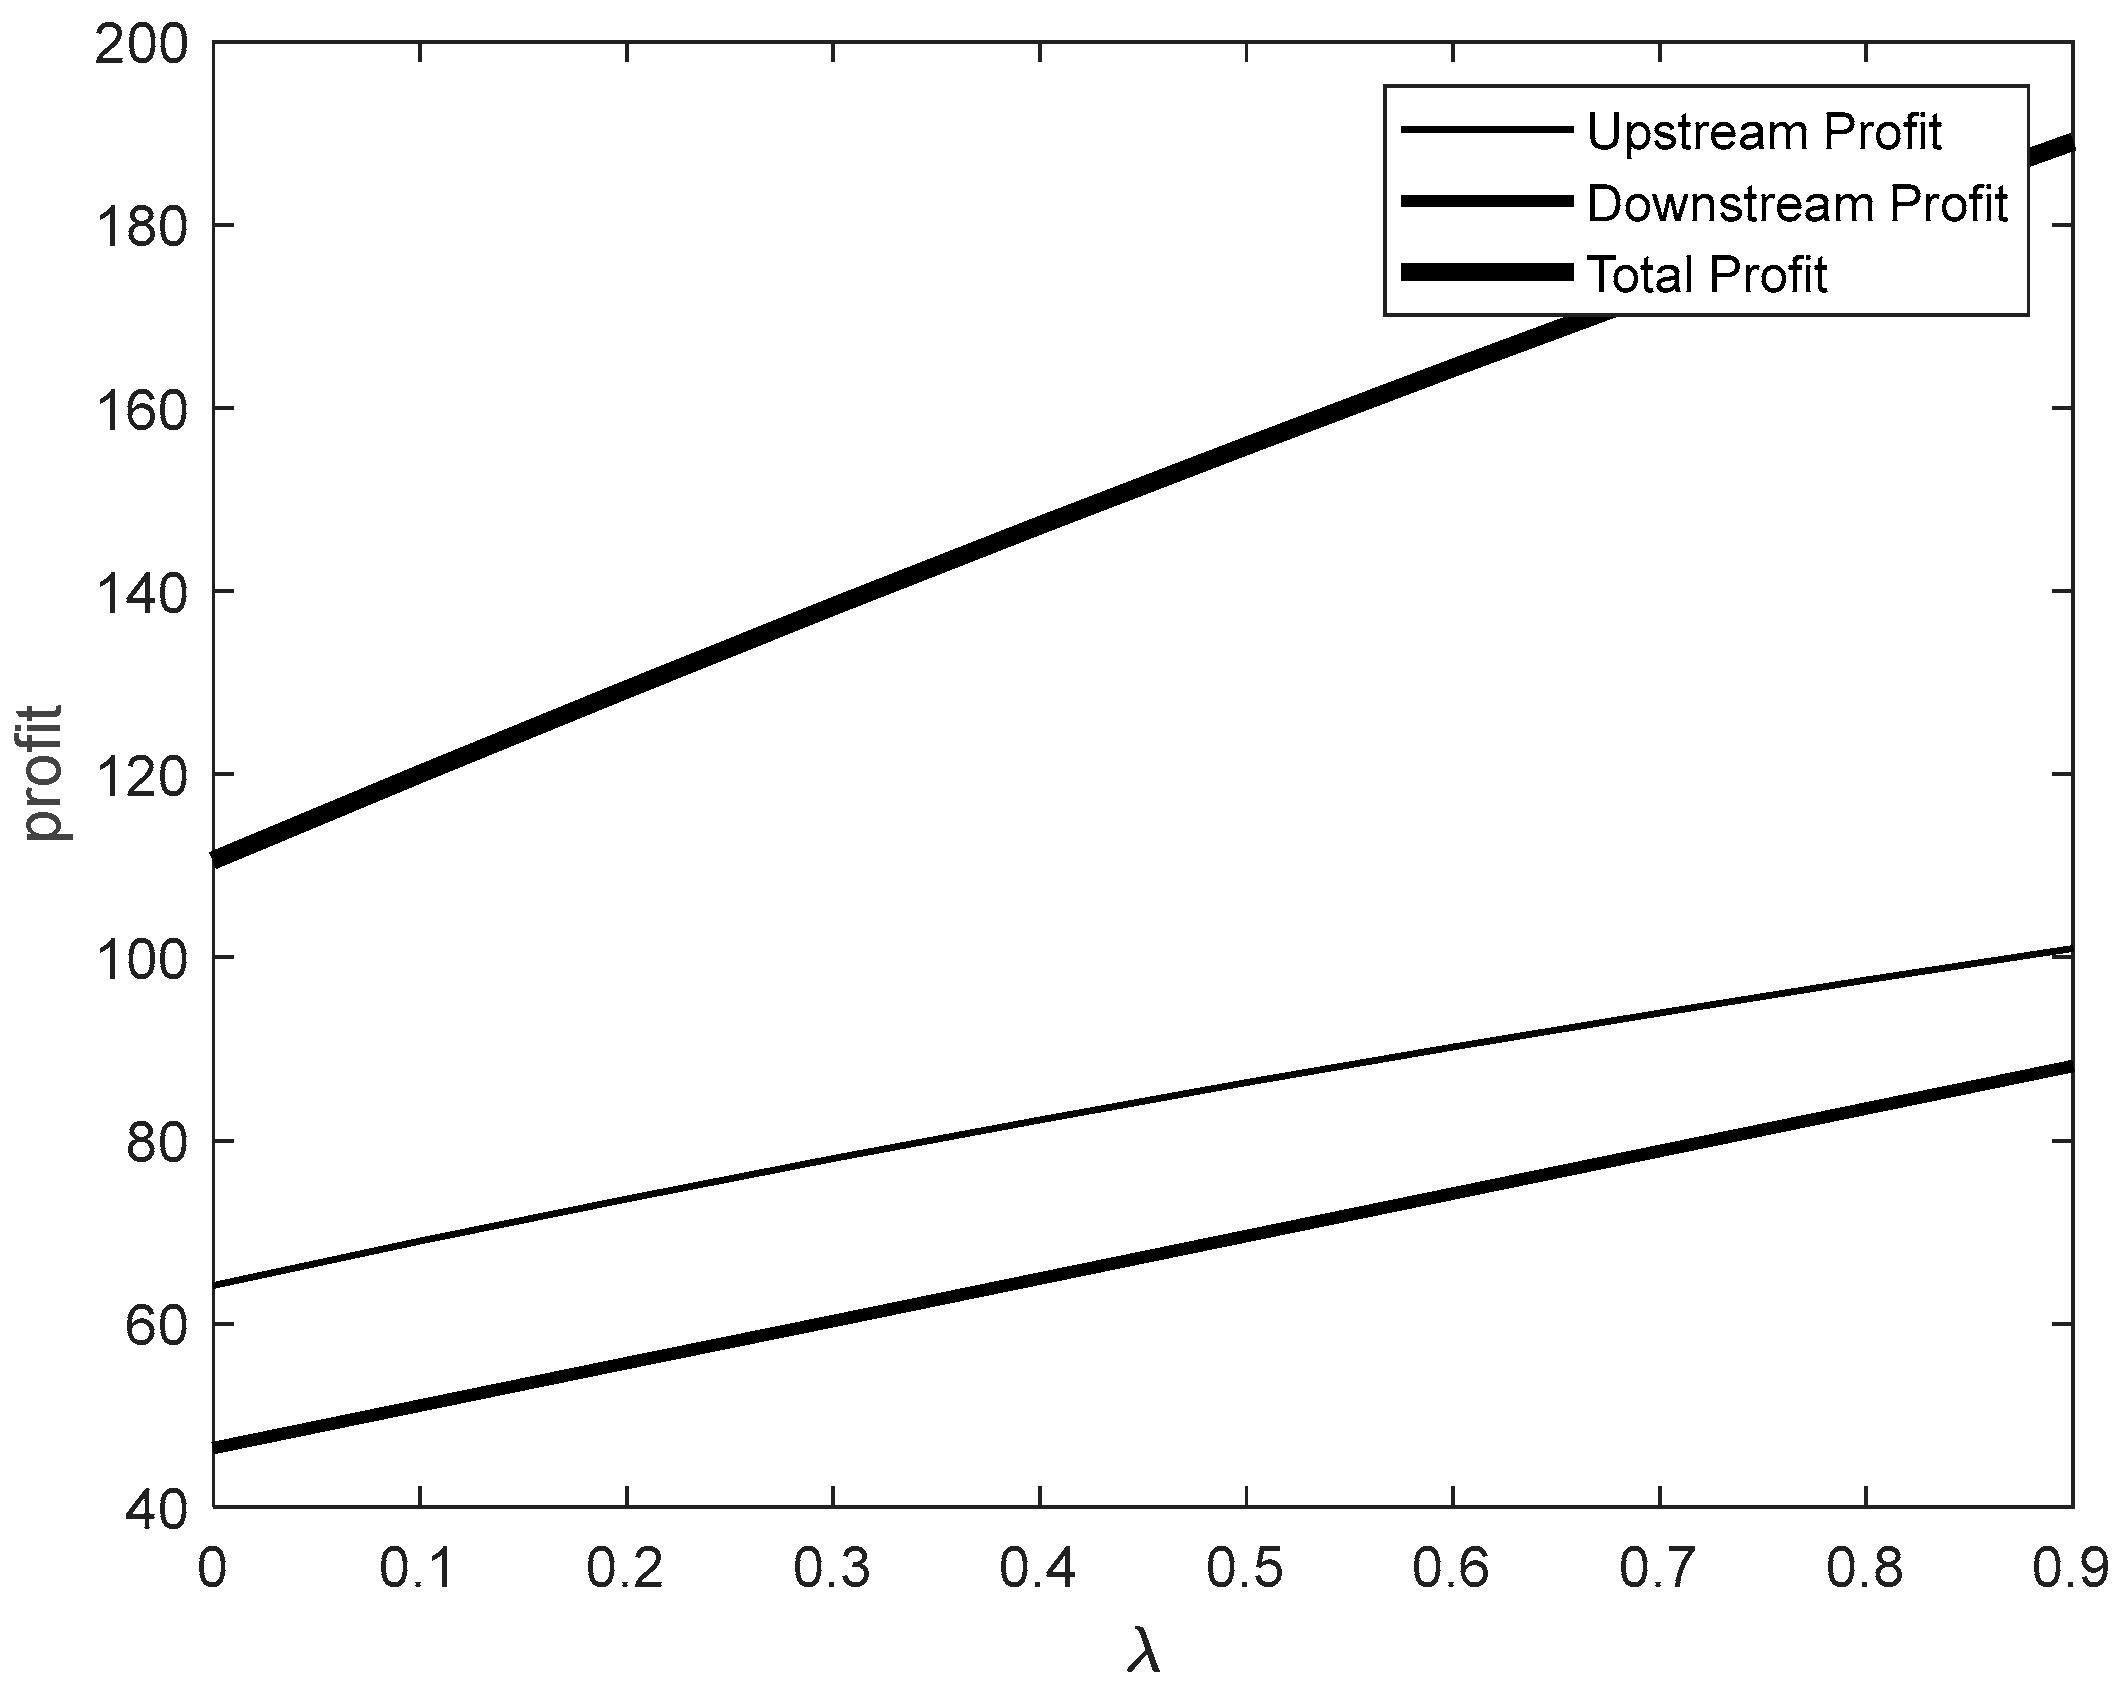
Figure 9.
Upstream (incentive) – The effect of the downstream incentive mechanism coefficient on profit.
Figure 9.
Upstream (incentive) – The effect of the downstream incentive mechanism coefficient on profit.
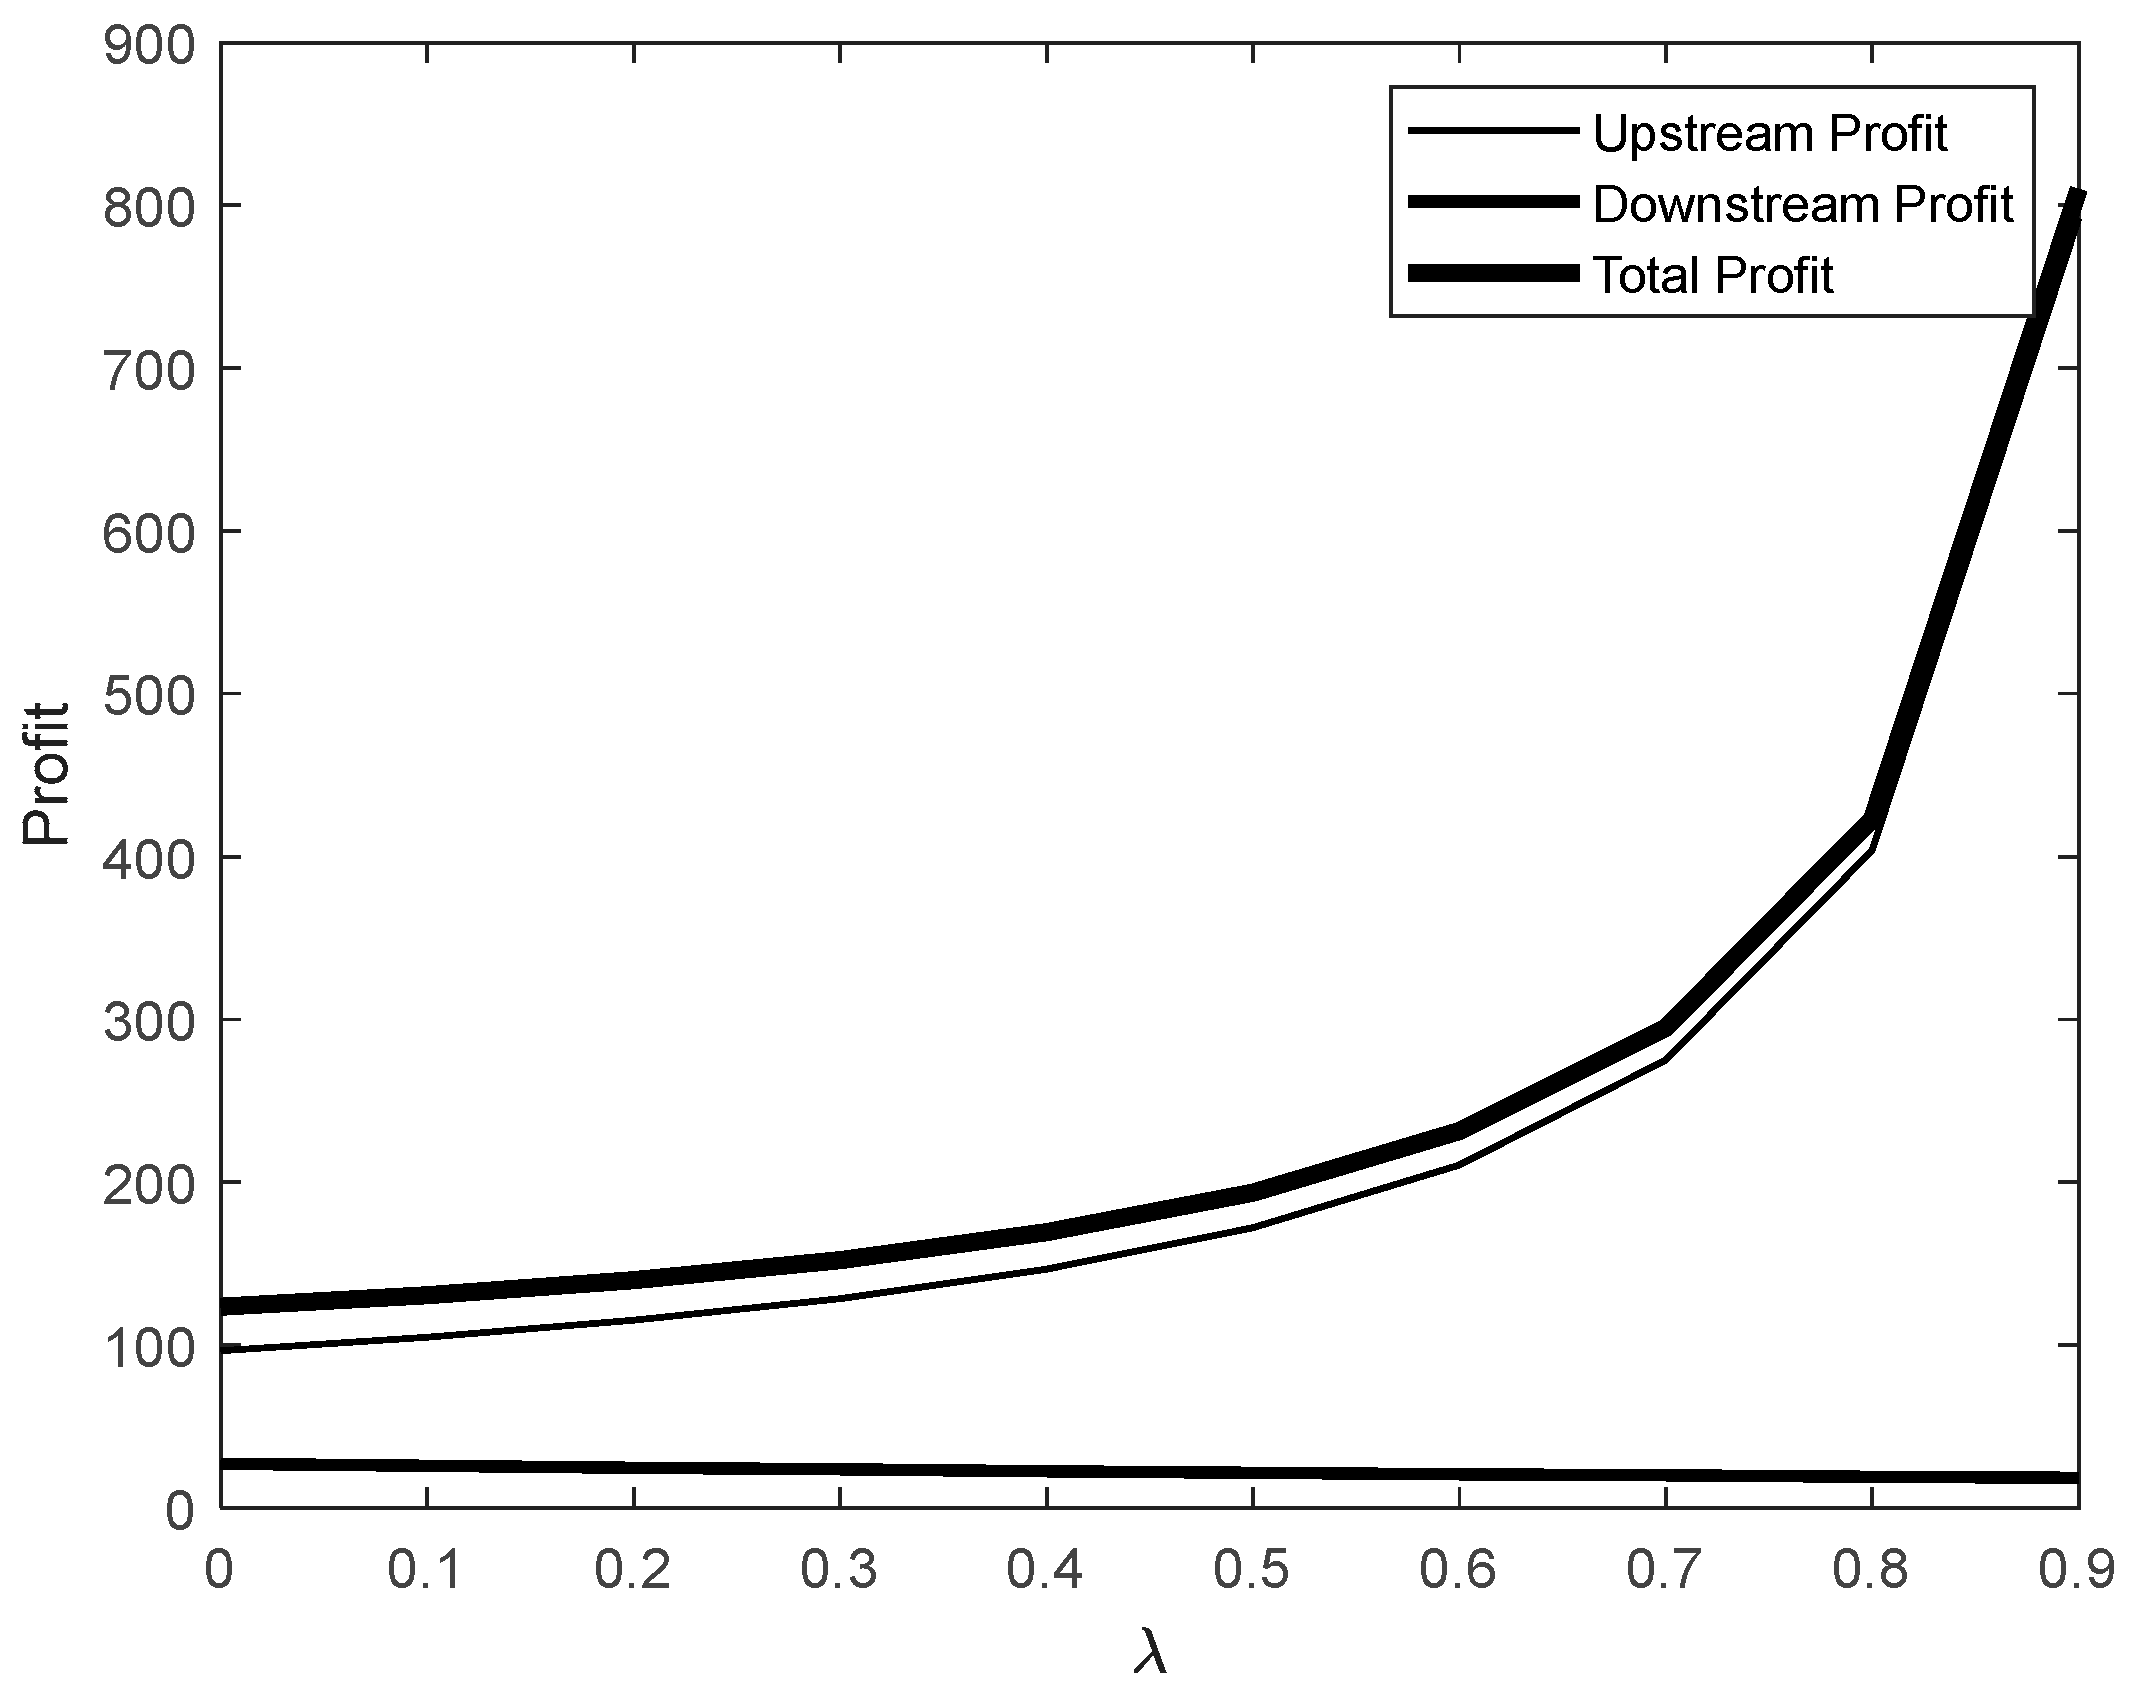
Figure 10.
Impact of and on profit in the upstream-downstream (incentive) mode.
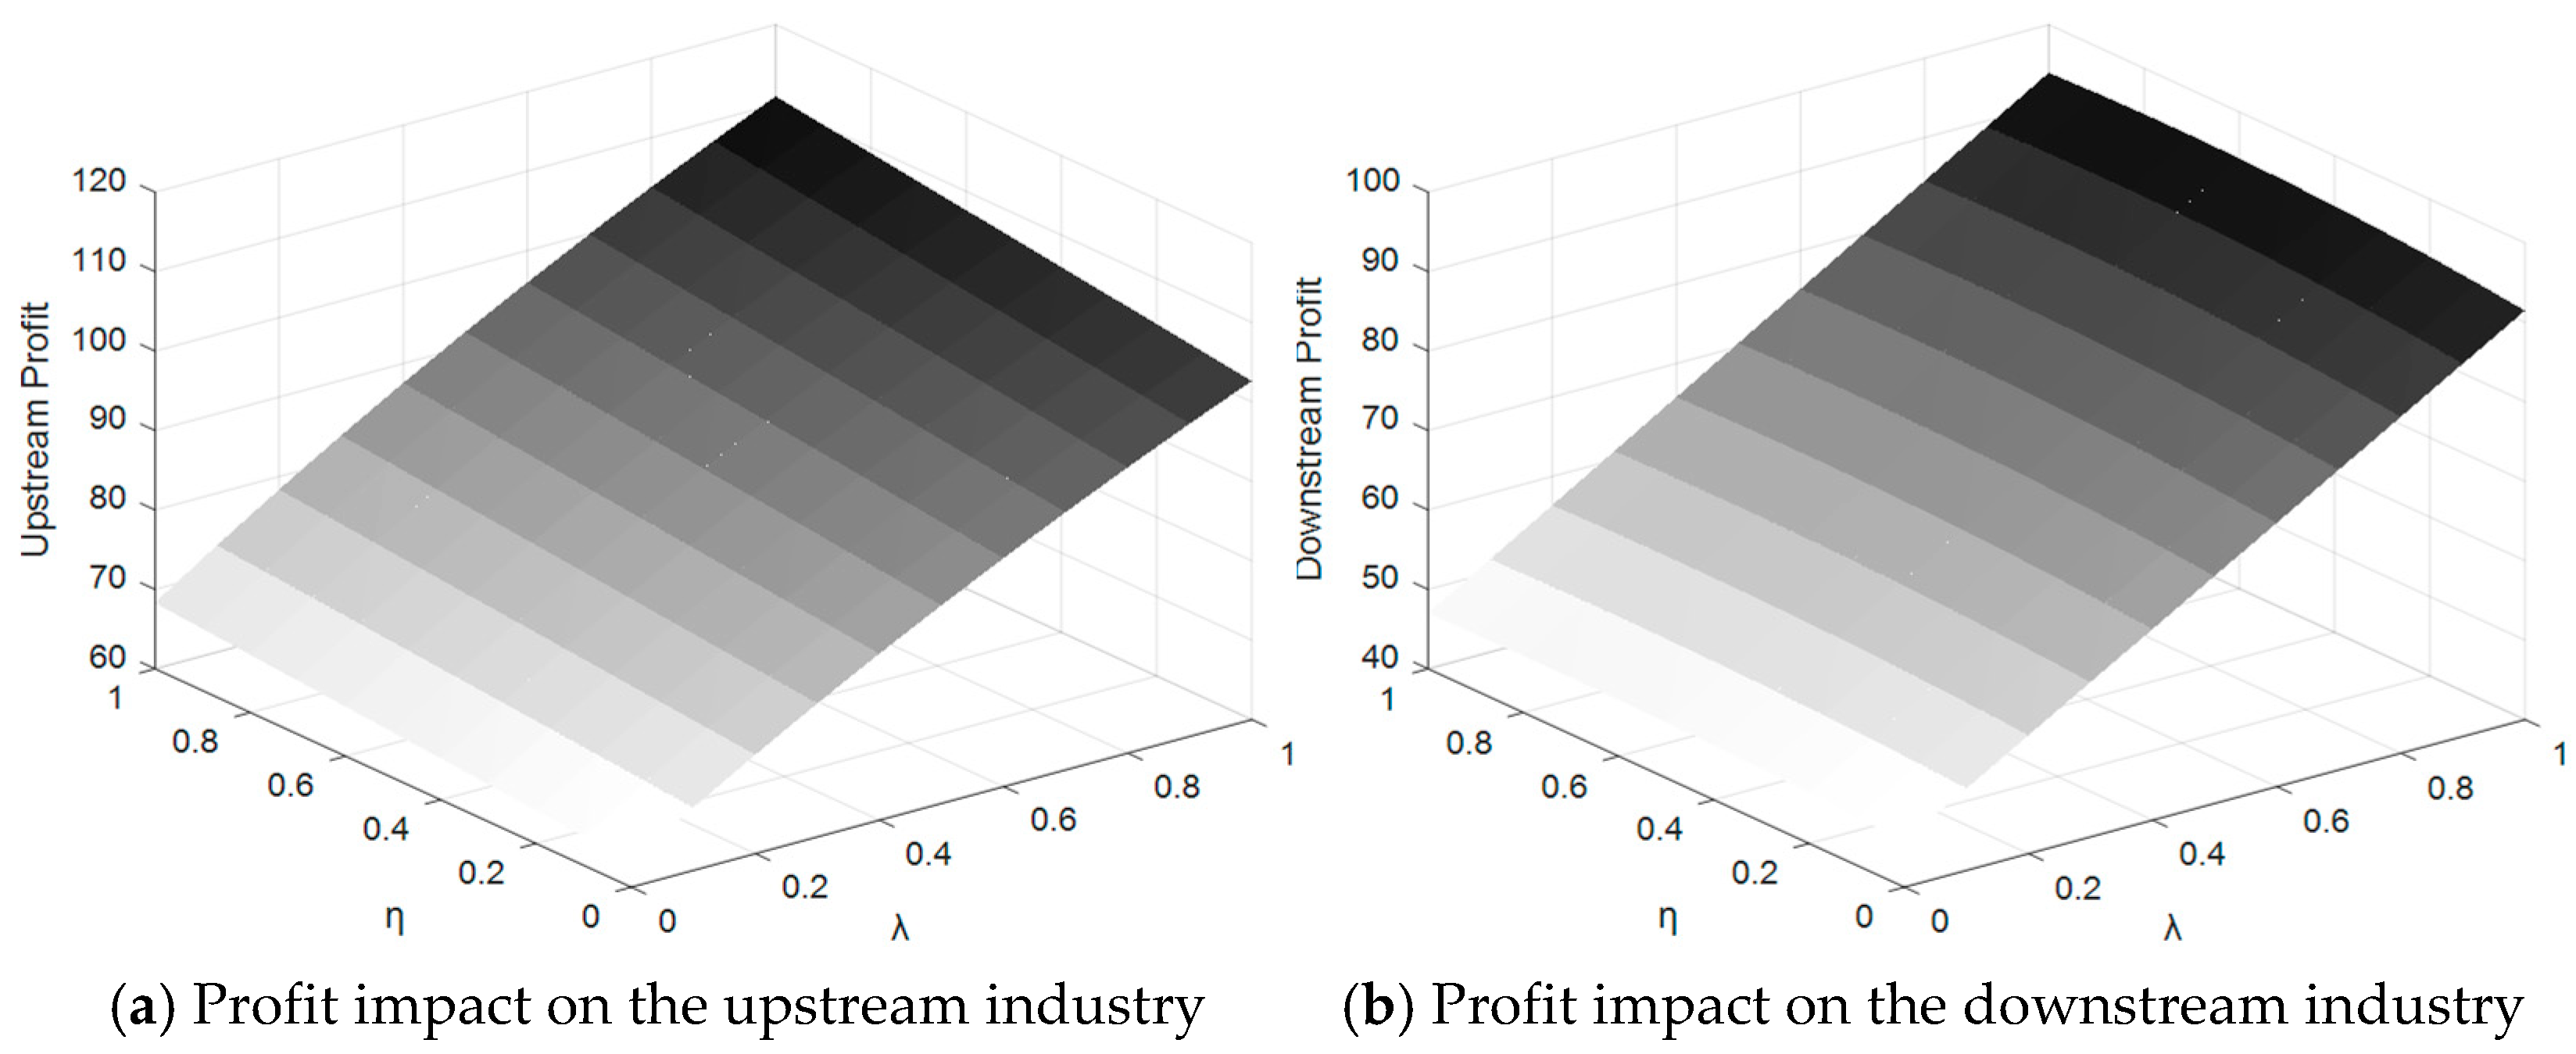
Figure 11.
Upstream (incentive) – Impact of and on profit in the downstream mode.
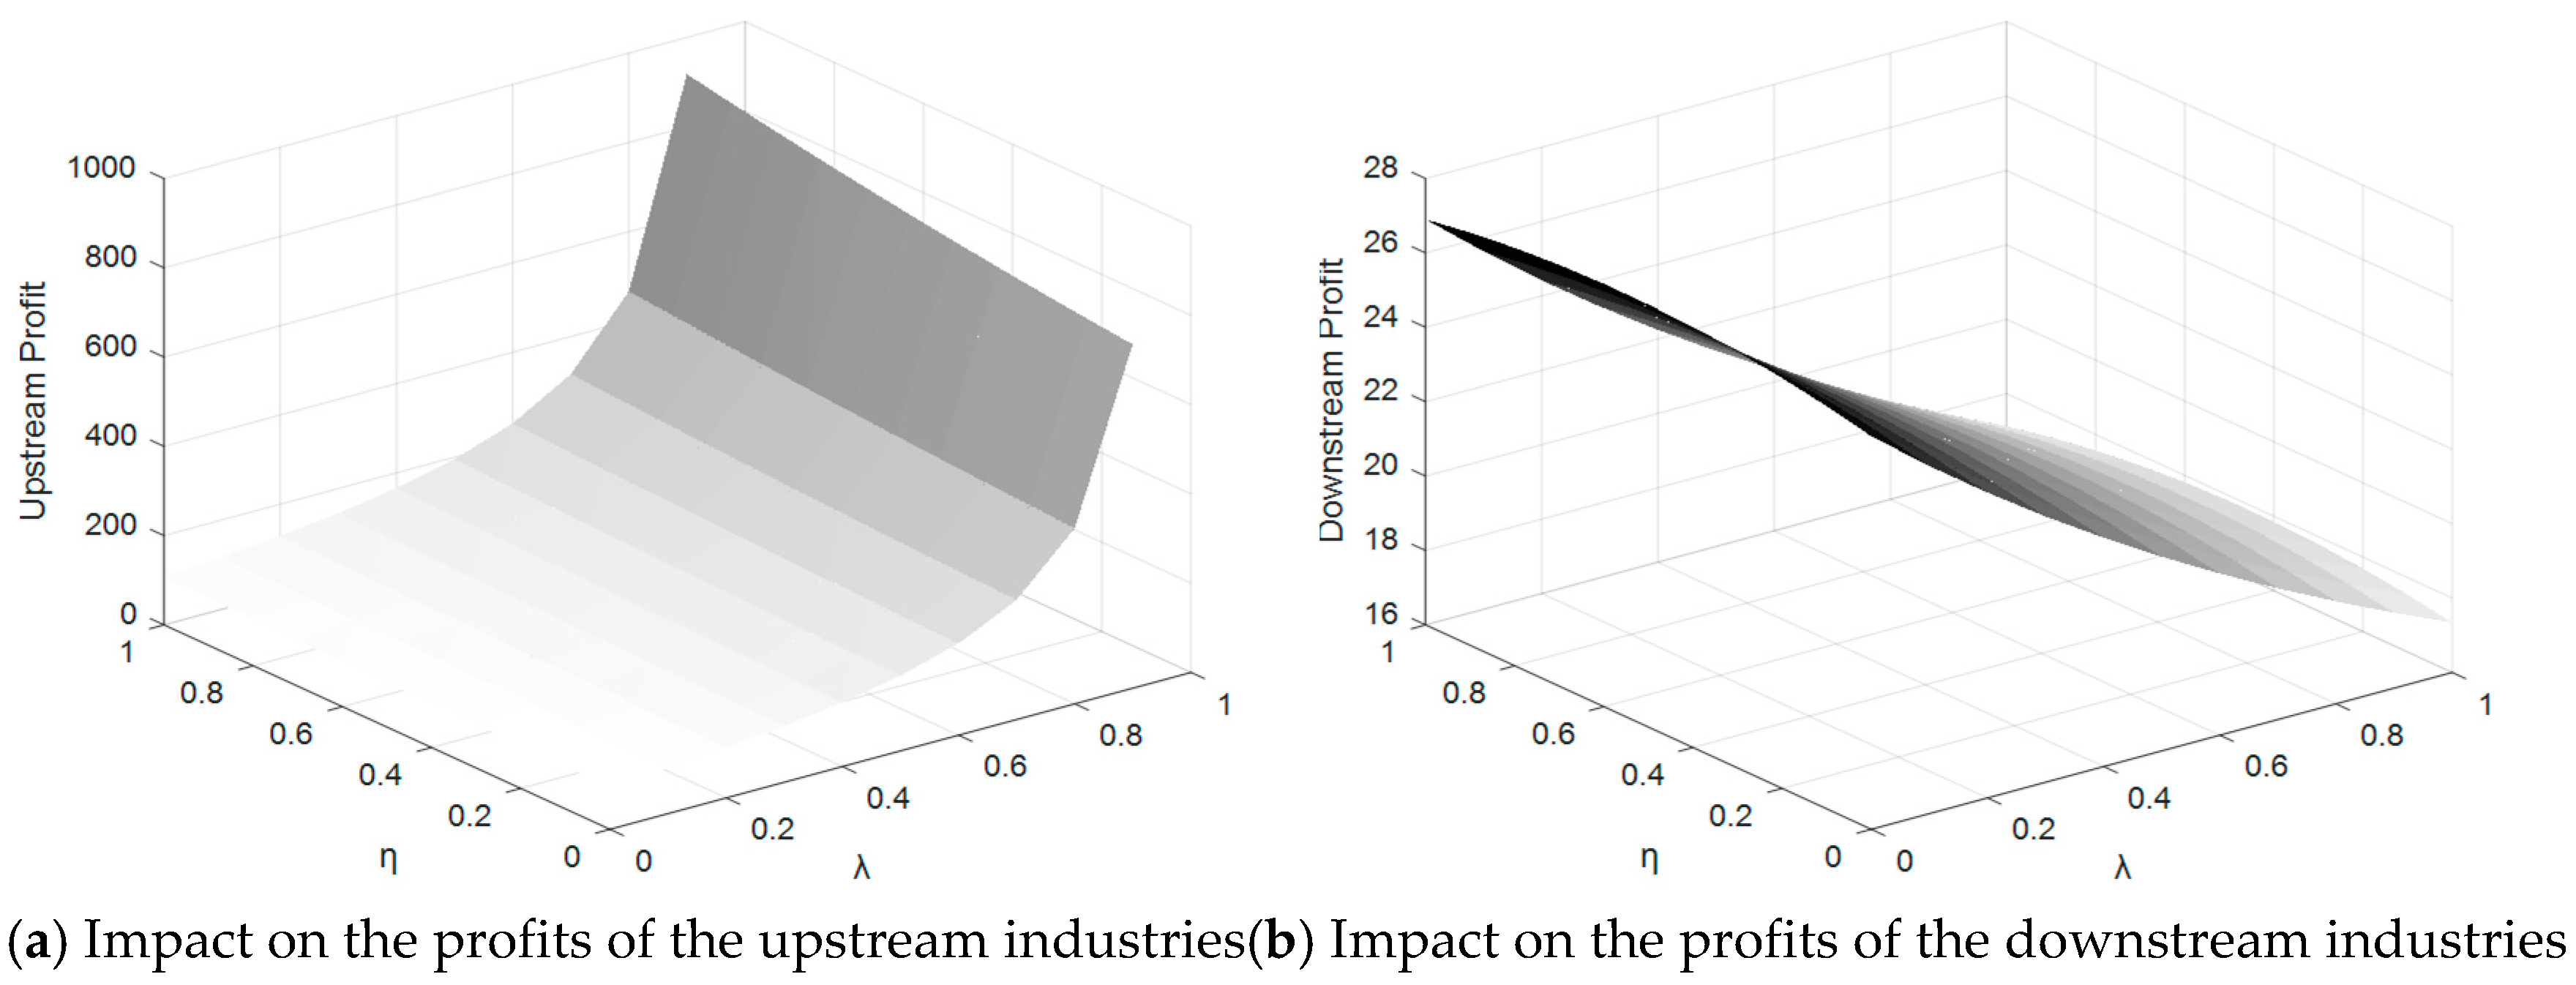
Figure 12.
Boxplot analysis.
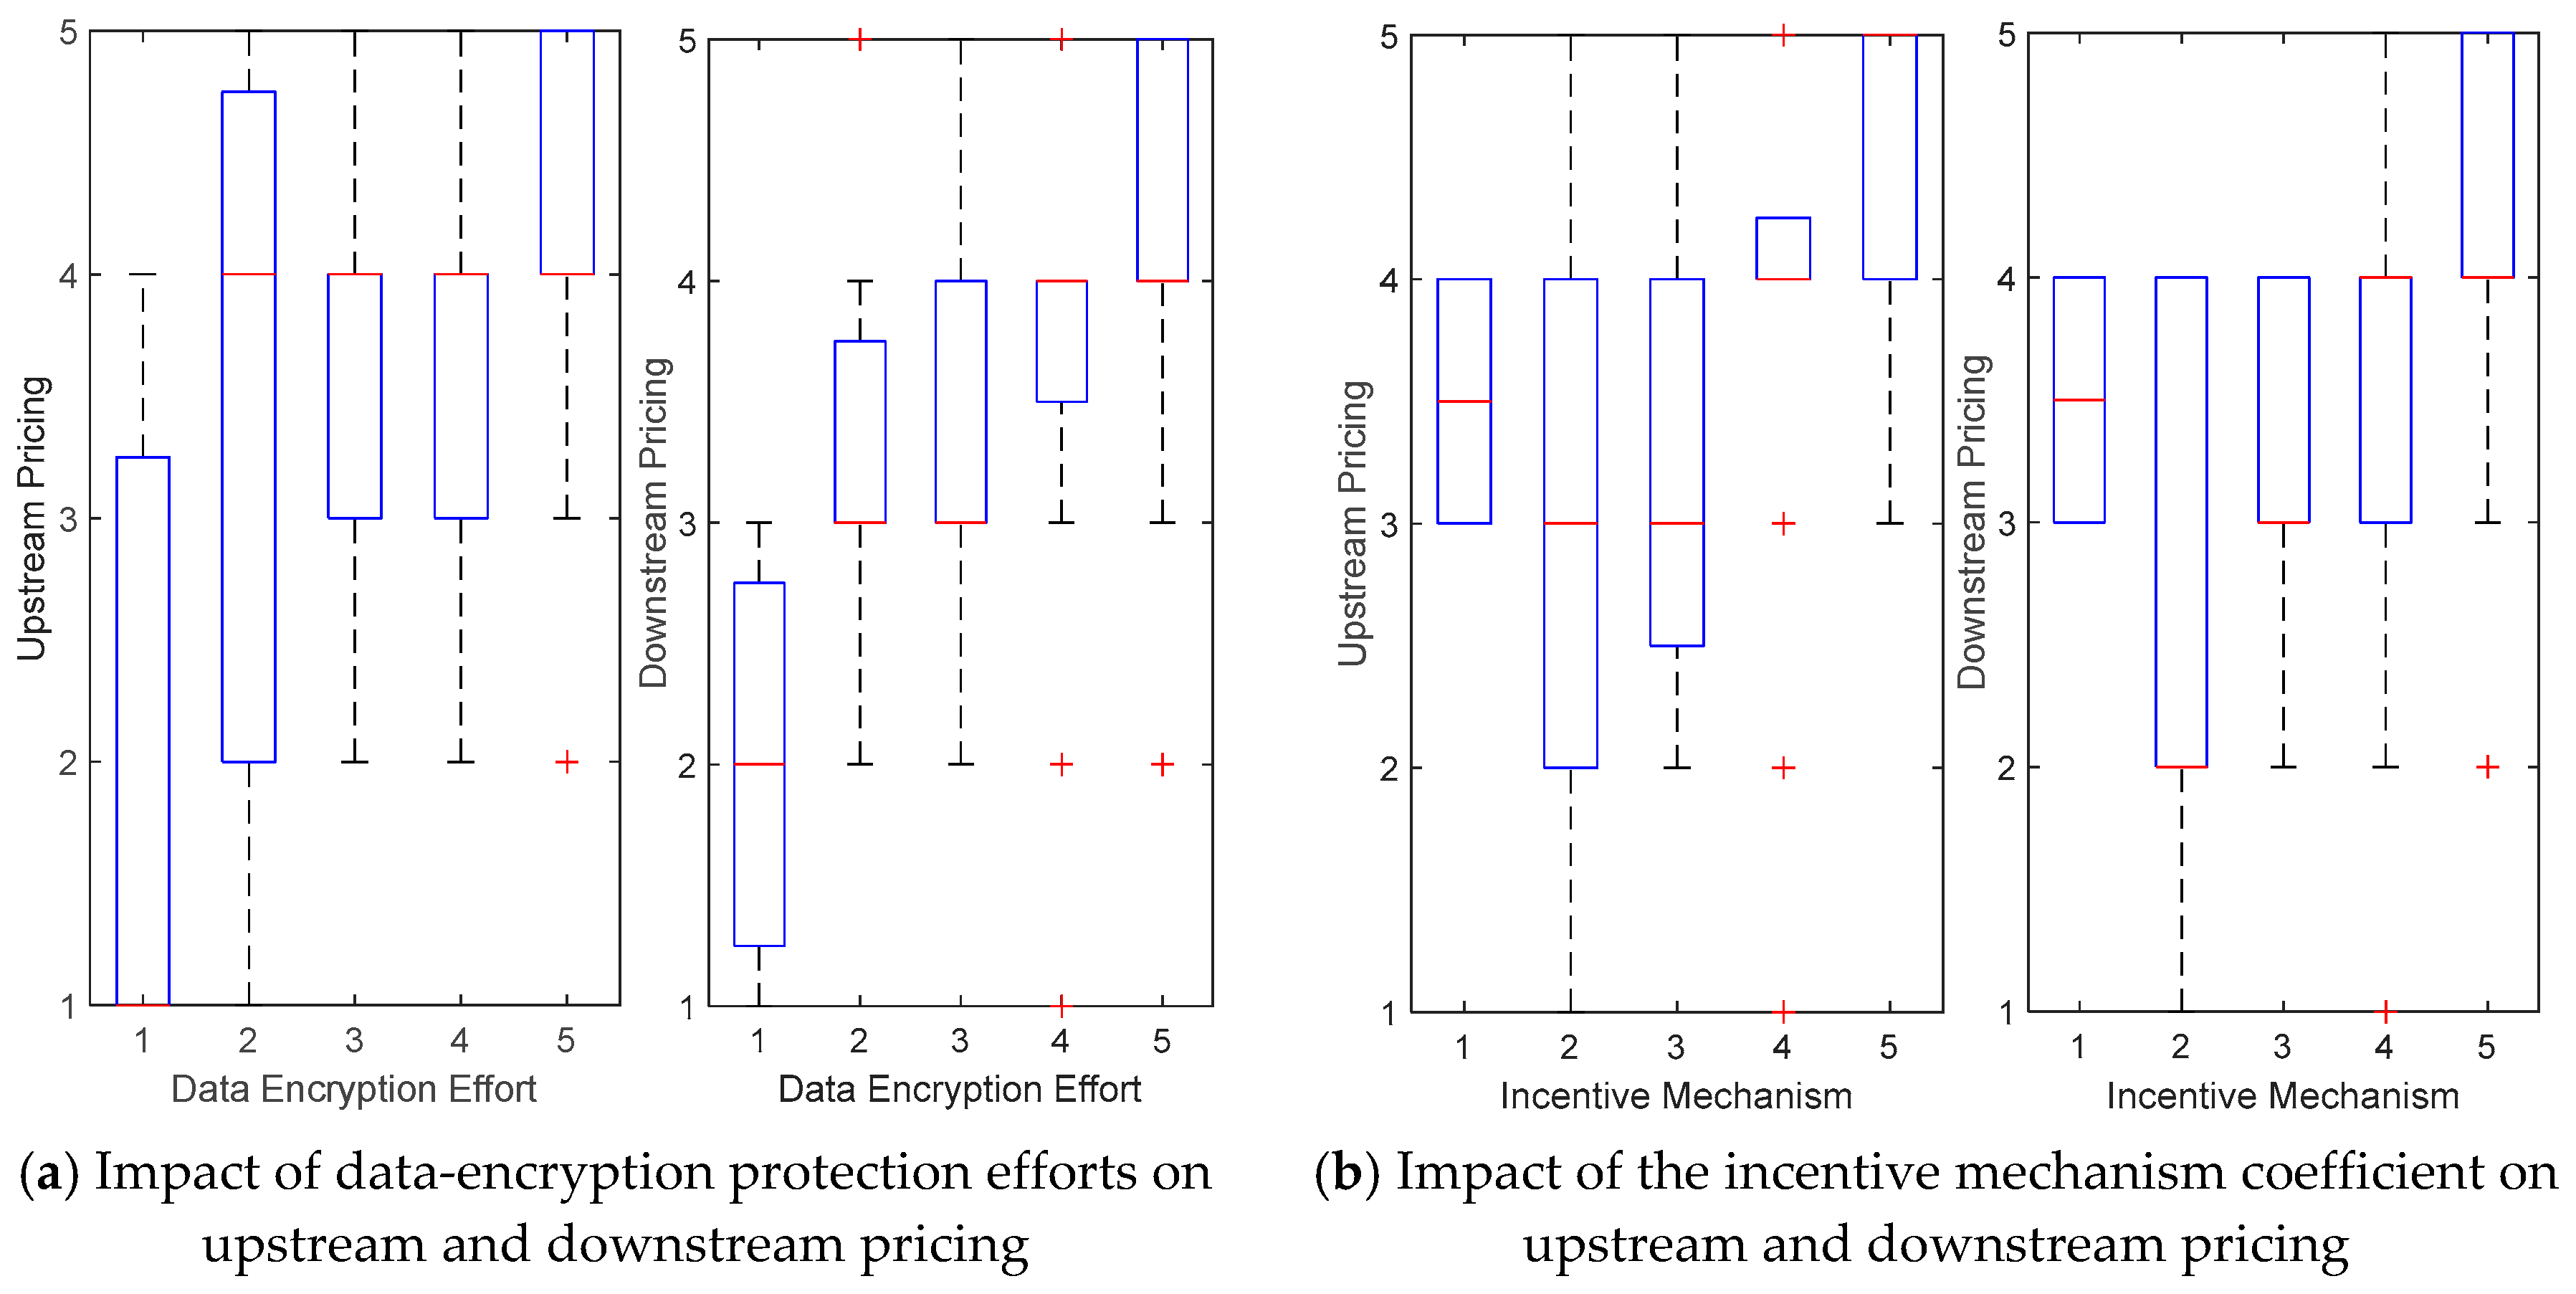

Table 1.
Illustration of parameters.
| symbol | meaning |
|---|---|
| Represents the level of effort in data-encryption protection , where . It quantifies the intensity of participants' input in protection measures., | |
| Denotes the degree of data discount , where , used to measure the price loss of data during the transaction process., | |
| Represents the data acquisition cost, reflecting the expenses incurred by data providers for data collection, processing, and transmission. | |
| Indicates potential market demand, measuring the market's purchase intention and the scale of demand for the data. | |
| Refers to the data-encryption protection cost coefficient, describing how sensitive the encryption cost is to changes in the level of protection effort. | |
| The data provider decides the selling price | |
| The data demanders decide the selling price | |
| Quantifies the market's sensitivity to price fluctuations of data, indicating how demand responds to price changes. | |
| Represents the scarcity of data, reflecting its availability and exclusivity in the market. | |
| Denotes the transaction proportion of sensitive data , where . It quantifies the share of sensitive data in overall market transactions. | |
| Represents the incentive mechanism coefficient , where , to describe the degree of influence that incentives have on the behavior of market participants. |
Table 2.
Values of parameter simulation.
| parameter | |||||||||
|---|---|---|---|---|---|---|---|---|---|
| numeric value | 0.3 | 0.3 | 3 | 150 | 5 | 7 | 3 | 0.3 | 0.3 |
Table 3.
Descriptive statistical analysis.
| mean | standard error | mode | least value | crest value | |
|---|---|---|---|---|---|
| 3.862 | 1.064 | 4 | 1 | 5 | |
| 3.702 | 1.096 | 4 | 1 | 5 | |
| 3.766 | 1.072 | 4 | 1 | 5 | |
| 3.606 | 1.128 | 4 | 1 | 5 | |
| 3.926 | 1.029 | 4 | 1 | 5 | |
| 3.809 | 1.148 | 4 | 1 | 5 | |
| 3.957 | 1.126 | 5 | 1 | 5 | |
| 3.809 | 1.029 | 4 | 1 | 5 | |
| 3.681 | 0.986 | 4 | 1 | 5 | |
| 3.745 | 1.154 | 4 | 1 | 5 | |
| 3.798 | 1.223 | 5 | 1 | 5 |
Table 4.
Pearson’s correlation matrix.
| 1 | 0.474 | 0.442 | 0.471 | 0.363 | 0.437 | 0.419 | 0.514 | 0.491 | 0.527 | 0.396 | |
| 0.474 | 1 | 0.419 | 0.497 | 0.308 | 0.369 | 0.408 | 0.409 | 0.378 | 0.295 | 0.376 | |
| 0.442 | 0.419 | 1 | 0.534 | 0.554 | 0.504 | 0.432 | 0.491 | 0.483 | 0.514 | 0.501 | |
| 0.471 | 0.497 | 0.534 | 1 | 0.410 | 0.560 | 0.449 | 0.515 | 0.501 | 0.535 | 0.426 | |
| 0.363 | 0.308 | 0.554 | 0.410 | 1 | 0.410 | 0.424 | 0.455 | 0.228 | 0.356 | 0.419 | |
| 0.437 | 0.369 | 0.504 | 0.560 | 0.410 | 1 | 0.501 | 0.447 | 0.387 | 0.502 | 0.456 | |
| 0.419 | 0.408 | 0.432 | 0.449 | 0.424 | 0.501 | 1 | 0.542 | 0.338 | 0.568 | 0.468 | |
| 0.514 | 0.409 | 0.491 | 0.515 | 0.455 | 0.447 | 0.542 | 1 | 0.504 | 0.543 | 0.490 | |
| 0.491 | 0.378 | 0.483 | 0.501 | 0.228 | 0.387 | 0.338 | 0.504 | 1 | 0.444 | 0.620 | |
| 0.527 | 0.295 | 0.514 | 0.535 | 0.356 | 0.502 | 0.568 | 0.543 | 0.444 | 1 | 0.508 | |
| 0.396 | 0.376 | 0.501 | 0.426 | 0.419 | 0.456 | 0.468 | 0.490 | 0.620 | 0.508 | 1 |
Disclaimer/Publisher’s Note: The statements, opinions and data contained in all publications are solely those of the individual author(s) and contributor(s) and not of MDPI and/or the editor(s). MDPI and/or the editor(s) disclaim responsibility for any injury to people or property resulting from any ideas, methods, instructions or products referred to in the content. |
© 2025 by the authors. Licensee MDPI, Basel, Switzerland. This article is an open access article distributed under the terms and conditions of the Creative Commons Attribution (CC BY) license (http://creativecommons.org/licenses/by/4.0/).
Copyright: This open access article is published under a Creative Commons CC BY 4.0 license, which permit the free download, distribution, and reuse, provided that the author and preprint are cited in any reuse.


