Submitted:
10 February 2025
Posted:
12 February 2025
You are already at the latest version
Abstract
Persistent homology is a powerful tool in topological data analysis that captures the multi-scale topological features of data. In this work, we provide a mathematical introduction to persistent homology and demonstrate its application to protein-protein interaction networks. We combine persistent homology with algebraic connectivity, a graph-theoretic measure of network robustness, to analyze the topology and stability of PPI networks. An example is provided to illustrate the methodology and its potential applications in systems biology.
Keywords:
Topology and Stability Analysis
; Persistent Homology
; Topological Data Analysis
; Protein-Protein Interaction Networks
; Algebraic Connectivity
; Network Robustness
; Systems Biology
MSC: 55N31; 62R40; 68T09; 92-08
1. Introduction
Topological data analysis (TDA) has emerged as a powerful framework for studying the shape and structure of complex datasets. Unlike traditional statistical methods that focus on local or linear structures, TDA provides a global perspective, capturing the intrinsic geometric and topological properties of data. This capability makes TDA particularly useful in high-dimensional, noisy, and incomplete datasets commonly encountered in biological and network sciences.
Persistent homology, a key tool in TDA, allows us to analyze data at multiple scales and extract robust topological features such as connected components, loops, and voids. These features are characterized by their "birth" and "death" across different scales, providing insights into the underlying data’s shape and stability. Persistent diagrams and barcodes are common visualization tools that help interpret these features, revealing patterns that might be hidden using conventional analysis techniques.
In this work, we focus on the application of persistent homology to protein-protein interaction (PPI) networks. PPI networks represent the physical interactions between proteins in a cell and are fundamental for understanding cellular functions, signaling pathways, and disease mechanisms. Analyzing the topology of PPI networks can uncover critical proteins (hubs), functional modules, and network robustness, which are essential for drug discovery and systems biology.
By combining persistent homology with algebraic connectivity, we aim to provide a comprehensive understanding of the topology and robustness of PPI networks. Algebraic connectivity, derived from the second-smallest eigenvalue of the Laplacian matrix of a graph, measures the network’s overall connectedness and resilience to node or edge removal. Integrating this metric with persistent homology enables us to correlate topological features with network stability, offering a multi-faceted view of PPI networks.
Our methodology involves constructing simplicial complexes from PPI networks, typically using the Vietoris-Rips complex, where simplices represent higher-order interactions among proteins. We then compute persistent homology to identify significant topological features across different interaction thresholds. By analyzing these features alongside algebraic connectivity measures, we can detect structural vulnerabilities and functional clusters within the network.
The results of this study are expected to enhance our understanding of PPI network dynamics, identify potential biomarkers, and suggest targets for therapeutic intervention. Furthermore, the combined approach of TDA and algebraic connectivity can be generalized to other biological networks, offering a versatile framework for complex data analysis.
2. Mathematical Foundations of Persistent Homology
Persistent homology is based on the concept of a filtration, which is a nested sequence of topological spaces:
This sequence typically arises from data, where each space represents the structure of the data at a particular scale or threshold. Filtrations can be constructed in various ways, such as Vietoris-Rips complexes, Čech complexes, or sublevel sets of a scalar function.
For each space , we compute its homology groups , which capture topological features across different dimensions:
- : Connected components
- : Loops or cycles
- : Voids or cavities
- Higher : Higher-dimensional analogs
These homology groups are typically computed over a field, such as ,also known as the finite field with two elements (0 and 1) ,to simplify calculations. Over , homology groups can have complicated torsion subgroups (elements of finite order). Working over a field, especially for a prime p, eliminates torsion-related issues because all modules over a field are vector spaces, which are simpler to handle.
As the filtration progresses, topological features are born (appear) and die (disappear). Persistent homology tracks these features across the filtration, recording their birth and death indices, which correspond to the scales at which the features emerge and vanish.
The output of persistent homology is a persistence diagram, which is a multiset of points in the plane . Each point represents a topological feature:
- b (birth): The filtration index or scale at which the feature appears.
- d (death): The filtration index or scale at which the feature disappears.
The persistence of a feature is given by , which measures its lifespan within the filtration. Features with long persistence are typically considered to reflect meaningful topological structures in the data, while those with short persistence may be attributed to noise.
Mathematically, persistent homology can be formalized using the language of algebraic topology and category theory. A filtration induces a sequence of homology groups connected by homomorphisms:
These maps allow us to track the evolution of homology classes across the filtration. The structure of persistent homology can be described using persistence modules, which are sequences of vector spaces connected by linear maps. The classification of these modules leads to the representation of persistent homology as barcodes or persistence diagrams.
An alternative visualization is the barcode, where each feature is represented by a horizontal line spanning its birth and death indices. Barcodes and persistence diagrams provide complementary perspectives on the topological features present in the data.
Persistent homology has broad applications in data analysis, including shape recognition, sensor networks, image processing, and biological data analysis. Its robustness to noise and invariance under continuous transformations make it a powerful tool in topological data analysis.
3. Protein-Protein Interaction Networks
Protein-protein interaction (PPI) networks are graphs , where V is the set of proteins (nodes) and E is the set of interactions (edges). These networks play a crucial role in understanding cellular processes, as they represent the physical interactions between proteins. The topology of PPI networks is often characterized by the presence of functional modules or protein complexes, which correspond to densely connected subgraphs.
PPI networks are essential for studying the functional organization of the cell. They provide insights into how proteins work together to perform biological functions, such as signal transduction, metabolic pathways, and regulatory mechanisms. By analyzing these networks, researchers can identify key proteins that are central to many interactions, often referred to as "hubs." These hub proteins are critical for maintaining the integrity and functionality of the network.
One of the challenges in studying PPI networks is their inherent complexity. The networks are often large, with thousands of nodes and edges, and they can be noisy due to false-positive interactions. To address these challenges, various computational methods have been developed to predict interactions, filter out noise, and identify functional modules. These methods include clustering algorithms, machine learning techniques, and network-based approaches.
3.1. Applications of PPI Networks
PPI networks have a wide range of applications in bioinformatics and systems biology. They are used to predict protein function, identify drug targets, and understand disease mechanisms. For example, by comparing PPI networks of healthy and diseased tissues, researchers can identify proteins that are differentially expressed or interact differently in disease states. These proteins can then be targeted for therapeutic intervention.
Another important application of PPI networks is in the study of evolutionary biology. By comparing PPI networks across different species, researchers can gain insights into the conservation of protein interactions and the evolution of cellular processes. This comparative analysis can reveal how proteins and their interactions have evolved over time and how they contribute to the diversity of life.
In conclusion, PPI networks are powerful tools for understanding the complex interactions between proteins in a cell. They provide a framework for analyzing the functional organization of the cell and have numerous applications in biomedical research. As computational methods continue to improve, our ability to analyze and interpret PPI networks will only grow, leading to new discoveries and advancements in the field of systems biology.
3.2. Example of a PPI Network
To illustrate the concept of a PPI network, consider a more complex example involving ten proteins, labeled to . The interactions between these proteins are represented as edges in a graph. Below is a TikZ diagram that visualizes this network, with varying edge weights and node styles to represent different types of interactions and protein roles.
In Figure 2, each node represents a protein, and each edge represents an interaction between two proteins. The node is highlighted as a hub protein, indicated by its red fill, due to its central role in the network. The edges are styled differently to represent the strength of interactions: thick solid lines indicate strong interactions, dashed lines indicate weak interactions, and regular solid lines represent moderate interactions.
For example, interacts strongly with and , while its interaction with is weaker. Similarly, is a key protein that interacts strongly with and , forming a densely connected subgraph that could represent a functional module or protein complex.
This network can be analyzed to identify functional modules, key proteins, and the overall structure of the network. Such analyses are crucial for understanding the biological roles of proteins and their interactions in cellular processes.
3.3. PPI Persistent Homology Evaluation
Considering the PPI network described at Figure 2, with 10 proteins represented as nodes, with interactions between them forming the edges. The network structure is as follows:
- Number of Nodes (Proteins): 10
- Number of Edges (Interactions): 15
- Graph Type: Undirected and unweighted
The persistent homology analysis provides insight into two topological features:
- Connected components (): Measures how the network fragments or remains connected.
- Loops (): Represents cycles in the network, which indicate alternative interaction pathways and robustness.
The persistence analysis of the network yields the following results:

Table 1.
Persistent homology results showing connected components and loops.
| Feature | Birth | Death |
|---|---|---|
| Connected Component () | 0.0 | ∞ |
| Loop 1 () | 3.0 | 3.74 |
| Loop 2 () | 3.0 | 3.74 |
| Loop 3 () | 3.0 | 4.35 |
3.3.1. Connected Components ()
The analysis detected a single connected component, meaning all proteins are interconnected, either directly or indirectly. The component persists indefinitely (∞), indicating a fully connected PPI network with no isolated proteins.
3.3.2. Loops ()
Three cycles were identified in the network, appearing at birth times of and persisting until ,for two of them, and , respectively. Only counts independent cycles, not combinations of other loops. These cycles represent alternative interaction pathways within the network. The persistence of these loops suggests structural robustness, implying redundancy in biological interactions, which is beneficial for cellular resilience against mutations or disruptions.
Figure 3.
Persistence diagram illustrating the birth and death times of connected components and loops.
Figure 3.
Persistence diagram illustrating the birth and death times of connected components and loops.
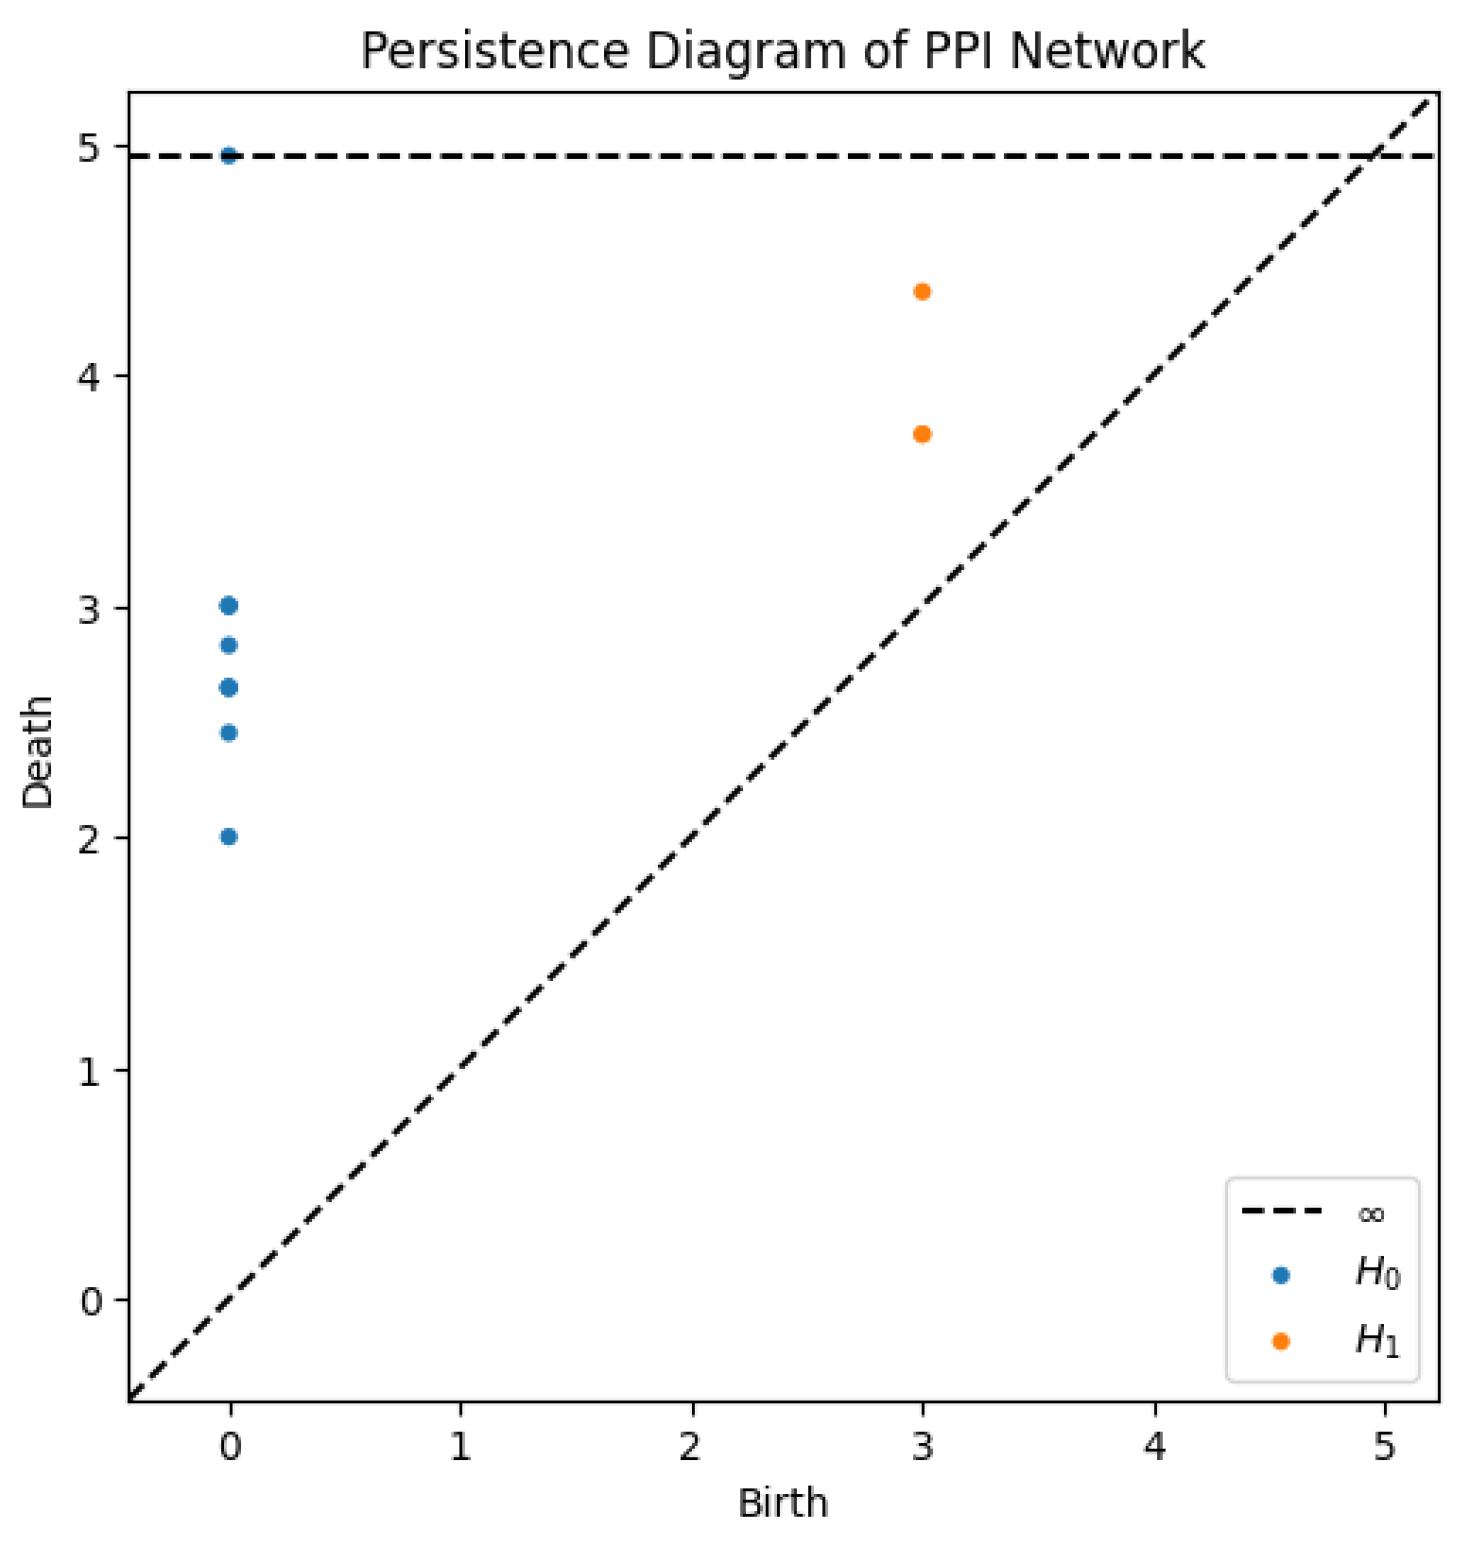
Figure 4.
Barcode diagram showing the lifetime of each feature.
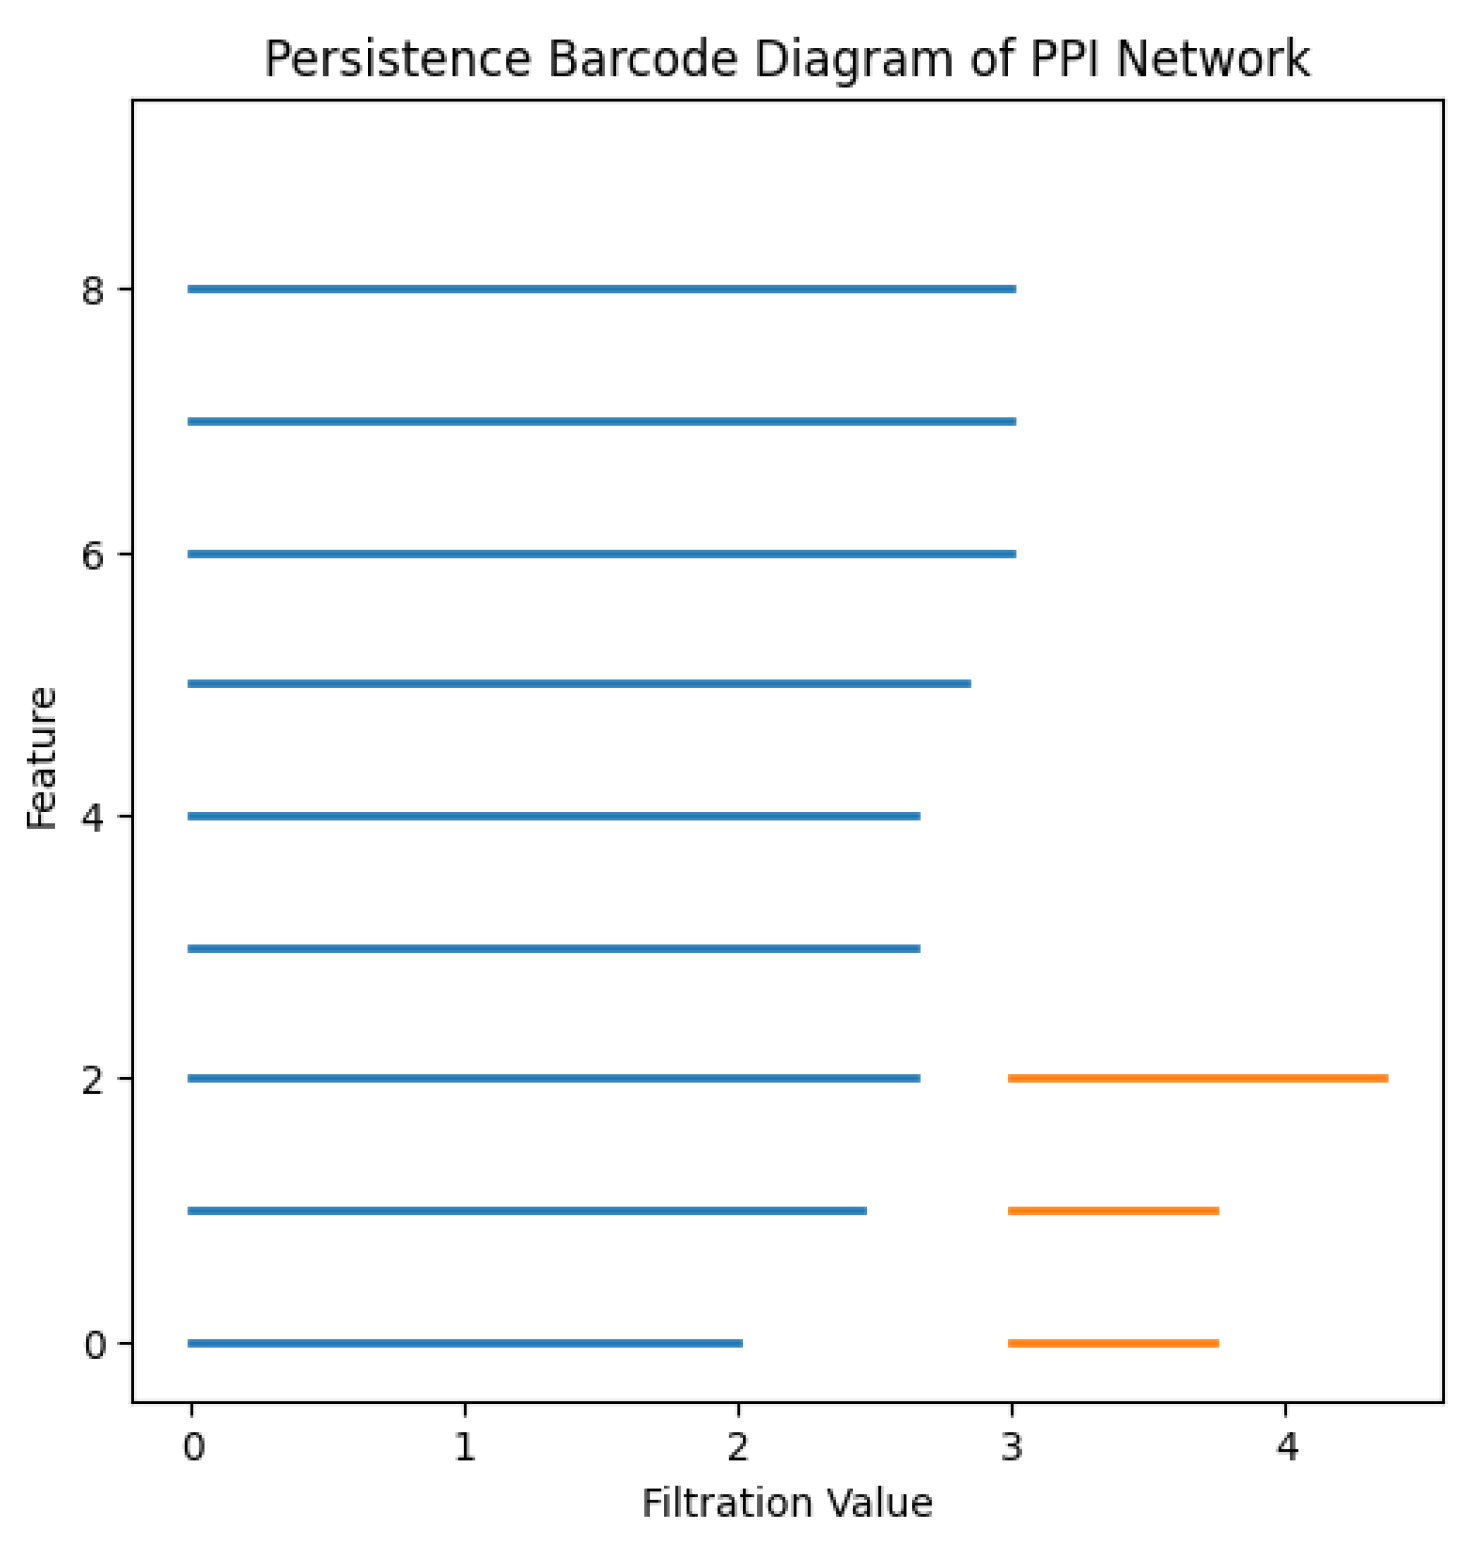
The persistent homology analysis of this PPI network highlights one dominant connected component, confirming strong connectivity among proteins. The presence of two persistent cycles suggests redundant interaction pathways, which enhance biological robustness. These findings contribute to the understanding of network resilience and functional stability in biological systems.
3.4. Example of a PPI Network: MAPK Signaling Pathway
To illustrate a more biologically complex example of a PPI network, consider the Mitogen-Activated Protein Kinase (MAPK) signaling pathway. This pathway is highly conserved and involves a series of protein interactions that transmit signals from the cell surface to the nucleus, regulating gene expression and cellular responses. Below is a TikZ diagram representing a simplified PPI network of key proteins in the MAPK pathway, including receptors, kinases, and transcription factors.
In Figure 5
- EGFR (Epidermal Growth Factor Receptor) is a receptor tyrosine kinase that initiates the signaling cascade upon ligand binding.
- GRB2 (Growth Factor Receptor-Bound Protein 2) and SOS (Son of Sevenless) are adaptor proteins that link EGFR to the small GTPase RAS.
- RAS activates RAF (a MAPK kinase kinase), which phosphorylates and activates MEK (a MAPK kinase).
- MEK then phosphorylates and activates ERK (Extracellular Signal-Regulated Kinase), a key MAPK.
- ERK translocates to the nucleus and activates transcription factors such as ELK1 and FOS, which regulate gene expression.
3.5. MAPK Persistent Homology Evaluation
The persistent homology analysis of the MAPK signaling pathway graph reveals its topological structure and connectivity. The persistence diagram, Figure 6, and birth-death table indicate the following:
3.5.1. Connected Components ()
The graph is fully connected, as evidenced by a single persistent connected component with a birth time of and a death time of infinity (∞). This means that all nodes in the graph are part of a single connected structure, and no additional components emerge or persist as the filtration value increases.
3.5.2. Loops ()
No loops (cycles) are present in the graph, as the persistence diagram for dimension 1 is empty. This is consistent with the structure of the MAPK pathway, which is a directed acyclic graph with no cyclic interactions.
The MAPK pathway is a highly conserved signaling cascade that plays a critical role in regulating cellular processes such as proliferation, differentiation, and response to external stimuli. The pathway is initiated by the activation of EGFR, which propagates the signal through a series of protein interactions (GRB2, SOS, RAS, RAF, MEK, ERK) and ultimately leads to the activation of transcription factors like ELK1 and FOS. These transcription factors modulate gene expression, influencing cell behavior and fate.
The persistent homology analysis of the MAPK pathway graph reveals its tree-like structure, characterized by a single connected component and the absence of loops. This reflects the pathway’s linear and hierarchical nature, where signals flow in a directed manner without feedback loops at this level of abstraction. The simplicity of its topology underscores the efficiency of the MAPK pathway in transmitting signals from the cell surface to the nucleus, ensuring precise and controlled cellular responses.
3.6. Applications of PPI Networks in Disease Research
PPI networks like the MAPK pathway are invaluable for understanding disease mechanisms. For example, mutations in EGFR or RAS are commonly found in cancers, leading to constitutive activation of the pathway and uncontrolled cell proliferation. By mapping these interactions, one can identify potential drug targets and develop targeted therapies. Recent advances in network biology have enabled the integration of PPI data with genomic and transcriptomic data, providing a more comprehensive understanding of disease pathways [2].
4. Combining Persistent Homology and Algebraic Connectivity
The integration of persistent homology and algebraic connectivity offers a powerful approach to analyzing protein-protein interaction (PPI) networks. These two mathematical tools complement each other by providing insights into both the topological and spectral properties of a network. While persistent homology reveals multi-scale topological features, algebraic connectivity quantifies the robustness and overall cohesion of the network. The combination of these methods enhances our ability to extract meaningful biological information from PPI networks.
Persistent homology, rooted in topological data analysis, captures the evolution of topological structures across multiple scales. By constructing a sequence of simplicial complexes from a given PPI network and tracking the birth and death of topological features such as connected components, loops, and voids, persistent homology encodes the network’s hierarchical organization.
On the other hand, algebraic connectivity, defined as the second-smallest eigenvalue of the Laplacian matrix of a graph, measures the network’s global connectivity and resilience. A higher algebraic connectivity indicates a well-connected and robust network, whereas a lower value suggests vulnerabilities in the network structure. This spectral property provides critical information regarding the network’s resistance to fragmentation and the efficiency of information flow across the system.
By jointly leveraging persistent homology and algebraic connectivity, we can gain a more holistic understanding of PPI networks. Persistent homology uncovers latent topological features that are not immediately apparent from standard graph-theoretic analyses, while algebraic connectivity quantifies the ease of communication and structural integrity of the network. This dual perspective enables researchers to identify key functional modules, detect structural vulnerabilities, and infer the biological significance of network topology. Furthermore, integrating these techniques can aid in the study of disease-related alterations in PPI networks, potentially leading to novel insights in systems biology and network medicine.
4.1. Algebraic Connectivity and Its Role in Network Analysis
The algebraic connectivity of a graph G is the second smallest eigenvalue ( is always non-negative, and if and only if the graph is disconnected) of its Laplacian matrix L. The Laplacian matrix is defined as:
where D is the degree matrix and A is the adjacency matrix of G.
Algebraic connectivity plays a critical role in various applications across network analysis:
- Robustness and Resilience: Networks with higher are more resilient to node or edge failures, making this measure crucial in designing robust communication and transportation systems.
- Synchronization: In dynamical systems, such as power grids or coupled oscillators, a larger facilitates faster synchronization.
- Community Detection: The Fiedler vector associated with helps identify natural clusters within the graph, aiding in community detection algorithms.
- Epidemic Spread: Understanding assists in modeling the spread of information or diseases across networks, as it influences the speed and reach of propagation.
4.2. PPI Algebraic Connectivity Evaluation
Consider the simple graph from Figure 2 with 10 nodes, and we want to compute its algebraic connectivity. Algebraic connectivity is defined as the second-smallest eigenvalue of the graph Laplacian matrix.
The graph G has the following vertices:
The edges E of the graph correspond to interactions between proteins, as previous mentioned, which can be classified as either strong or weak:
- Strong edges are between and , and , and , and and .
- Weak edges are between and , and between and .
- Other interactions between proteins are represented by ordinary edges.
On the Laplacian matrix L 3 D is the degree matrix, a diagonal matrix where each entry represents the degree of node i, i.e., the number of edges incident to that node:
- Degree of : (edges with , , and ).
- Degree of : (edges with and ).
- Degree of : (edges with , , and ).
- Degree of : (edges with , , and ).
- Degree of : (edges with , , , and ).
- Degree of : (edges with and ).
- Degree of : (edges with , , and ).
- Degree of : (edges with , , and ).
- Degree of : (edges with , , and ).
- Degree of : (edges with and ).
Thus, the degree matrix D is:
The adjacency matrix A is a matrix where if there is an edge between nodes i and j, and otherwise.
To study the impact of edge removals, we computed the algebraic connectivity for the original graph and after removing each edge one by one. The results are summarized in Table 2, sorted in descending order of algebraic connectivity.
From the results, we observe that the removal of edge (P8, P9) has the least impact on the algebraic connectivity, indicating that this edge is less critical for overall connectivity. Conversely, the removal of edge (P7, P8) significantly decreases the algebraic connectivity, making it a crucial edge in the network. Understanding these variations can help in designing more resilient networks and improving fault tolerance in real-world applications.
5. Discussion and Applications
The combination of persistent homology and algebraic connectivity provides a powerful framework for analyzing protein-protein interaction (PPI) networks. These mathematical tools allow for a deeper understanding of the topological and spectral properties of biological networks, offering several promising applications in systems biology and bioinformatics.
One significant application is the identification of functional modules or protein complexes. Persistent homology enables the detection of higher-order topological structures within PPI networks, revealing clusters of interacting proteins that may correspond to biological pathways or cellular functions [3,4]. Algebraic connectivity, derived from the second smallest eigenvalue of the Laplacian matrix, provides insights into the cohesiveness of these clusters [5].
Another crucial application is assessing the impact of perturbations, such as protein deletions or mutations, on network stability. By studying changes in topological features and spectral properties before and after perturbations, researchers can predict critical nodes whose removal may lead to network fragmentation [6]. This approach has been particularly useful in understanding the robustness of signaling pathways and identifying potential drug targets [7].
Furthermore, the framework can be used to compare PPI networks from healthy and diseased states. Topological and spectral differences between networks associated with different physiological conditions can reveal key biomarkers or pathogenic mechanisms [8]. For instance, alterations in homological features and connectivity measures have been linked to neurodegenerative diseases and cancer [9].
These applications illustrate the power of integrating persistent homology and algebraic connectivity in network biology, paving the way for novel insights into complex biological systems.
6. Conclusion
In this work, we have provided a mathematical introduction to persistent homology and demonstrated its application to protein-protein interaction networks. By combining persistent homology with algebraic connectivity, we have developed a comprehensive framework for analyzing the topology and robustness of protein-protein interaction networks. This approach offers a novel perspective on network structure, capturing both local and global features that traditional graph-theoretic methods may overlook.
Our results highlight the ability of persistent homology to identify topological invariants that characterize network stability, modular organization, and critical functional components. By integrating these insights with algebraic connectivity, we have created a powerful toolset for quantifying the resilience of biological networks to perturbations, such as node deletions or edge disruptions. These findings have broad implications in systems biology, particularly for understanding disease mechanisms, identifying potential drug targets, and modeling the dynamic evolution of cellular networks.
Furthermore, the methodology we propose extends beyond PPI networks and can be applied to various complex systems, including social networks, communication networks, and ecological systems. Future research may explore refinements to this approach, such as incorporating weighted or temporal networks, integrating machine learning techniques for pattern recognition, and enhancing computational efficiency for large-scale biological datasets.
By bridging topological data analysis with network science, our work provides a robust framework for studying the structural and functional properties of complex networks, paving the way for deeper insights into biological organization and beyond.
Acknowledgments
This research was partially sponsored with national funds through the Fundação Nacional para a Ciência e Tecnologia, Portugal-FCT, under projects UIDB/04674/2020 (CIMA). DOI: https://doi.org/10.54499/UIDB/04674/2020
Conflicts of Interest
The authors declare no conflict of interest.
References
- Samatar, A.A.; Poulikakos, P.I. Targeting the MAPK pathway in cancer therapy. Cancer Cell 2014, 25, 283–284. [Google Scholar]
- Leiserson, M.D.; Vandin, F.; Wu, H.T.; Dobson, J.R.; Eldridge, J.V.; Thomas, J.L.; Papoutsaki, A.; Kim, Y.; Niu, B.; McLellan, M.; et al. Network-based approaches for understanding gene regulation and function in cancer. Nature Reviews Genetics 2020, 21, 774–790. [Google Scholar]
- Horak, D.; Maletić, S.; Rajković, M. Persistent homology of complex networks. Journal of Statistical Mechanics: Theory and Experiment 2009, 2009, P03034. [Google Scholar] [CrossRef]
- Petri, G.; et al. Homological scaffolds of brain functional networks. Journal of The Royal Society Interface 2014, 11, 20140873. [Google Scholar] [CrossRef] [PubMed]
- Mohar, B. The Laplacian spectrum of graphs. In Graph Theory, Combinatorics, and Applications; 1991; Vol. 2, pp. 871–898.
- Giusti, C.; et al. Two’s company, three (or more) is a simplex: Algebraic-topological tools for understanding higher-order structure in neural data. Journal of Computational Neuroscience 2016, 41, 1–14. [Google Scholar] [CrossRef] [PubMed]
- De Silva, V.; Ghrist, R. Coverage in sensor networks via persistent homology. Algebraic and Geometric Topology 2007, 7, 339–358. [Google Scholar] [CrossRef]
- Karbalaei, R.; et al. Protein-protein interaction analysis of Alzheimer`s disease and NAFLD based on systems biology methods unhide common ancestor pathways. Gastroenterol Hepatol Bed Bench. 2018, 11. [Google Scholar]
- Stolz, B.; Harrington, H.; Porter, M. Persistent homology of time-dependent functional networks constructed from coupled time series. Chaos 2017, 27. [Google Scholar] [CrossRef] [PubMed]
Figure 1.
Filtration and Induced Homology Maps
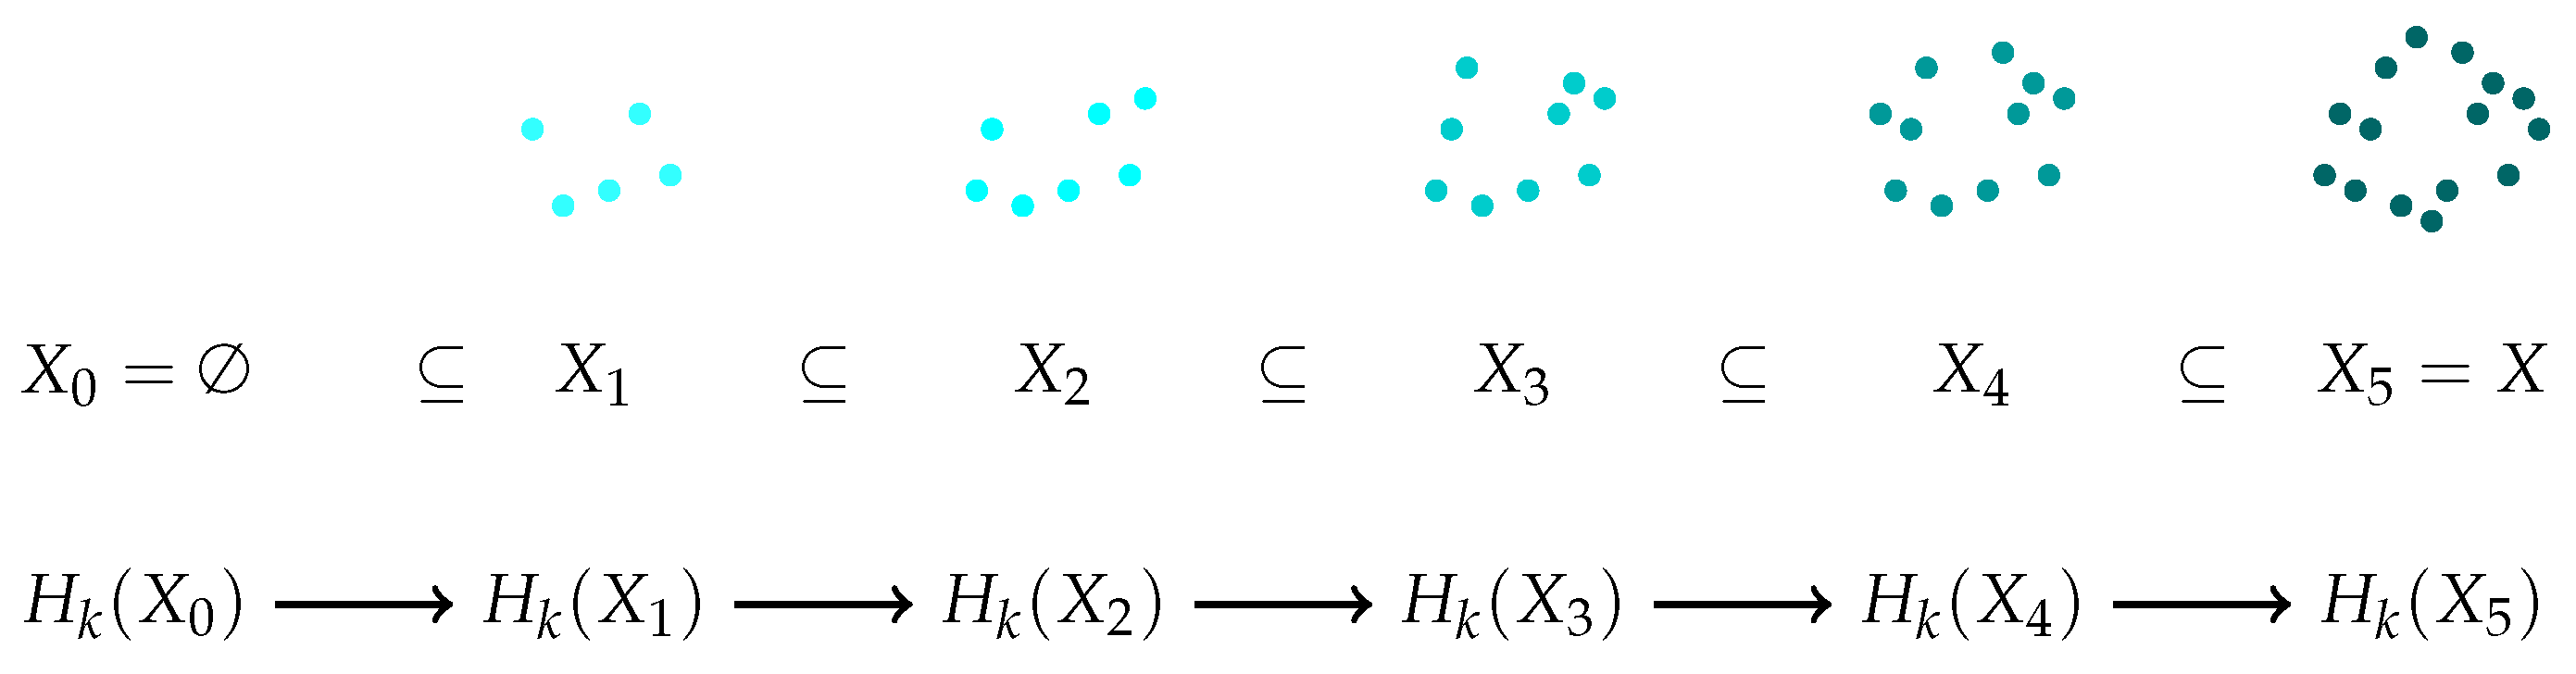
Figure 2.
A Protein-Protein Interaction network highlighting key interactions and functional modules. Nodes represent proteins, with the central hub protein (red) playing a critical role in the network. Solid lines represent strong interactions, dashed lines represent weak interactions, and regular lines represent standard interactions. The network illustrates the connectivity and potential functional relationships between proteins, such as , , , and others, which may form functional modules or complexes.
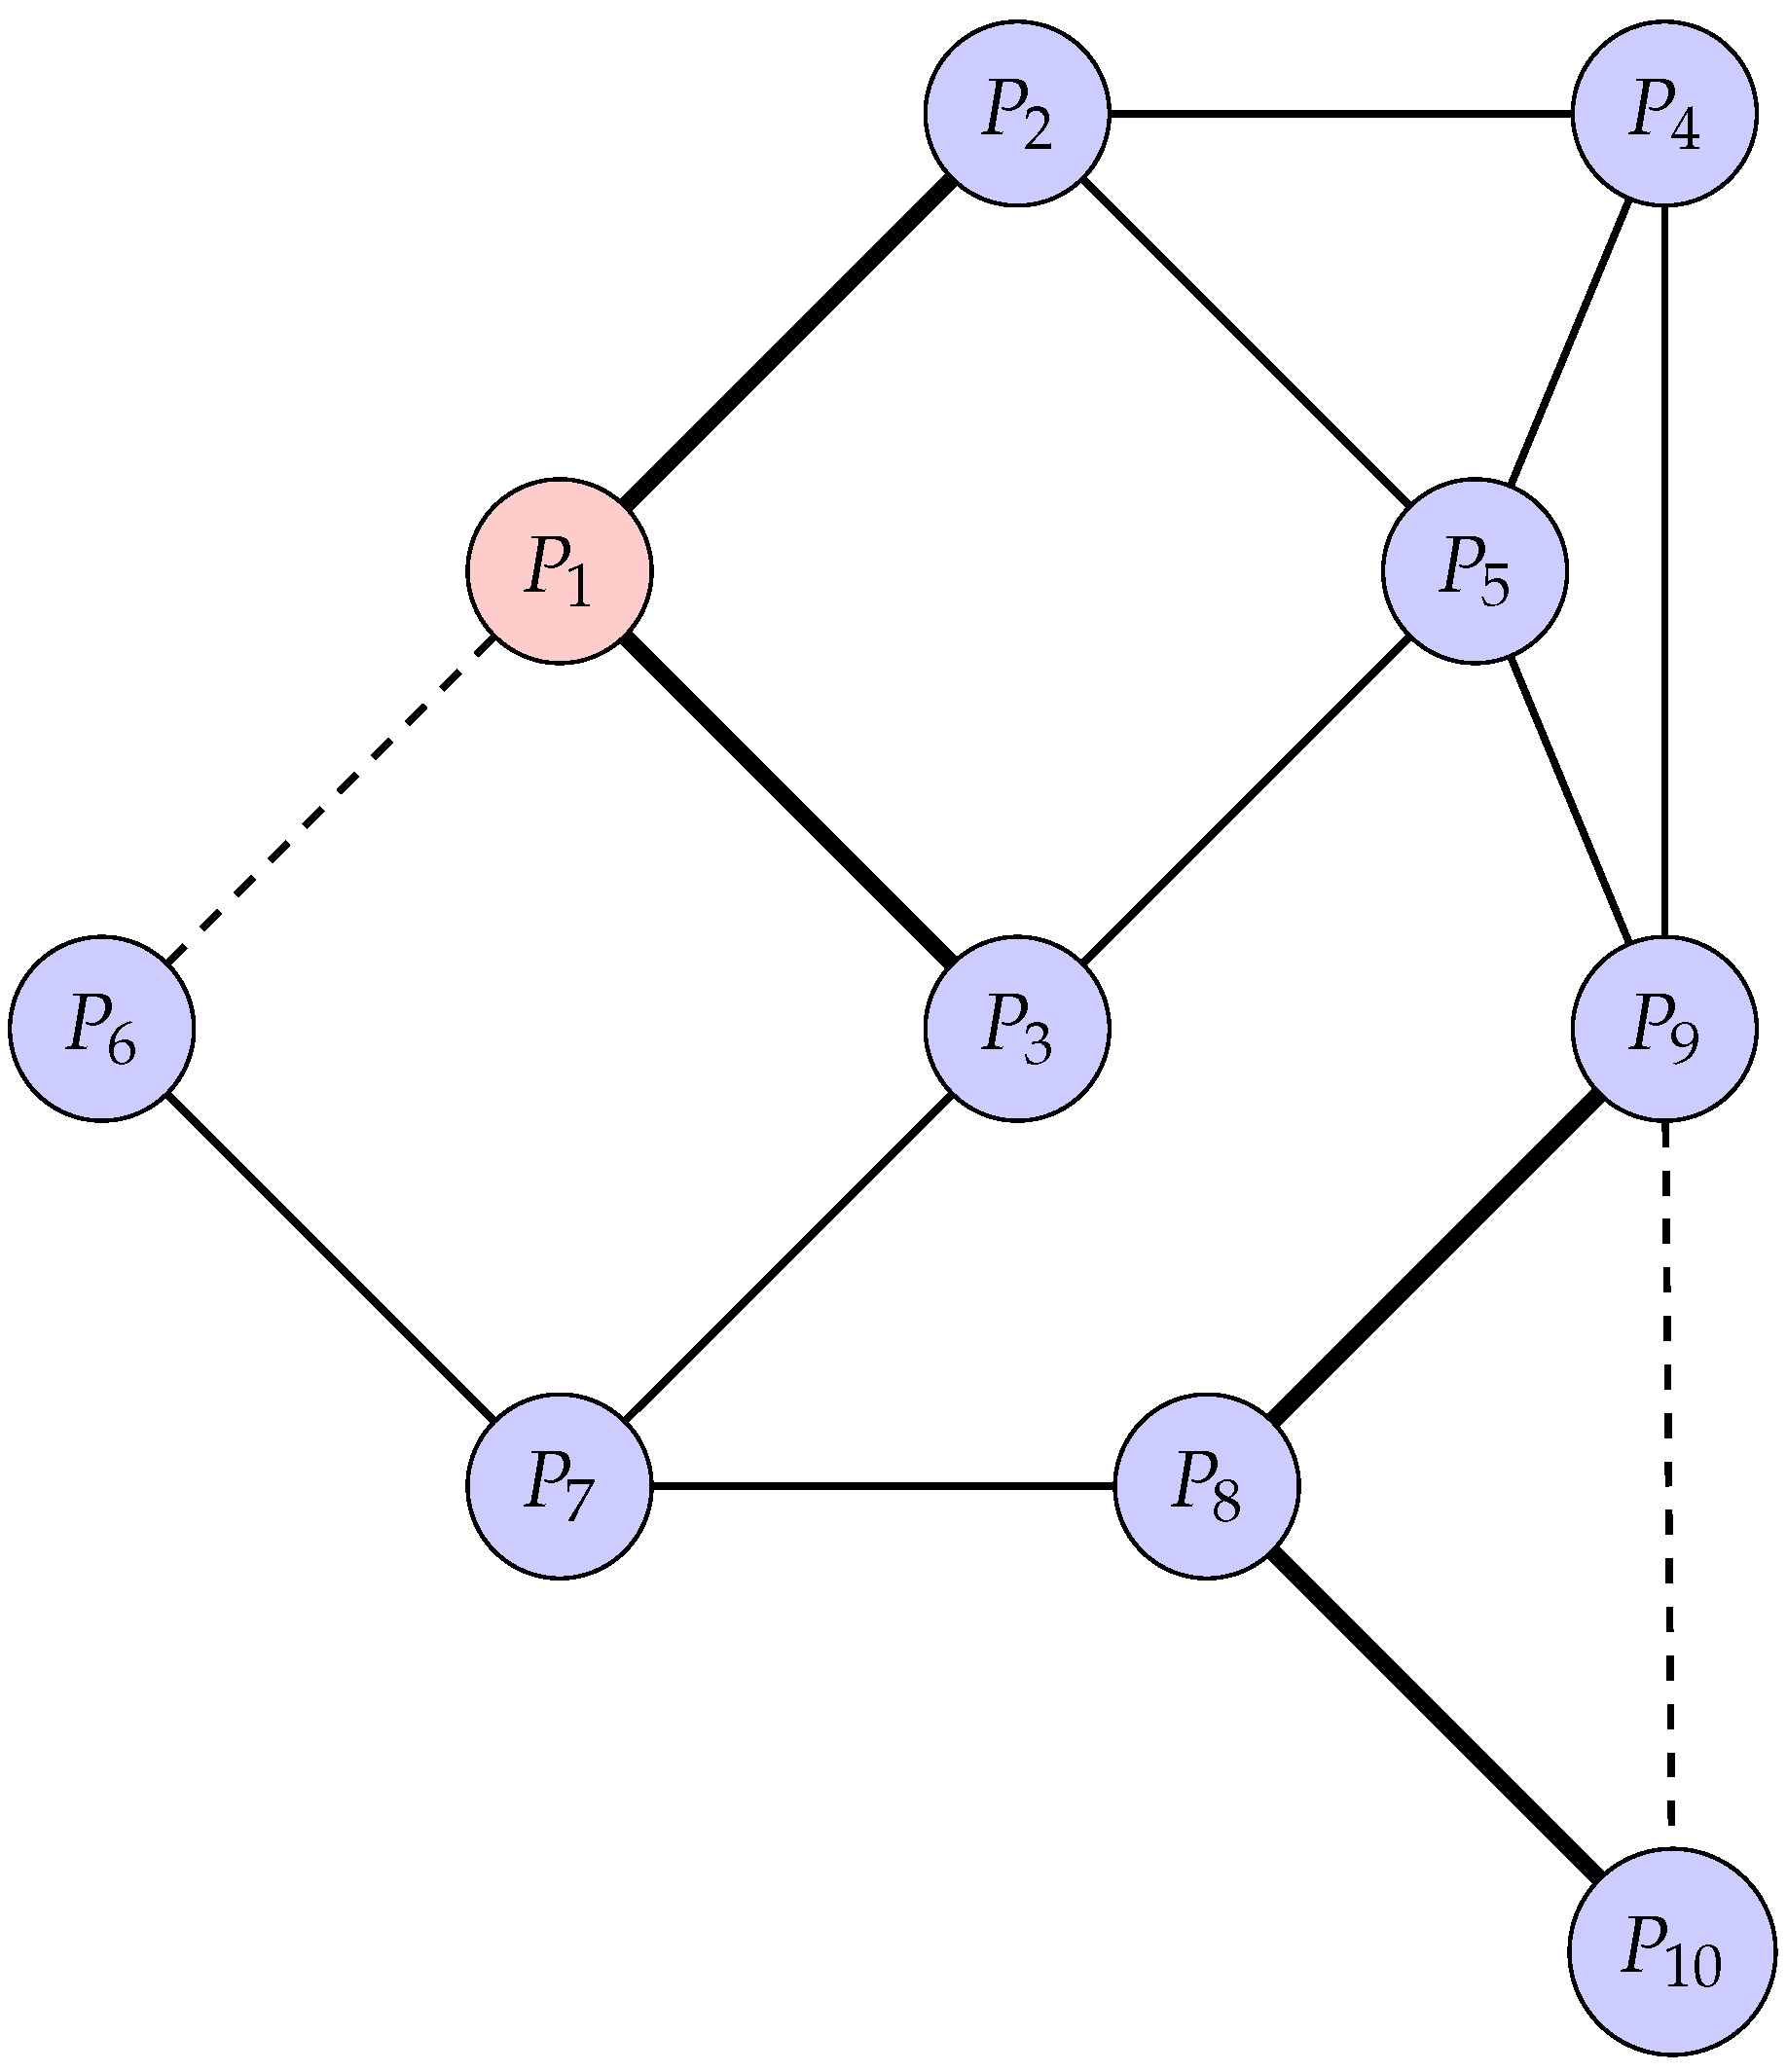
Figure 5.
Schematic representation of the MAPK signaling pathway. The pathway begins with the activation of the Epidermal Growth Factor Receptor (EGFR), which initiates a cascade of protein interactions involving GRB2, SOS, RAS, RAF, MEK, and ERK. Activated ERK translocates to the nucleus and regulates transcription factors such as ELK1 and FOS, which modulate gene expression. This pathway plays a critical role in cellular processes such as proliferation, differentiation, and stress responses.
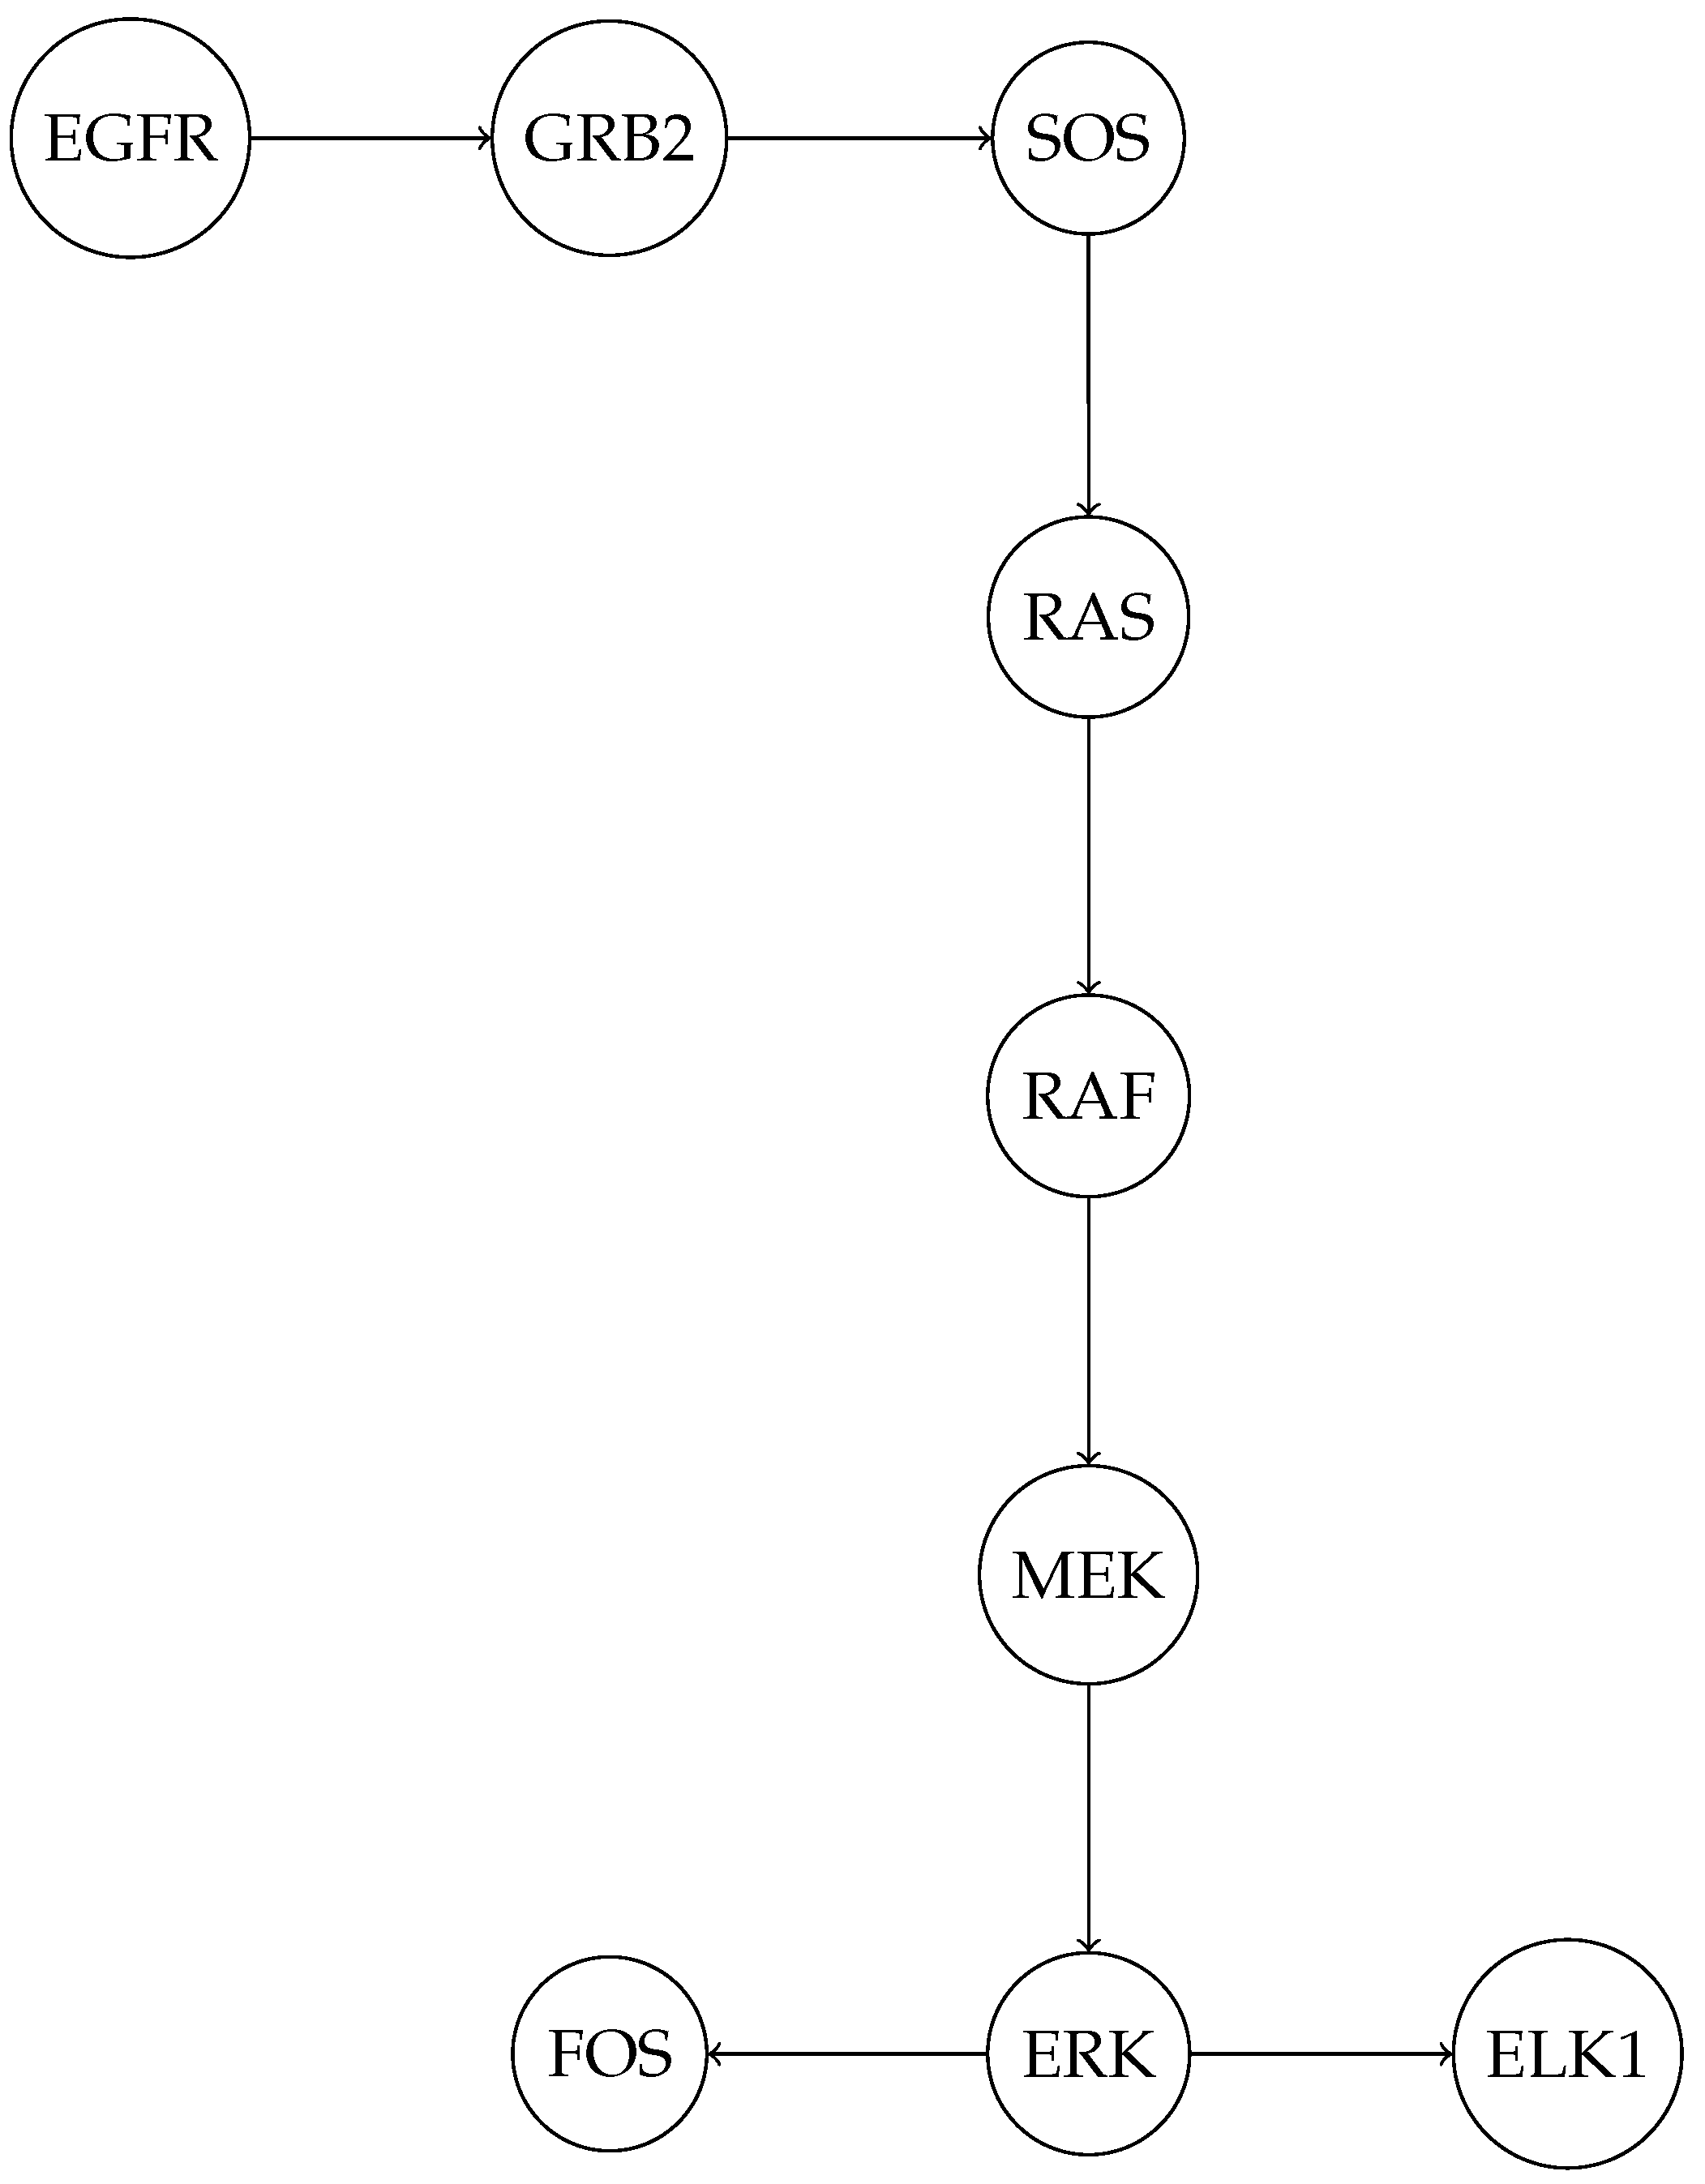
Figure 6.
Persistence diagram for MAPK pathway.
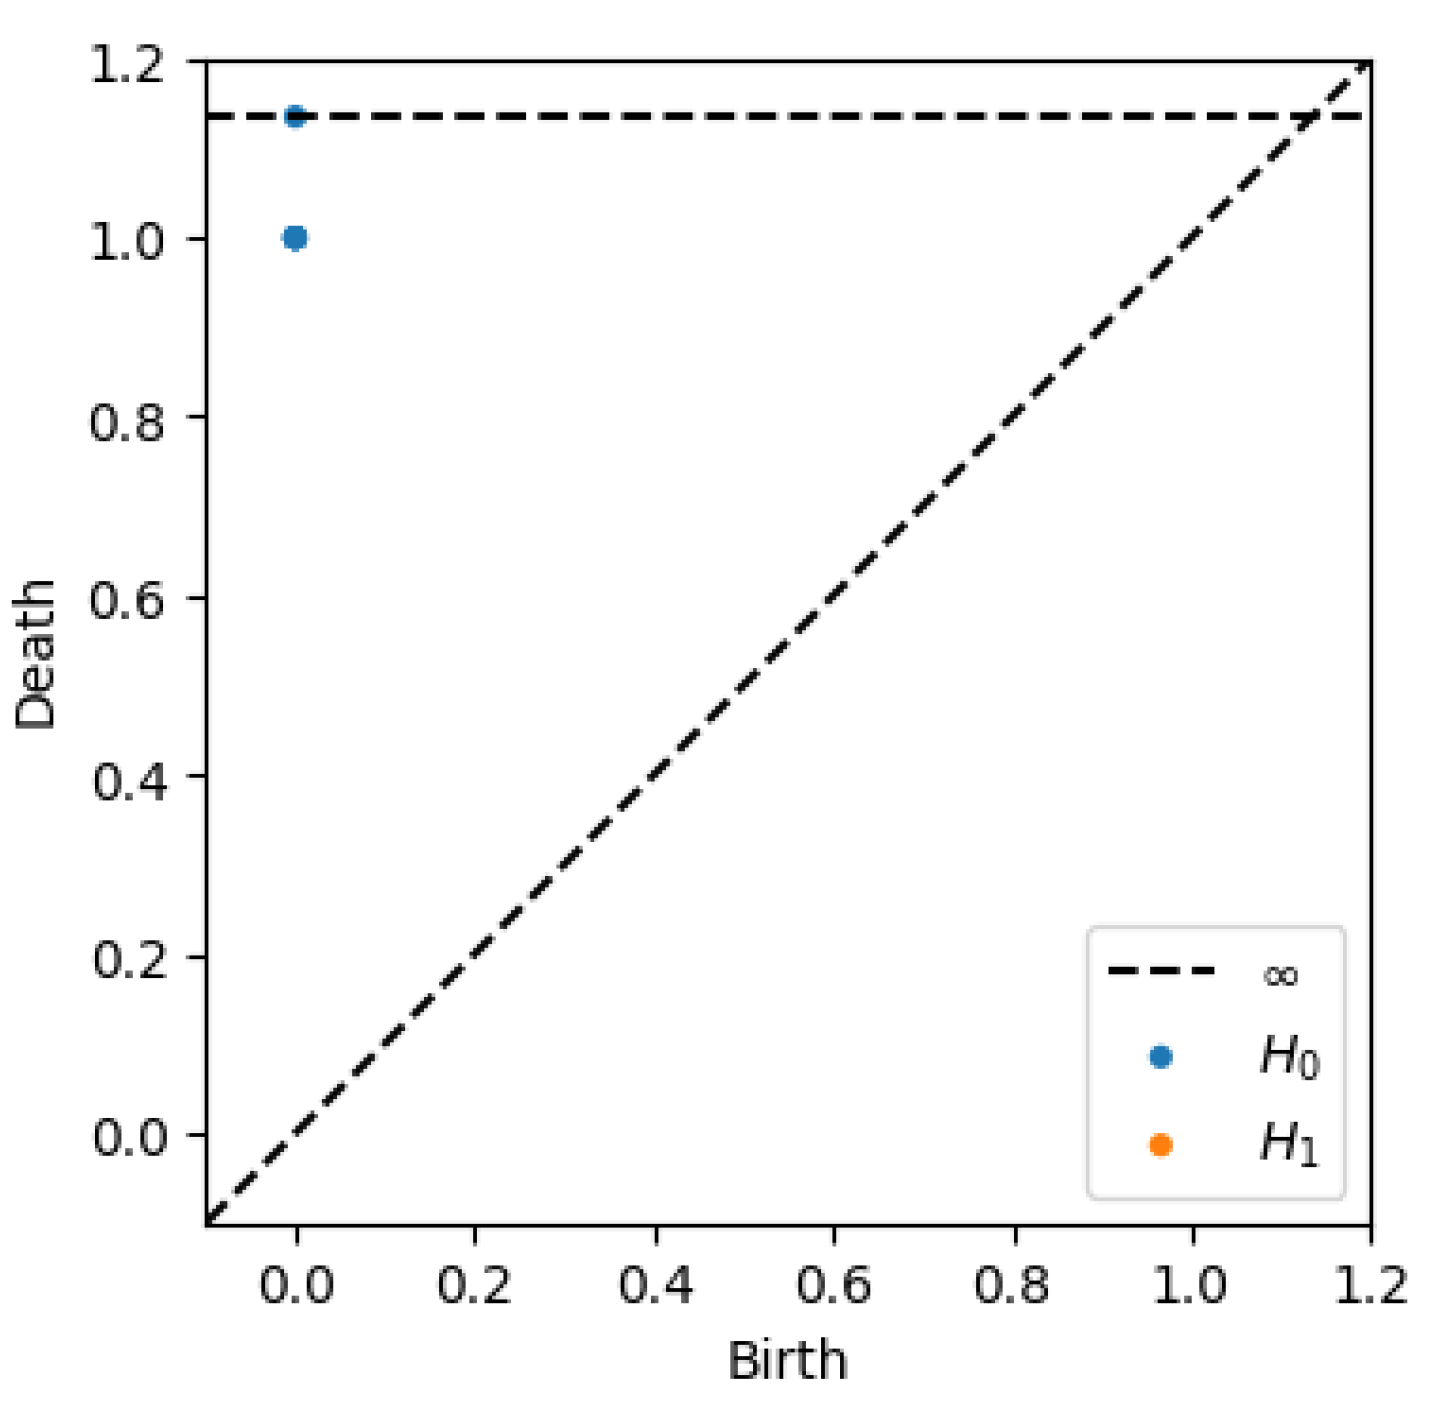
Table 2.
Algebraic connectivity values after removing each edge.
| Edge Removed | Algebraic Connectivity |
|---|---|
| (P8, P9) | 0.829914 |
| (P4, P5) | 0.811099 |
| (P2, P5) | 0.780133 |
| (P1, P3) | 0.756942 |
| (P3, P7) | 0.728101 |
| (P2, P4) | 0.700633 |
| (P4, P9) | 0.647610 |
| (P8, P10) | 0.643108 |
| (P5, P9) | 0.633303 |
| (P3, P5) | 0.585786 |
| (P9, P10) | 0.585786 |
| (P1, P6) | 0.573956 |
| (P1, P2) | 0.524352 |
| (P6, P7) | 0.519108 |
| (P7, P8) | 0.370384 |
Disclaimer/Publisher’s Note: The statements, opinions and data contained in all publications are solely those of the individual author(s) and contributor(s) and not of MDPI and/or the editor(s). MDPI and/or the editor(s) disclaim responsibility for any injury to people or property resulting from any ideas, methods, instructions or products referred to in the content. |
© 2025 by the authors. Licensee MDPI, Basel, Switzerland. This article is an open access article distributed under the terms and conditions of the Creative Commons Attribution (CC BY) license (http://creativecommons.org/licenses/by/4.0/).
Copyright: This open access article is published under a Creative Commons CC BY 4.0 license, which permit the free download, distribution, and reuse, provided that the author and preprint are cited in any reuse.


