Submitted:
08 February 2025
Posted:
10 February 2025
You are already at the latest version
Abstract
Satellites experience complex vibrational environments during launch and operation, potentially leading to structural failures and equipment damage. This work aimed to mitigate this issue by designing a variable cross-sectional metal rubber isolator (VCMRI), which was fully constructed from metal and featured a symmetric structure. Initially, a finite element model of VCMRI was developed, incorporating symmetric boundary conditions and employing the Bergström-Boyce model to define variable cross-sectional metal rubber (VCMR) parameters. Subsequently, sinusoidal sweep tests were performed to investigate how variations in VCMR density, spring stiffness, and excitation deflection angle affect the peak acceleration response and natural frequency of VCMRI. Finally, simulation analyses were conducted and insertion loss was derived from the results to assess the vibration isolation performance of VCMRI. The results indicate that the finite element model accurately captures the dynamic behavior of VCMRI with minimal error. In addition, VCMRI demonstrates robust vibration isolation performance by effectively integrating the influences of VCMR density, spring stiffness, and excitation angle, achieving insertion losses of up to 19.2 dB across a wide frequency range. It provides a robust theoretical support for the design and performance optimization of isolation systems, with potential positive impacts on relevant engineering applications.
Keywords:
isolator
; metal rubber
; finite element model
; sinusoidal sweep frequency
; insertion loss
1. Introduction
The launch of satellite is intricate engineering endeavor [1]. From rocket ignition and ascent to satellite separation and deployment, both the satellite and its onboard systems are subjected to highly complex and extreme vibrational environments [2,3,4]. As a dynamic load, vibration poses significant threat to the structural integrity, functional stability, and reliability of onboard electronic systems [5,6,7]. Resonance effects during vibration may further exacerbate these risks, potentially leading to launch failure or equipment malfunction.
To mitigate the effects of vibration on internal satellite equipment during launch and operation [8,9,10], Chen et al. [11] developed circular metastructure isolators composed of simple beams, reducing the isolation bandwidth by approximately 20 Hz. Kwon et al. [12] designed a compression-type shape memory alloy (SMA) mesh washer isolator to reduce vibrations generated by mechanical components during satellite operation. Chen et al. [13] proposed a dual-isolation structure to address vibrations induced by optical satellite reaction wheels, extending the vibration transmission path and improving high-frequency vibration attenuation. Lee et al. [14] introduced a corrugated tube isolator filled with viscous fluid, effectively mitigating vibration interference during satellite operation. However, while these approaches effectively suppress satellite vibration responses, their capacity to isolate multi-directional vibration loads remains limited. This underscores the need for more robust and versatile solutions to achieve effective multi-directional vibration control.
To overcome the limitations of satellite vibration isolation devices in mitigating multi-directional vibrations, researchers have explored the development of multi-directional vibration isolation technologies. Yin et al. [15] introduced a six-degree-of-freedom vibration isolation platform that utilizes MnCu alloy springs. This platform, featuring low stiffness and high damping, effectively mitigated low-frequency, small-amplitude vibrations in multiple directions. Wang et al. [16] designed a multi-directional isolator integrating inertial elements, dampers, and springs. Luo et al. [17] proposed a ring-shaped laminated constrained damping structure combining metal rings with rubber, aiming to reduce multi-directional vibrations transmitted from satellites to optical equipment Zhang et al. [18] developed an innovative multi-directional vibration isolation platform utilizing magnetic levitation technology, which enabled active vibration isolation through coil current regulation. This platform was integrated into the satellite control loop, employing control moment gyroscopes (CMGs) as actuators. Fang et al. [19] proposed a Stewart-based multidirectional vibration isolation platform powered by piezoelectric actuators, achieving high-precision positioning through an analysis of the nonlinear hysteresis of piezoelectric ceramics. Zhang et al. [20] integrated a Stewart six-degree-of-freedom vibration isolation platform with electromagnetic shunt damping, allowing damping adjustments through internal circuit control to manage vibrations during large-angle, multidirectional satellite attitude changes. Zhang et al. [21] further developed a multi-column multi-directional vibration isolation platform, integrated vibration isolation system, tuned mass damper, and rod structure inspired by the Stewart platform. Adjusting the number and coefficients of the dampers effectively suppressed the vibration response of the satellite system. However, the primary damping components in vibration isolation systems are predominantly made of materials such as rubber, piezoelectric ceramics, and magnetorheological fluids. Their high sensitivity to magnetic fields and extreme temperature fluctuations limits their suitability for the reliability and long-term stability required in space missions.
Metal rubber (MR) is a porous metallic material that exhibits high-temperature resistance, superior fatigue durability, and rubber-like elasticity and damping characteristics [21,22,23]. Its unique porous structure enables effective absorption and dissipation of vibrational energy, making it suitable for extreme environments such as high temperatures, vacuum conditions, and intense mechanical vibrations. Liu et al. [22] developed a composite vibration damping structure that integrates metal rubber with butterfly springs, achieving up to 95% vibration isolation efficiency. Ma et al. [23] and their team optimized the structural parameters using a genetic algorithm, producing a metal rubber isolator capable of achieving three-directional isolation efficiencies of up to 80% Du et al. [24] and collaborators integrated metal rubber with a Stewart platform to create a fully metallic vibration isolation platform, capable of operating in extreme conditions and mitigates three-axis vibrations across a frequency range of 40-2000 Hz. Its future development potential remains significant from an application perspective. Metal rubber is expected to retain high interest and widespread application in vibration isolation and noise reduction materials.
To address the limitations of existing satellite interior vibration isolation systems in multidirectional isolation and environmental adaptability, VCMRI was proposed by leveraging the superior properties of metal rubber. First, the finite element model of VCMRI was constructed, incorporating the Bergström-Boyce model to characterize the material properties of VCMR. Experimental validation was conducted to ensure the reliability of the simulations. Second, sine sweep tests were conducted to analyze the influence of the structural parameter variations on vibration response. Finally, the simulation model was utilized to investigate the impact of these parameter variations on vibration isolation performance.
2. Structural Design of VCMRI and Fabrication of VCMR
2.1. Structural Design
To safeguard precision equipment in satellites during launch, a isolator incorporating variable cross-sectional metal rubber (VCMR) was proposed. Engineered to withstand multidirectional loads and complex operating conditions. Hybrid vibration mitigation approach is employed by VCMRI through the integration of VCMR components with vibration isolation legs, as illustrated in Figure 1(a). A counterweight block is affixed to the base, serving as the platform for the protected precision equipment. While the isolation legs are symmetrically arranged around the base at 60° intervals, each incorporates a spring to provide stiffness support.
As shown in Figure 1(b), each vibration isolation leg contains a spring as stiffness-supporting element, connected to the VCMR component to ensure stability under vibrational loads. The VCMR is designed to contact a cylindrical wall, with its outer surface curved to enhance conformity with the positioning cylinder. Under applied loads, the contact area dynamically adjusts according to the load magnitude, thereby enables displacement cushioning. This mechanism facilitates the conversion of vibrational energy into thermal energy and subsequently dissipated. The primary structural parameters of the designed VCMR are depicted in Figure 1(c).
2.2. Fabrication of VCMR
The VCMR was fabricated using metallic wire mesh as the primary raw material, the fabrication process is shown in Figure 2. During the compression molding process, unprocessed metallic wire mesh was prone to delamination. To mitigate this issue, slotting machine was employed to imprint wave pattern onto the wire mesh, effectively reducing likelihood of delamination. Compressed wire mesh was wound around mandrel at specific angle before being further compressed into the final VCMR structure.
3. Methodologies
3.1. Construction of the Test Platform of Sine Sweep Frequency
To investigate the dynamic characteristics of VCMRI under excitations of varying frequencies, sinusoidal sweep test platform was constructed as illustrated in Figure 3. VCMRI is mounted onto an external connection plate through baseplate holes and secured to the test bench using anchor bolts. The control system generates excitation signals to drive the electromagnetic exciter, transmitting the sinusoidal force F0 to the counterweight block through an excitation rod. As depicted in Figure 4, an accelerometer is attached to the counterweight block to measure the VCMRI’s acceleration response, while a force sensor on the excitation rod monitors transmitted force.
3.2. Analysis of Finite Element Simulation
To simplify simulation calculations, the internal springs within the vibration isolation legs were replaced with virtual springs. As shown in Figure 4(a), the connected components were merged into a single unit, omitting features such as fillets and connection holes to enhance computational efficiency without compromising structural integrity. During the meshing process, local mesh refinement was applied to the VCMR, while adhesive constraints were imposed between adjacent parts. Fixed constraint is assigned to the base to ensure contact conditions accurately reflect actual operating environment and excitation deflection angle between excitation force and vibration isolation legs is set to α0.
3.2.1. Construction of the Macroscopic Constitutive Model for VCMR
Accurate parameter characterization of VCMR is critical for simulation analysis, as it significantly influences the computational outcomes of vibration isolation structures. This work employed the Bergström-Boyce constitutive model to describe macroscopic behavior of VCMR. Widely used for characterizing viscoelastic properties of rubber and polymer materials, this model effectively captures the mechanical response of materials under large deformations by integrating both elastic and viscous characteristics.
As illustrated in Figure 4(b), the Bergström-Boyce model decomposes material’s mechanical response into two parallel components. Component A represents the material’s elastic behavior and is modeled using the Yeoh hyperelastic constitutive model, which characterizes recoverable deformation under stress. Additionally, the Bergström-Boyce model accounts for the hysteresis behavior observed during loading and unloading processes.
The mathematical representation of constitutive relationship is expressed as follows:
Constitutive relationship of component A is characterized by the Yeoh hyperelastic model. The constitutive equation of the Yeoh model is given as:
where W represents the density of strain energy, while C10,C20 and C30 are material constants, represent the distinct mechanical properties.
The hysteresis material model describes the constitutive relationship for Component B as follows:
The parameters are defined as follows: represents the effective creep strain rate, A denotes the material parameter, represents the nominal creep strain, C represents the creep strain exponent, represents the effective stress, m is the equivalent stress exponent. In addition, a parameter S need be defined to represent the ratio of the stress experienced by components A and B.
The parameters of the Bergström-Boyce constitutive model for VCMR are determined by fitting static curve data using the least squares method. This fitting process is conducted for VCMR densities of 1.5, 2.0, and 2.5 g/cm³.The resulting parameter curves are shown in Figure 5 and the obtained parameters are presented in the Table 1.
3.2.2. Modal Analysis
This study employed finite element simulation to conduct modal analysis of the VCMRI, identifying its modal parameters. By analyzing both the VCMRI and the rigid structure without VCMR and springs, the corresponding mode shapes for each natural frequency were obtained, providing insight into the VCMRI 's dynamic response under excitation. Figure 6 presents the modal shapes derived from finite element simulations, and the associated natural frequencies are summarized in Table 2. The VCMRI configuration possesses a VCMR density of 2 g/cm³ and a spring stiffness of 150 kN/m.
3.3. Characterization of Vibration Isolation Performance
Vibration isolation efficiency is a key metric for evaluating the performance of VCMRI, as it reflects the level of attenuation achieved. In this work, insertion loss is employed to characterize isolation performance. Vibration isolation legs are assumed to exhibit a rigid response in the absence of spring connections and without VCMR, while other cases are considered to demonstrate an elastic response.
where L represents expressions for force transmissibility, the input force is denoted as F, and the output force as F0, IL is insertion loss, Lr and Le respectively represent the rigid response and elastic response.
4. Results and Discussion
4.1. Validation of Simulation Model
Based on the natural frequencies and mode shapes obtained in the previous section, vibration response of VCMRI is evaluated through harmonic response analysis. Under external vibration or shock loading, the structural mass is primarily concentrated in the internal counterweight block, leads to a relatively localized mass distribution. During the harmonic response analysis, a sinusoidal excitation force (F0) applied to the counterweight block within a specified frequency range. The analysis set F0 to 10 N, α0 to 0°, with the frequency range spans from 5 to 600 Hz. The density of VCMR is specified as 2 g/cm³, and the material parameters are detailed in Table 1. Additionally, virtual springs are used to replace the physical springs in the vibration isolation legs, with stiffness values of 50, 100, and 150 kN/m. In the absence of springs, the stiffness is considered infinite, denoted as ∞. The harmonic response analysis yielded the structural acceleration response and compared to the results from sinusoidal sweep frequency tests.
Figure 7 presents a comparison between the acceleration response under 10 N excitation force and the finite element simulation results. Simulated and experimental curves exhibited strong consistency in terms of trend and key characteristics. Figure 8 illustrates the overall relative error between the two curves, indicates that the differences were mainly concentrated in the low-frequency range. When stiffness of the springs in the vibration isolation legs is ∞ kN/m, the maximum relative error reaches 11.4%. However, the overall error remained minimal. Figure 9 further demonstrates that the relative error of the peak acceleration response does not exceed 7.1%, and the relative error in natural frequencies stays below 9%. These results indicate that the actual dynamic characteristics of the system is effectively captures by the finite element simulation method.
4.2. Analysis and Discussion of Sine Sweep Frequency Experimental Results
In practical applications, various work conditions influence the performance of a vibration isolation system. To examine the effects of different structural parameters, a single-variable control method is adopted. In this experiment, spring stiffness is denoted as k0. Sinusoidal excitation amplitude is denoted as F0, and excited deflection angle is α0. Specific values of relevant parameters are listed in Table 3.
4.2.1. Effect of Density Variation on the Performance of VCMRI
Variations in the density of VCMR significantly influence its load-bearing capacity and vibration energy dissipation characteristics. Similarly, these variations also exert a strong effect on the system's natural frequency and vibration transmission properties. In this work, VCMR specimens with densities of 1.5, 2.0, and 2.5 g/cm³ are selected for testing. During the experiment, F0 was set to 10 N, and α0 was set to 0°. Rigid metallic elements are used as control samples to replace the VCMR, enabling a comparative analysis of the structural vibration response with and without VCMR.
Figure 10(a) depicts the acceleration response curve when rigid metallic components replaced the VCMR. The results indicate a peak acceleration response of 9.2 g and a structural natural frequency of 75.9 Hz. During the sine sweep frequency test, as excitation frequency approaches natural frequency, both the acceleration response and the swinging amplitude of the counterweight block increase significantly. The high stiffness of the metallic elements substantially enhanced overall rigidity of VCMRI, thereby elevates its natural frequency due to their direct correlation. Moreover, absence of elasticity and damping properties in metallic elements impair the system’s ability to dissipate vibrational energy effectively. Consequently, resonance within the VCMRI leads to accumulation of vibrational energy. At this stage, insufficient energy dissipation fails to counterbalance the input energy, results in pronounced fluctuations in the acceleration response.
As illustrated in Figure 10(b), increasing in density of VCMR leads to reduction in the natural frequency of VCMRI. This decrease occurs because VCMRI becomes unstable at its natural frequency, exhibits nonlinear behavior, larger displacement variations and altered dynamic properties, inducing stiffness-softening effect. Consequently, the vibration mode becomes more complex, and the relationship between stiffness and natural frequency deviates from linearity. Additionally, changes in stiffness influence internal energy distribution during vibration, shifting energy concentration toward low-frequency range. Although increasing the density of VCMR enhances overall stiffness of VCMRI, the instability caused by oscillatory effects ultimately reduces the natural frequency of VCMRI.
With the increasing density of VCMR, both peak acceleration response and natural frequency of VCMRI decrease. This phenomenon can be attributed to the denser internal structure of VCMR, because it results in more contact points and frictional interfaces, thereby increasing the overall contact area. During vibration, these structural changes enhance internal dry friction and significantly increase energy dissipation through friction.
Furthermore, metal wires within the VCMR undergo slight rearrangements during vibration, forms new contact points or alters existing frictional interfaces. This dynamic reconfiguration requires overcomes the frictional and adhesive forces at the original contact points, further dissipating vibrational energy. Consequently, increasing the density of VCMR effectively reduces the acceleration response of the VCMRI.
4.2.2. Acceleration Response Analysis Under Evolution of Spring Stiffness
Stiffness of springs plays a critical role in determining load-bearing capacity and vibration isolation performance of the vibration isolation legs. In this experiment, VCMR with a density of 2 g/cm³ is used and the stiffness coefficient k0 is set to 50, 100, 150, and ∞ kN/m. The excitation forces (F0) are 5 N, 10 N, and 15 N, with an excitation deflection angle α0 of 0°. As shown in Figure 11, both spring stiffness and excitation force significantly influence dynamic response of VCMRI. Specifically, for a given excitation force, variations in spring stiffness alter overall structural rigidity and potentially induce swinging instability during vibration. The dynamic behavior, vibration modes, and energy distribution of VCMRI are significantly impacted by changes in stiffness. It causes a nonlinear relationship between stiffness and natural frequency. Higher stiffness not only enhances structural rigidity but also increases load-bearing capacity and reduces swinging instability. During oscillation, higher stiffness reduces deformation amplitude and improves internal stability, thereby decreases the acceleration response amplitude.
Table 4 illustrates the variation trends of peak acceleration response and natural frequency. When spring stiffness remains constant, the peak acceleration response exhibits a positive correlation with the excitation force F0. However, increasing the excitation force reduces natural frequency of VCMRI. This phenomenon arises because VCMR, as a nonlinear vibration isolation material, exhibits both nonlinear stiffness and damping behavior during vibration. As the excitation force increases, the contact area between the metal wires is significantly expanded and friction is intensified, thereby damping effect of VCMR is enhanced. Furthermore, increased energy dissipation reduces energy concentration within the resonance region, shifting the natural frequency to a lower range.
4.2.3. Acceleration Response Analysis Under Variation of Excitation Angles
The variation in α0 significantly influences dynamic characteristics of VCMRI. This work analyzes the changes in acceleration response for α0 values of 0°, 15°, and 30°, with an excitation force F0 of 10 N and spring stiffness values of 50, 100, 150, and ∞ kN/m. Due to specific arrangement of the vibration isolation legs, vibration response of the VCMRI varies with different excitation directions. As illustrated in Figure 12(d), when the spring stiffness is ∞ kN/m, variations in α0 have negligible effect on the stiffness along excitation force direction. Consequently, the peak acceleration response and natural frequency exhibit minimal fluctuation.
Conversely, Figure 12(a), (b), and (c) demonstrate that when springs are incorporated into the vibration isolation legs, changes in α0 significantly affect the acceleration response. This occurs because equivalent stiffness along excitation force direction increases as α0 increases. As depicted in Table 5, an increase in stiffness decreases the natural frequency while simultaneously reduces the peak acceleration. This phenomenon arises because swing instability contributes to a reduction in natural frequency, whereas increases stiffness enhances structural stability and effectively mitigates the rise in peak acceleration.
4.3. Finite Element Analysis of VCMRI Performance
4.3.1. Effect of Different VCMR Densities on Vibration Isolation Performance of VCMRI
The reliability of the simulation model is validated in Section 4.1. Based on this, the verified model is used in this section to investigate the influence of VCMR density variations on vibration isolation performance. The vibration isolation legs are configured without springs, and the analysis is conducted over a frequency range of 0-600 Hz, incorporating the VCMR material parameters detailed in Table 1.
Figure 13(a) illustrates the output force and force transmissibility curves obtained from the simulation results. In the absence of VCMR, the output force is significantly higher than in configurations incorporating VCMR. When VCMR is present, an increase in density leads to a greater number of metal wires per unit volume, resulting in enhanced overall stiffness. This increase in stiffness reduces system deformation and consequently decreases the amplitude of the output force.
Figure 13(b) illustrates force transmissibility curves for different VCMR densities. Insertion loss is determined from force transmissibility curve, with rigid structure serves as the reference for rigid response. The corresponding insertion loss results are summarized in Table 6, revealing a positive correlation between density of VCMR and average insertion loss. As density of VCMR increases, the metal wire network becomes more compact, resulting in a higher number of contacts points and significantly amplifying friction and interfacial sliding interactions. These contact points dissipate greater amounts of vibrational energy through frictional and sliding mechanisms, thereby enhances the damping effect. This characteristic effectively minimizes the energy transmitted from the vibration input to the output, results in an increase in insertion loss.
4.3.2. Effect of Different Stiffnesses on Vibration Isolation Performance of VCMRI
The applications of VCMRI must consider both contact density effects and the influence of spring stiffness variations in the vibration isolation legs on vibration transmission. In present simulation, an excitation force (F0) of 10 N is applied with an excitation deflection angle (α0) of 0°, over a frequency range of 0-600 Hz, with density of VCMR set to 2 g/cm³. Spring stiffness of the vibration isolation legs is varied among 50, 100, 150, and ∞ kN/m. Figure 14 presents output force and force transmission rate curves corresponding to different spring stiffness values.
When spring stiffness in the vibration isolation legs is ∞ kN/m, vibration suppression relies entirely on the inherent damping properties of the VCMR. However, when a spring is introduced, it provides elastic support by storing and releasing vibrational energy, while the VCMR dissipates vibration energy through its damping characteristics. Figure 14(a) illustrates that integrating VCMR in series with the spring significantly reduces output force compared to using VCMR alone. Clear negative correlation is observed between spring stiffness and output force.
Table 7 presents average force transmission rate and insertion loss values derived from Figure 14(b). At spring stiffness of 150 kN/m, the VCMRI achieves its maximum insertion loss of 19.2 dB, indicates optimal vibration isolation performance. This enhancement results from the synergistic interaction between the spring and the VCMR in a series configuration. Spring stores vibrational energy, which is then gradually dissipated by the VCMR, thereby reduces vibration amplitude. Under constant input force, increasing spring stiffness reduces spring deformation, leads to greater deformation of the VCMR. This, in turn, enlarges contact area between internal metal wires, enhances frictional losses and vibration energy dissipation during periodic loading. As a result, vibration transmission is effectively minimized.
4.3.3 Effect of Different Excitation Angles on Isolation Performance of VCMRI
The vibration isolation legs are symmetrically arranged along circumference and maintain a 60° angle between adjacent legs. In practical applications, evaluating influence of α0 variations on vibration isolation performance of VCMRI is crucial. This work analyzes the isolation performance under excitation deflection angles (α0) of 0°, 15°, and 30°. Spring stiffness is fixed at 150 kN/m, with VCMR density of 2 g/cm³, over the frequency range of 5-600 Hz.
Figure 15(a) illustrates negative correlation between α0 and output force. When α0 = 0°, vibration is primarily concentrated in the vibration isolation legs aligned with excitation force direction. Under these conditions, force transmitted through these legs is greater, results in higher output force after being damped by VCMR. As α0 increases, vibration is progressively distributed among the adjacent legs, reducing transmitted force per leg and consequently decreasing the damped output force.
Figure 15(b) demonstrates that for excitation frequencies below 10 Hz, the variation in α₀ has negligible effect on the force transmission rate, as the curves nearly overlap and remain close to zero. However, influence of α₀ on force transmission rate becomes increasingly pronounced as frequency rises between 10-100 Hz range. As α₀ increases, changes in the internal force distribution and coupling effects within the vibration isolation legs lead to reduction in force transmission rate, thereby enhancing vibration isolation performance. When frequencies above 100 Hz, force transmission rate declines sharply, demonstrating that VCMRI exhibits excellent vibration isolation performance within the high-frequency range. The lowest average force transmission rate is observed at α0 = 30°, reflects optimal vibration isolation performance.
Table 8 presents the overall force transmission rate and insertion loss of the VCMRI for various α₀. As α0 increases from 0° to 30°, both the peak and average force transmission rates decrease, insertion loss increases. It indicates notable improvement in vibration isolation performance. This enhancement occurs because higher α0 alters the directionality of the excitation force, thereby redistributes the transmitted forces among the vibration isolation legs. Consequently, dynamic response variations between the legs are amplified and modifies coupling effects. Additionally, the equivalent stiffness was enhanced with the increasing of α0. Along the excitation force direction, the sway of structural instability is effectively suppressed., reducing the resonance peak amplitude and shifting resonance frequency.
Moreover, the redistribution of vibration energy among the vibration isolation legs enhances the damping characteristics of VCMR and further reduces vibration transmission intensity. As a result, increasing α0 effectively attenuates vibration transmission within the resonance region. It improves high-frequency vibration isolation and significantly enhances the overall dynamic performance of VCMRI.
5. Conclusions
VCMRI was designed as a symmetrical structure specifically for space applications to protect precision electronic equipment from vibration and shock during satellite launch. Its vibration isolation performance was investigated through sine sweep tests and simulation analyses, revealing its dynamic characteristics and frequency response behavior. The key findings of this work are summarized as follows:
(1) A Bergström-Boyce constitutive model for VCMR was developed. This model can be used to simulate the vibration response of the VCMRI under sinusoidal excitation, and its reliability is experimentally validated.
(2) The equivalent stiffness of VCMRI is significantly influence by the density of VCMR, spring stiffness, and excitation angle. These parameters are directly proportional to equivalent stiffness. However, swing instability effects reduce the natural frequency and peak acceleration response.
(3) Insertion loss shows a positive correlation with density of VCMR, spring stiffness, and deflection angle. The increase in VCMR density enhances energy dissipation., while adding springs in series enhanced isolation through effective energy storage and release. Larger α₀ redistributed the load among more legs and further elevating insertion loss and improving vibration attenuation.
Author Contributions
J. L.; Conceptualization, formal analysis, writing-original draft. X.L.; methodology. H.W.; resource. Z.Y.; data curation. X.X.; investigation, supervision, writing-revise & editing. All authors have read and agreed to the published version of the manuscript.
Funding
This work received highly appreciated financial support from the National Natural Science Foundation of China (No. 12272094), the National Key Laboratory of Reliability and Environmental Engineering (No. 614200420240103) and the Natural Science Foundation of Fujian Province of China (No. 2024J01244).
Data Availability Statement
The data used to support the findings of this study are included within the article.
Acknowledgments
The authors would like to express many thanks to Senior Engineer Yizhu Guo of China Academy of Space Technology for his valuable comments and motivating discussions.
Conflicts of Interest
The author(s) declare no potential conflicts of interest with respect to the research, authorship, and/or publication of this article.
References
- Shi, H.T.; Abubakar, M.; Bai, X.T.; Luo, Zhong. Vibration Isolation Methods in Spacecraft: A Review of Current Techniques. Adv. Space Res. 2024, 73: 3993-4023.
- Xing, W.D.; Tuo, W.X.; Li, X.F.; Wang, T.Y.; Yang, C.X. Micro-Vibration Suppression and Compensation Techniques for In-Orbit Satellite: A Review. Chin. J. Aeronaut. 2024, 37: 1-19.
- Danowski, M.E.; Heine, S.N.T.; Figueroa,F.E.; Goldfinger, D.; Wikus, P.; McCammon, D.; Oakley, P. Vibration Isolation Design for the Micro-X Rocket Payload. J. Low Temp. Phys. 2016, 184: 597-603.
- Li, L.; Wang, L.; Yuan, L.; Zheng, R.; Wu, Y.P.; Sui, J.; Zhong, J. Micro-Vibration Suppression Methods and Key Technologies for High-Precision Space Optical Instruments. Acta Astronaut. 2021, 180: 417-428.
- Wang, X.; Yue, X.K.; Dai, H.H.; Yuan, J.P. Vibration Suppression For Post-Capture Spacecraft Via a Novel Bio-Inspired Stewart Isolation System. Acta Astronaut. 2020, 168: 1-22.
- Ma, J.; Lu, G.Y.; Tan, L.; Yu, S.Y.; Fu, Y.; Li, F. Satellite Platform Vibration Influence on Acquisition System for Intersatellite Optical Communications. Opt. Laser Technol. 2021, 138, 106874. [Google Scholar] [CrossRef]
- Azadi, E.; Fazelzadeh, S.A.; Azadi, M. Thermally Induced Vibrations of Smart Solar Panel in A Low-Orbit Satellite. Adv. Space Res. 2017, 59, 1502–1513. [Google Scholar] [CrossRef]
- Kamesh, D.; Pandiyan, R.; Ghosal, A. Modeling Design and Analysis of Low Frequency Platform for Attenuating Micro-Vibration in Spacecraft. J. Sound Vibr. 2010, 329, 3431–3450. [Google Scholar] [CrossRef]
- Lee, D.O.; Yoon. J.S.; Han, J.H. Development of Integrated Simulation Tool for Jitter Analysis. Int. J. Aeronaut. Space Sci. 2012, 13, 64–73. [Google Scholar] [CrossRef]
- Wang, F.; Zheng, S.; Huang, C.; Wang, W.J.; Yan, J.; He, Z.Q.; Yu, H.L.; Liao, J.B. Research and Application of Vibration Isolation Platform Based on Nonlinear Vibration Isolation System. J. Sens. 2023, 2023, 9967142. [Google Scholar] [CrossRef]
- Chen, N.; Yang, Z.; Yang, T.; Shen, Y.Z.; Tian, W.; Xu, Y.L. Design of Low-Frequency Circular Metastructure Isolators with High-Load-Bearing Capacity. Chin. J. Aeronaut. 2024, 37, 207–220. [Google Scholar] [CrossRef]
- Kwon, S.C.; Jo, M.S.; Oh, H.U. Experimental Validation of Fly-Wheel Passive Launch and On-Orbit Vibration Isolation System by Using a Superelastic SMA Mesh Washer Isolator. Int. J. Aerosp. Eng. 2017, 2017, 5496053. [Google Scholar] [CrossRef]
- Chen, S.; Xuan, M., Xin. J.; Liu, Y.; Gu, S.; Li, J.; Zhang, Lei. Design and Experiment of Dual Micro-Vibration Isolation System for Optical Satellite Flywheel. Int. J. Mech. Sci. 2020, 179, 105592.
- Lee, D.O.; Park, G.; Han, J.H. Experimental Study on On-Orbit and Launch Environment Vibration Isolation Performance of a Vibration Isolator Using Bellows and Viscous Fluid. Aerosp. Sci. Technol. 2015, 45, 1–9. [Google Scholar] [CrossRef]
- Yin, X.; Xu, Y., Sheng, X.; Wan, S.; Wang, Y. Study on the Micro-vibration Suppression of a MnCu Spring Isolation Platform with Low Stiffness and High Damping. International Int. J. Aeronaut. Space Sci. 2023, 24, 753-765.
- Wang, Y.; Wang, P.; Meng, H.; Chen, L. Nonlinear vibration and dynamic performance analysis of the inerter-based multi-directional vibration isolator. Arch. Appl. Mech. 2022, 92, 3597–3629. [Google Scholar] [CrossRef]
- Luo, H.; Fan, C.; Li, Y.; Liu, G.; Yu, C. Design and Experiment of Micro-Vibration Isolation System for Optical Satellite. Eur. J. Mech. A-Solids, 2023; 97, 104833. [Google Scholar]
- Zhang, Y.; Sheng, C.; Hu, Q.; Li, M.; Guo, Z.; Qi, R. Dynamic Analysis and Control Application of Vibration Isolation System with Magnetic Suspension on Satellites. Aerosp. Sci. Technol. 2018, 75, 99–114. [Google Scholar] [CrossRef]
- Fang Z, Yu Z, Huang Q, Et Al. Research on Design and Control Method of Active Vibration Isolation System Based on Piezoelectric Stewart Platform. Sci Rep 2025, 15, 944. [Google Scholar] [CrossRef] [PubMed]
- Zhang, H.; Luo, Q.; Zhou, G.; Huang, Y. Research on Isolation Method of Spacecraft Reaction Wheels Using Electromagnetic Shunt Damping. J. Phys. Conf. Ser. 2022, 2368, 012028. [Google Scholar] [CrossRef]
- Zhang, Y.; Zhang, J.; Zhai, G. Vibration Isolation Platform with Multiple Tuned Mass Dampers for Reaction Wheel on Satellites. Math. Probl. Eng. 2013, 2013, 574072. [Google Scholar] [CrossRef]
- Liu, G.; Wang, X.; Guo, Z.; Zhang, Y. Experimental Study on Shock Isolation of Metal Rubber-Disc Spring Composite Shock Absorber Under Different Shock Excitation. J. Phys. Conf. Ser. 2024; 2720, 012042. [Google Scholar]
- Ma Y, Tang X, Wang Y, Hong, Jie. Design of nonlinear metal rubber isolator subjected to random vibration. Mech. Syst. Signal Proc. 2023, 197, 110375. [Google Scholar] [CrossRef]
- Du, Y.; Wang, X.; Wang, Y. Research on an All-metal Vibration Isolation Platform with Six DOFs. J. Mech. Eng. 2023, 59, 188–198. [Google Scholar]
Figure 1.
Schematic diagram of VCMRI: (a) three-dimensional structure diagram, (b) the structure of VCMR, (c) the vibration isolation legs.
Figure 1.
Schematic diagram of VCMRI: (a) three-dimensional structure diagram, (b) the structure of VCMR, (c) the vibration isolation legs.
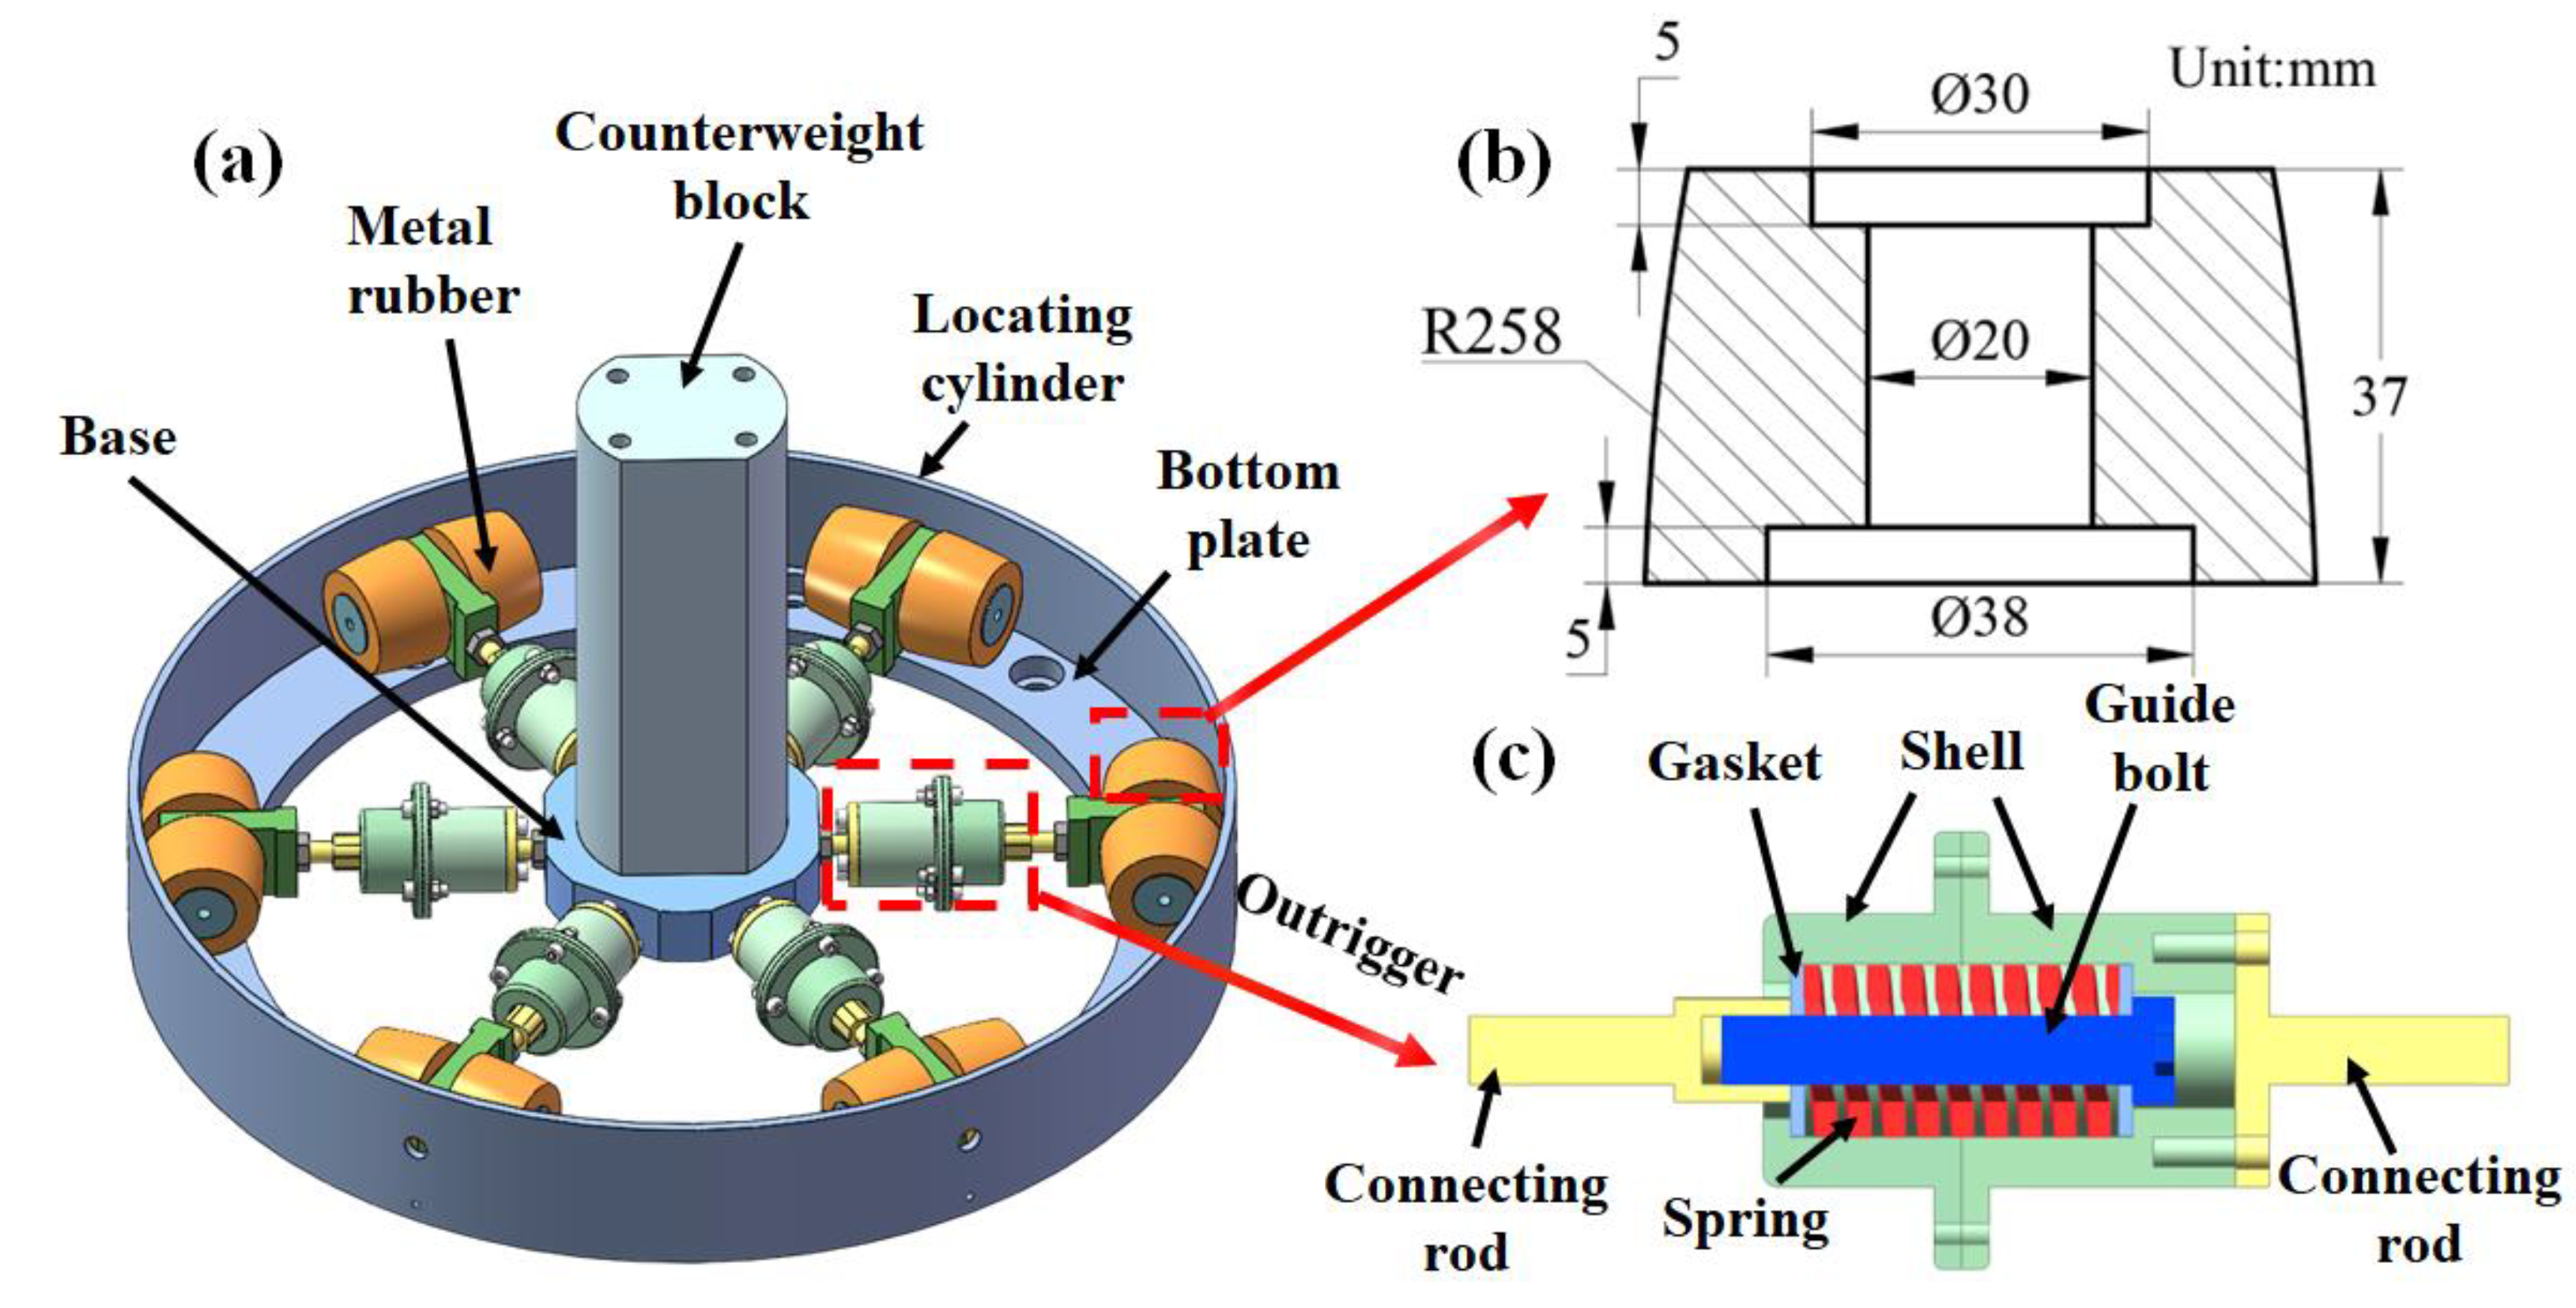
Figure 2.
Fabrication process of VCMR.
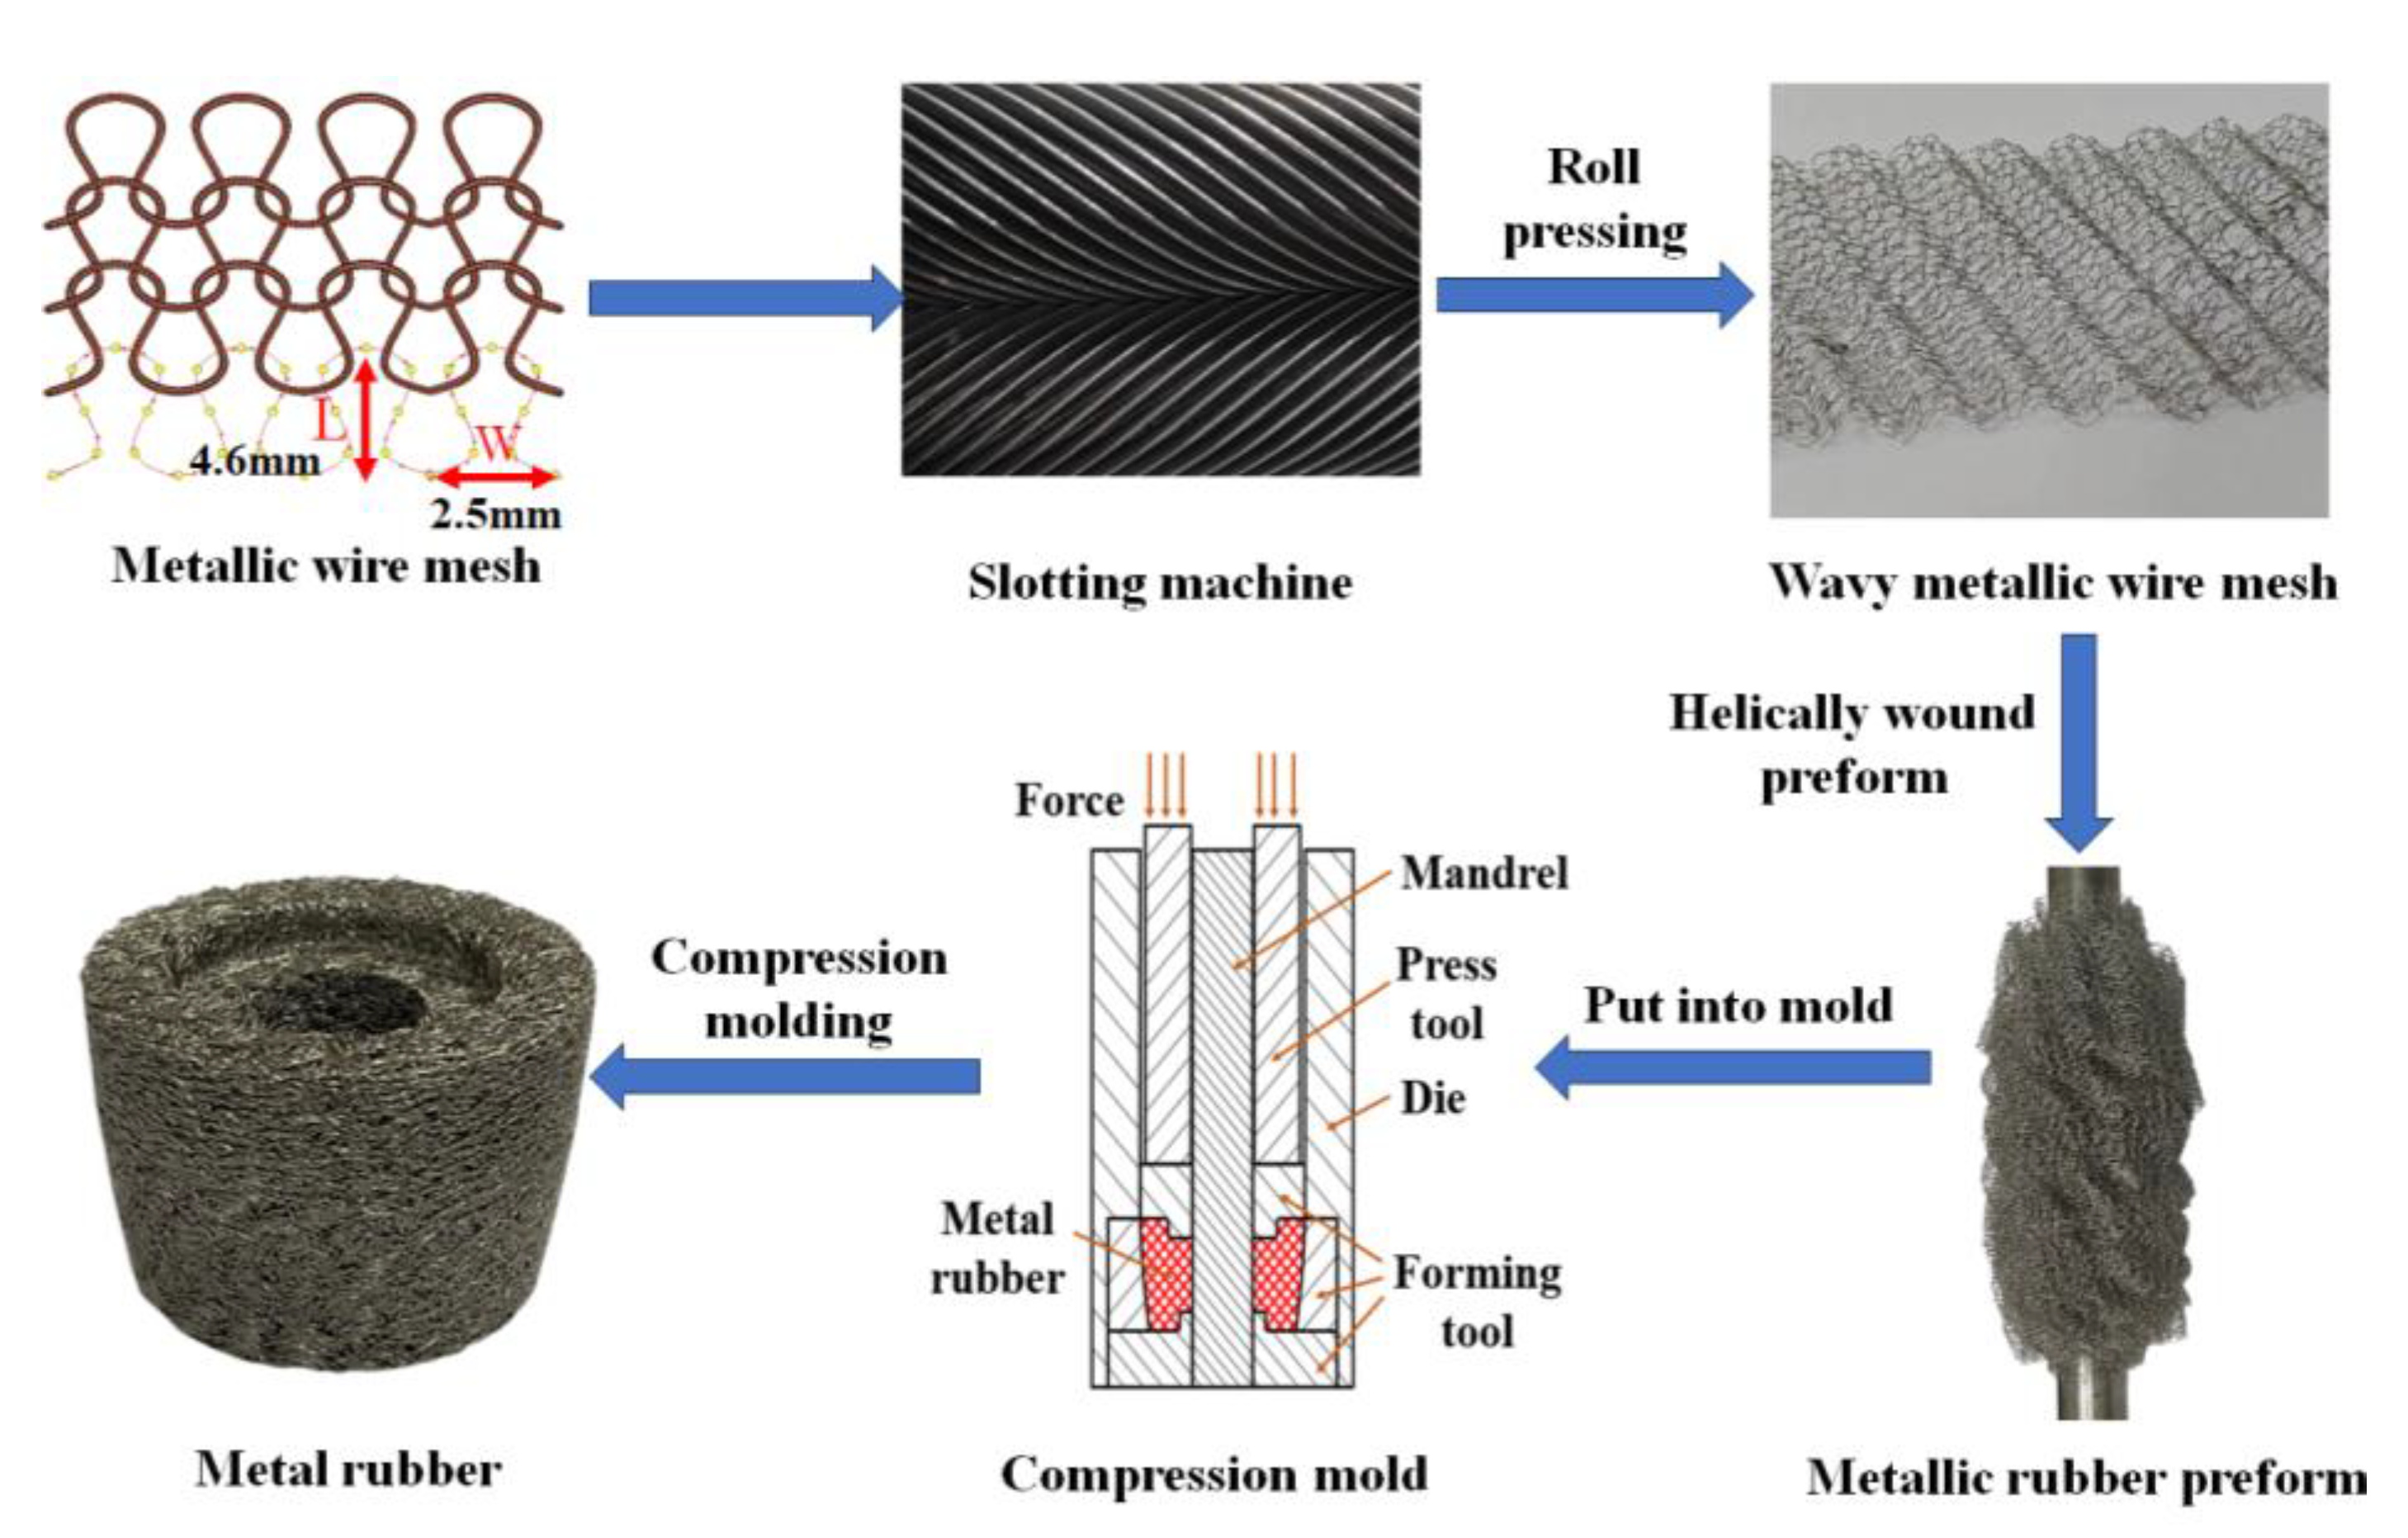
Figure 3.
Illustration of the test platform of Sine sweep frequency.
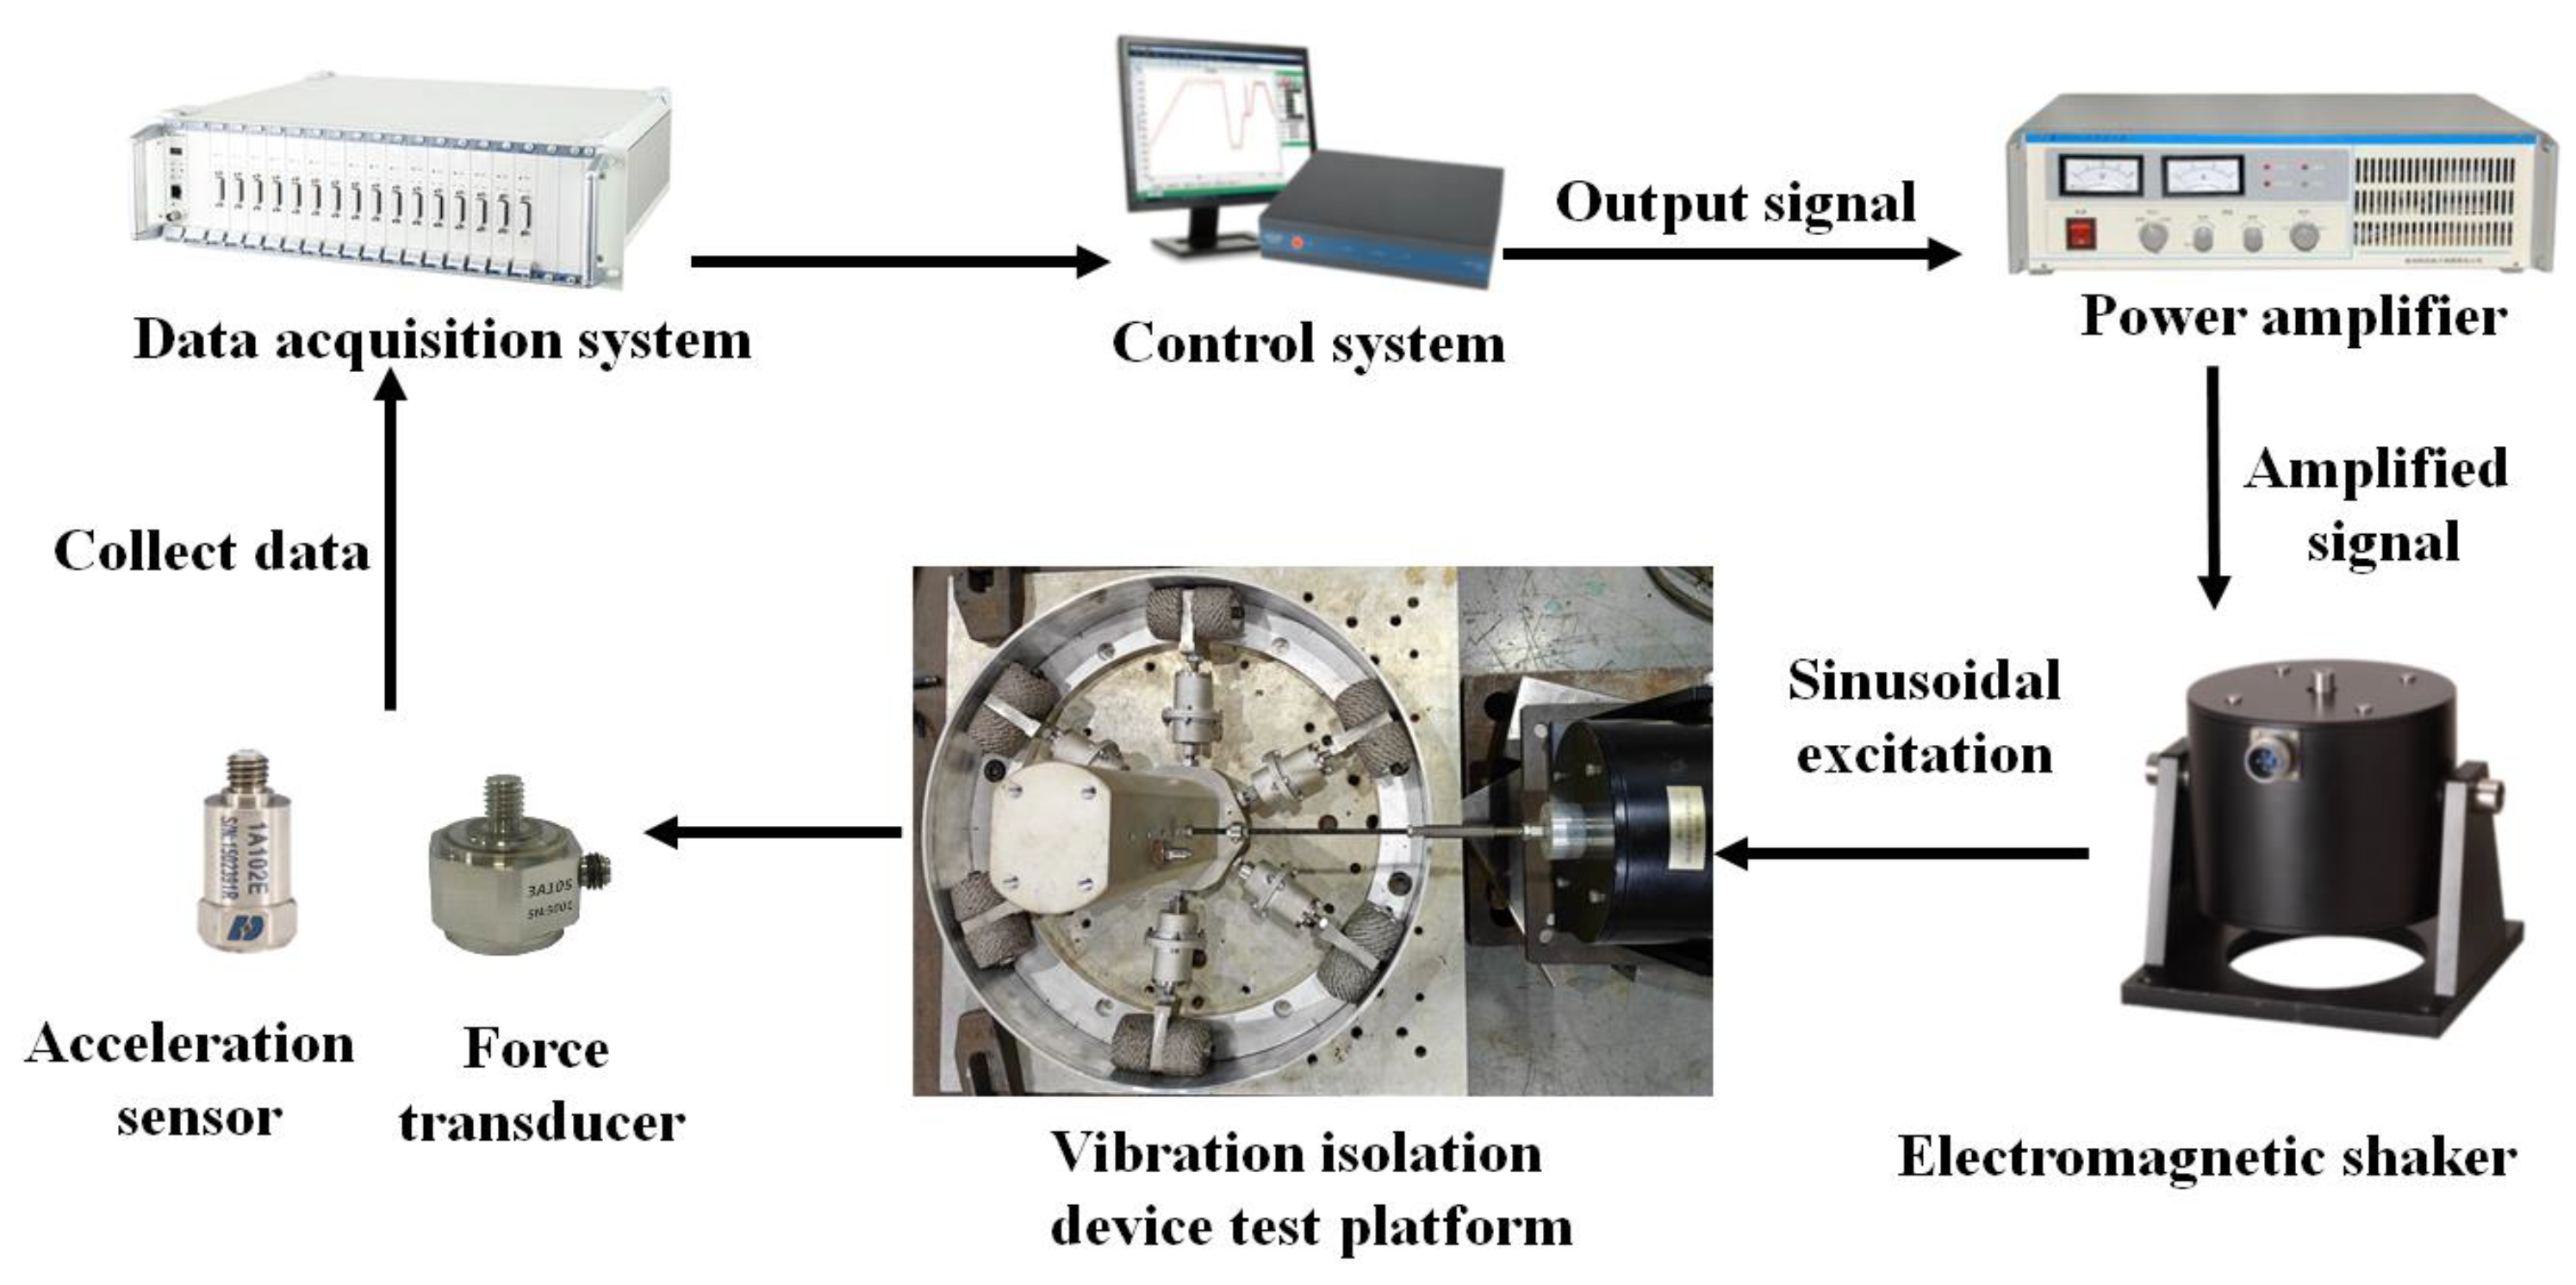
Figure 4.
Finite element simulation: (a) Boundary condition, (b) Bergström-Boyce model.
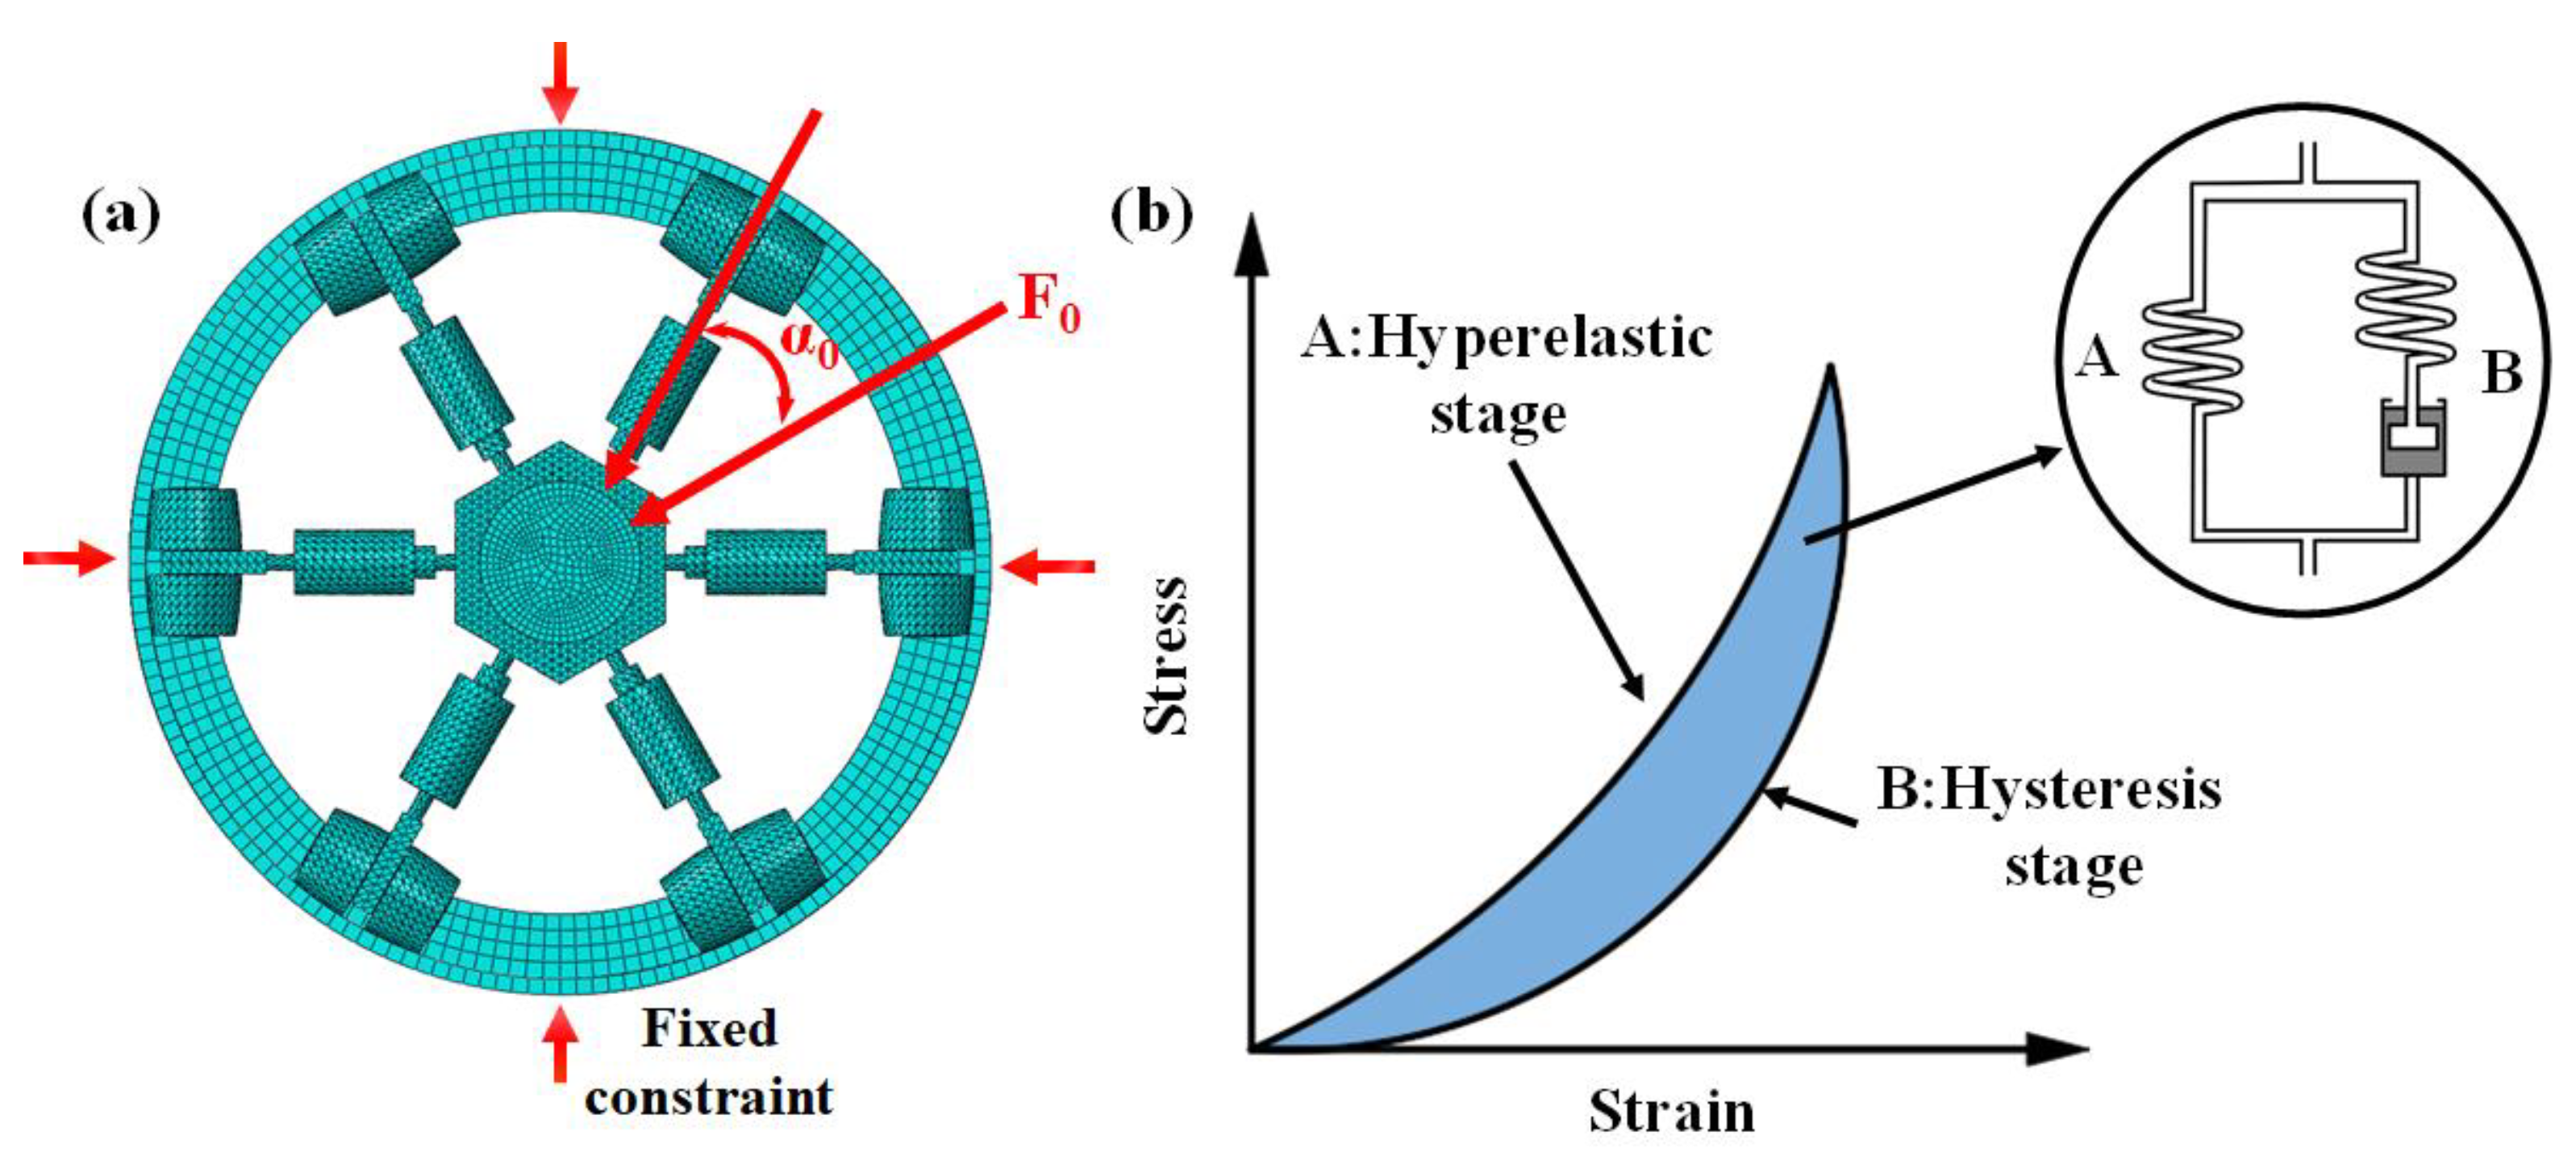
Figure 5.
Fitting curves of VCMR with different densities.
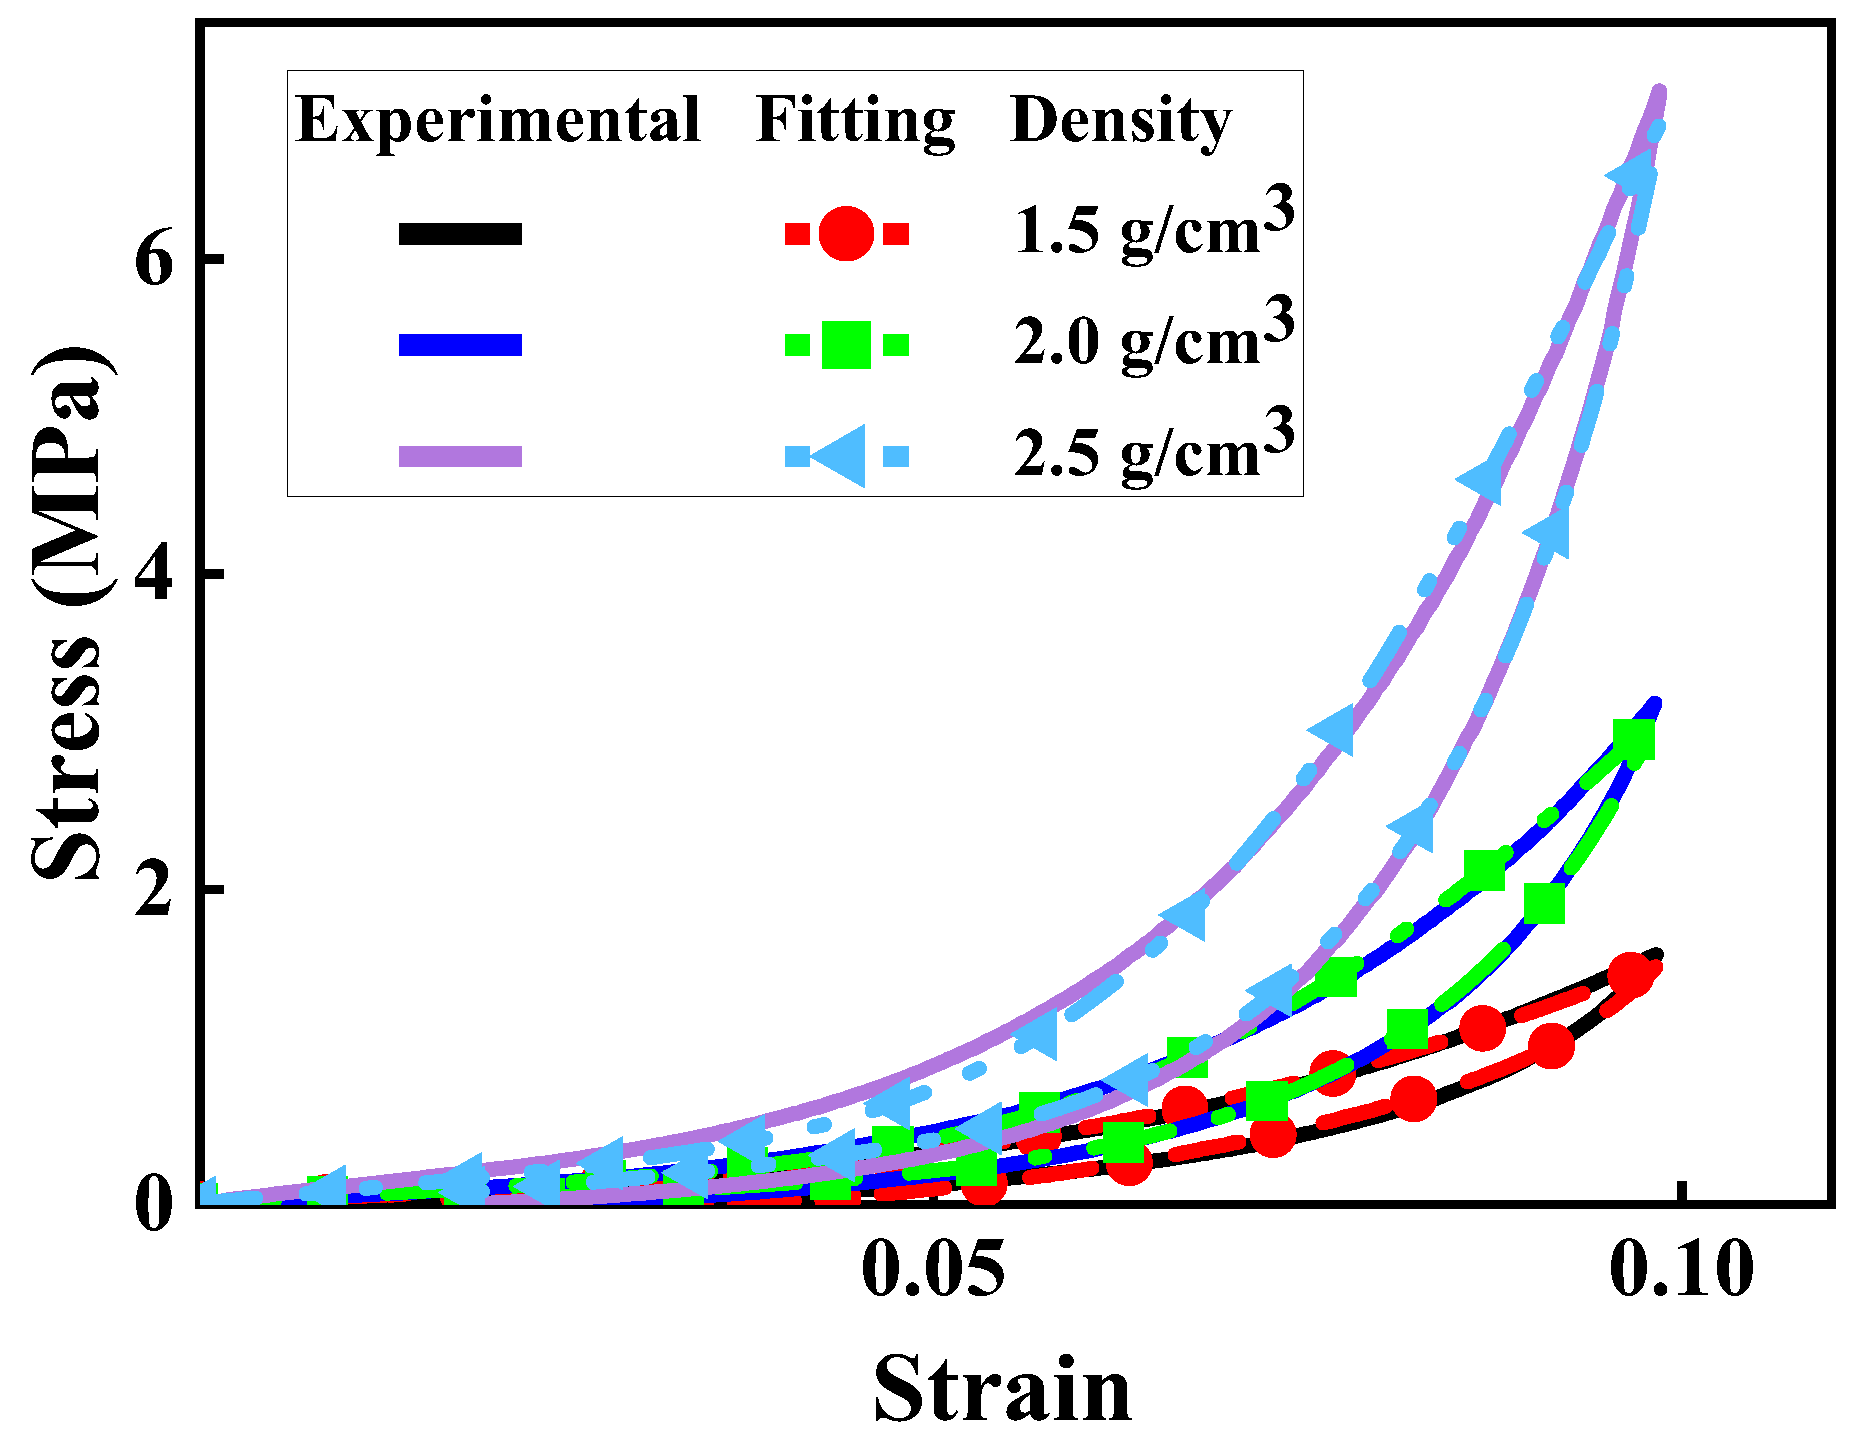
Figure 6.
Fourth mode of VCMRI: (a) First-order mode, (b) Second-order mode, (c) Third-order mode, (d) Fourth-order mode.
Figure 6.
Fourth mode of VCMRI: (a) First-order mode, (b) Second-order mode, (c) Third-order mode, (d) Fourth-order mode.
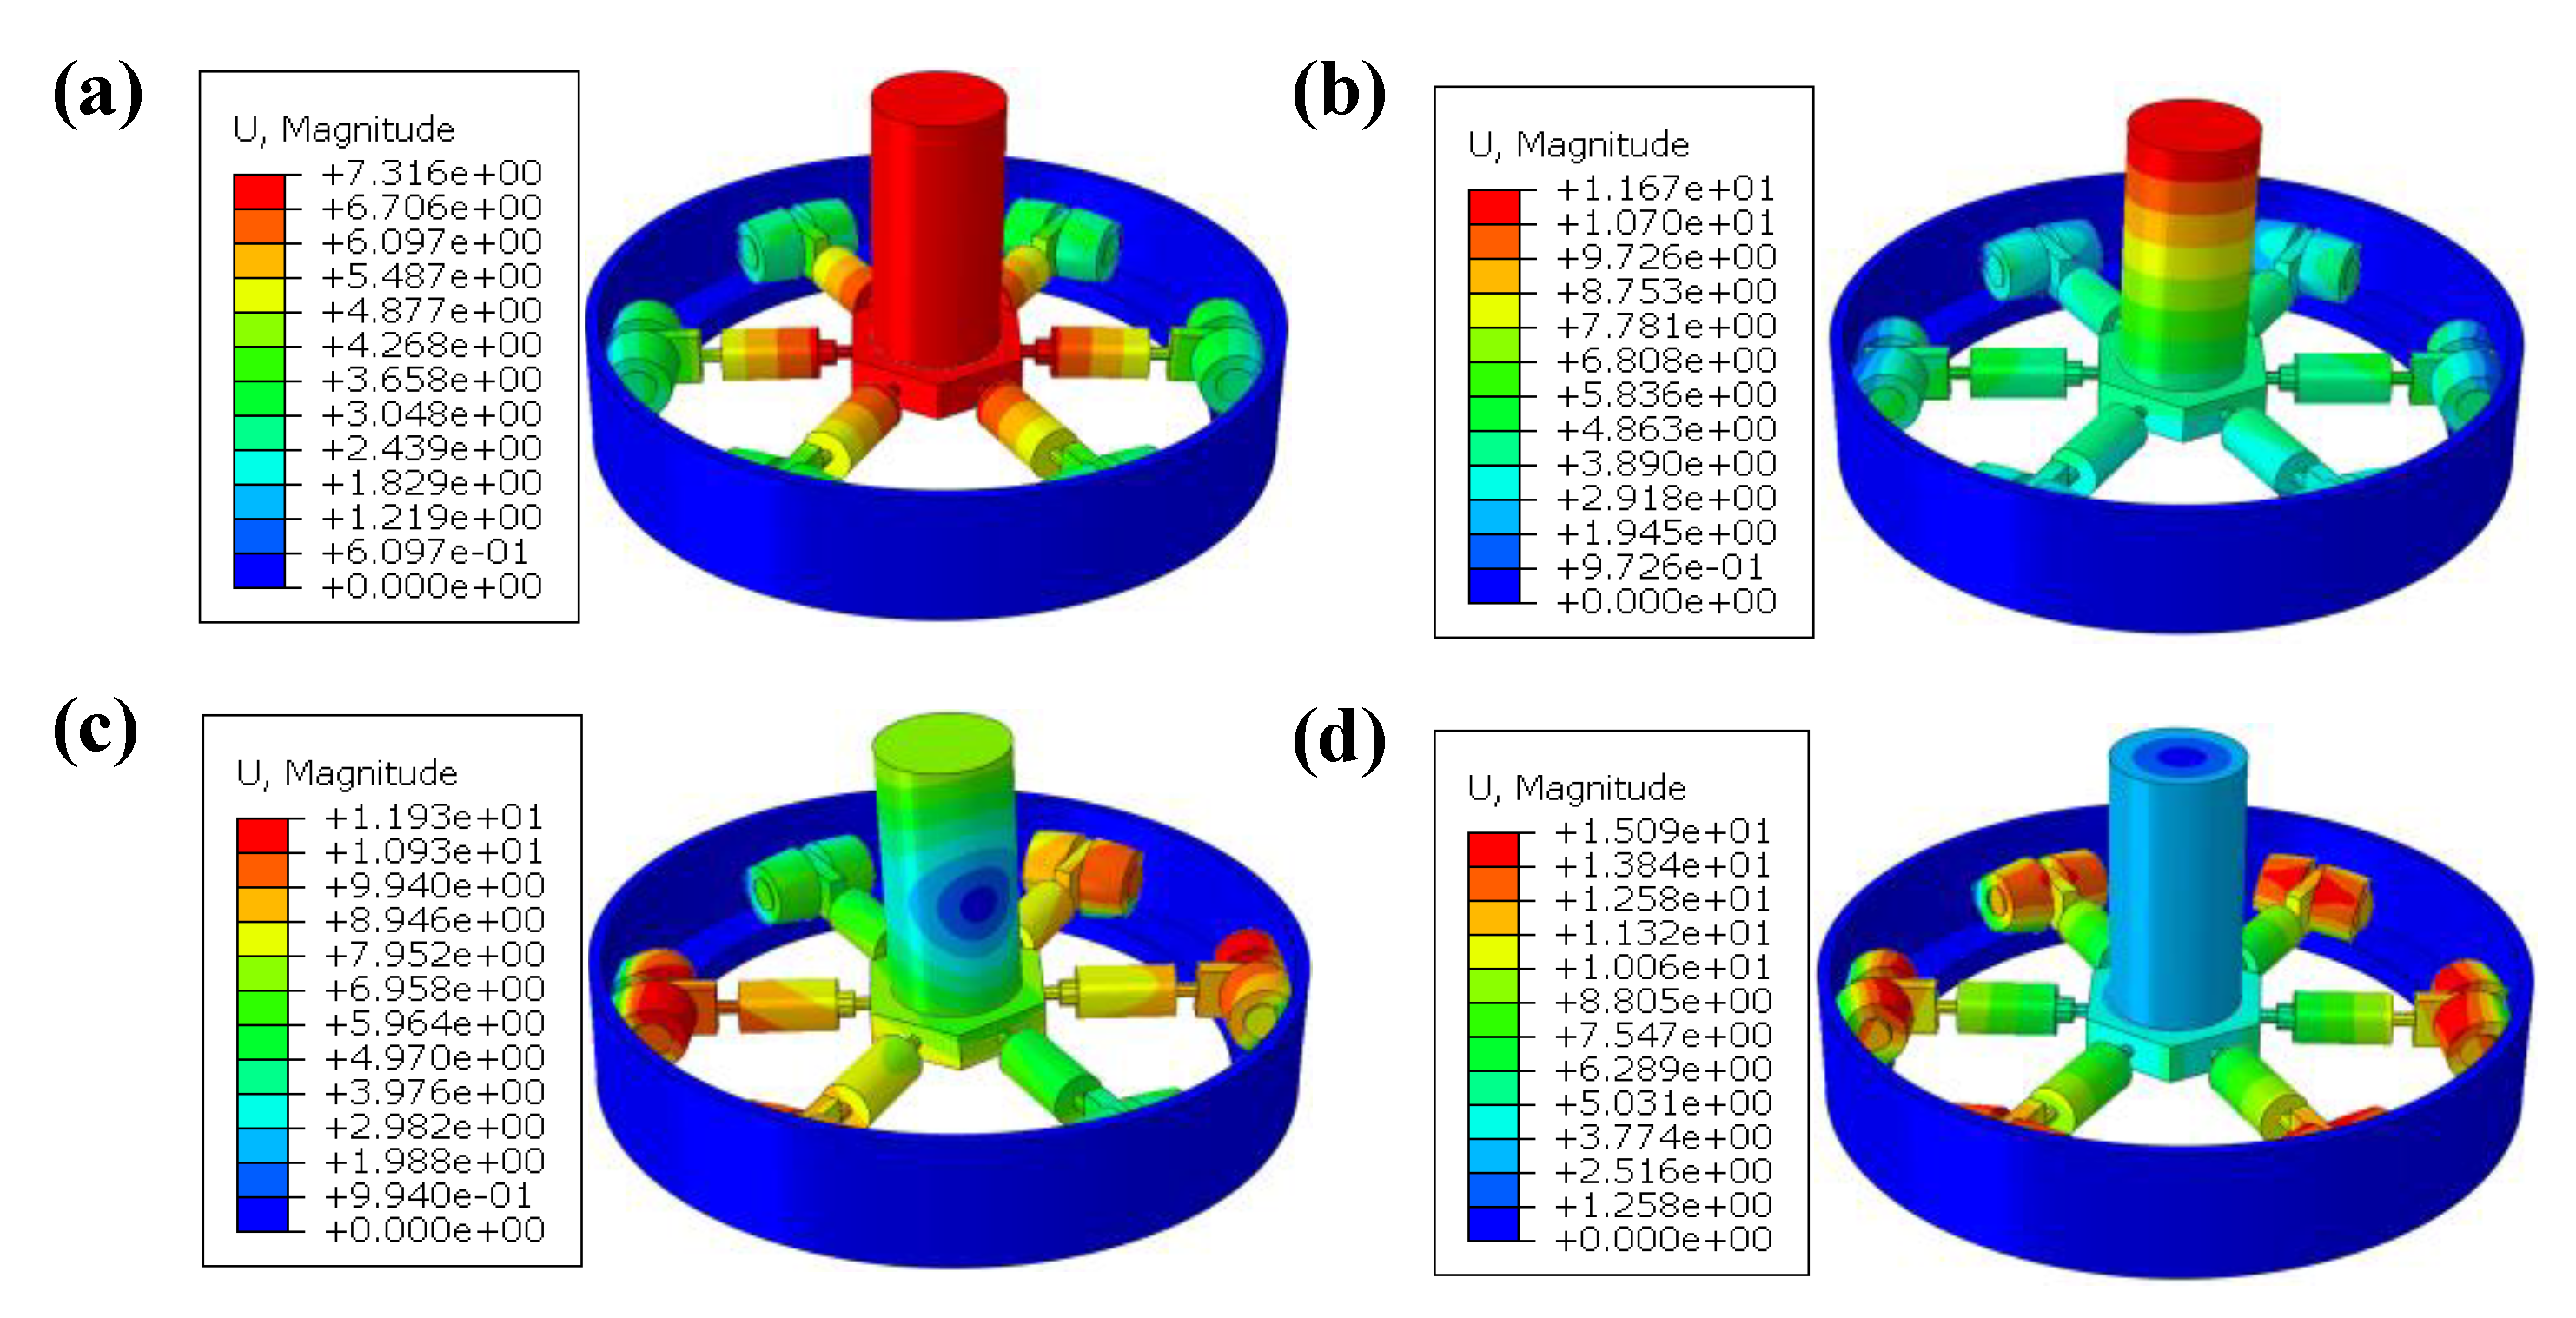
Figure 7.
Comparison of simulation and experimental frequency response curves: (a) 50 kN/m, (b) 100 kN/m, (c) 150 kN/m, (d) ∞ kN/m.
Figure 7.
Comparison of simulation and experimental frequency response curves: (a) 50 kN/m, (b) 100 kN/m, (c) 150 kN/m, (d) ∞ kN/m.
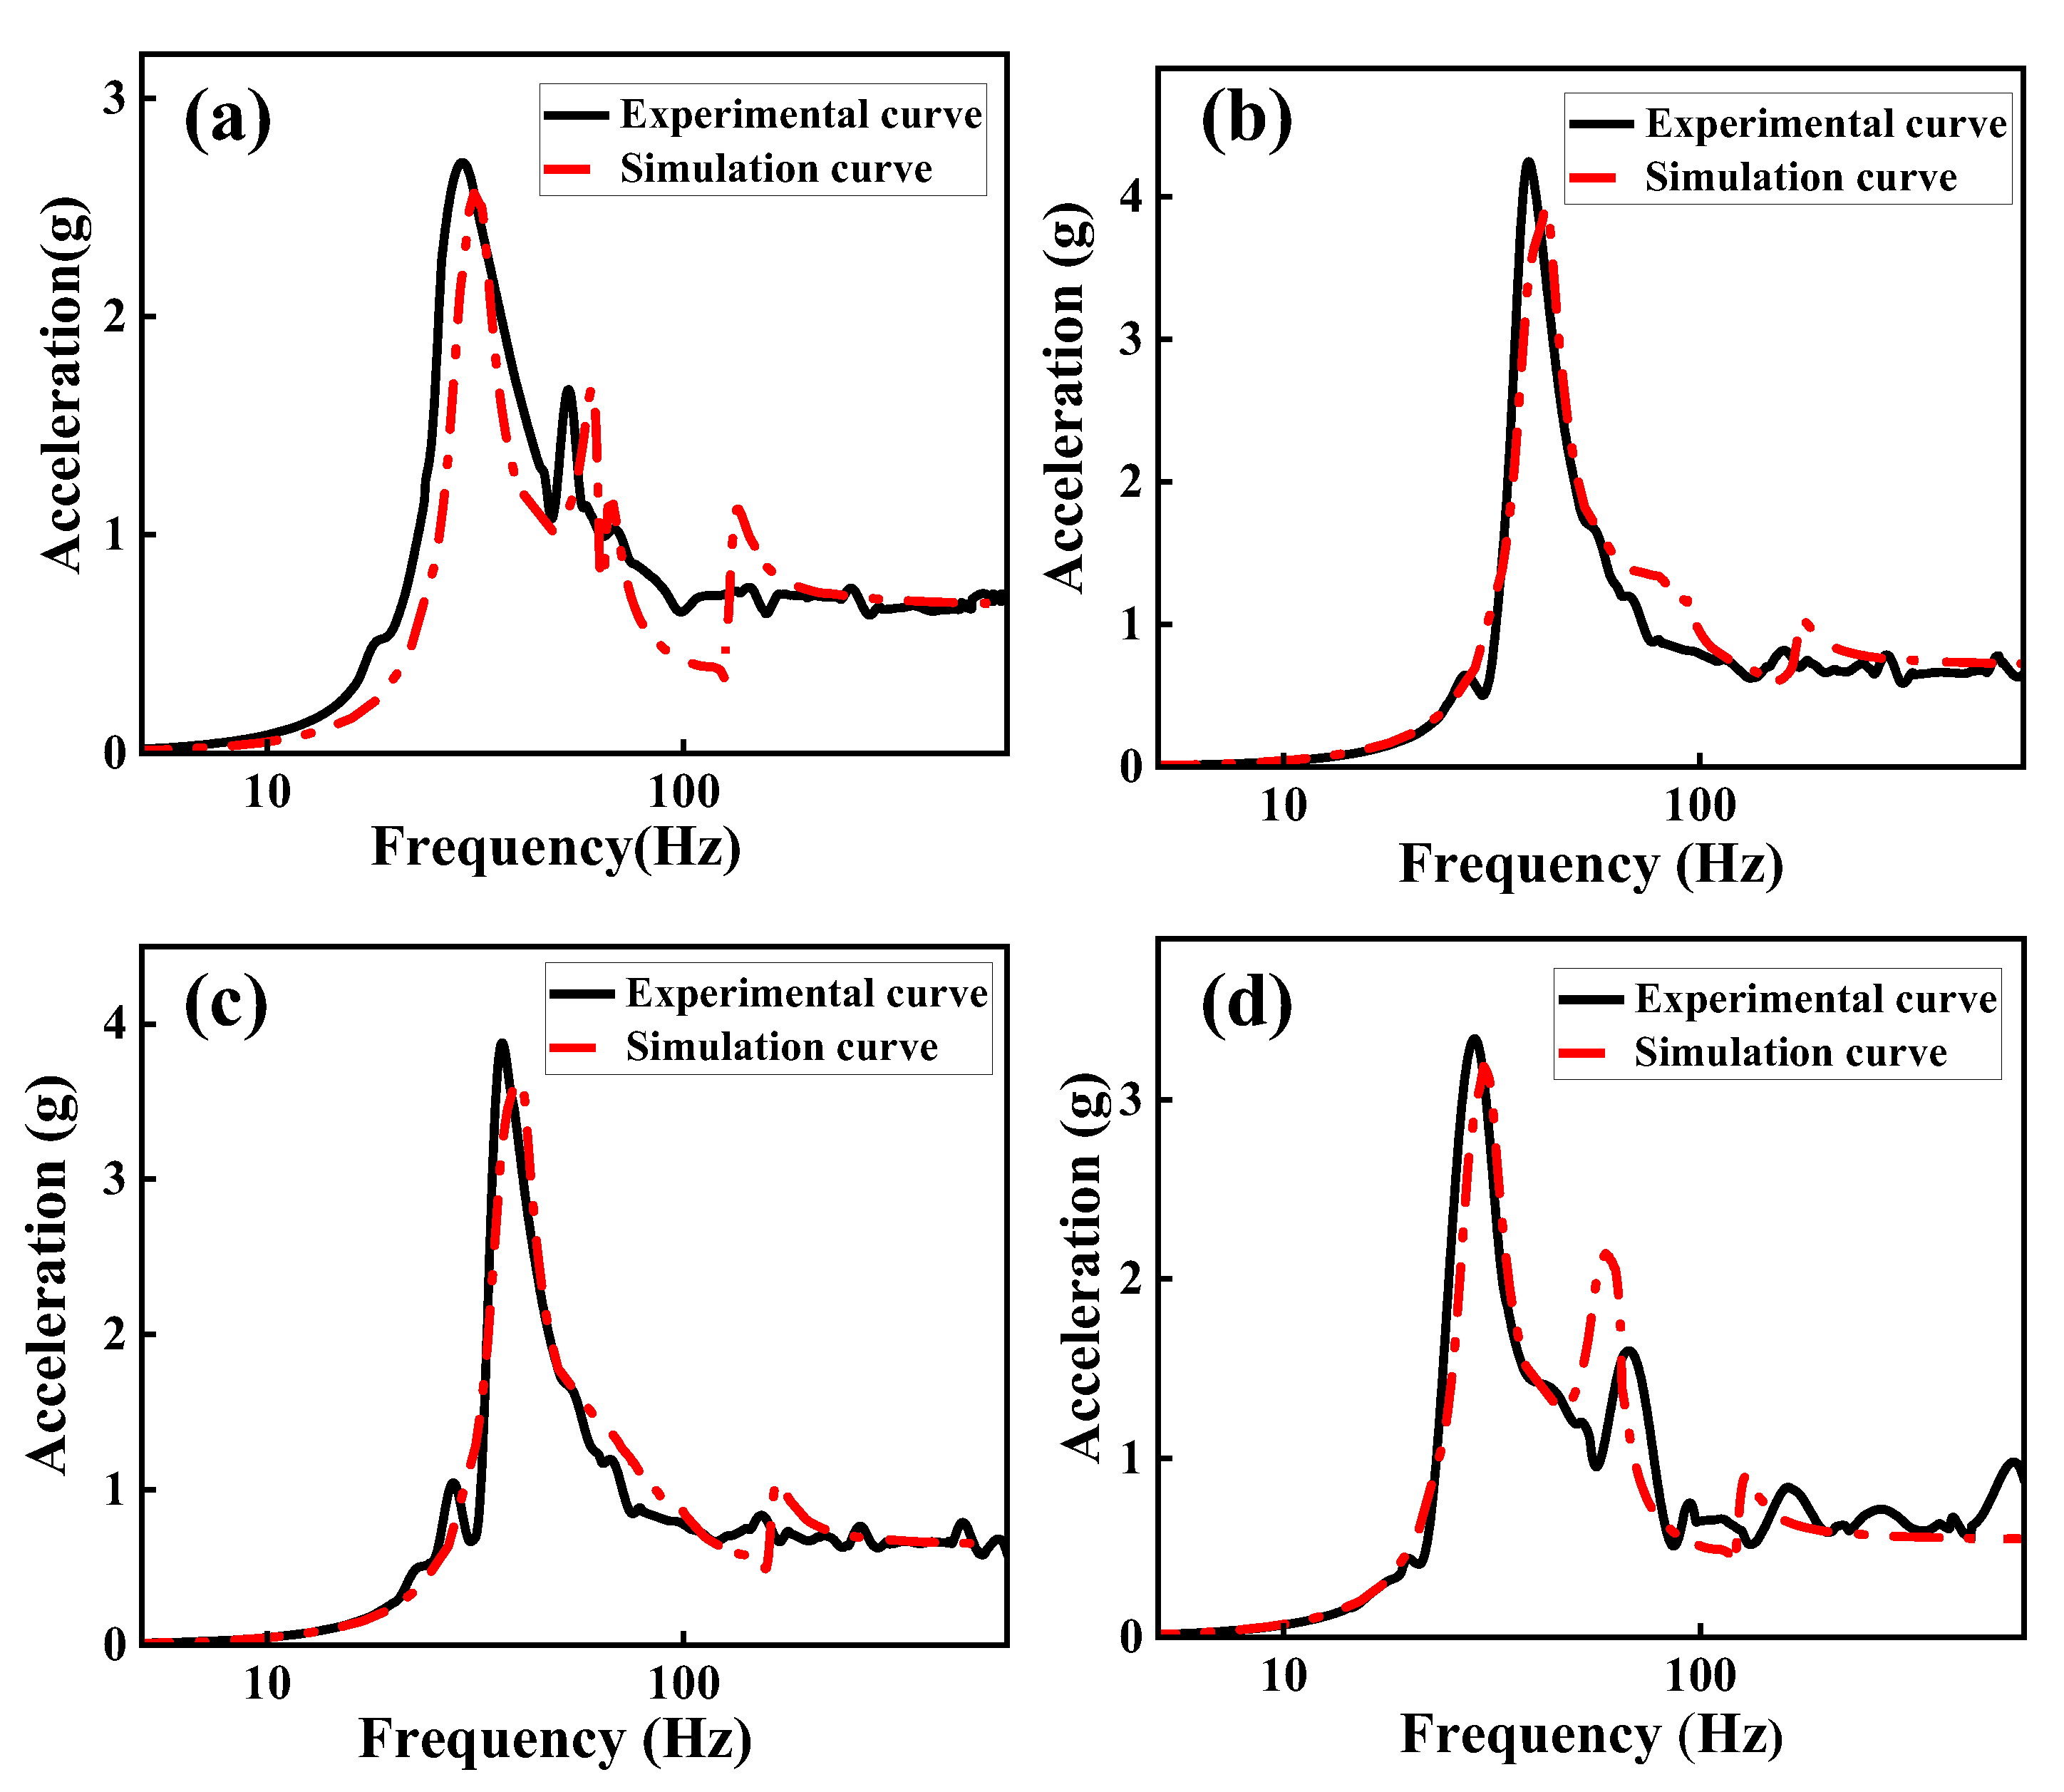
Figure 8.
Relative error between experimental results and simulation results.
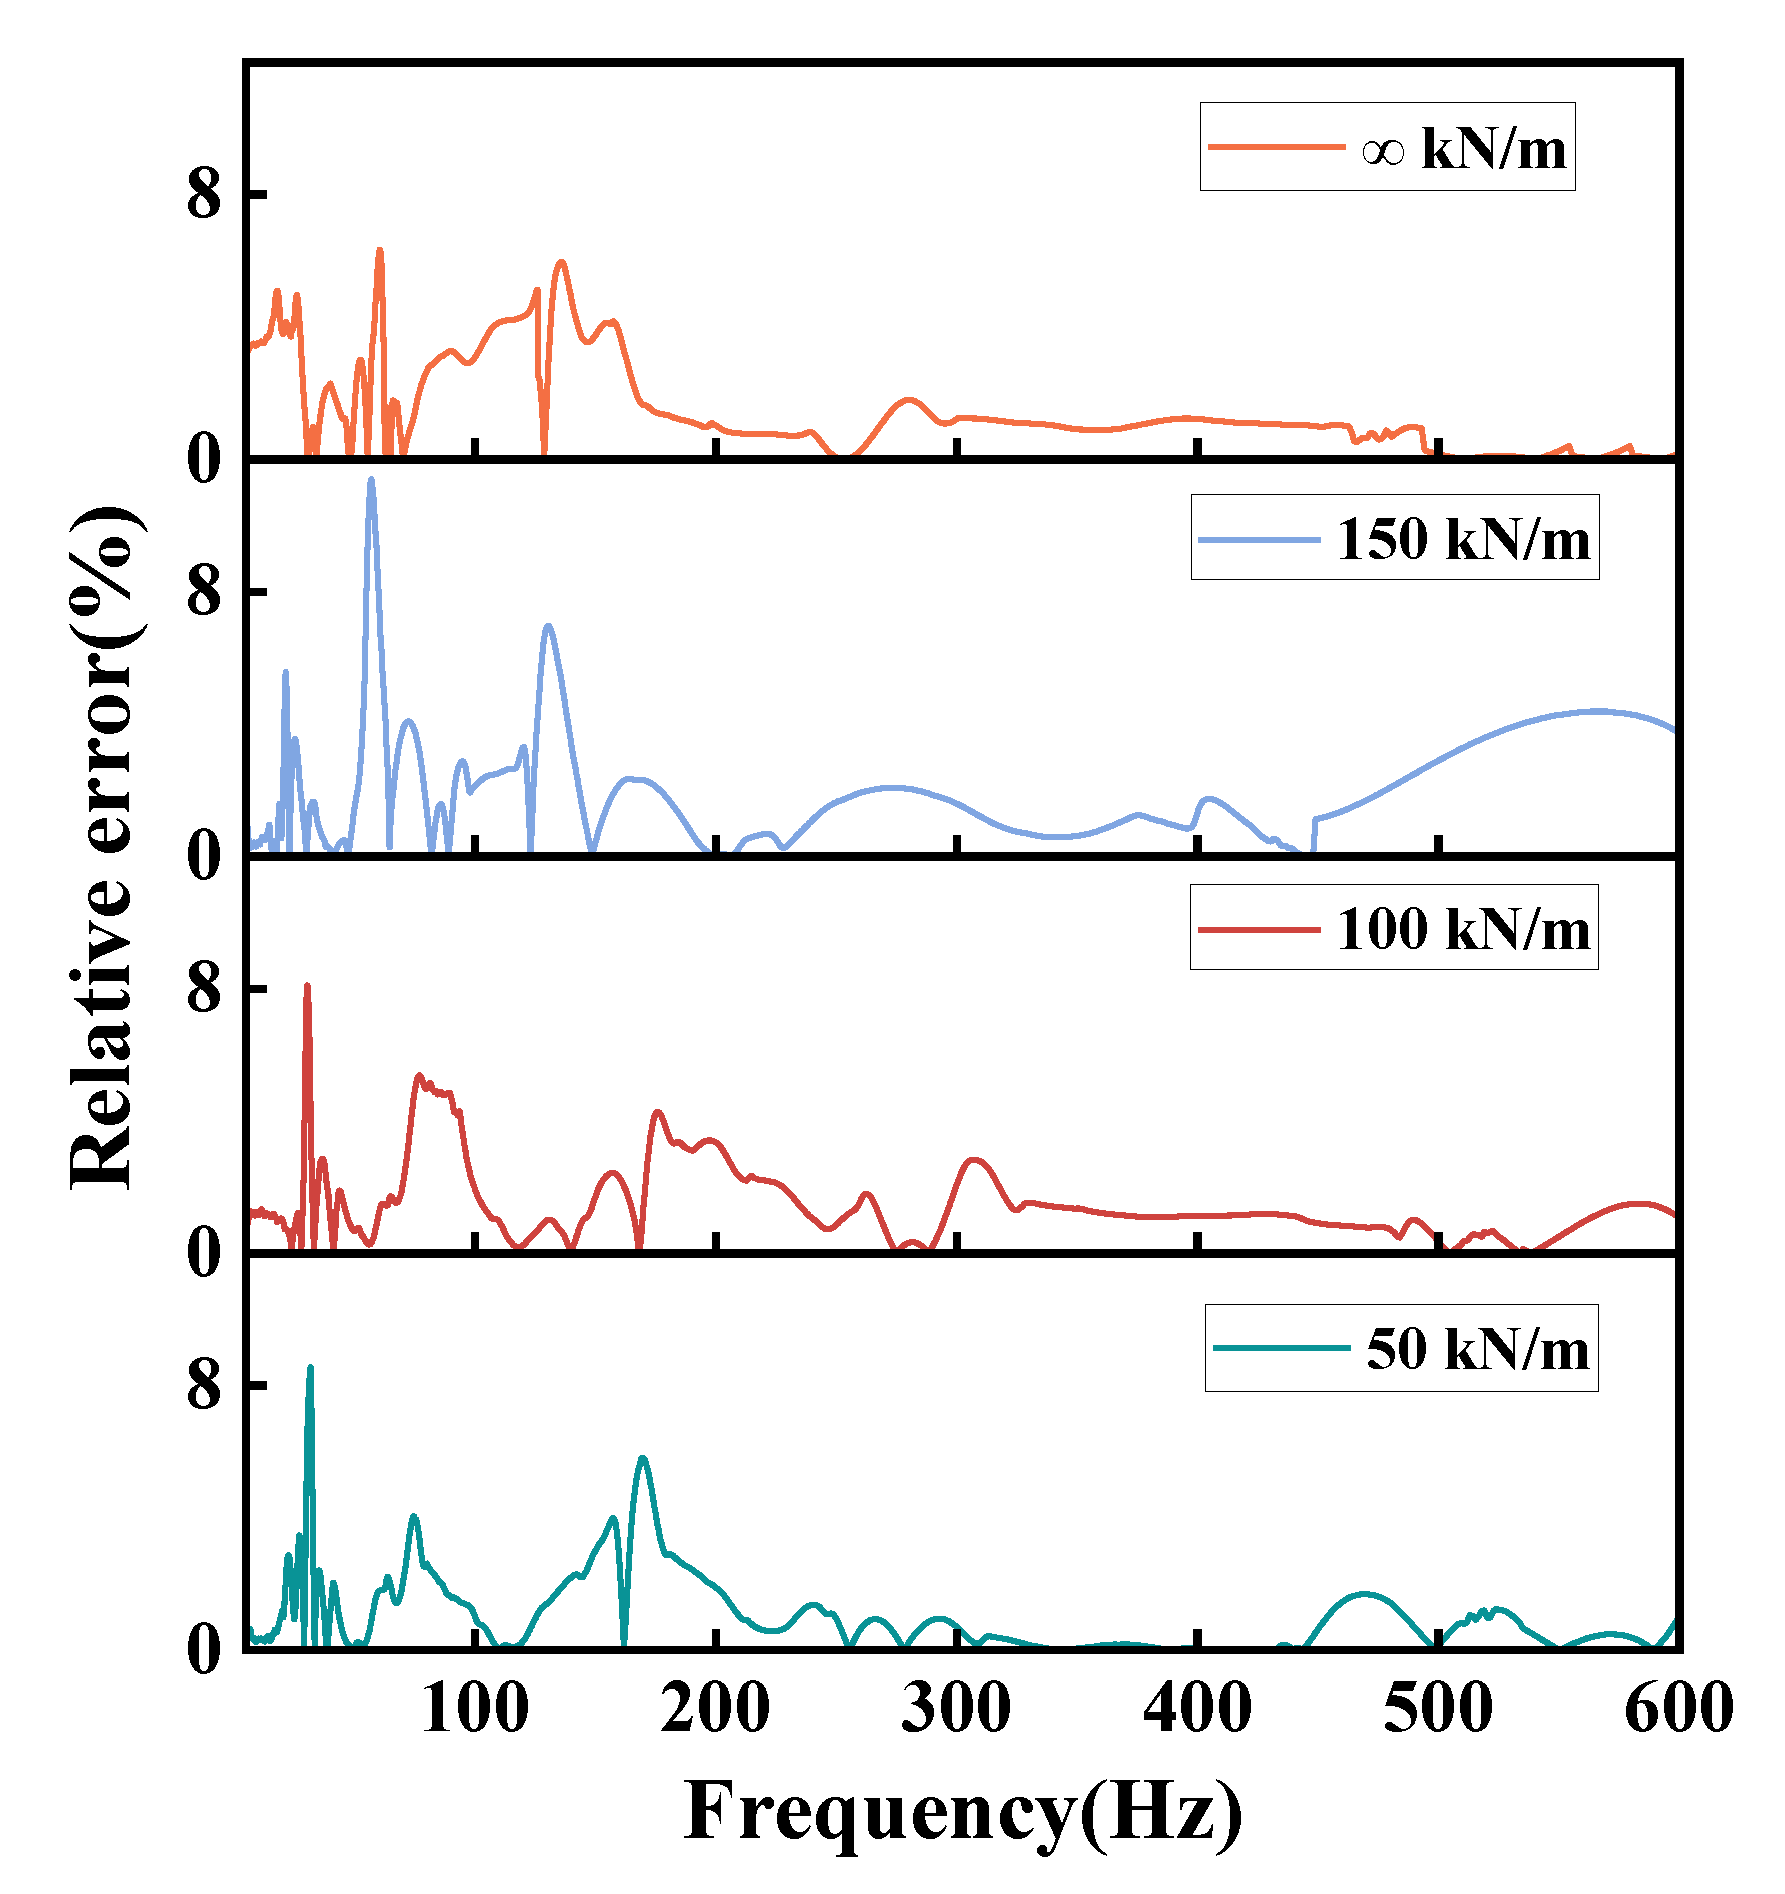
Figure 9.
Comparison of peak value of acceleration response (a) and natural frequency (b) between experimental and simulation results.
Figure 9.
Comparison of peak value of acceleration response (a) and natural frequency (b) between experimental and simulation results.
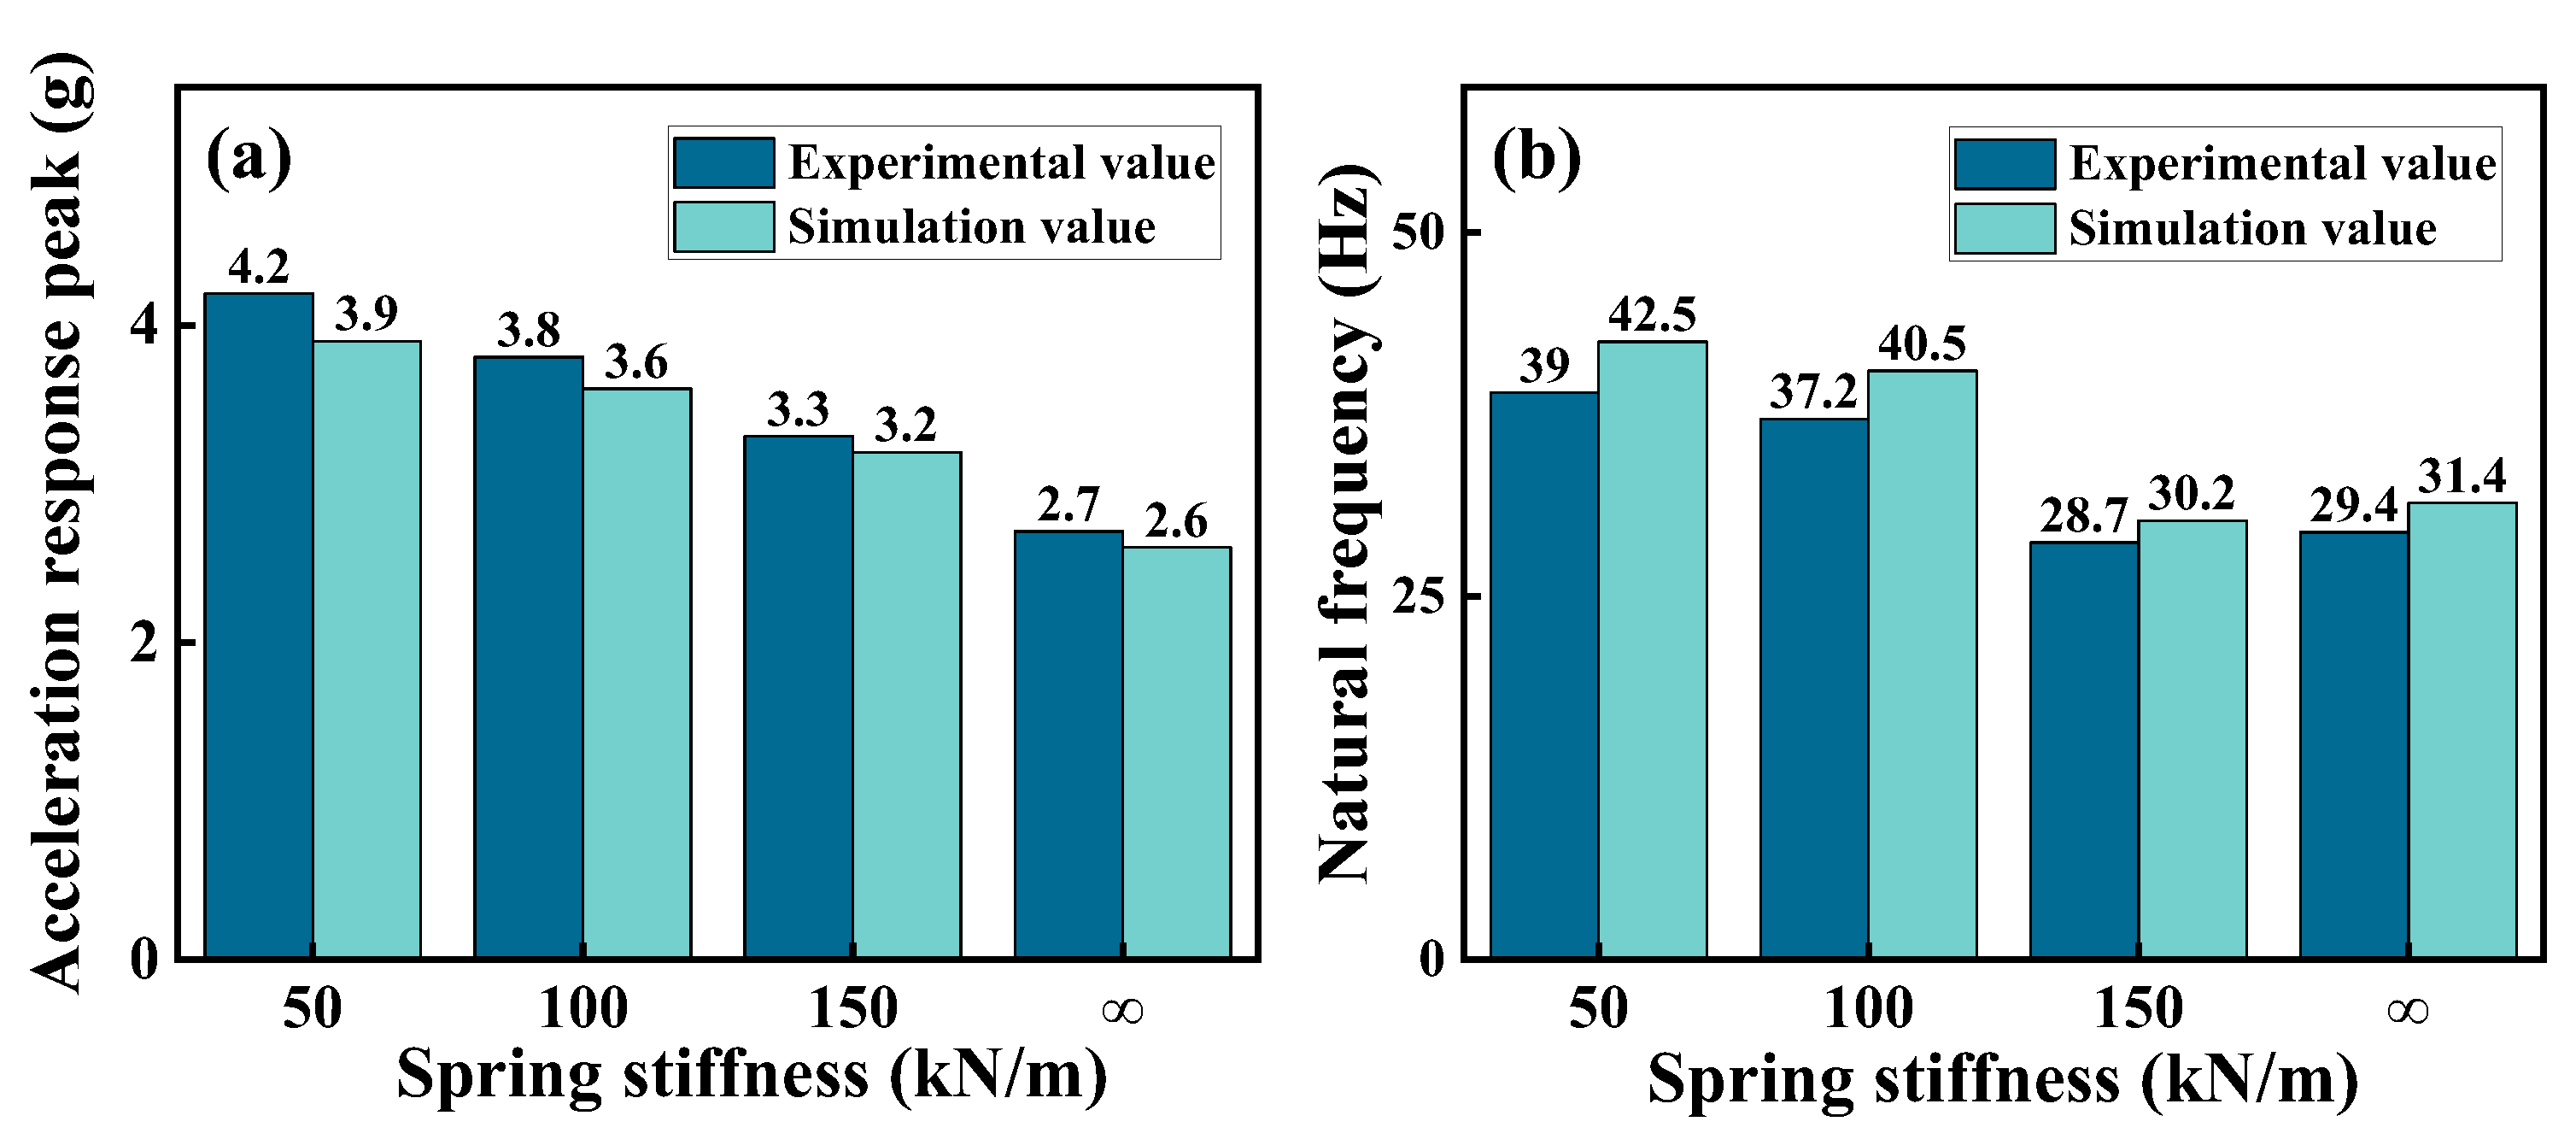
Figure 10.
Acceleration response curves: (a) rigid structure, (b) different VCMR densities.
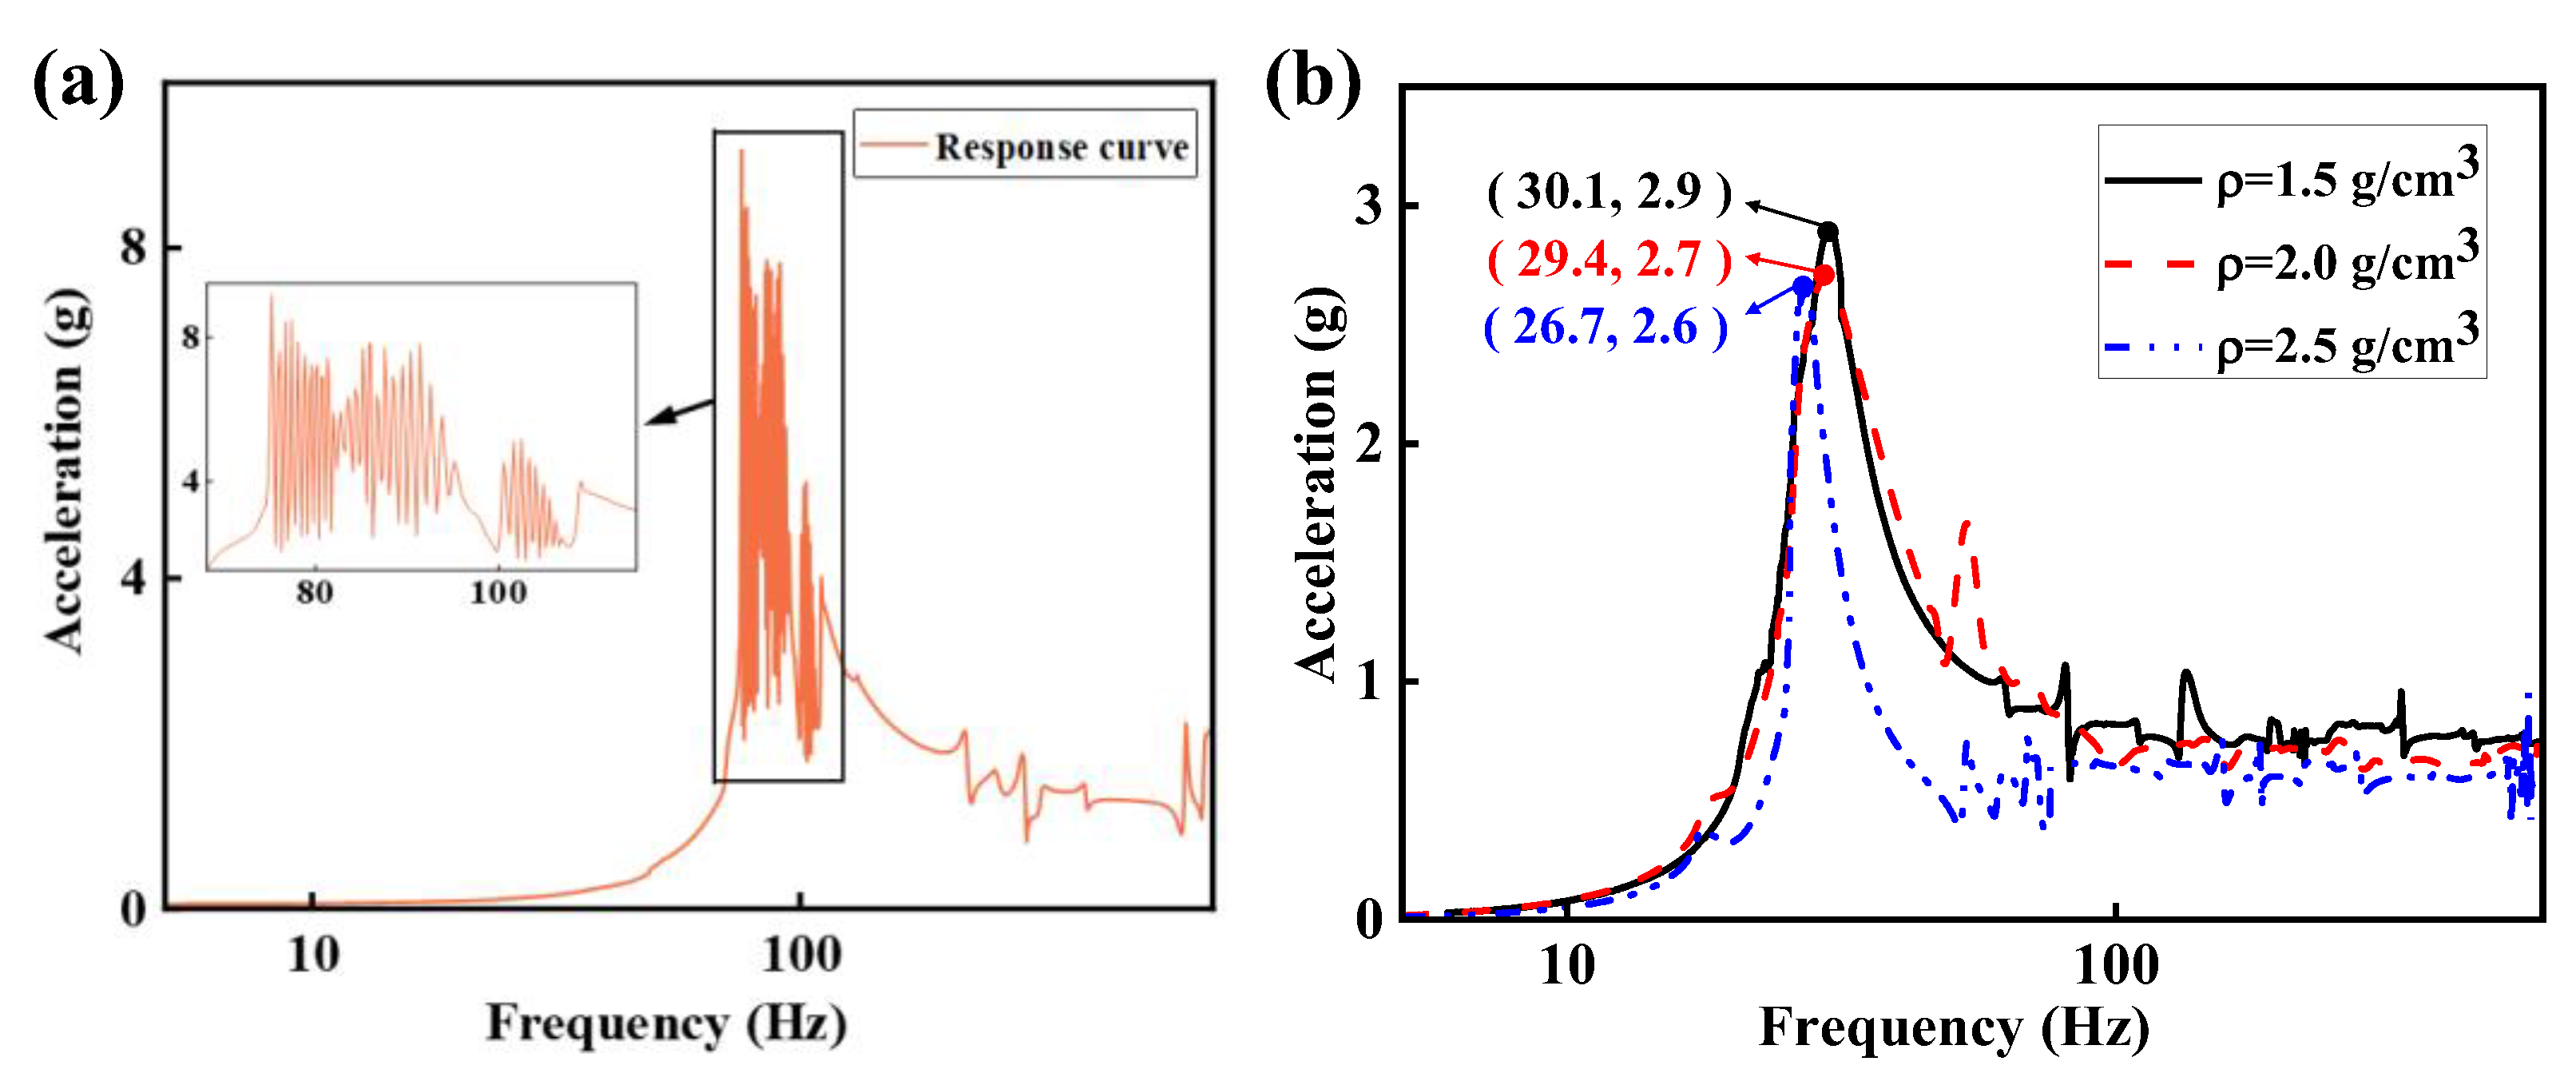
Figure 11.
Influence of excitation force variation on frequency response curve under different spring stiffnesses: (a) 50 kN/m, (b) 100 kN/m, (c) 150 kN/m, (d) ∞ kN/m.
Figure 11.
Influence of excitation force variation on frequency response curve under different spring stiffnesses: (a) 50 kN/m, (b) 100 kN/m, (c) 150 kN/m, (d) ∞ kN/m.
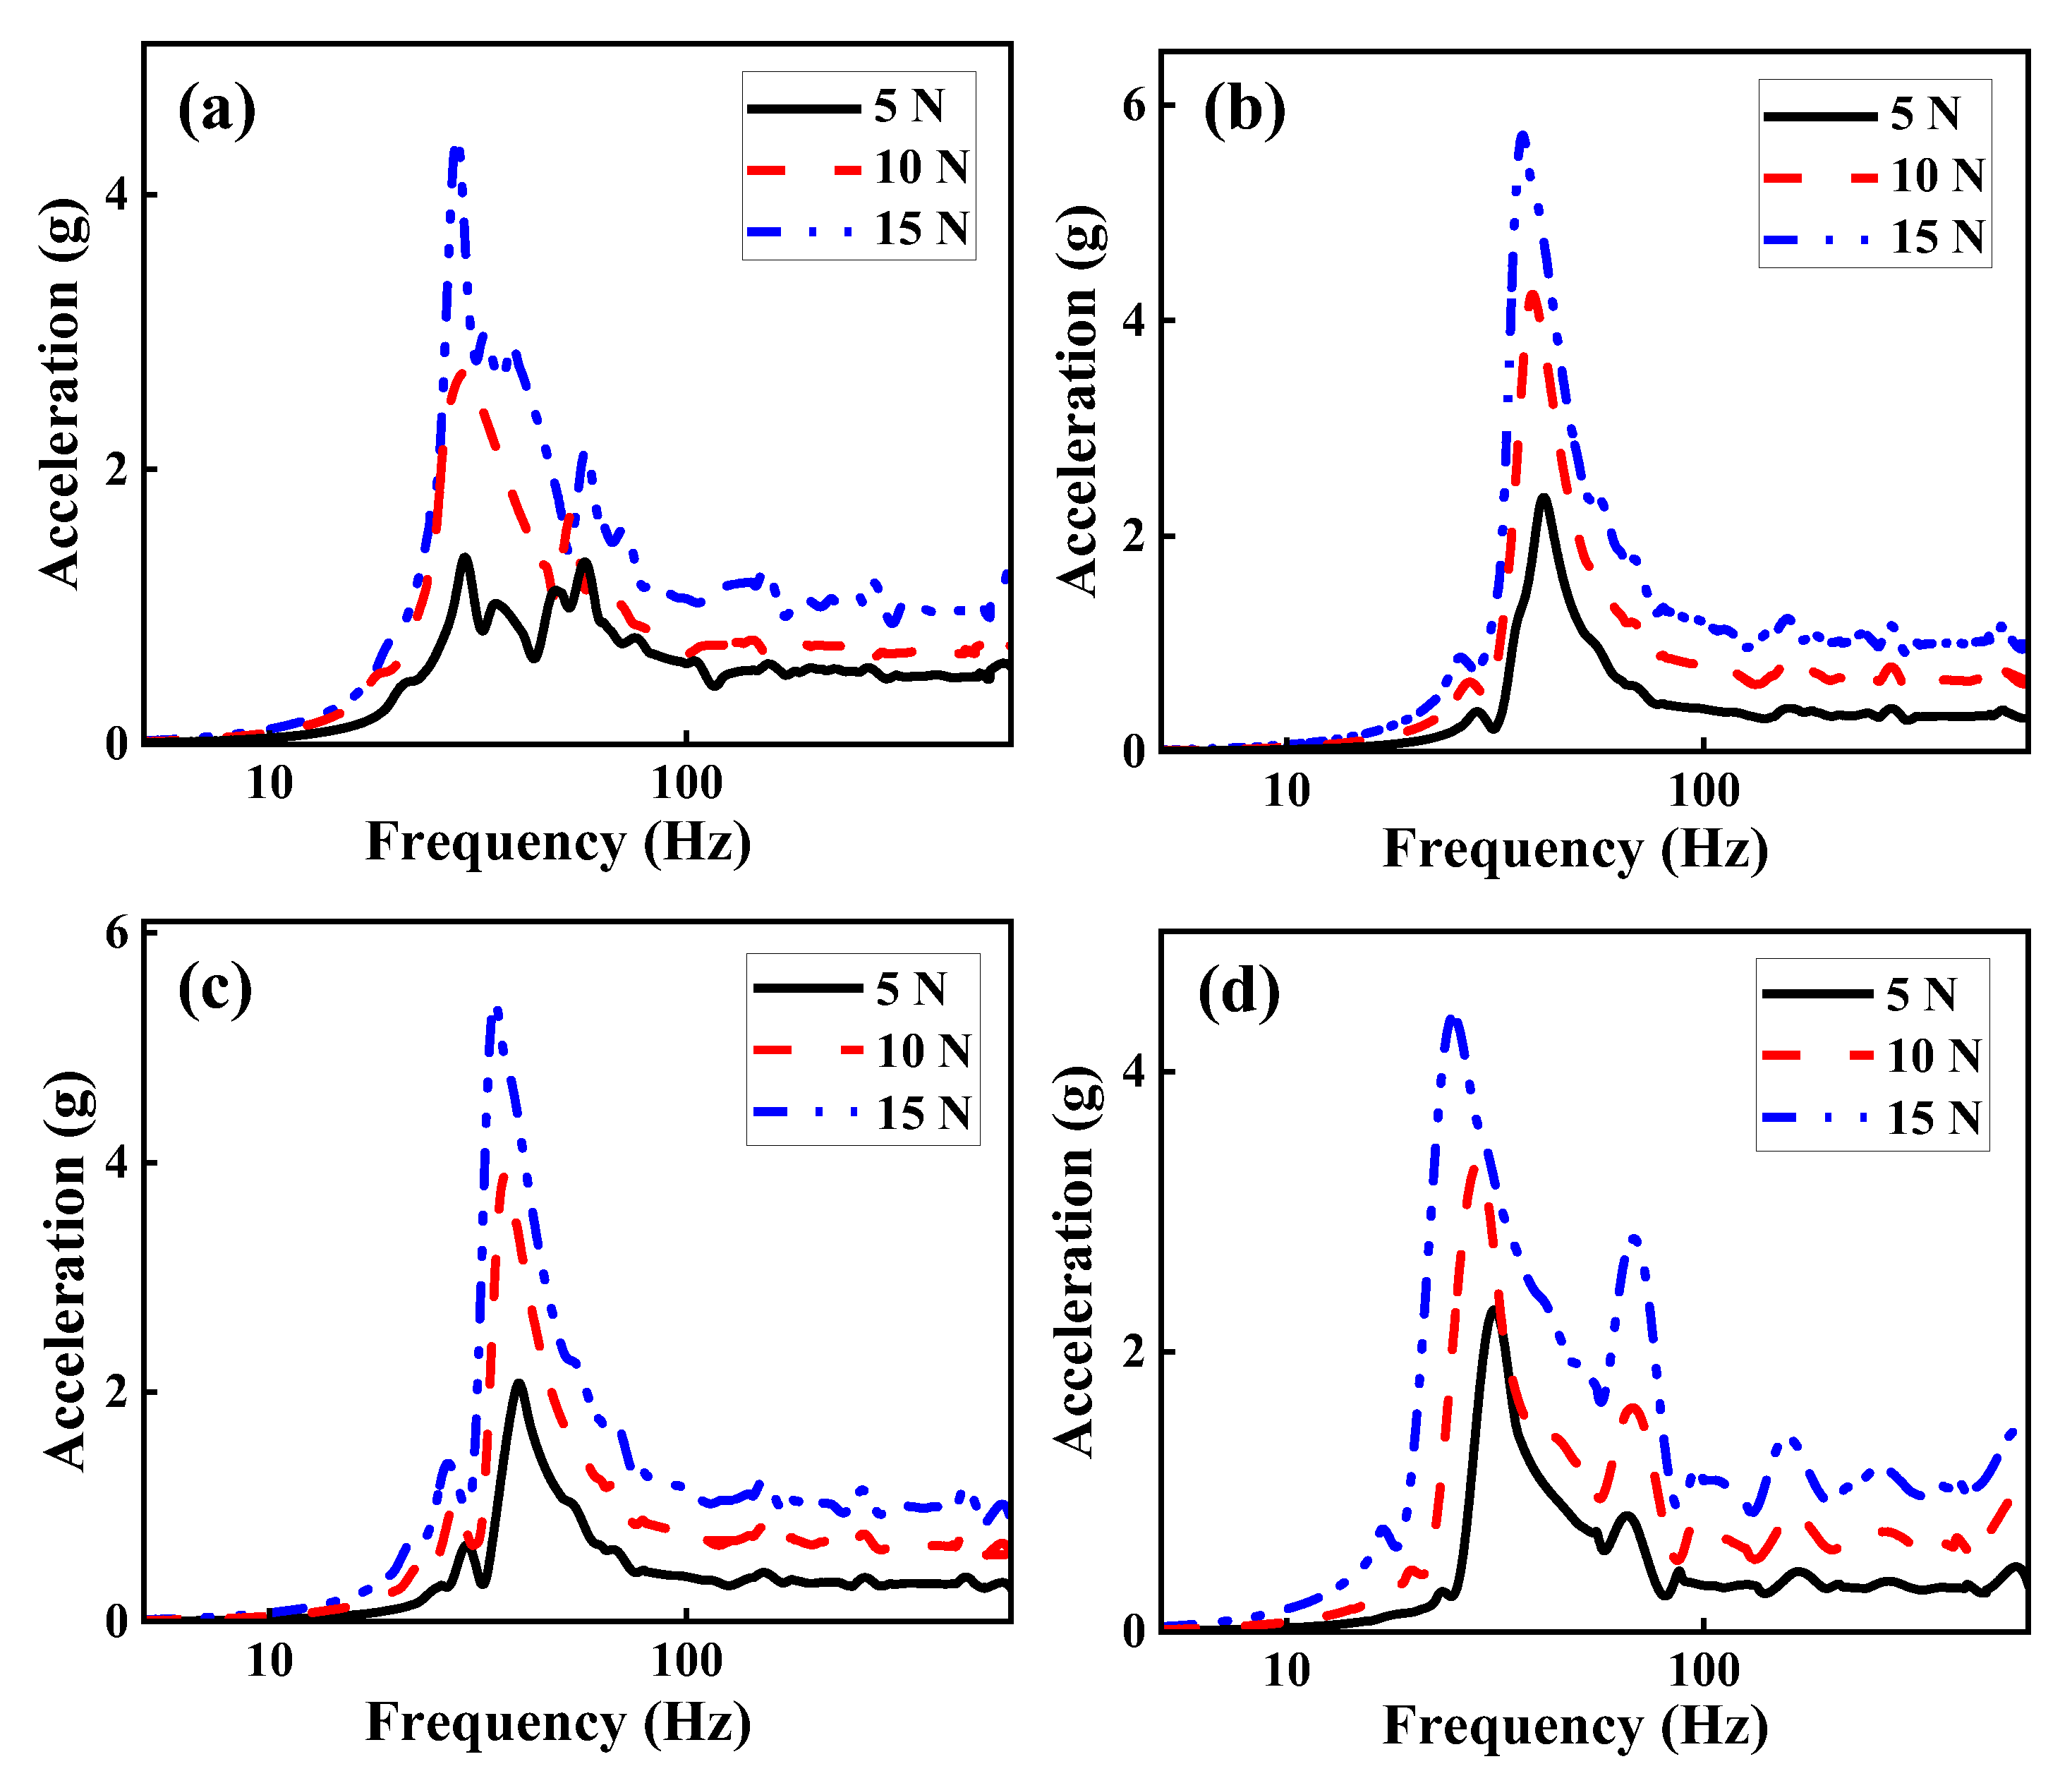
Figure 12.
Influence of excitation angles change on frequency response curve with different spring stiffnesses: (a) 50 kN/m (b) 100 kN/m (c) 150 kN/m (d) ∞ kN/m.
Figure 12.
Influence of excitation angles change on frequency response curve with different spring stiffnesses: (a) 50 kN/m (b) 100 kN/m (c) 150 kN/m (d) ∞ kN/m.
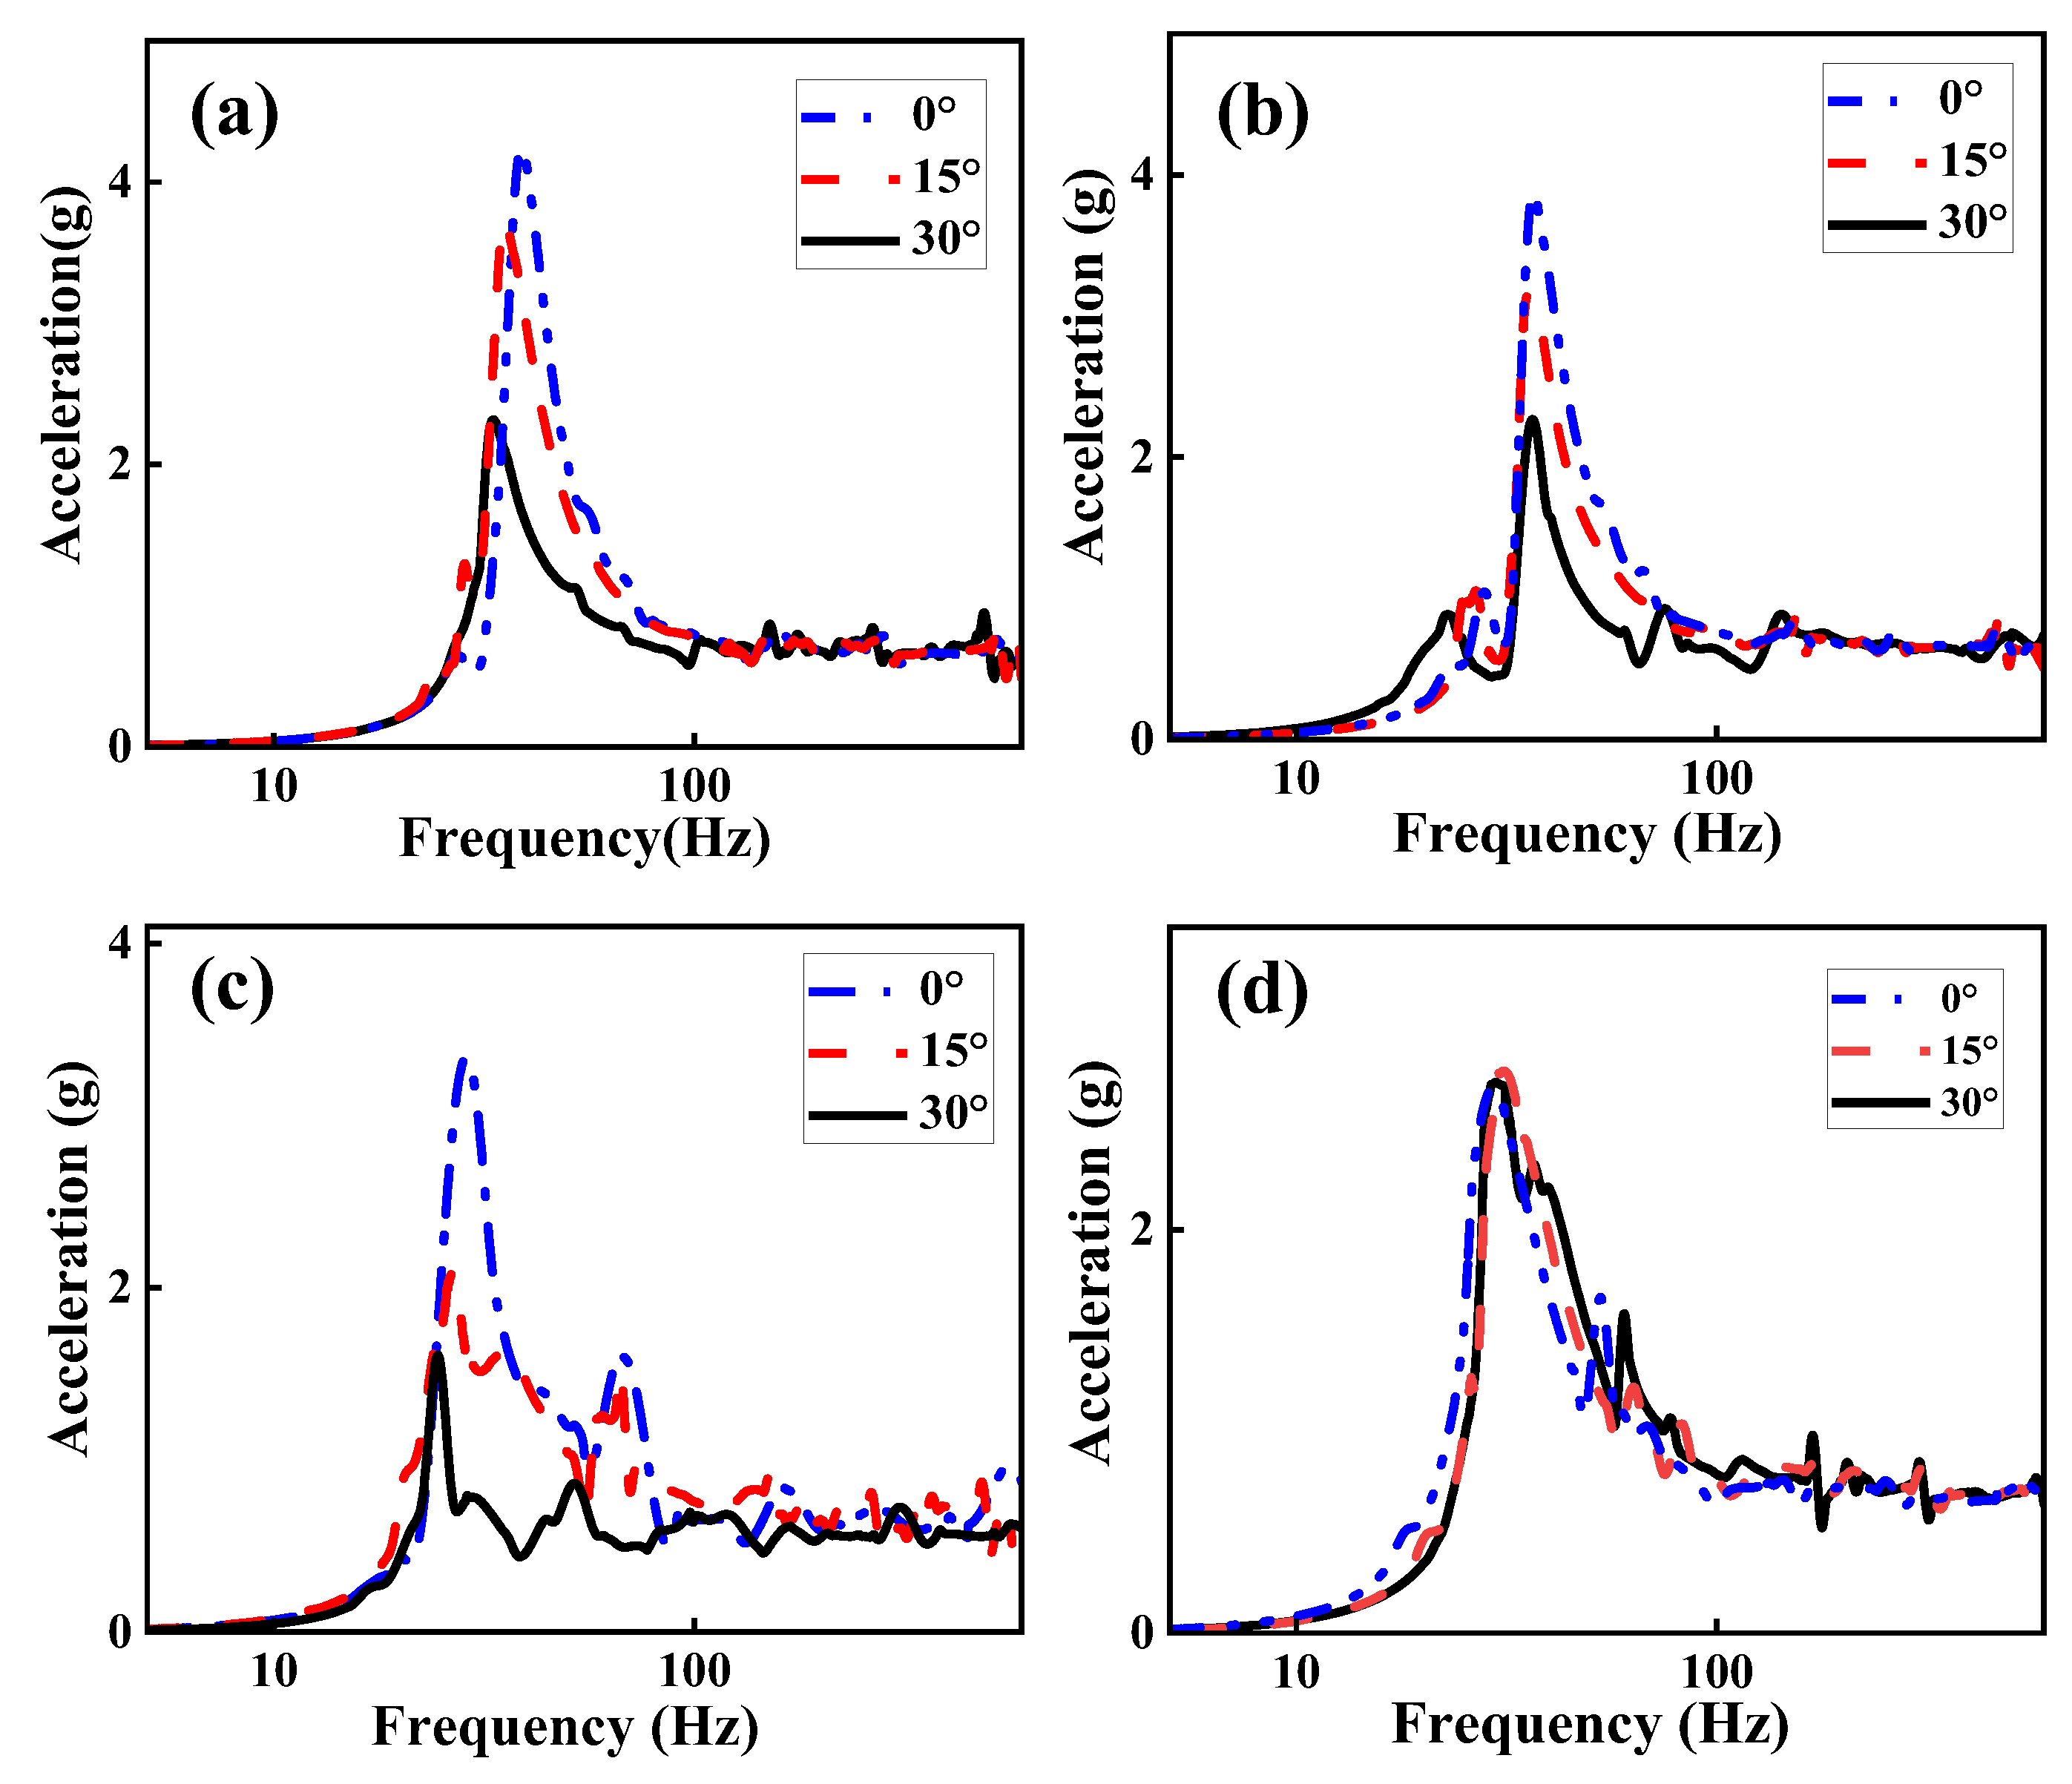
Figure 13.
Frequency response of VCMRI under different spring stiffnesses: (a) output force, (b) force transfer rate.
Figure 13.
Frequency response of VCMRI under different spring stiffnesses: (a) output force, (b) force transfer rate.
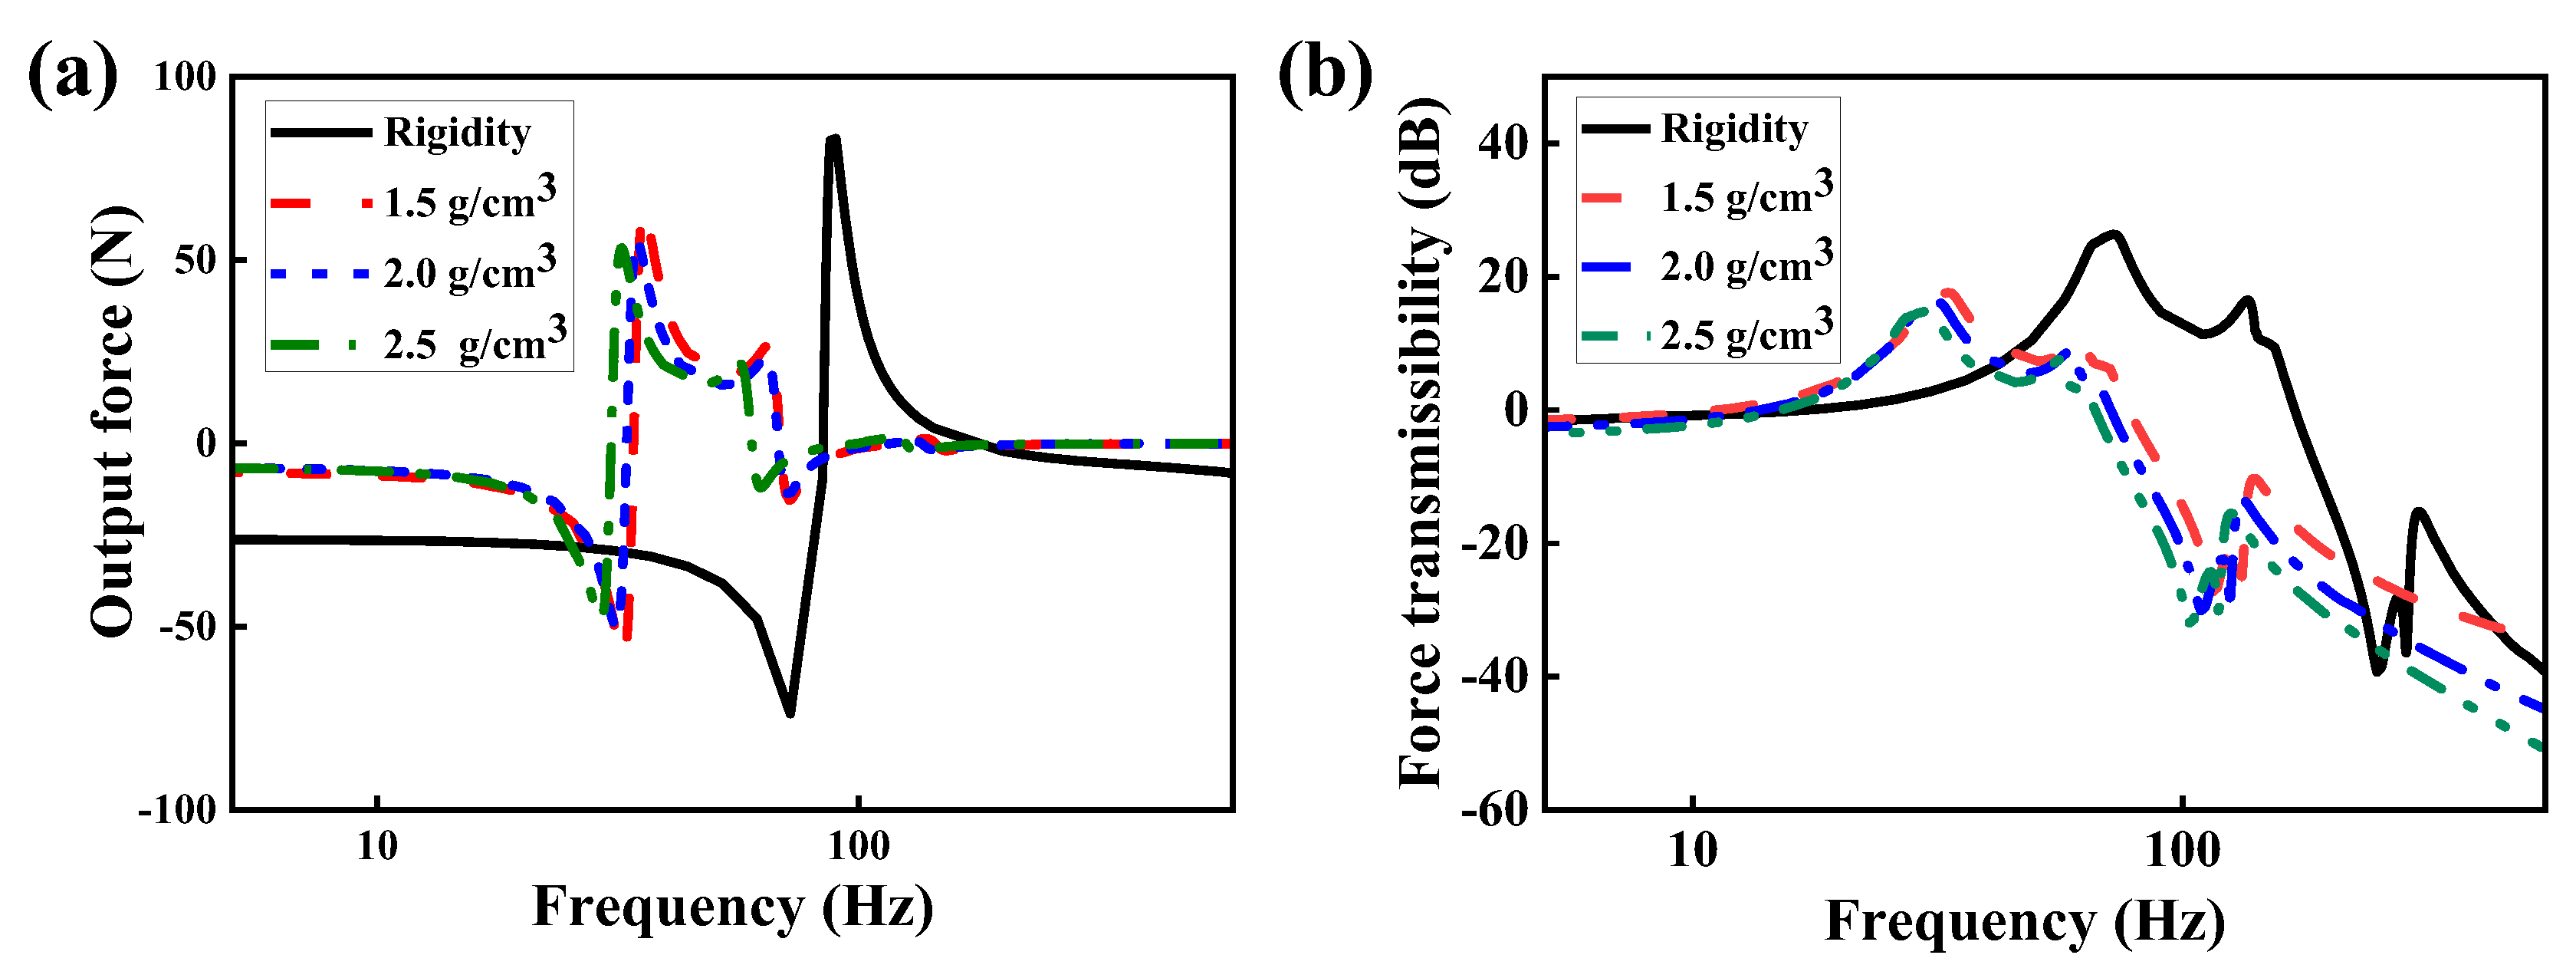
Figure 14.
Frequency response of VCMRI under different spring stiffnesses: (a) output force, (b) force transfer rate.
Figure 14.
Frequency response of VCMRI under different spring stiffnesses: (a) output force, (b) force transfer rate.
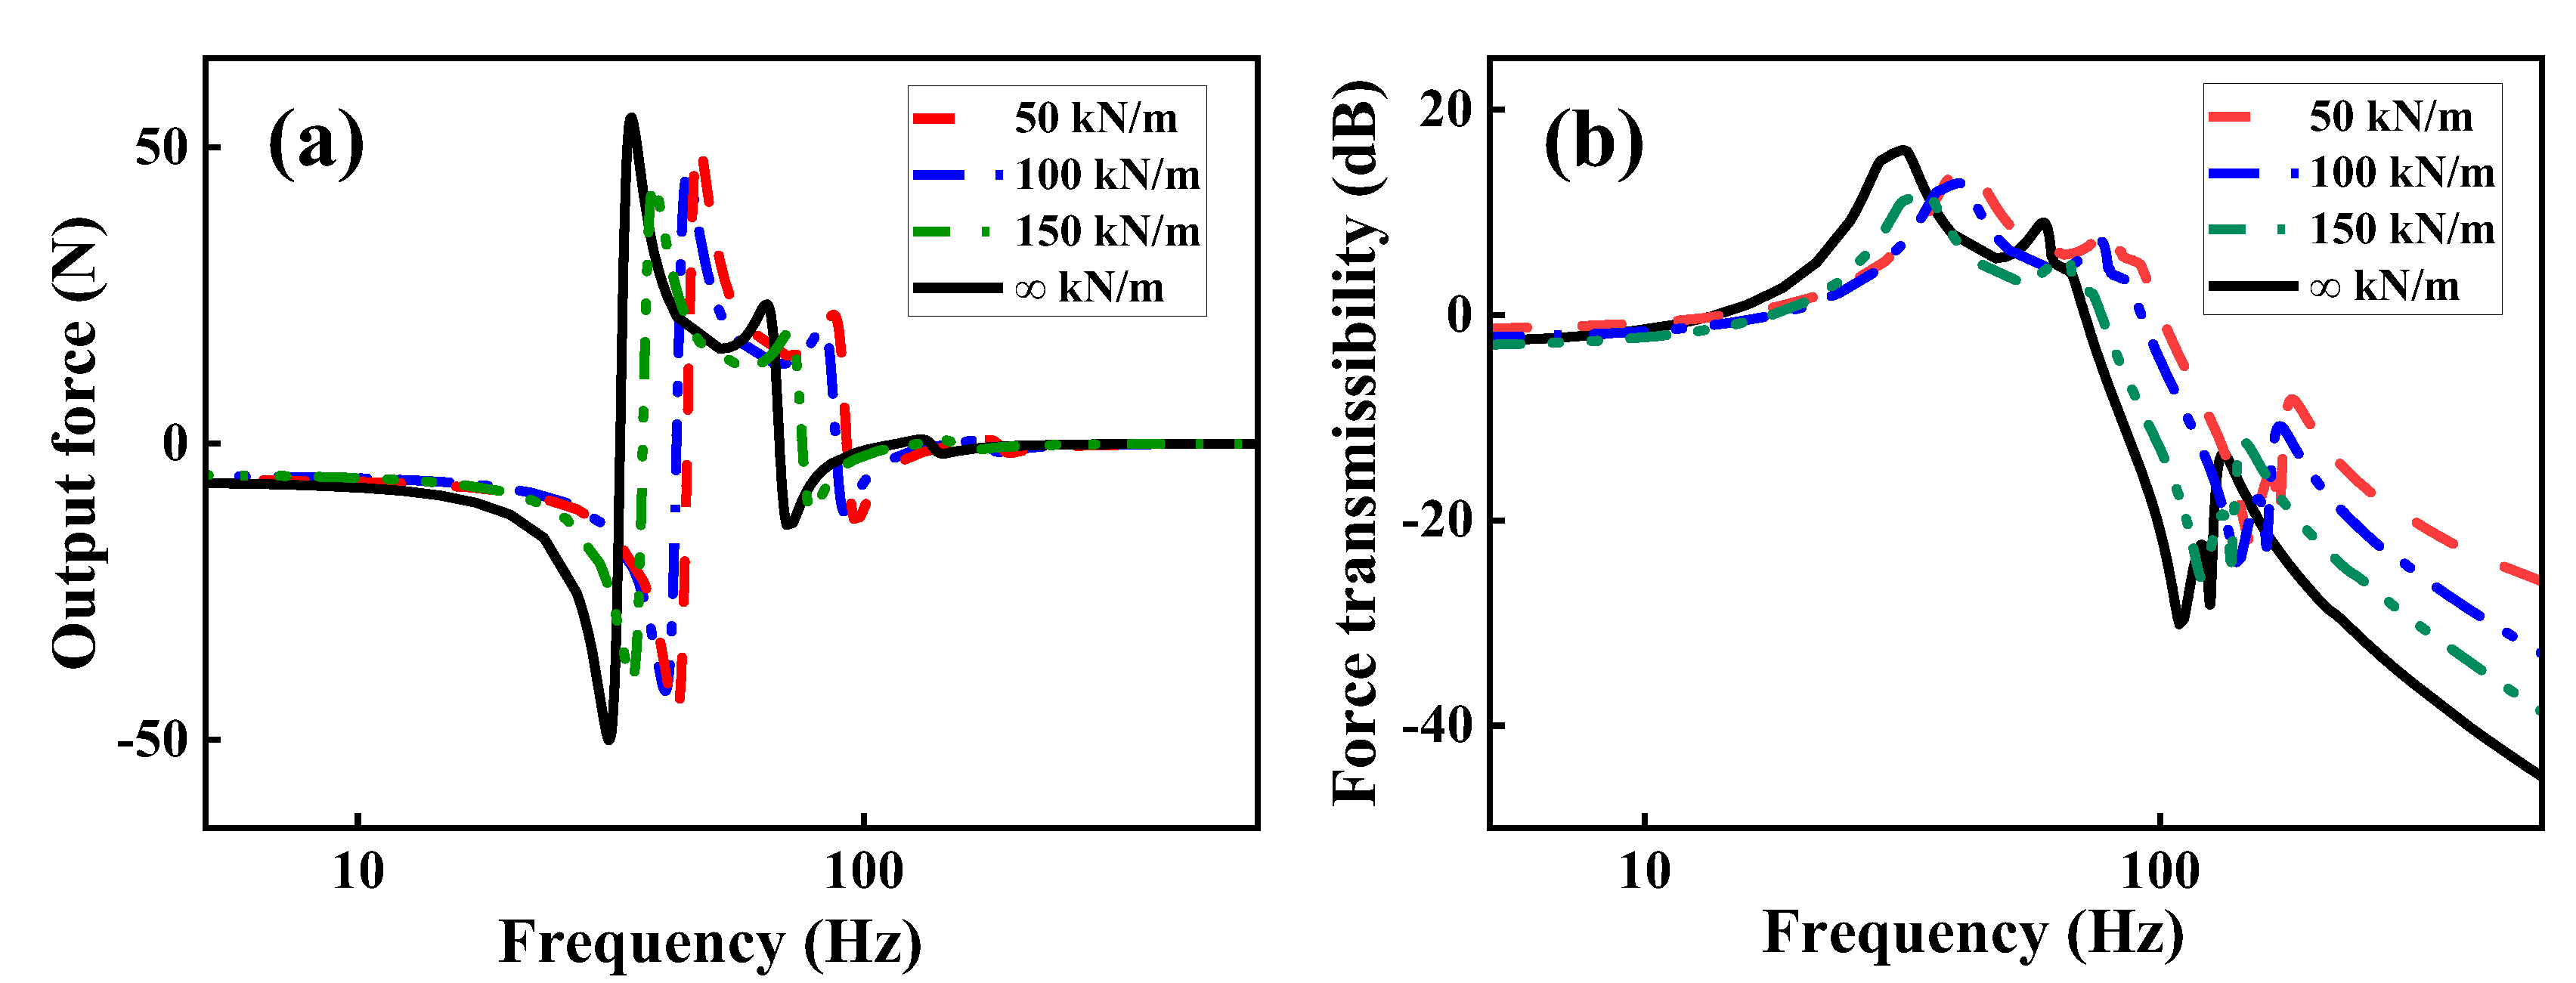
Figure 15.
Frequency response of the VCMRI at different excitation angles: (a) output force, (b) force transmission rate.
Figure 15.
Frequency response of the VCMRI at different excitation angles: (a) output force, (b) force transmission rate.
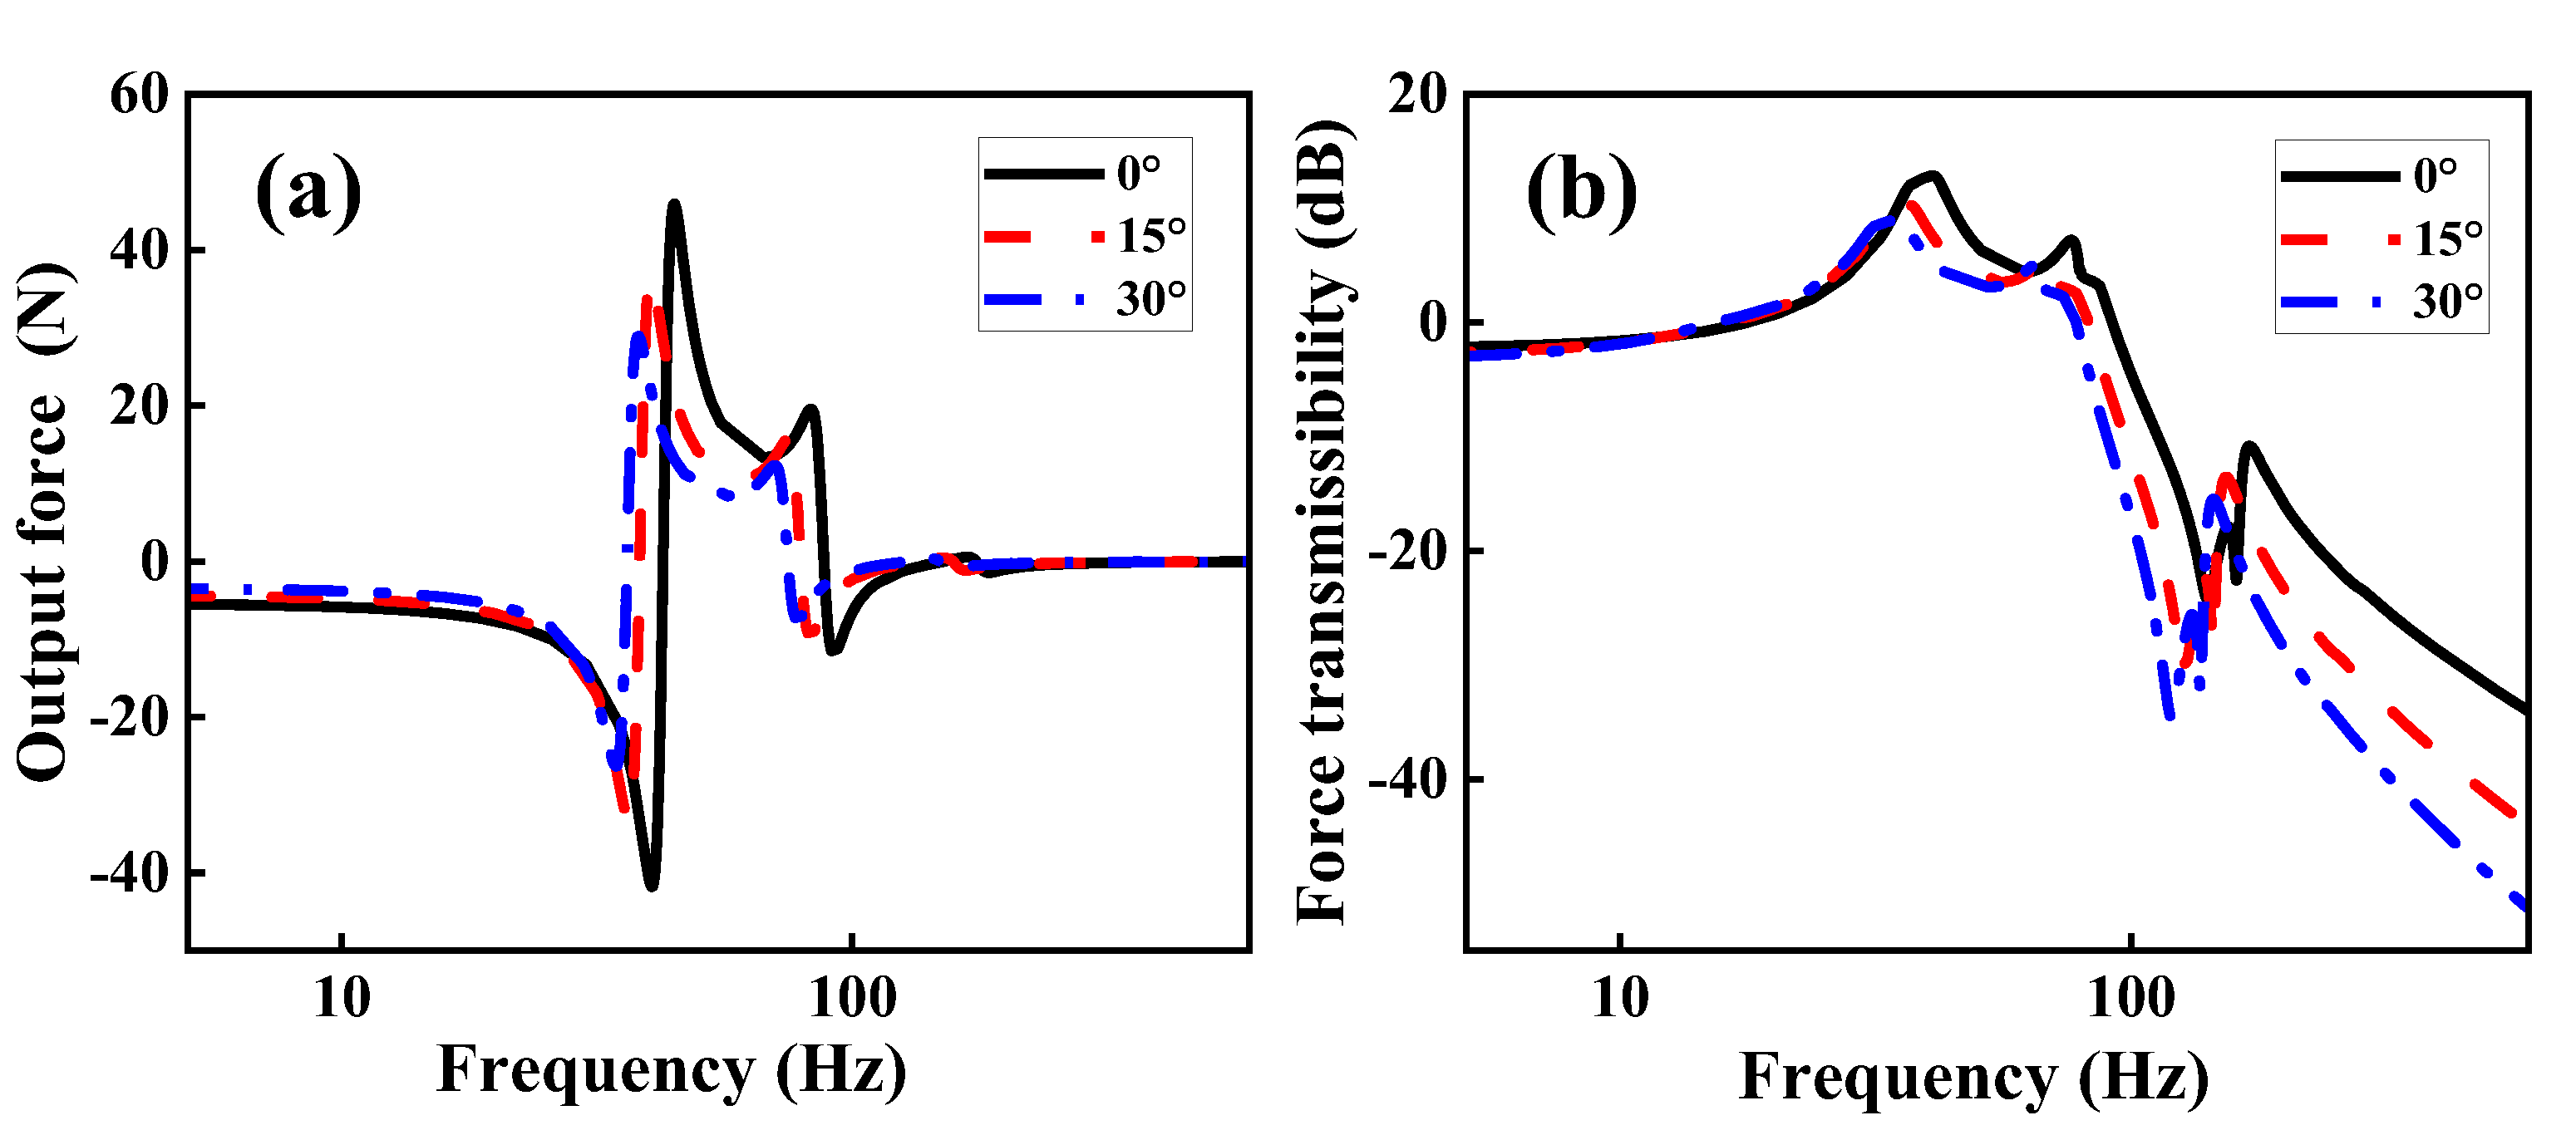

Table 1.
Parameters of Yeoh and Bergström-Boyce models at different densities.
| Density of VCMR | Yeoh | Bergström-Boyce | |||||
| C10 | C20 | C30 | S | A | M | C | |
| 1.5 g/cm3 | 12.507 | 2.189 | 1.184 | 13.048 | 6.064 | 1.471 | -0.499 |
| 2.0 g/cm3 | 10.199 | 0.519 | 0.605 | 13.586 | 0.681 | 1.011 | -0.509 |
| 2.5 g/cm3 | 33.838 | 1.975 | 3.835 | 13.989 | 0.013 | 1.505 | -0.033 |
Table 2.
Natural Frequencies of VCMRI.
| Frequency | First | Second | Third | Fourth |
| Rigid structure | 75.9 Hz | 223.5 Hz | 338.4 Hz | 410.8 Hz |
| VCMRI | 34.8 Hz | 87.3 Hz | 160.8 Hz | 245.4 Hz |
Table 3.
Parameters of the Test of Sine Sweep Frequency.
| Spring stiffness (kN/m) | Density of VCMR (g/cm³) | Excitation force (N) | Excitation angle |
| 50 | 1.5 | 5 | 0° |
| 100 | 2.0 | 10 | 15° |
| 150 | 2.5 | 15 | 30° |
Table 4.
Structural response of different excitation forces and spring stiffnesses.
| Spring stiffness (kN/m) | Acceleration response peak | Natural frequency | ||||
| 5 N | 10 N | 15 N | 5 N | 10 N | 15 N | |
| 50 | 2.4 | 4.2 | 5.7 | 41.3 | 38.8 | 36.8 |
| 100 | 2.2 | 3.9 | 5.4 | 39.6 | 36.9 | 34.7 |
| 150 | 2.1 | 3.3 | 4.5 | 31.5 | 28.7 | 27.8 |
| ∞ | 1.4 | 2.7 | 4.3 | 30.8 | 29.4 | 27.0 |
Table 5.
Structural response of different angles and spring stiffnesses.
| Spring stiffness (kN/m) | Acceleration response peak | Natural frequency | ||||
| 0° | 15° | 30° | 0° | 15° | 30° | |
| 50 | 4.2 | 3.7 | 2.4 | 38.8 | 35.4 | 33.2 |
| 100 | 3.9 | 3.1 | 2.3 | 36.9 | 34.5 | 32.8 |
| 150 | 3.3 | 2.1 | 1.6 | 28.7 | 26.8 | 24.6 |
| ∞ | 2.7 | 2.8 | 2.8 | 29.4 | 29.6 | 29.1 |
Table 6.
Force transfer rate of VCMRI with different densities of VCMR.
| Density of VCMR (g/cm³) | Peak force transmission rate (dB) | Average force transmission rate (dB) | Insertion loss (dB) |
| Rigid | 26.4 | -6.5 | |
| 1.5 | 17.6 | -17.1 | 10.6 |
| 2.0 | 16.1 | -19.2 | 12.7 |
| 2.5 | 14.8 | -24.1 | 17.6 |
Table 7.
Force transfer rate of VCMRI with different spring stiffnesses.
| Spring stiffness (kN/m) | Peak force transmission rate (dB) | Average force transmission rate (dB) | Insertion loss (dB) |
| 50 | 14.1 | -19.9 | 13.4 |
| 100 | 12.7 | -23.2 | 16.7 |
| 150 | 11.9 | -25.7 | 19.2 |
| ∞ | 16.1 | -19.2 | 12.7 |
Table 8.
Force transfer rate of VCMRI with different excitation forces.
| Excitation force | Peak force transmission rate (dB) | Average force transmission rate (dB) | Insertion loss (dB) |
| 0° | 11.9 | -25.7 | 19.2 |
| 15° | 10.3 | -29.2 | 22.7 |
| 30° | 9.0 | -33.5 | 27.0 |
Disclaimer/Publisher’s Note: The statements, opinions and data contained in all publications are solely those of the individual author(s) and contributor(s) and not of MDPI and/or the editor(s). MDPI and/or the editor(s) disclaim responsibility for any injury to people or property resulting from any ideas, methods, instructions or products referred to in the content. |
© 2025 by the authors. Licensee MDPI, Basel, Switzerland. This article is an open access article distributed under the terms and conditions of the Creative Commons Attribution (CC BY) license (http://creativecommons.org/licenses/by/4.0/).
Copyright: This open access article is published under a Creative Commons CC BY 4.0 license, which permit the free download, distribution, and reuse, provided that the author and preprint are cited in any reuse.


