1. Introduction
Noroviruses (NoV) is the primary cause of sporadic cases and outbreaks for acute gastroenteritis (AGE) in all age groups. It can lead to about 699 million infected cases [
1] and over 200 thousand death cases [
2] globally. The detection rate of Rotavirus has decreased after the introduction and application of Rotavirus vaccine in China. Since then, Norovirus had become the most common pathogen [
3]. Timely and accurate surveillance and early warning means are the key part of monitoring AGE and delivering timely public health interventions. On the one hand, during the epidemic in COVID-19, wastewater surveillance of SARS-CoV-2 was proved to be an effective and applicable surveillance tool for reflecting the trend of SARS-CoV-2 infections in the population and detecting new variants or sub-lineages even earlier than routine clinical surveillance [
4,
5]. Wastewater-based surveillance has become a useful public health tool for evaluating community infection [
6,
7]. On the other hand, studies suggested that the average temperature is the main climatic factor influencing Norovirus outbreaks in humans [
8,
9]. In addition, the synthetic index method can combine datas from various surveillance indicators to establish an early warning threshold for the prevalence level of Norovirus AGEs [
10]. Therefore, this study combines the datas of the human health surveillance, wastewater surveillance, meteorological surveillance n Chaoyang District, Beijing, to grade the epidemic intensity and provide technical support for the early warning of AGE caused by Norovirus.
2. Materials and Methods
2.1. Data Sources
In accordance with the requirements of the
Guidelines on Outbreak Investigation, Prevention and Control of Norovirus Infection (2015), this study investigated outbreaks of AGE from June 2023 to June 2024 in Chaoyang District of Beijing. Schools, kindergartens and other institutions reported outbreaks to community health centres and subsequently to the Chaoyang District CDC. The Chaoyang District CDC conducted investigations within 24 hours of receipt a report and anal swabs or fecal specimens were collected from cases for pathogen testing within 48 hours of initiating the investigation. The AGE outbreak surveillance network has been established in Beijing [
11]. In the Chaoyang District CDC, diagnostic testing for AGE outbreak includes detection of NoV and other diarrhea virus. A NoV outbreak was confirmed when two or more AGE cases test positive for NoV by real-time polymerase chain reaction (PCR) testing.
With reference to the requirements of the
National Viral Diarrhoea Surveillance Programme (2021) [
12], sentinel hospitals, Chuiyangliu Hospital affiliated Tsinghua University and Beijing Children's Hospital, Capital Medical University, collect at least 10 intestinal outpatient diarrhoea cases per month and send to the Chaoyang District CDC for for testing of diarrhoeal viruses such as Norovirus.
Based on the wastewater-based surveillance network of SARS-CoV-2 by the Working Programme for Monitoring New Coronaviruses in Municipal Sewage (2023), the copy numbers (copies/mL) of Norovirus GII in wastewater from the wastewater treatment plant in Chaoyang District, Beijing, from June 2023 to June 2024 were collected and detected. When the standard curve is plotted with CtGII as the vertical coordinate and Lg(GII copies/mL) as the horizontal coordinate, and the conditions of coefficient of determination (R2) > 0.99 and amplification efficiency (E%) between 90% and 110% are met, then the Ct value of Norovirus GII of the wastewater samples will be substituted into the equation of the standard curve, and then the number of copies of Norovirus GII in the sewage is calculated (copies/mL).
The test results of all the above samples have been reviewed by the Beijing CDC for accuracy.
Daily average temperature data for 2023 to 2024 were obtained from the website of the National Centers for Environmental Information (NCEI) (
https://www.ncei.noaa.gov/data/global-summary-of-the-day/archive/) from the U.S. National Oceanic and Atmospheric Administration (NOAA). The degrees Fahrenheit was converted to degrees Celsius of daily average temperature for calculation and establishment of the database of weekly average temperatures.
2.2. Research Method
Surveillance indicators including routine and indirect monitoring indicator were selected to reflect the prevalence of Norovirus infection in the population. Every original surveillance data were standardised and assigned different weights, and then the Synthetic index (SI) was obtained[
10]. Finally, this study established a hierarchy of prevalence levels of Norovirus AGE based on the distribution characteristics of the SI.
2.2.1. Surveillance Indicators
Norovirus GII AGE cases: The cases who have defecation ≥3 times and Trait change within 24 h, and/or vomit within 24 h are diagnosed as Norovirus GII by laboratory test.
Norovirus GII weekly positive detection rate of sentinel surveillance (%): the number of specimens positive for Norovirus GII in sentinel hospitals per week divided by the total number of specimens sent for testing in sentinel hospitals in the same week (×100%).
Number of weekly outbreaks of Norovirus GII: Number of outbreaks caused by Norovirus GII in outbreak monitoring every week.
Norovirus GII weekly concentration of urban domestic wastewater (copies/mL): Arithmetic mean of concentrations (copies/mL) of weekly Norovirus GII from urban domestic wastewater of eight wastewater treatment plants in Chaoyang District, Beijing, from the June 1, 2023 to June 30, 2024.
Weekly average temperature (°C): Arithmetic mean of daily average temperatures in degrees Celsius per week.
2.2.2. Normalized Threshold of Surveillance Indicators
Normalized threshold for number of weekly outbreaks of Norovirus GII: referred to literature reports and expert assessments, 60% of the maximum value of the number of weekly outbreaks of Norovirus GII in outbreak surveillance in Chaoyang District, Beijing, from 2023 to 2024 was used as the cut-off value for determining the epidemiological and non-epidemiological periods of AGE, and it was determined as the normalized threshold of the number of weekly outbreaks of Norovirus GII in outbreak surveillance.
Normalized threshold for Norovirus GII weekly positive detection rate of sentinel surveillance (%): Sentinel surveillance was divided into epidemic and non-epidemic periods using the established Normalized threshold for number of weekly outbreaks of Norovirus GII. The arithmetic mean of the weekly positive detection rate (%) for sentinel surveillance of Norovirus GII during the epidemic period wass used as the normalized threshold.
Normalized threshold for Norovirus GII weekly concentration of urban domestic wastewater (copies/mL): Sentinel surveillance was divided into epidemic and non-epidemic periods using the established Normalized threshold for number of weekly outbreaks of Norovirus GII. The arithmetic mean of the average weekly detection concentrations (copies/mL) of Norovirus GII in urban domestic wastewater during the epidemic period was used as the normalized threshold.
Normalized threshold weekly average temperature (°C): Sentinel surveillance was divided into epidemic and non-epidemic periods using the established Normalized threshold for number of weekly outbreaks of Norovirus GII. . The arithmetic mean of the average weekly temperature (°C) in Chaoyang District during the epidemic period was used as the normalized threshold.
2.2.3. Determination of Synthetic Index Classification
The database was created by word processing system (WPS) and the data were screened and analysed. Statistical indicators such as average value, median valu and percentile are used as the basis for the classification of synthetic index (SI).
2.2.4. Calculation of Synthetic Index
The weighting coefficients of the surveillance indicators were determined with reference to literature reports [
10] and expert assessments, and the weekly synthetic index was calculated by the formula of SI= ∑W
i Y
ij = ∑(W
iX
ij/M
i). where SI refers to the synthetic index, W
i represents the weighting coefficient of the indicator i (i=1, 2, 3, 4), Y
ij refers to the relative value of the indicator i in week j, X
ij is the measured value of the indicator i in week j, and M
i is the normalized threshold of the indicator i.
3. Results and Discussion
3.1. Normalized Threshold of Surveillance Indicators
The maximum number of weekly outbreaks of Norovirus GII in Chaoyang District from June 2023 to June 2024 was 5, so the normalized threshold of weekly norovirus GII outbreaks was 3 that was a criterion for distinguishing between epidemic and non-epidemic periods. The weekly average, that is, normalized threshold, of Norovirus GII weekly positive detection rate of sentinel surveillance (%), Norovirus GII weekly concentration of urban domestic wastewater (copies/mL) and weekly average temperature (°C) during the epidemic period in this study. 4 epidemic seasons of the disease were selected to be the basis for epidemic and non-epidemic period SI studies. However, the AGE potentially is affected by prevention and control measures of COVID-19 in recent years, and it does not reflect the actual epidemic level of NoV GII infection, so this study temporarily estimated the threshold value only by the data of 1 epidemic season. In the future, data will be accumulated to appropriately extend the study period to more accurately predict the epidemiological status of NoV GII AGE.
3.2. Assigning Weight Coefficients to Monitoring Indicators and Calculating Synthetic Index
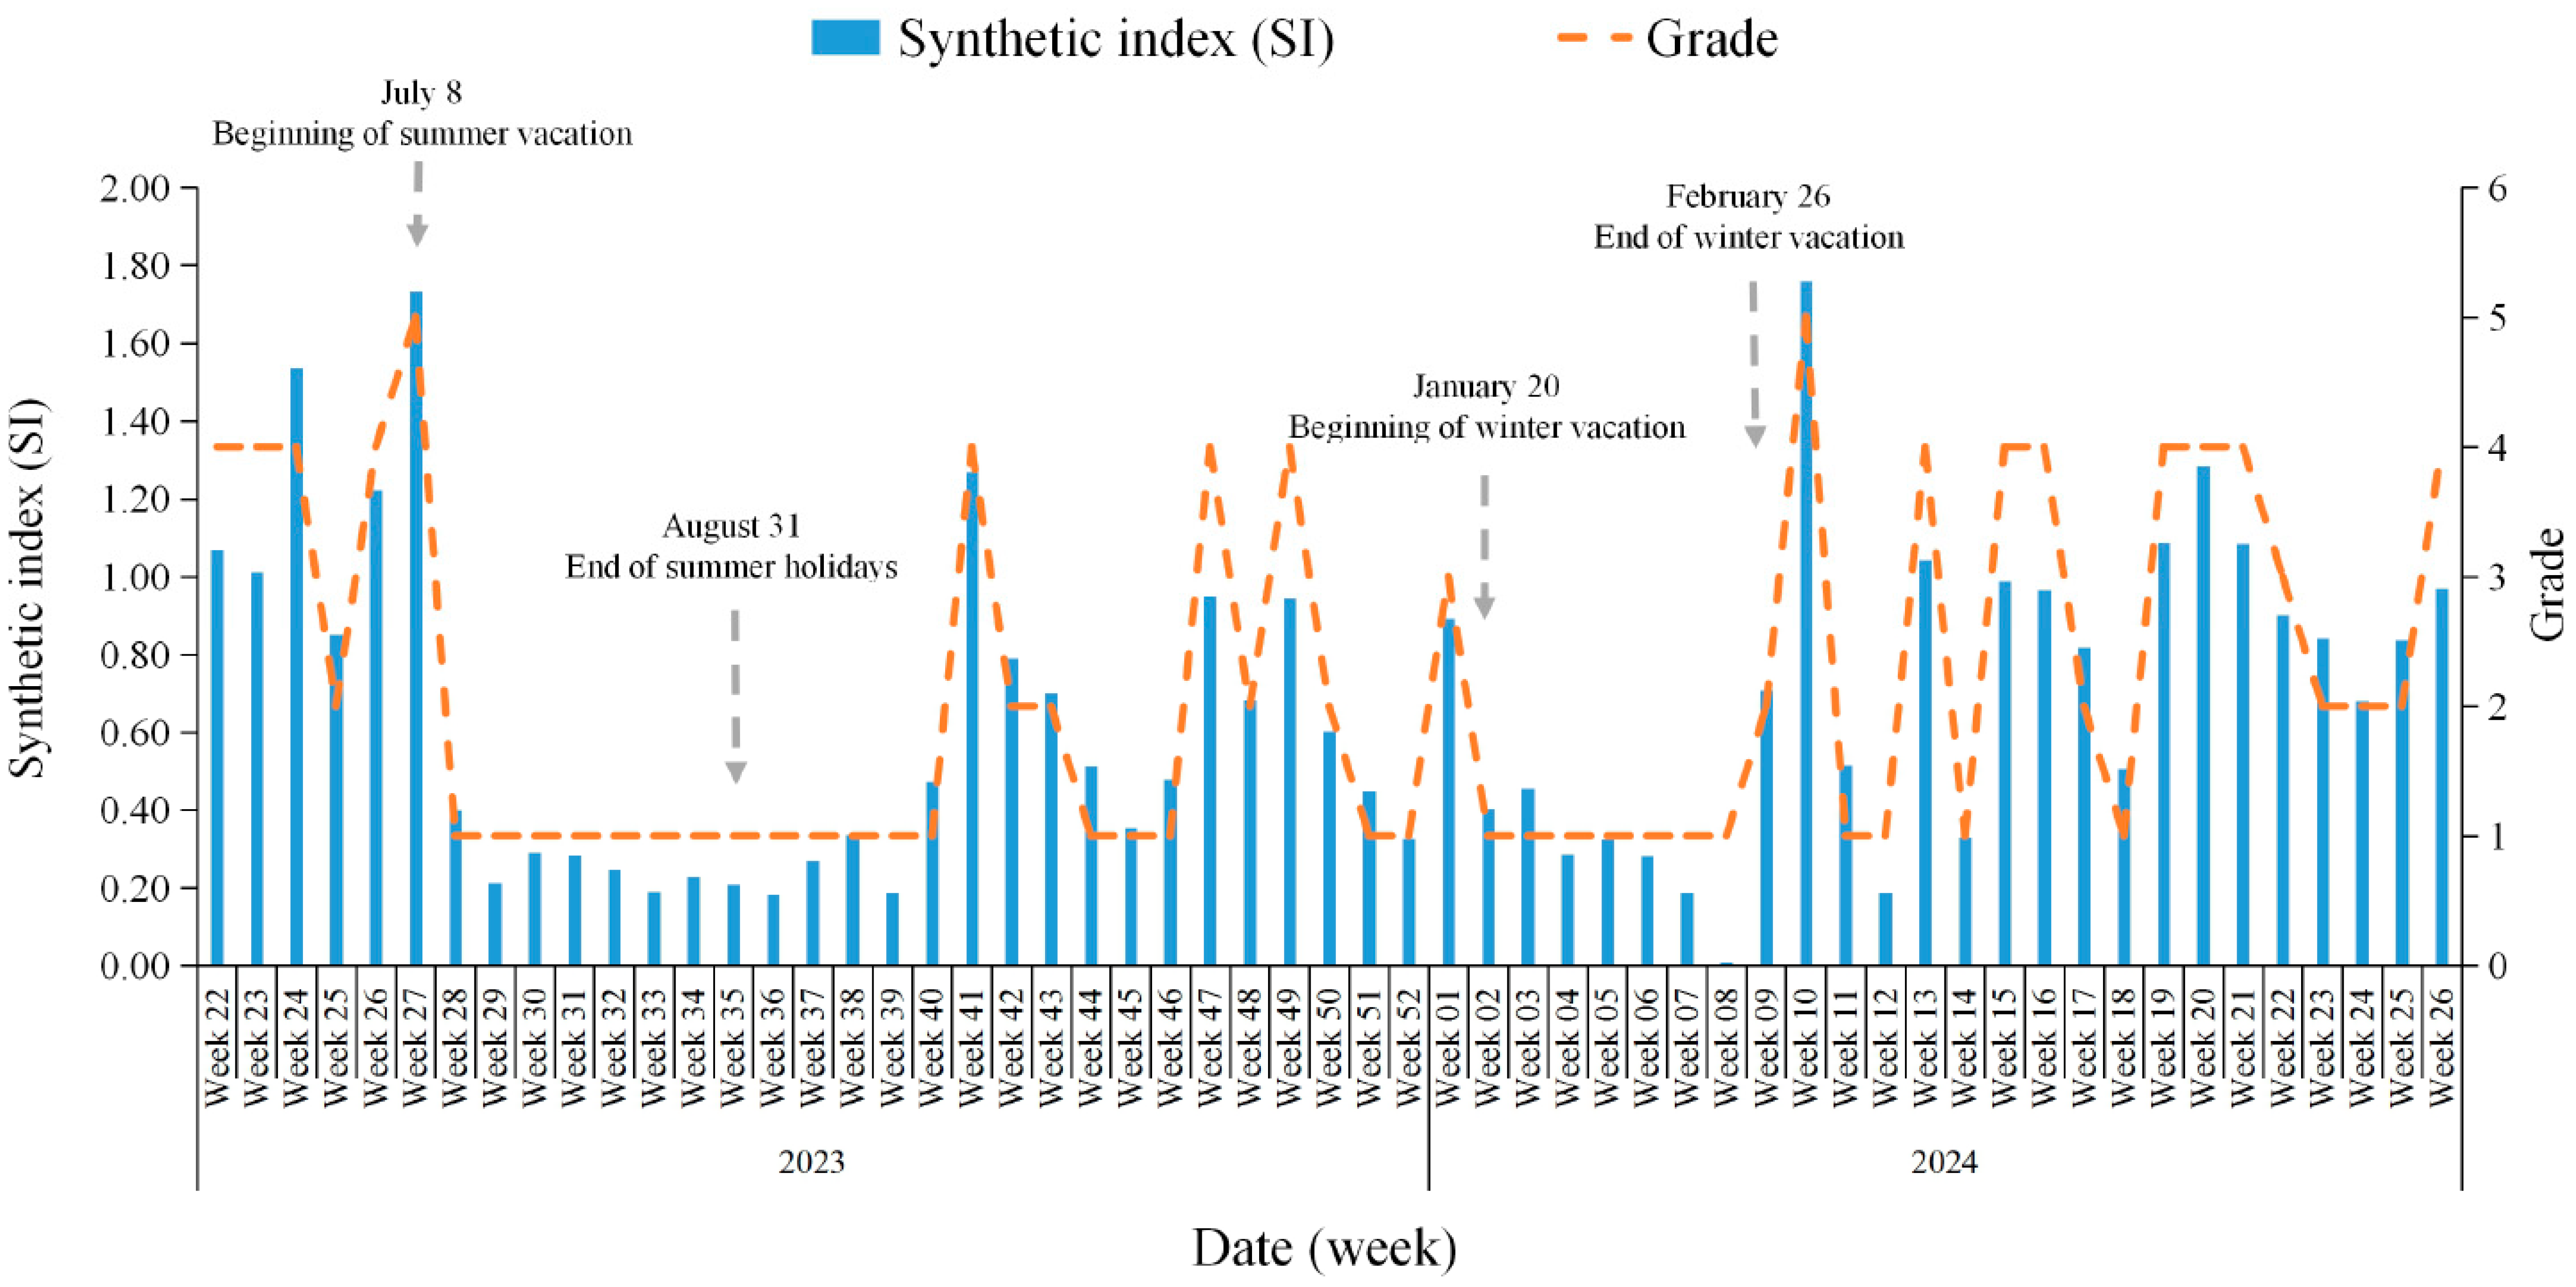
Because the weekly number of Norovirus GII for AGE reflects the risk of crowd-sourced transmission, it has a high sensitivity. Therefore the weighting factor for the number of weekly outbreaks of Norovirus GII has been assigned as 0.4. The sensitivity of diarrhea cases in sentinel hospitals was relatively poor, and Norovirus GII weekly positive detection rate of sentinel surveillance (%) was assigned a weight of 0.3. The trends of Norovirus concentration in urban domestic wastewater, environmental temperature and Norovirus GII outbreaks were basically the similar, but these two indicators are influenced by various factors, so Norovirus GII weekly concentration of urban domestic wastewater (copies/mL) and Weekly average temperature (°C) were assigned weights coefficients of 0.2 and 0.1, respectively.. According to the SI formula, the weekly synthetic index dataset of Chaoyang District for the 22nd week of 2023 to the 26th week of 2024 was calculated to have values ranging from 0.0073 to 1.7593, with a median of 0.5155 (
Figure 1).
3.3. Epidemic Intensity of Norovirus GII for AGE
With reference to the experience of epidemiological level classification of Influenza and Norovirus infections [
10,
13] and actual epidemiological status of Norovirus (NoV) AGE in Chaoyang District, the epidemic intensity of NoV GII was divided into five grades with increasing intensity from grade 1 to 5, which corresponds to non-epidemic risk, general risk, moderate risk, high risk and ultra-high risk respectively. The median of the weekly SI of 0.52 was used as a threshold to distinguish between epidemic and non-epidemic periods. Based on the expert assessment and the characteristics of the surveillance data, 0.87, 0.92 and 1.71 were used as the cut-off values for class 2 to 5, respectively (
Table 1). If the synthetic index of 2 consecutive monitoring weeks in the epidemic season of 2023-2024 exceeds a certain threshold, an early warning for the corresponding epidemic intensity is issued and recommendations on corresponding control measures will be given. It is worth noting that mathematical models applied to epidemiological early warning all rely on historical surveillance data, but can not completely replace professional experience. Therefore, when making decisions based on the results of the various early warning models in practice, it is necessary to refer to the opinions of authoritative and experienced experts in the field, and to comprehensively consider various factors to avoid the bias of the early warning model from affecting misjudgement strategy.
3.4. Early Warning Classification of Norovirus GII AGE for the First Time with the Data of Cases and Environmental Surveillance
At present, there are few studies that have utilized case surveillance data to classify the epidemic intensity of Norovirus GII AGE. And there are also no studies that use case and environmental surveillance data to do it. This study combine case surveillance data and environmental surveillance data to establish and quantify the criteria for the epidemic intensity of Norovirus GII AGE, it provides a reference for other methods to carry out relevant studies in the future.
The cases and their information were collected by the case surveillance systems from outpatient and inpatient departments of sentinel surveillance hospitals. These reflected the incidence and prevalence of AGE to a certain extent. But it was extremely easy to overlook patients who were not attending hospitals, such as those purchasing medicines from pharmacies. Wastewater surveillance can compensate for possible biases in individual clinical tests and is another means of monitoring disease prevalence [
14]. For example, poliovirus wastewater monitoring is used to complement AFP surveillance of the Global Polio Eradication Initiative (GPEI) and has been included in the World Health Organization Guidelines for Environmental Poliovirus Surveillance [
15,
16,
17]. On the one hand, The dominant strains in wastewater is consistent with human NoV AGE in temporal distribution [
18,
19]. On the other hand, based on the flowrate-weighted average virus concetration in Hong Kong, significant positive correlation values were observed between the NoV GII virus concentration in wastewater with the clinical detection rates in faecal specimens (Spearman's r =0.88 for GII,
P<0.01) [
20]. Therefore, NoV GII concentration in wastewater was also included as one of the indicators in this study. The sewage samples in this study cover populations not only in the Chaoyang District of Beijing, but also in other regions, which leads to a bias between sewage monitoring and population testing results, in other words, not a perfect match. In view of the fact that the average temperature is the main climatic element influencing the outbreak of human NoV [
8,
9], the average temperature was included as another one of the indicators. In the end, the above indicators were combined to obtain the grading criteria for epidemic intensity of NoV GII AGE in Chaoyang District, Beijing. In the future, we will also optimise the indicators on the basis in this study and try to introduce more appropriate indicators that can predict the prevalence level of NoV AGE. The influence of winter and summer vacations on the prevalence of AGE among primary and middle school students is an example (
Figure 1).
4. Conclusions
We have initially established and quantified the criteria for the epidemic intensity of Norovirus GII AGE in Beijing for the first time based on case and environmental surveillance data. It provides data support for timely issuing early warning information and taking corresponding prevention and control measures, and also serves a reference for other methods to carry out related research in the future.
Acknowledgments
This work was supported by the Beijing Chaoyang District Center for Disease Control and Prevention of China, The authors would like to thank the wastewater treatment plants from Beijing city drainage Refco Group Ltd and Beijing Enterprises Water Group Limited (BEWG) for the collection of wastew ater samples analyzed, and we also thank Suzhou Advanced Molecular Diagnostics Inc for technical support in this study.
Declaration of Competing Interest: The authors declare that they have no known competing financial interests or personal relationships that could have appeared to influence the work reported in this article.
References
- Lopman BA, Steele D, Kirkwood CD, et al. The vast and varied global burden of norovirus:Prospects for prevention and control.PLOS Med.2016, 13(4):e1001999. [CrossRef]
- Pires SM, Fische-Walker CL, Lanata CF, et al. Aetiology-specific estimates of the global and regional incidence and mortality of diarrhoeal diseases commonly transmitted through food. PLOS One.2015, 10(12):e0142927. [CrossRef]
- Hassan F, Kanwar N, Harrison CJ, et al. Viral Etiology of Acute Gastroenteritis in <2-Year-Old US Children in the Post-Rotavirus Vaccine Era. J Pediatric Infect Dis Soc. 2019 Nov 6;8(5):414-421. [CrossRef]
- Yang S, Dong Q, Li S, et al. Persistence of SARS-CoV-2 RNA in wastewater after the end of the COVID-19 epidemics. J Hazard Mater. 2022, 429:128358. [CrossRef]
- Deng Y, Xu X, Zheng X, et al. Use of sewage surveillance for COVID-19 to guide public health response: A case study in Hong Kong. Sci Total Environ. 2022,15;821:153250. [CrossRef]
- Hrudey SE,Bischel HN,Charrois J, et al.2022.Wastewater surveillance for SARS-CoV-2 RNA in Canada.The Royal Society of Canada. [(Accessed on 1 January 2025)]. Available online: https://rsc-src.ca/sites/default/files/WWS%20PB_EN_3.pdf.
- International Water Association, COVID-19 Wastewater-Based Epidemiology. IWA. [(Accessed on 1 January 2025)]. Available online: https://iwa-network.org/learn/covid-19-wastewater-based-epidemiology/.
- Zhou SX, Zhang HY, Wang LP, et al. Exploration of the association between meteorological factors and positive rate of norovirus infectious diarrhea based on the distributed lag non-linear model in Shanghai. Chin J Dis Control Prev. 2021, 25(10):1180-1185,1193. [CrossRef]
- Zhai MY, Tang QY, Li YH, et al. Influence of climatic factors on the outbreaks of acute gastroenteritis caused by norovirus in China. Journal of Environmental Hygiene. 2023, 13(3):154-161. [CrossRef]
- Wang Y, Jia L, Gao ZY, et al. Establishment of grading thresholds for epidemic intensity of norovirus acute gastroenteritis in Beijing by synthetic index method. International Journal of Virology. 2019, 26(4):225-228. [CrossRef]
- Jiao Y, Han T, Qi X, et al. Genotypes Diversity of Acute Gastroenteritis Outbreaks Caused by Human Sapovirus - Beijing Municipality, China, 2015-2021. China CDC Wkly. 2023,5(28):625-631. [CrossRef]
- Chinese Centre for Disease Control and Prevention (CDC). National Viral Diarrhoea Surveillance Programme (2021). [EB/OL]. [2021-09-18]. https://www.chinacdc.cn/jkyj/crb2/bl/grxfxb/jswj_fxb/202409/P020240907592486658798.pdf.
- Zhang L, Wu SS, Shi WX, et al. Establishment of the classified evaluation system on the levels of influenza epidemics through a synthetic index method, in Beijing. Zhonghua Liu Xing Bing Xue Za Zhi. 2018;39(8):1096-1099.
- O'Brien, E., & Xagoraraki, I. A water-focused one-health approach for early detection and prevention of viral outbreaks.One health (Amsterdam, Netherlands), 2019, 7, 100094. [CrossRef]
- Sein C. Evaluating surveillance indicators supporting the global polio eradication initiative, 2011–2012. Morb Mortal Wkly Rep, 2013,62:270-274.
- Polio eradication strategy 2022-2026: delivering on a promise. [(Accessed on 26 December 2025)]. Available online: https://www.who.int/publications/i/item/9789240031937.
- World Health Organization.WHO guidelines for environmental surveillance for poliovirus circulation. Geneva, Switzerland: World Health Organization; 2003. [(Accessed on 1 January 2025)]. Available online: http://whqlibdoc.who.int/hq/2003/who_v&b_03.03.pdf.
- Huang Y, Zhou N, Zhang S, et al. Norovirus detection in wastewater and its correlation with human gastroenteritis: a systematic review and meta-analysis. Environmental science and pollution research international, 2022, 29(16), 22829-22842. [CrossRef]
- Shrestha S, Malla B, Haramoto E. Estimation of Norovirus infections in Japan: An application of wastewater-based epidemiology for enteric disease assessment. Sci Total Environ. 2024, 912:169334. [CrossRef]
- Zheng X, Zhao K, Xue B, et al. Tracking diarrhea viruses and mpox virus using the wastewater surveillance network in Hong Kong. Water Res. 2024, 255:121513. [CrossRef]
|
Disclaimer/Publisher’s Note: The statements, opinions and data contained in all publications are solely those of the individual author(s) and contributor(s) and not of MDPI and/or the editor(s). MDPI and/or the editor(s) disclaim responsibility for any injury to people or property resulting from any ideas, methods, instructions or products referred to in the content. |
© 2025 by the authors. Licensee MDPI, Basel, Switzerland. This article is an open access article distributed under the terms and conditions of the Creative Commons Attribution (CC BY) license (http://creativecommons.org/licenses/by/4.0/).