1. Introduction
Customer experience is a concept that has evolved remarkably over the past few years. In the past five years, customer experience has contributed to organizational profits and growth (Hodgkinson et al., 2021). Private and government organizations have started focusing more passively on customer experience (Weber and Hofsink, 2018). As people change from generation to generation, the ecosystem within which they operate and respond must seemingly conform to these changes to remain competitive (Lemon and Verhoef, 2016). From purely transactional, customer experience today focuses more on building relationships, leading to more personalized experiences. Relationships are built differently in modern times; with the abundance of communication tools to keep in touch with customers, there is no excuse not to keep customers close and informed. In the light of advancements in information technology, Customers expect seamless interactions across multiple channels online, in-store, and via mobile. These experiences must remain consistent and convenient for customers. Although the past years have seen increasing research in customer experience, few studies have attempted to sample higher education institutions.
Brands have been known to add value for customers and stakeholders of an organization (Miller, 2014). Brands play a crucial role in helping companies build and nurture relationships with their customers, resulting in positive outcomes such as repeat purchases and customer advocacy or support for the brand (Hamouda and Aissaoui, 2024). On the other hand, love is an essential trait of the human experience. Love shapes our relationships, adds to more positive well-being and gives us a sense of belonging (Wong and Mayer, 2023). When applied to branding, these feelings denote a sense of loyalty and satisfaction a customer feels when a brand inspires and motivates them. This deep connection between a brand and its customers enriches the company and its clients (Wong and Mayer, 2023). With brand love, companies can enjoy the benefits of emotional connection and passion with their satisfied customers. At this point, the attachment to the brand has gone beyond mere preference. Affection and loyalty are at play here, influencing consumer behaviour and decision-making. Loyalty, when paired with brand love, creates stable and stronger relationships between the customer and the brand compared to when there is no love involved (Palusuk et al., 2019). Although a long list of goodness comes from brand love, drawbacks, such as brand addiction, can escalate into an unhealthy attachment (Carroll and Ahuvia, 2006). Research confirms that there is not always happiness when it comes to love. Instead, it can also be an experience that guides us through life’s challenges and gives us a broader perspective of our environment (Wong & Mayer, 2023). This study will use the definition of brand love by Caroll and Ahuvia (2006), “brand love is an emotional attachment of a satisfied consumer towards a particular brand”.
This study aims to analyze the impact of customer experience on brand love in an institution of higher learning; the relationship between brand and customer experience has been proven in several studies (Eklund, 2022; Prentice et al., 2019). The study of brand love is beneficial towards understanding consumer-brand relationships better (Bagozzi et al., 2017). Research done with smartphone users, retail outlets and e-commerce sites all show that a great experience makes customers love a brand (Safeer and He, 2020; Anggara et al., 2022; Mostafa et al., 2024). In a study conducted with smartphone users, the experience was measured using sensory, affective, behavioural, and intellectual variables that positively affect brand love (Safeer and He, 2020). Apparel buyers develop a feeling of attachment to a brand that is difficult to replace and reflects a lifestyle supported by social acceptance (Anggara et al., 2022). In an online environment, brand love is a product of easy navigation and excellent online customer service. Positive experiences with online communication tools like catboats, smooth transaction processes and attractive layouts contribute to feelings of brand love (Mostafa et al., 2024). To date, limited literature has studied the effect of customer experience on brand love. This research significantly contributes to customer experiences using the EXQ (customer experience scale model) towards brand love in an institution of higher learning.
2. Literature Review
2.1. Brand Love
The most well-known definition of brand love is “a degree of exciting desirable dependency that a satisfied customer has toward a special trade name” (Carroll and Ahuvia, 2006). Based on this definition, brand love exists when customers form an attachment to a brand. The source of this attachment naturally comes from a positive experience. The attachment is not a simple satisfaction, it is a connection to the product or service that has become essential to the customer. It is a connection that brings joy and a sense of thrill. This type of connection will benefit the organization as a connection of this level will generally lead to sharing. Positive word of mouth is an obvious outcome of this attachment. The result is that the customer will feel a firm reliance on the product or service and encourage others to join.
Brand love indicates the deep emotional attachment a satisfied consumer feels toward a specific brand. Brand love encompasses a strong passion for the brand, a deep attachment to it, favourable evaluations, positive emotions triggered by it, and expressions of affection or loyalty toward it (Carroll and Ahuvia, 2006). Brand love represents an emotional or experiential dimension of the brand relationship that can impact consumers’ purchase intentions (Sarkar et al., 2012). Bergkvist and Bech-Larsen (2010) described brand love as “affection towards the brand”. In a further study about the emotional role of brand love, Batra et al. (2012) describe brand love as consisting of cognitive, affective and behavioural elements.
The journey into brand love is driven by brand experience, customer personality and brand quality (Rauschnabel and Ahuvia, 2014; Joshi and Garg, 2020; Roy et al., 2013). Studies about brand love have shown that it is positively related to brand loyalty (Mody and Hanks, 2020) mouth (Carroll and Ahuvia, 2006), willingness to pay more (Bairadda et. al., 2029), brand trust (Joshi and Garg, 2021) and brand equity (Machado et. al., 2019). Brand love creates an emotional bond that enhances customer loyalty and engagement, making consumers more likely to advocate for the brand and remain committed over time (Fournier, 1998). When customers view a brand as integral to their identity or lifestyle, it enhances their overall experience and connection, further solidifying the brand’s position in their minds and hearts. The satisfaction that is compounded over time and remains consistent will then evolve into a sense of closeness to the brand and create an attachment between the user and the brand (Unal and Aydin, 2013). This emotional bond makes the brand exceptional (Palusuk et al., 2019). Therefore, brand love has to be built. It is not a situation or feeling that pops out after a single purchase or encounter; instead, it results from long-term relationships (Albert and Merunka, 2013; Carroll and Ahuvia, 2006).
One of the many perks of brand love is that consumers tend to purchase without hesitation when they feel a close attachment and are emotionally invested (Kang, 2015). This reflects the level of trust consumers have in the brand, where they do not need to do too much investigation or information seeking as they assume that the brand will definitely meet all their expectations. This remarkable level of high confidence shows the unmatched relationship strength between the brand and its consumers (Karjaluoto et al., 2016). When a relationship reaches a certain level of attachment, it becomes difficult to leave it, as the level of tolerance is high. Switching intentions become relatively low as the consumer is more forgiving (Arantola, 2002). Consumers become more defensive and protect the brand when adverse situations occur, as their passion makes them mentally strong enough to face criticisms from non-brand users (Amani, 2022).
2.2. Customer Experience
An experience is an exchange (Pine and Gillmore, 1999). It is an exchange between an organization and its customers. Organizations create value, and customers enjoy those values aided by touch points made available by the organization. Organizations use these touchpoints as opportunities to create positive, memorable experiences for customers through multiple platforms (Koetz, 2019). Customer experience emerges from communications at three levels: touchpoints, customer journey and customer networking within the service system (Teixeita et al., 2012). Consumers who go through outstanding experiences from their service encounters have increased satisfaction and loyalty levels (Meeprom and Silanoi, 2020). It is worth noting, however, that the service provider’s efforts may not necessarily produce the results expected from customers. Emotions sometimes get in the way of service providers wanting to do their best for their customers. Human beings face many levels of emotions daily. Therefore, emotions do get in the way of how a customer feels in any situation. A customer angry or upset by a previous encounter and then comes into contact with service providers will be more demanding and less tolerant (Becker and Jaakola, 2020). This situation is further supported by Heinonen et al. (2019), whose study showed that experiences are subjective and are often influenced by personal circumstances.
Experience does not just happen overnight. It is accumulated through weeks, months, and years of communication between the organization and the consumer. This accumulation, when positive, develops into a bond that translates into satisfaction and loyalty (Hirschman and Holbrook (1986). Organizations must ensure that efforts related to customer experiences go on constantly and efficiently for as long as the company exists. Customers tend to forget their experiences quite rapidly. Therefore, their experiences must be frequently fresh (Macdonald et al., 2012). When managing customer experience, organizations must constantly redesign customer journey maps to maintain their competitive advantage in providing superior customer experience (Ieva and Ziliani, 2018). Incorporating many elements that make up customer experience brings another managerial challenge for organizations (Wetzels et al., 2023). This challenge also includes the dynamic nature of customer experience. Past experiences or exposure determines present and future perceptions of customer expectations (Hwang and Seo, 2016).
Traditionally, experience is thought to be determined by perceptions of service quality, which the customer perceives before the service process paints a picture of what they expect to happen (Gronroos, 1984). Over time, customer experience has evolved to be more complex and dynamic. Past literature has documented customer experience in many ways. Schmitt (1999) documented that customer experience is a combination of sensory, affective, cognitive, physical and social identity experiences. Verhoef et al. (2009) also mention the cognitive, affective, social and physical responses that comprise the experience ecosystem. De Keyser et al. (2015) continue research into the new millennium by concluding that customer experiences involve cognitive, emotional, physical, sensorial, spiritual and social elements between the consumer and service provider. Other authors with similar conclusions include Trevinal and Stenger (2014); Gahler et al. (2019).
2.3. The EXQ Model
The EXQ model is used in the study to measure customer experience. Studies have shown that the EXQ scale is a good choice when researching service experience (Klaus and Maklan, 2013). EXQ is valid across multiple industries (Klaus et al., 2013; Klaus and Maklan, 2012), making it a versatile and convenient tool that can be used to measure experience quality. EXQ gives an understanding of the worth of a product or service so that organizations can better allocate their resources. This worth is reflected in how consumers communicate with service providers (Chen and Chen, 2010). The dimensions used in EXQ relate strongly to the social and psychological challenges that consumers go through to obtain a product or service (Lemke et al., 2011). In the past, quality management researchers have overlooked the cognitive and emotional sensations that customers go through during their service experience. Therefore, Maklan and Klaus (2011) addressed this gap by creating an EXQ scale that pays attention to the overall experience and not just the product or service attributes. The EXQ scale also takes into consideration customer behaviour and intentions, areas which were also previously left out in quality management studies. It has been used in studies related to financial services (Raina et al., 2019). The study researched experiences with three financial services: banking, insurance and investment from both public and private sectors. The outcome of this study suggests that all the dimensions of EXQ positively affect customer satisfaction, word of mouth, loyalty intentions and service value. Kashif et al. (2016) studied the linkages between dimensions of the ECQ model and satisfaction, loyalty and word of mouth. The study disclosed that moment-of-truth and peace of mind were the most attractive and valuable dimensions to customers. It was also observed that since EXQ dimensions impact vital and profitable marketing outcomes, it is a suitable tool that can be used to measure the positive impact of customer experience across various organizations. Studies using the EXQ scale have also been done in retailing (Deshwal, 2016), manufacturing (Kuppelweiser and Klaus, 2021) and tourism (Milman et al., 2017).
Customer experience is not a single-dimensional attribute. It is a complex, multi-layered incident shaped by several interrelating dimensions (Verheof et al., 2009). These dimensions include cognitive, emotional, sensory, behavioural and social dimensions. Cognitive dimensions refer to the processes that take part in the human brain. Problem-solving and decision-making are part of this dimension. The emotional dimension deals with feelings as they are associated with matters related to the heart. Emotions can be positive or negative. It can influence the overall customer experience outcome as emotions easily influence human beings. Sensory dimensions comprise sight, sound, taste, smell and touch. These dimensions relate to the ambience where a particular interaction takes place. The behavioural dimension is actions taken by customers based on the experience that they have endured. It can be channeled through word of mouth, reviews and social media engagements. The social dimension refers to all forms of communication with service personnel through various touch points of the organization (Verheof et al., 2009). Klaus and Maklan (2012) introduced an EXQ scale consisting of four dimensions based on the concept. These dimensions are product experience, outcome focus, moments of truth and peace of mind.
3. Hypotheses Development
3.1. Peace of Mind
Peace of mind is a dimension related to the more emotional part of rendering service. It highly depends on how a situation is handled and the level of expertise the service provider shows. In Psychology, peace of mind is related to the absence of anxiety and discomfort (Lee et al., 2013). Peace of mind depicts the customer’s emotional evaluation of all communications they go through with service personnel before, during and after purchasing a product (Klaus, 2014). Peace of mind is strongly associated with the emotional aspects of a service, and these emotions primarily depend on the skill and support provided to customers during their interaction with an organization’s service personnel (Maklan and Klaus, 2011). Therefore, we can conclude that two significant parts make up peace of mind: emotions and level of expertise. Consumers buy a product for functional purposes and emotional satisfaction (Jin et al., 2015). In view of this, ECQ also measures emotions (Maklan and Klaus, 2011). A study done in a major private healthcare facility in Malaysia found that peace of mind positively impacts customer experience perceptions (Kashif, et al., 2016). It is therefore hypothesized that:
H1: Peace of mind has a positive effect on brand love.
3.2. Moment-of-Truth
Moment-of-truth is a dimension that addresses the importance of service recovery. It relates to dealing with complications that arise at touch points and how they are handled. Service recovery is the task of failures that occur while executing a service procedure. It is a task that aims to solve problems, overturn negative situations and turn unhappy customers into more content ones (Mir et al., 2023). The term moment-of-truth was first introduced by Carlzon (1987). Moment-of-truth was described as an important instance in the communication between consumers and service providers. Late literature has also focused on moment-of-truth as part of the customer experience (Lemon and Verhoef, 2016). Moments of truth can significantly influence customer responses (Voorhees et al., 2017). The interactions during moment-of-truth are vital to the longevity of the relationship between the organization and its customers. A moment of truth forms a striking memory imprinted on customers’ minds (Lawrence, 2007). Research proves that consumers use much energy during moment-of-truth interactions. Expectations and wanting attention contribute to this burst of energy (Beaujean et al., 2006). The continuation of organization-consumer relationships is highly dependent on the experience consumers go through during a moment-of-truth episode (Roy et al., 2019). Research by Kashif et al. (2009) discovered that moment-of-truth significantly impacts customer experience perceptions. It is therefore hypothesized that:
H2: Moment-of-truth has a positive effect on brand love.
3.3. Outcome Focus
Outcome focus focuses mainly on reducing customers’ transaction costs. The highest costs of switching suppliers stem from psychological challenges faced when trying to let go of the familiar (Arasil, 2005). It includes costs incurred for switching brands and gathering information. Switching costs are key factors that create barriers or expenses for consumers when changing service providers (Colgate and Lang, 2001).
Transaction costs include all consumers’ costs when purchasing a product or service. They are monetary and include time and effort (Hsu and Lin, 2020). Consumers form perceptions of transaction costs while processing and evaluating information related to the product or service they wish to purchase (Fletcher and Gbadamosi, 2022). Switching costs are not taken lightly by consumers. With information at their fingertips, consumers can now easily compare an organization’s product and that of competitors (Jones, Mothersbaugh and Beatty, 2002). When organizations impose switching costs, it is also a mechanism to safeguard themselves from any failures that may occur while providing service to the customer (Jones et al., 2000). It encompasses customers’ costs when switching service providers, including monetary costs, such as the loss of financial benefits, and non-monetary costs, such as time, effort, psychological strain, and convenience (Han, Back, and Kim, 2011). These costs make it difficult for consumers to change brands, encouraging customer loyalty and ensuring they remain long-term patrons. It is therefore hypothesized that:
H3: Outcome focus has a positive effect on brand love.
3.4. Product Experience
Product experience is a multi-faceted phenomenon that involves manifestations such as subjective feelings, behavioural reactions, expressive reactions, and physiological reactions (Desmet et al., 2007). The experience with a product varies depending on the consumer’s level of contact with it (Mooy and Robben, 2002). Product experience is related to the customers’ perception of the choices offered and to what extent they can compare these offers with those of the competitors or within the same organization. The apparent capabilities of a product influence product preference before use and the problems solved by the product after it has been used (Thompson et al., 2005). Research suggests that when under pressure, consumers have difficulties processing information (Dhar et al., 2000). It affects their cognitive and affective abilities, causing them to be in an unstable emotional state. Uncomfortable situations also encourage consumers to then look at what competitors are offering (Maule and Svenson, 1993). To reduce pressure, organizations can aid consumers by making information easily accessible or by offering a variety of communication modes that the consumer can use to get assistance. It lowers the complexity of decision-making and makes the experience more positive for consumers. Hekkert (2006) identified three parts of product experience. These parts are aesthetic pleasure, attribution of meaning and emotional response. Aesthetic pleasure denotes product features pleasing to the senses, such as sight, hearing, smell, taste and touch. The attribution of meaning plays a more cognitive role. It is related to processing and understanding information while making purchase decisions. The emotional response represents an affective role, where the feelings of love and hate, fear and desire or pride and misery come into play. Mugge et al. (2004) proposed that when an attachment towards a product develops, a person is more likely to be more careful handling it and would delay its replacement. It is therefore hypothesized that:
H4: Product experience has a positive effect on brand love.
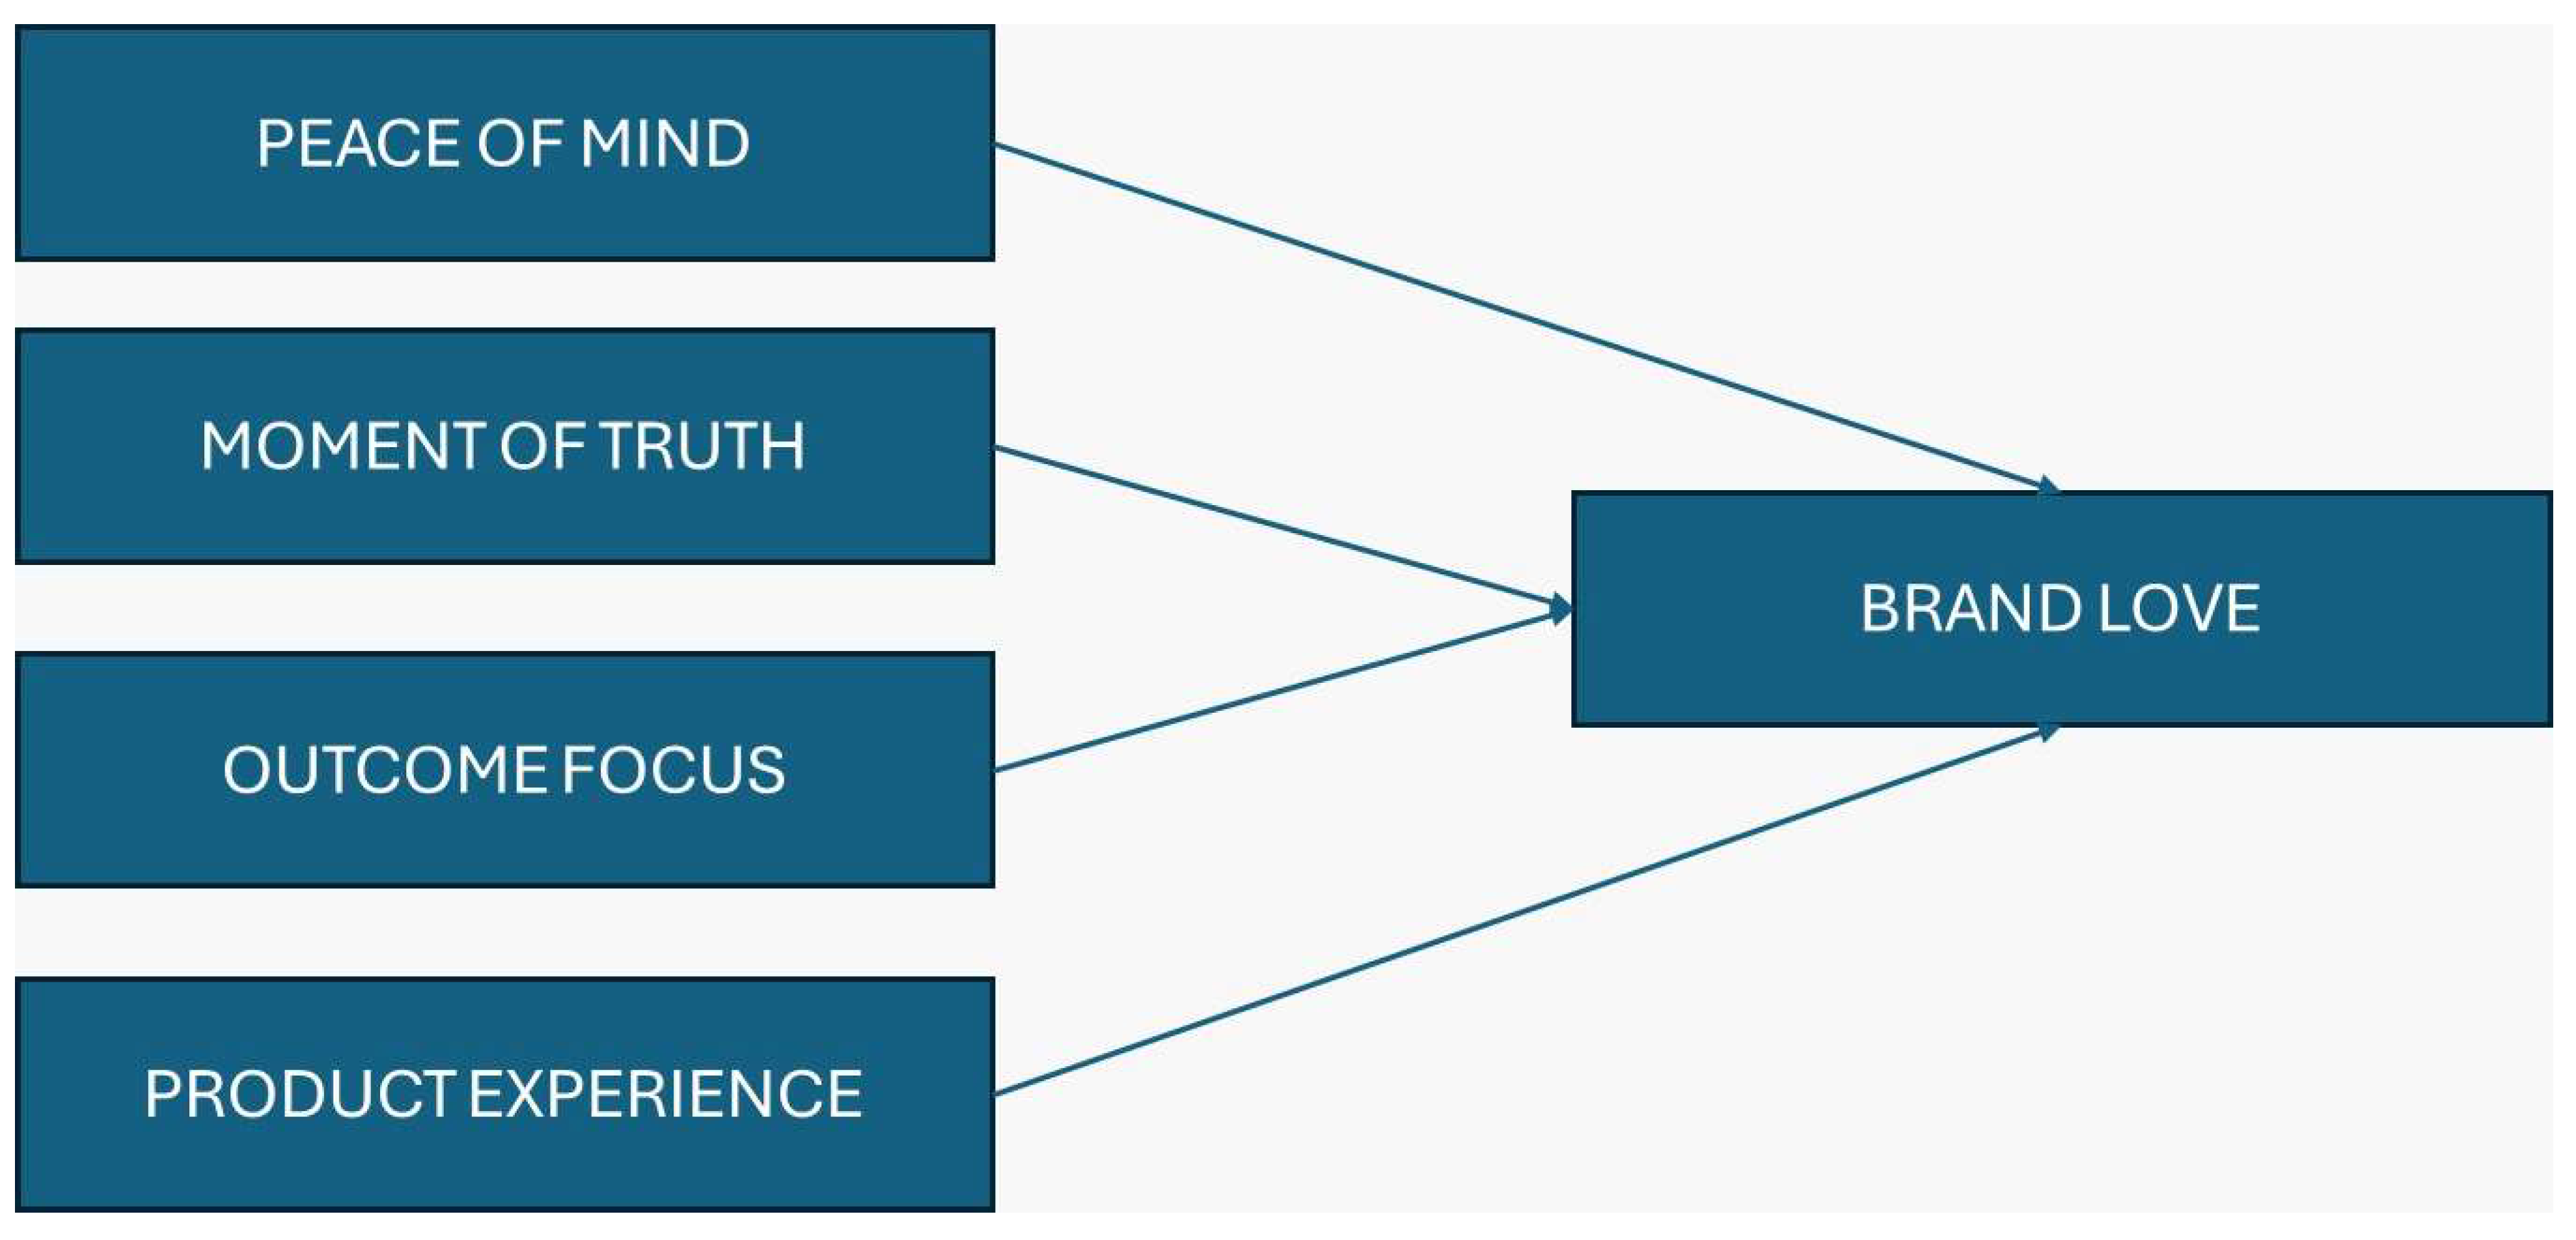
Figure 1 illustrates the study’s conceptual framework, where each variable represents a critical dimension of customer experience and its influence on brand love. Below is a description of each variable:
Peace of Mind: The emotional security and assurance the customer has when interacting with the service provider highlights the impact of expertise and emotional support. This leads to a sense of stability and trust, positively reinforcing brand love.
Moment of Truth: When things go wrong for the customer, service recovery takes place, and the emotional connection matters. Finally, this metric highlights the need for good handling of customers’ concerns to create memorable events that enhance brand emotional attachment.
Outcome Focus: It has to do with the efficiency of providing services, reducing transaction costs and projects based on solutions the client would be happy with. This dimension emphasizes enhancing processes that are easy, pleasant, and delightful to engage with, creating more stickiness with the brand.
Product Experience: It includes the sensory, emotional, and functional facets of customer interaction with a product or service. This relates to the packaging and how the product has been perceived, fulfilling the true gauntlet of expectations and adding to the customer experience, which can make them loyal and passionate about the brand.
Brand love: Brand love is the dependent variable, which means it is the outcome variable being tested. It is an indication of the emotional interest or affection that a customer develops towards a brand. Net Promoter Score (NPS): This composite score reflects the sum of good experiences from the other variables and the loyalty and advocacy in favors of the brand.
4. Methodology
4.1. Sampling and Data Collection
This quantitative approach is based on research targeting students from Multimedia University (MMU), Malaysia. The data was gathered using a structured survey to measure the quality dimensions of customer experience and its impact on brand affinity. Lastly, it has been reported that MMU is one of the top private institutions in higher education, so it has a diverse student body, which makes it a substantial site in which customer experience in academia could be investigated. Data were collected via both paper copies and online. The physical surveys were distributed across MMU’s campuses in Cyberjaya and Melaka among the students at designated common areas such as libraries and cafeterias. Online method: The survey was disseminated on social media pages affiliated with the universities, groups on WhatsApp for students, and the university intranet. Non-probability sampling, specifically convenience sampling, was used as there was no well-defined sampling frame for the student population. The event had a diverse representation of students of all levels of study and MMU faculties.
We applied screening questions to ensure the validity and reliability of the data collected, including asking respondents to verify that they were current students and had been enrolled for at least six months. This criterion was intended to ensure that participants had enough experience with the services of the MMU to answer comprehensively. The survey also included a cover note that clarified the study and ensured anonymity. Data were collected over a 2-month study period (target November 2024). There were 312 replies, and 267 were determined to be usable after performing data cleaning. This sample size surpasses the minimum number of observations required in line with a priori power analysis, performed in G*Power 3.1.9.4, which sample size is 244 with a desired power of 95% for a medium effect size (0.15) with a significance level of 5% (p < 0.05). Data collected was then analyzed with SPSS.
The questionnaire was preceded with a short note to the respondents for informed consent stating that participation in the survey was voluntary and they could withdraw their responses at any time.
4.2. Common Method Bias
Following Podsakoff et al.’s (2003) recommendations for avoiding common method bias (CMB) and its influence, procedural (multiple-wave study and multiple-source data) and statistical (Harman’s single factor test and full collinearity test) remedies were implemented (Tehseen et al., 2017). In terms of procedure, participants were guaranteed the anonymity and confidentiality of their responses, assuring them that the data would be used only for academic purposes. This assurance was designed to decrease the chances of socially desirable or biased responses.
To reduce the likelihood of CMB, we designed the current survey using several measures. To decrease respondents’ potential to infer relationships between items, items about different constructs were placed on separate pages. Instructions were explicit, noting that each statement must be read carefully and answered truthfully. To maintain clarity in the items, ambiguity was reduced by defining technical terms and using plain language (Tourangeau et al., 2000). Harman’s single-factor test was conducted using principal component analysis and included all of the primary constructs in the study. Results indicated that one factor explained 34% of the total variance, below the 50% threshold reported by Fuller et al. (2016) and Svensson et al. (2018). An implication is that CMB will not likely be a significant concern in this work.
4.3. Measurements
A questionnaire structured with close-ended questions was prepared to assess the study variables and collect demographic details, including gender, age, faculty, and educational level (
Appendix A). The questionnaire was based on validated scales from previous studies. To facilitate understanding, all survey items were written in English because it is the medium of instruction at Multimedia University (MMU). The EXQ model (Klaus and Maklan, 2012) measured customer experience. Those dimensions were peace of mind, moment of truth, and outcome focus and product experience. All dimensions were assessed through a five-point Likert, from “1 = Strongly Disagree” to “5 = Strongly Agree.”
5. Data Analysis and Result
5.1. Demographic Profile
Table 1 to study respondents’ demographic profiles showing their age, sex, marital status, education, room sharing, and income. Most of the participants were male (57.4%), and females were 42.6% of the participants. The respondents’ age distribution indicated that most were between 20 and 35 years old (75.3%), and the largest group was in the 20–25 years age range (26.6%). As this demographic is very much in line with the demographic of higher education institutions, it can be concluded that the findings are likely to represent primarily the perceptions and experiences of younger customers. Younger consumers are more digitally engaged and value seamless, multi-channel experiences, which may influence their brand love.
Most respondents were from the Faculty of Management (43%), whereas few respondents were from FCM (16.4%) and FOB (12.3%). This divergence may underscore differences in how academic environments impact customer experiences, leading to brand attachment. In terms of level of study, the majority of the sample were postgraduate students, and 49.2% were in a PhD/DBA program. A high percentage of advanced degree candidates may indicate that consideration of brand experience at its institution and its impact on long-term loyalty is somewhat settled in their minds.
Table 2 presents descriptive statistics for the study variables of interest: Peace of Mind, Moment of Truth, Outcome Focus, Product Experience, and Brand Love. From the mean values in
Table 2, it can be seen that all variables value above 3.9 on a 5-point scale, which suggests that respondents have positive perceptions in general. That means the institution keeps providing customer experiences that build brand love. Peace of Mind (4.1780) had the highest mean value, indicating how this variable impacts customer perception. This finding is consistent with the literature showing that customers are looking for emotional assurance during their interactions. The low standard error (0.04396) and high kurtosis (3.388) also provide evidence of a consensus among respondents on their emotional satisfaction. The mean value for Moment of Truth was 4.0984, demonstrating how well customer touchpoints must be handled in critical situations. A moderately high standard deviation (0.79308) and skewness (-1.325) value confirm that although most respondents reported positive experiences, some might have disagreed.
Outcome Focus attained a mean of 4.1127, suggesting that minimizing transaction costs and offering customer-friendly techniques are influential. The distribution of perceptions over this dimension is slightly skewed (-0.965) and has a low kurtosis (0.705), indicating that respondents might perceive it differently. Product Experience is the lowest (still positive) scoring variable, with a mean of 3.9416. It signals an opportunity for improvement, especially in providing consistent and engaging product experiences. This relatively more significant standard deviation (0.74323) and skewness (-0.700) indicate respondents’ diverse opinions regarding their experiences with the product under investigation. Brand Love had the highest mean (4.2410), so the respondents had a high emotional attachment to the institution. These findings reaffirm the positive relationship between customer experience and brand love. However, its kurtosis (2.660) and skewness (-1.544) indicate a slightly higher-end skew, emphasizing most responses’ strong emotional connection.
5.2. Regression Analysis
When combined, this relationship is strong in the regression model outlined in
Table 3, showing that the independent variables (namely Peace of Mind, Moment of Truth, Outcome Focus, and Product Experience) significantly affect Brand Love (the dependent variable). The model’s R-value (0.843) shows a strong correlation and reflects that independent variables collectively explain the variance in Brand Love.
The fact that the R-squared is 0.711 indicates that the independent variables can explain 71.1% of the variation in Brand Love. Such R-squared is a considerable explanatory power, confirming that the dimensions of customer experience are relevant for the prediction of brand love. With an adjusted R-squared value of 0.706, the model is confirmed for robustness, accounting for the number of predictors. Yes, the power of the regression lies in the adjusted R-squared value.
The standard error of the estimate is 0.46945, which indicates the average distance that the observed values fall from the regression line. There is some variability, but the standard error is relatively low, indicating that the model fits the data well. The F-test (F = 146.696, p < 0.001) affirms the overall significance of the regression model. It shows good predictive power of the independent variables to predict Brand Love. Our research concludes that all four customer experience dimensions play a significant role in developing Brand Love. The elevated R-squared and significant F-test confirm the model’s accuracy and highlight the importance of customer experience in generating emotional attachment to the brand.
The results of the ANOVA test are presented in
Table 4, which assesses the overall significance of the regression model. These results indicate that the model is significant, p < 0.001. Thus, it signifies that the combination of predictors (Peace of Mind, Moment of Truth, Outcome Focus, and Product Experience) statistically affects the dependent variable (Brand Love).
The F-statistic of the regression model is equal to 146.696, which is also a relatively high value and further supports the conclusion that the regression model can account for a significant amount of the variance in Brand Love. The high ratio of regression sum of squares (129.318) to residual sum of squares (52.672) suggests that the model explains most of the variance in the response variable, with slight unexplained variation remaining. These findings confirmed that customer experience dimensions are significant predictors of Brand Love. Overall, pairwise comparisons performed on the ANOVA results indicate that the model can be reliable in depicting the relationship between customer experience and brand love, specifically in private higher education institutions.
Only then will
Table 5 show how the independent variables (Peace of Mind, Moment of Truth, Outcome Focus and Product Experience) contribute to the ’Brand Love’ dependent variable. The standardized and unstandardized coefficients and significance levels show each predictor’s relative importance and statistical influence.
The unstandardized (B = 0.207) and standardized coefficients (β = 0.165) show a positive significant relationship (p = 0.007) with Brand Love. This discovery highlights how emotional assurance encourages customers to become more loyal and affectionate towards a brand, correlating with other research showing that emotional comfort contributes to a fulfilling customer experience.
As shown by the unstandardized coefficient (B = 0.341) and standardized coefficient (β = 0.313), Moment of Truth strongly and significantly impacts Brand Love (p < 0.001). How critical service encounters are managed particularly in problem resolution drives customer perceptions of and emotional connection to the brand.
With the most excellent unstandardized coefficient (B = 0.522) and standardized coefficient (β = 0.431), Outcome Focus is revealed as the most powerful predictor. The p-value of < 0.001 indicates that lowering transactional costs or pricing products/services to be commensurate with value positively contributes to Brand Love. This discovery mirrors the need for efficiency and cost-effectiveness in developing robust connections between consumers and brands.
Product Experience has a weak and non-significant relationship with Brand Love (B = -0.028, β = -0.024, p = 0.636). This finding implies that product-related touch points are not as vital for brand love to develop in this case as they are when dimensions such as emotion-oriented satisfaction. The implication is that an institution may have to consider, evaluate, and/or improve its products or customer perceptions of them.
Figure 2 shows the regression model results, presenting the independent variables (Peace of Mind, Moment of Truth, Outcome Focus, Product Experience) and their relationship with the dependent variable, Brand Love. The figure presents a visual overview of the regression results, showing the different degrees of impact of each of the customer experience components on the emotional attachment to the brand.
Figure 3, which summarizes the key insights of the regression analysis and the relative contributions of each variable to Brand Love. It visually compares the standardized coefficients (β) for Peace of Mind, Moment of Truth, Outcome Focus and Product Experience. The chart succinctly presents the relative strengths of the relationship between each variable and Brand Love, allowing for quick identification of both areas of success and potential for improvement.
6. Discussion
This research contributes to understanding how the various dimensions of customer experience are an antecedent to brand love in a private higher education institution. Recent literature is reviewed concerning each dimension to outline its impact and implications. The results show that providing peace of mind is crucial in building brand love, defining it as an important emotional value of the customer experience. This aligns with recent research that shows ways of building customer brand relationships with emotional reassurance (Rane et al., 2023). Trust is built on emotional security developed through effortless encounters and effective service, which is essential for brand love (Husain et al., 2022). It is only natural for institutions to want to focus their initiatives on those that provide emotional satisfaction (e.g. mechanisms for personalized support, transparent and clear channels of communication, etc.).
Results of the study show that moments of truth positively and significantly impact brand love. There is support for the argument that these moment-of-truth touchpoints particularly those involving service recovery have a longer-term impact on customers (Huang et al., 2023). More recent work shows that when issues arise, resolving them effectively in critical interactions not only alleviates dissatisfaction but also enhances emotional bonding (Rane et al., 2023). Organizations must invest in training their people to deal with these opportunities and create memorable experiences that positively affect brand perception.
Outcome focus stands out as the strongest predictor of brand love, highlighting the need for transaction cost reduction and the efficient delivery of services. The source of this finding aligns with recent literature underscoring the significance of convenience and value in engendering customer loyalty (Hoyos Vallejo and Chinelato, 2025). Cost-effectiveness through simplified processes builds customer satisfaction, eventually leading consumers to brand love. It underscores the importance of ongoing service efficiency and innovation.
In this study, product experience did not have a strong and significant relationship with brand love as expected. This outcome contrasts previous studies, highlighting the significance of product-related interactions. However, it is in line with the idea that in sectors dominated by service (such as education), the product (for example, academic programs) could matter less than service delivery (Indrawati and Kuncoro, 2021). If the customer is evolving, the institutions must review how they are offering the offer.
These outcomes illustrate the complex but crucial relationship between customer experience and brand love. Along the same lines as the EXQ framework, the two main components of customer experience, emotional and functional, are significant contributors to brand loyalty and attachment (Le, et al., 2021). The results also indicate that not all dimensions carry equal weight, meaning the need for strategic consideration of the most impactful areas, including focus on the outcomes and emotional reassurance. From an academic perspective, this study contributes to the literature on customer experience and brand love by providing empirical evidence of their link in the context of higher education. It connects with recent calls for sector-specific research. It stresses the key need for organizations to cater their customer experience strategies to different consumer groups’ distinct needs and expectations.
7. Conclusion
Four dimensions of customer experience quality were used in this study, including peace of mind, moment of truth, outcome focus, and product experience, to explore customer brand love in a private institution of higher learning. This study shows that customer experience is an important antecedent of brand love, but these dimensions do not all have the same influence. Outcome focus proved to be the elevating factor, clearly validating that the beauty and speed of an organization’s process of creating products and services directly influences the quality of emotional attachment. Peace of mind and moments of truth also bolstered brand love, illustrating the far-reaching impact of emotional assurance and service recovery during critical interactions. Product experience has exhibited a weak and non-significant impact, indicating that in the context of higher education, service-related factors might be of greater importance than product-related features.
7.1. Theoretical and Practical Implications
From a theoretical perspective, this study advances the determinants of customer experience, particularly in higher education, where prior research on this domain is scant, albeit known in a general context. It also validates the relevance of the EXQ model when testing customer experience in this specific context. Implications: The results are also practical and offer institutions opportunities to optimize transaction efficiency, emotional engagement, service recovery, and more in advancing customer loyalty and brand attachment.
7.2. Recommendations
Higher education institutions should spend time on emotional and functional customer experience strategies. It encompasses enhancing service recovery mechanisms, providing personalized assistance to address customers’ requirements, and iterating processes to ensure smooth and gratifying interactions. Although not a dominant factor in this study, universities should not lose sight of aligning their offerings with changing customer expectations around product experience.
7.3. Future Research Directions
This study outlines paths for more diversification in general studies in cultural or demographic differences in customer experience dimensions and related brand love. Further studies could explore other fields or contexts to analyze findings and generalize them on a larger scale. Moreover, using longitudinal data may allow research on the evolution of customer experience and brand love. Customers expect every touchpoint with their favourite brands and hence, if brands are loving or even correct it is natural that brand love’s linkage to customer experience quality comes from its emotional and functional dimensions. By prioritizing these, institutes can not only retain customer satisfaction. However, they will be able to retain the emotional connection for a longer time with them, which implies long-term loyalty and advocacy.
About the authors
Dr. Nurazlin Binti Mohd Fauzi is a dedicated academic and experienced Senior Lecturer at the Faculty of Management (FOM), Multimedia University (MMU), Cyberjaya. With almost two decades of teaching experience in marketing subjects, including 15 years specializing in Principles of Marketing, Dr. Nurazlin has established herself as a passionate educator in the field. Her academic journey includes a doctorate in service marketing, a field she thoroughly enjoys and continues to explore with enthusiasm. She holds an NCC Diploma and Advanced Diploma in Computer Studies, a Bachelor of Business Administration (BBA), and an MBA, reflecting her diverse and robust educational background. Dr. Nurazlin’s professional expertise spans service recovery, corporate image, and customer service, making her a valued contributor to both academic and professional discussions in these areas. Before joining MMU in 2006, she gained industry and academic experience working with RTM (1991–1995) and Kolej Yayasan Melaka (2001–2006). Beyond her professional endeavors, Dr. Nurazlin embraces a positive outlook, finding joy and gratitude in everyday life. H. M. Mahfuzur Rahman is a Research scholar, Faculty of Management, Multimedia University, Malaysia. He is currently pursuing his PhD in Management at the Multimedia University of the Cyberjaya, Malaysia. He holds a B.sc (hons) and M.sc in chemistry, from national University in Bangladesh. H M Mahfuzur Rahman has authored articles in several journals. His research interests encompass an Operations Management, Human Resources Management Practices, Technology Management, Supply chain Management, Industry 4.0, Digital Security, Industry 5.0 and Tourism and Hospitality Management and Sustainable Development studies. Dr. Junainah Binti Mohd Mahdee has completed her Ph.D. at Queen’s University of Belfast (QUB), United Kingdom. She serves as an Assistant Professor (Marketing) at the Faculty of Management, Multimedia University (MMU), Malaysia. Her research interests are in the area of Marketing and Management such as Digital Marketing, Services Marketing, Internal Marketing and Intellectual Capital which consists of organizational, social and human capitals. Niaz Pervez is a MPhil candidate specializing in mental health with resilience at Multimedia University Malaysia. He also holds an undergraduate degree in marketing. His research interests are in mental health and marketing such as, resilience, mindfulness, sustainability and entrepreneurship.
Author’s contribution statements
All authors have approved the final manuscript. Nurazlin Binti Mohd Fauzi: Conceptualization; Writing; Literature review; Supervision; Review. H. M. Mahfuzur Rahman: Conceptualization and execution of the research; Methodology; Software; Data curation; Writing of original draft; Literature Review; Conclusion of the study; Discussion; Review and formatting. Junainah Binti Mohd Mahdee: Conceptualization; Supervision; Discussion; Review. Niaz Pervez: Conceptualization; Discussion; Review; Formatting.
Ethical approval
This study was obtained from the Research Ethics Committee of Multimedia University, Malaysia with the approval number (EA1002024). All participants were informed about the purpose of the study, their rights to confidentiality, and their ability to withdraw at any time without penalty. Informed consent was obtained from all individual participants included in the study. The study adhered to the ethical standards as prescribed in the 1964 Declaration of Helsinki and its later amendments.
Disclosure statement
No potential conflict of interest was reported by the author(s)
Funding
Funding is sponsored by the Research Management Centre (RMC) of Multimedia University, Cyberjaya, Malaysia. [MMU/RMC/PC/2025]
Data availability statement
The data that support the findings of this study are available from the corresponding author upon reasonable request.
Appendix A
Section 1: Demographic Profile
| No |
Questionnaire |
Scale |
| 1 |
What is your Gender |
Male |
Female |
| 2 |
What is your Age |
Between 20-25 years |
Between 26-30 years |
Between 31-35 years |
Between 36-40 years |
Between 41-45 years |
Above 45 years |
| 3 |
What is your Faculty |
FOM |
FOB |
FCM |
FOE |
FET |
FIST |
FOL |
FAC |
| 4 |
What is your study level? |
Diploma |
Bachelor’s Degree |
Master’s Degree |
PhD/DBA |
| |
|
|
|
|
|
|
|
|
|
|
|
| Strongly disagree |
Disagree |
Neutral |
Agree |
Strongly agree |
| 1 |
2 |
3 |
4 |
5 |
Section 2: Place of Mind
| No |
Questionnaire |
1 |
2 |
3 |
4 |
5 |
| PM1 |
I am confident in the expertise of my lecturers. |
|
|
|
|
|
| PM2 |
All the processes related to my studies that I have gone through have been smooth. |
|
|
|
|
|
| PM3 |
MMU makes me feel that my future is secured. |
|
|
|
|
|
| PM4 |
I chose MMU because of its excellent track record. |
|
|
|
|
|
| PM5 |
Experience with my past semesters has made it easier for me to get things done. |
|
|
|
|
|
| PM6 |
When I need any advice related to my studies, the faculty is easy to approach. |
|
|
|
|
|
| PM7 |
I am enjoying my MMU experience. |
|
|
|
|
|
Section 3: Moment of Truth
| No |
Questionnaire |
1 |
2 |
3 |
4 |
5 |
| MT1 |
MMU is flexible and looks after my needs. |
|
|
|
|
|
| MT2 |
MMU keeps me up-to-date with its latest developments. |
|
|
|
|
|
| MT3 |
MMU’s reputation makes me feel secure. |
|
|
|
|
|
| MT4 |
MMU employees have good student management skills. |
|
|
|
|
|
| MT5 |
When I have an issue, MMU is quick to deal with it. |
|
|
|
|
|
Section 4: Outcome Focus
| No |
Questionnaire |
1 |
2 |
3 |
4 |
5 |
| OF1 |
Studying in this MMU makes it easy for me to obtain my academic qualifications. |
|
|
|
|
|
| OF2 |
Studying in MMU allows me to obtain my academic qualifications in a timely manner. |
|
|
|
|
|
| OF3 |
I prefer MMU over other universities. |
|
|
|
|
|
| OF4 |
MMU employees always understand the situation I am in. |
|
|
|
|
|
Section 4 Product Experience
| No |
Questionnaire |
1 |
2 |
3 |
4 |
5 |
| PE1 |
I can choose between different academic subjects offered by MMU. |
|
|
|
|
|
| PE2 |
I made comparisons with other universities before choosing MMU |
|
|
|
|
|
| PE3 |
Before deciding on my course, I compared all the different academic courses offered by MMU. |
|
|
|
|
|
| PE4 |
I have good experience with most MMU employees. |
|
|
|
|
|
Section 5: Brand Love
| No |
Questionnaire |
1 |
2 |
3 |
4 |
5 |
| BL1 |
I love MMU |
|
|
|
|
|
| BL2 |
MMU makes me feel good |
|
|
|
|
|
| BL3 |
MMU makes me very happy |
|
|
|
|
|
| BL4 |
I am passionate about MMU |
|
|
|
|
|
| BL5 |
I feel emotionally connected to MMU |
|
|
|
|
|
References
- Albert, N. and Merunka, D. The role of brand love in consumer-brand relationships. Journal of Consumer Marketing, 2013, 30, 258–266. [CrossRef]
- Amani, D. Circumventing customers’ switching behavior in telecommunication industry in Tanzania: insight from Sternberg’s triangular theory of love, Cogent Social Sciences, 2022, 8, 204207.
- Angelini, A. and Gilli, A. Customer experience can play a strategic role for wineries. Journal of Business Strategy, 2022, 43, 391–396. [CrossRef]
- Arantola, H. Consumer Bonding - A conceptual exploration, Journal of Relationship Marketing, 2002, 1, 93-107.
- Arasil, O. Customer loyalty and the effect of switching costs as a moderator variable a case in the Turkish mobile phone market. Marketing Intelligence & Planning, 2005, 23, 89–103. [Google Scholar]
- Association, 93 No. 2, p. 119.
- Bae, B. R. , & Kim, S. E. Effect of brand experiences on brand loyalty mediated by brand love: the moderated mediation role of brand trust. Asia Pacific Journal of Marketing and Logistics, 2023, 35, 2412–2430. [Google Scholar]
- Bagozzi, R.P. , Batra, R. and Ahuvia, A. Brand love: development and validation of a practical scale, Marketing Letters, 2017, 28, 1–14. [Google Scholar]
- Bairrada, C.M. , Coelho, A. and Lizanets, V. The impact of brand personality on consumer behavior: the role of brand love, Journal of Fashion Marketing and Management: An International Journal, 2019, 23, 30–47. [Google Scholar]
- Batra, R. , Ahuvia, A. and Bagozzi, R.P. Brand love, Journal of Marketing, 2012, 22, 1–16. [Google Scholar]
- Beaujean, M. , Davidson, J. and Madge, S. (2006), The ‘moment of truth’ in customer service, McKinsey Quarterly, No. 1, pp. 62-73.
- Becker, L. , Jaakkola, E. and Halinen, A. Toward a goal-oriented view of customer journeys, Journal of Service Management, 2020, 31, 767–790. [Google Scholar]
- Bergkvist, L. and Bech-Larsen, T. Two studies of consequences and actionable antecedents of brand love, Journal of Brand Management, 2010, 17, 504–518. [Google Scholar]
- Carlzon, J. (1987), Moments of Truth, Ballinger, Cambridge, MA.
- Carroll, B.A. and Ahuvia, A.C. (2006), Some antecedents and outcomes of brand love, Marketing Letters, 17 No. 2, pp. 79-89. [CrossRef]
- Charters, S. and O’Neill, M. Service quality at the cellar door: a comparison between regions, International Journal of Wine Marketing, 2001, 13, 7–17. [Google Scholar]
- Chen, C.F. and Chen, F. S. QoE, perceived value, satisfaction and behavioral intentions for heritage tourists, Tourism Management, 2010, 31, 72–80. [Google Scholar]
- Choo, P. W. , Tan, C. L., & Yeo, S. F. A review of customer experience quality measurement in Malaysian heritage hotels. Global Business and Management Research, 2018, 10, 379–395. [Google Scholar]
- Colgate, M. and Lang, B. Switching barriers in consumer markets: an investigation of the financial services industry, Journal of Consumer Marketing, 2001, 18, 332–347. [Google Scholar] [CrossRef]
- De Keyser, A. , Lemon, K.N., Keiningham, T. and Klaus, P. (2015), A framework for understanding and managing the customer experience, MSI Working Paper No. 15-121, Marketing Science Institute, Cambridge, MA.
- Deshwal, P. Customer experience quality and demographic variables (age, gender, education level, and family income) in retail stores. International Journal of Retail & Distribution Management, 2016, 44, 940–955. [Google Scholar]
- Desmet, P. M. A. , & Hekkert, P. Framework of Product Experience. International Journal of Design, 2007, 1, 13–23. [Google Scholar]
- Dhar, R. and Nowlis, S. M. The effect of time pressure on consumer choice deferral, Journal of Consumer Research, 1999, 25, 369–384. [Google Scholar]
- Eklund, A.A. The mediating impact of brand love and brand image between brand experience and brand loyalty: an analysis of car brands, Academy of Marketing Studies Journal, 2022, 26, 1-14.
- Fletcher, K.A. and Gbadamosi, A. Examining social media live stream’s influence on the consumer decision-making: a thematic analysis, Electronic Commerce Research, 2022, 22, 1–31. [Google Scholar]
- Fuller, C. M. , Simmering, M. J., Atinc, G., Atinc, Y., & Babin, B. J. Common methods variance detection in business research. Journal of business research, 2016, 69, 3192–3198. [Google Scholar]
- Gahler, M. , Klein, J.F. and Paul, M. (2019), Measuring customer experiences: a text-based and pictorial scale, Marketing Science Institute Working Paper Series Report No. 19-119, Cambridge, MA.
- Gonçalves, L. , Patrício, L. , Grenha Teixeira, J. and Wünderlich, N.V. Understanding the customer experience with smart services, Journal of Service Management, 2020, 31, 723–744. [Google Scholar]
- Grönroos, C. Grönroos, C. A service quality model and its marketing implications, European Journal of Marketing, 1984, 18, 36-44.
- Hamouda, M. and Aissaoui, A. Rooting for the green: consumers and brand love, Journal of Business Strategy, 2024, 45, 275–281. [Google Scholar]
- Han, H. , Back, K. and Kim, Y. A multidimensional scale of switching barriers in the full-service restaurant industry, Cornell Hospitality Quarterly, 2011, 52, 54–63. [Google Scholar]
- Heinonen, K. , Campbell, C. and Lord Ferguson, S. Strategies for creating value through individual and collective customer experiences, Business Horizons, 2019, 62, 95–104. [Google Scholar]
- Hekkert, P. Design aesthetics: Principles of pleasure in product design. Psychology Science, 2006, 48, 157–172. [Google Scholar]
- Hirschman, E.C. and Holbrook, M.B. (1982), Hedonic consumption: emerging concepts, methods and propositions, Journal of Marketing, 46 No. 3, pp. 92-101.
- Hodgkinson, I.R. , Jackson, T.W. and West, A.A. (2021), Customer experience management: asking the right questions, Journal of Business Strategy, 43 No. 2, pp. 105-114.
- Hoyos Vallejo, C. A. , & Chinelato, F. B. (2025). Delivering trust: how food safety performance drives loyalty across the online ordering journey. International Journal of Quality & Reliability Management, 42(1), 107-121.
- Hsu, C.L. and Lin, J.C.C. (2020), Understanding continuance intention to use online to offline (O2O) apps, Electronic Markets, 30 No. 4, pp. 883-897.
- Huang, L. , Gao, B., & Gao, M. (2023). Value Realization from the Perspective of Customers and Users. In Value Realization in the Phygital Reality Market: Consumption and Service Under Conflation of the Physical, Digital, and Virtual Worlds (pp. 15-39). Singapore: Springer Nature Singapore.
- Husain, R., Paul, J., & Koles, B. (2022). The role of brand experience, brand resonance and brand trust in luxury consumption. Journal of Retailing and Consumer Services, 66, 102895.
- Hwang, J. and Seo, S. (2016), A critical review of research on customer experience management: theoretical, methodological and cultural perspectives, International Journal of Contemporary Hospitality Management.
- Ieva, M. and Ziliani, C. (2018), The role of customer experience touchpoints in driving loyalty intentions in services, The TQM Journal, 30 No. 5, pp. [CrossRef]
- Indrawati, S. M. , & Kuncoro, A. (2021). Improving competitiveness through vocational and higher education: Indonesia’s vision for human capital development in 2019–2024. Bulletin of Indonesian Economic Studies, 57(1), 29-59.
- Jin, N. , Lee, S. and Lee, H. (2015), The effect of QoE on perceived value, satisfaction, image and behavioral intention of water park patrons: new versus repeat visitors, International Journal of Tourism Research, 17 No. 1, pp. 82-95.
- Jones, A. , Mothersbaugh, L., & Beatty, E. (2002). Why customers stay: measuring the underlying dimensions of services switching costs and managing their differential strategic outcomes. Journal of Business Research, 55(6), 441–450.
- Jones, M.A. , Mothersbaugh, D.L. and Beatty, S.E. (2000), Switching barriers and repurchase intentions in services, Journal of Retailing, 76 No. 2, pp. 259-274.
- Joshi, R. and Garg, P. (2021), Role of brand experience in shaping brand love, International Journal of Consumer Studies, 45No. 2, pp. 259-272.
- Kang, A. (2015), Brand love–moving beyond loyalty an empirical investigation of perceived brand love of Indian consumer, Arab Economic and Business Journal, 10 No. 2, pp. 90-101.
- Karjaluoto, H. , Munnukka, J. and Kiuru, K. (2016), Brand love and positive word of mouth: the moderating effects of experience and price, Journal of Product and Brand Management, 25 No. 6, pp. 527-537.
- Kashif, M. , Zakiah Melatu Samsi, S., Awang, Z. and Mohamad, M. (2016), EXQ: measurement of healthcare experience quality in Malaysian settings: A contextualist perspective, International Journal of Pharmaceutical and Healthcare Marketing, 10 No. 1, pp. 27-47.
- Kaushal, V. and Yadav, R. (2024), Exploring luxury hospitality customer experience of Maldives tourists amidst COVID-19 pandemic, Consumer Behavior in Tourism and Hospitality, 19 No. 1, pp. 140-165.
- Khalid, A. , Awan, R. A., Ali, R., & Sarmad, I. (2023). The antecedent cognitions of brand love and its impact on brand loyalty: the moderating role of sustainability marketing. Corporate Governance (Bingley). [CrossRef]
- Klaus, P. (2014). Measuring customer experience: How to develop and execute the most profitable customer experience strategies. Berlin, Germany: Springer.
- Klaus, P. and Maklan, S. (2013), Towards a better measure of customer experience, International Journal of Market Research, 55 No. 2, pp. 227-246.
- Klaus, P. , & Maklan, S. (2012). EXQ: a multiple-item scale for assessing service experience. Journal of Service Management, 23(1), 5-33.
- Koetz, C. (2019), Managing the customer experience: a beauty retailer deploys all tactics, Journal of Business Strategy, 40 No. 1, pp. 10-17.
- Kuppelwieser, V.G. and Klaus, P. (2021), Customer experience quality in African B2B contexts, Journal of Services Marketing, 35 No. 7, pp. 891-900.
- Lawrence., K., E. (2007). Winning at Employee Moments of Truth Through HR Products and Services. Organization Development Journal, 25(2), 159-161.
- Le, A. N. H., Khoi, N. H., & Nguyen, D. P. (2021). Unraveling the dynamic and contingency mechanism between service experience and customer engagement with luxury hotel brands. International Journal of Hospitality Management, 99, 103057.
- Lee, Y.-C. , Lin, Y.C., Huang, C.-L., Fredrickson, B.L. (2013) The construct and measurement of peace of mind. Journal of Happiness Studies, 14 (2) (2013), pp. 571-590.
- Lemke, F. , Clark, M. and Wilson, H. (2011), Customer QoE: an exploration in business and consumer contexts using repertory grid technique, Journal of the Academy of Marketing Science, 39 No. 6, pp. 846-869.
- Lemon, K.N. and Verhoef, P.C. (2016), Understanding customer experience throughout the customer journey, Journal of Marketing, 80 No. 6, pp. 69-96.
- Macdonald, E. , Wilson, H.N. and Konus, U. (2012), Better customer insight – in real time, Harvard Business Review, 90 No. 9, pp. 102-108.
- Machado, J.C. , Vacas-de-Carvalho, L., Azar, S.L., Andre, A.R. and dos Santos, B.P. (2019), Brand gender and consumer-based brand equity on Facebook: the mediating role of consumer-brand engagement and brand love, Journal of Business Research, 96, pp. 376-385.
- Maklan, S. and Klaus, P. (2011), Customer experience: are we measuring the right things?, International Journal of Market Research, 53 No. 6, pp. 771-772.
- Maule, A.J. and Svenson, O. (1993), Theoretical and empirical approaches to behavioral decision making and their relation to time constraints, Time Pressure and Stress in Human Judgment and Decision Making, pp. 3-25.
- Meeprom, S. and Silanoi, T. (2020), Investigating the perceived quality of a special event and its influence on perceived value and behavioural intentions in a special event in Thailand, International Journal of Event and Festival Management, 11 No. 3, pp. 337-355.
- Miller, D. (2014), Brand-building and the elements of success: discoveries using historical analyses, Qualitative Market Research: An International Journal, 17 No. 2, pp. 92-111.
- Milman, A. , Zehrer, A., & Tasci, A. D. (2017). Measuring the components of visitor experience on a mountain attraction: the case of the Nordkette, Tyrol, Austria. Tourism Review, 72(4), 429–447.
- Mir, M. , Ashraf, R., Syed, T.A., Ali, S. and Nawaz, R. (2023), Mapping the service recovery research landscape: a bibliometric-based systematic review, Psychology and Marketing, 40 No. 10, pp. 2060-2087.
- Mittal, B. and Lassar, W.M. (1996), The role of personalization in service encounters, Journal of Retailing, 72 No. 1, pp. 95-109.
- Mody, M. and Hanks, L. (2020), Consumption authenticity in the accommodations industry: the keys to brand love and brand loyalty for hotels and Airbnb, Journal of Travel Research, 59 No. 1, pp. 173-189.
- Mooy, Sylvia C. and Henry S. J. Robben (2002), Managing Consumers’ Product Evaluations through Direct Product Experience, Journal of Product and Brand Management, 11 (7), 432–44.
- Mousavi, P. , Shamizanjani, M., Rahimnia, F. and Mehraeen, M. (2024), A metrics-driven approach for customer experience management evaluation: the case of commercial banks in developing countries, The TQM Journal, ahead-of-print No. ahead-of-print.
- Mugge, R. , Schifferstein, H. N. J., & Schoormans, J. P. L. (2004). Personalizing Product Appearance: The Effect on Product Attachment. In Kurtgözü, A. (Ed.) Proceedings of 2004 International Conference on Design and Emotion, Ankara, Turkey.
- Parasuraman, A. , Zeithaml, V.A. and Berry, L.L. (1988), Servqual: a multiple-item scale for measuring consumer perceptions of service quality, Journal of Retailing, 64 No. 1, pp. 12-40.
- Parasuraman, A. , Zeithaml, V.A. and Berry, L.L. (1985), A conceptual model of service quality and its implications for future research, Journal of Marketing, 49 No. 4, pp. 41-50.
- Philipp Phil Klaus, Stan Maklan, (2012),EXQ: a multiple-item scale for assessing service experience,Journal of Service Management, 23 Iss: 1 pp. 5 - 33.
- Pine, J.B., II. and Gilmore, J.H. (1999), The Experience Economy: Work is Theatre and Every Business a Stage, Harvard Business School Press, Cambridge, MA.
- Podsakoff, N. P. , Whiting, S. W., Welsh, D. T., & Mai, K. M. (2013). Surveying for artifacts: The susceptibility of the OCB–performance evaluation relationship to common rater, item, and measurement context effects. Journal of Applied Psychology, 98(5), 863.
- Prentice, C. , Wang, X. and Loureiro, S. (2019), The influence of brand experience and service quality on customer engagement, Journal of Retailing and Consumer Services, 50, pp. 50-59.
- Raina, S. , Chahal, H., & Dutta, K. (2019). Customer experience and its marketing outcomes in financial services: A multivariate approach. In Understanding the Role of Business Analytics (pp. 119–143).
- Rane, N. L. , Achari, A., & Choudhary, S. P. (2023). Enhancing customer loyalty through quality of service: Effective strategies to improve customer satisfaction, experience, relationship, and engagement. International Research Journal of Modernization in Engineering Technology and Science, 5(5), 427-452.
- Roy, S. , Sreejesh, S. and Bhatia, S. (2019), Service quality versus service experience: an empirical examination of the consequential effects in B2B services, Industrial Marketing Management, 82, pp. 52-69.
- Safeer, A. A. , He, Y., & Abrar, M. (2020). The influence of brand experience on brand authenticity and brand love: an empirical study from Asian consumers’ perspective. Asia Pacific Journal of Marketing and Logistics, 33(5), 1123–1138. [CrossRef]
- Sahhar, Y. , Loohuis, R. and Henseler, J. (2023), GraphEx: visualizing and managing customer experience in its multidimensionality, Journal of Service Theory and Practice, 33 No. 7, pp. 94-115.
- Sarkar, A. , Ponnam, A. and Murthy, B.K. (2012), Understanding and measuring romantic brand love, Journal of Customer Behaviour, 11 No. 4, pp. 324-347.
- Schmitt, B. (1999), Experiential marketing, Journal of Marketing Management, 15 Nos 1-3, pp. 53-67.
- Silanoi, T. , Meeprom, S. and Jaratmetakul, P. (2022), Consumer experience co-creation in speciality coffee through social media sharing: its antecedents and consequences, International Journal of Quality and Service Sciences, 14 No. 4, pp. 576-594.
- Singh, S. , & Wagner, R. (2023). Environmental concerns in brand love and hate: an emerging market’s purview of masstige consumers. Asia-Pacific Journal of Business Administration.
- Stein, A. and Ramaseshan, B. (2020), The customer experience – loyalty link: moderating role of motivation orientation, Journal of Service Management, 31 No. 1, pp. 51-78.
- Sternberg, R.J. (1986), A triangular theory of love, Psychological Review, American Psychological.
- Svensson, V. , Vento-Tormo, R., & Teichmann, S. A. (2018). Exponential scaling of single-cell RNA-seq in the past decade. Nature protocols, 13(4), 599-604.
- Tehseen, S. , Ramayah, T., & Sajilan, S. (2017). Testing and controlling for common method variance: A review of available methods. Journal of management sciences, 4(2), 142-168.
- Teixeira, J. , Patrício, L., Nunes, N.J., Nóbrega, L., Fisk, R.P. and Constantine, L. (2012), Customer experience modeling: from customer experience to service design, Journal of Service Management, 23 No. 3, pp.
- Thompson, Debora Viana, Rebecca W. Hamilton, and Roland T. Rust Feature Fatigue: When Product Capabilities Become Too Much of a Good Thing, Journal of Marketing Research, 2005, 42, 431–442.
- Tourangeau, R. (2000). The psychology of survey response. University of Cambridge.
- Trevinal, A.M. and Stenger, T. Toward a conceptualization of the online shopping experience, Journal of Retailing and Consumer Services, 2014, 21, 314–326. [Google Scholar]
- Verhoef, P.C. , Lemon, K. N., Parasuraman, A., Roggeveen, A., Tsiros, M. and Schlesinger, L.A. Customer experience creation: determinants, dynamics and management strategies, Journal of Retailing, 2009, 85, 31–41. [Google Scholar]
- Voorhees, C.M. , Fombelle, P. W., Gregoire, Y., Bone, S., Gustafsson, A., Sousa, R. and Walkowiak, T. Service encounters, experiences and the customer journey: defining the field and a call to expand our lens, Journal of Business Research, 2017, 79, 269–280. [Google Scholar]
- Weber, M. and Hofsink, A. (2018), Design and development of the CEM-dashboard: a diagnostic tool to determine your current position and improvement directions in customer experience management, Springer Proceedings in Business and Economics book series (SPBE).
- Wetzels, R.W.H., Klaus, P.P. and Wetzels, M. (2023), There is a secret to success: linking customer experience management practices to profitability, Journal of Retailing and Consumer Services, 73.
- Wong, P. T. P. , & Mayer, C. H. The meaning of love and its bittersweet nature. International Review of Psychiatry, 2023, 35, 33–41. [Google Scholar] [PubMed]
- Xie, L. , Li, D. and Keh, H.T. Customer participation and well-being: the roles of service experience, customer empowerment and social support, Journal of Service Theory and Practice, 2020, 30, 557–584. [Google Scholar]
|
Disclaimer/Publisher’s Note: The statements, opinions and data contained in all publications are solely those of the individual author(s) and contributor(s) and not of MDPI and/or the editor(s). MDPI and/or the editor(s) disclaim responsibility for any injury to people or property resulting from any ideas, methods, instructions or products referred to in the content. |
© 2025 by the authors. Licensee MDPI, Basel, Switzerland. This article is an open access article distributed under the terms and conditions of the Creative Commons Attribution (CC BY) license (http://creativecommons.org/licenses/by/4.0/).