Submitted:
31 January 2025
Posted:
04 February 2025
You are already at the latest version
Abstract
Viewer engagement in videos has consistently low due to excessive advertisements during or before playback, long startup delays, pauses, blurring, poor resolution, and repetitive, intrusive ads. Although many well-established algorithms and techniques claim to improve user engagement, there is no universal solution that addresses all user needs and adapts to varying network conditions. This study elaborates methods for assessing user Quality of Experience (QoE) while watching ad-supported videos by analyzing viewer facial expressions, video metadata, network conditions, and questionnaire feedback. Participants in this subjective study allow facial and screen capture, watch a series of videos with embedded ads, and provide feedback after each session. The collected comments and concerns are then analyzed to understand how advertisements affect engagement, with the goal of making more informed ad placement decisions for future video streaming. Our proposed method, AELIX (Adaptive Ensemble for Imbalance Classification using eXplainable artificial intelligence), based on experimental data and analysis, can infer user QoE and offer advertisers insights on placing ads without diminishing viewer engagement. AELIX achieves a no accuracy of 0.95 and 0.994 with utilization of advanced metrics. And it surpasses our benchmark, ITU-T P.1203, by 55.3%.
Keywords:
1. Introduction
- 1.
- Audio Quality Measurement (P.1203.1): This module estimates the quality of audio stream based on codec parameters, sampling rate, and bitrate.
- 2.
- Video Quality Measurement (P.1203.2): This module estimates the quality of video based on factors like resolution, encoding bitrate, frame rate, spatial and temporal complexity of content characteristics.
- 3.
- Integration Model for Overall Quality (P.1203.3): This module considers both audio and video quality, including stalling events and other streaming disturbances, for overall quality measurement.
- 1.
- Bitrate and Resolution Impact: It has been assumed that the better video quality has the higher bitrates and resolutions for their sharp and great image detail. However, at a certain point, higher bitrate and resolution does not mean the user satisfaction keep increasing.
- 2.
- Stalling Events: Stalling indicated by video freezing. It is due to loading delays that may result in degradation of user experience. A short period of stalling event may drastically degrade user QoE. Hence, ITU-T P.1203 considers stalling events as one of QoE influence factor.
- 3.
- Audio-Video Synchronization: ITU-T P. 1203 consider synchronization of both audio and video to achieve immersive viewing experience. As desynchronization between them may lead to user QoE impairment.
- 4.
- Temporal Variation of Quality: ITU-T P.1203 consider both resolution and bitrate fluctuation frequency during video streaming session due to sudden and often fluctuation may lead to deterioration of QoE.
- 5.
- Final Quality Integration: ITU-T P.1203 considers individual video stream segments to accumulate quality scores at the segment level over time. Some segments may have different weight due to differences in psychological bias that may impact overall quality.
- 1.
- Creation and development of AELIX (Adaptive Ensemble for Imbalance Classification using eXplainable AI) to represent advancement in QoE inference by considering face emotion recognition, advertisement strategy, network statistic and user rating.
- 2.
- Multi-modal dataset collection and creation of unified platform. The collected data including user face video while watching, user rating and ad feedback.
- 3.
- Propose advanced metrics and formulas for QoE optimization. It includes the Ad Effectiveness Score (AES), Log-Transformed Ad Count (LAC), Emotional Valence Consistency (EVC), and Frustration Recovery Rate (FRR).
- 4.
- Propose adaptive ensemble learning to handle class imbalance.
- 5.
- Propose an ad optimization strategy using sentiment analysis.
- 6.
- Found outstanding accuracy over state-of-the-art algorithms. AELIX outperforms the industry standard ITU-T P.1203 by 55.3%, achieving an accuracy of 0.994.
- 1.
- Research Question 1 (RQ1): How can facial expression, sentiment analysis, and network statistic be effectively utilized to estimate user satisfaction during a video streaming session?
- 2.
- Research Question 2 (RQ2): How do various ad insertion strategies affect QoE, and how can sentiment analysis offer deeper apprehensions into more holistic QoE?
- 3.
- Research Question 3 (RQ3): How can adaptive ensemble learning and XAI effectively tackle an imbalanced data problem to accurately infer QoE compared to traditional metrics.
2. Related Work
2.1. QoE Prediction and Assessment Techniques
2.2. Network and System-Level QoE Optimization
2.3. User Behavior, Interaction, and Immersive Media QoE
2.4. Advanced Techniques and Explainability in Video Streaming
3. Methodology
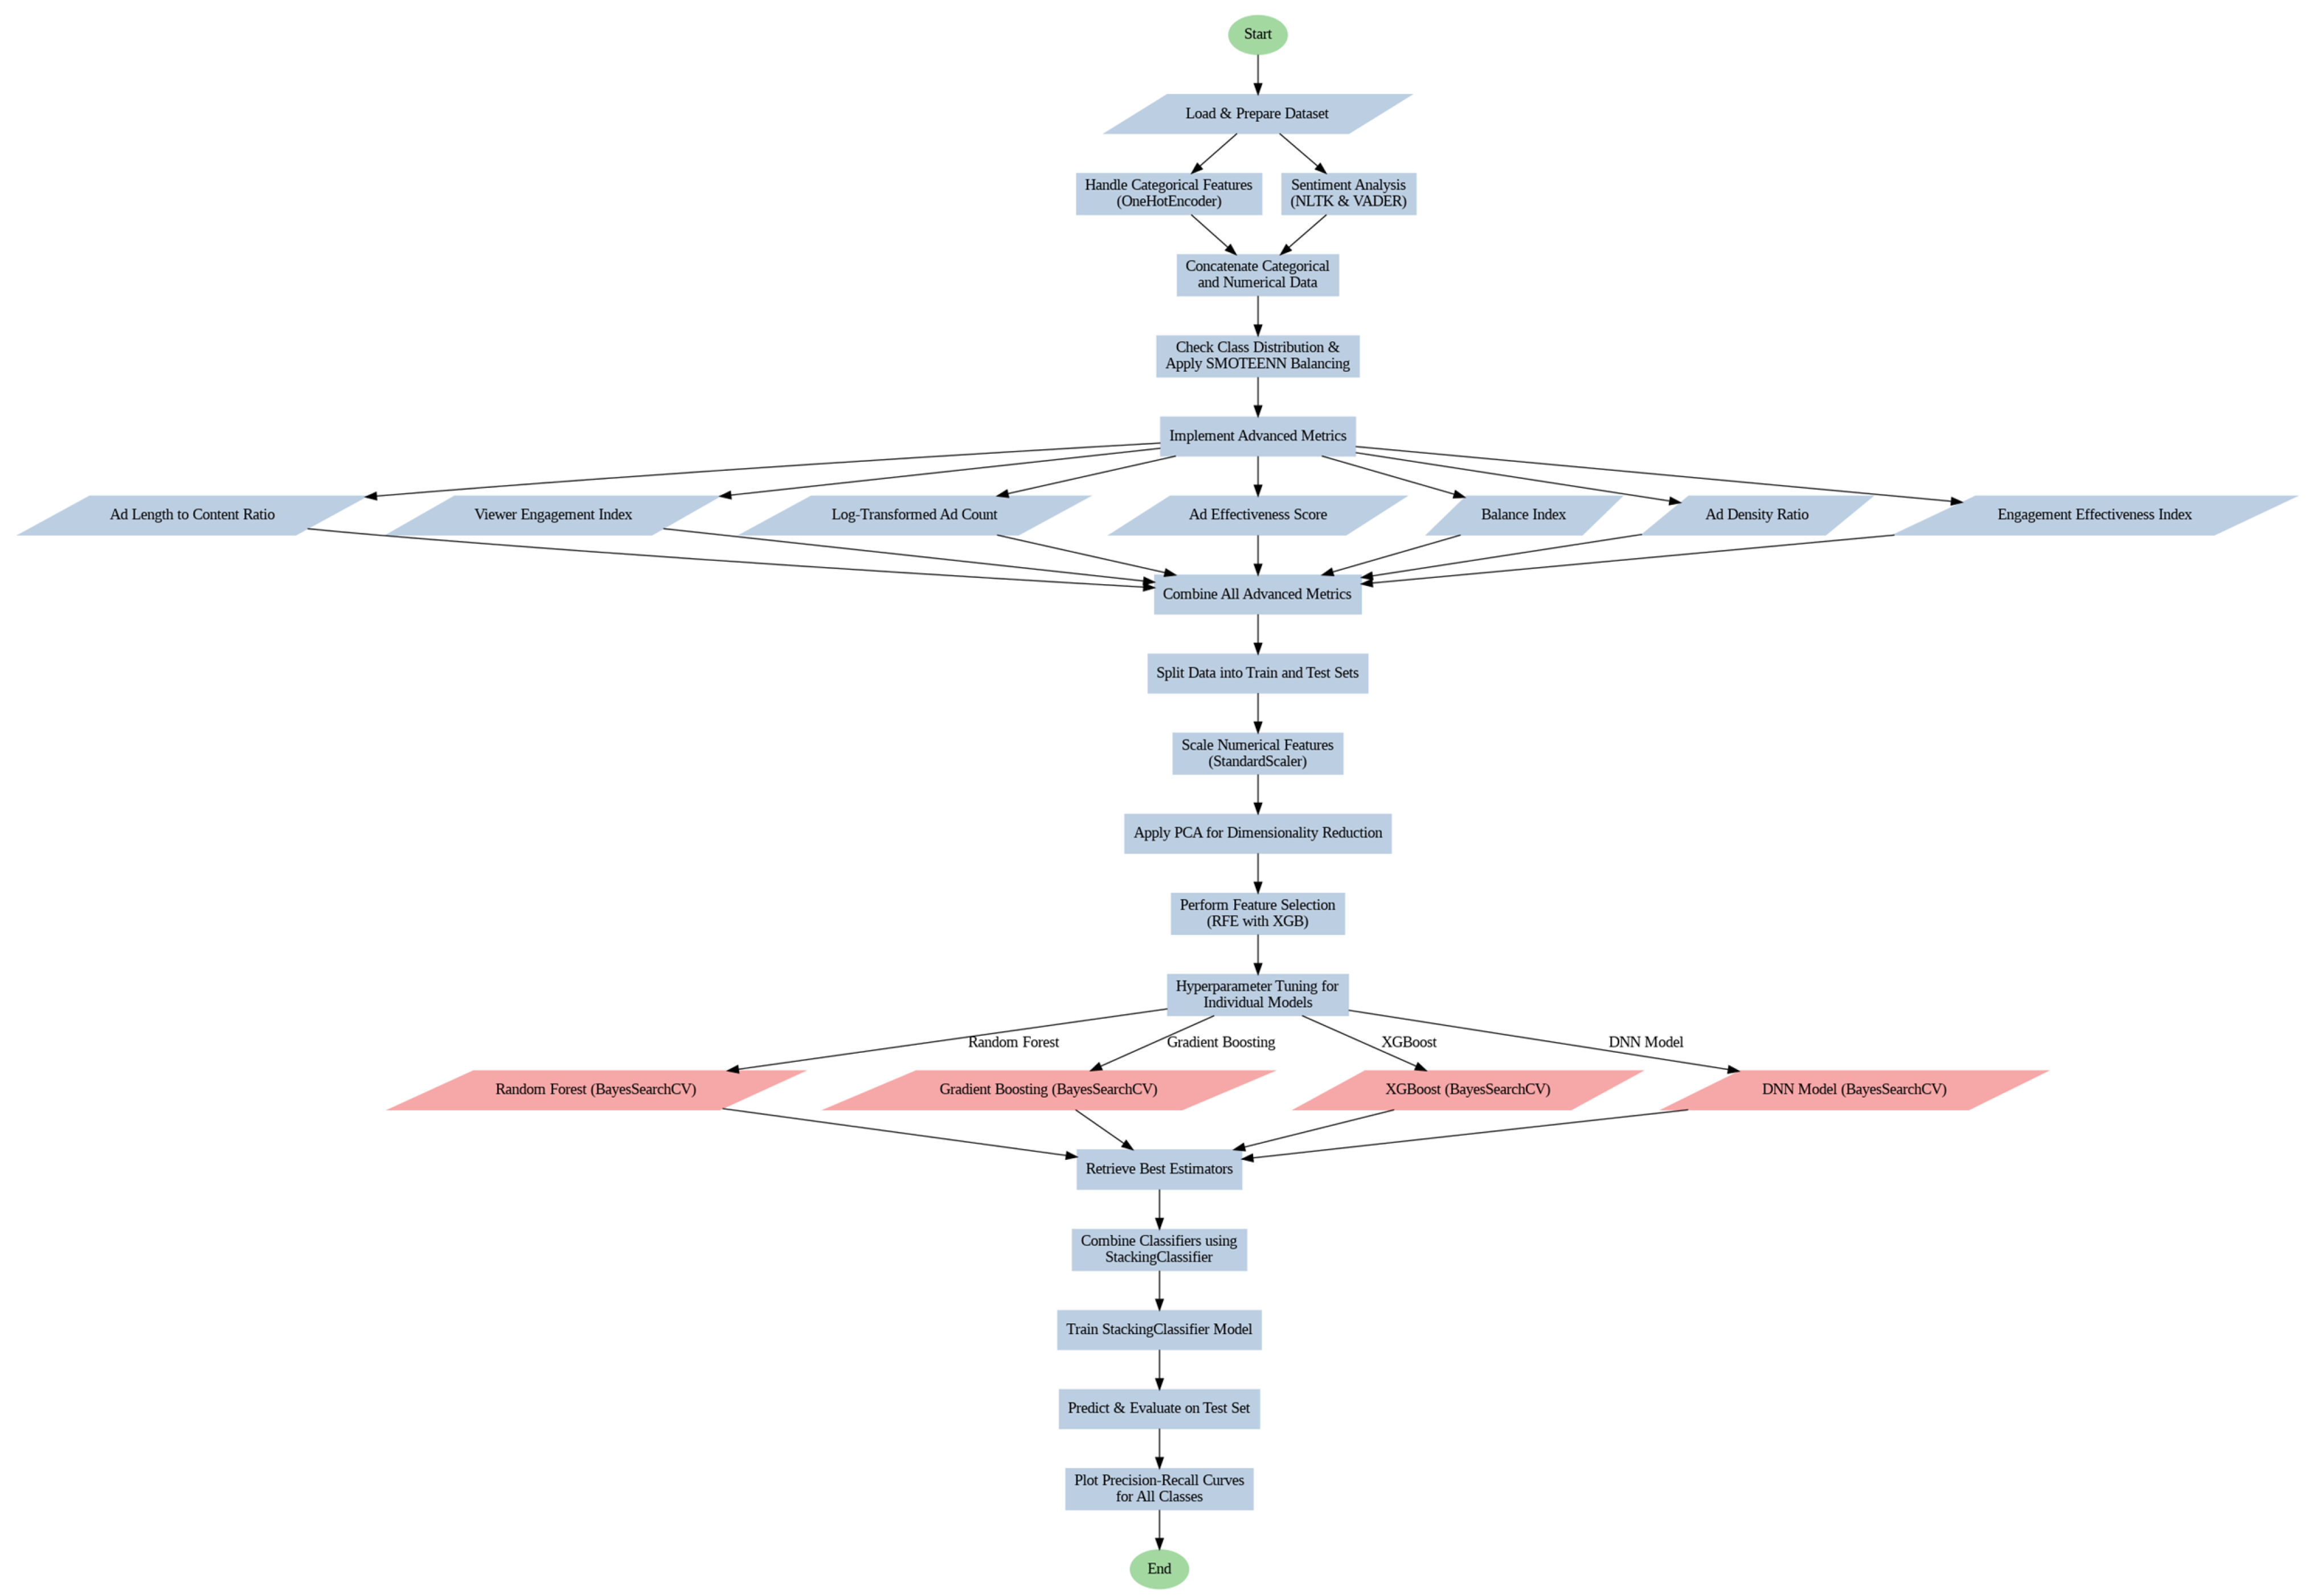
- 1.
-
Start
- Purpose: Start of the machine learning.
- 2.
-
Data Analysis (Node: Load & Prepare Dataset)
- Step: Prepare the dataset and perform Exploratory Data Analysis (EDA). We checked the dataset from any missing values, outliers, and data distributions.
- Missing Features Handling: We remove missing values and fill them with 0 to avoid problems during training. We address all the outliers through removal. Example: columns such as bitrate, ad.count_x, and content.length_x contain missing values or outliers, which are replaced with 0 or filled with mean/median.
-
We use two public datasets from YouTube Spam Collection by Alberto & Lochter [38] and Advertising Dataset from Elmetwally, n.d. [39]. They are used as an accuracy comparison with our collected data and our proposed approach. We use YouTube dataset to help us analyze user feedback and engagement patterns. And we use Advertising Dataset to show interactions and click-through rates pattern that may be beneficial for QoE.
- –
- The YouTube Spam Collection dataset by Alberto and Lochter [38] contains labeled comments from YouTube videos that differentiate between spam and not.
- –
- The Advertising Dataset by Elmetwally [39] on Kaggle contains advertisement data on social media with their metrics such as clicks and demographics.
- 3.
-
Data Augmentation (Node: Handle Categorical Features)
- Categorical Feature Encoding: We use it to convert columns using One-Hot Encoding or Feature Hashing. It transforms nominal and ordinal variables into binary for numerical processing. Example: a resolution column has values such as 720p, 1080p, and can be transformed into binary columns’ resolution_720p, resolution_1080p.
- Numerical & Categorical Merge: we combine encoded data with numerical columns such as bitrate, content.length_x, and customized metrics such as Ad Length to Content Ratio.
- 4.
-
Sentiment Analysis (Node: sentiment analysis)
- In the initial state of text preprocessing, user reviews or comments are prepared using NLTK [40]. The preparation includes text tokenizing, removing stop words, and standardizing word by stemming.
- VADER (Valence Aware Dictionary for Sentiment Reasoning) gives sentiment scores based on a predefined lexicon associated with valence scores. It is derived from human sentiment analysis and statistical research. For example, “hate” was assigned as a strong negative (e.g, -3.0) due to the common emotional intensity in language usage (Hutto & Gilbert, 2014 in [43]).
- The system modifies sentiment scores by contextual modifiers. For example, intensifiers (“really”) can reverse sentiment, and negations (“not”) can reverse it.
-
For instance:
- –
- “I hate these ads” has a compound sentiment score of -0.75, and has strong negativity.
- –
- “I really hate these ads!” amplifies the negative up to -0.9 due to the intensifier.
- –
- “I do not hate these ads” flips the score to +0.1 and modify negative sentiment with negation.
- VADER normalizes individual word scores to a compound value between -1 (most negative) and +1 (most positive). VADER is effective in social media sentiment analysis as compared to human raters.
-
Example:
- –
- “I hate these ads” yields a compound score of -0.75 (strong negative).
- –
- “I really hate these ads!” amplifies the negative sentiment to -0.9 due to the intensifier.
- –
- “I do not hate these ads” results in +0.1, reversing the negative sentiment.
- 5.
-
Feature Engineering (Node: Concatenate Categorical and Numerical Data)
- Once categorical features are encoded, they must be merged with existing numerical data for subsequent processing.
- Example: Columns such as content.length_x (numerical) and resolution_720p (encoded categorical) are combined into a single data frame.
- 6.
-
Class Imbalance Handling (Node: Check Class Distribution & Apply SMOTEENN Balancing)
- To handle class imbalance, we use SMOTE (Synthetic Minority Over-sampling Technique). SMOTE is used to create synthetic samples for minority classes to ensure a balanced training model.
- Example: Our collected data set has low-rated ads compared to high-rated ones. SMOTE generates synthetic samples for high-rated ads to balance the training set.
- 7.
-
Implement Advanced Metrics (Node: Implement Advanced Metrics)
- Traditional metrics to assess ads effect like click-through rates (CTR), user ratings failed to investigate the relationship between ads and engagement. They overlook aspects like the ratio between ad and content length and user interruption tolerance.
- The streaming platforms need to compromise between profit and user satisfaction; it is a necessity to develop more holistic metrics.
- Our goal is to validate proposed metrics: Log-Transformed Ad Count (LAC), Ad Effectiveness Score (AES), Emotional Valence Consistency (EVC), and Frustration Recovery Rate (FRR). They have the potential to enhance QoE inference accuracy in our collected dataset.
-
The dataset used for this research from wide range of culture, content and ads. We used two public datasets and several algorithms to ensure generalizability against our proposed approach. The experimental results of using proposed metrics can be seen in Table 4.
- (a)
-
Ad Effectiveness Score (AES): AES assess ad effectiveness by considering user ratings, burden of ad frequency and ad length. Equation 2 is used to determine AES:In equation 2 variable stars is the user’s rating. AdCount is the number of ads inserted in video. AdLength is ad length. ContentLength is the length of video content. AES offer a measure to tolerate between maximizing ad revenue and optimizing user satisfaction. From our collected data, users who consume more/longer ads were more likely to rate video poorly, non-linearly.
- (b)
-
Log-Ad Count (LAC) LogAdCount has a function to normalize ad count distribution to make the metric less susceptible due to outliers. Equation 3 is used to determine LAC:In equation 3 variable AdCount is the number of ads inserted in a video content. Without log transformation, the distribution of ad counts in a dataset is often heavily skewed. Most users seeing a few ads and a few users see a high number of ads unevenly. This skew can ruin the models. It makes a difficult assessment of true ad frequency influence on user behavior. The model becomes more robust to outliers and can generalize better across a wider range of ad counts by applying a log transformation, Accordingly, the predictions become more accurate. Without this adjustment, it would be biased towards users with lower ad exposure, resulting in inaccurate predictions in a real-world scenarios.
- (c)
-
Emotional Valence Consistency (EVC) Emotional Valence means positive or negative emotional experience. Consistency means a stable conditions of a user’s emotional state over time while watching. EVC is important due to the users who experience stable and positive emotions are more to have a better satisfaction. And frequent of emotional fluctuations may degrade perceived quality and lower ratings. Equation 4 is used to determine EVC:In equation 4 variable Var, a measure of dispersion, it represents selected engagement-related metrics variance. LEAE stands for Likely Engagement and Attention Estimation, AES stands for AdEffectivenessScore. AES measures the impact of ads and FER or perceived relevance. FER stands for Face Emotion Recognition score that fluctuate during watching over time. The variance of these metrics means how many fluctuations of user’s emotional experience over time. A low variance refers to consistent metrics and high EVC. If it has high fluctuation, it means unstable emotional and reduction of EVC. Consistency has relationship with positive QoE. Usually, a user who has positive and steady emotions will remain engaged, attentive, and without feeling fatigued, and will have the opportunity to give a higher rating. Emotional fluctuations may mean sudden change from satisfaction to annoyance that can degrade QoE. EVC helps predict which content has an enjoyable experience and maintains stable emotion.
- (d)
- LEAE (Likely Engagement and Attention Estimation) LEAE is used to assess content with ads effectiveness to capture and sustain user attention. In equation 5 variable AES means how ads align with user preferences, and LAC means ad exposure volume. Logarithm of AES means control of diminishing returns on ad relevance due to the most effective ads may reach saturation point. , , , refers to coefficients and · denote multiplication between the coefficients and variables. Targeted ads can improve QoE but in moderation by balancing relevance and quantity to avoid fatigue, as mentioned by Wojdynski and Evans in [41]. A high LEAE means ads are relevant and placed effectively, high QoE and user retention. LEAE important for ad strategies optimization in which it aligns with user preferences, QoE and business goals. Equation 5 is used to determine LEAE:
- (e)
-
Frustration Recovery Rate (FRR) FRR is a metric to assess user resilience on disruptive ad, especially on negative emotion and repeated ad occurrences. In formula 6, the variable FER examines user facial frustration. Variable repeat means the existence of repeated ads, with a value of 1 means there are repeated ads, and 0 indicating no repetition. A high FRR refers to positive maintained engagement, although there exist ad frustrations. In contrast, a low FRR means susceptibility to repeated negative interruptions and negative emotion that leads to a higher potential for abandonment. Liu-Thompkins in [43] claimed that there is a relationship between repetitive ads with user tolerance and frustration. If FRR is optimized, user retention and engagement will improve due to strategically reduced ad repetition with observed emotional cues over time. Equation 6 is used to determine FRR:In Equation 6, the variable LAC represents the logarithmic scale of the ad count. Ad.each.min refers to the existence of ad each minute. Higher value means high ad interruptions and may lead to user frustration.
- 8.
- Data Splitting (Node: Split Data into Train and Test Sets) The dataset was split into 20:80 Pareto ratio to improve objective assessment of model’s accuracy. For instance, 800 of 1000 rows were utilized for training while the remaining 200 were utilized for testing.
- 9.
- Feature Scaling (Node: Scale Numerical Features) The numerical features like bitrate and content length are scaled for consistency to certain ranges.
- 10.
- Dimensionality Reduction (Node: Apply PCA for Dimensionality Reduction) Principal Component Analysis (PCA) is applied to reduce complexity with maintain maximum variance to avoid overfitting. If there are 20 features, PCA will reduce it to 10 PCA and retain 95% variance.
- 11.
- Feature Selection (Node: Perform Feature Selection using RFE with XGB) We use XGBoost to select the most important features, reduce noise and enhance generalization.
- 12.
- Hyperparameter Tuning (Node: Hyperparameter Tuning for Individual Models) We use cross validation to tune hyperparameters including learningRate, treeDepth and regularization. We tune learningRate and maxDepth using Random Grid Search and Bayesian Optimization for search refining.
- 13.
- Model Training and Evaluation (Nodes: Model Training and Prediction) We combined them with stacking classifier and evaluated with metrics such as accuracy, F1-score, precision, and recall.
- 14.
- Model Explainability SHAP (Shapley Additive Explanations) is used to interpret how certain features impact predictions. Example: A model is trained using Stacking Classifier that combine ensemble learning technique to enhance accuracy by learning from other uniqueness [42].
4. Results
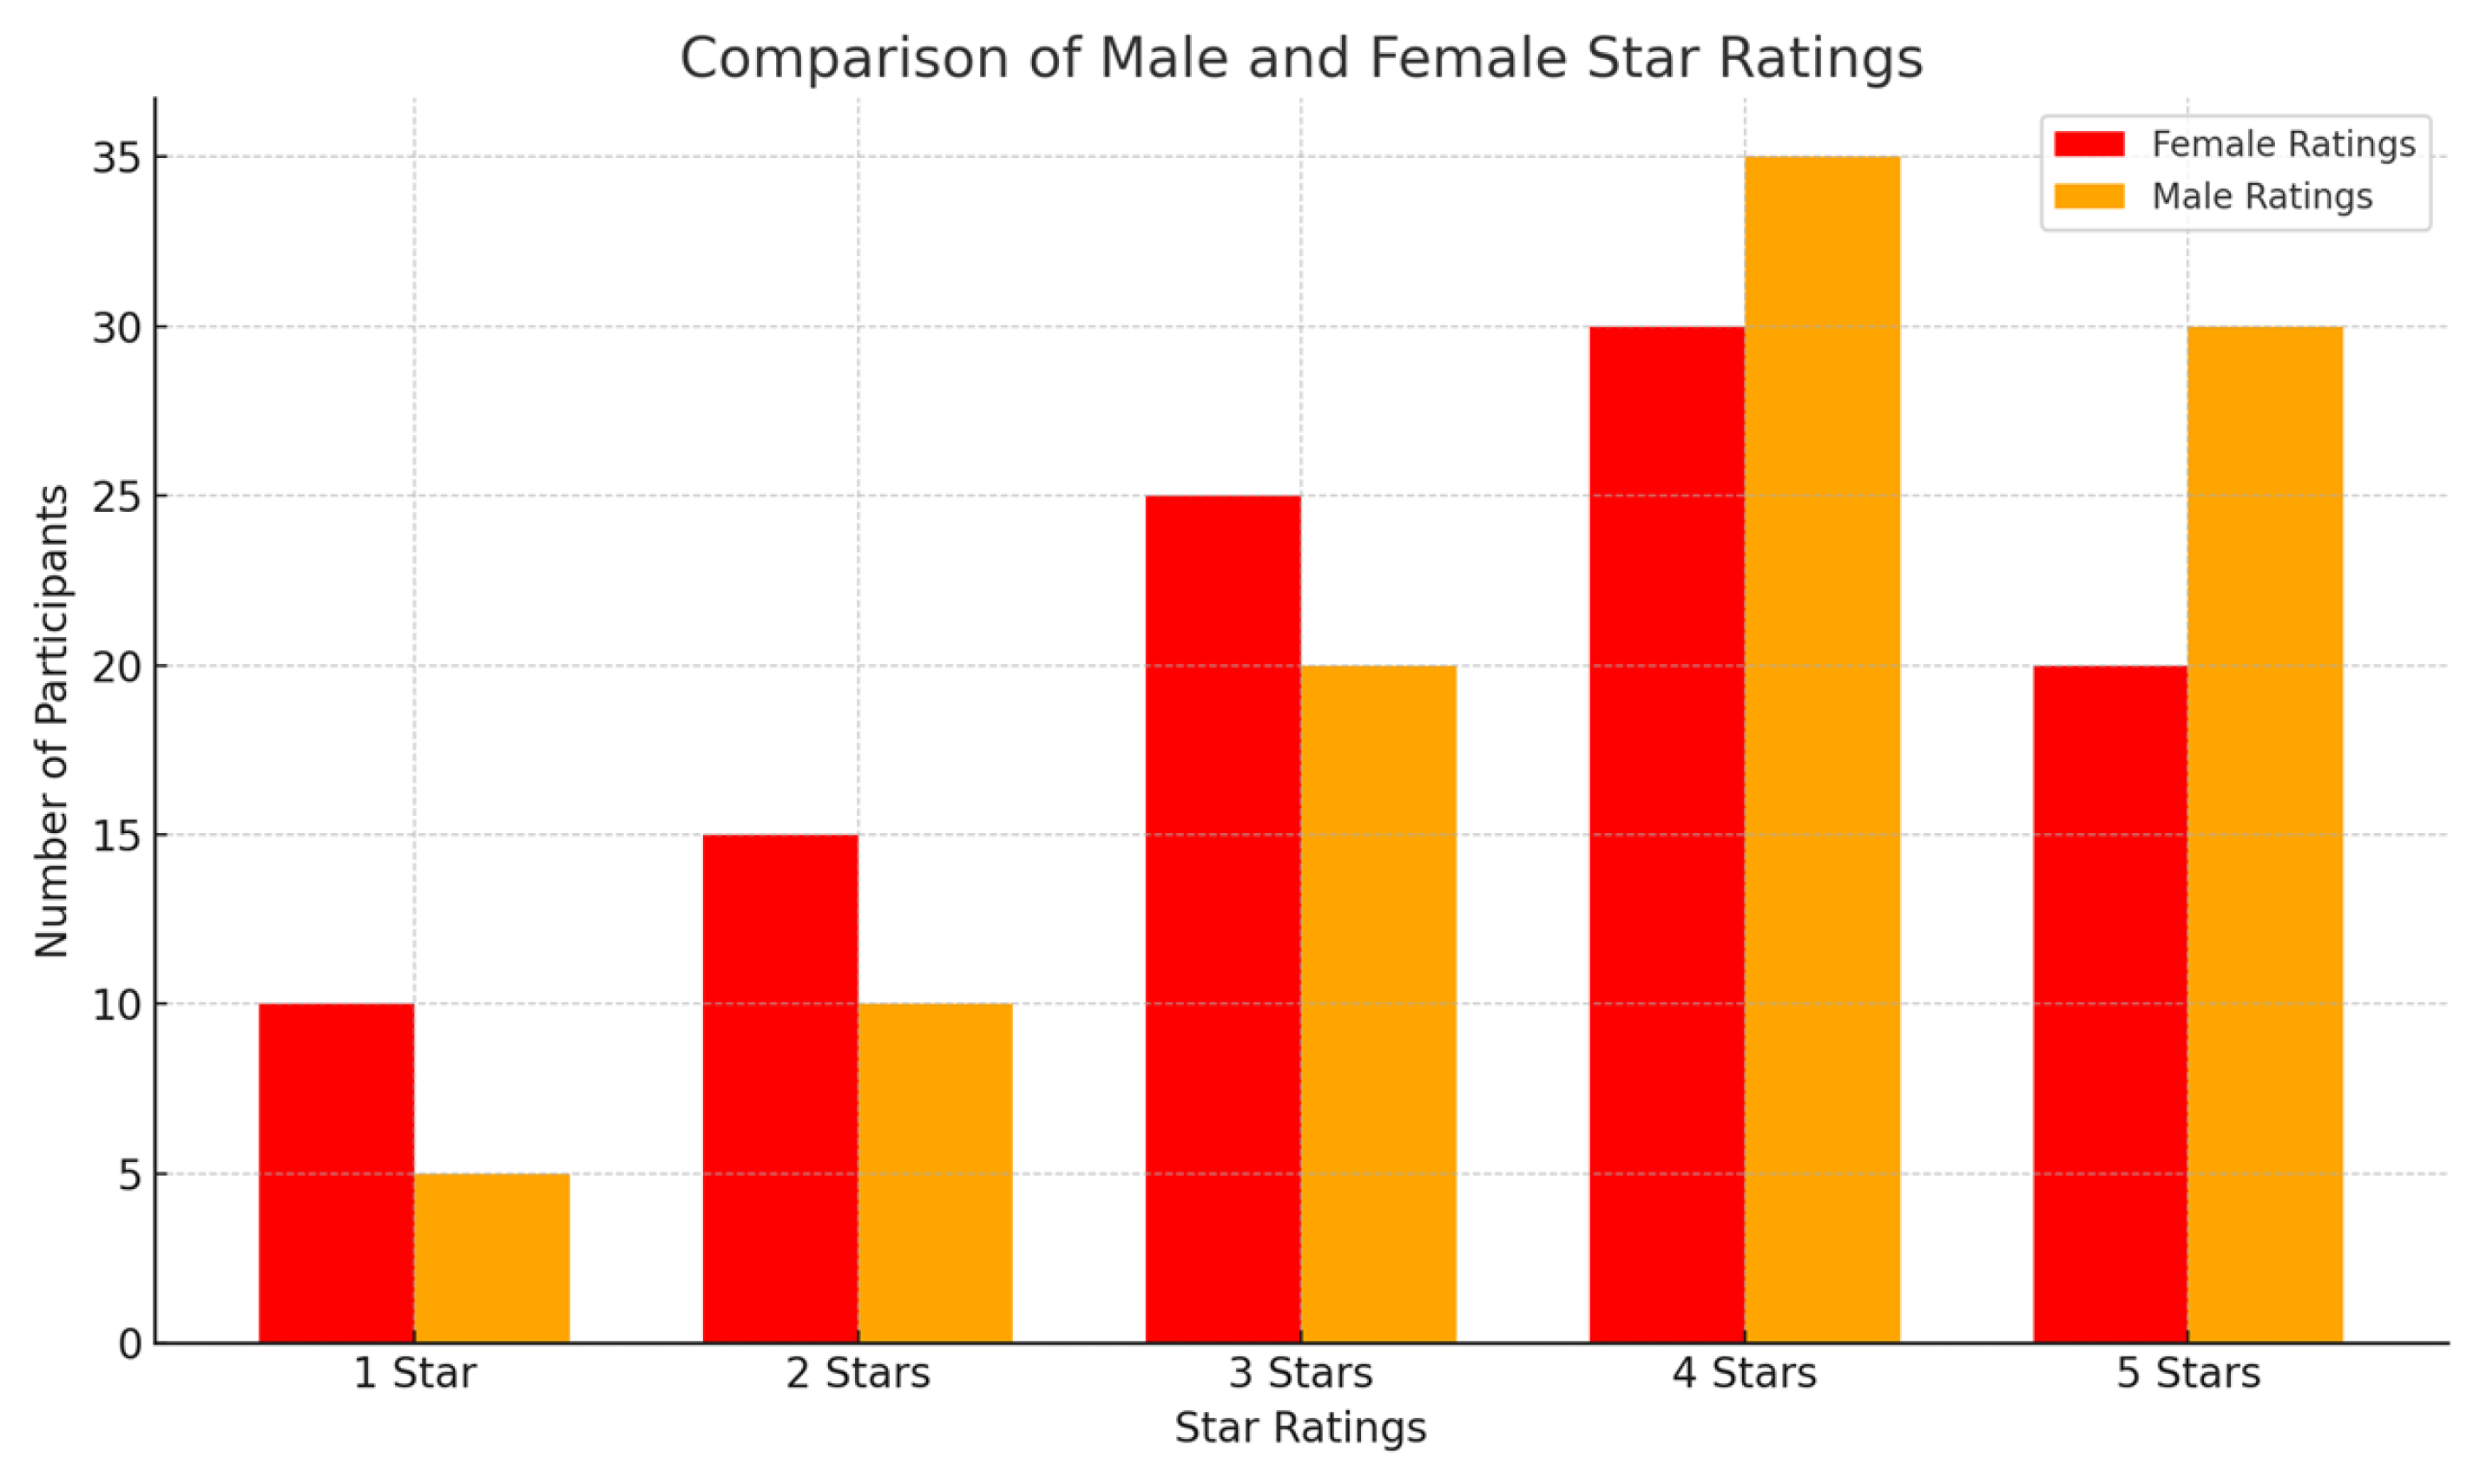
4.1. User Demography
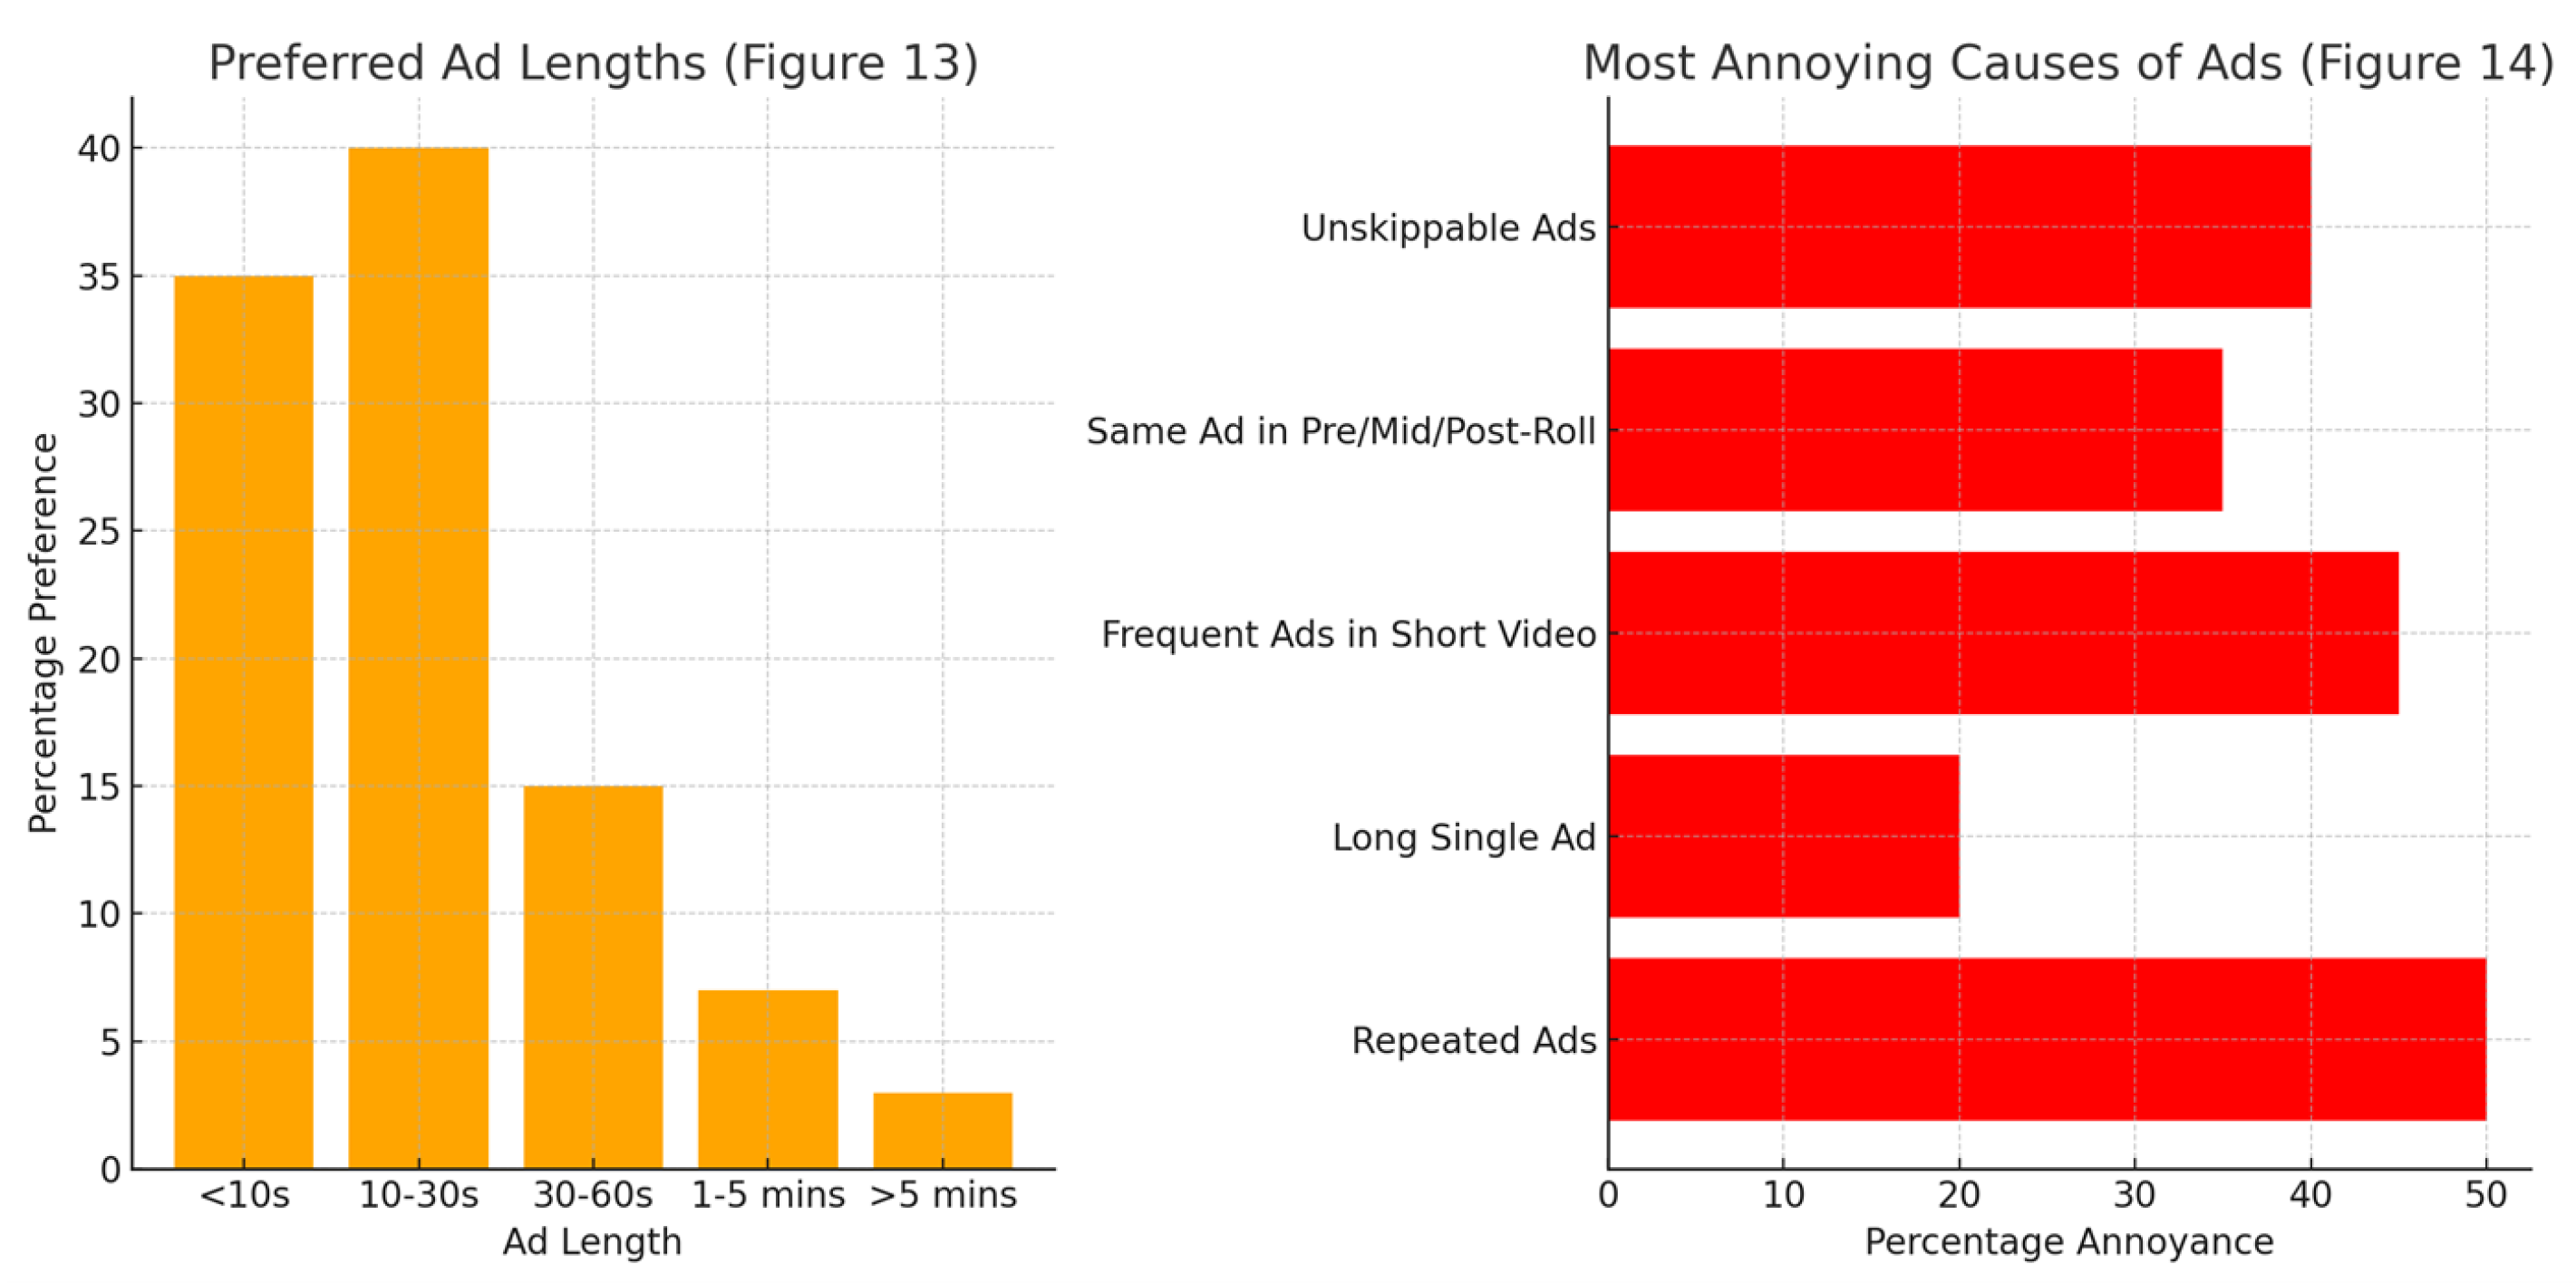
4.2. Questionnaire Results
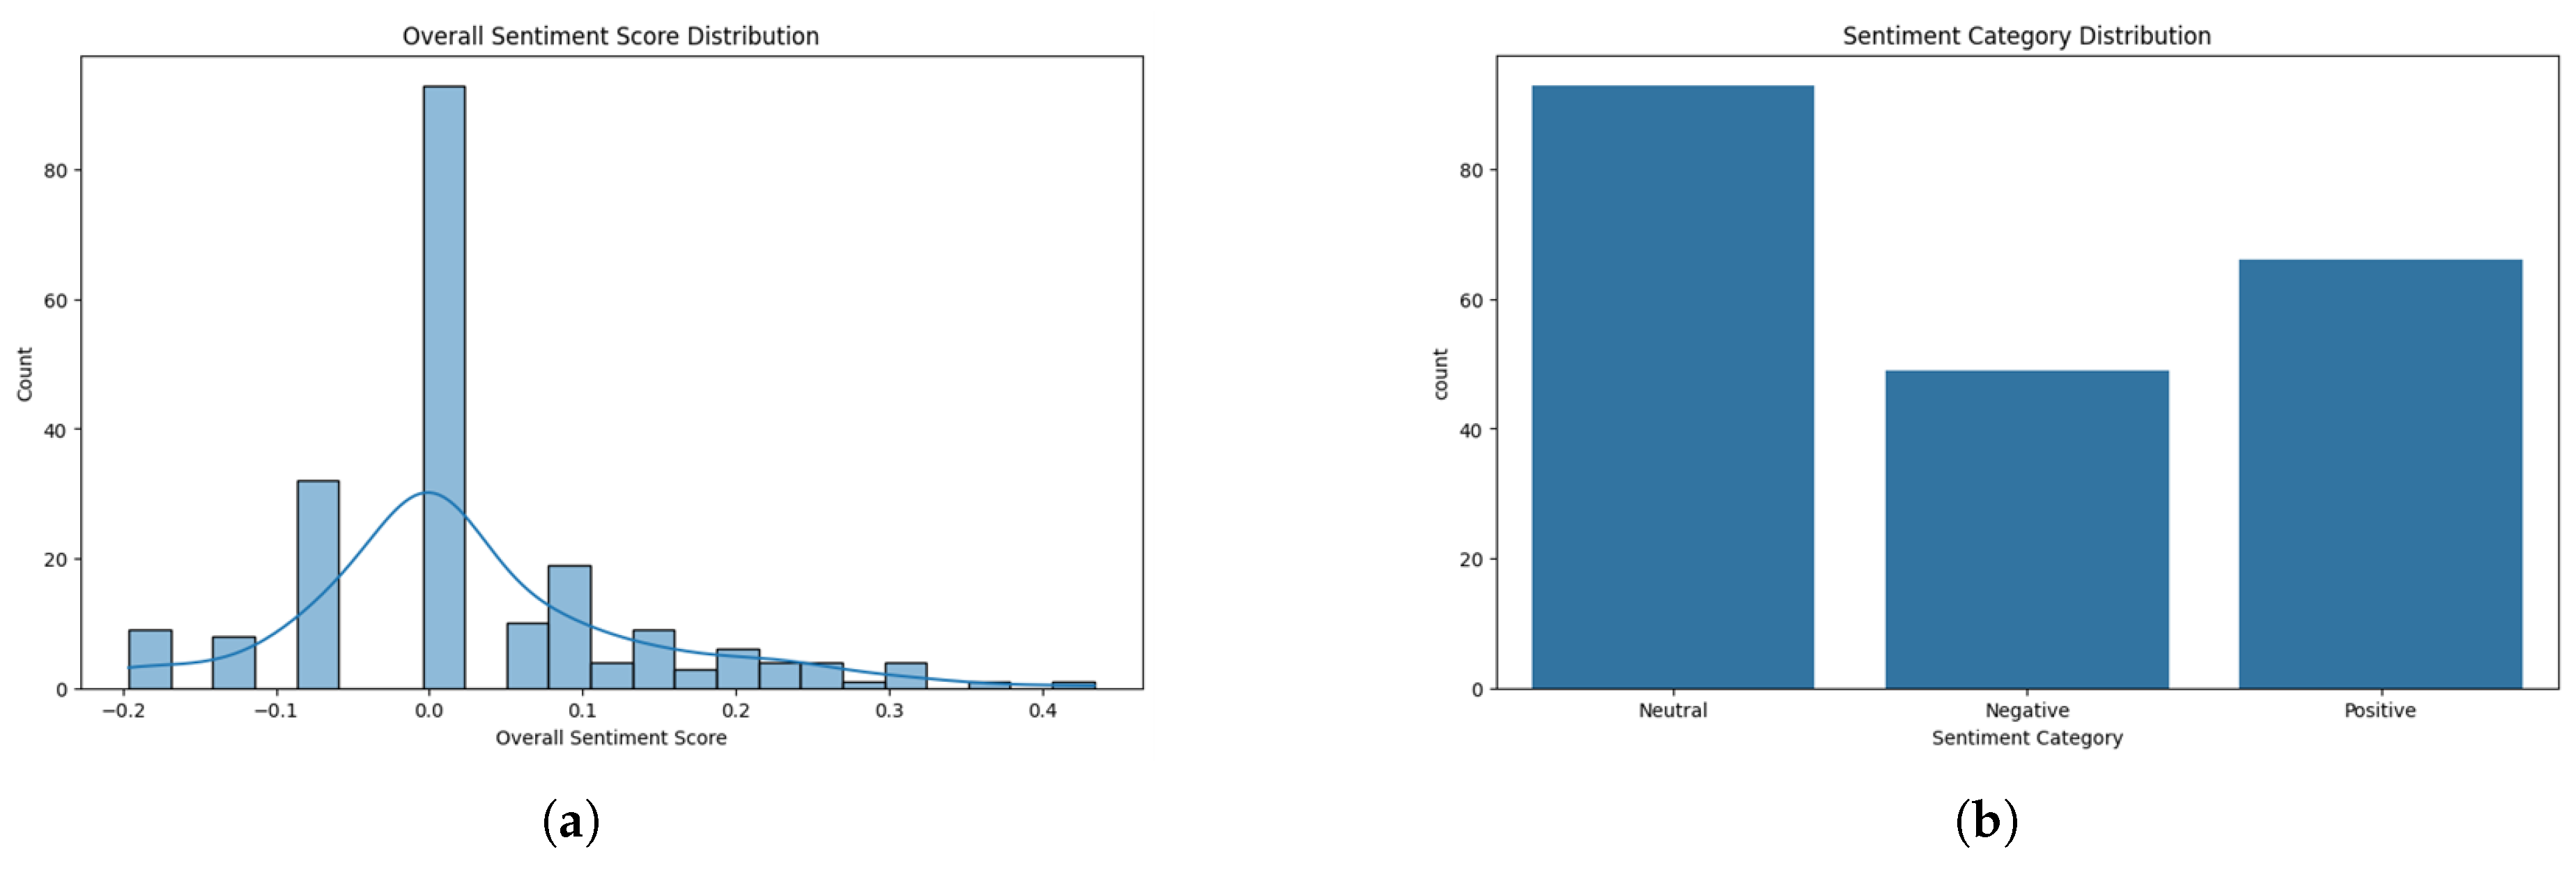
4.3. Sentiment Analysis (SA)
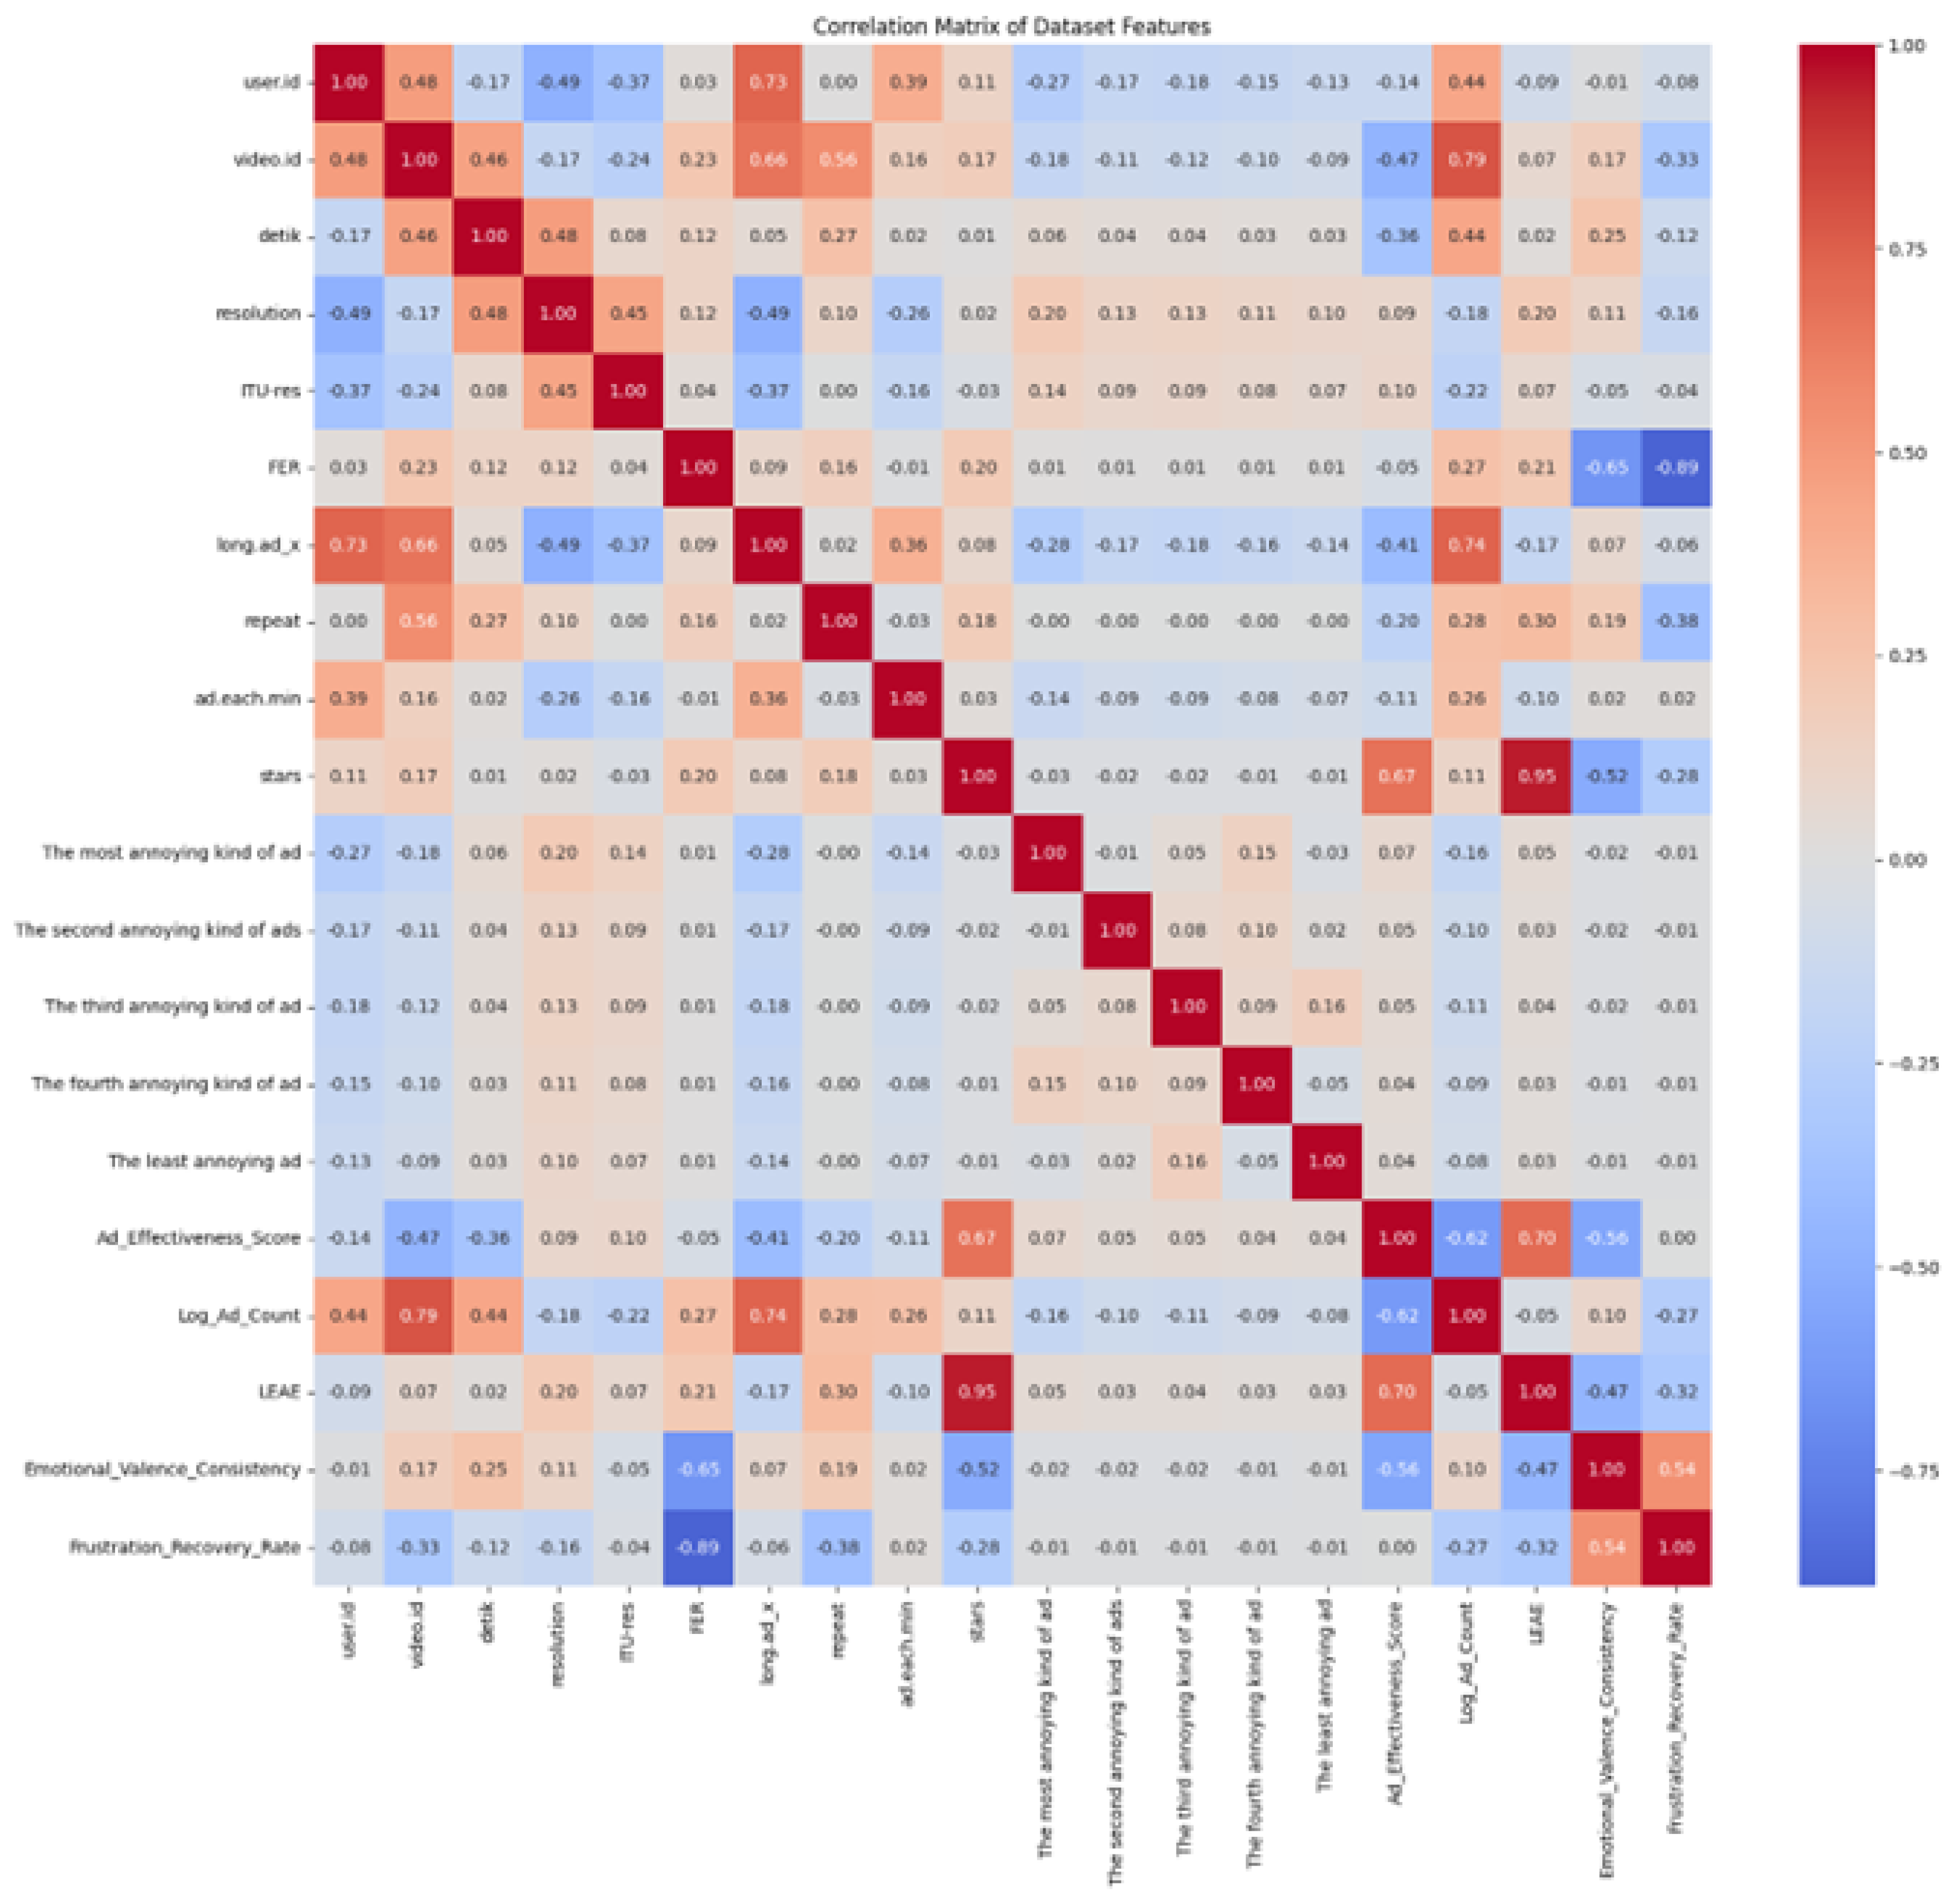
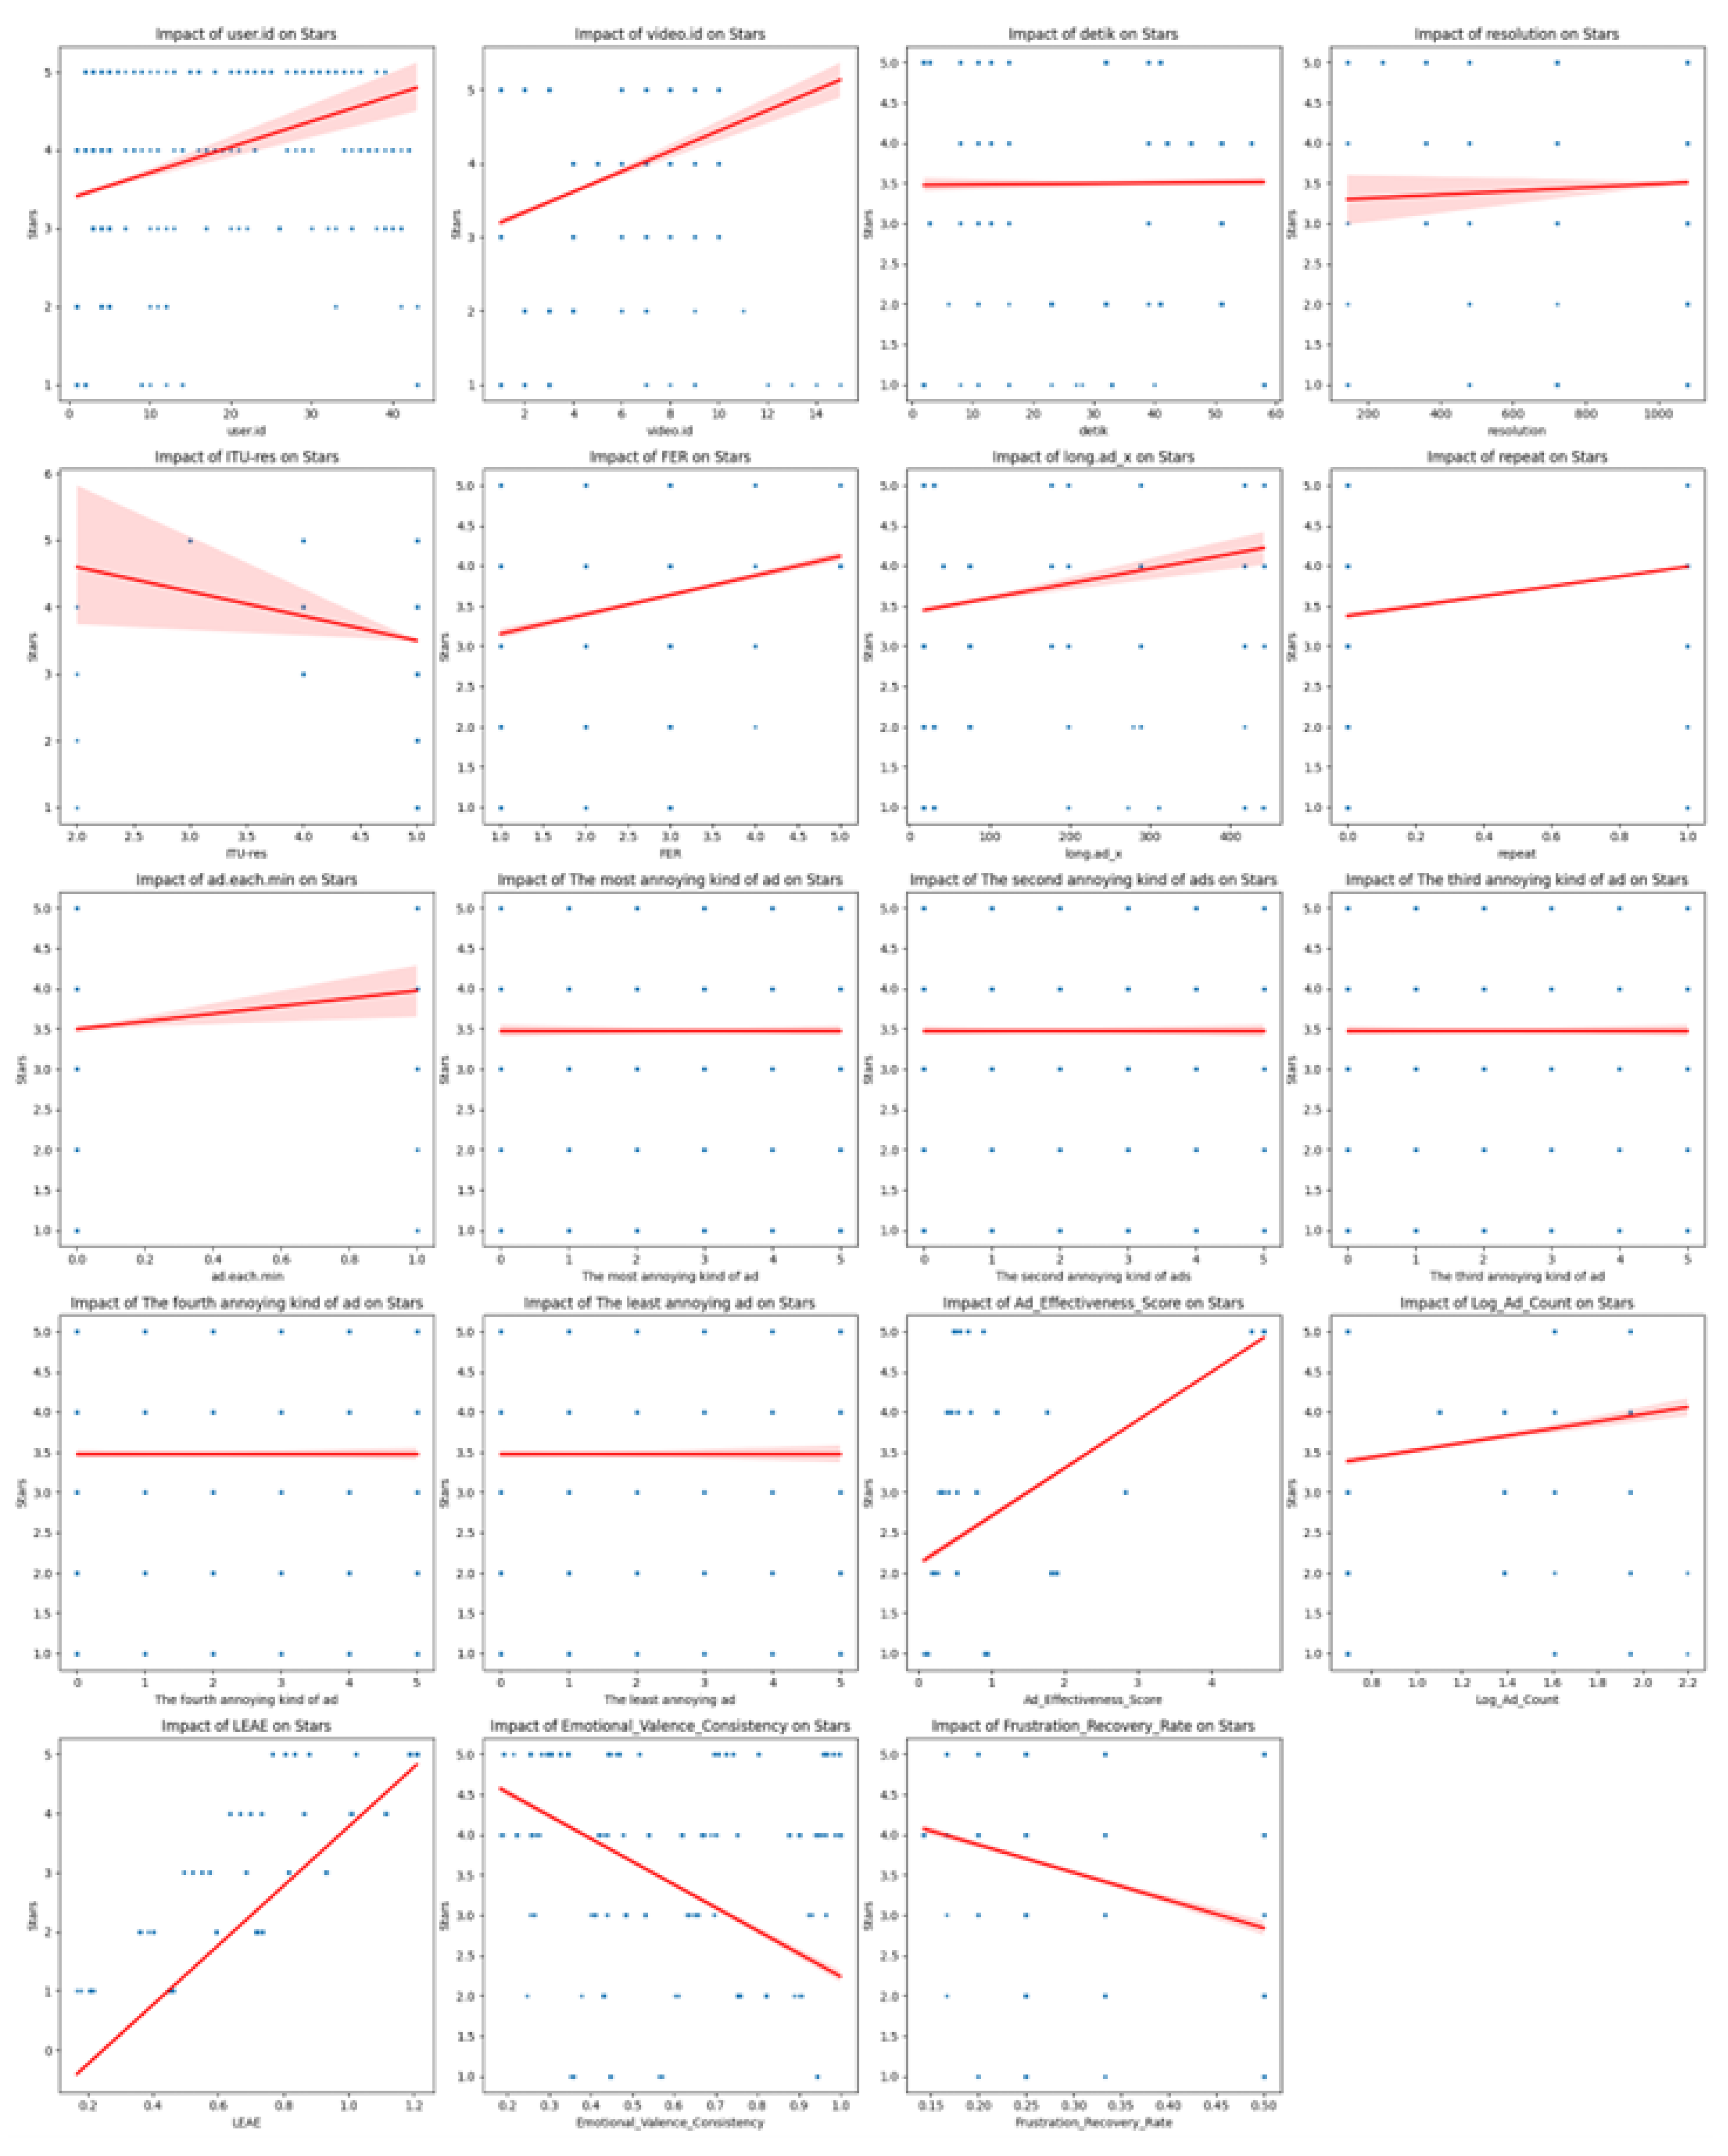
4.4. Data Analysis
4.5. Machine Learning Results

| Condition | Feature | Number of Samples |
|---|---|---|
| Class distribution before SMOTEENN | 1 | 95 |
| 2 | 64 | |
| 3 | 32 | |
| 4 | 13 | |
| 5 | 11 | |
| Class distribution after SMOTEENN | 1 | 95 |
| 2 | 95 | |
| 3 | 95 | |
| 4 | 95 | |
| 5 | 95 | |
| Features before PCA | Name, Title, Resolusi, Bitrate, Itu, Fer, ContentLength, AdCount, LongAd, AdLoc, Repeat, Long5minAd, AdEachMin, PreMidPostSameAd, NoSkip | |
| Features after PCA | PC | Top 3 Dominant Contributors |
| PC1 | Long5minAd (0.444), Name (-0.411), ContentLength (0.317) | |
| PC2 | Itu (0.441), Fer (-0.254), ContentLength (-0.346) | |
| PC3 | AdLoc (0.549), Title (0.453), Long5minAd (0.299) | |
| PC4 | PreMidPostSameAd (0.480), LongAd (0.325), Bitrate (0.357) | |
| PC5 | title (0.454), itu (-0.413), bitrate (-0.407) | |
| PC6 | adCount (0.627), repeat (0.487), fer (0.332) | |
| PC7 | preMidPostSameAd (0.493), bitrate (0.340), repeat (0.204) | |
| PC8 | resolusi (0.505), name (0.443), contentLength (-0.294) | |
| PC9 | adEachMin (0.445), preMidPostSameAd (0.382), contentLength (0.157) | |
| PC10 | longAd (0.550), noSkip (-0.469), adLoc (-0.341) | |
| PC11 | noSkip (0.484), adCount (0.368), long5minAd (0.275) | |
| PC12 | long5minAd (0.503), adEachMin (0.386), title (-0.293) | |
| Features before RFE | Name, Title, Resolusi, Bitrate, Itu, Fer, ContentLength, AdCount, LongAd, AdLoc, Repeat, Long5minAd, AdEachMin, PreMidPostSameAd, NoSkip | |
| Features after RFE | Resolusi, Title, Long5minAd, ContentLength, Name, Name, AdCount, PreMidPostSameAd, Repeat | |
| Algorithm | F1 score | Precision | Recall | Accuracy |
|---|---|---|---|---|
| Own Collected Dataset | ||||
| AELIX Base Model (without Advanced Matrices) | 0.937 | 0.929 | 0.952 | 0.95 |
| AELIX (With Advanced Matrices) | 0.985 | 0.985 | 0.985 | 0.99 |
| Random Forest | 0.861 | 0.825 | 0.904 | 0.9 |
| Random Forest (with advanced metrics) | 0.905 | 0.914 | 0.905 | 0.905 |
| Decision Tree | 0.862 | 0.893 | 0.857 | 0.86 |
| Decision Tree (with advanced metrics) | 0.975 | 0.976 | 0.975 | 0.974 |
| XGBoost | 0.888 | 0.881 | 0.905 | 0.9 |
| XGBoost (with advanced metrics) | 0.943 | 0.946 | 0.942 | 0.942 |
| DNN | 0.937 | 0.929 | 0.952 | 0.95 |
| DNN (with advanced metrics) | 0.977 | 0.978 | 0.978 | 0.978 |
| LSTM | 0.865 | 0.837 | 0.905 | 0.9 |
| LSTM (with advanced metrics) | 0.35 | 0.387 | 0.388 | 0.379 |
| GRU | 0.581 | 0.731 | 0.619 | 0.62 |
| GRU (with advanced metrics) | 0.272 | 0.357 | 0.275 | 0.368 |
| CNN | 0.839 | 0.837 | 0.857 | 0.86 |
| CNN (with advanced metrics) | 0.977 | 0.978 | 0.977 | 0.977 |
| Advertising Public Dataset (Elmetwally, T. (n.d.)) | ||||
| AELIX Base Model (without Advanced Matrices) | 0.8 | 0.802 | 0.8 | 0.8 |
| AELIX (With Advanced Matrices) | 0.9563 | 0.962 | 0.9563 | 0.96 |
| Random Forest | 0.9 | 0.912 | 0.9 | 0.9 |
| Random Forest (with advanced metrics) | 0.903 | 0.912 | 0.9 | 0.9 |
| XGBoost | 0.92 | 0.94 | 0.92 | 0.925 |
| XGBoost (with advanced metrics) | 0.903 | 0.912 | 0.9 | 0.9 |
| GRU | 0.7 | 0.701 | 0.7 | 0.7 |
| GRU (with advanced metrics) | 0.811 | 0.836 | 0.825 | 0.82 |
| CNN | 0.952 | 0.959 | 0.95 | 0.95 |
| CNN (with advanced metrics) | 0.952 | 0.959 | 0.95 | 0.95 |
| Decision Tree | 0.8571 | 0.88 | 0.85 | 0.85 |
| Decision Tree (with advanced metrics) | 0.928 | 0.943 | 0.925 | 0.93 |
| DNN | 0.877 | 0.882 | 0.875 | 0.875 |
| DNN (with advanced metrics) | 0.901 | 0.903 | 0.9 | 0.9 |
| LSTM | 0.69 | 0.733 | 0.675 | 0.68 |
| LSTM (with advanced metrics) | 0.872 | 0.872 | 0.875 | 0.88 |
| YouTube Comment Spam Public Dataset Shakira (Alberto, T., & Lochter, J. (2015)) | ||||
| AELIX Base Model (without Advanced Matrices) | 0.913 | 0.929 | 0.911 | 0.91 |
| AELIX (With Advanced Matrices) | 0.954 | 0.954 | 0.954 | 0.95 |
| Random Forest | 0.925 | 0.938 | 0.924 | 0.924 |
| Random Forest (With Advanced Matrices) | 0.901 | 0.921 | 0.898 | 0.9 |
| XGBoost | 0.937 | 0.946 | 0.937 | 0.937 |
| XGBoost (With Advanced Matrices) | 0.901 | 0.921 | 0.898 | 0.9 |
| GRU | 0.807 | 0.807 | 0.81 | 0.81 |
| GRU (With Advanced Matrices) | 0.756 | 0.755 | 0.759 | 0.76 |
| CNN | 0.851 | 0.863 | 0.848 | 0.848 |
| CNN (with advanced metrics) | 0.888 | 0.897 | 0.886 | 0.89 |
| Decision Tree | 0.875 | 0.881 | 0.873 | 0.881 |
| Decision Tree (with advanced metrics) | 0.863 | 0.872 | 0.861 | 0.86 |
| DNN | 0.874 | 0.876 | 0.873 | 0.873 |
| DNN (with advanced metrics) | 0.824 | 0.826 | 0.823 | 0.82 |
| LSTM | 0.805 | 0.808 | 0.81 | 0.81 |
| LSTM (with advanced metrics) | 0.776 | 0.782 | 0.785 | 0.78 |
| Meta-Learner | Precision | Recall | F1 Micro Average |
|---|---|---|---|
| Random Forest | 0.5349 | 0.5349 | 0.5349 |
| KNN | 0.3953 | 0.3953 | 0.3953 |
| SVM | 0.5116 | 0.5116 | 0.5116 |
| Decision Tree | 0.3488 | 0.3488 | 0.3488 |
| Gradient Boosting | 0.3488 | 0.3488 | 0.3488 |
| Logistic Regression | 0.9286 | 0.9524 | 0.9365 |
| Base Estimators | Precision | Recall | F1 Micro Average |
|---|---|---|---|
| RandomForest, GradientBoosting, XGBoost | 0.4601 | 0.5349 | 0.4854 |
| RandomForest, SVM, DecisionTree | 0.4512 | 0.5116 | 0.4694 |
| KNN, XGBoost, ExtraTrees | 0.6283 | 0.5349 | 0.518 |
| MLP, GradientBoosting, DecisionTree | 0.4718 | 0.5581 | 0.5009 |
| RandomForest, MLP, SVM | 0.4086 | 0.4651 | 0.427 |
| ExtraTrees, DecisionTree, GradientBoosting | 0.4305 | 0.4884 | 0.4475 |
| KNN, RandomForest, GradientBoosting | 0.6256 | 0.5581 | 0.5284 |
| SVM, XGBoost, ExtraTrees | 0.4718 | 0.5349 | 0.4913 |
| RandomForest, GradientBoosting, XGBoost, DNN | 0.9286 | 0.9524 | 0.9365 |
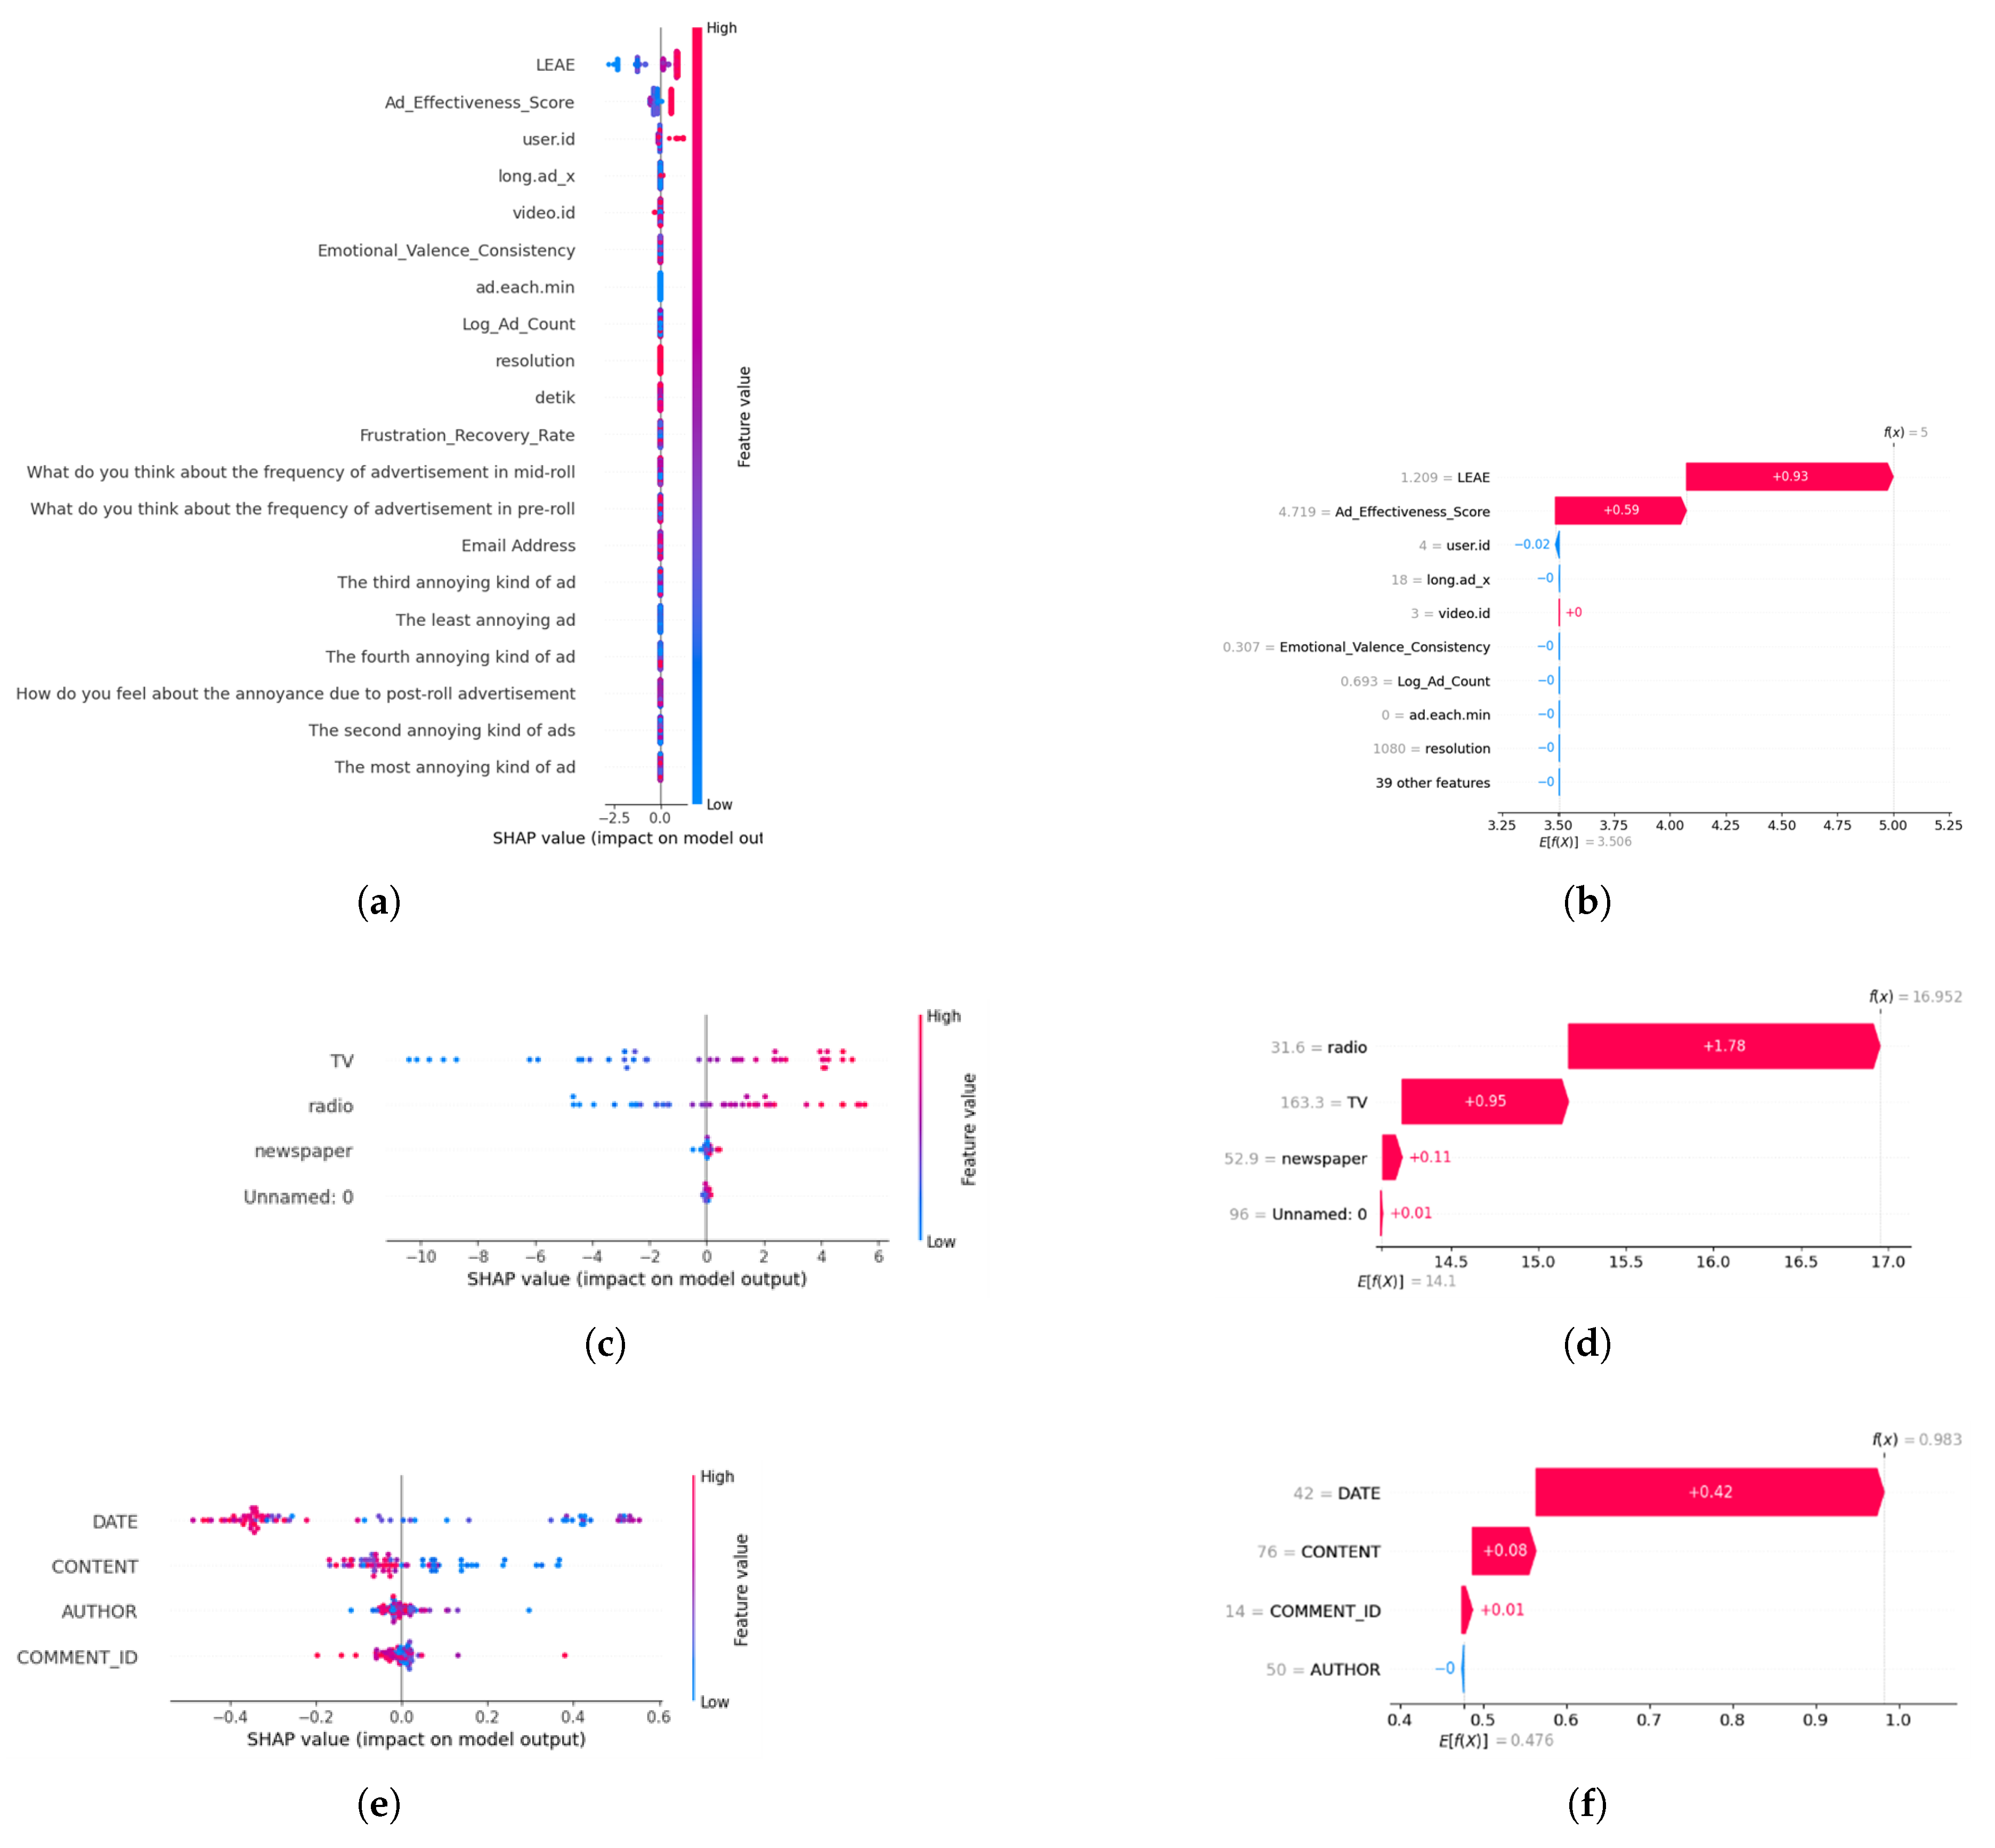
4.6. SHAP Results
4.7. Experimental Results Analysis
- 1.
- Research Question #1: Can integrating multimodal data sources (facial emotion recognition, video metadata, network conditions, and user feedback) provide more accurate QoE predictions compared to traditional methods? Finding: Yes it can. Our proposed AELIX can achieve a high accuracy of about 0.95 in QoE predictions utilizing face emotion, ads placement strategies, network statistics, and several advanced metrics and outperforming state-of-the-art models and standard ITU-T P.1203 by 55.3%. It can be done in real time so that the stakeholder can manage automatic strategies accordingly over time.
- 2.
- Research Question #2: How do different types of ads impact user engagement and emotional responses during video streaming? Finding: From our experimental results, mid-roll ads have the most impairment in QoE and user emotion, followed by pre-roll and post-roll ads. This finding supports our hypothesis that the timing and placement of advertisements significantly affect user satisfaction. consequently, a happy user can have more intense ads rather than an unhappy one.
- 3.
- Research Question #3: Can XAI techniques improve transparency and decision making for stakeholders in video streaming services? Finding: The usage of SHAP as one of XAI can provide better insights on the most influential factor that may affect QoE for more informed decision-making process.
5. Conclusions
Author Contributions
Funding
Institutional Review Board Statement
Acknowledgments
Conflicts of Interest
Appendix A
Appendix A.1
| No. | Questions | Possible Answers |
|---|---|---|
| Q1 | What do you think about the frequency of advertisement in pre-roll | Few/ Many/ Moderate/ None |
| Q2 | What do you think about the frequency of advertisement in mid-roll | Few/ Many/ Moderate/ None |
| Q3 | What do you think about the frequency of advertisement in post-roll | Few/ Many/ Moderate/ None |
| Q4 | Reduction of service experience due to pre-roll advertisement | Advertisement make video QoE better/ Extremely reduced/ Moderately/ Not at all/ Slightly reduced |
| Q5 | What do you think about the reduction of service experience due to mid-roll advertisement | Advertisement make video QoE better/ Extremely reduced/ Moderately/ Not at all/ Slightly reduced |
| Q6 | What do you think about the reduction of service experience due to post-roll advertisement | Advertisement make video QoE better/ Extremely reduced/ Moderately/ Not at all/ Slightly reduced |
| Q7 | How do you feel about the annoyance due to pre-roll advertisement | Extremely Annoying/ I am happy to watch pre-roll advertisement/ Moderately/ Neutral/ Not at all |
| Q8 | How do you feel about the annoyance due to mid-roll advertisement | Extremely Annoying/ I am happy to watch pre-roll advertisement/ Moderately/ Neutral/ Not at all |
| Q9 | How do you feel about the annoyance due to post-roll advertisement | Extremely Annoying/ I am happy to watch pre-roll advertisement/ Moderately/ Neutral/ Not at all |
| Q10 | What is your opinion about maximum acceptable advertisement length period | None/ less than 10s/ 10-30s/ 30-60s/ 1-5 minutes/ more than 5minutes |
| Q11 | Please reorder from the most annoying to the least | Many repeated advertisements in 1 point of time in mid-roll/ Single 5 minutes advertisement long in mid-roll/ in 5 minutes video content, every 1 minute there is one repeated ads/ Same ads repeatedly in pre, mid, post-roll/ There is no skippable ads |
Appendix A.2
| Timestamp | 2/28/2022 19:40 | 3/1/2022 0:53 | 3/5/2022 2:55 | 3/6/2022 20:51 | 3/7/2022 14:49 | 3/10/2022 16:13 | 3/14/2022 13:05 | 3/17/2022 22:34 | 3/20/2022 19:27 |
|---|---|---|---|---|---|---|---|---|---|
| Email Address | Ra***@gmail.com | 20**@uaeu.ac.ae | Ok**@gmail.com | Ra**@hotmail.com | Ro**@gmail.com | Mu**@gmail.com | Le**@gmail.com | Ka**@gmail.com | Tr**@gmail.com |
| What do you think about the frequency of advertisement in pre-roll | Few | Many | Most all time | Many | Few | Many | None | Most all time | Many |
| What do you think about the frequency of advertisement in mid-roll | Many | Many | Most all time | Many | Few | Many | Few | Most all time | Few |
| What do you think about the frequency of advertisement in post-roll | Some | Many | Some | None | Few | Many | Some | Many | Many |
| How bodily relaxed / aroused are you after watching first video (Title: How This Guy Found a Stolen Car!)? [(A) Relaxed - (B) Stimulated] | A | A | A | A | A | A | A | B | B |
| How bodily relaxed / aroused are you after watching first video (Title: How This Guy Found a Stolen Car!)? [(A) Calm - (B) Excited] | A | A | B | B | A | B | A | B | B |
| How bodily relaxed / aroused are you after watching first video (Title: How This Guy Found a Stolen Car!)? [(A) Sluggish - (B) Frenzied] | B | A | B | B | A | A | A | B | B |
| How bodily relaxed / aroused are you after watching first video (Title: How This Guy Found a Stolen Car!)? [(A) Dull - (B) Jittery] | A | A | B | A | B | A | A | B | B |
| How bodily relaxed / aroused are you after watching first video (Title: How This Guy Found a Stolen Car!)? [(A) Sleepy - (B) Wide Awake] | B | A | B | B | B | A | B | B | B |
Appendix A.3
| Content Title | Length of Content (s) | Number of Ad | Length of Ad (s) | Position of Ad |
|---|---|---|---|---|
| Expo 2020 Dubai | 280 | 1 | 18 | Post-roll |
| Squid game2 | 113 | 1 | 30 | Pre-roll |
| Every death game SG | 375 | 1 | 18 | Mid-roll |
| 5 metaverse | 461 | 3 | 75 | Pre, Mid, Post-roll |
| Created Light from Trash | 297 | 2 | 45 | Pre-roll |
| How this guy found a stolen car! | 171 | 6 | 288 | Pre, Mid, Post-roll |
| First underwater farm | 233 | 6 | 198 | Pre, Mid, Post-roll |
| Most beautiful building in the world | 166 | 6 | 292 | Mid-roll |
| This is made of...pee?! | 78 | 4 | 418 | Pre-roll |
| The most unexplored place in the world | 256 | 5 | 391 | Post-roll |
| Jeda Rodja 1 | 387 | 8 | 279 | Pre-roll |
| Jeda Rodja 2 | 320 | 8 | 440 | Pre, Mid, Post-roll |
| Jeda Rodja 3 | 415 | 6 | 272 | Pre, Mid, Post-roll |
| Jeda Rodja 4 | 371 | 6 | 311 | Post-roll |
| Jeda Rodja 5 | 376 | 6 | 311 | Mid-roll |
References
- International Telecommunication Union. Recommendation ITU-T P.1203.3, Parametric Bitstream-Based Quality Assessment of Progressive Download and Adaptive Audiovisual Streaming Services over Reliable Transport-Quality Integration Module. 2017. Available online: https://www.itu.int/rec/T-REC-P.1203.3/en (accessed on 28 March 2024).
- M, V. P. K.; Ghosh, M.; Mahapatra, S. No-reference video quality assessment from artifacts and content characteristics: A neuro-fuzzy framework for video quality evaluation. Multimedia Tools and Applications 2024, 83, 48049–48074. [Google Scholar] [CrossRef]
- Du, L.; Li, J.; Zhuo, L.; Yang, S. VCFNet: Video clarity-fluency network for quality of experience evaluation model of HTTP adaptive video streaming services. Multimedia Tools and Applications 2022, 81, 42907–42923. [Google Scholar] [CrossRef]
- Selma, T.; Masud, M. M.; Bentaleb, A.; Harous, S. Inference Analysis of Video Quality of Experience in Relation with Face Emotion, Video Advertisement, and ITU-T P.1203. Technologies 2024, 12, 5. [Google Scholar] [CrossRef]
- Ahmad, A.; Mansoor, A. B.; Barakabitze, A. A.; Hines, A.; Atzori, L.; Walshe, R. Supervised-learning-Based QoE Prediction of Video Streaming in Future Networks: A Tutorial with Comparative Study. IEEE Communications Magazine 2021, 59, 88–94. [Google Scholar] [CrossRef]
- Skaka-Čekić, F.; Baraković Husić, J. A feature selection for video quality of experience modeling: A systematic literature review. Wiley Interdisciplinary Reviews: Data Mining and Knowledge Discovery. 2023. [CrossRef]
- Kougioumtzidis, G.; Vlahov, A.; Poulkov, V. K.; Lazaridis, P. I.; Zaharis, Z. D. QoE Prediction for Gaming Video Streaming in O-RAN Using Convolutional Neural Networks. IEEE Open Journal of the Communications Society 2024, 5, 1167–1181. [Google Scholar] [CrossRef]
- Ligata, A.; Perenda, E.; Gacanin, H. Quality of Experience Inference for Video Services in Home WiFi Networks. IEEE Communications Magazine 2018, 56, 187–193. [Google Scholar] [CrossRef]
- Bulkan, U.; Dagiuklas, T.; Iqbal, M. Modelling Quality of Experience for Online Video Advertisement Insertion. IEEE Transactions on Broadcasting 2020, 66, 835–846. [Google Scholar] [CrossRef]
- Jones, N.; Hamby, A. It’s Written on Your Face: How Emotional Variation in Super Bowl Advertisements Influences Ad Liking. Journal of Advertising 2024, 53, 463–472. [Google Scholar] [CrossRef]
- Miranda, G.; MacEdo, D. F.; Marquez-Barja, J. M. Estimating Video on Demand QoE From Network QoS Through ICMP Probes. IEEE Transactions on Network and Service Management 2022, 19, 1890–1902. [Google Scholar] [CrossRef]
- Orsolic, I.; Skorin-Kapov, L. A Framework for in-Network QoE Monitoring of Encrypted Video Streaming. IEEE Access 2020, 8, 74691–74706. [Google Scholar] [CrossRef]
- Petrou, M.; Pradas, D.; Royer, M.; Lochin, E. Unveiling YouTube QoE Over SATCOM Using Deep-Learning. IEEE Access 2024, 12, 39978–39994. [Google Scholar] [CrossRef]
- Yin, J.; Chen, H.; Xu, Y.; Ma, Z.; Xu, X. Learning Accurate Network Dynamics for Enhanced Adaptive Video Streaming. IEEE Transactions on Broadcasting. [CrossRef]
- Zhou, G.; Luo, Z.; Hu, M.; Wu, D. PreSR: Neural-Enhanced Adaptive Streaming of VBR-Encoded Videos with Selective Prefetching. IEEE Transactions on Broadcasting 2023, 69, 49–61. [Google Scholar] [CrossRef]
- Zhang, Y.; Cheng, S.; Guo, Z.; Zhang, X. Inferring Video Streaming Quality of Real-time Communication inside Network. IEEE Transactions on Circuits and Systems for Video Technology. [CrossRef]
- Ye, J.; Qin, S.; Xiao, Q.; Jiang, W.; Tang, X.; Li, X. Adaptive Bitrate Algorithms via Deep Reinforcement Learning With Digital Twins Assisted Trajectory. IEEE Transactions on Network Science and Engineering 2024, 11, 3522–3535. [Google Scholar] [CrossRef]
- Wang, L.; Yu, Z.; Yu, H.; Liu, S.; Xie, Y.; Guo, B.; Liu, Y. AdaEvo: Edge-Assisted Continuous and Timely DNN Model Evolution for Mobile Devices. IEEE Transactions on Mobile Computing. [CrossRef]
- Sedlak, B.; Pujol, V. C.; Donta, P. K.; Dustdar, S. Equilibrium in the Computing Continuum through Active Inference. Future Generation Computer Systems 2024, 160, 92–108. [Google Scholar] [CrossRef]
- Laiche, F.; ben Letaifa, A.; Aguili, T. QoE-aware traffic monitoring based on user behavior in video streaming services. Concurrency and Computation: Practice and Experience 2023, 35. [Google Scholar] [CrossRef]
- Bartolec, I.; Orsolic, I.; Skorin-Kapov, L. Impact of User Playback Interactions on In-Network Estimation of Video Streaming Performance. IEEE Transactions on Network and Service Management 2022, 19, 3547–3561. [Google Scholar] [CrossRef]
- Gao, G.; Zhang, H.; Hu, H.; Wen, Y.; Cai, J.; Luo, C.; Zeng, W. Optimizing Quality of Experience for Adaptive Bitrate Streaming via Viewer Interest Inference. IEEE Transactions on Multimedia 2018, 20, 3399–3413. [Google Scholar] [CrossRef]
- van Kasteren, A.; Brunnström, K.; Hedlund, J.; Snijders, C. Quality of experience of 360 video—Subjective and eye-tracking assessment of encoding and freezing distortions. Multimedia Tools and Applications 2022, 81, 9771–9802. [Google Scholar] [CrossRef]
- Nguyen, M.; Vats, S.; van Damme, S.; van der Hooft, J.; Vega, M. T.; Wauters, T.; de Turck, F.; Timmerer, C.; Hellwagner, H. Characterization of the Quality of Experience and Immersion of Point Cloud Videos in Augmented Reality Through a Subjective Study. IEEE Access 2023, 11, 128898–128910. [Google Scholar] [CrossRef]
- Zhang, K.; Chuai, G.; Gao, W.; Liu, Q. Cellular QoE Prediction for Video Service Based on Causal Structure Learning. IEEE Transactions on Intelligent Transportation Systems 2023, 24, 7541–7551. [Google Scholar] [CrossRef]
- Wu, C.; Shao, S.; Tunc, C.; Satam, P.; Hariri, S. An Explainable and Efficient Deep Learning Framework for Video Anomaly Detection. Cluster Computing 2022, 25, 2715–2737. [Google Scholar] [CrossRef] [PubMed]
- Lundberg, S. M.; Lee, S. I. A Unified Approach to Interpreting Model Predictions. Advances in Neural Information Processing Systems 2017, 30. [Google Scholar]
- Zhang, M.; Qian, J.; Cao, J. How Video Cover Images Influence Pre-Roll Advertisement Clicks: The Value of Emotional Faces in Driving Attention to the Advertisement. Journal of Advertising Research 2023, 63, 349–369. [Google Scholar] [CrossRef]
- Shepelenko, A.; Kosonogov, V.; Shestakova, A. How Emotions Induce Charitable Giving: A Psychophysiological Study. Social Psychology 2023, 54, 261–270. [Google Scholar] [CrossRef]
- Zhou, F.; Yang, X. J.; de Winter, J. C. F. Using Eye-Tracking Data to Predict Situation Awareness in Real Time during Takeover Transitions in Conditionally Automated Driving. IEEE Transactions on Intelligent Transportation Systems 2022, 23, 2284–2295. [Google Scholar] [CrossRef]
- García-Torres, M.; Pinto-Roa, D. P.; Núñez-Castillo, C.; Quiñonez, B.; Vázquez, G.; Allegretti, M.; García-Diaz, M. E. Feature Selection Applied to QoS/QoE Modeling on Video and Web-Based Mobile Data Services: An Ordinal Approach. Computer Communications 2024, 217, 230–245. [Google Scholar] [CrossRef]
- Chawla, N. V.; Bowyer, K. W.; Hall, L. O.; Kegelmeyer, W. P. SMOTE: Synthetic Minority Over-Sampling Technique. Journal of Artificial Intelligence Research 2002, 16, 321–357. [Google Scholar] [CrossRef]
- Batista, G. E.; Prati, R. C.; Monard, M. C. A Study of the Behavior of Several Methods for Balancing Machine Learning Training Data. ACM SIGKDD Explorations Newsletter 2004, 6, 20–29. [Google Scholar] [CrossRef]
- Breiman, L. Random Forests. Machine Learning 2001, 45, 5–32. [Google Scholar] [CrossRef]
- Liaw, A.; Wiener, M. Classification and Regression by RandomForest. R News 2002, 2, 18–22. [Google Scholar]
- Friedman, J. H. Greedy Function Approximation: A Gradient Boosting Machine. Annals of Statistics 2001, 29, 1189–1232. [Google Scholar] [CrossRef]
- Chen, T.; Guestrin, C. XGBoost: A Scalable Tree Boosting System. In Proceedings of the 22nd ACM SIGKDD International Conference on Knowledge Discovery and Data Mining; 2016; pp. 785–794. [Google Scholar]
- Alberto, T.; Lochter, J. YouTube Spam Collection [Dataset]. UCI Machine Learning Repository. [CrossRef]
- Elmetwally, T. Advertising Dataset [Dataset]. Kaggle. Available online: https://www.kaggle.com/datasets/tawfikelmetwally/advertising-dataset.
- Budianto, A. G.; et al. Sentiment Analysis Model for KlikIndomaret Android App during Pandemic Using VADER and Transformers NLTK Library. 2022 IEEE International Conference on Industrial Engineering and Engineering Management (IEEM) 2022, pp. 281–286. [CrossRef]
- Wojdynski, B. W.; Evans, N. J. Going Native: Effects of Disclosure Position and Language on the Recognition and Evaluation of Online Native Advertising. Journal of Advertising 2016, 45, 157–168. [Google Scholar] [CrossRef]
- Wolpert, D. H. Stacked Generalization. In Neural Networks 1992, 5.
- Liu-Thompkins, Y. A Decade of Online Advertising Research: What We Learned and What We Need to Know. Journal of Advertising 2019, 48, 1–13. [Google Scholar] [CrossRef]
- Hutto, C.; Gilbert, E. VADER: A Parsimonious Rule-Based Model for Sentiment Analysis of Social Media Text. Proceedings of the International AAAI Conference on Web and Social Media 2014, 8, 216–225. [Google Scholar] [CrossRef]

| Study | Objective | Methodology | Metrics/Factors | Key Findings | Comparison to AELIX |
|---|---|---|---|---|---|
| Du et al.[3] | Assess HTTP adaptive streaming QoE | VCFNet: Network emphasizes on video clarity | Video clarity and effective QoE assessment based on these clarity | AELIX goes farther by including network conditions, ads, facial expression and clarity | |
| Hamby and Jones [10] | Examine the emotional range of commercials | study Super Bowl commercials | Emotional content | Emotions have a big impact on ad selection. | For optimal ad placements, AELIX records psychological responses in real time |
| Kougioumtzidis et al. [7] | Estimate VR QoE in O-RAN | using deep learning in VR-specific QoE | VR specific QoE measurement, deep learning accuracy | Effective QoE prediction is demonstrated in VR | AELIX use deep learning to cover general case |
| Nguyen et al. [24] | Investigate QoE and engagement in AR | Subjective evaluation | User feedback, engagement | Offers insights into user point of views in AR | AELIX utilizes subjective evaluation, network conditions and face emotion |
| Shepelenko et al. [29] | Investigate relationship between emotion and charitable giving | Psychophysiological measurements | Emotional responses | Emotions has strong relationship with user behavior | AELIX uses emotion to optimize QoE and ad placement |
| Wu et al. [26] | Video anomaly prediction | Explainable deep learning | Anomaly detection, model transparency | Achieves transparency and anomaly detection in high accuracy | AELIX focuses on QoE estimation transparency via SHAP |
| Zhang et al. [25] | Causal structure learning for Cellular QoE inference | Causal structure learning | cellular networks QoE | Cellular network QoE causal prediction accurately | AELIX uses causal learning to propose advanced metrics |
| Zhang et al. [28] | Effect of cover images on ad clicks | Face investigation for cover images | Emotional cues | Emotional faces improve ad engagement | AELIX use emotional responses for better ad strategy |
| Zhou et al. [30] | Estimate awareness with eye-tracking | Eye-tracking assessment in Real-time | Awareness | Real-time data predicts awareness precisely | AELIX uses face emotion in a real-time manner to plan for strategy |
| Ahmad et al. [5] | future network QoE estimation | Supervised learning | Various QoE factors | QoE supervised learning comparative study | AELIX uses several supervised learning for a better inference |
| Bartolec et al. [21] | User interactions effect on streaming performance | In-network prediction | User interactions | User interactions has high relationship with performance | AELIX use real-time user feedback and network statistics |
| Bulkan et al. [9] | Model QoE for video commercial strategy | Statistical modeling | Ad insertion and frequency | Ads have a high effect on QoE | AELIX uses ad, network statistics and emotion recognition |
| Gao et al. [22] | Improve QoE in adaptive bitrate streaming | Viewer interest inference | Viewer preferences, adaptive bitrate | Inferring viewer preferences improve QoE | AELIX uses emotion, content related information and user feedback |
| García-Torres et al. [31] | video and web QoS/QoE modeling | Feature selection, ordinal modeling | QoS/QoE features | accurate feature selection improves QoE modeling | AELIX applies feature selection that related to accurate QoE inference |
| van Kasteren et al. [23] | Investigate 360 video QoE | Subjective and eye-tracking evaluation | Encoding and freezing impairment | Encoding and freezing affect QoE | AELIX uses real-time emotion and user feedback |
| Ye et al. [17] | Adaptive bitrate model with deep reinforcement learning | Digital twins-assisted trajectory | Adaptive bitrate | Deep reinforcement learning improve bitrate model | AELIX uses deep learning and ensemble learning |
| Zhang et al. [16] | Estimate real time video streaming quality | Network communication assessment | Video streaming quality | real-time quality estimation | AELIX investigate real-time network condition |
| Grading Value | Estimated Emotion | Estimated Quality |
|---|---|---|
| 5 | Happy | Excellent |
| 4 | Surprise | Good |
| 3 | Neutral | Fair |
| 2 | Sad | Poor |
| 1 | Disgust, anger, fear | Bad |
| Category | Precision | Recall | F1 Micro Average |
|---|---|---|---|
| Without PCA and RFE | 0.8462 | 0.8462 | 0.8462 |
| Without PCA | 0.92 | 0.9 | 0.8889 |
| Without RFE | 0.92 | 0.9 | 0.8889 |
| Without SMOTEENN | 0.4601 | 0.5349 | 0.4854 |
| Without SMOTEENN + PCA | 0.4601 | 0.5349 | 0.4854 |
| Without SMOTEENN + RFE | 0.4601 | 0.5349 | 0.4854 |
| Without SMOTEENN + PCA + RFE | 0.4601 | 0.5349 | 0.4854 |
| With SMOTEENN + PCA + RFE | 0.9286 | 0.9524 | 0.9365 |
Disclaimer/Publisher’s Note: The statements, opinions and data contained in all publications are solely those of the individual author(s) and contributor(s) and not of MDPI and/or the editor(s). MDPI and/or the editor(s) disclaim responsibility for any injury to people or property resulting from any ideas, methods, instructions or products referred to in the content. |
© 2025 by the authors. Licensee MDPI, Basel, Switzerland. This article is an open access article distributed under the terms and conditions of the Creative Commons Attribution (CC BY) license (http://creativecommons.org/licenses/by/4.0/).


