Submitted:
02 February 2025
Posted:
03 February 2025
You are already at the latest version
Abstract
The shell of Ostreoidea is specific among that of bivalves, as it comprises many crystal microstructures and crystal textures. This stems from the fact that into the basic shell structure, consisting of columnar, foliated, granular calcite and myostracal aragonite, voids are incorporated: the pores of the vesicular segments and the blades/laths of the chalk lenses. Furthermore, cementation to uneven-surfaced substrate requires the formation of corrugated shell morphologies and adjustments of crystal organization for the generation of convex/concave shell surfaces.
We investigated the shell of Magallana gigas, Ostrea stentina, Ostrea edulis (Ostreidae) and Hyotissa hyotis, Hyotissa mcgintyi, Neopycnodonte cochlear (Gryphaeidae) with high-resolution, low-kV, electron backscatter diffraction (EBSD) measurements and scanning electron microscopy (FE-SEM) imaging. From a crystallographic perspective we, (i) characterized the sub-micrometer crystal assembly of ostreoid microstructures and textures, (ii) investigated crystal organization at the changeover from one microstructure into the other, and (iii) examined how curved crystal surfaces are generated at inner shell surface and within the shell, in and at aggregations of folia. We show that Ostreoidea are capable to secrete, within the same shell, single crystalline, graded and polycrystalline calcite, the latter with almost random orientation. We demonstrate that Ostreoidea myostracal aragonite is twinned, while Ostreoidea calcite is not twinned, neither the calcite within the different microstructures, nor the calcite at the changeover from one microstructure into the other. We highlight the very specific microstructure of the foliated shell and demonstrate the strongly regulated gradedness of both, the c- and a*-axes orientation of the foliated calcite crystallites.
Keywords:
microstructure of oyster shells
; texture of oyster shells
; high-resolution EBSD
; misorientation between crystals
; turbostratic texture
; crystal twin formation
1. Introduction
Ostreoidea appeared in the Triassic and comprise a superfamily with a long paleontological record [1,2,3]. Ostreoidea evolved into ecologically very successful marine organisms and have today a global distribution across a wide range of salinities and habitats [4,5]. Ostreoidea colonize intertidal to subtidal, marine to brackish environments [3,6]; nonetheless, some species (Neopycnodonte zibrowii Gofas, Salas and Taviani 2009) extend into deep water, up to about 2000 m water depths [6,7].
The shells of Ostreoidea are composites of biopolymers and minerals (e.g. [3,8,9,10,11,12]). The biopolymer component is present in the shell (i) as a network between the crystallites, (ii) as thick membranes encasing the columns, (iii) as an organic glue surrounding the cementation granules and, only for the Ostrea sp., (iv) as an organic layer incorporating an assembly of rhombohedral crystals [13].
The superfamily of Ostreoidea comprises the families Gryphaeidae (foam oysters) and Ostreidae (true oysters) [12,14,15]. Species of both families form their shell of low-Mg calcite and myostracal and ligament aragonite [16,17,18]. In this regard, the Ostreoidea are specific among bivalves. While species of many bivalve families secrete for shell formation aragonite or superimposed layers of aragonite and calcite, Ostreoidea use calcite for shell generation, disregarding the myostracal and ligament aragonite [3,19].
Below an outermost thin organic periostracum [17], Ostreoidea secrete six Ca-carbonate microstructures. The bulk of the Ostreoidea shell consists of foliated calcite (e.g. [16,17,18,19,20,21,22]), complemented, however, along the external surface of both valves, though particularly the right one, with a seam of columnar calcite [16,23,24], and, along sections of the proximal surface of the lower valve, with a cementation layer comprising granular calcite [4,25,26,27]. The muscle attachment sites, myostraca, are formed of prismatic aragonite. The columnar, foliated, granular calcite and myostracal, prismatic, aragonite microstructures generate compact shell layers. However, Ostreoidea incorporate voids into their shell; a further structural characteristic that is specific for these bivalves. Ostreidae incorporate large volumes of a meshwork of wavy calcite blades and laths into the foliated shell, forming the chalk lenses [17,19,28]. Gryphaeidae incorporate lenses of submicrometer- to micrometer-sized pores within the foliated shell [13].
The Ostreoidea have life spans of about 10 years, up to a maximum of 20 years. Nonetheless, they form thick shells within a few years [29]. This can be achieved by incorporating large volumes of cavities into the structural material of the shell; a unique strategy developed, among bivalves, only by the Ostreoidea for producing in short time thick and robust shells [30]. The chalk and the vesicular lenses have irregular extensions and varying thicknesses within the shells. In shell cross-sections, the growth lines are widely spaced between the foliated layer and the chalk or between the foliated layer and the vesicular microstructure. This indicates a higher thickening speed for the cavity-rich microstructures, relative to the speed of thickening of the foliated material [12,22]. In addition, it is also demonstrated that the chalk assists with its cavity-rich structural plasticity the attachment of the oyster shell to uneven-surfaced substrates (e.g. [31] and references therein).
In the study presented here we summarize and review crystallographic aspects for all types of crystals and crystal units that we observe, so far, for Ostreoidea shells. The latter are ideal for understanding the morphological, crystallographic and organizational diversity of biologically secreted Ca-carbonate crystals, as the compact Ostreoidea shell layers comprise not only the five main microstructures (columnar, foliated, granular, prismatic (the myostraca) and rhombohedral (the latter the Ostreidae only)), but also the cavity-rich assemblies of the chalk blades and laths in the Ostreidae and the fractal-shaped dendritic polyhedral crystals, surrounding the vesicular pores in the Gryphaeidae. In addition, due to this huge diversity in crystal shapes, types and organizational patterns, Ostreoidea shells are best suited for examining the crystallographic nature at the changeover from one microstructure into the other. We find five transitions between adjacent crystal assembly patterns. Disregarding the aragonite of the myostraca, all Ostreoidea shell microstructures are formed of only one Ca-carbonate polymorph, calcite, hence, there is no delimitation between adjacent microstructures in form of, e.g. a biopolymer membrane, as it is often the case when the shell is formed of superimposed layers of calcite and aragonite [32]. Accordingly, the changeover from one microstructure into the other is, to a large degree, controlled for Ostreoidea shells by crystallographic aspects of the relevant crystals and microstructures.
The foliated shell layer with its specific microstructure and outstanding texture is topologically related to all other shell microstructures. Accordingly, for understanding the shell as a structural entity, one major aim of this study, it is essential to assess the crystallographic-structural attributes of all types of shell-forming crystals and crystal units as well as of the microstructures these generate. Crystallographic characteristics of crystals and their assemblies are best characterized with diffraction methods, X-ray diffraction or electron backscatter diffraction (EBSD) carried out with a scanning electron microscope (SEM) or a transmission electron microscope (TEM). The advantage of X-ray diffraction analysis for structure determination is that the measurement covers a large section of the sample [21,24,32,33], however, it determines the texture of the material and does not render its microstructural characteristics. Electron backscatter diffraction measures and visualizes both the microstructure and the texture of the material in question, nonetheless, high-resolution individual EBSD scans cover small sample portions, relative to sample sections that can be examined with XRD measurements. However, the advantage of EBD measurements is that, in addition to texture determination, many crystallographic attributes, e.g. the mode and degree of misorientation between crystals, crystal morphology, degree of interlinkage and many more are obtained. These can be related to the observed texture patterns and, even though, in general, smaller sample sections are scanned, the mode of crystal organization can be better assessed and understood. In addition, EBSD measurements render very local, very small-scaled, crystallographic-structural attributes as well, in comparison to what is obtained with XRD measurements.
When EBSD is carried out conventionally with an SEM-EBSD system, an acceleration voltage of 20 kV is used. This gives a minimal space resolution between 300 and 400 nm. The foliated calcite of Ostreoidea shells consists of parallel arrays of 200 to 400 nm thick, 2-4 µm wide and up to 20 µm long folia (e.g. this study and [20,21,28]). The columnar, granular, blade/laths-shaped, fractal-dendritic and prismatic crystals are topologically related to the foliated shell. Hence, for high-quality EBSD measurements, as it is required for the crystallographic characterization of the foliated, granular and chalk structures, EBSD data acquisition must be conducted with a space resolution of 100 to 200 nm. A space resolution of 300-400 nm is not fine scaled enough for deciphering on the nm range crystallographic and structural aspects of the crystals.
We performed for this study low kV electron backscatter diffraction (EBSD) measurements on adult Ostreidae and Gryphaeidae shells. Measurements were conducted with an acceleration voltage below 20 kV, down to very few kV’s, as described for biological carbonates [34]. This renders a space resolution, depending on the used kV, of 100 to 200 nm. We performed for this study EBSD measurements at 15, 12, even at 8 kV and investigated shell crystal microstructure and texture for: the Ostreidae Magallana gigas (Thunberg, 1793), Ostrea stentina Payraudeau, 1826, Ostrea edulis Linnaeus, 1758 and the Gryphaeidae Hyotissa hyotis (Linnaeus, 1758), Hyotissa mcgintyi (H. W. Harry, 1985) and Neopycnodonte cochlear (Poli, 1795). EBSD results were complemented with FE-SEM micrographs, taken on fractured surfaces. As our study is conducted on very small-scale levels, we wanted to ensure that the structural information is not distorted by etching artefacts, hence, we did not image etched shell surfaces.
The following questions led to the present study:
- Do we find a comparable diversity in crystal texture in Ostreidae shells, as observed for the microstructures?
- How are crystallographic axes of crystals organized at the transition between adjacent microstructures? Is there continuity or discontinuity in crystallographic axes orientation between adjacent microstructures?
- How are the round surfaces of the pores accomplished within the shells?
- How is a convex and concave shell surface generated with foliated crystal units?
- How can we address the nature of the foliated shell layer texture?
Accordingly, subsequently, we characterize the nanometer scale internal structure of the shell forming crystals and crystal units, address their microstructure, address their texture and describe the degree and mode of misorientation between the crystals and the crystal units. Based on results gained from the latter we demonstrate (i) crystallographic axes discontinuity and some continuity between adjacent microstructures, (ii) the mode of crystallographic axes organization at the change from one microstructure into the other and (iii) discuss possible determinants for the changeover from one shell structure into the other, such as crystal twinning, gradation in crystal orientation or oriented nucleation. (v) We address the very specific texture of the foliated shell layer and discuss for the latter possible texture modes, such as: an axial texture, a turbostratic texture or a spherulitic texture. (v) We illustrate, from a structural point of view, the accomplishment of curvature within the shells as well as at shell inner surface.
Sample Preparation for FE-SEM Imaging and EBSD Measurements
The shells were cut transversely. Shell pieces were embedded into epoxy resin and several mechanical grinding and polishing steps were performed on them. The final polishing, consisting of etch-polishing with colloidal alumina, with ∼0.06 μm particle size, was performed using a vibratory polisher. EBSD measurements required 4-6 nm of carbon coating, while for FE-SEM imaging samples were coated with 5 nm Pt/Pd.
EBSD Measurements and Data Analysis
A Hitachi SU5000 field emission SEM, equipped with an Oxford Instruments Nordlys II EBSD detector, was used to perform the measurements. The SEM operation during measurements was mainly at 12 and 15 kV, for some measurements at 8 kV. We discuss six Ostreoidea species. In order to understand the structure of the shell well, we performed 12 to 14 EBSD measurements per species.
For Kikuchi indexing, the Oxford Instruments CHANNEL 5 and AZTec Crystal software were used. Most measurements were done with increments of 100 to 200 nm, for none of the measurements was the step size higher than 300 nm. This ensured very high indexing rates, over 95%. The latter is necessary for understanding the foliated calcite arrangements and the nature of the transitions from one microstructure into the other.
Terminology
This study uses the terms: crystallites, crystals, crystal units, mesocrystals, assemblies of crystallites and assemblies of crystals.
The idealized concept of a crystal or of a crystallite refers to a structure in which matter is arranged in a perfectly regular, periodically repeating spatial pattern. The latter is the crystal lattice, which extends coherently in all directions over the space occupied by the crystal.
For the crystals discussed in this study, the crystal lattice is 3-dimensional. Real crystals develop during their growth, imperfections, e.g. incorporate impurities, adopt dislocations. Due to these real crystals implement small-angle grain boundaries, e.g. at arrays of dislocations and at these boundaries the crystal lattice takes a slightly different orientation [35]. Accordingly, real crystals consist of subunits and these are tilted to each other by a small angle, for which an upper limit of 10° is often used [35]. These subunits are termed mosaic blocks or mosaic domains.
We regard the foliated units to be mesocrystals. A mesocrystal is defined as a mesoscopically structured crystal, consisting of submicrometer-sized crystallites and organized within the mesocrystal with a good crystallographic register. Nonetheless, the crystallites in mesocrystals are separated from each other by voids and/or impurities [36,37,38].
We use in this study the term crystal unit for morphological mosaic- or mesocrystal entities such as columns, prisms, blades, laths, rhombohedra, polyhedra or granules. These crystal units assemble in the shell of the investigated species to microstructures. These have different modes of preferred crystallographic orientation or crystal textures.
Shell microstructures are presented in this study with EBSD band contrast measurement and crystal orientation maps. EBSD band contrast is shown grey-scaled, crystal orientation in the maps are shown color-coded. We use the inverse pole figure (IPF) and all-Euler colouring codes. The relevant coloring-code is either given in the figure or indicated in the figure caption.
Crystal texture or the crystallographic preferred orientation of crystals or crystal units is shown with pole figures. These display either crystal orientation data or their density distribution. The density distributions that we show in this study are calculated with a half-width of 5° and a cluster size of 3°. The half-width gives the spread of the poles over the surface of the projection sphere. The cluster with a chosen size gives information on the amount of poles that have the same orientation.
We discuss in this contribution different carbonate crystal textures.
A single-crystal-like crystal textures is present when we observe in the pole figure one cluster for c-axes and clusters as well for either the three a*-axes of the calcite or the a- and b-axes of the aragonite.
A single-crystal-like texture with a graded distribution of calcite c- and a*-axes is given when we find in the pole figures individual clusters for the crystallographic axes orientations, however, the clusters display a longish appearance, due to the recurrent gradual tilt of crystallographic axes distribution for each cluster.
An axial crystal textures is given when we observe clustering in c-axes orientation, however, scattering of the corresponding a*-axes (calcite) or a- and b-axes (aragonite) orientations on a great circle perpendicular to the texture axis, here the c-axis, direction.
Crystal co-orientation strength is calculated from the density distribution of EBSD orientation data and is given either for entire EBSD scans or the subsets of these. Crystal co-orientation strength is presented with MUD (multiple of uniform (random) distribution) values. A high MUD indicates a high crystal co-orientation strength, a low MUD indicates low or no crystal co-orientation strength. If, at a half-width of 5° and a cluster size of 3°, the MUD value is below 3, the orientation data have a random distribution or lack preferred crystal orientation. If, at a half-width of 5° and a cluster size of 3°, the MUD values are higher than 700, this indicates a very high, single-crystal-like, crystal co-orientation.
The degree of tilt or misorientation between crystallites and crystals is obtained from EBSD measurements. We show misorientation between crystals with (i) relative frequency-misorientation angle or (ii) misorientation angle-distance diagrams. The misorientation-distance diagrams are given for trajectories a to b, c to d. The chosen trajectories run either parallel to the length of a foliated unit or perpendicular to the length of a foliated unit. For the misorientation angle-distance diagrams we give either the cumulative misorientation angle, thus, the cumulative increase in misorientation relative to the first point on the trajectory, or we give the local misorientation, misorientation from point to point along the trajectory, hence, misorientation from crystallite to crystallite along the trajectory.
2. Results
EBSD band contrast measurement maps of Figure 1 highlight the different microstructures that were observed for the investigated Ostreoidea shells. As the crystal assembly patterns are not only characterized by crystal or/and crystal unit shape, size, structure and organization, but also by the degree and mode of misorientation between the constituting crystals, we highlight for the different modes of crystal organization the corresponding pattern of misorientation between the crystals (Figure 1 and Figure 2). For the investigated Ostreoidea species we find an ordered as well as a disordered pattern of misorientation between the comprising crystals (Figure 2). For discrimination between ordered and disordered misorientation patterns, we show the MacKenzie curves for calcite and aragonite. These give the distribution of misorientation angles for randomly textured carbonate polycrystals (Figure 2H, [39]).
We observe significant structural differences for the crystals that comprise the microstructures of the investigated Ostreoidea shells. Columnar prisms are graded in size towards the outer shell surface (Figuer 1A and Figure S1). Individual columns are markedly structured (Figure 1A and Figure S1); however, the comparison of the band contrast maps and the misorientation angle patterns shows that the structuring within the columns is not resembling the internal structuring of the foliated units (Figure 1A, B and Figure S1). For the latter, well visible from the band contrast map is the, more or less, parallel arrangement of folia (Figure 1B). This is not observed for the internal architecture of the columns. The layer that cements the outer surface of the lower valve comprises a conglomerate of granules and small prism-shaped crystals (Figure 1C). The microstructure of the chalk is a meshwork of interlaced, in part, connected calcite blades and laths, where the latter often have curved/undulated morphologies (Figure 1D). The occlusion of vesicular pores into the shell is accomplished with the generation of a shell layer microstructure consisting of a tight interlinkage of variously sized, strongly fractal-shaped, polycrystals (Figure 1E). These form a dense microstructure and encase the round-shaped pores (Figure 1E). The microstructure of adductor and pallial myostraca (the muscle attachment sites) results from an interconnection of aragonite prisms (Figure 1F). The prisms are graded in size and increase in dimension towards the inner shell surface (Figure 1F). Most striking and only observed for the Ostreidae is the formation of crystals with strictly rhombohedral morphologies (Figure 1G). The morphology of these crystals is distinct to that of other biologically secreted Ca-carbonate crystals and resemble inorganic rhombohedra precipitated from solution [41,42]. A detailed description of the rhombohedron-shaped crystals is given by Sancho Vaquer et al. (2025) [13]. Accordingly, we not only find significant differences in morphologic-structural attributes of crystal, crystal unit and shell layer microstructures, but also in the corresponding misorientations between the microstructures comprising crystals (Figure 2). For the columns (Figure 2A), the granules (Figure 2D), the dendritic crystals (Figure 2E) and the chalk blades/laths we observe a wide range in misorientation angle, up to 100°, and a misorientation angle distribution that equals random distribution (see the MacKenzie curves in Figure 2H). Random distribution of misorientation angles is not observed for the assembly of folia (Figure 2B), for the rhombohedral crystals (Figure 2G and [13]) and for the assembly of myostracal prisms (Figure 2F). The misorientation angle distribution of myostracal prisms is specific. We find a large range in misorientation angle distribution (Figure 2F), however, the myostracal crystal misorientation diagram is dominated by a marked peak at 64° misorientation (Figure 2F). Note also the difference in the degree of misorientation angle between the assembly of foliated crystals (Figure 2B) and the assembly of chalk blades/laths (Figure 2C). For the foliated crystals we see a large peak at low-angle misorientations, while for the chalk blades, we see a large peak mainly at large-angle misorientations.
Subsequently, we present in more detail the structural and crystallographic attributes of the crystals and crystal units that form the different shell layers of the investigated Ostreoidea species (Figure 3, Figure 4, Figure 5, Figure 6, Figure 7, Figure 8, Figure 9, Figure 10, Figure 11, Figure 12, Figure 13 and Figure 14, Figures S1–S5).
Calcite columns with dimensions of 8-10 mm x 4-5 mm x 40-50 mm (e.g., for M. gigas) seam large sections of the distal, outer, surface of the two valves (Figure 3A). BSE images show an internal layering of individual columns, consisting of equally sized dark and light bands (Figure 3B, C). These reflect differences in organic content (light layers are more mineralized, the dark bands are more organic-rich) and indicate different stages of column growth. The internal structure of the columns is specific (Figure 3D, E, F, Figures S2 and S3). We observe in the band contrast measurement images that the columns consist of subunits or domains (Figure 3E, F and Figure S3). These are formed of platy crystals (Figure S3C), nonetheless, the width, length and morphology of these platy crystals do not resemble at all those of the folia which form the foliated units of the foliated shell (compare images of Figure S3A to C with images shown in Figure 4A to C). The columnar subunits (domains) consist of thin, platy, irregularly shaped crystallites, resembling flakes. Nonetheless, as it is the case for the folia in foliated units, the crystallites within a columnar subunit are strongly co-oriented; misorientation within the columnar subunits/domains is low, it scatters up to about 5°. Even though the calcite of individual columns is well co-oriented, columnar calcite cannot be addressed as being single crystalline (Figure 3J, K). Contrasting to the latter, the calcite of arrays of columns is very little co-oriented (see MUD value in Figure 3I), a characteristic that resembles the arrangement of folia in foliated crystals and that of foliated crystals in the foliated shell layer (see MUD value in Figure 3H). We find for the investigated Ostreoidea shells that within the individual crystals or crystal units (a column or a foliated unit) the crystallites are very well co-oriented, however, for the assembly of these crystals/crystal units we find very low crystal co-orientation strength. The texture pattern of individual columns is single-crystal-like (pole figure in Figure 3J), while the texture pattern of an assembly of columns is axial (pole figure in Figure 3I).
Structural properties and crystallographic attributes of units forming the foliated shell layer are presented with Figure 4, Figure 5, Figure 6, Figure 7, Figure 8 and Figure 9 and Figure S4. BSE images of Figure 4A, C visualize the thickness and width of individual folia, while Figure 4B shows the shape and size of crystals that comprise a folium. A folium is formed of, more or less, parallel arrays of lath-shaped crystals with arrowhead endings (Figure 4B and [20]). The calcite of individual folia is very co-oriented (MUD values 591, 626, Figure 4D). It can be addressed to be single crystal like, as EBSD measurements show that individual folia have a single-crystal-like long-range crystallographic order (see pole figures in Figure 4D).
When investigating calcite c- and a*-axes orientation of a stack of folia, generating a foliated unit (e.g., Figure 4E, F), we observe an elongated appearance of the c- and a*-axes orientation data points in the pole figure. This is an expression of the gradation in calcite c- and a*-axes orientation (see pole figures in Figure 4E, F); it is the result of a graded assembly of folia in the foliated unit (Figure 5). Gradation of one of the crystallographic axes of calcite or aragonite crystals is observed for biological carbonates, however, gradation in all crystallographic axes of carbonate crystals is outstanding. For biologically secreted calcite, this study is the second report so far that demonstrates the gradation of both the c- as well as the a*-axis of the calcite in a crystal unit.
Figure 5A gives for the foliated shell layer of H. hyotis a large EBSD scan which extends from the inner surface of the shell well into the foliated section of the shell. We find a marked increase in crystal size when moving away and inward from the inner surface of the shell. The consequence of the latter is that, while the smaller foliated units are scanned fully with the chosen size of the EBSD scan, the large foliated crystal units are scanned only in part; the EBSD measurement covers only a portion of the large foliated units. The red, yellow and white stars in the map shown in Figure 5A point to foliated units that will subsequently be described in more detail. These three foliated units were deliberately taken from different parts of the EBSD map and were selected for their difference in size as well as position in the foliated shell layer. We show, for the selected foliated units, with sketched crystals and pole figures the orientation pattern of calcite c- and a*-axes. For the foliated units given in Figure 5B, C we see clearly the gradual rotation of calcite c- and a*-axes with the length of the foliated unit and, to a lesser degree, the rotation of crystallographic axes perpendicular to the length of the foliated unit (see the corresponding pole figures and sketched crystals).
Figure 5 gives misorientation angle distributions for individual foliated units along trajectories from a to b and c to d. Trajectories a to b (indicated with white arrows on the foliated units) run parallel to the length of a foliated unit, trajectories c to d (indicated with red arrows on the foliated units) run orthogonal to the length of a foliated unit.
We show two types of misorientation angle distributions with the lengths of the foliated units:
- (i)
- with the misorientation angle relative to the first point on the trajectory the overall, cumulative, misorientation angle is given for a foliated unit, while
- (ii)
- with the misorientation angle from point to point on the trajectory the local, internal, misorientation angle is given for a foliated unit; hence, the misorientation angle from crystallite to crystallite or/and from folium to folium.
- (iii)
- In addition, we give for each misorientation angle diagram the corresponding misorientation angle gradient (the value in the misorientation angle diagram).
- (iv)
- We observe the following main features from the misorientation angle diagrams (Figure 5):
- (v)
- Irrespective of the orientation of the trajectory, we find for both cumulative and local misorientation, an increase in misorientation angle with the increasing length of the trajectory.
- (vi)
- The latter is lowest for the foliated unit shown in Figure 5B (the unit that is closest to the inner surface of the shell), is slightly higher for the foliated unit shown in Figure 5C and is highest for the foliated unit shown in Figure 5D (the unit that is most far away from the inner surface of the shell).
- (vii)
- The increase in misorientation angle is smoother when the trajectory runs parallel to the length of the foliated unit, relative to a trajectory that runs orthogonal to the length of the foliated unit.
- (viii)
- When the trajectory is orthogonal to the length of the foliated unit and spans across many folia in the foliated unit, then the increase in cumulative misorientation angle is rather irregular and not smooth.
- (ix)
- For all investigated foliated units, we find, irrespective of the direction of the trajectory, similar low misorientation angle gradients.
The crystal shown in Figure 5D is, in the chosen EBSD scan field (Figure 5A), most far away from the inner surface of the foliated shell and is, relative to the other crystals (given in Figure 5B, C), largest in size. It should be kept in mind that we cover only a part of the crystal with the size of the conducted EBSD measurement. For the crystal portion shown in Figure 5D, we find a different internal structuring, as visualized with the corresponding sketched crystals, pole figures and misorientations. For that crystal portion (Figure 5D and Figure 6B) we do not see any more a rotation from folium to folium, from calcite c- and a*-axis to calcite c- and a*-axis, as it is the case for the crystals shown in Figure 5B, C, but mainly the tilting between two crystal orientations (see the sketched crystals, the poles and misorientation diagrams of Figure 5D). For the crystal portion shown in Figure 5D we observe two interdigitating substructures, however, these closely related in orientation to each other (see pole figures in Figure 5D). In the corresponding misorientation diagrams (Figure 5D) we find, for both trajectories (a to b, c to d), an increase in cumulative misorientation with distance away from the first point on the trajectory, however, the course of the increase in misorientation is strongly jagged (not smooth, as it is the case for the crystals shown in Figure 5B, C) and we observe formation of a larger degree of misorientation from point to point, between the adjacent crystallites (see misorientation diagrams in Figure 5D). The following explanation might explain the structural difference for the crystals shown in (C) and (D) on the one hand side, and (E) on the other. The foliated units in Figure 5B, C are individual blocks/units of co-oriented folia, the crystal portion of the foliated unit in Figure 5D is a zoom-in into a foliated unit and we observe the interdigitation of two adjacent subunits, calcite c-axes of these subunits being tilted to each other by about 30°.
The texture of the foliated crystal units, irrespective if these are small or large, is very specific (see pole figures in Figure 6, Figure 7 and Figure S4). We observe for an EBSD scan, comprising various foliated crystal units a ring in c-axis as well as a ring in a*-axes orientation (black arrows in pole figures shown in Figure 6C, D). With Figure 6 we attempt to visualize how the ring in c- and a*-axes orientation is generated for an assembly of adjacent foliated units. When reduced to the core crystal of a large foliated unit (Figure 6B), we see in the pole figure a cluster in c-axis and three clusters in a*-axes orientation. Nonetheless, for the clusters in the pole figure and in the corresponding EBSD map we observe that the core crystal of the foliated unit consists of two, differently oriented, subunits. When two to three adjacent foliated units are regarded, we find that each of these is structured by interdigitating subunits and that, in turn, each foliated unit adds in the pole figure a cluster in c- and three clusters in a*-orientation. Hence, for a 3D assembly of adjacent foliated units the c- and a*-axes clusters of the different foliated units merge and generate a ring-shaped c- and a*-axes orientation distribution. Although not as well observed as for the large foliated units, the small foliated units are also interdigitations of adjacent, substructured foliated units and for these we see as well the generation of c-axes and a*-axes rings in the pole figure (see pole figures in Figure 7B, C, D). Nonetheless, as the EBSD scan covers many, to each other strongly misoriented, small foliated units, the ring-shaped c- and a*-axes orientation distribution for small foliated units is rather noisy, not as clear-cut as it is the case for the large foliated units (compare the pole figure shown in Figure 7B with that shown in Figure 7C).
As demonstrated in Figure 4E, F, we find for the foliated units a gradation in calcite c- and a*-axes. This points to a mesocrystalline nature of the foliated units. A mesocrystal is defined as a mesoscopically structured crystal consisting of submicrometer-sized crystallites, with a crystallographic register [35,36,40]. The distinction of the individual nanocrystals is not clearcut because the crystal lattice is continuous across them [40]. The length, width, and thickness of crystallites that form a mesocrystal do not have to be similar in size [40], as it is the case for biologically-formed mesocrystals, e.g., the foliated units of Ostreoidea shells. For the generation of a mesocrystal, the change in crystallographic axes orientation needs to have a, in 3D, controlled tilt [40], and this we find for the foliated units of the investigated Ostreoidea shells. For individual foliated units, we see in the relative frequency - misorientation angle diagrams only low-angle (up to 10°) misorientations and a very small range in misorientation angle (Figure 4E, F).
Figure 8 shows an EBSD scan that covers many foliated crystals and extends from the inner shell surface well into the foliated shell layer. We see in this measurement how inner shell surface curvature is generated with foliated units. It is formed with a decrease in foliated unit size towards the curved surface thus, at the curved surface, we find an accumulation of small foliated units.
Figure 9 gives calcium carbonate phase, microstructure, texture and crystal co-orientation strength of granular to prismatic crystals that comprise the shell at the attachment sites, myostraca, of pallial and adductor muscles. We observe for these aragonitic shell sections a different Ca-carbonate phase, as that of the calcitic rest of the shell (Figure 9A, F), a specific microstructure (Figure 9C, E), which is distinct from that of the rest of the shell, an axial texture (see pole figures for aragonite in Figure 9C, E), a higher crystal co-orientation strength, as observed for all other shell portions (see MUD values in Figure 9C, E) and a marked peak at 64° misorientation in the misorientation angle diagram (black arrows in Figure 9C, G). The crystallographic-structural difference between myostraca and the other valve sections is the result of different calcium carbonate hard tissue forming determinants (e.g., [37,38]).
Figure 10, Figure 11, Figure 12, Figure 13 and Figure S6 visualize the structural arrangement of calcite crystals when voids, and pores are incorporated into Ostreoidea shells. Ostreidae incorporate a meshwork of calcite in between stacks of folia, Gryphaeidae occlude lenses of vesicular pores within the stacks of folia. When based on SEM images, the crystal meshwork of the chalk appears to be entirely unstructured (Figure 10A to C). This is the case to a large degree, as indicated by the large-angle misorientations in the relative frequency-misorientation angle diagrams (Figure 10E, F). However, we also observe some structuring of the chalk by larger-sized blades/struts (see EBSD measurements in Figure 11D). We often find low MUD values for the chalk (e.g. MUD 4; Figure 10F), but also an increased MUD (e.g. MUD 45, Figure 11D; MUD 24, Figure 11E). Thus, the crystallites that comprise the chalk are not at all entirely random in orientation. High-resolution EBSD measurements demonstrate the presence, when based on structure, of a transitional zone between the foliated crystals and the calcite meshwork of chalk (white stars in Figure 10D, Figure 10G, Figure 11B). The structure of this transitional zone is chaotic, we do not find in the latter the typical structure of either foliated crystals, or of the calcite meshwork of the chalk (e.g., 11A to C). Regarding crystal organization for the topologically closely-related foliated, transitional and chalk crystal arrangements (Figure 11A to C), we observe a rotation in c-axis orientation from the folia (Figure 11C) to the crystals at the transition from the folia to the chalk blades/laths (Figure 11B). While c-axis orientation of calcite folia is rather within the plane of view (green to yellow data points in the pole figure in Figure 11C), it becomes gradually tilted out of the plane of view and being oriented perpendicular to the plane of view when approaching the transitional section to the chalk (yellow to red data points in the pole figure in Figure 11C). Calcite c-axis orientation of the transitional zone between the folia and chalk is mainly perpendicular to the plane of view (red data points in the pole figure in Figure 11B).
Our study shows that calcite with a chalk-like microstructure is not only present in lenses within the foliated shell. We observe for O. stentina, formation of a layer with a chalk-like microstructure, texture, and misorientation angle distribution also at outer shell portions (Figure 11E), however, always in topological relation to the foliated shell layer (EBSD map in Figure 11E). Figure 12 and Figure 13 show for H. mcgintyi, H. hyotis, and N. cochlear the mode of crystal organization around voids and pores (e.g., Figure 12B, 13B, C). The calcite microstructure that surrounds the pores consists of an assembly of dendritic crystals (Figure 12 and Figure 13). These are very diverse in size (e.g., Figure 13B) and, in particular, have highly fractal morphologies (e.g., Figure 12B, D and Figure 13B). Adjacent crystals interlock strongly in 3D with neighboring fractal crystals (Figures 12D and 13B). The calcite of individual dendritic crystals is well co-oriented (Figure 13C), hence, we find for individual dendritic crystals only low-angle misorientation (Figure 10E). Even though crystal co-orientation strength within an individual crystal is high, due to the, more or less, random interconnection of crystals, crystal co-orientation strength of the whole microstructure is low (Figuer 12A), nonetheless, it is comparable to that of the adjacent foliated shell (Figure 13A). The texture of the dendritic granular microstructure has a very low preferred orientation, thus, a very weak texture (pole figures in Figure 13A, C). Nonetheless, in rare cases we see for the assembly of dendritic crystals the development of a weak axial texture (pole figure in Figure 12A). Thus, for the latter example, we see a directed assembly of dendritic crystals, however, irrespective of which texture is developed, with a very decreased crystal co-orientation strength (see the low MUD values for the measurements in Figure 12A and 13A, C).
Calcite crystals within the cementation layer are mainly granular (Figure 14A); when slightly larger-sized (Figure 14B), the morphology of the cementation layer crystals tends to be prismatic (Figure 14B). Crystal co-orientation strength for the cementation layer crystals is low (see MUD values in Figure 14A, B). Crystal texture can be very vaguely axial (pole figure in Figure 14B). However, the axial texture can also be developed with some directed c- and a*-axes orientation (pole figure for the granules in Figure 14A).
3. Discussion
At fabrication of structural materials it is a challenge to obtain the right balance between strength, toughness and resilience (e.g., [43]). Nonetheless, is a balance attained, it is often determined, to a large extent, by the design of the structural material in question (e.g., [44,45,46,47,48]).
The strength and toughness of a structural material can be changed in many ways, e. g., (1) by incorporating impurities into the crystals, (2) by varying crystal size and crystal organization, (3) by forming composites out of different minerals, (4) by generating composites of organic substance and mineral, or (5) by incorporating interfaces into crystals or into crystal microstructures [45,47,48].
Driven by evolution-, environment- and predation, a large variety of biologically secreted materials evolved in the geological past. These are characterized by an advanced material performance which is called forth by (1) their, in three-dimension, hierarchical architecture, (2) by bridging a wide range of scale levels and connecting the atomic scale to the macro scale (e.g., [45,48] and (3) by fabricating composites, in particular, of biopolymers and minerals. Apart from myostracal and ligament aragonite, that are by volume very minor shell components of Ostreoidea shells, all the Ostreoidea form their shell of low-Mg calcite [16,17,18]. Hence, Ostreoidea do not vary the carbonate phase of their shell material for the attainment of a balance between strength, toughness and resilience, but, mainly, the design and the architecture of the different shell layers, that is, the morphology, size, interlinkage of crystals (microstructure) and the mode of crystal assembly in the different layers and portions of the shell (texture) (Figure 1, Figure 2, Figure 3, Figure 4, Figure 5, Figure 6, Figure 7, Figure 8, Figure 9, Figure 10, Figure 11, Figure 12, Figure 13 and Figure 14 and Figures S1–S6).
3.1. The microstructures
The Ostreoidea secrete for shell generation crystals with many shapes: columns, prisms, granules, rhombohedra, dendrites, laths with arrowhead endings, folia, foliated units, blades, and form out of these six different microstructures and five different textures (Figure 1, Figure 2, Figure 3, Figure 4, Figure 5, Figure 6, Figure 7, Figure 8, Figure 9, Figure 10, Figure 11, Figure 12, Figure 13 and Figure 14). Apart from the myostracal aragonitic microstructure, all calcitic microstructures have a low crystal co-orientation strengths, varying, for the measurements conducted in this study, from an MUD value of 4 to an MUD of 67 (Table 1, Figure 1, Figure 2, Figure 3, Figure 4, Figure 5, Figure 6, Figure 7, Figure 8, Figure 9, Figure 10, Figure 11, Figure 12, Figure 13 and Figure 14). Nonetheless, when individual crystals or crystal units are regarded, e.g. rhombohedra, dendrites, folia, individual foliated units, individual columns, the crystal co-orientation strength of these is very high (e.g. Figure 3J and Figure 13C, Table 1). Thus, little co-oriented is the assembly of the crystal units that form a shell layer, while the calcite of individual units is highly co-oriented. The low crystal co-orientation strength of the different shell layer microstructures is striking, in particular, when compared to the co-orientation strength of other bivalve shell microstructures, where MUD values (for a particular microstructure) scatter between 200 and 400 [45,48]. The low crystal co-orientation strength of Ostreoidea shell microstructures is not just the result of fast shell secretion, thus, the necessity to form a thick shell in short time. The low MUD values of some Ostreoidea microstructures can be explained with the specific use and utilization of a particular shell layer, as it is the case for the assembly of columns, for the assembly of granules and for the assembly of the dendritic crystals.
3.1.1. The microstructures that form the compact shell layers
The columnar shell layer
The columnar layer consists of closely packed, discrete, column-shaped large calcite units, in some references termed also as prisms. In cross-section, individual columns have polygonal morphologies (Figure 3D). The columns are variable in size (Figure S1A, B). In general, their arrangement in the layer is such that, towards outer columnar layer surface, the columns decrease in size. For the investigated species, we found that the outermost shell layer surface is seamed by rather small-sized columns, which increase in size toward the boundary with the foliated shell layer (Figure S1A, B).
We find two main structural characteristics for the columnar layer of the investigated Ostreoidea species.
- The columnar layer is strongly enriched in organic substance. The latter is developed as thick membranes delineating adjacent columns (Figs. 35, 37 in [17], and [48]). In addition, we observed that much organic substance is also present within the columns, e.g. Figure 3B, C. Surprisingly, the deposition of organic substance in the columns has a banded appearance (Figure 3A to C) and is not inhomogeneous as it is the case for bivalve aragonitic columnar prisms (e.g. Elliptio crassidens (Lamarck, 1819) [32]). The growth bands in Ostreoidea columnar layers are episodic growth bands. Harper and Checa [48] investigated the organic content of the shell layers of pearl oysters (very many species of 29 taxa). These form their shell of columnar calcite and nacreous aragonite. The authors detected a significant difference in organic substance content between the columnar and the nacreous shell layers and suggested that the high percentage of organic substance of the columnar layer, relative to the nacreous shell layer, might be regarded as a functional trait. The more organic substance-rich and, thus, more ductile, columnar layer renders the structural flexibility of that shell layer and is of use for, e.g., a tight closure of the valves. Thus, a more efficient protection of the soft tissue and organs from organism-related and/or physical, external, attack.
- The other structural characteristic that we observed for the columnar layer of the investigated species is the strong structuring of the columns (Figure 3E, F and Figure S3). An individual column consists of many subunits, domains. These have very irregular shapes and sizes (Figure 3E and Figure S3A) and are misoriented to each other by about 5° to 10° (Figure 3K). The subunits, domains of the columns are formed of platy calcite crystals (Figure S2). These have strongly irregular morphologies and vary also highly in size (Figure 3F and Figure S3B, C). It should be noted that, for the species investigated in this study, neither the structuring of the columns into subunits/domains, nor the crystals that comprise the domains resemble the structures that we find for the corresponding foliated shells. We find very different microstructures and crystal textures for the columnar and for the foliated shell layers. Even though, two structural characteristics are similar for the two shell layers: (i) their very hierarchical architecture and (ii) The high co-orientation strength of calcite crystals in the subunits (Figure 3J and Figure 4E, F), but very low co-orientation strength of the units (columns, foliated units) in the relevant shell layer (Figure 3H, I and Figure 7B, C).
The foliated shell layer
For all investigated species, the foliated shell layer comprises the largest part, by volume, of the valves and is outstanding in microstructure and crystal texture (e.g., the results of this study and [16,17,21,28,49,50]). For the foliated shell microstructure, these studies visualized that the crystals of the foliated material are arrowhead terminated laths. These assemble, more or less, in parallel and form foils, consisting of a few laths. Two to three foils form a folium, assemblies of folia form foliated units and a conglomeration of foliated units forms the foliated shell (e.g. Figure 6 and Figure 7). We observe for the foliated shell of the investigated species, for individual foliated units, a gradation in c- and a*-axes orientation (see pole figures in Figure 4E, F) and, according to the latter, for an assembly of foliated units, a ring-shaped orientation distribution of calcite c- and a*-axes in the pole figures (see the pole figures in Figure 6 and Figure 7). The latter is, from a crystallographic point of view, a very remarkable structural characteristic. Other organisms, gastropods, bryozoans, also have foliated layers, but their textures are different to the foliated calcite of the Ostreoidea.
The combined interpretation of crystallographic characteristics gained from the Ostreoidea foliated microstructures and the corresponding textures infers the conclusion that the texture pattern of the foliated shell layer of the investigated species resembles a turbostratic arrangement of the folia and of the foliated units. For the description of a turbostratic arrangement of particles see [51,52]. Cumulative misorientation angle patterns along trajectories parallel or/and orthogonal to the length of a foliated unit show that the course of the misorientation angle in the cumulative misorientation diagram is very smooth with the length of the foliated unit, while it is ragged when the trajectory runs orthogonal to the length of the foliated unit (Figure 5B, C). The above described structural-crystallographic features indicate that the texture of the Ostreoidea foliated microstructure is not axial or sheeted, nether spherulitic, nor single crystalline. It is rather turbostratic [50], nonetheless, and due to the lath morphology of the foliated crystals, the Ostreoidea foliated texture has, most probably, a specific form of the turbostratic texture motif [53]. The turbostratic textures described for, e.g. aggregates of clay particles and particle units, are based on the notion that a clay particle is a platelet. Many platelets form a clay platelet unit and many of the latter units generate in clay-water suspensions a clay platelet unit layer with a turbostratic texture (very well addressed by Aylmore and Quirk [51] and Lutterotti [52]). The crystals that form the Ostreoidea foliated shell are lath-shaped (Figure 4B) and only aggregations of these (foils, folia) generate plate-shaped units.
The cementation layer
The cementation layer of Ostreoidea shells has as well a rather compact microstructure, relative to the cavity-rich microstructures of both the chalk and the vesicular lenses. The crystals in the cementation layer of the investigated species are mainly granular and can be regarded to be reinforcements of the organic glue that cements the shell to the substrate, in general, to a rough-surfaced substrate. Although the orientation pattern of the cementation granules is rather isotropic (see the pole figures in Figure 14B for the cementation granules), in some instances we observed some directed orientation of the granules (see the pole figure for the granules in Figure 14A) and, as it is shown in Figure 14A, some co-orientation of calcite c-axes of the cementation granules and the c-axes of the dendritic crystals that generate the shell layer that incorporates the vesicular pores (see the pole figures for the dendritic crystals and cementation granules in Figure 14A). Our study did not disclose the reason for the low co-orientation strength of the cementation granules. Nonetheless, the low degree of their co-alignment in the layer is in concert with the low co-alignment of the units (the columnar and foliated units) that form the other Ostreoidea shell layers. Even though, we might hypothesize that the isotropic orientation pattern of the cementation granules is of benefit for cementation of the shell to an irregularly surfaced substrate. From our EBSD measurements we did not observe the ridge-and-furrow structure of the cementation granules, as reported by Yamaguchi [54]. Nor can we confirm the conclusion of MacDonald et al. [27] stating that the cementation granules are precipitated from seawater and are not secreted by the organism. MacDonald et al. [27] justify the latter conclusion with the observations that (i) the cementation granules consist of high-Mg calcite and (ii) that the cementation granules are fully random in orientation. We investigated in great detail the cementation layer of H. mcgintyi and M. gigas and did not find any difference in Mg-content between the granules and the adjacent folia. In contrast, when EBSD measurements are conducted with high resolution, we observed (i) a tight structural connection between the foliated shell and the adjacent assembly of cementation granules (Figure 14A, B) and (ii) even some continuity in orientation of calcite c- and a*-axes between the dendritic and the cementation granular shell layers (Figure 14A). As shown in this as well as in other studies [32], not all Ca-carbonate skeletons/skeletal elements have or need to have a high crystal co-orientation strength. It is not uncommon and also not of disadvantage for the organism to secrete a carbonate hard tissue consisting of crystals with a low or almost random crystal co-orientation strength (e.g. [32,50]). This is observed, for example, for the shell of thecideid brachiopods [55] and for the shell of the bivalve Arctica islandica (Linnaeus, 1767) [56], the latter being a species having a marked longevity and, thus, slow shell secretion, even though it forms its shell out of only one microstructure and a very low crystal co-orientation strength [56]. Based on crystal co-orientation strength, it cannot be determined if the mineralized components of the shell are precipitated from seawater or are secreted biologically. We consider the cementation granules as well as the calcite of the rest of the Ostreoidea shell as being the product of biological secretion.
The myostracal layers
The myostraca of bivalves are always formed of aragonite, even if the rest of the shell consists of calcite (e.g. [41,57] and references therein, [58]). This is not the case for all bivalved marine organisms. E. g. brachiopod myotests, the scars of the brachiopod muscle attachment sites, consist of calcite [59,60]. Modern rhynchonelliform brachiopods secrete calcitic shells as well as calcitic muscle scars [60].
In the case of Ostreoidea, not only the carbonate phase of their myostraca is different to the mineralogy of the rest of the shell, all other structural attributes of their myostraca are different as well, e.g., crystal morphology, crystal co-orientation strength, myostracal microstructure and texture (Figure 9). The marked difference in structure, microstructure and texture of the myostracum and of the rest of the shell is the result of the influence of determinants that affect the formation of the different microstructures. The columnar, foliated, and granular microstructures of Ostreoidea shells are mainly the result of biological determinants, while the myostracal microstructure, even though secreted by an organism, is mainly influenced by physical crystal growth determinants. Physical determinants do not exert influence on the growth of columnar, foliated and the cementation crystals. For further information on biological hard tissue formation determinants see Checa [22]; for physical determinants of myostracal crystal growth see Hoerl et al. [41,57].
The crystal growth process of Ostreoidea myostracal crystals is the process of growth competition. At the latter growth process, the orientation of the crystal’s growth axis, for calcite the c-axis, determines the success of a crystal to grow to a large entity. Myostracal crystals nucleate onto the adjacent shell layer template, in the case of the Ostreoidea, onto the foliated shell template. The first crystals that form are minute and have random orientation [17,28,30]. As crystal nucleation occurs at high supersaturation, many crystals nucleate next to each other and, with growth, compete for space. Those crystals that have their fastest growth axis oriented perpendicular to the orientation of the template surface, thus, perpendicular to the foliated layer surface, can grow without any inhibition and develop to large crystal entities. Crystals that have their fastest growth axis direction at an angle to the nucleation template, to the surface of the foliated shell layer, collide at growth with their neighbors and, due to restriction in available space, become eliminated. Hence, due to the growth process, the inner myostracal shell surface is seamed by large myostracal prisms and the c-axis of adjacent prisms is parallel to each other and is oriented normal to inner shell surface.
Our EBSD results show a further important structural characteristic for the myostracal microstructure of the investigated Ostreoidea shells. Myostracal aragonite is twinned (see the marked misorientation peaks at 63°/64° in the misorientation diagrams in in Figure 9C, G), while columnar, foliated, granular, chalk, rhombohedral calcite of the investigated Ostreoidea shells in not twinned. The lack of crystal twinning of Ostreoidea calcite will be discussed subsequently.
3.2. The microstructures that enable the incorporation of voids into the shells
The Ostreoidea developed two strategies for enabling cavity incorporation into the shell. Ostreidae incorporate voids into the foliated shell layer with the inclusion of the chalk lenses (Figure 10 and Figure 11 [17,28,30,61]). The Gryphaeidae generate a shell layer with a specific vesicular microstructure that allows the incorporation of large sequences of pores into that layer (Figure 12 and Figure 13 and [1,12,62,63]). The shell layer that hosts the vesicular pores is never within the foliated microstructure, nonetheless, always associated to it. The chalk and the vesicular microstructures are considered to be structurally unrelated [12,28]). This is an indication that the Ostreidae and the Gryphaeidae arrived independently to a comparable Ca-carbonate material functionalization solution that, most probably, was and is driven by adaptation to similar environmental requirements. The foliated microstructure plays an important role in facilitating void and pore incorporation, as both the void-rich chalk lenses as well as the arrays of the vesicular pores are in topological relation to the foliated mode of crystal and crystal unit arrangement, and are not in structural relation to other crystal, crystal unit arrangements, e.g., to the columnar assembly of crystals.
The structure of the meshwork of chalk blades and laths is very specific. In particular, when the degree of structuring is considered, it is very different to the arrangement of folia that surrounds the chalk lenses. The observation of these differences led to the suggestion that the blades/laths and the foliae are formed through different biomineralization processes. Chinzei and Seilacher [64], Vermeij [65] and Banker and Vermeij [66] suggested that sulfur reducing bacteria, living within the shell, could be responsible for the formation of chalk blade calcite and, as calcite formation by bacteria is a precipitation process, bacterial precipitation might be responsible for the specific microstructure of the chalk. This concept was challenged by Korringa [67], Pelseneer [68], Ranson [63], Galtsoff [69], Margolis and Carver [70], Ullmann et al. [71], Checa et al. [28], Banker and Sumner [31] and de Winter et al. [72]. The studies of the latter authors indicate that the chalk as well as all other oyster shell layers are deposited directly by the oyster. In addition, in favor of the latter is the similarity in isotopic signature of chalk and foliated calcite [71,72]. A possible explanation for the specific microstructure of the chalk and the disordered structural nature of chalk blades/laths was given by Checa et al. [28]. The authors suggested that the foliated layer and the chalk lenses grow at different rates; the cavity-rich chalk calcite is formed at a higher thickening speed, relative to the thickening speed of the dense foliated material.
SEM images of the chalk structure convey the impression that the chalk is a fully random assembly of blades and laths (e.g. Figure 10A, B and see MUD values for the chalk in Figure 10E, F). However, EBSD scans taken on the chalk show some internal structuring (Figure 11D). The aggregation of the laths is pervaded by undulated blades (Figure 11D), possibly for the stabilization of the cavity-rich chalk structure. Individual chalk blades have an increased to, even, high crystal co-orientation strengths (Tab. 1) and traverse the chalk structure over large distances (Figure 11D, E). Thus, one can find for EBSD scans, performed on the chalk, also high crystal co-orientation strengths (e.g., an MUD of 45; Figure 11D or 24; Figure 11E). Furthermore, we see in misorientation angle diagrams for all EBSD scans conducted on the chalk, the tendency to formation of large misorientations. This indicates some structural organization of the chalk microstructure as well.
The Gryphaeidae developed a different strategy for the incorporation of cavities into their shell. Gryphaeidae secrete a shell layer with a specific microstructure, which is capable to accommodate for the incorporation of large sequences of vesicular pores. The latter is possible through the interlinkage of crystals having highly irregular and strongly fractal morphologies (Figure 12D). These crystals are dendritic, interlink strongly in 3D (see the dendritic crystal and its neighbors in Figure 13B) and form a microstructure that has also a very low crystal co-orientation strength (Table 1). The pores are, in general, large-sized cavities (Figure 12 and Figure 13), thus, the mineralized structure that encases the pores needs to be particularly robust. This is realized by the Gryphaeidae with a shell layer structure consisting of crystals with very fractal shapes (Figures 12D and 13) and a pronounced, but, in 3D, variously oriented, interlinkage of the dendritic crystals (Figure 12B, D and Figure 13B, EBSD map for dendritic crystals in Figure 14A). As it is the case for the columnar and the foliated shell layers, for the dendritic crystal shell layer as well, we find that crystal units are formed of strongly co-oriented calcite (see MUD values of individual crystals in Figure 13C), while the respective shell layer has a low crystal co-orientation strength (Table 1).
Gryphaeidae are not the only bivalved organisms that secrete a meshwork of fractal crystals for shell formation. We find a similar microstructural motif, rooted in the interlinkage of strongly fractal-shaped calcite crystals, for the formation of the primary shell layer by modern rhynchonelliform brachiopods (Figure 19A to C and Figure 20A in [55]). A tight interlinkage of fractal-shaped calcite crystals generates the microstructure of modern thecideid brachiopod shells (Figure 10 in [73]) and the ornamentation microstructure of the modern venerid bivalve Chama arcana (Figure 3b, c in [57]). For the formation of the gryphaeid dendritic microstructure, the pronounced fractality of the crystals is very essential. This facilitates their tight interlinkage in 3D as well as an undirected mode of interlinkage and enables the formation of a dense, strong and tough microstructure. It should be noted that all above given examples for shell layer formation out of interlinked, fractal-shaped, dendritic crystals are calcitic microstructures. To the knowledge of the authors, this microstructural motif has not been observed yet for biologically formed aragonites.
3.3. Formation of curved surface with Ostreoidea shell crystals
For the investigated Ostreoidea shells we see the development of curved surfaces. These are present at inner shell surface, for both the Ostreidae and Gryphaeidae. For the Gryphaeidae, in addition, we find curved surfaces also within the shell, the inner surface of the pores, present in the shell layer formed by the fractal-shaped crystals.
When a curved inner shell surface is generated by the Ostreoidea, the size of the foliated units decreases towards the inner shell surface (Figure 8 and Figure S4). Thus, an Ostreoidea inner shell surface that is curved is seamed by small foliated units. In addition, as the difference in point to point misorientation between the foliated units shows (Figure 5B, C), the degree of misorientation between adjacent folia, for a foliated unit, decreases towards inner shell surface. Thus, at Ostreoidea inner shell surface a microstructure is present with small foliated units and with the comprising folia having a low crystal co-orientation strength. See the difference in microstructure between sections a and b of the EBSD scan given in Figure 8. We can observe well that the shell layer section formed of small foliated units does not abruptly change into a shell portion with large foliated units. The change from large to small foliated units is gradual (Figure 8B).
Curved surfaces forming the inner surface of the pores of the Gryphaeidae (Figures 12E and 13) are generated with formation of a shell layer consisting of strongly interlinked, little co-oriented, fractal-shaped crystals. Thus, the main difference in structural strategy of curved surface formation between Ostreidae and Gryphaeidae lies in crystal shape.
3.4. The textures
We described in the Results section and discussed in the Discussion section the large diversity of crystal morphologies and the diversity of microstructures that oysters can generate with the crystals they secrete. Do we find such a diversity in crystal textures?
As the pole figures in Figure 3H, I, Figure 7B to D, Figure 9C, E, Figure 10F, Figure 11A, B, Figure 12A, Figure 13 and Figure 14B demonstrate, Ostreoidea are capable to secrete calcite with diverse texture modes and this in the same shell. Within the same oyster shell, we find single crystal-like textures (individual columns, individual foliated units), axial textures (columnar layer), turbostratic-like textures (foliated layer) and polycrystalline textures with an almost random preferred orientation of the crystals (meshwork of the chalk, layer formed by dendritic crystals, cementation layer). Thus, we find within an Ostreoidea shell all main texture patterns that are observed today for Ca-carbonate microstructures secreted by marine organisms (Figure 12.15 in [32,87].
In essence, our study shows for the texture of Ostreoidea Ca-carbonate shells that (i) the diversity of texture patterns in Ostreoidea shells is increased, relative to the diversity of texture patterns that we detect for the shells of other bivalved, biocarbonate-forming, marine organisms (bivalves as well as brachiopods). (ii) we observe for Ostreoidea shells a larger diversity in crystal microstructures, relative to what we find for the crystal textures.
3.5. The change from one microstructure into the other
As Ostreoidea shells are formed of calcite, disregarding the few patches of myostracal and ligament aragonite, and as their shell comprises many microstructure patterns, Ostreoidea shells are ideal for the investigation of structural features at the changeover from the one microstructure into the other. We investigated the latter from a crystallographic point of view and discuss, subsequently, some crystallographic characteristics of calcite crystals that we observe for the different microstructure changeovers (Figure 15, Figure 16, Figure 17 and Figure 18). We show crystal orientation that prevails at the interface between adjacent microstructures with the corresponding EBSD maps, but also with the {100} (a*-axes), <001> (c-axes) and the {104}, {018}, {012} pole figures. These pole figures are shown for the one microstructure, e.g., for the columns, as well as for the latter, the adjacent microstructure, e.g., the columns and the folia. For a better visualization of the nature of the changeover, we complement the EBSD scans and pole figures with relative frequency–misorientation angle diagrams (Figure 16 and Figure 17).
3.5.1. Crystal rotation
For the changeover from foliated to columnar crystals, we observe a steady rotation of crystallographic axes between the columns and the folia (Figure 15A to E). See in the pole figure the gradedness in c- and a*-axes for a calcite unit/entity comprising a column and the adjacent stack of folia (Figure 15E).
3.5.2. Oriented nucleation
The changeover from foliated calcite to prismatic aragonite can be addressed as the oriented nucleation of myostracal prisms onto the foliated crystals (Figure 15F). Even though we find significant differences in texture for the folia and the myostracal prisms, as c-axes orientation of an assembly of foliated units has a ring-shaped distribution, there will always be c-axes orientations of some foliated units that are parallel to the c-axes orientation of myostracal prism aragonite. However, due to the difference in foliated and myostracal-prismatic texture, there is no correspondence between the foliated calcite and the myostracal aragonite a*- (calcite) and a- (aragonite) axes orientation (Figure 15F). For further discussion of the latter, see Griesshaber et al. [50].
3.5.3. Crystal twin-related changeover
From foliated crystals to chalk blades
Due to the large spread in crystallographic axes orientation of chalk calcite (e.g. the pole figure for chalk calcite in Figure 10F), it is difficult to describe the changeover from foliated to chalk calcite, as the wide spread in chalk crystal orientation masks the nature of the changeover. Nonetheless, based on misorientation diagrams and on the pole figures for the four twin laws of calcite (Figure 16 and Figure 17) we can determine whether there is a crystal twin-related relationship between the folia and the chalk blades/laths, thus, a twin-related changeover from the foliated layer to the chalk lens.
A twined crystal is an intergrowth of two or more crystal domains of the same phase and chemical composition [74]. The twin domains have different orientations. Their orientational relationship, however, is crystallographically defined through a mirror operation on a crystallographic lattice plane or a rotation around a crystallographic axis. Thus, the domains of a twinned crystal are related to each other through crystallographically defined misorientations; the degree of the twin-related misorientation is defined by the twin law. As twin crystals are intergrowths of domains, for the proof of a crystal twin-based relation between crystals, it is necessary to examine directly adjacent crystals, thus, to examine a possible twin formation for a folium or a foliated unit that is directly adjacent to a chalk blade or to a cluster of chalk blades. This is the case for the examples that we show in Figure 16A to C. We give three EBSD scans misorientation angle diagrams and twin law-related pole figures for (i) only the foliated calcite and (ii) for the foliated calcite and the directly adjacent chalk blades.
The mode of intergrowth of twin domains is defined by the twin laws [74]. Inorganic calcite is known to follow four classical twin laws, named after the Miller indices of the twin planes, the , , and planes [74,75]. These twin laws are regarded as the classical twin laws of calcite. Yin et al. [76], Lastam et al. [77] and Lastam et al. [78] showed that the most frequently occurring biocalcite twin law is the twin. Pokroy et al. [79] identified a fifth {108} twin in biogenic calcite. Schmahl et al. [80] detected, also for biologically secreted calcite, a further systematically and frequently reoccurring misorientation, a misorientation of 78° on the [6,7,8,9,10,11,12,13,14,15,16,17,18,19,20,21,22,23,24,25,26,27,28,29,30,31,32,33,34,35,36,37,38,39,40,41,42,43,44,45,46,47,48,49,50,51,52,53,54,55,56,57,58,59,60,61] twin axis and addresses this misorientation as a non-classical form of calcite twinning. Accordingly, when the changeover from folia to chalk blades is determined by a twin-related crystallographic operation, we need to see this not only in the pole figure given for the relevant twin, but also and, in particular, we need to see a marked peak in the misorientation angle diagram at a specific misorientation, which is defined by the relevant twin law. In the case of crystal twinning at the changeover from foliated to bladed calcite we should see a peak either at 60°, 78°, 79° or/and 104° misorientation. For the EBSD measurements, covering the foliated and adjacent chalk calcite, we find neither in the pole figures nor in the corresponding misorientation angle diagrams any indication for a twin-related changeover from the folia to the chalk blades (Figure 14 and Figure 15).
The structural relationship between adjacent columns
The EBSD scans that were measured for this study allowed the investigation of the mode of misorientation between adjacent columns of the Ostreoidea columnar shell layer, in particular, the structural analysis if adjacent columns are related to each other by a twin-related orientation relationship. As the orientational relationship of the twin domains of a twin crystal is crystallographically defined and is either a mirror operation on a crystallographic lattice plane or a rotation around a crystallographic axis, we show, for a large array of columns:
- along trajectories A to B (i) relative frequency–misorientation angle diagrams and (ii) degree of misorientation–distance diagrams (Figure S6).
- In addition, we give for 67 trajectories taken on adjacent columns (Figure S7A): (i) the misorientation angles and their frequencies (Figure S7B) as well as (ii) the crystallographic indices of the misorientation axes and the frequencies of these misorientation axes (Figure S7C).
Thus, if adjacent columns are related to each other through a crystal twin-defined orientational relationship, we would need to see a specific calcite twin law-related misorientation (at 60°, 78°, 79° or/and 104° misorientation) in one of the misorientation diagrams (Figure S6) or a frequently occurring, calcite twin law-related angle (Figure S7B, C), or a frequently occurring, twin law-related crystallographic axis, preferentially the (001) axis (Figure S7C). None of these is the case. We neither see a marked peak at (at 60°, 78°, 79° or/and 104° misorientation) in one of the misorientation diagrams, nor an often occurring, calcite twin-related, misorientation angle (Figure S7B), nor the frequent presence of a crystallographic axis (Figure S7C, D).
In essence, we examined in great detail calcite and aragonite crystal twin generation for the different shell microstructures of the investigated Ostreoidea species. For none of the calcite structures did we find any twin formation, only for myostracal aragonite. Crystal twin formation is widely observed for biological aragonites, e.g. for bivalves, gastropods, otoliths, corals [81,82], for bivalve columnar [81,83] and sheeted [81,82,84] nacre, for bivalve complex and crossed-lamellar aragonite [41,57,60,81,82,85,86,87,88] and for bivalve myostracal aragonite [41,57,60]. In contrast, disregarding the calcite of rotaliid foraminifera shells [76,78], crystal twin formation is absent in biologically secreted calcite. This is very surprising; we do not know the reason for that and need to decipher in future this structural imbalance.
Author Contributions
A.S.V. worte the manuscript and evaluated the EBSD data, E.G. performed EBSD measurements and evaluated the EBSD data, A.G.C. discussed the EBSD data and wrote the manuscript, W.W.S. discussed the EBSD data and wrote the manuscript, C.S. and E.M.H. discussed EBSD data and helped with writing the manuscript.
Data Availability Statement
The raw data supporting the conclusions of this article will be made available by the authors on request.
Acknowledgements
We thank Sebastian Hoerl for evaluating many EBSD data sets also with AZTec Crystal and for his comments to the manuscript. We thank Lisa Kreitmeier for the preparation of some Ostreoidea samples. W.W.S., E.G. and A.S.V. acknowledge funding by the German Research Council Programmes GR 9/1234, SCHM 930/11-2. A.G.C., and C.S.C acknowledge funding by projects PID2023-146394NB-I00 and PID2020116660GB-I00 (Spanish Ministry of Science and Innovation: MCIN/AEI/10.13039/501100011033/). A.G.C. also acknowledges the Unidad Científica de Excelencia UCE-PP2016-05 (University of Granada) and the Research Group RNM363 (Junta de Andalucía).
Conflicts of Interest
The authors declare no conflict of interest.
References
- Stenzel, H.B. Systematic Descriptions. In Treatise on invertebrate paleontology: Part N Mollusca 6: Bivalvia: Oysters; Moore, R.C., Ed.; The Geological Society of America: Boulder, CO, U.S.A., 1971; Vol. 3, pp. 1096–1172 ISBN ISBN 0-8137-3026-0.
- Márquez-Aliaga, A.; Jiménez-Jiménez, A.P.; Checa, A.G.; Hagdorn, H. Early Oysters and Their Supposed Permian Ancestors. Palaeogeogr. Palaeoclimatol. Palaeoecol. 2005, 229, 127–136. [CrossRef]
- Mouchi, V.; Pecheyran, C.; Claverie, F.; Cathalot, C.; Matabos, M.; Germain, Y.; Rouxel, O.; Jollivet, D.; Broquet, T.; Comtet, T. A Step towards Measuring Connectivity in the Deep Sea: Elemental Fingerprints of Mollusk Larval Shells Discriminate Hydrothermal Vent Sites. Biogeosciences 2024, 21, 145–160. [CrossRef]
- Yonge, C.M. Oysters; Collins, 1960;
- Bricteux-Gregoire, S.; Duchateau-Bosson, G.; Jeuniaux, C.; Florkin, M. Constituants Osmotiquement Actifs Des Muscles Adducteurs d’ostbea Edulis Adaptée a L’eau de Mer Ou a L’eau Saumatre. Arch. Int. Physiol. Biochim. 1964. [CrossRef]
- Van Rooij, D.; De Mol, L.; Le Guilloux, E.; Wisshak, M.; Huvenne, V. a. I.; Moeremans, R.; Henriet, J. Environmental Setting of Deep-Water Oysters in the Bay of Biscay. DEEP-SEA Res. PART -Oceanogr. Res. Pap. 2010, 57, 1561–1572. [CrossRef]
- Bieler, R.; Mikkelsen, P.M.; Lee, T.; Foighil, D.Ó. Discovery of the Indo-Pacific Oyster Hyotissa Hyotis (Linnaeus, 1758) in the Florida Keys (Bivalvia : Gryphaeidae). Molluscan Res. 2004, 24, 149–159. [CrossRef]
- Nakahara, H.; Bevelander, G. The Formation and Growth of the Prismatic Layer of Pinctada Radiata. Calcif Tissue Res 1971, 7, 31–45.
- MacDonald, J.; Freer, A.; Cusack, M. Alignment of Crystallographic C-Axis throughout the Four Distinct Microstructural Layers of the Oyster Crassostrea Gigas. Cryst. Growth Des. 2010, 10, 1243–1246. [CrossRef]
- Dauphin, Y.; Ball, A.D.; Castillo-Michel, H.; Chevallard, C.; Cuif, J.-P.; Farre, B.; Pouvreau, S.; Salomé, M. In Situ Distribution and Characterization of the Organic Content of the Oyster Shell Crassostrea Gigas (Mollusca, Bivalvia). Micron 2013, 44, 373–383. [CrossRef]
- Checa, A.G.; Macías-Sánchez, E.; Harper, E.M.; Cartwright, J.H.E. Organic Membranes Determine the Pattern of the Columnar Prismatic Layer of Mollusc Shells. Proc R Soc B 2016, 283.
- Checa, A.G.; Linares, F.; Maldonado-Valderrama, J.; Harper, E.M. Foamy Oysters: Vesicular Microstructure Production in the Gryphaeidae via Emulsification. J. R. Soc. Interface 2020, 17, 20200505. [CrossRef]
- Sancho Vaquer, A.; Checa, A.G.; Griesshaber, E.; Fernandez-Diaz, L.; Salas, C.; Schmahl, W.W. Layers Formed of Rhombohedral Calcite and Biopolymers in Oyster Shells. Crystals 2025, submitted.
- Liu, J.; Li, Q.; Kong, L.; Yu, H.; Zheng, X. Identifying the True Oysters (Bivalvia: Ostreidae) with Mitochondrial Phylogeny and Distance-Based DNA Barcoding. Mol. Ecol. Resour. 2011, 11, 820–830. [CrossRef]
- Bai, Y.; Liu, S.; Hu, Y.; Yu, H.; Kong, L.; Xu, C.; Li, Q. Multi-Omic Insights into the Formation and Evolution of a Novel Shell Microstructure in Oysters. BMC Biol. 2023, 21, 204. [CrossRef]
- Taylor, J.D.; Kennedy, W.J.; Hall, A. The Shell Structure and Mineralogy of the Bivalvia Introduction. Nuculacea-Trigonacea. Bull Br Mus Nat Hist 1969, Suppl. 3, 1–125.
- Carriker, M.R.; Palmer, R.E.; Sick, L.V.; Johnson, C.C. Interaction of Mineral Elements in Sea Water and Shell of Oysters (Crassostrea Virginica (Gmelin)) Cultured in Controlled and Natural Systems. J. Exp. Mar. Biol. Ecol. 1980, 46, 279–296. [CrossRef]
- Dungan, C.F. Aragonite-Fiber Calcification of the Hinge Ligament Mechanical Antagonist to Valve Adduction in Oysters. In Proceedings of the Journal of Shellfish Research; National Shellfisheries Association: Providence, Rhode Island, 2008; Vol. 27, pp. 1004–1005.
- Mouchi, V.; Lartaud, F.; Guichard, N.; Immel, F.; de Rafélis, M.; Broussard, C.; Crowley, Q.G.; Marin, F. Chalky versus Foliated: A Discriminant Immunogold Labelling of Shell Microstructures in the Edible Oyster Crassostrea Gigas. Mar. Biol. 2016, 163, 256. [CrossRef]
- Runnegar, B. Crystallography of the Foliated Calcite Shell Layers of Bivalve Molluscs. Alcheringa Australas. J. Palaeontol. 1984, 8, 273–290. [CrossRef]
- Checa, A.G.; Esteban-Delgado, F.J.; Rodríguez-Navarro, A.B. Crystallographic Structure of the Foliated Calcite of Bivalves. J. Struct. Biol. 2007, 157, 393–402. [CrossRef]
- Checa, A.G. Physical and Biological Determinants of the Fabrication of Molluscan Shell Microstructures. Front. Mar. Sci. 2018, 5.
- Esteban-Delgado, F.J.; Harper, E.M.; Checa, A.G.; Rodríguez-Navarro, A.B. Origin and Expansion of Foliated Microstructure in Pteriomorph Bivalves. Biol. Bull. 2008, 214, 153–165. [CrossRef]
- Checa, A.G.; Esteban-Delgado, F.J.; Ramírez-Rico, J.; Rodríguez-Navarro, A.B. Crystallographic Reorganization of the Calcitic Prismatic Layer of Oysters. J. Struct. Biol. 2009, 167, 261–270. [CrossRef]
- Harper, E.M. Post-Larval Cementation in the Ostreidae and Its Implications for Other Cementing Bivalvia. J. Molluscan Stud. 1992, 58, 37–47. [CrossRef]
- Harper, E.M. Attachment of Mature Oysters (Saccostrea Cucullata ) to Natural Substrata. Mar. Biol. 1997, 127, 449–453. [CrossRef]
- MacDonald, J.; Freer, A.; Cusack, M. Attachment of Oysters to Natural Substrata by Biologically Induced Marine Carbonate Cement. Mar. Biol. 2010, 157, 2087–2095. [CrossRef]
- Checa, A.G.; Harper, E.M.; González-Segura, A. Structure and Crystallography of Foliated and Chalk Shell Microstructures of the Oyster Magallana: The Same Materials Grown under Different Conditions. Sci. Rep. 2018, 8, 7507. [CrossRef]
- Bayne, B.L. Biology of Oysters; 1st Edition.; Academic Press: London, 2017; Vol. 41; ISBN 978-0-12-803472-9.
- Higuera-Ruiz, R.; Elorza, J. Biometric, Microstructural, and High-Resolution Trace Element Studies in Crassostrea Gigas of Cantabria (Bay of Biscay, Spain): Anthropogenic and Seasonal Influences. Estuar. Coast. Shelf Sci. 2009, 82, 201–213. [CrossRef]
- Banker, R.M.W.; Sumner, D.Y. Structure and Distribution of Chalky Deposits in the Pacific Oyster Using X-Ray Computed Tomography (CT). Sci. Rep. 2020, 10, 12118. [CrossRef]
- Griesshaber, E.; Yin, X.; Ziegler, A.; Kelm, K.; Checa, A.; Eisenhauer, A.; Schmahl, W.W. Patterns of Mineral Organization in Carbonate Biological Hard Materials. In Highlights in Applied Mineralogy; Heuss-Aßbichler, S., Amthauer, G., John, M., Eds.; De Gruyter, 2017; pp. 245–272 ISBN 978-3-11-049734-2.
- Hedegaard, C.; Wenk, H.-R. Microstructure and Texture Patterns of Molluse Shells. J. Molluscan Stud. 1998, 64, 133–136. [CrossRef]
- Chateigner, D.; Hedegaard, C.; Wenk, H.-R. Mollusc Shell Microstructures and Crystallographic Textures. J. Struct. Geol. 2000, 22, 1723–1735. [CrossRef]
- Hull, D. Introduction to Dislocations; Pergamon Press GmbH: Kronberg-Taunus, 1975;
- Seto, J.; Ma, Y.; Davis, S.A.; Meldrum, F.; Gourrier, A.; Kim, Y.Y.; Schilde, U.; Sztucki, M.; Burghammer, M.; Maltsev, S.; et al. Structure-Property Relationships of a Biological Mesocrystal in the Adult Sea Urchin Spine. Proc Natl Acad Sci U A 2012, 109, 3699–3704.
- Bergström, L.; Sturm (née Rosseeva), E.V.; Salazar-Alvarez, G.; Cölfen, H. Mesocrystals in Biominerals and Colloidal Arrays. Acc. Chem. Res. 2015, 48, 1391–1402. [CrossRef]
- Ma, M.-G.; Cölfen, H. Mesocrystals — Applications and Potential. Curr. Opin. Colloid Interface Sci. 2014, 19, 56–65. [CrossRef]
- Yin, X.; Griesshaber, E.; Fernández-Díaz, L.; Ziegler, A.; García-García, F.J.; Schmahl, W.W. Influence of Gelatin–Agarose Composites and Mg on Hydrogel-Carbonate Aggregate Formation and Architecture. Cryst. Growth Des. 2019, 19, 5696–5715. [CrossRef]
- Mackenzie, J.K. Second Paper on Statistics Associated with the Random Disorientation of Cubes. Biometrika 1958, 45, 229–240. [CrossRef]
- Hoerl, S.; Griesshaber, E.; Checa, A.G.; Schmahl, W.W. The Biological Crystals in Chamid Bivalve Shells: Diversity in Morphology and Crystal Arrangement Pattern. Crystals 2024, 14, 649. [CrossRef]
- Ritchie, R.O. Armoured Oyster Shells. Nat. Mater. 2014, 13, 435–437. [CrossRef]
- Gao, H.; Ji, B.; Jäger, I.L.; Arzt, E.; Fratzl, P. Materials Become Insensitive to Flaws at Nanoscale: Lessons from Nature. Proc. Natl. Acad. Sci. 2003, 100, 5597–5600. [CrossRef]
- Gim, J.; Schnitzer, N.; Otter, L.M.; Cui, Y.; Motreuil, S.; Marin, F.; Wolf, S.E.; Jacob, D.E.; Misra, A.; Hovden, R. Nanoscale Deformation Mechanics Reveal Resilience in Nacre of Pinna Nobilis Shell. Nat. Commun. 2019, 10, 4822. [CrossRef]
- Wegst, U.G.K.; Bai, H.; Saiz, E.; Tomsia, A.P.; Ritchie, R.O. Bioinspired Structural Materials. Nat. Mater. 2015, 14, 23–36. [CrossRef]
- Lu, K. Stabilizing Nanostructures in Metals Using Grain and Twin Boundary Architectures. Nat. Rev. Mater. 2016, 1, 1–13. [CrossRef]
- Sun, J.; Bhushan, B. Hierarchical Structure and Mechanical Properties of Nacre: A Review. RSC Adv. 2012, 2, 7617–7632. [CrossRef]
- Harper, E.M.; Checa, A.G. Tightly Shut: Flexible Valve Margins and Microstructural Asymmetry in Pterioid Bivalves. Mar. Biol. 2020, 167, 78. [CrossRef]
- Carter, J.G. Chapter 10. Evolutionary Significance of Shell Microstructure in the Palaeotaxodonta, Pteriomorphia and Isofilibranchia (Bivalvia: Mollusca). In Skeletal Biomineralization, Patterns, Processes and Evolutionary Trends; Carter, J.G., Ed.; Van Nostrand Reinhold, New York, 1990; Vol. 1, pp. 135–296.
- Griesshaber, E.; Sancho Vaquer, A.; Checa, A.G.; Salas, C.; Harper, E.M.; Schmahl, W.W. The Texture Motif of Ostreoidea Shell Calcite. Crystals 2025, submitted.
- Aylmore, L. a. G.; Quirk, J.P. Swelling of Clay–Water Systems. Nature 1959, 183, 1752–1753. [CrossRef]
- Lutterotti, L. Total Pattern Fitting for the Combined Size–Strain–Stress–Texture Determination in Thin Film Diffraction. Nucl. Instrum. Methods Phys. Res. Sect. B Beam Interact. Mater. At. 2010, 268, 334–340. [CrossRef]
- Schmahl, W.W.; Sancho Vaquer, A.; Checa, A.; Griesshaber, E. The Very Specific Texture Motif of the Oyster Shell Turbostratic Foliated Microstructure. Ludwig-Maximilians-Universität München, Munich, Germany. 2025, to be submitted.
- Yamaguchi, K. Shell Structure and Behaviour Related to Cementation in Oysters. Mar. Biol. 1994, 118, 89–100. [CrossRef]
- Simonet Roda, M.; Griesshaber, E.; Angiolini, L.; Rollion-Bard, C.; Harper, E.M.; Bitner, M.A.; Milner Garcia, S.; Ye, F.; Henkel, D.; Häussermann, V.; et al. The Architecture of Recent Brachiopod Shells: Diversity of Biocrystal and Biopolymer Assemblages in Rhynchonellide, Terebratulide, Thecideide and Craniide Shells. Mar. Biol. 2021, 169, 4. [CrossRef]
- Casella, L.A.; He, S.; Griesshaber, E.; Fernández-Díaz, L.; Greiner, M.; Harper, E.M.; Jackson, D.J.; Ziegler, A.; Mavromatis, V.; Dietzel, M.; et al. Hydrothermal Alteration of Aragonitic Biocarbonates: Assessment of Micro- and Nanostructural Dissolution–Reprecipitation and Constraints of Diagenetic Overprint from Quantitative Statistical Grain-Area Analysis. Biogeosciences 2018, 15, 7451–7484. [CrossRef]
- Hoerl, S.; Le Moine, T.; Peter, N.J.; Amini, S.; Griesshaber, E.; Wang, J.; Harper, E.M.; Salas, C.; Checa, A.G.; Schwaiger, R.; et al. Crystal Organisation and Material Properties of Chama and Glycymeris Myostraca and Shells. Materialia 2024, 36, 102149. [CrossRef]
- Hoerl, S.; Micheletti, C.; Amini, S.; Griesshaber, E.; Peharda, M.; Schmahl, W.W. The Difference in Microstructure, Texture and Mechanical Behaviour between Glycymeris, Chama and Placopecten Myostraca. Materialia 2024.
- Mackinnon, D.I.; Williams, A. The Formation of Muscle Scars in Articulate Brachiopods. Philos. Trans. R. Soc. Lond. B Biol. Sci. 1997, 280, 1–27. [CrossRef]
- Hoerl, S.; Griesshaber, E.; Häussermann, V.; Achterhold, C.; Amini, S.; Schmahl, W.W. Calcite Crystal Organization and Architecture of the Muscle Scars, the Myotests of Modern Brachiopod Shells. Ludwig-Maximilians-Universität München, Munich, Germany. 2025, to be submitted.
- Carriker, M.R.; Palmer, R.E. A New Mineralized Layer in the Hinge of the Oyster. Science 1979, 206, 691–693. [CrossRef]
- Douvillé, H. Le Test Des Ostréidés Du Groupe de l’Ostrea Cochlear (Genre Pycnodonta, F. de W.). C R Hebdm Séances Acad Sci Paris 1936, 203, 1113–1117.
- Ranson, G. Les Espèces Actuelles et Fossils Du Genre Pycnodonta F. de W.: 1. Pycnodonta Hyotis (L.). Bull Mus Natl Hist Nat Paris 1941, 13, 82–92.
- Chinzei, K.; Seilacher, A. Remote biomineralization I: fill skeletons in vesicular oyster shells. Jb Geol Paläontol Abh 1993, 190, 349–361.
- Vermeij, G.J. The Oyster Enigma Variations: A Hypothesis of Microbial Calcification. Paleobiology 2013, 40, 1–13. [CrossRef]
- Banker, R.; Vermeij, G.J. Oyster Microbial Communities and Implications for Chalky Deposit Formation. Hydrobiologia 2018, 816, 121–135. [CrossRef]
- Korringa, P. On the Nature and Function of “Chalky” Deposits in the Shell of Ostrea Edulis Linnaeus. Proc. Calif. Acad. Sci. 4th Ser. 1951, 27, 133--158.
- Pelseneer, P. Hermaphrodite Oysters. Nature 1929, 124, 14–14. [CrossRef]
- Galtsoff, P.S. The American Oyster, Crassostrea Virginica (Gmelin). Chesap. Sci. 1965, 6, 199–199. [CrossRef]
- Margolis, S.V.; Carver, R.E. Microsculpture of Chalky Deposits Found in Shells of the Oyster Crassostrea Virginica. The Nautilus 1974, 8.
- Ullmann, C.V.; Böhm, F.; Rickaby, R.E.M.; Wiechert, U.; Korte, C. The Giant Pacific Oyster (Crassostrea Gigas) as a Modern Analog for Fossil Ostreoids: Isotopic (Ca, O, C) and Elemental (Mg/Ca, Sr/Ca, Mn/Ca) Proxies. Geochem. Geophys. Geosystems 2013, 14, 4109–4120. [CrossRef]
- de Winter, N.J.; Daemmer, L.K.; Falkenroth, M.; Reichart, G.-J.; Moretti, S.; Martinez-Garcia, A.; Hoeche, N.; Schoene, B.R.; Rodiouchkina, K.; Goderis, S.; et al. Multi-Isotopic and Trace Element Evidence against Different Formation Pathways for Oyster Microstructures. Geochim. Cosmochim. ACTA 2021, 308, 326–352. [CrossRef]
- Simonet Roda, M.; Griesshaber, E.; Angiolini, L.; Harper, D.A.T.; Jansen, U.; Bitner, M.A.; Henkel, D.; Manzanero, E.; Müller, T.; Tomašových, A.; et al. The Evolution of Thecideide Microstructures and Textures: Traced from Triassic to Holocene. Lethaia 2021, 54, 558–577. [CrossRef]
- Hahn, Th.; Klapper, H. Twinning of Crystals. In International Tables for Crystallography, Online MRW; John Wiley & Sons, Ltd, 2006; pp. 393–448 ISBN 978-0-470-68575-4.
- Richards, R.P. The Four Twin Laws of Calcite and How to Recognize Them. Rocks Miner. 1999, 75, 308–317.
- Yin, X.; Griesshaber, E.; Checa, A.G.; Nindiyasari-Behal, F.; Sánchez-Almazo, I.; Ziegler, A.; Schmahl, W.W. Calcite Crystal Orientation Patterns in the Bilayers of Laminated Shells of Benthic Rotaliid Foraminifera. J. Struct. Biol. 2021, 231, 107707.
- Lastam, J.; Griesshaber, E.; Yin, X.; Rupp, U.; Sánchez-Almazo, I.; Heß, M.; Walther, P.; Checa, A.; Schmahl, W.W. Patterns of Crystal Organization and Calcite Twin Formation in Planktonic, Rotaliid, Foraminifera Shells and Spines. J. Struct. Biol. 2022, 215, 107898. [CrossRef]
- Lastam, J.; Griesshaber, E.; Yin, X.; Rupp, U.; Sánchez-Almazo, I.; Heß, M.; Walther, P.; Checa, A.; Schmahl, W.W. The Unique Fibrilar to Platy Nano- and Microstructure of Twinned Rotaliid Foraminiferal Shell Calcite. Sci. Rep. 2023, 13, 2189. [CrossRef]
- Pokroy, B.; Kapon, M.; Marin, F.; Adir, N.; Zolotoyabko, E. Protein-Induced, Previously Unidentified Twin Form of Calcite. Proc. Natl. Acad. Sci. 2007, 104, 7337–7341. [CrossRef]
- Suzuki, M.; Kim, H.; Mukai, H.; Nagasawa, H.; Kogure, T. Quantitative XRD Analysis of {1 1 0} Twin Density in Biotic Aragonites. J. Struct. Biol. 2012, 180, 458–468. [CrossRef]
- Suzuki, M.; Kim, H.; Mukai, H.; Nagasawa, H.; Kogure, T. Quantitative XRD Analysis of {1 1 0} Twin Density in Biotic Aragonites. J. Struct. Biol. 2012, 180, 458–468. [Google Scholar] [CrossRef]
- Kogure, T.; Suzuki, M.; Kim, H.; Mukai, H.; Checa, A.G.; Sasaki, T.; Nagasawa, H. Twin Density of Aragonite in Molluscan Shells Characterized Using X-Ray Diffraction and Transmission Electron Microscopy. J. Cryst. Growth 2014, 397, 39–46. [CrossRef]
- Mutvei, H. Ultrastructural Characteristics of the Nacre in Some Gastropods. Zool. Scr. 1978, 7, 287–296. [CrossRef]
- Griesshaber, E.; Schmahl, W.W.; Ubhi, H.S.; Huber, J.; Nindiyasari, F.; Maier, B.; Ziegler, A. Homoepitaxial Meso- and Microscale Crystal Co-Orientation and Organic Matrix Network Structure in Mytilus Edulis Nacre and Calcite. Acta Biomater. 2013, 9, 9492–9502. [CrossRef]
- Kobayashi, I.; Akai, J. Twinned Aragonite Crystals Found in the Bivalvian Crossed Lamellar Shell Structure. J. Geol. Soc. Jpn. 1994, 100, 177–180. [CrossRef]
- Almagro, I.; Drzymała, P.; Berent, K.; Sainz-Díaz, C.I.; Willinger, M.G.; Bonarski, J.; Checa, A.G. New Crystallographic Relationships in Biogenic Aragonite: The Crossed-Lamellar Microstructures of Mollusks. Cryst Growth Des 2016, 16.
- Crippa, G.; Griesshaber, E.; Checa, A.G.; Harper, E.M.; Simonet Roda, M.; Schmahl, W.W. SEM, EBSD, Laser Confocal Microscopy and FE-SEM Data from Modern Glycymeris Shell Layers. Data Brief 2020, 33, 106547. [CrossRef]
- Crippa, G.; Griesshaber, E.; Checa, A.G.; Harper, E.M.; Simonet Roda, M.; Schmahl, W.W. Orientation Patterns of Aragonitic Crossed-Lamellar, Fibrous Prismatic and Myostracal Microstructures of Modern Glycymeris Shells. J. Struct. Biol. 2020, 212, 107653. [CrossRef]
Figure 1.
Ostreoidea shell crystal morphology, shell layer internal structuring and relative frequency-misorientation angle distributions for the different crystal assembly patterns. A to G: EBSD band contrast measurement images. The inserts give relative frequency versus misorientation angle diagrams for the shown EBSD scans and, thus, microstructures. A: Sequence of columns seaming outer valve surfaces. B: Array of folia forming the foliated units. C: String of granules intercalated into the organic matrix of the cementation layer, the layer that attaches the lower valve external surface to the substrate. D: Meshwork of blades and laths forming the cavity-rich structure of the chalk. E: Conglomeration of variously sized dendritic, polyhedral crystals facilitating the occlusion of pores into the Gryphaeidae shells. F: The prisms of the myostraca, the shell section where the muscles attach to. G: Accumulation of rhombohedral crystals within organic substance in Ostreidae shells.

Figure 2.
Diversity in relative frequency-misorientation angle patterns for the microstructures that comprise Ostreoidea shells (A to G). H: MacKenzie curves for random misorientation angle distribution [40], given for calcite and aragonite. A, C, D, E: Random distribution of misorientation angles. B, F, G: Structured distribution of misorientation angles, note the structured distribution of misorientation angles for folia (B). We find for (A) and (E) a comparable pattern for the distribution of misorientation angles, alike for (C) and (D). For the latter, we find a gradual change and increasing development to the formation of large misorientations. Note the difference in magnitude of misorientation angle between the assembly of folia (B) and the assembly of chalk blades/laths (C).
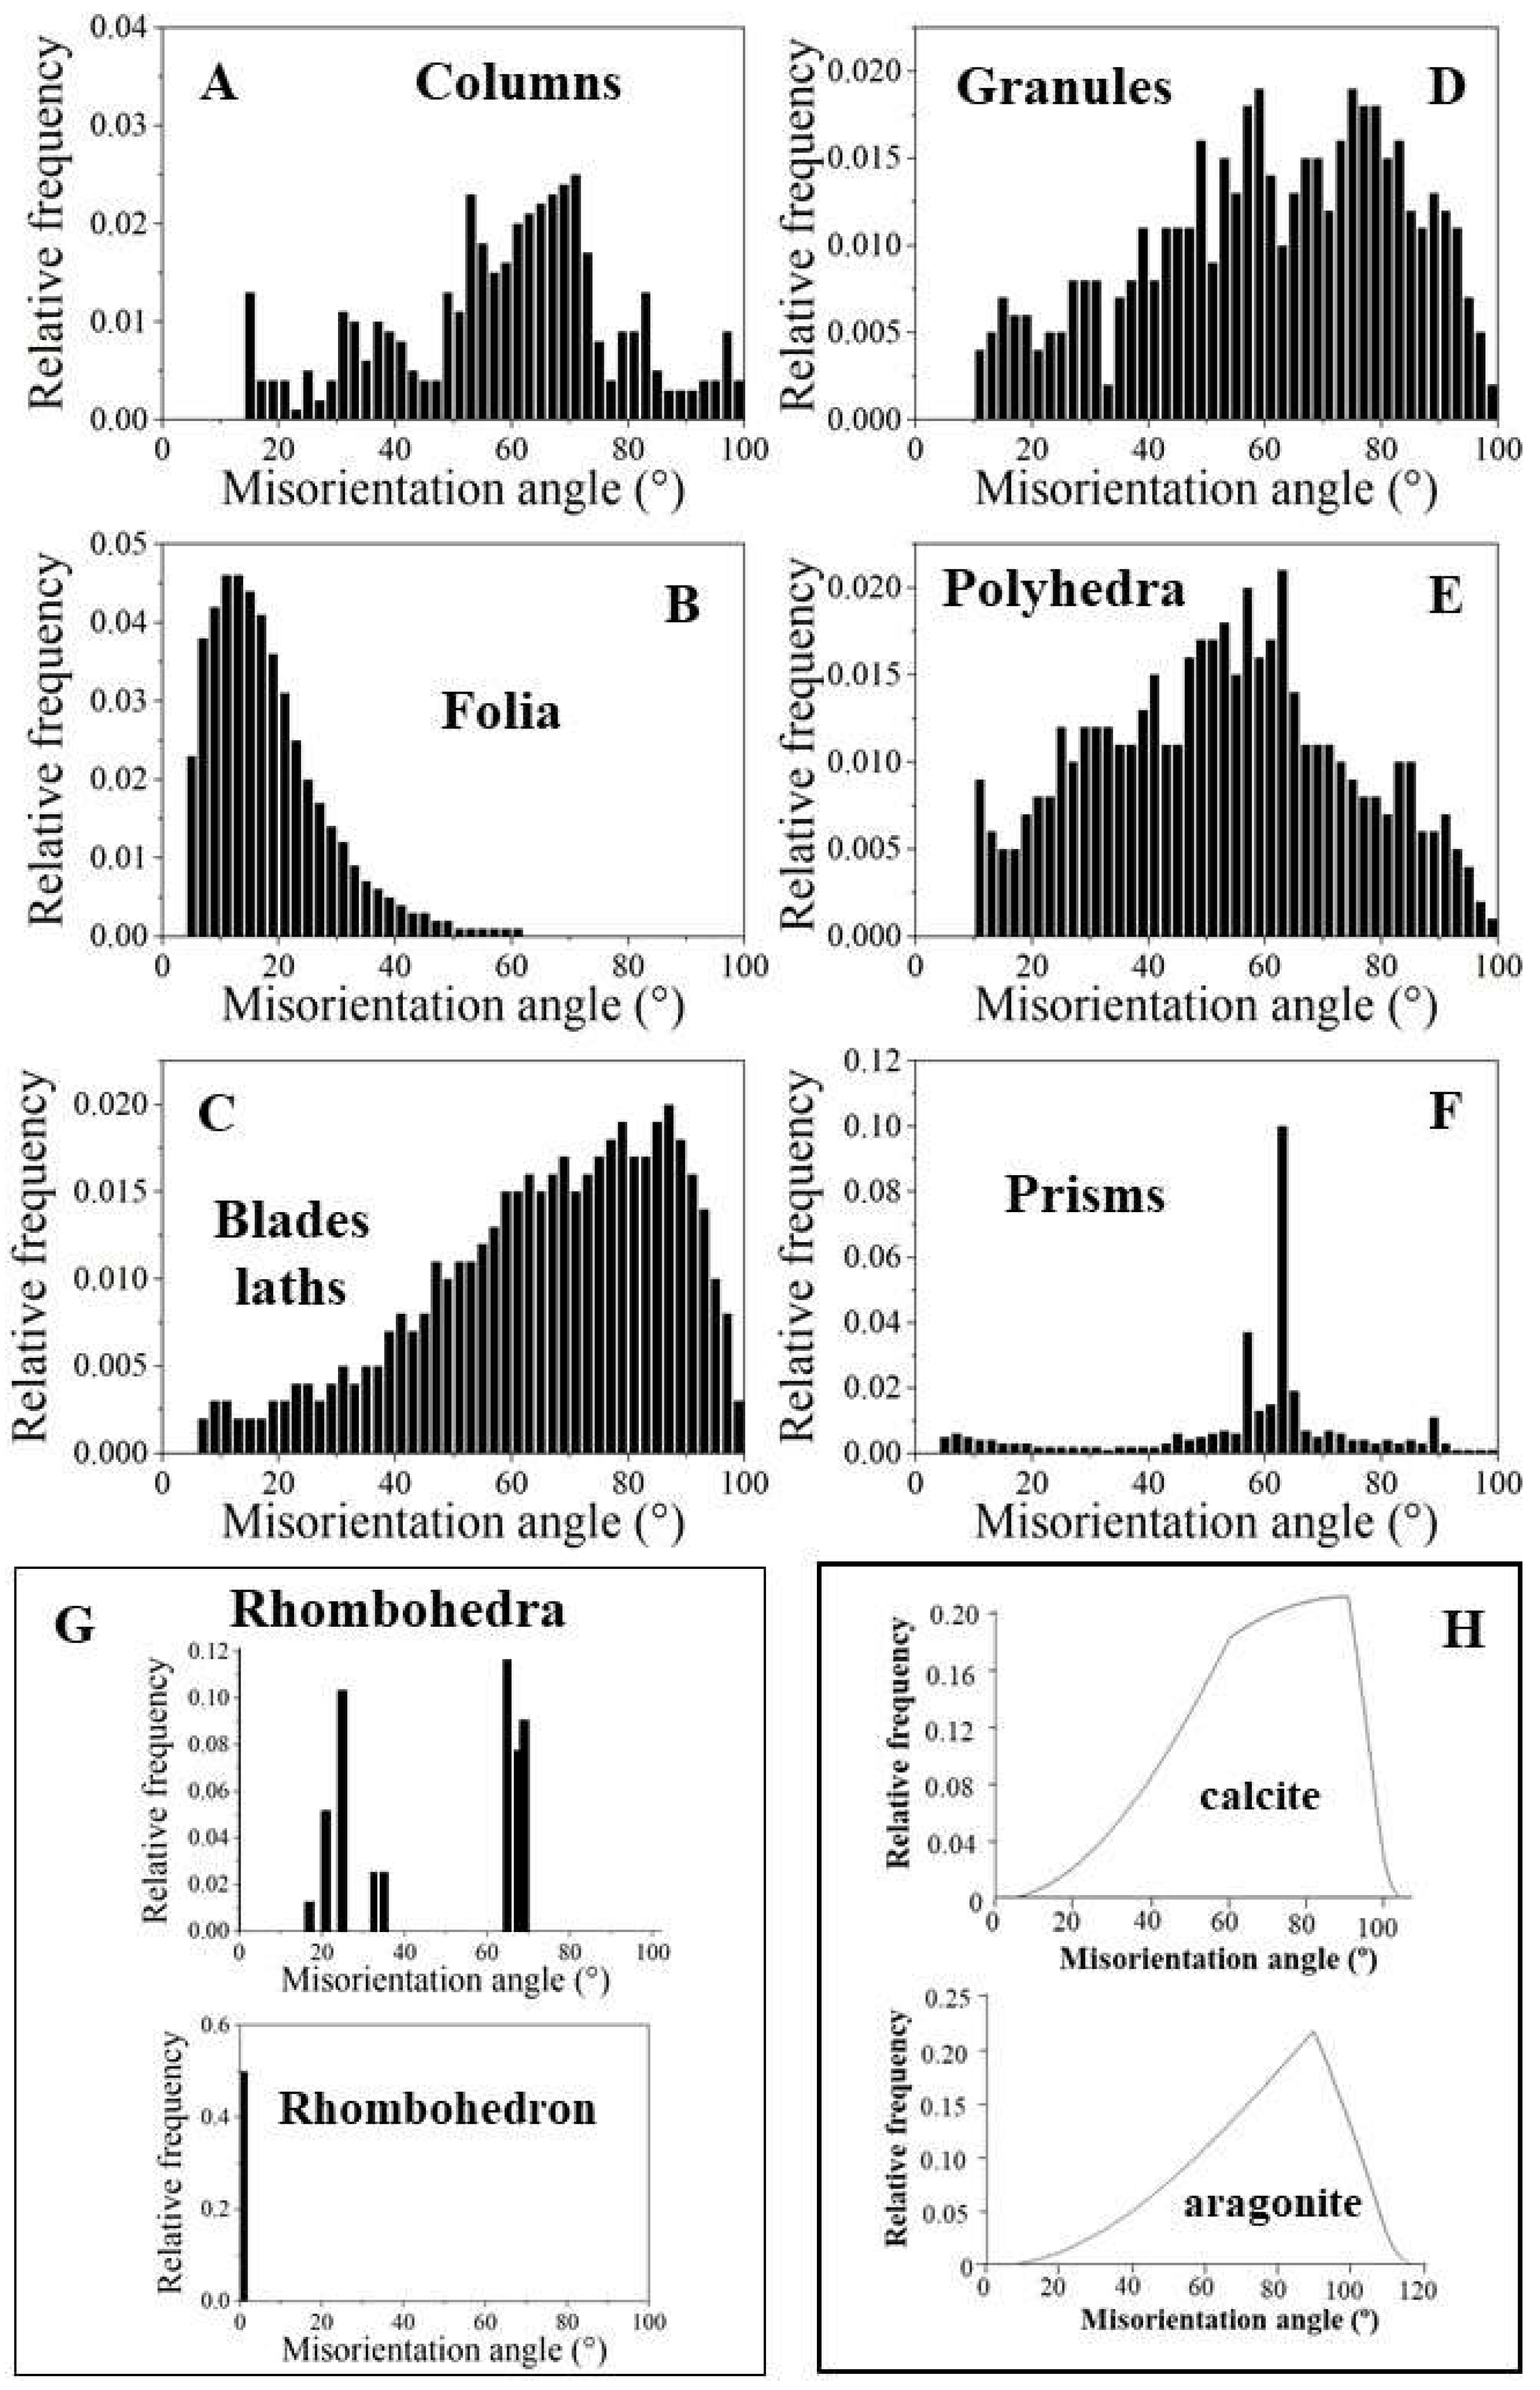
Figure 3.
Internal structure, microstructure, crystal texture and crystal co-orientation strength of the array of columns that seam the outermost valve layer of Magallana gigas shells. A to D, F: BSE micrographs. E: EBSD band contrast measurement image. F, G, I, J, K: Color-coded crystal orientation (EBSD maps), crystal texture (pole figures) and crystal co-orientation strength (MUD value) of individual columns (J, K, L) and of arrays of columns (G, I). H: The foliated shell adjacent to a sequence of columns (I). Note the difference in texture but similarity in crystal co-orientation strength for the columns and for the adjacent sequence of foliated units (H, I). Individual columns are internally structured and are formed of subunits (domains) consisting of well co-oriented calcite crystallites (F, J) (Figure S3B). The internal structure of the columns as well as of their subunits is different to that of the foliated units, nonetheless, we find only low angle misorientations within the columns (see the relative frequency-misorientation angle diagrams for individual columns in (K)), as it is also the case for the assembly of folia and foliated units (see the misorientation angle diagram in Figure 1B). Note the layering within the columns (A to C), visualizing different growth stages. Black arrows in the pole figures in (H) and (I) indicate the overall direction of c-axis orientation and show an about 30° misorientation in c-axis orientation between an array of columns and the adjacent foliated shell (H, I). At EBSD data acquisition and EBSD data evaluation, the three Euler angles were kept at 0°; φ1=0°, Φ=0°, φ2=0°.
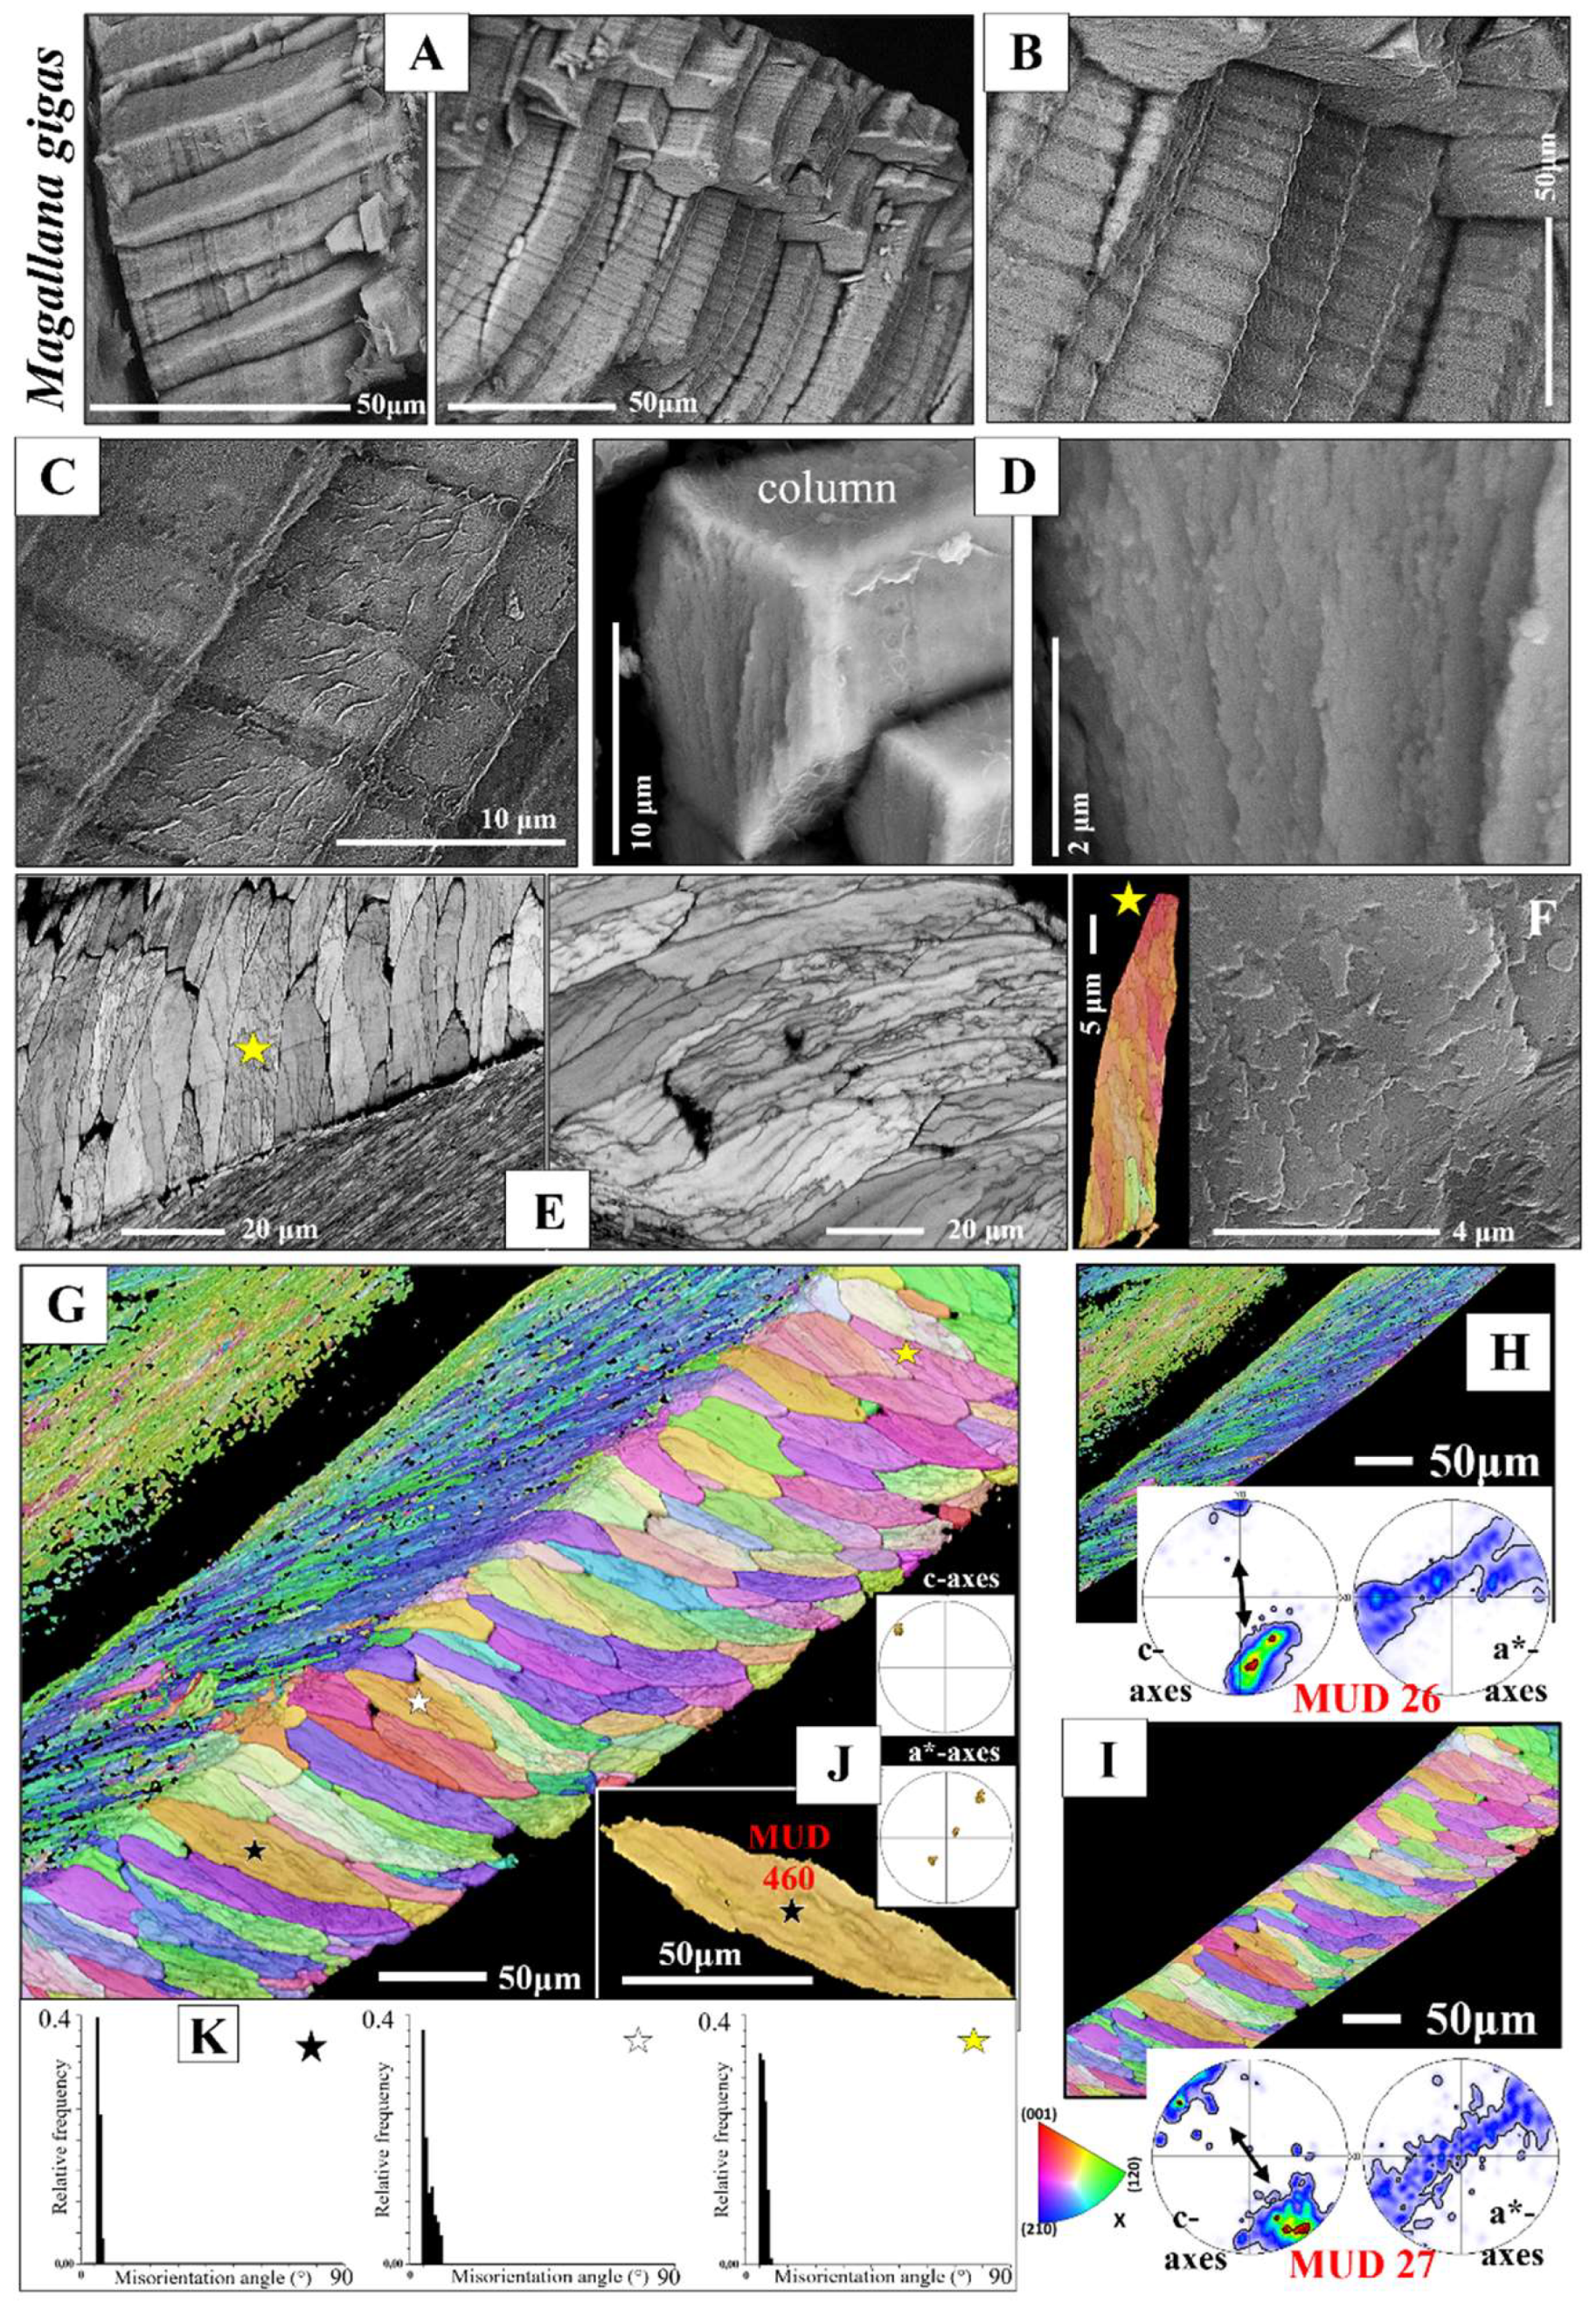
Figure 4.
The folia and assemblies of folia that generate ostreoidean foliated units, e.g., as those shown in E and F. A to C: BSE micrographs highlighting the morphology and dimension (width and thickness) of lath-shaped, arrowhead ended crystals and of individual folia. D: Crystal orientation, crystal texture and crystal co-orientation strength of two individual folia. The calcite of a folium is strongly co-oriented (see MUD values in D). E, F: EBSD scans of foliated units, consisting of stacks of folia. Note the mode of c- and a*-axes orientation distribution in the pole figures (E, F). The gradual change in color (EBSD map and pole figures), as well as the gradual change in tilt of both crystallographic axes (see the pole figures), demonstrates that the foliated crystal units are entities with a graded calcite c- and a*-axes orientation. We observe a marked gradedness in orientation for both, calcite c- as well as a*-axes. E, F: Relative frequency-misorientation angle diagrams are given for the crystal shown in the figure; we observe very low misorientation angles between adjacent folia. Euler angles were kept at zero for EBSD data acquisition and analysis for the measurements shown in D, E, F.
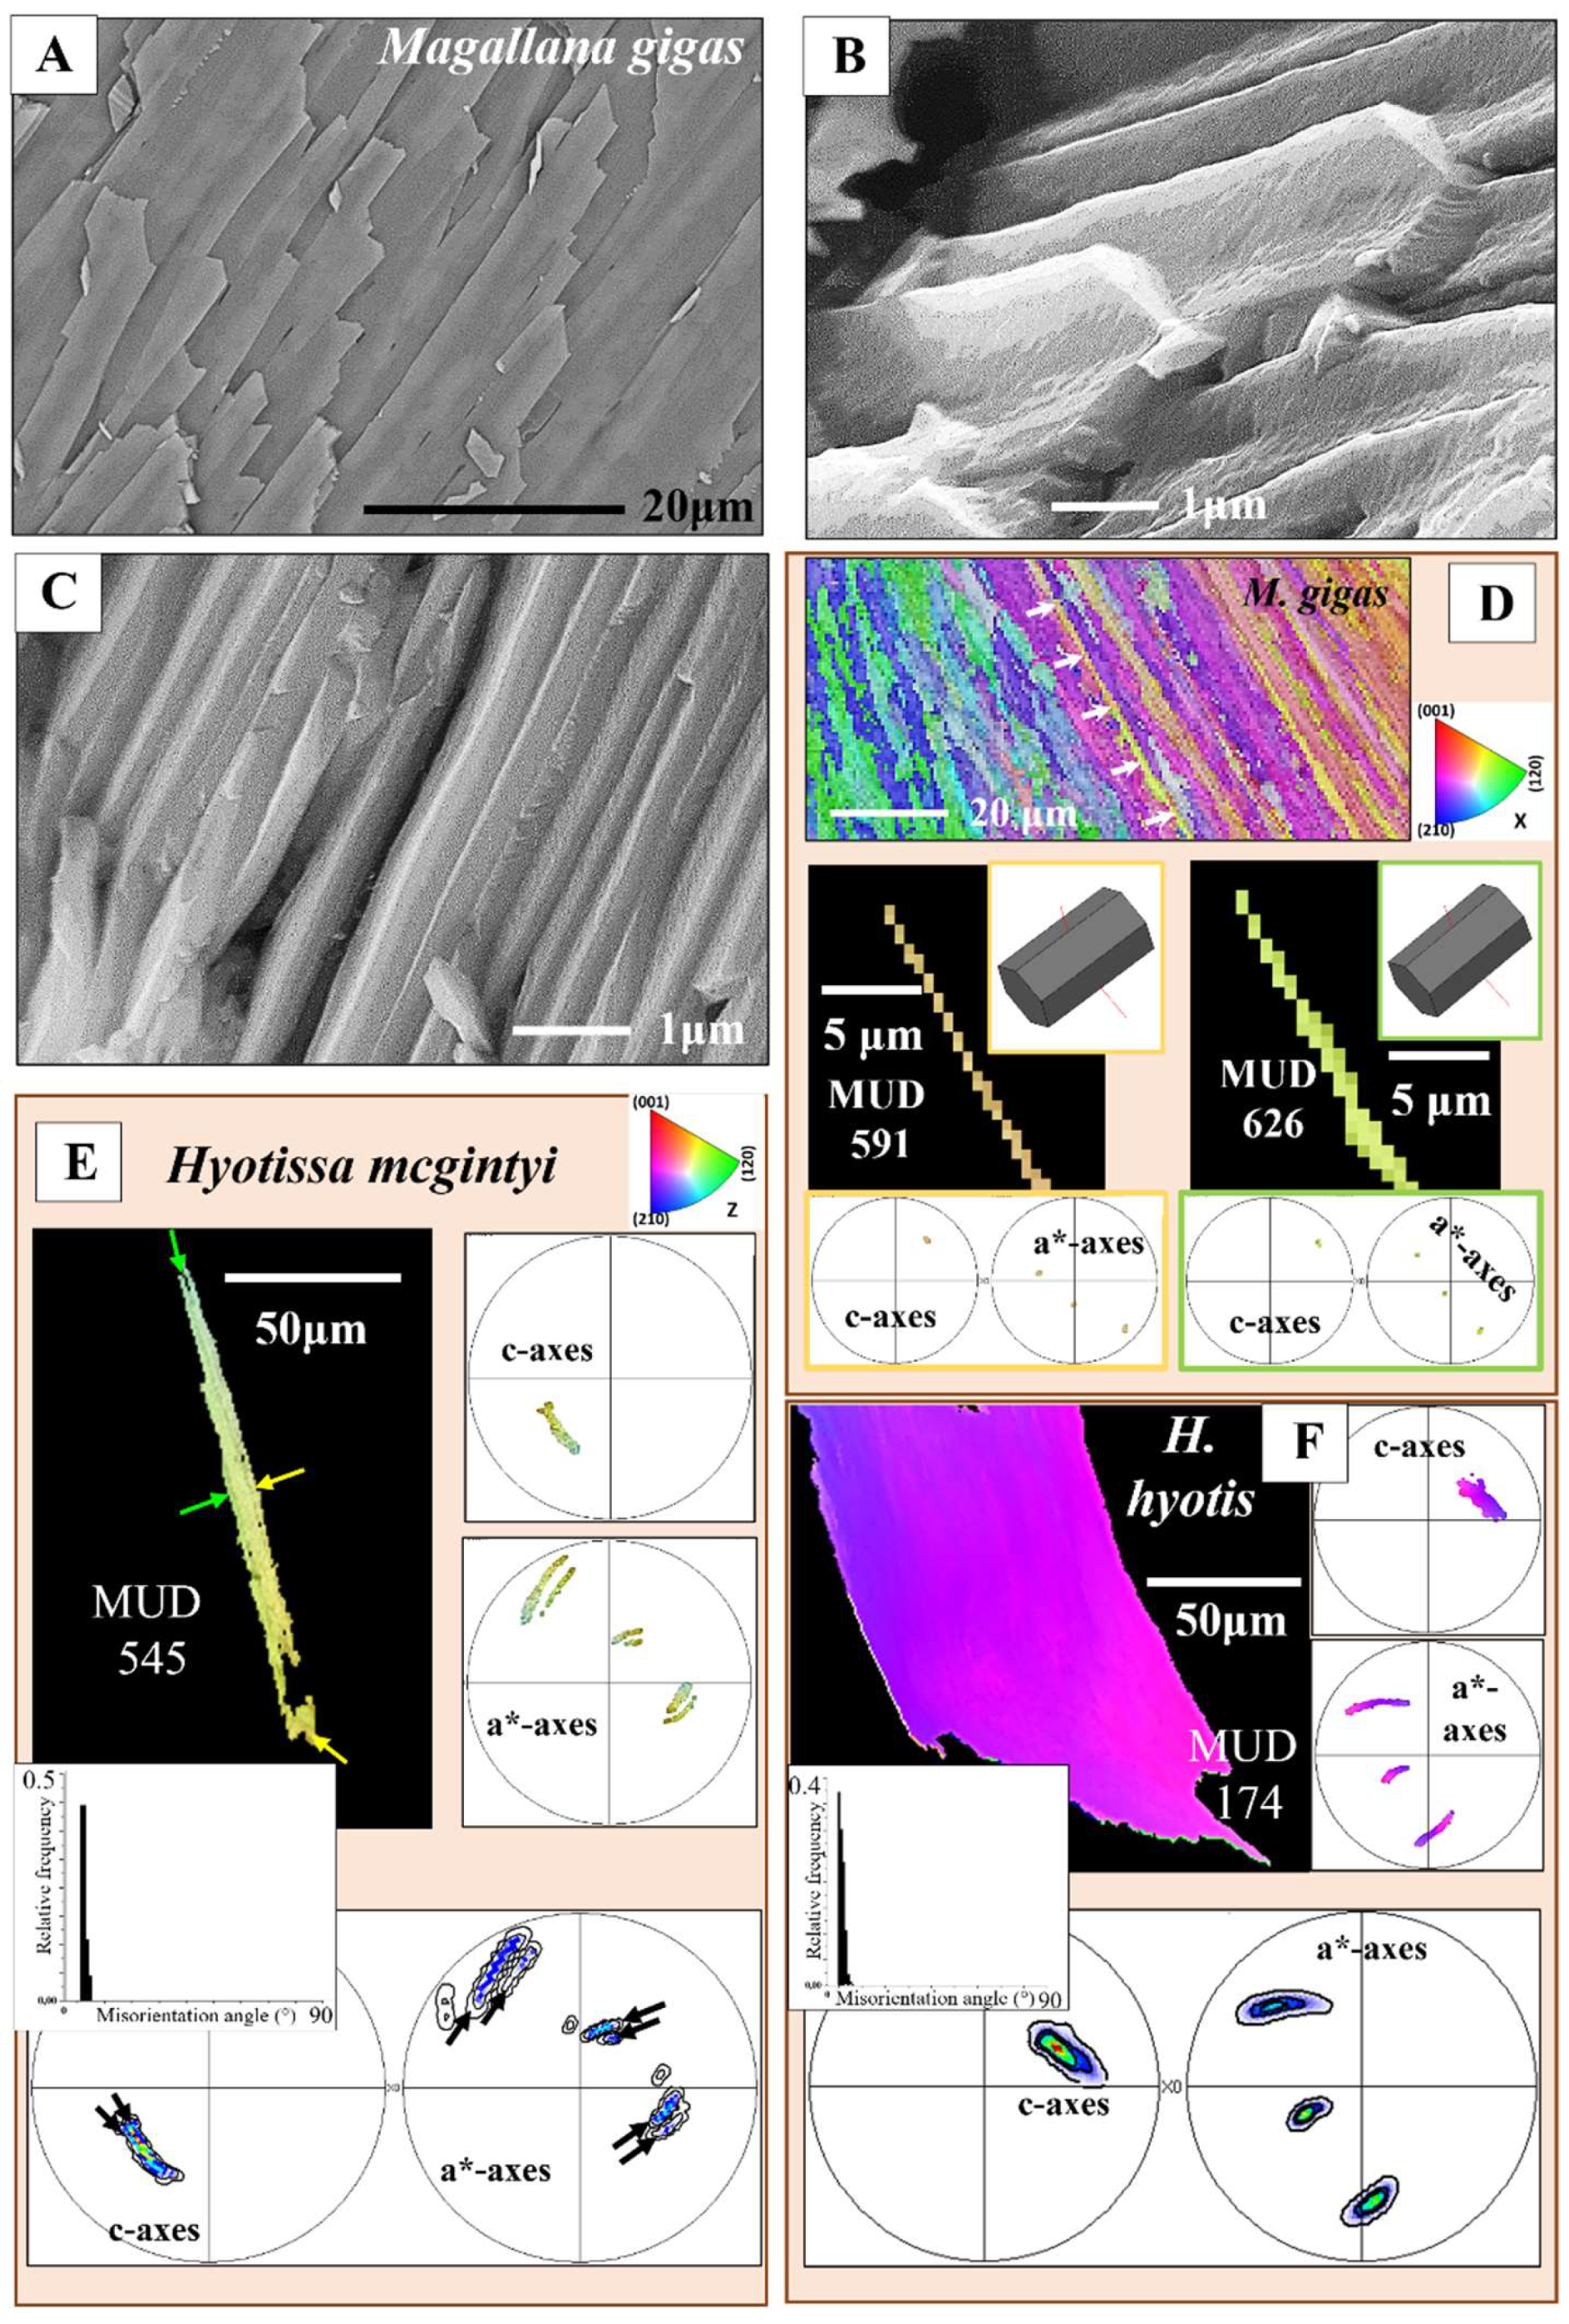
Figure 5.
A: EBSD crystal orientation map of an assembly of foliated crystals for the shell of Hyotissa hyotis, visualizing their size, internal structure and interlinkage. B to D: Individual foliated units selected from different parts of the foliated shell (indicated with a red, yellow or white star in the EBSD map in (A)). The organization of crystallographic c- and a*-axes of/in the foliated units is indicated with sketched crystals and corresponding misorientation angle - distance diagrams. These show misorientation between crystallites along trajectories a to b and c to d (B to D). We give (i) the cumulative misorientation angle, the increase in misorientation angle, relative to the first point on the trajectory and (ii) the misorientation angle from point to point along the trajectory, thus the local misorientation angle, misorientation between adjacent crystals. For the foliated units shown in (B) and (C), we observe a gradual rotation of crystallographic c- and a*-axes orientation, in both directions, along the length as well as perpendicular to the length of the foliated unit, see sketched crystals in (B) and (C). The result is that we find a gradual increase in misorientation angle, relative to the first point on the trajectory and a very low degree of misorientation from point to point (B, C). The crystals in (B) and (C) are small, foliated units, while the crystal shown in (D) is a large foliated unit. For the latter crystal (D) we do not find for the crystal portion that is scanned with EBSD such a clear-cut gradual rotation in crystallographic axes orientation, but rather, for adjacent crystallites (possibly folia) an abrupt tilt between two crystallographic axes orientations (see the sketched crystals in (D)). This is also observable from the misorientation angle-distance diagrams (E). Even though an increase in the degree of misorientation angle, relative to the first point on the trajectory, is still present in the misorientation angle - distance diagrams (D), the gradual increase in cumulative misorientation angle, with distance away from the first point on the trajectory, is not as smooth, as it is for the foliated units shown in (B) and (C). In addition, we find, for the crystal in (D) a large degree of misorientation from crystallite to crystallite, from folium to folium. Note as well that the degree of misorientation, relative to the first point as well as from point to point is different for the crystals given in (B), (C), (D) thus, different for the different parts of the foliated shell. The degree of misorientation between adjacent crystallites increases significantly with distance away from the inner shell surface.
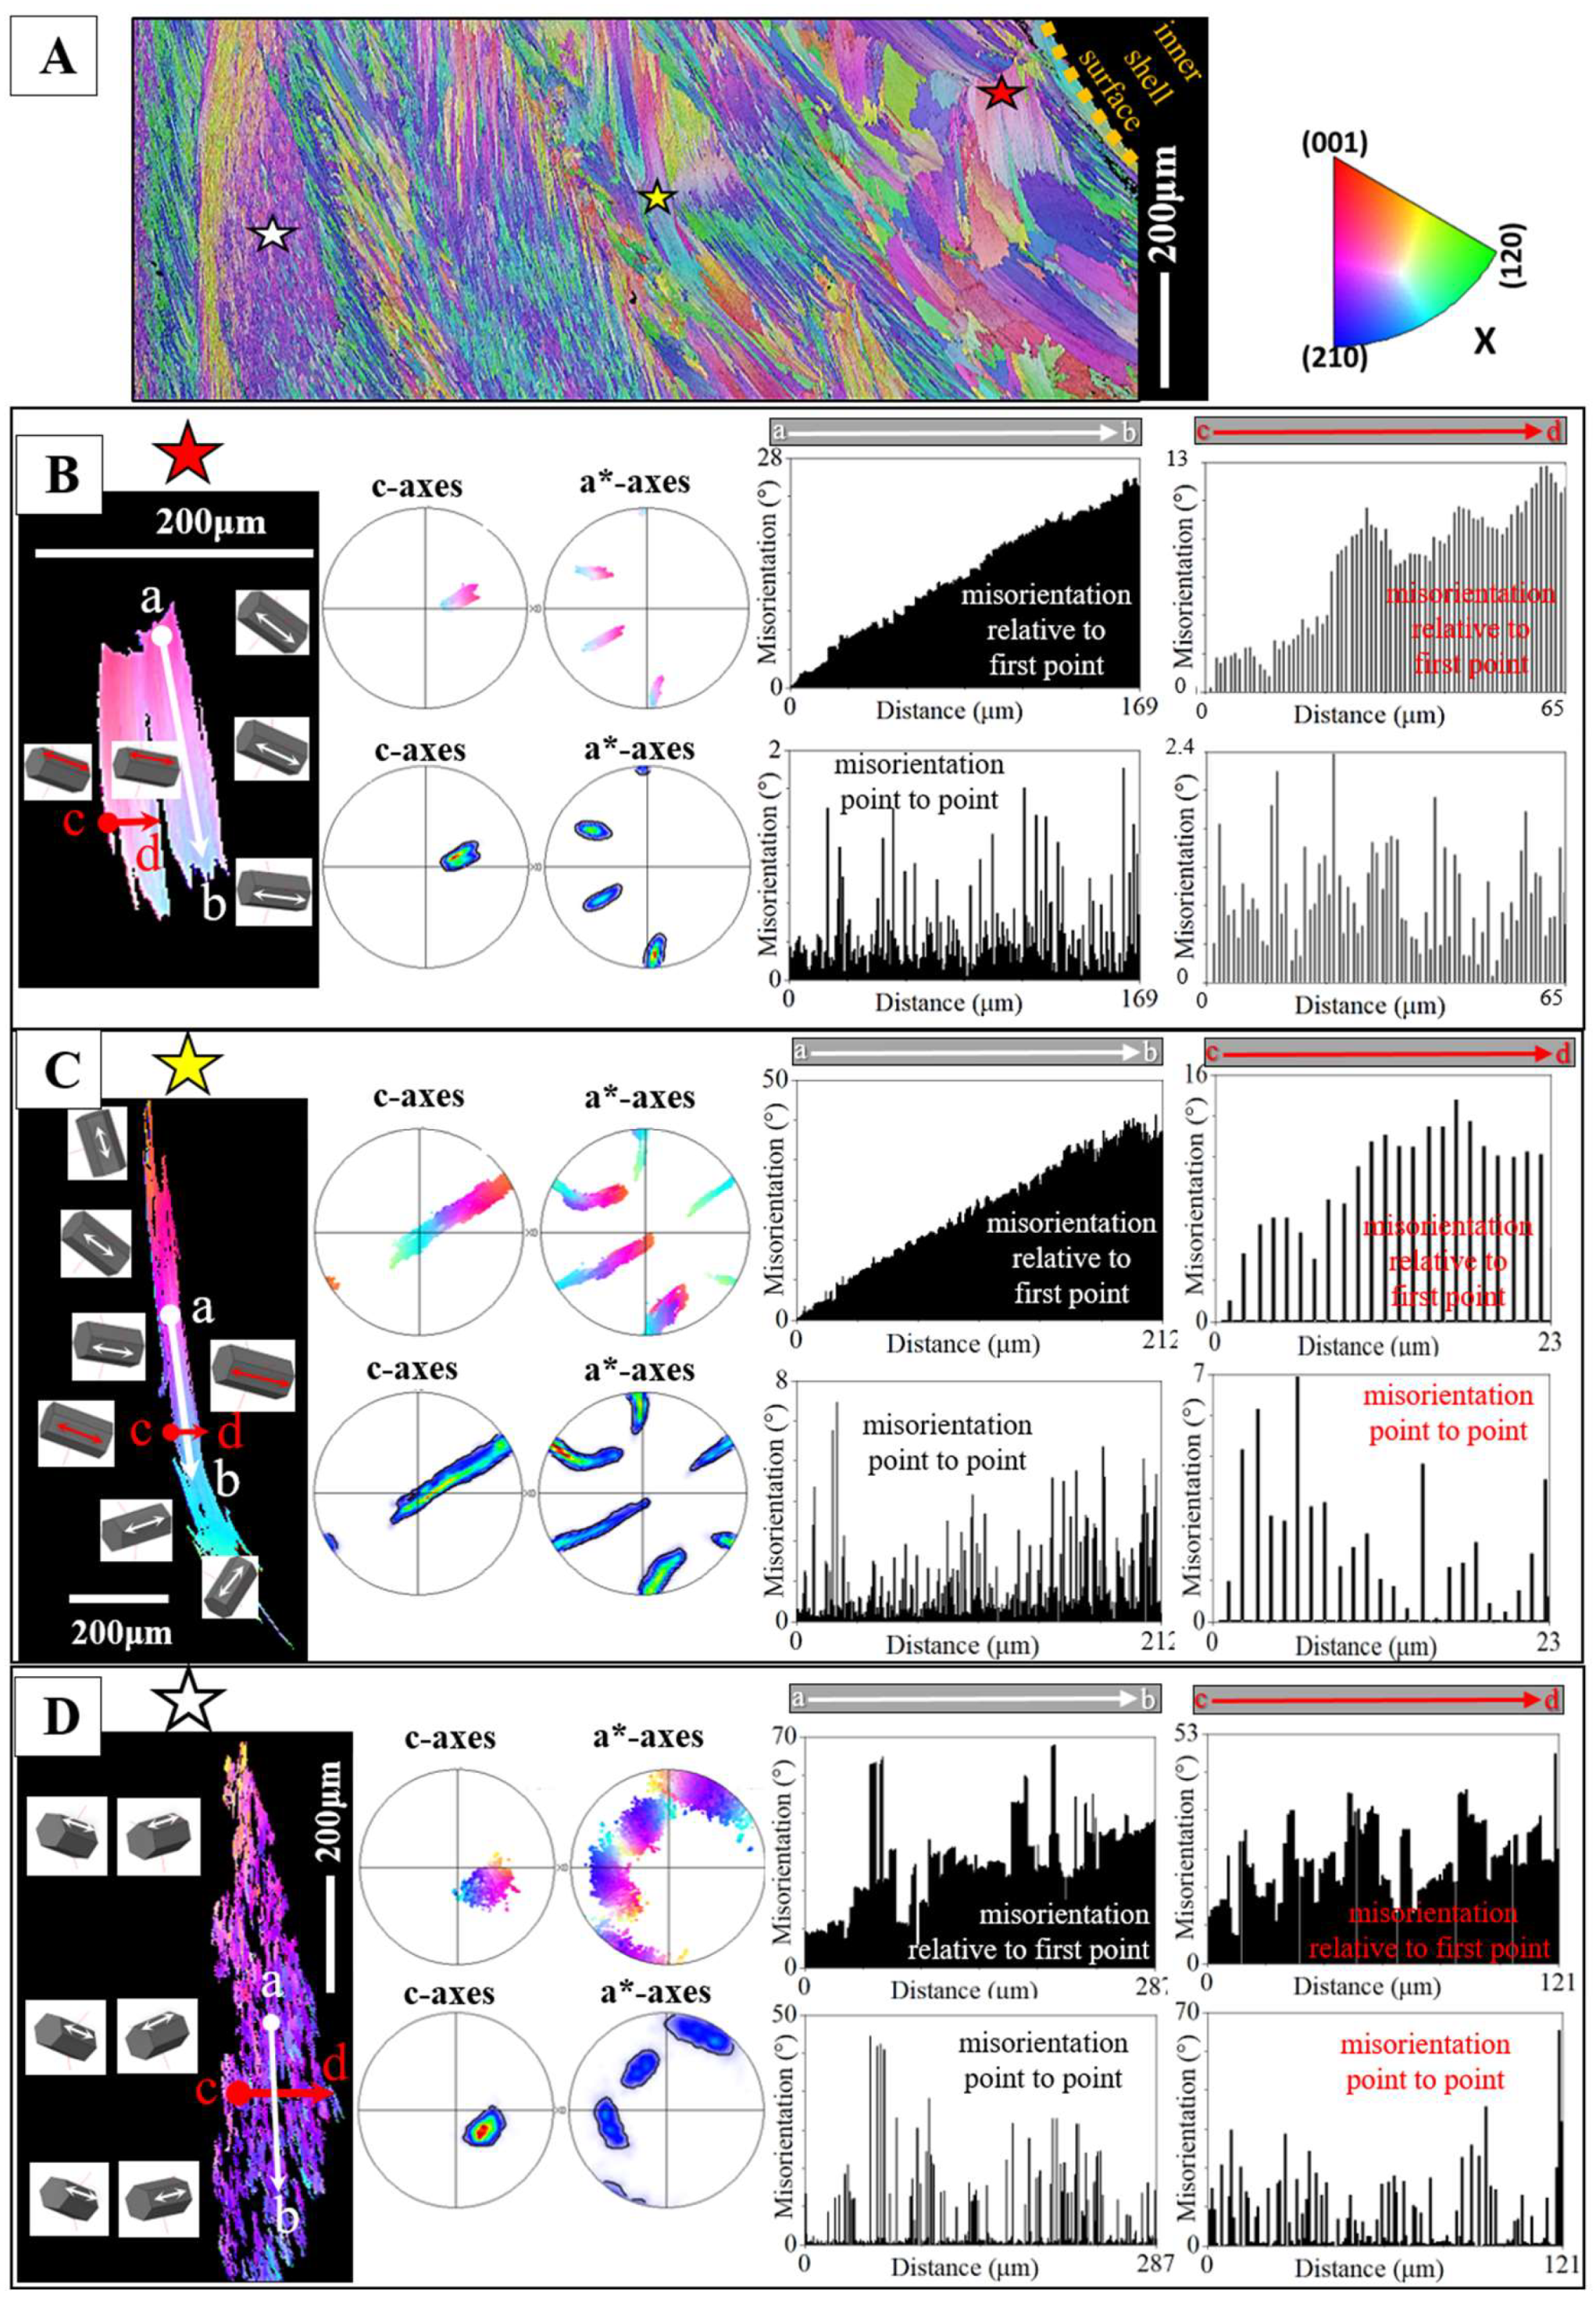
Figure 6.
The microstructure of large foliated units (B to D) and the nature of their texture (B to D). Formation and development of c- and a*-axes orientation rings for the texture pattern of the foliated units (B to D). The colors in Figure 6 code for crystal orientation. The core crystal entity (e.g. as that shown in (B)) of a large foliated unit is a structured arrangement of crystallites and consists of an interwoven meshwork of, mainly, two subunits having slightly different orientations (see blue and green colors in the map and pole figure in (B), see the sketched crystals in (B). Nonetheless, we find in the corresponding pole figure (B) a cluster for c-axes and three clusters for the a*-axes orientations. However, we observe well in the pole figures (B) that the c- and a*-axes clusters are substructured. Selecting a larger section of a foliated unit (C), e.g. the core crystal entity and adjacent foliated crystals (C), in the pole figures we find that additional c- and a*-axes clusters are added to the c- and a*-axes clusters of the core crystal entity, in such a way that the c- and a*-axes orientations of a few adjacent large foliated units form a ring in the c- and a*-axes pole figures (black arrows in C, D). This is a very specific texture pattern and very different to the texture of fibrous, columnar and nacreous biocalcified microstructures, where the texture pattern of the latter microstructures is axial. A: The entire EBSD scan, with the colors indicating crystal orientation. The dashed yellow, red and black rectangles in (A) depict the EBSD scan portions that are shown in (B), (C) and (D).
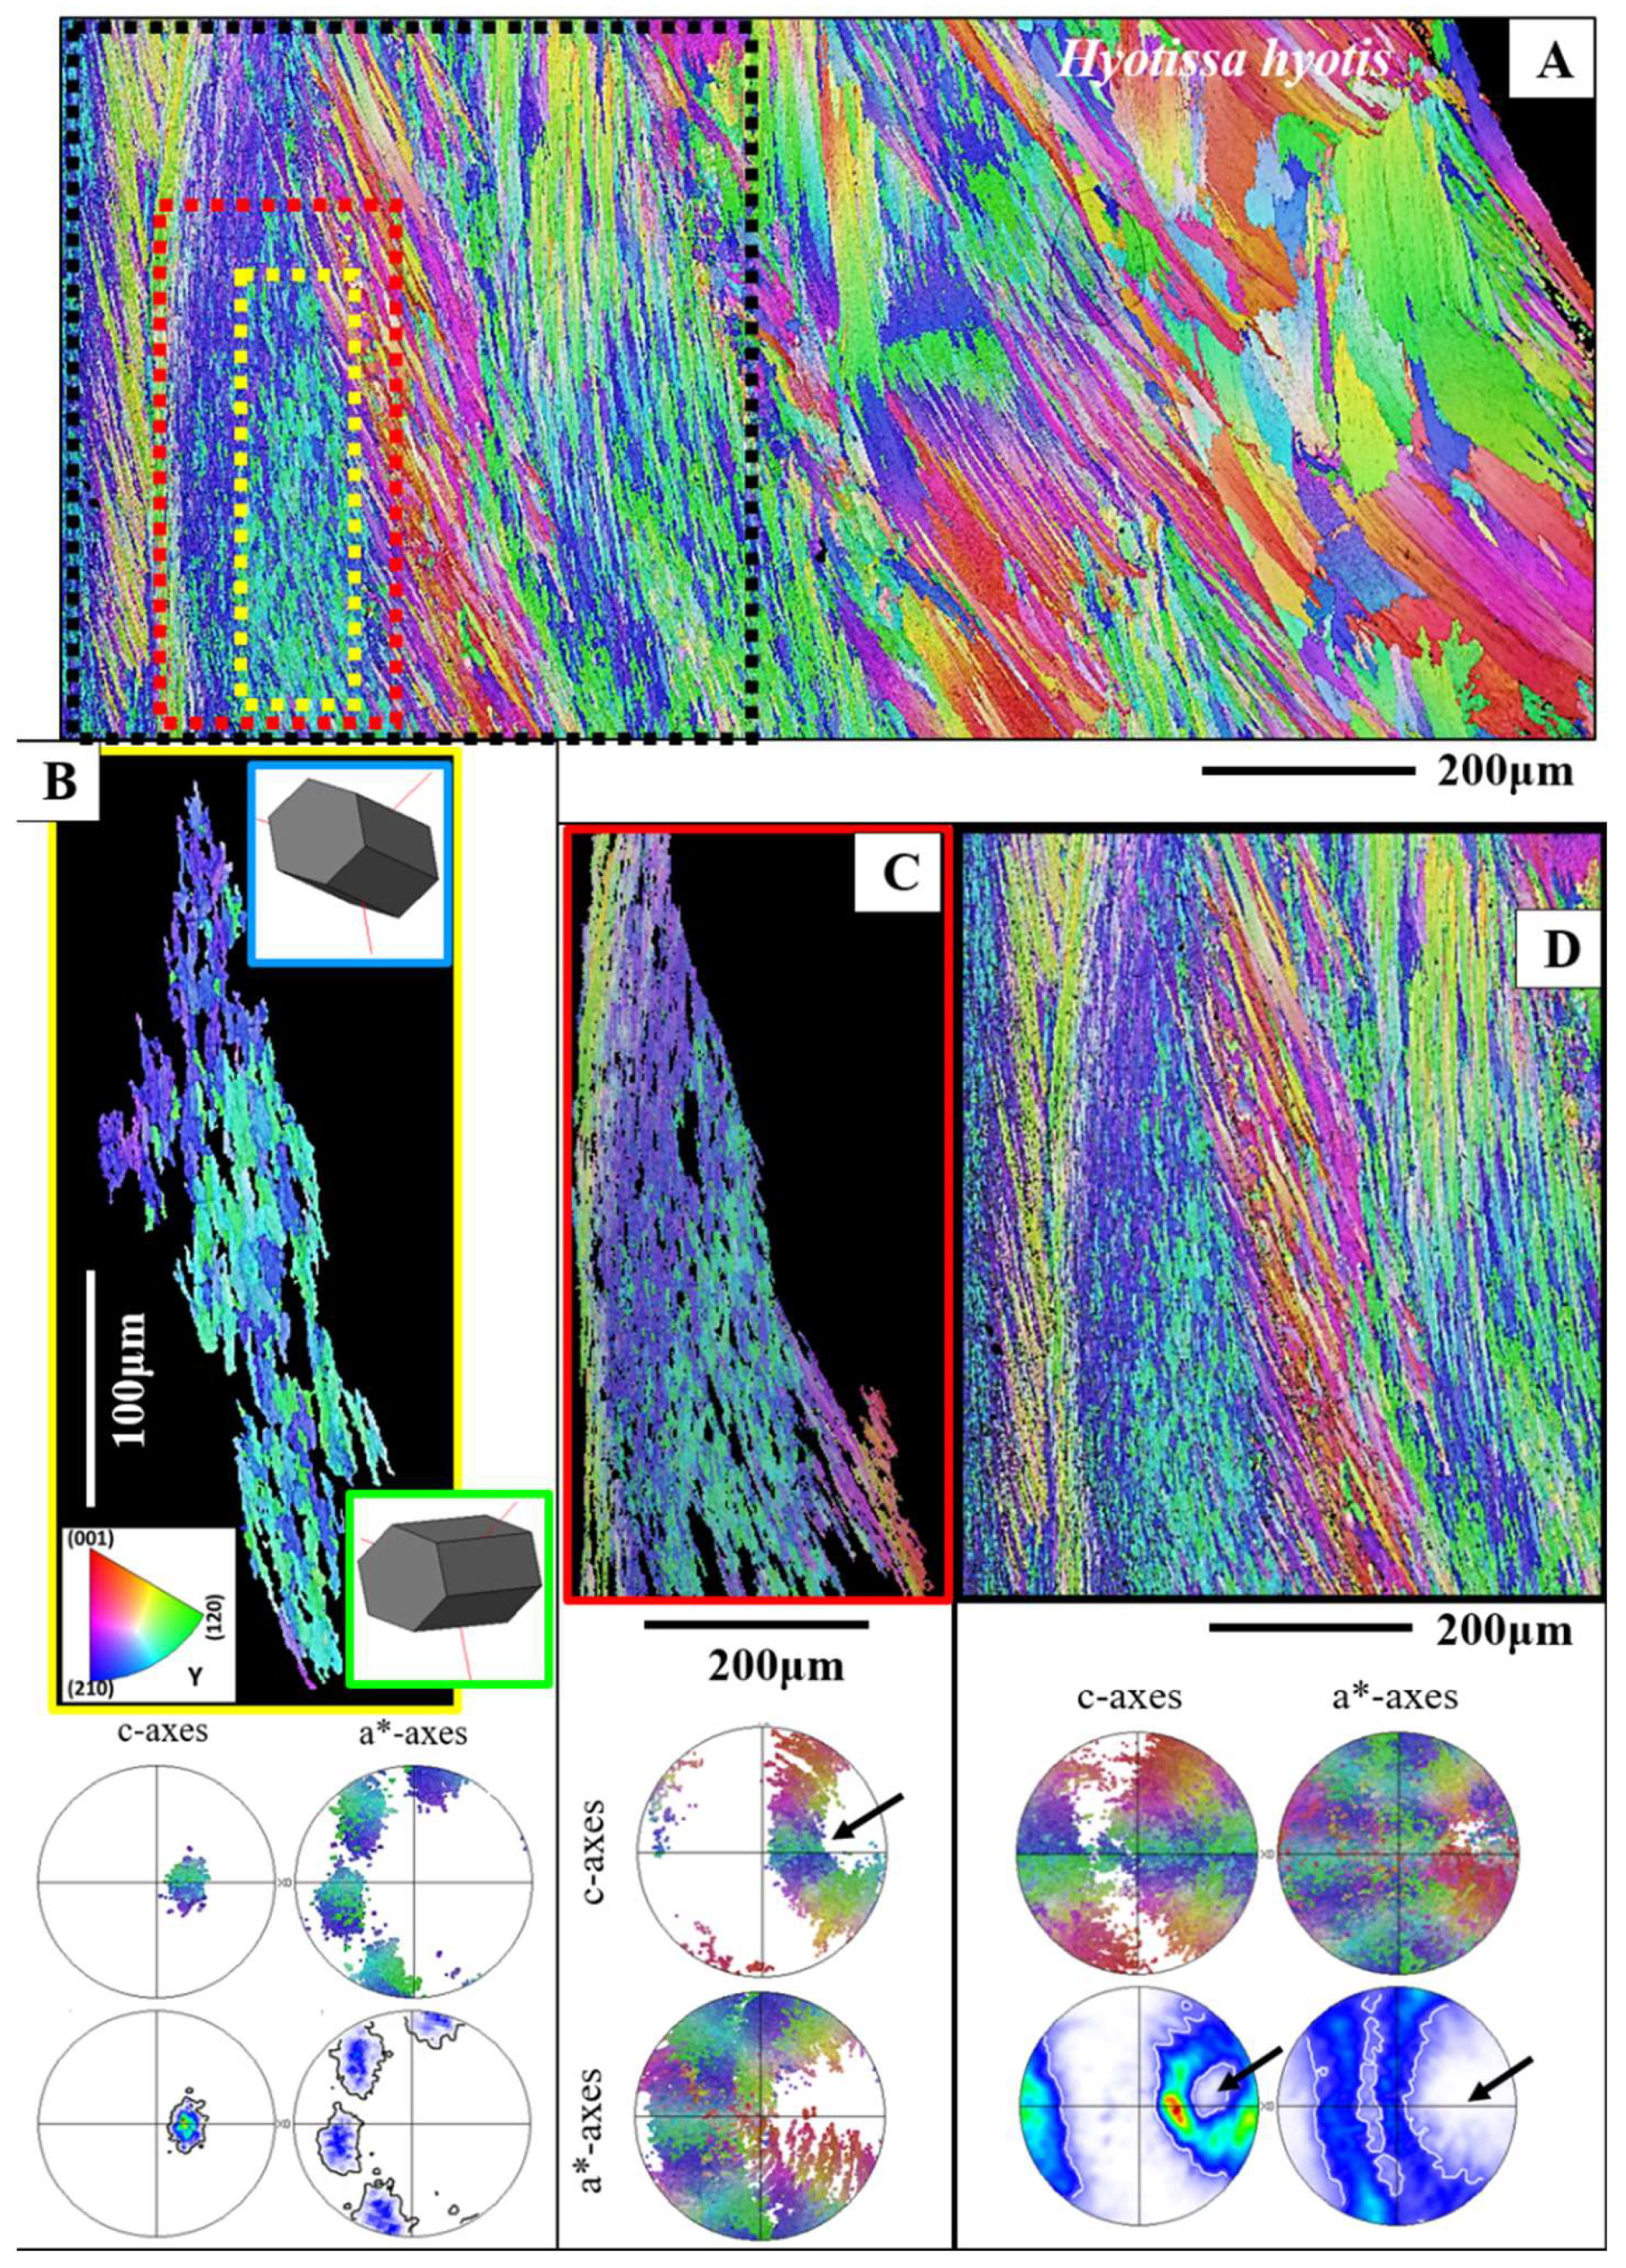
Figure 7.
The texture pattern of assemblies of large and small foliated units (A to C) and the texture of an individual small foliated units (D). We observe for all foliated units, small or large, the same texture pattern, namely, formation of c- and a*-axes orientation rings in the corresponding pole figures. The outline of the c- and a*-axes orientation rings is very irregular for small foliated units (C), due to their high abundance and almost random orientation organization (MUD of 5 (C)). We find also formation of c- and a*-axes rings for an individual small foliated unit.
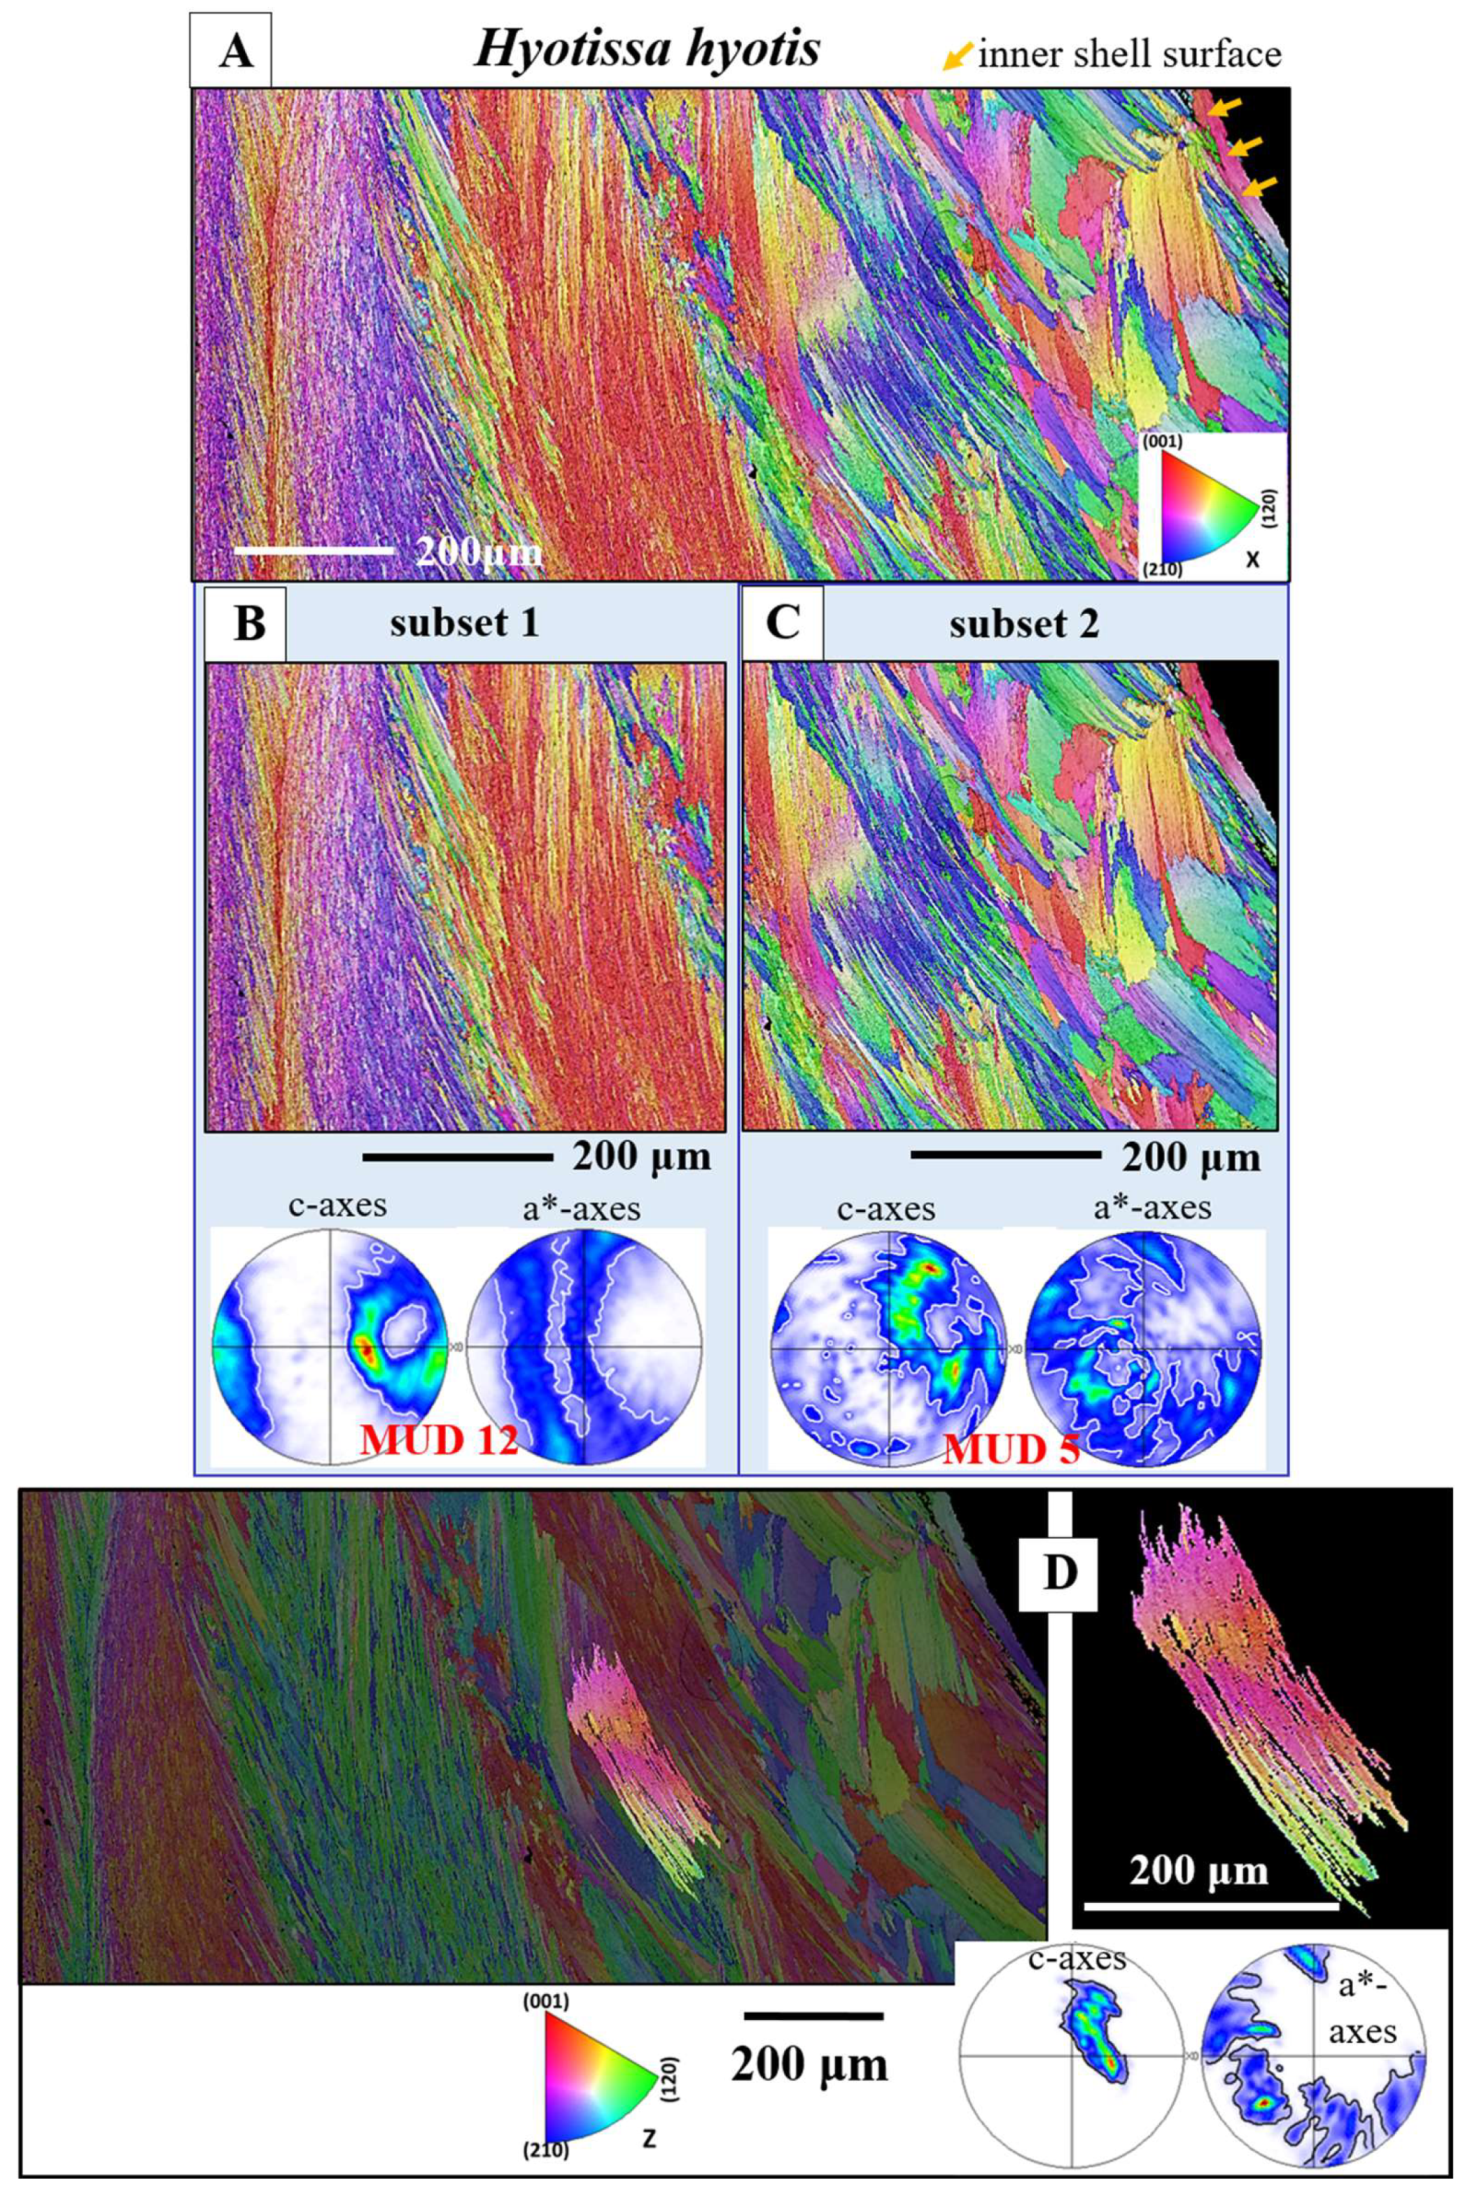
Figure 8.
The Hyotissa hyotis distribution pattern of small and large foliated units (A, B) and generation of a curved inner shell surface with foliated units (A, B). A: EBSD band contrast measurement image; B: for calcite orientation color-coded EBSD scan. For the scan shown in (B), we use the Euler angle coloring code. It is well observable that towards the inner shell surface the size of foliated units decreases gradually, hence, a curved surface is formed with an assembly of small foliated units, in contrast to the size of foliated units that are present in more outward sections of the foliated shell layer. We appear to find layers formed of small (a), larger (b) and very large (c) foliated units (B).
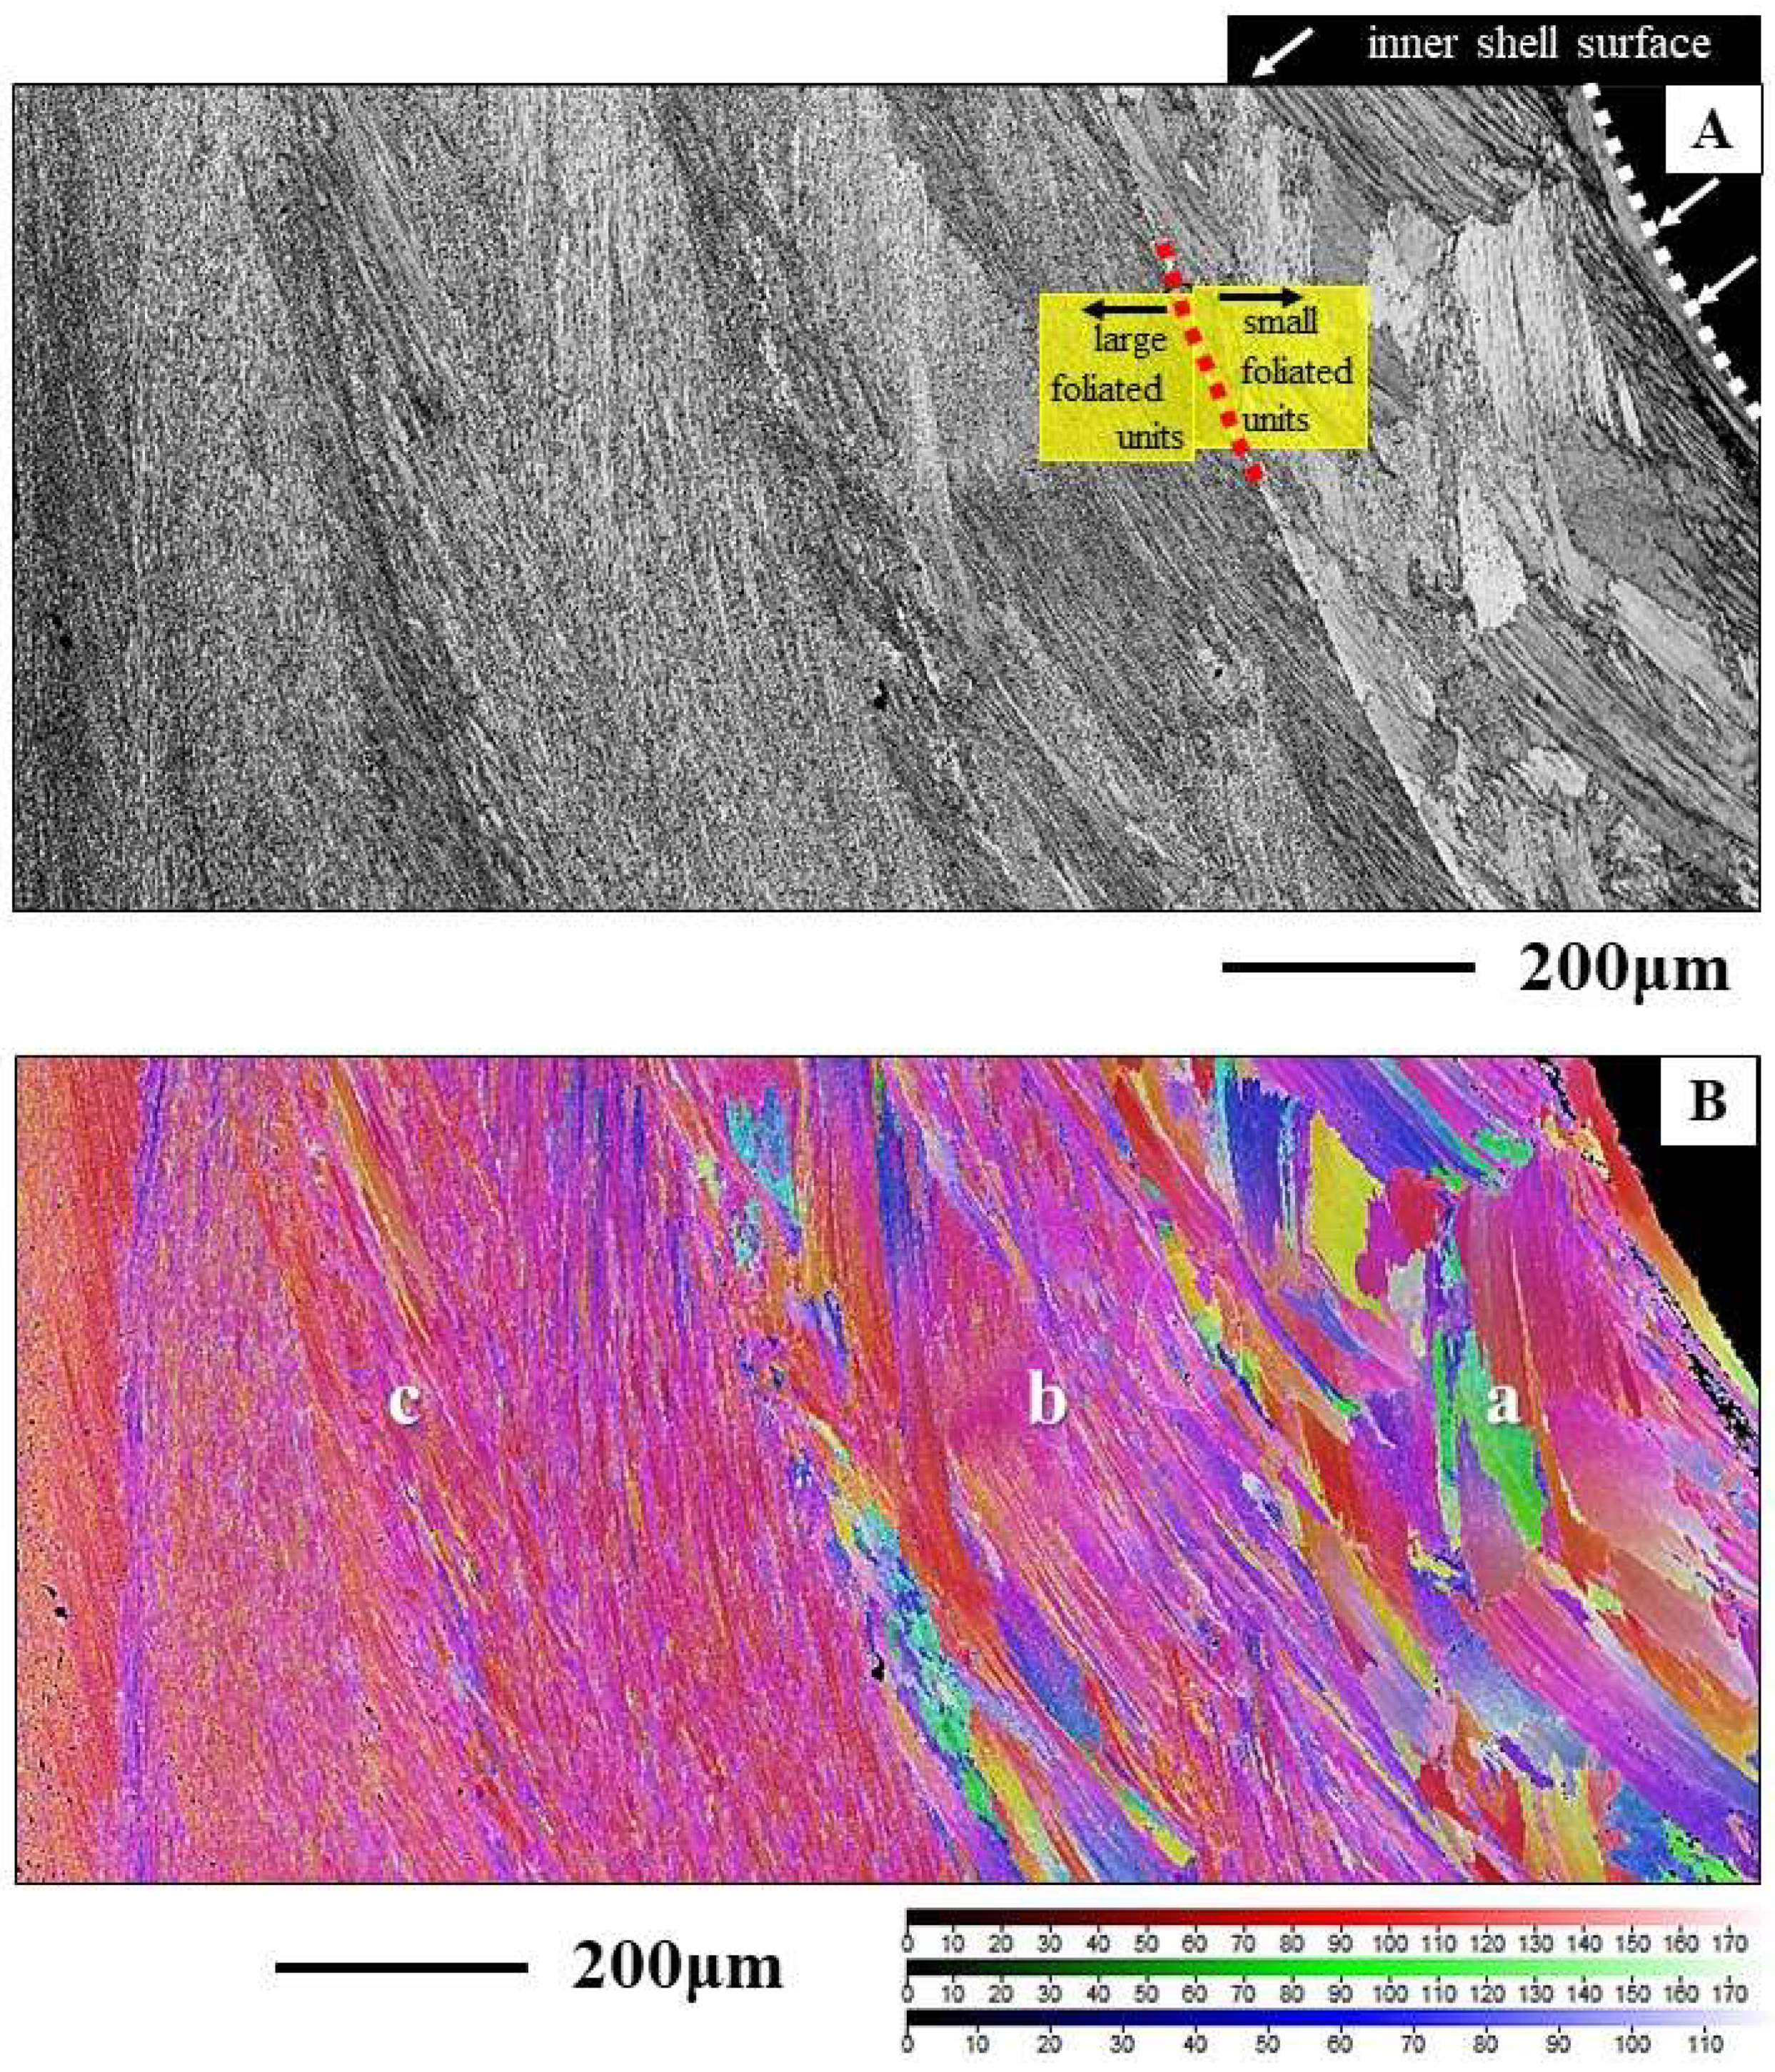
Figure 9.
The microstructure, texture, and carbonate phase of ostreoidean adductor and pallial myostraca (A to G). A, B: Ostrea stentina. The myostraca are formed of aragonite prisms (A, F). These have a characteristic microstructure derived from their growth process [39,40], form an axial texture (see pole figures for aragonite in C and E), and are characterized by a marked peak at about 63° to 64° misorientation in the relative frequency-misorientation angle diagram (black arrow in C, G). The latter indicates the twinning of the aragonite on the {110} plane. In comparison to shell calcite, myostracal aragonite crystals are more co-oriented (see the difference in MUD value between myostracal aragonite (C, E) and shell calcite (D). Black arrows in the pole figures shown in (E) indicate the direction of c-axis orientation for foliated calcite and myostracal aragonite. We find for the two microstructures some correspondence in c-axes orientation.
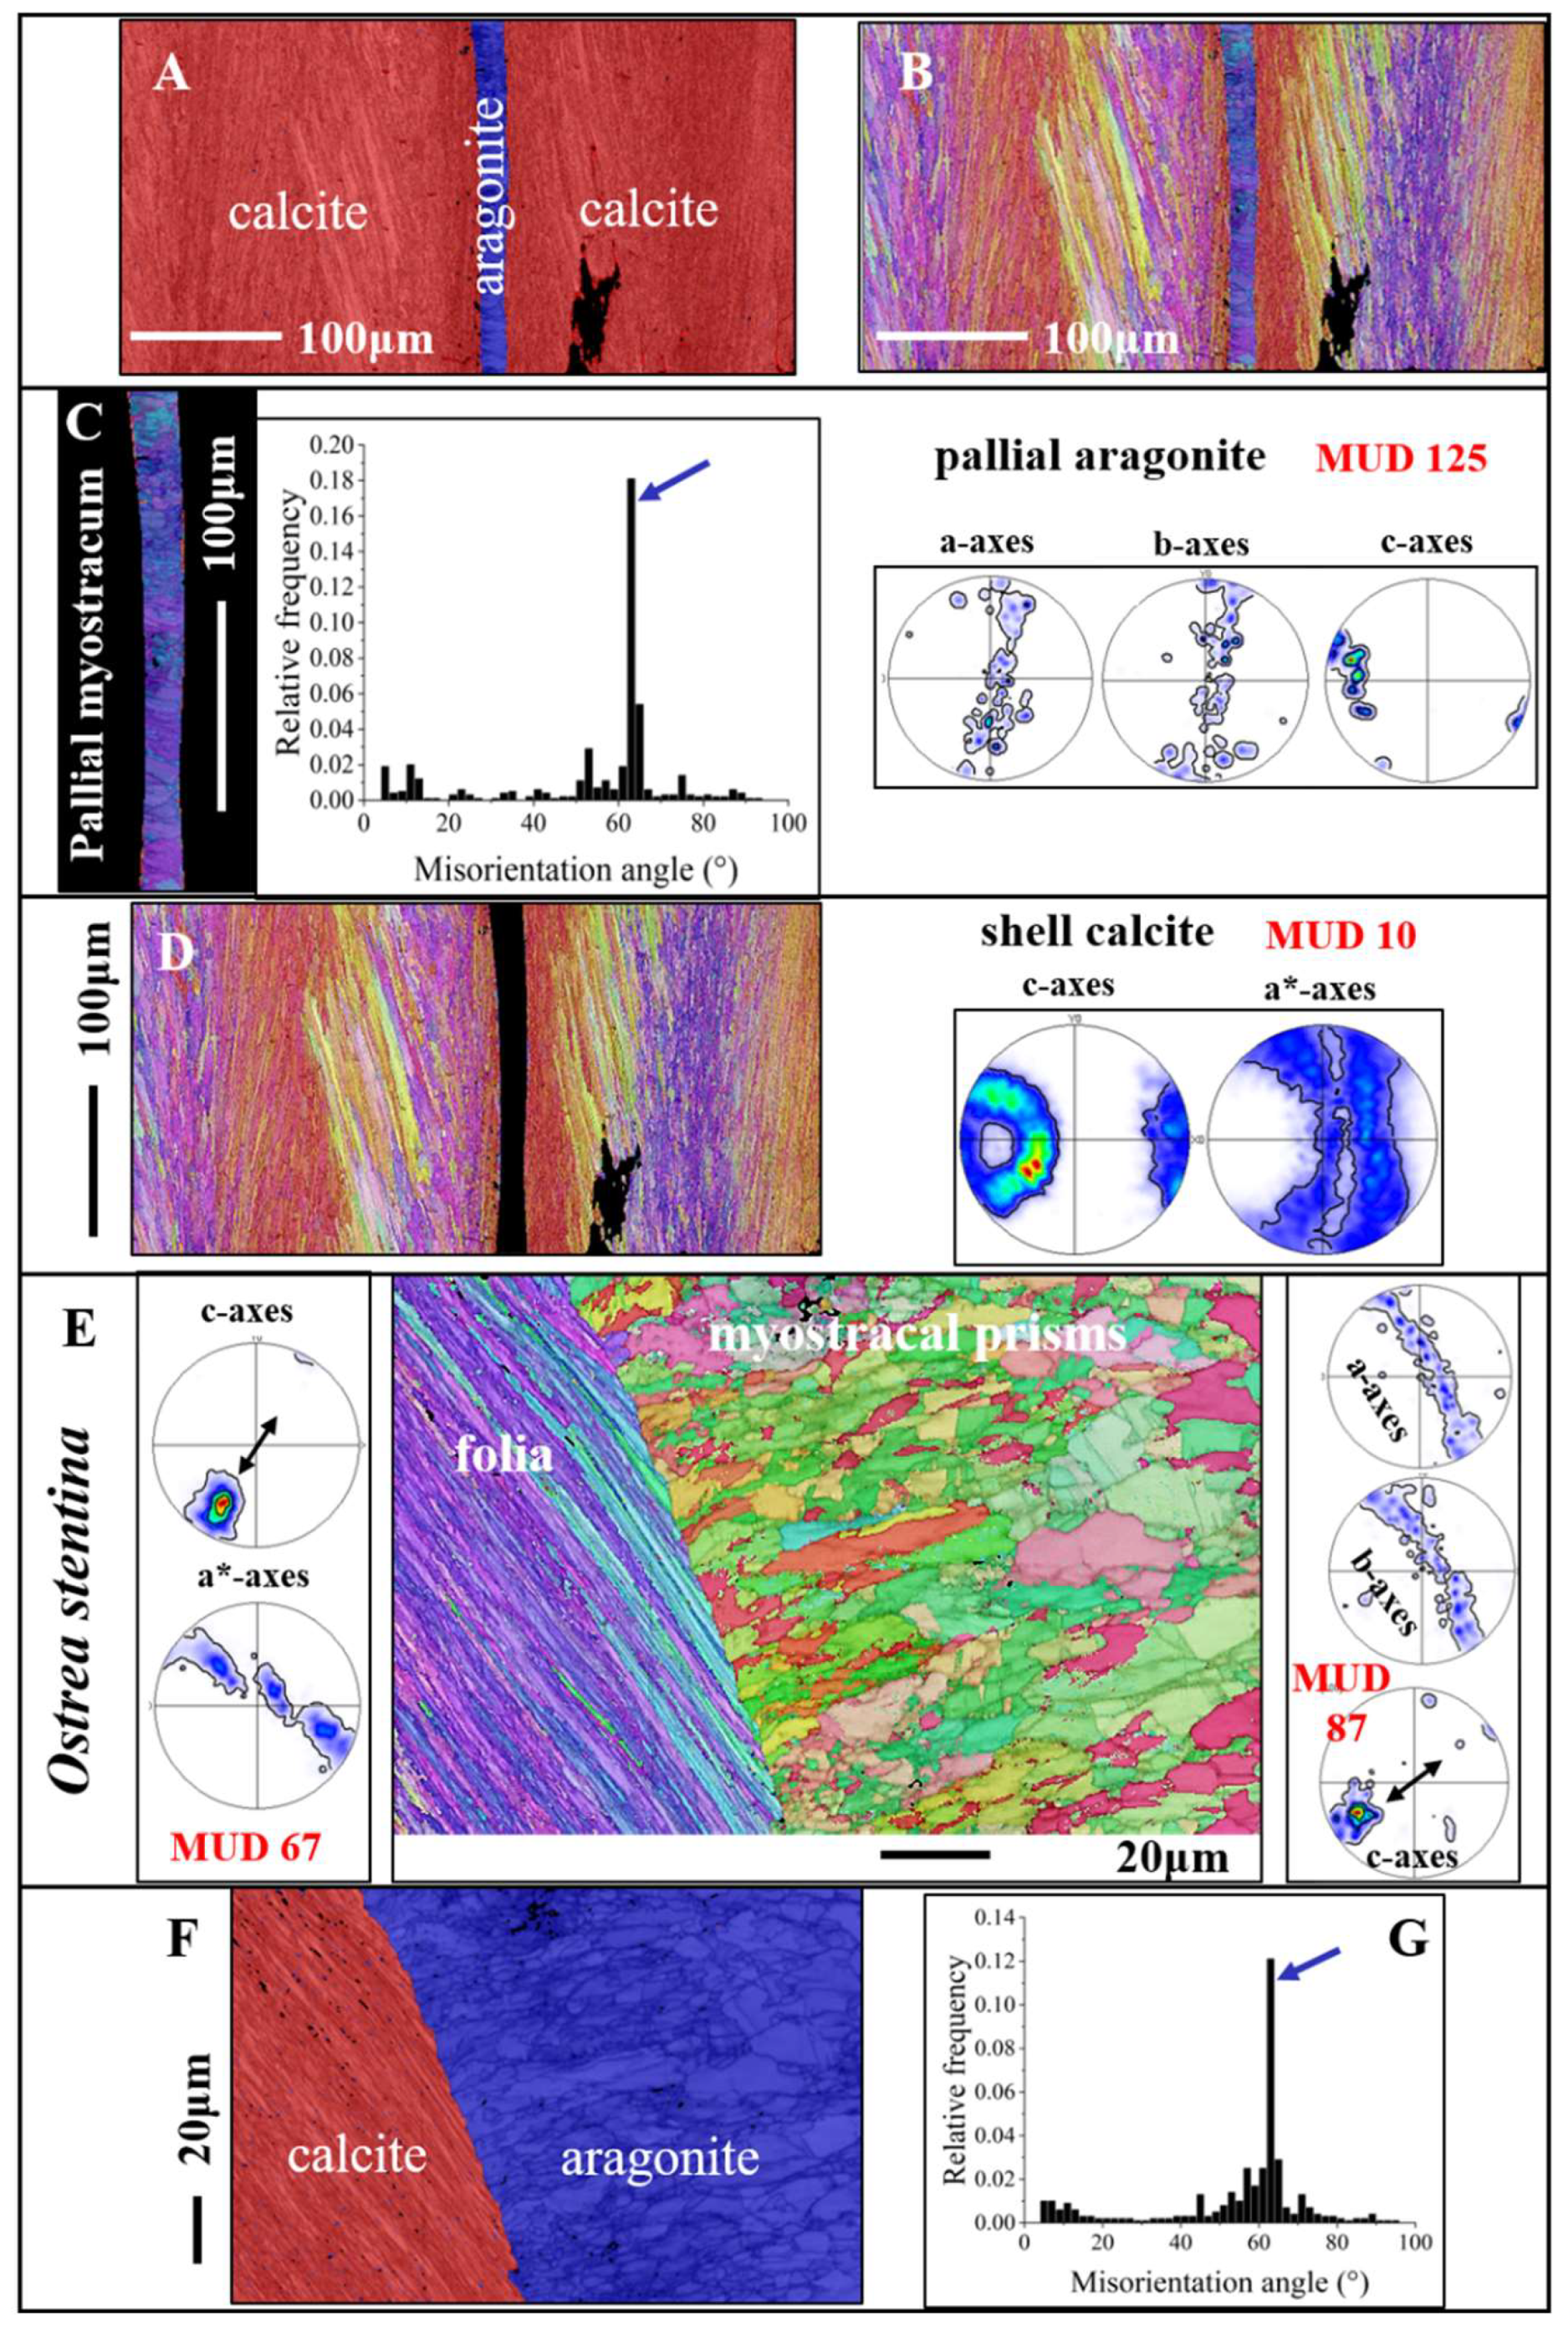
Figure 10.
The meshwork of crystals, and their microstructure and texture, that form chalk lenses in Ostreidae shells (A to C) and the crossover from the foliated to the chalk-related assembly of calcite (B to G). A to F: Magallana gigas. A to C: BSE micrographs; D to G: EBSD maps, color-coded for crystal orientation; corresponding pole figures, showing orientation data (F) or their density distribution (E). For the microstructures and textures, we show the corresponding relative frequency-misorientation angle diagrams. Crystal co-orientation strength is given with MUD values (D, E). For the EBSD map shown in (F), the IPF coloring code was used, for the map given in (G), the all-Euler coloring code was selected. Although both microstructures are formed of blade/lath-shaped crystals, we find significant differences in crystal texture, magnitude of misorientation angle, and mode of misorientation angle distribution (D, E). Even though the assembly of folia is more co-oriented than the assembly of crystals that form the chalk, crystal co-orientation strength is low for both microstructures (see MUD values). We find between the stacks of folia and the agglomeration of chalk blades/laths a transitional zone (G, white stars in D and Figure 11B), marked by a chaotic microstructure, not resembling in structure either the arrays of folia, or the aggregation of chalk blades/laths. At EBSD data acquisition and EBSD data evaluation the three Euler angles were kept at 0°; φ1=0°, Φ=0°, φ2=0°.
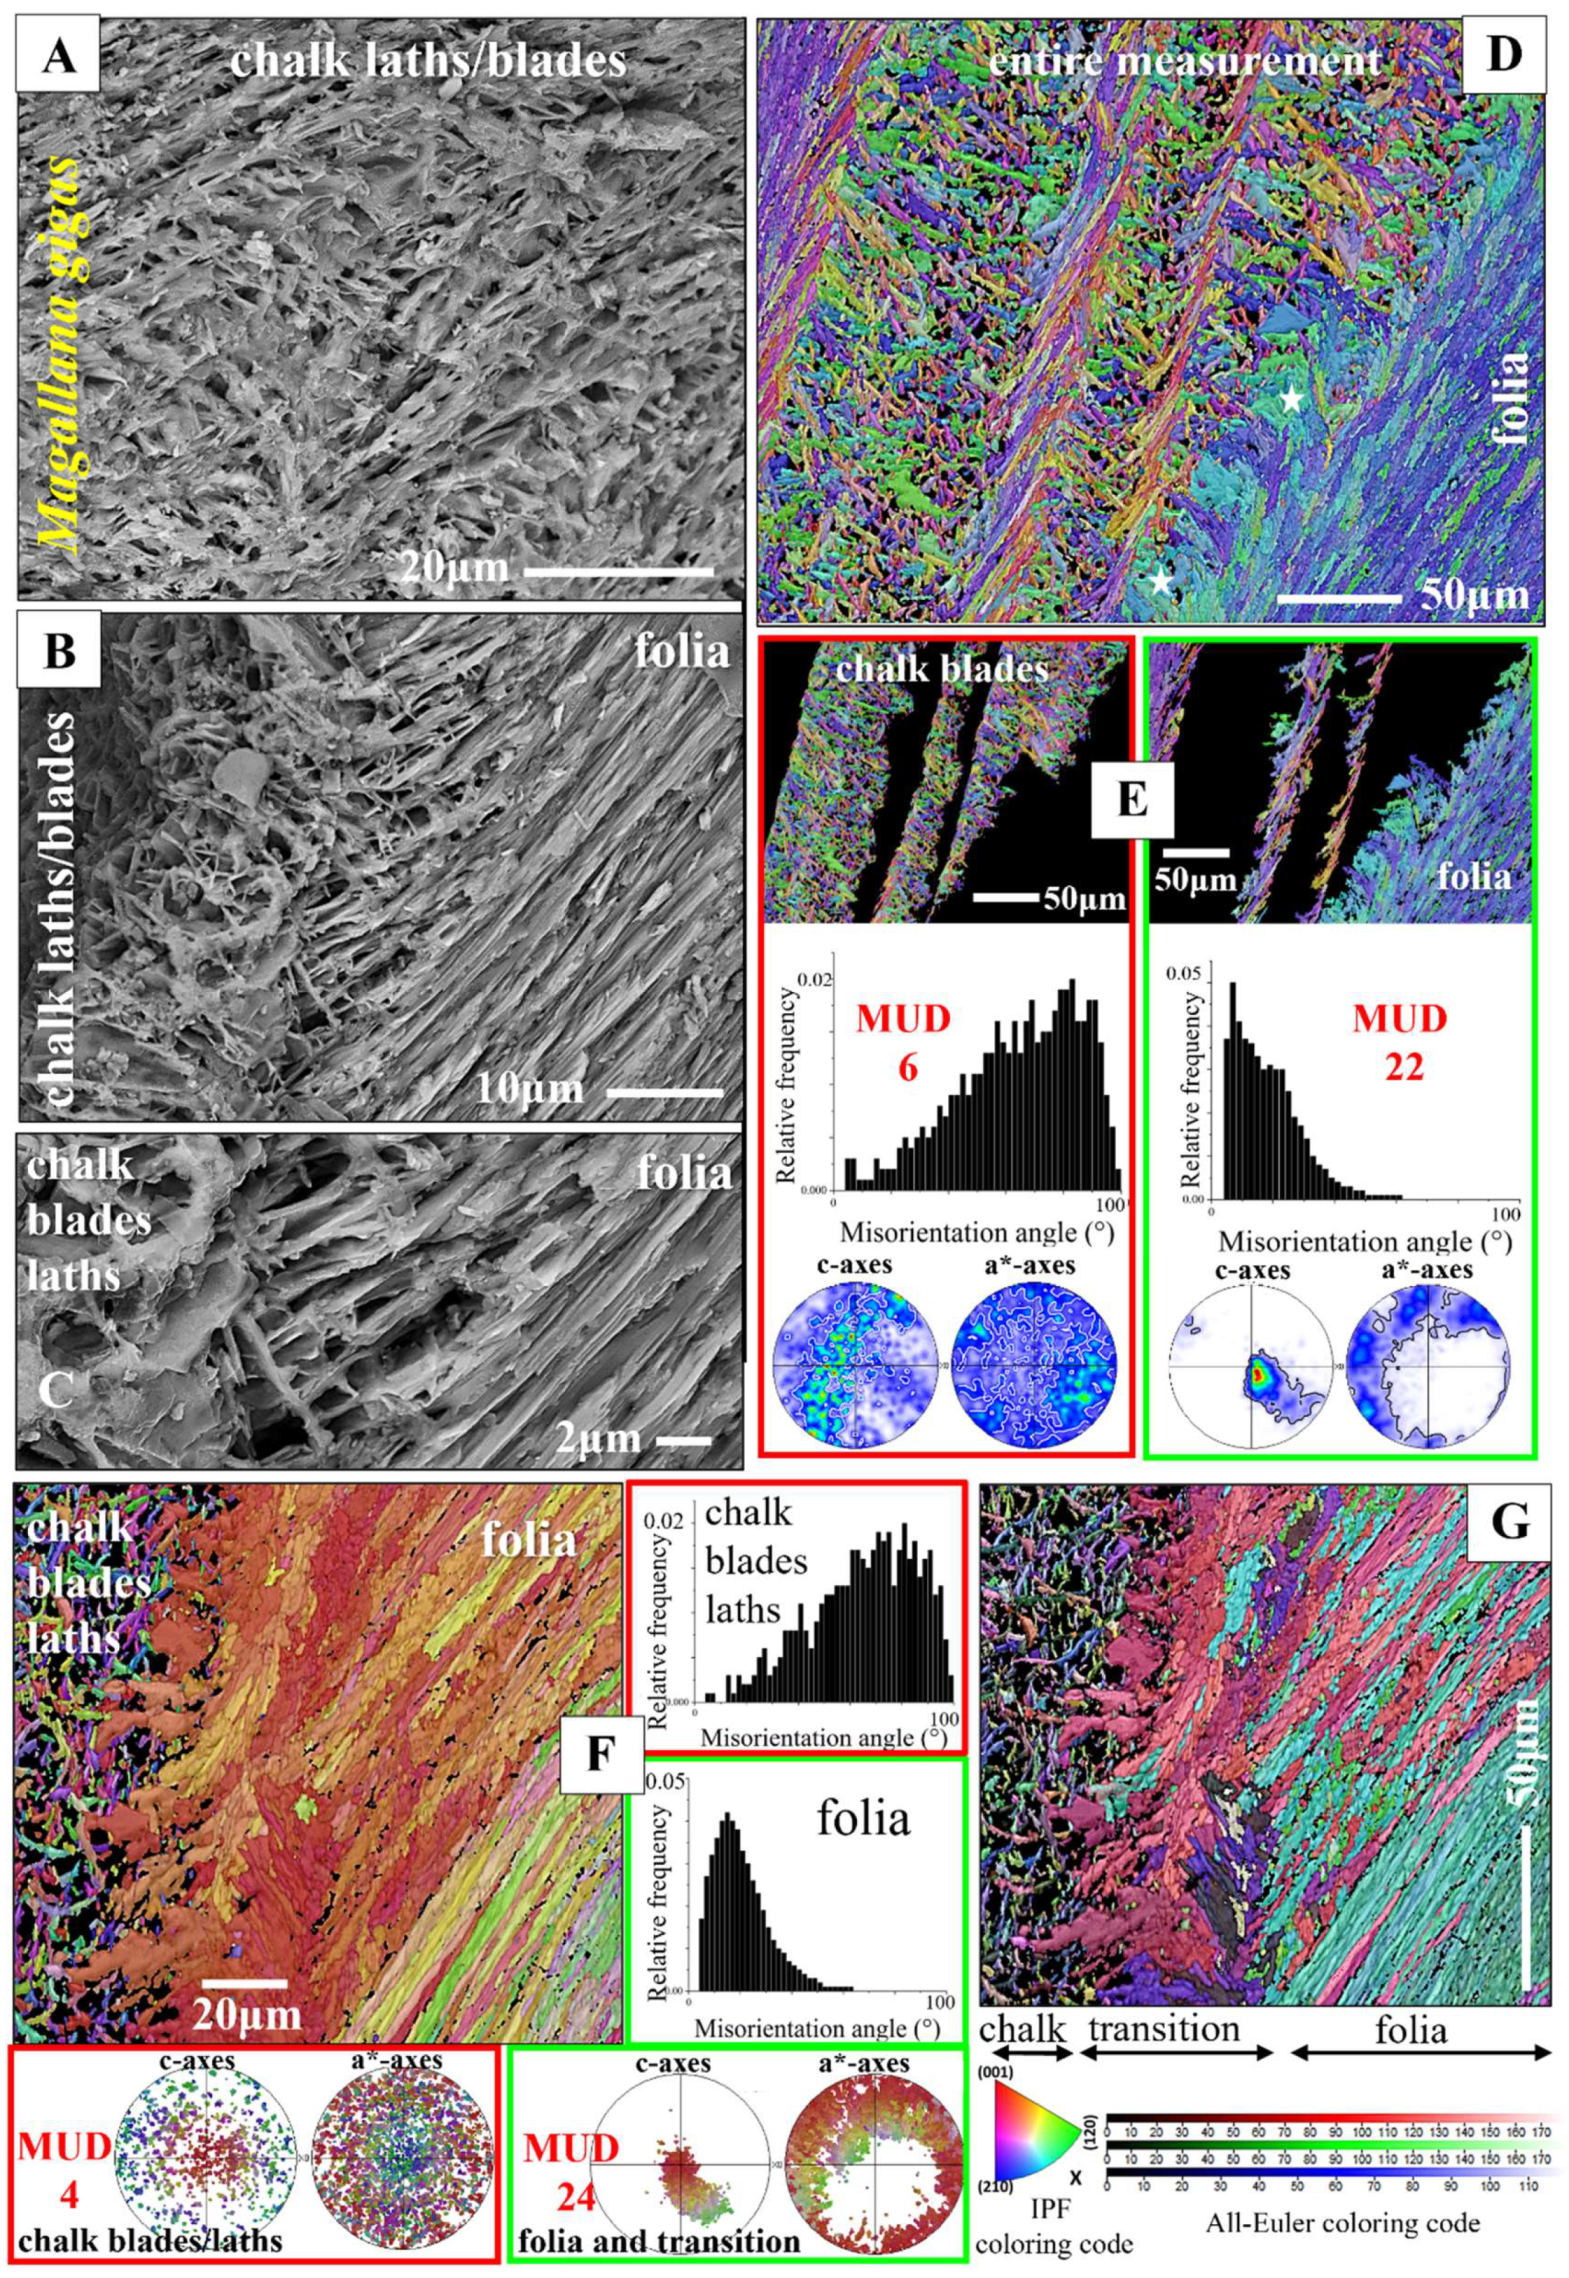
Figure 11.
A to C: Subsets of the EBSD measurement shown in Figure 10F highlight the difference in crystal orientation between the blades, laths of the chalk (A), the crystals that form the transitional section between the chalk and the stacks of folia (B) and for the stacks of folia (C). In the shell, these microstructures are adjacent to each other. Sketched crystals visualize calcite crystallographic axes orientation of the folia (C) and of the crystals that form the transitional section between the folia and the chalk blades (B). Calcite c-axes of the latter are perpendicular to the plane of view (B), while calcite c-axes of the folia are largely within the plane of view (C). D, E: Meshwork of chalk blades and laths within the foliated shell layer (D) as well as adjacent to the foliated layers at outer shell sections (E). The co-orientation strength of calcite crystallites that comprise the chalk is low but not random (see MUD values for the chalk in D, E). Thus, there is some structuring of the chalk, e.g. by struts (see EBSD band contrast and crystal orientation maps in D). E: A chalk-type microstructure at outer shell layers (white stars in E), developed with an axial texture (pole figure for the chalk in E), a slightly increased crystal co-orientation strength (MUD value for the chalk in E) and the typical relative frequency-misorientation angle pattern that is also observed for the chalk within the lenses that are incorporated into the foliated shell. This is the first report of a chalk-type microstructure at outer shell layers. A to C, inserts in D, E give EBSD maps, coded for crystal orientation. The micrographs in (E) and the left-hand side, grey-scaled, image in (D) are BSE images. The right-hand side, grey-scaled, image in (D) is an EBSD band contrast measurement image. At EBSD data acquisition and EBSD data evaluation, the three Euler angles were kept at 0°; φ1=0°, Φ=0°, φ2=0°.
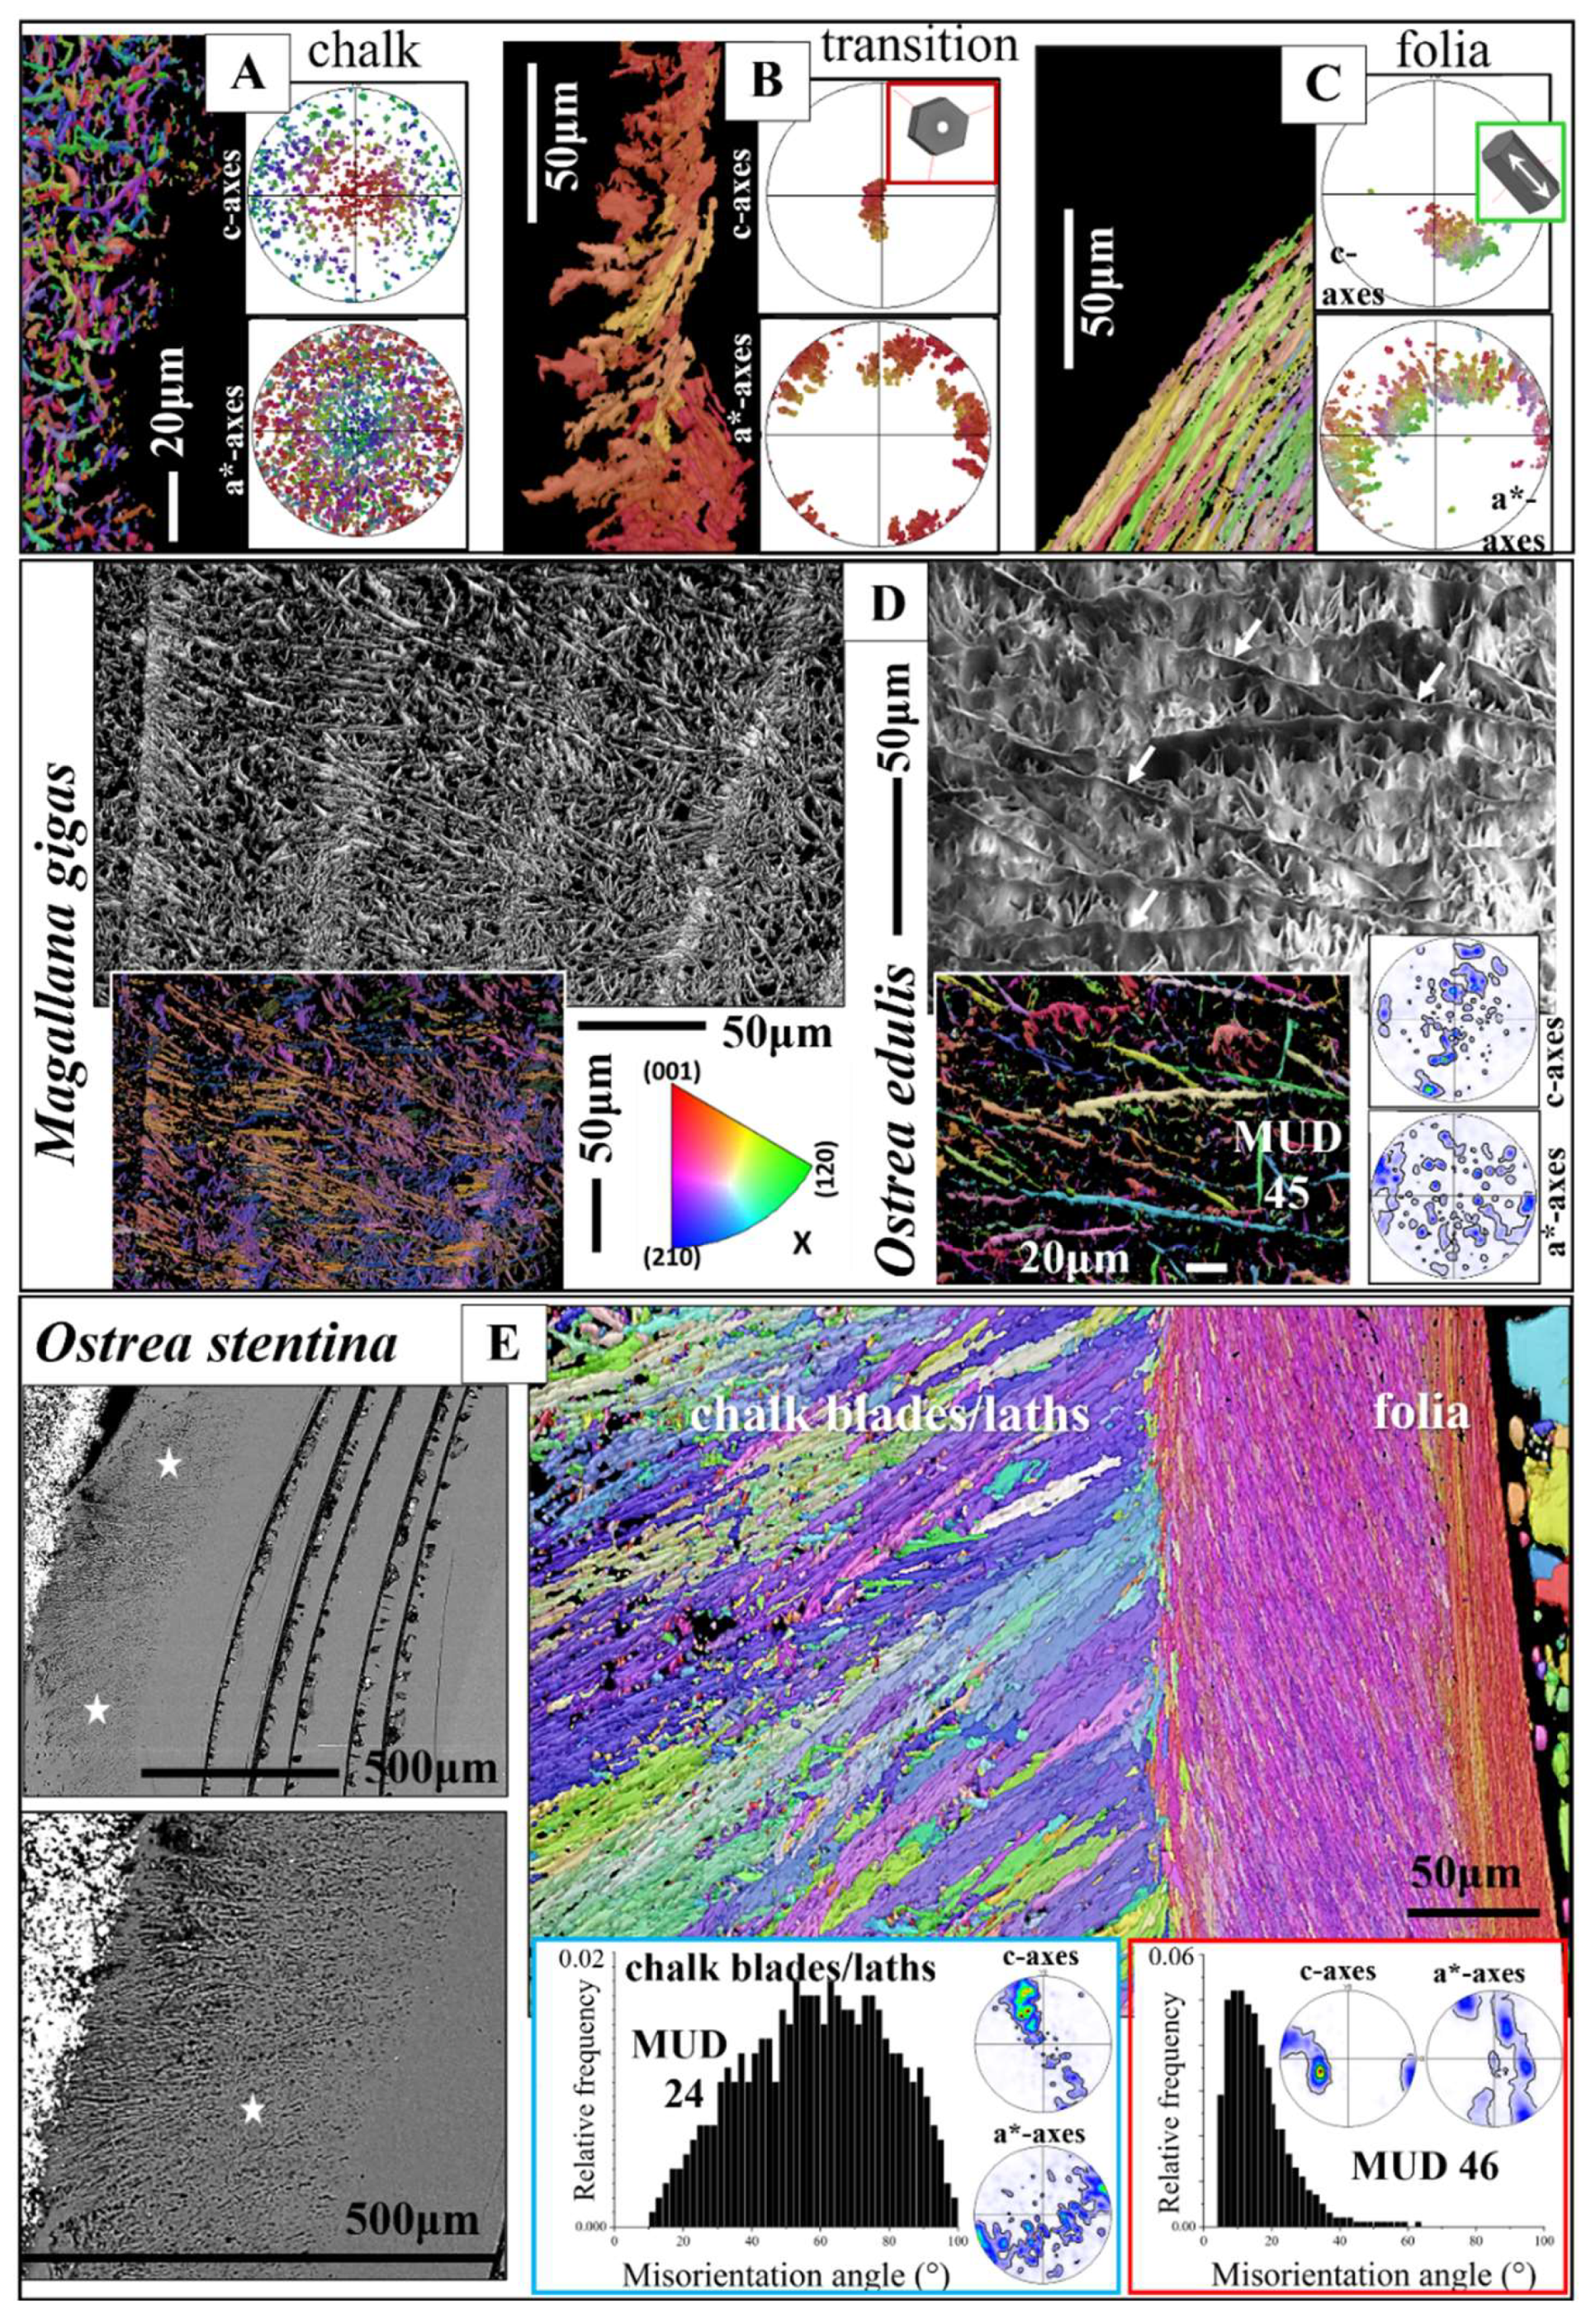
Figure 12.
The crystals, their size, morphology, microstructure and texture that encase the vesicular pores, incorporated into the shell of the gryphaeid species Hyotissa mcgintyi (A, B, E). Although crystal co-orientation strength is very comparable between the foliated and the dendritic, polyhedral crystal, shell portion (A), we find, for the two shell layers, significant differences in microstructure, texture and misorientation angle distribution (A). The transition from folia to dendritic crystals is abrupt (A). Note the axial texture for the dendritic, polyhedral crystal, shell portion. Dendritic crystals have highly irregular, fractal morphologies (B, D). Adjacent dendritic crystals interdigitate strongly (D). The three white arrows in the EBSD map in (B) point to the crystals shown in (D). (C): The white lines are the traces of dendritic grain boundaries for the grains shown in (B) and highlight the tight interlinkage of neighboring grains as well. E: Relative frequency-misorientation angle diagrams for selected dendritic crystals. Note the low degree of misorientation angle between calcite crystallites in a dendritic crystal and the similarity of misorientation angle distribution pattern to the misorientation angle distribution pattern of a foliated crystal (compare to Figure 4E, F). Red arrows in the pole figures in (A) indicate the overall direction of c-axis orientation. Even though being at an angle of a few degrees, there is some correspondence in c-axis orientation between the foliated shell and the adjacent dendritic crystal shell layer. At EBSD data acquisition and EBSD data evaluation, the three Euler angles were kept at 0°; φ1=0°, Φ=0°, φ2=0°.
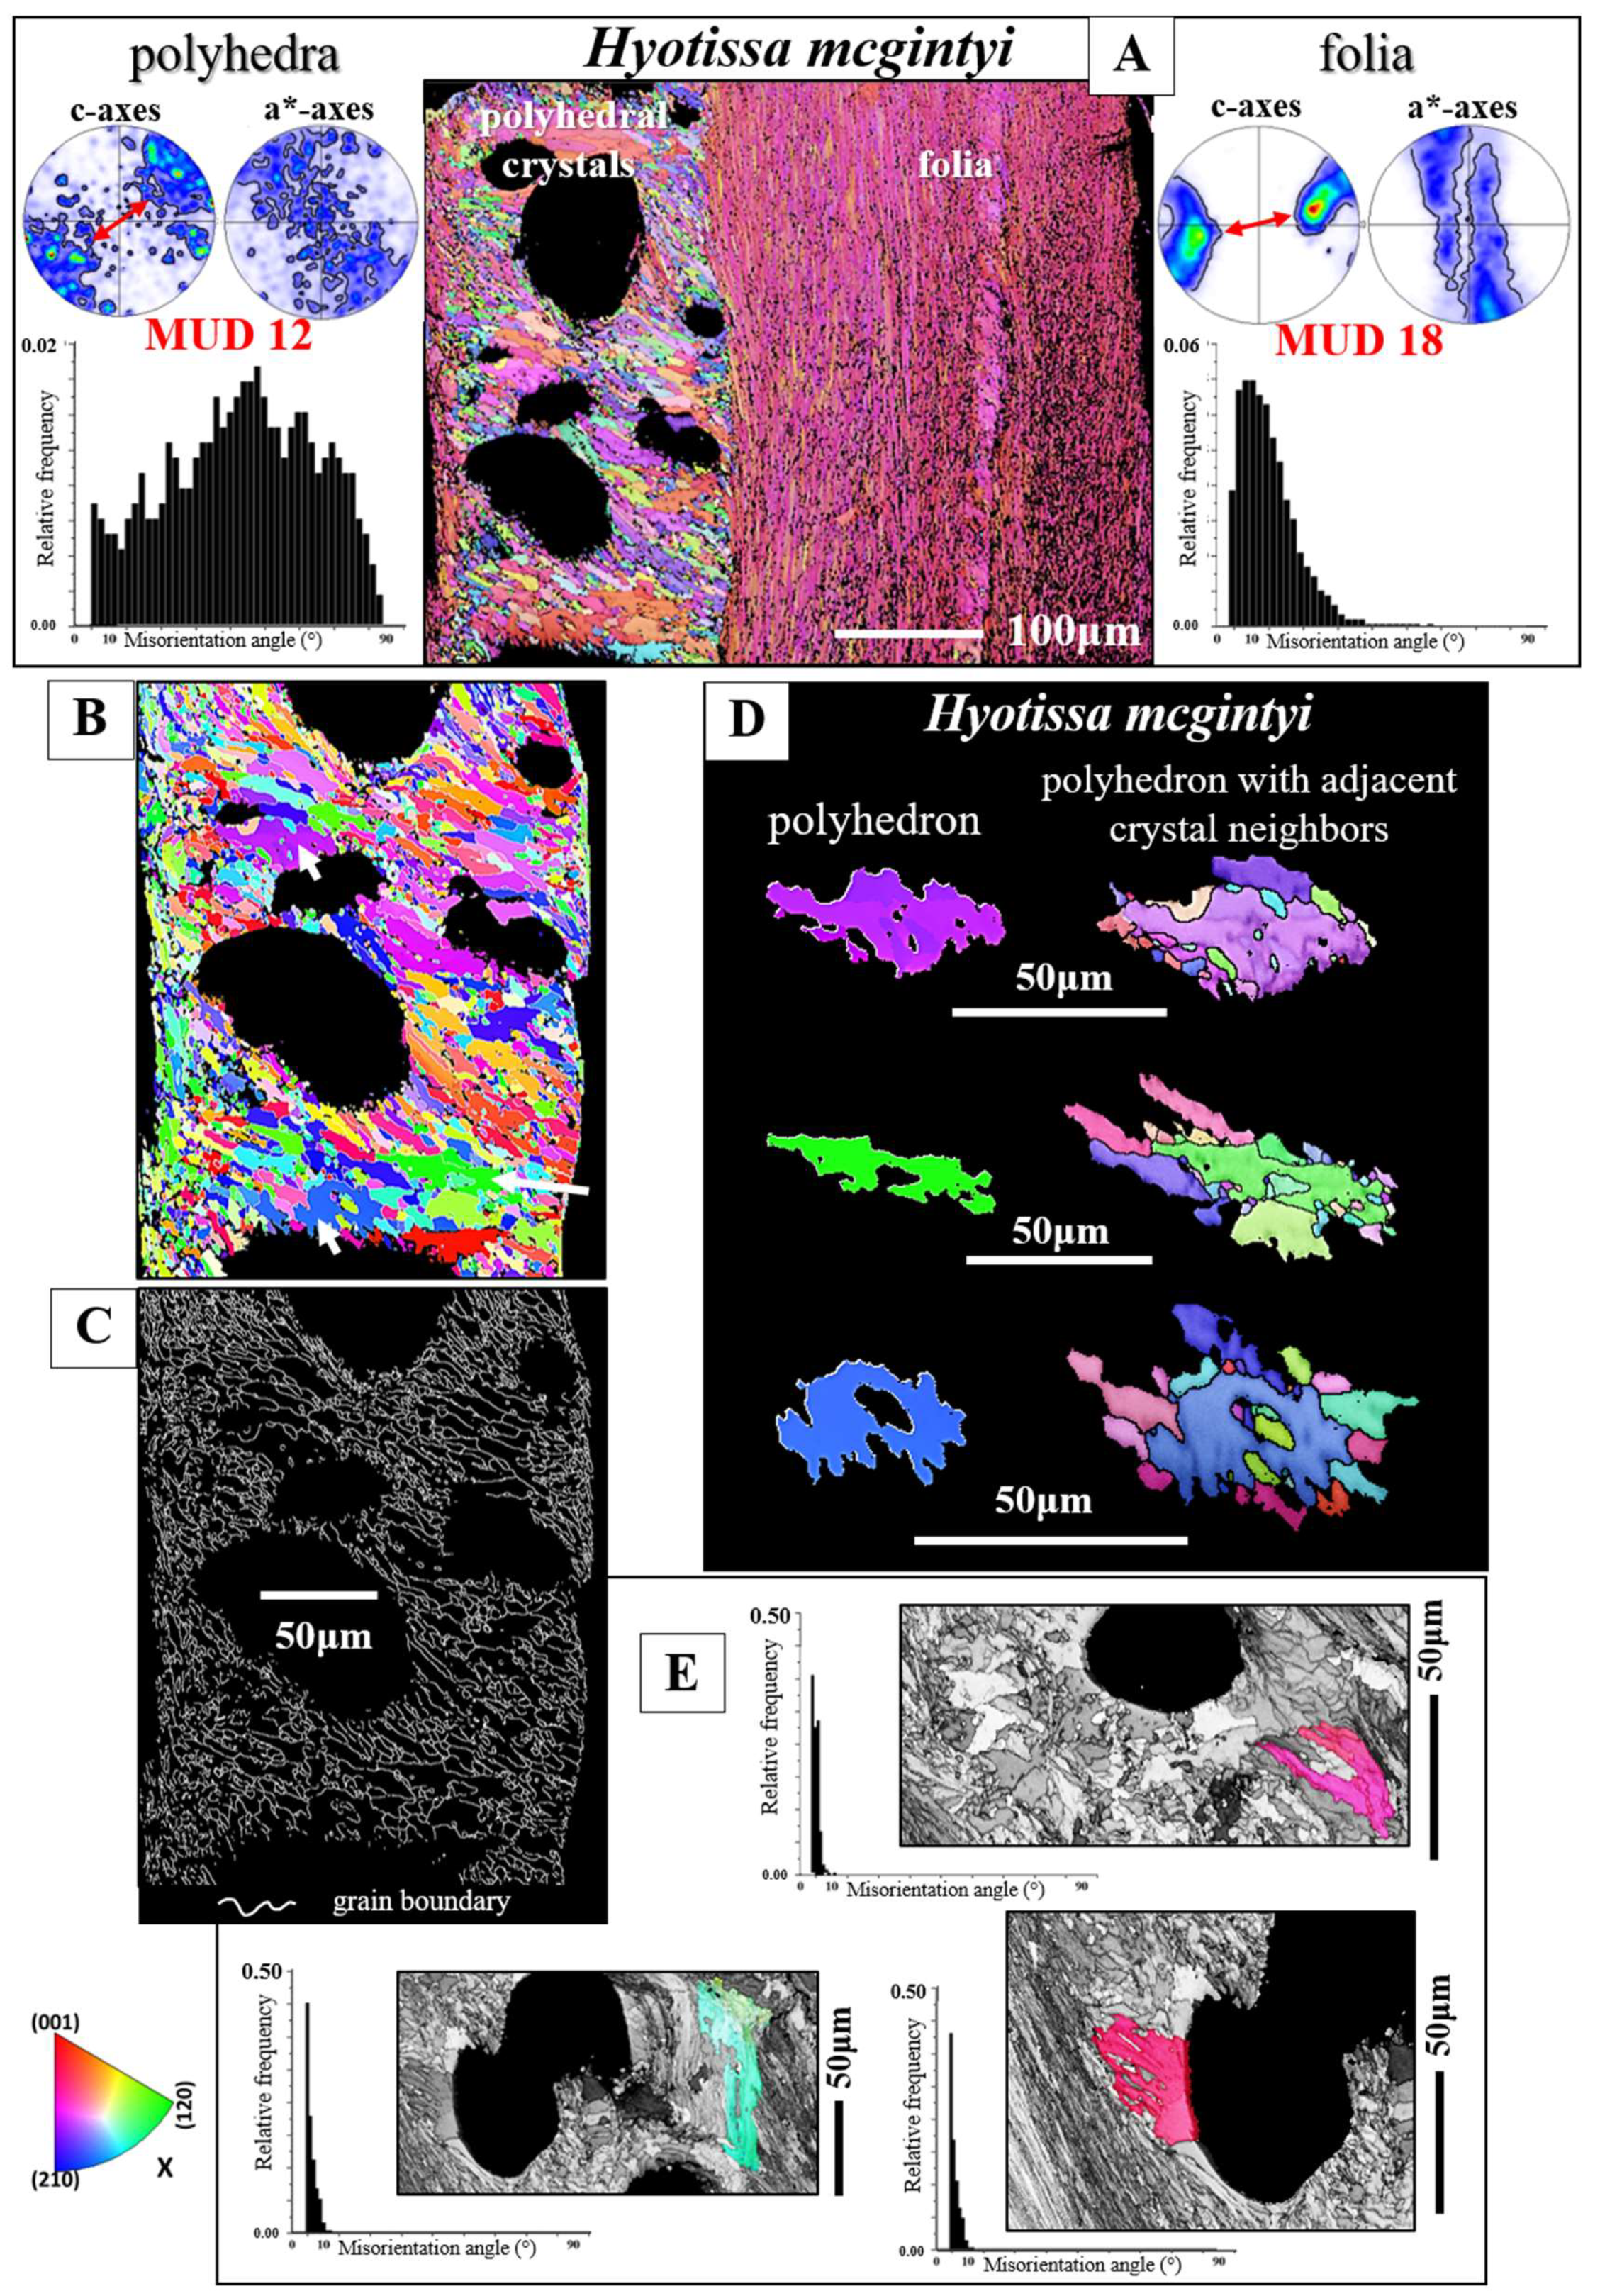
Figure 13.
Assembly of fractal-shaped (dendritic) crystals that surround the vesicular pores in Hyotissa hyotis and Neopycnodonte cochlear (Gryphaeidae) shells (A to C). Dendritic grains vary strongly in size, shape and orientation. The dendritic, polyhedral, crystal texture pattern is distinct from that of the foliated shell (see pole figures in A). B: Strong interlinkage of dendritic crystals, well visible from the EBSD maps as well as from individual crystals. For the latter see the crystal marked with a white star in (B) and its adjacent neighbors. C: The calcite of individual grains (indicated with a yellow and a white star in C) is well co-oriented. EBSD map in (C): The assembly of folia lashes out into the adjacent dendritic granular layer, encasing the vesicular pores. At EBSD data acquisition and EBSD data evaluation the three Euler angles were kept at 0°; φ1=0°, Φ=0°, φ2=0°.
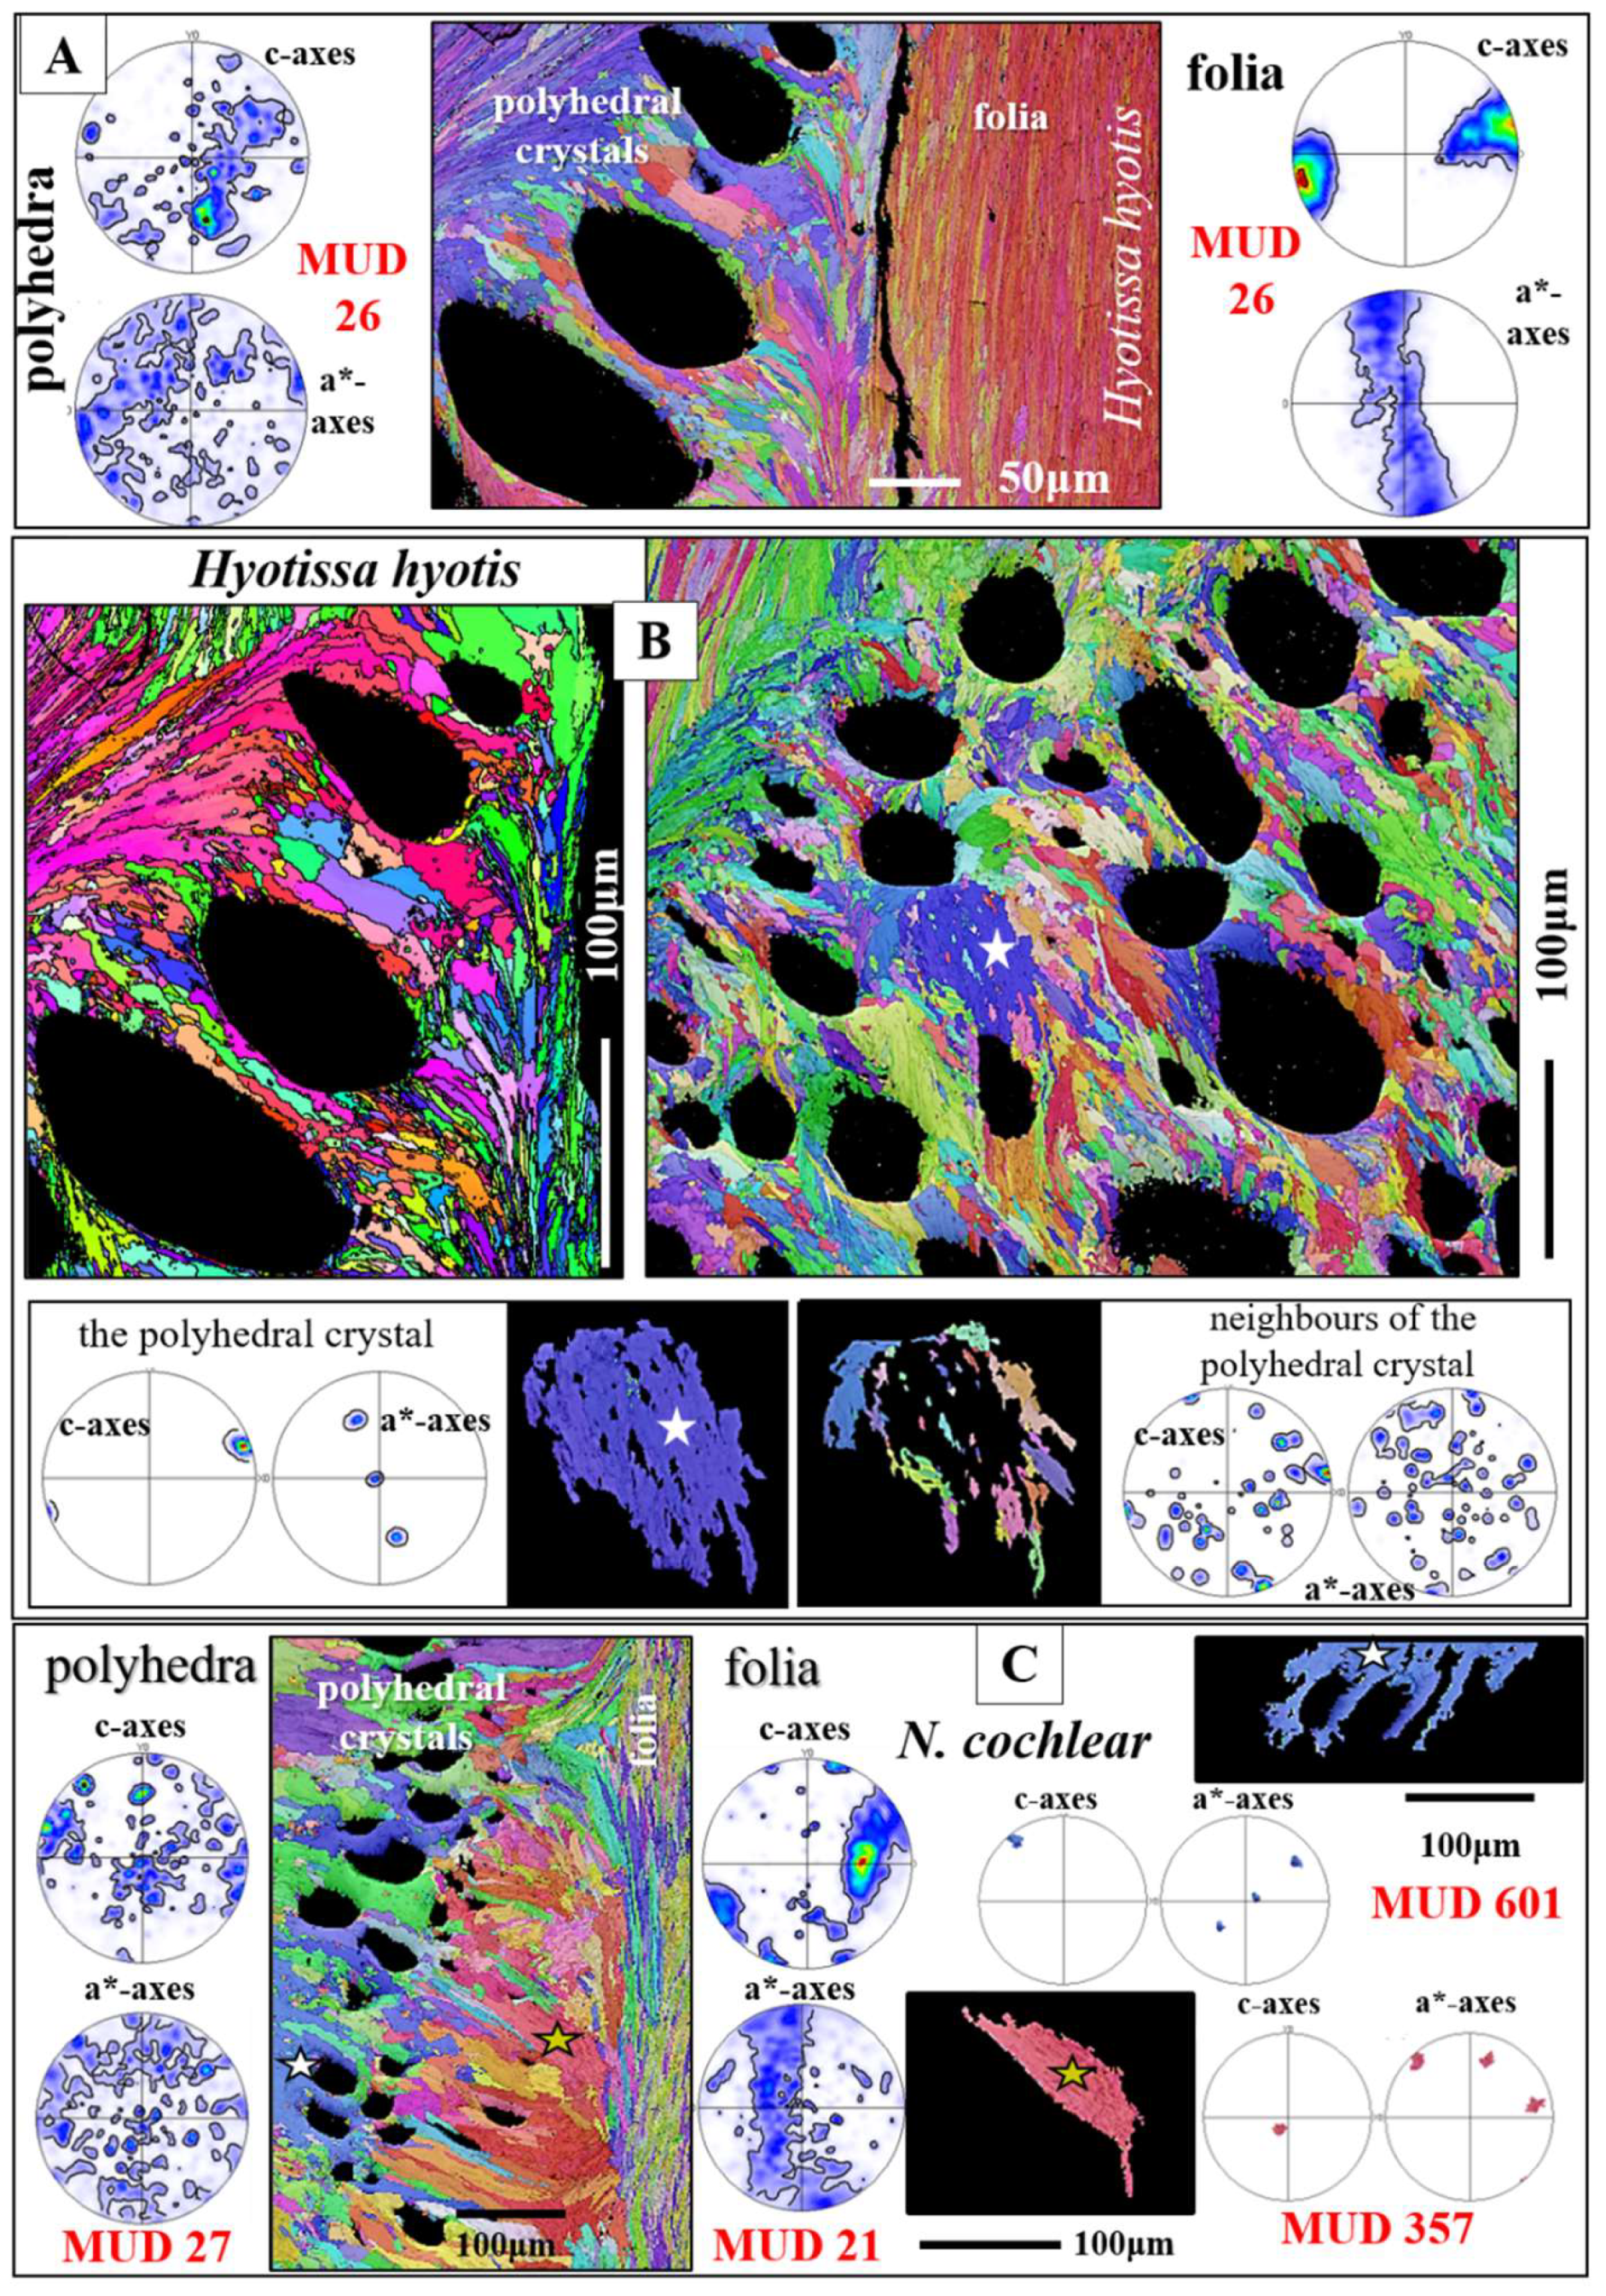
Figure 14.
A, B: Morphology, microstructure, texture and co-orientation strength of crystals that reinforce the biopolymer glue of Hyotissa mcgintyi (Gryphaeidae) and Magallana gigas (Ostreidae) which cements the shell to the substrate. White star in (A): The granular nature of the cementation layer and the arrangement/assembly of granules into chains/strings. We observe from the pole figures some oriented arrangement of the cementation granules as well as for the adjacent assembly of dendritic crystals (A). Black arrows in the pole figures in (A) indicate the overall direction of c-axis orientation of the granular (the cementation granules) and of the dendritic granular calcite (the calcite encasing the pores). At EBSD data acquisition and EBSD data evaluation, the three Euler angles were kept at 0°; φ1=0°, Φ=0°, φ2=0°.
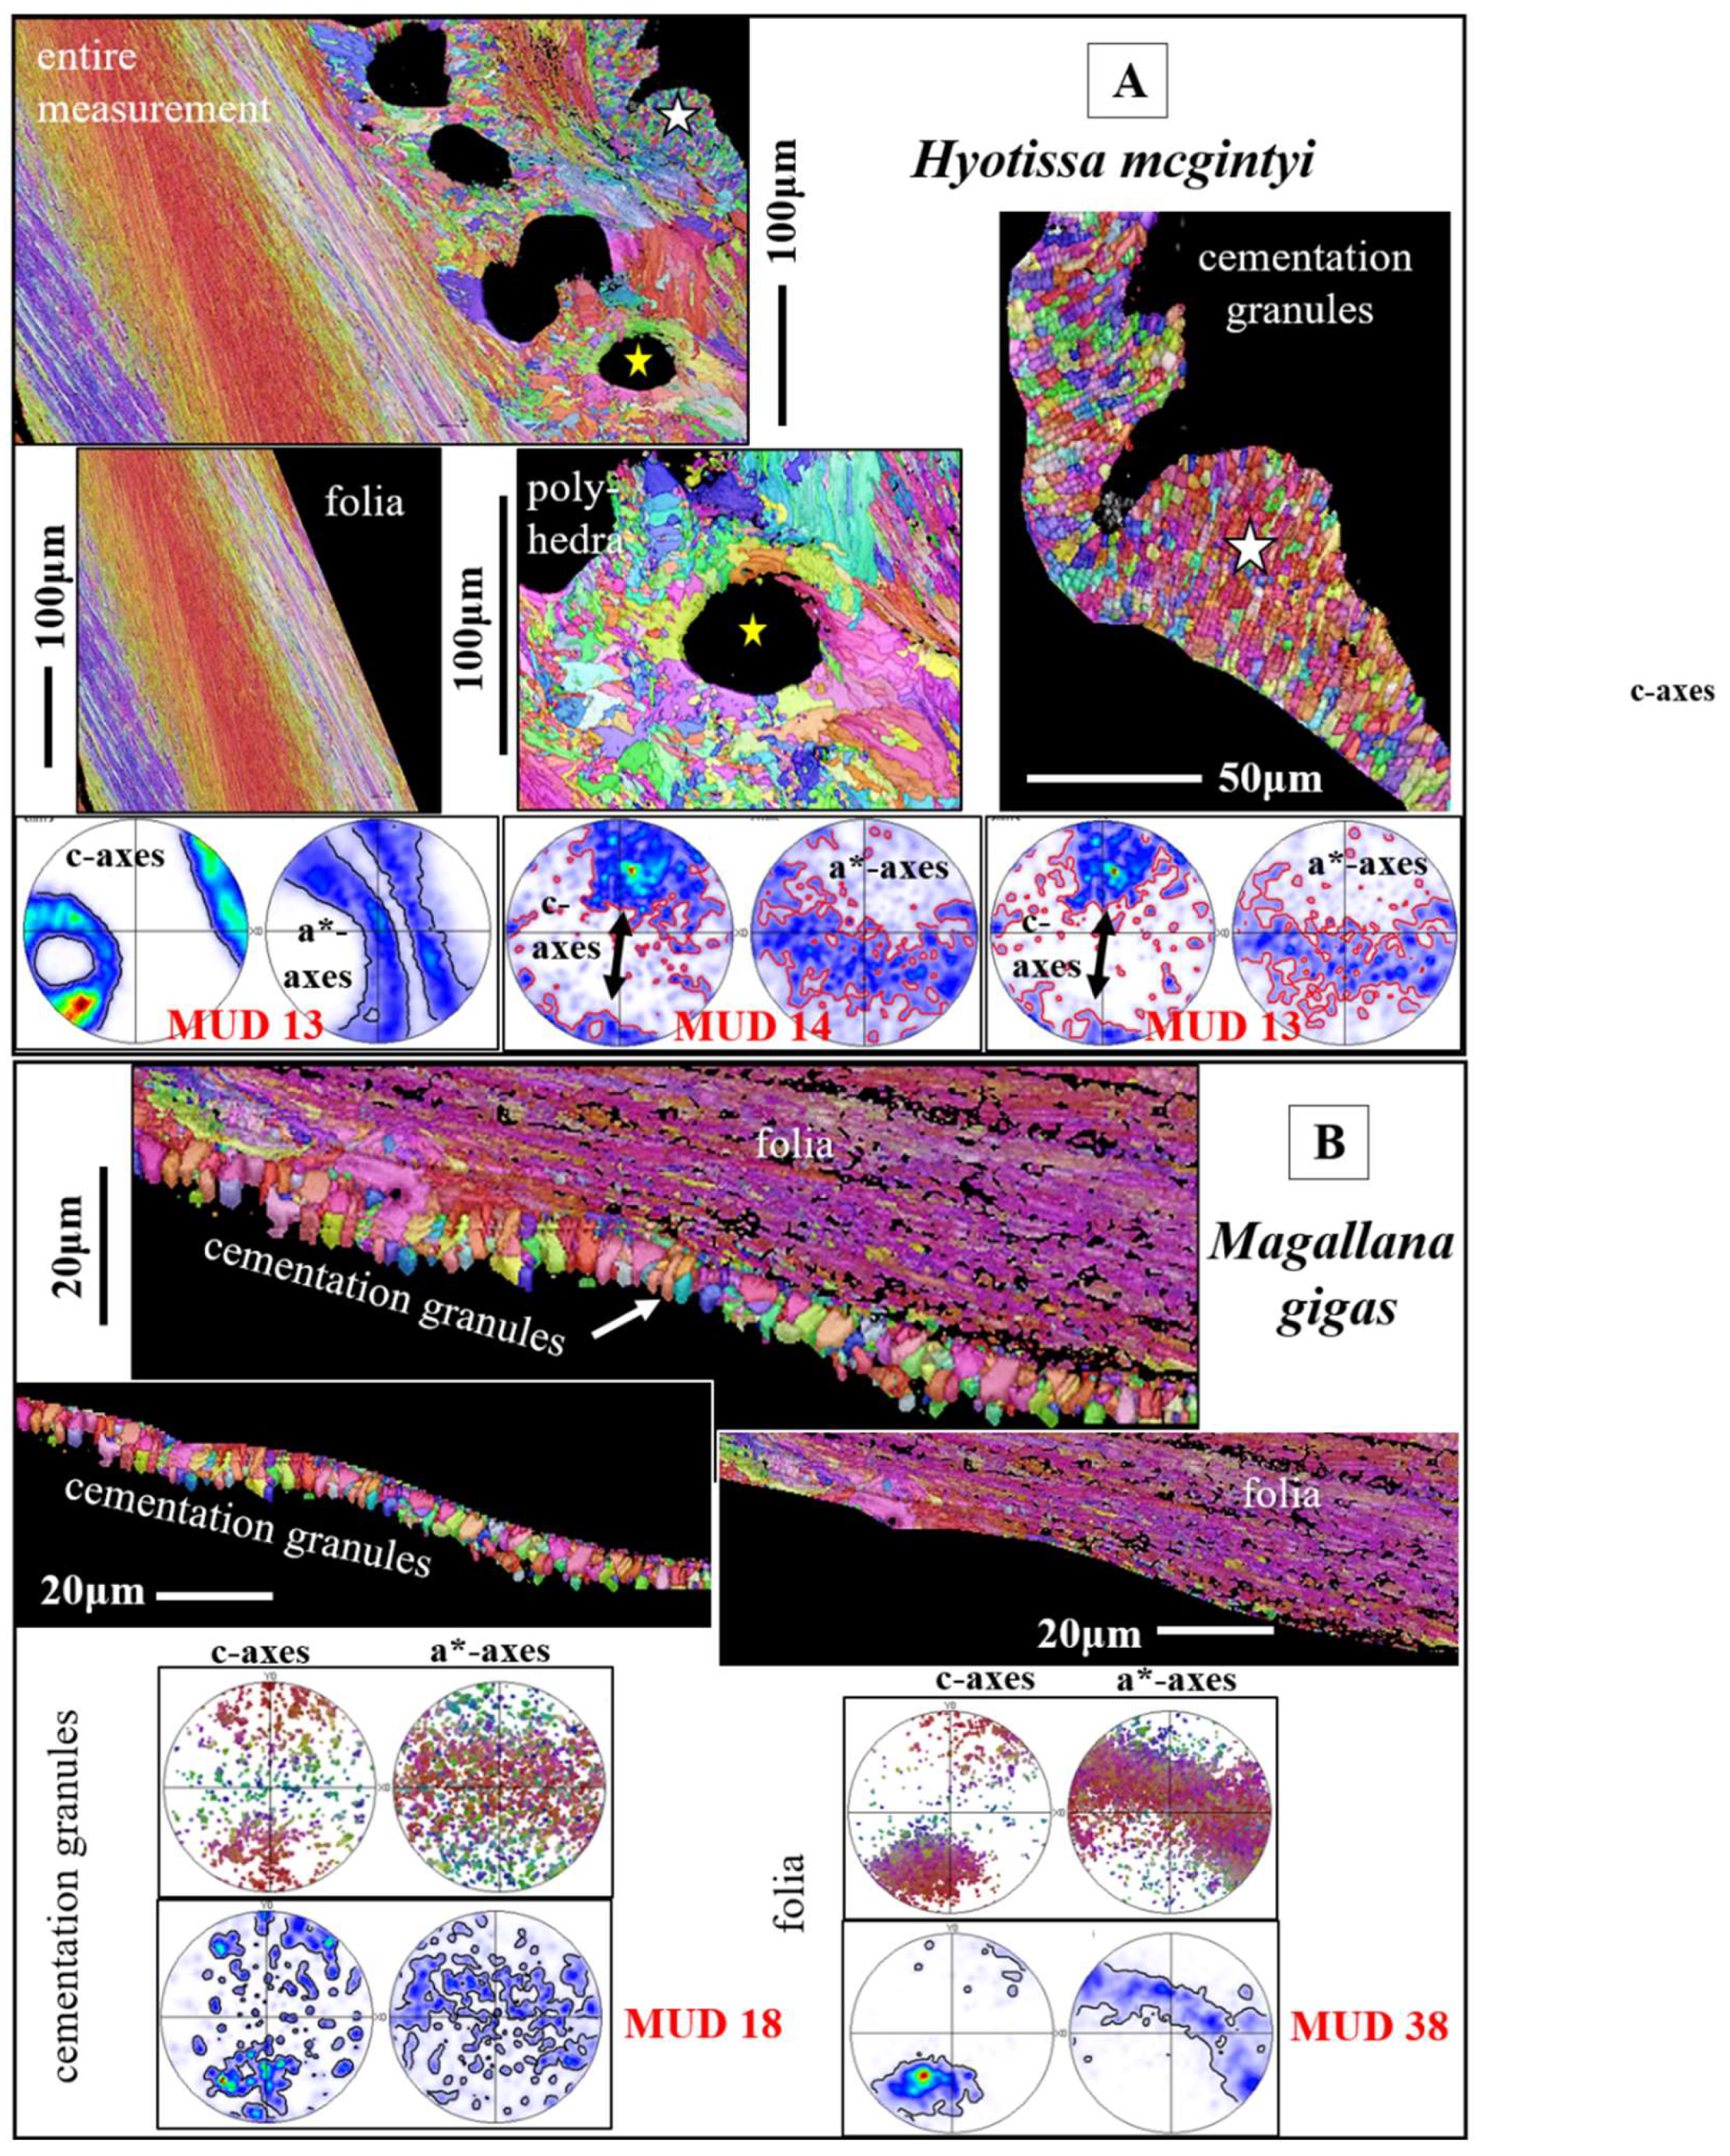
Figure 15.
Calcite c- and a*-axes orientations at the changeover from columns to the stacks of folia (A to E) and from the assembly of folia to myostracal prisms (F). For investigation of a possible crystal twin-related change between adjacent microstructures, we show, in addition to the c-axis (the {001} pole figure) and a*-axes (the {110} pole figure) orientations, pole figures for {104}, {018} and {012} plane orientations. As it is well visible from the pole figures in Figure 15A to C, the transition from the columns to the adjacent folia is not twin operation related. It is rather a gradual, crystal rotation-based, change between the crystallites of the columnar to the crystallites of the foliated shell layers (D, E). F: Changeover from foliated calcite to myostracal, prismatic, aragonite. Even though the microstructures, as well as the textures, are very different for these two shell layers, we find some correspondence in c-axes orientation (see pole figures encircled in red in F) and some correspondence in a*-axes orientations for the calcite and the aragonite (see the pole figures encircled in blue in F). At EBSD data acquisition and EBSD data evaluation, the three Euler angles were kept at 0°; φ1=0°, Φ=0°, φ2=0°. A to E: Magallana gigas. F: Ostrea stentina.
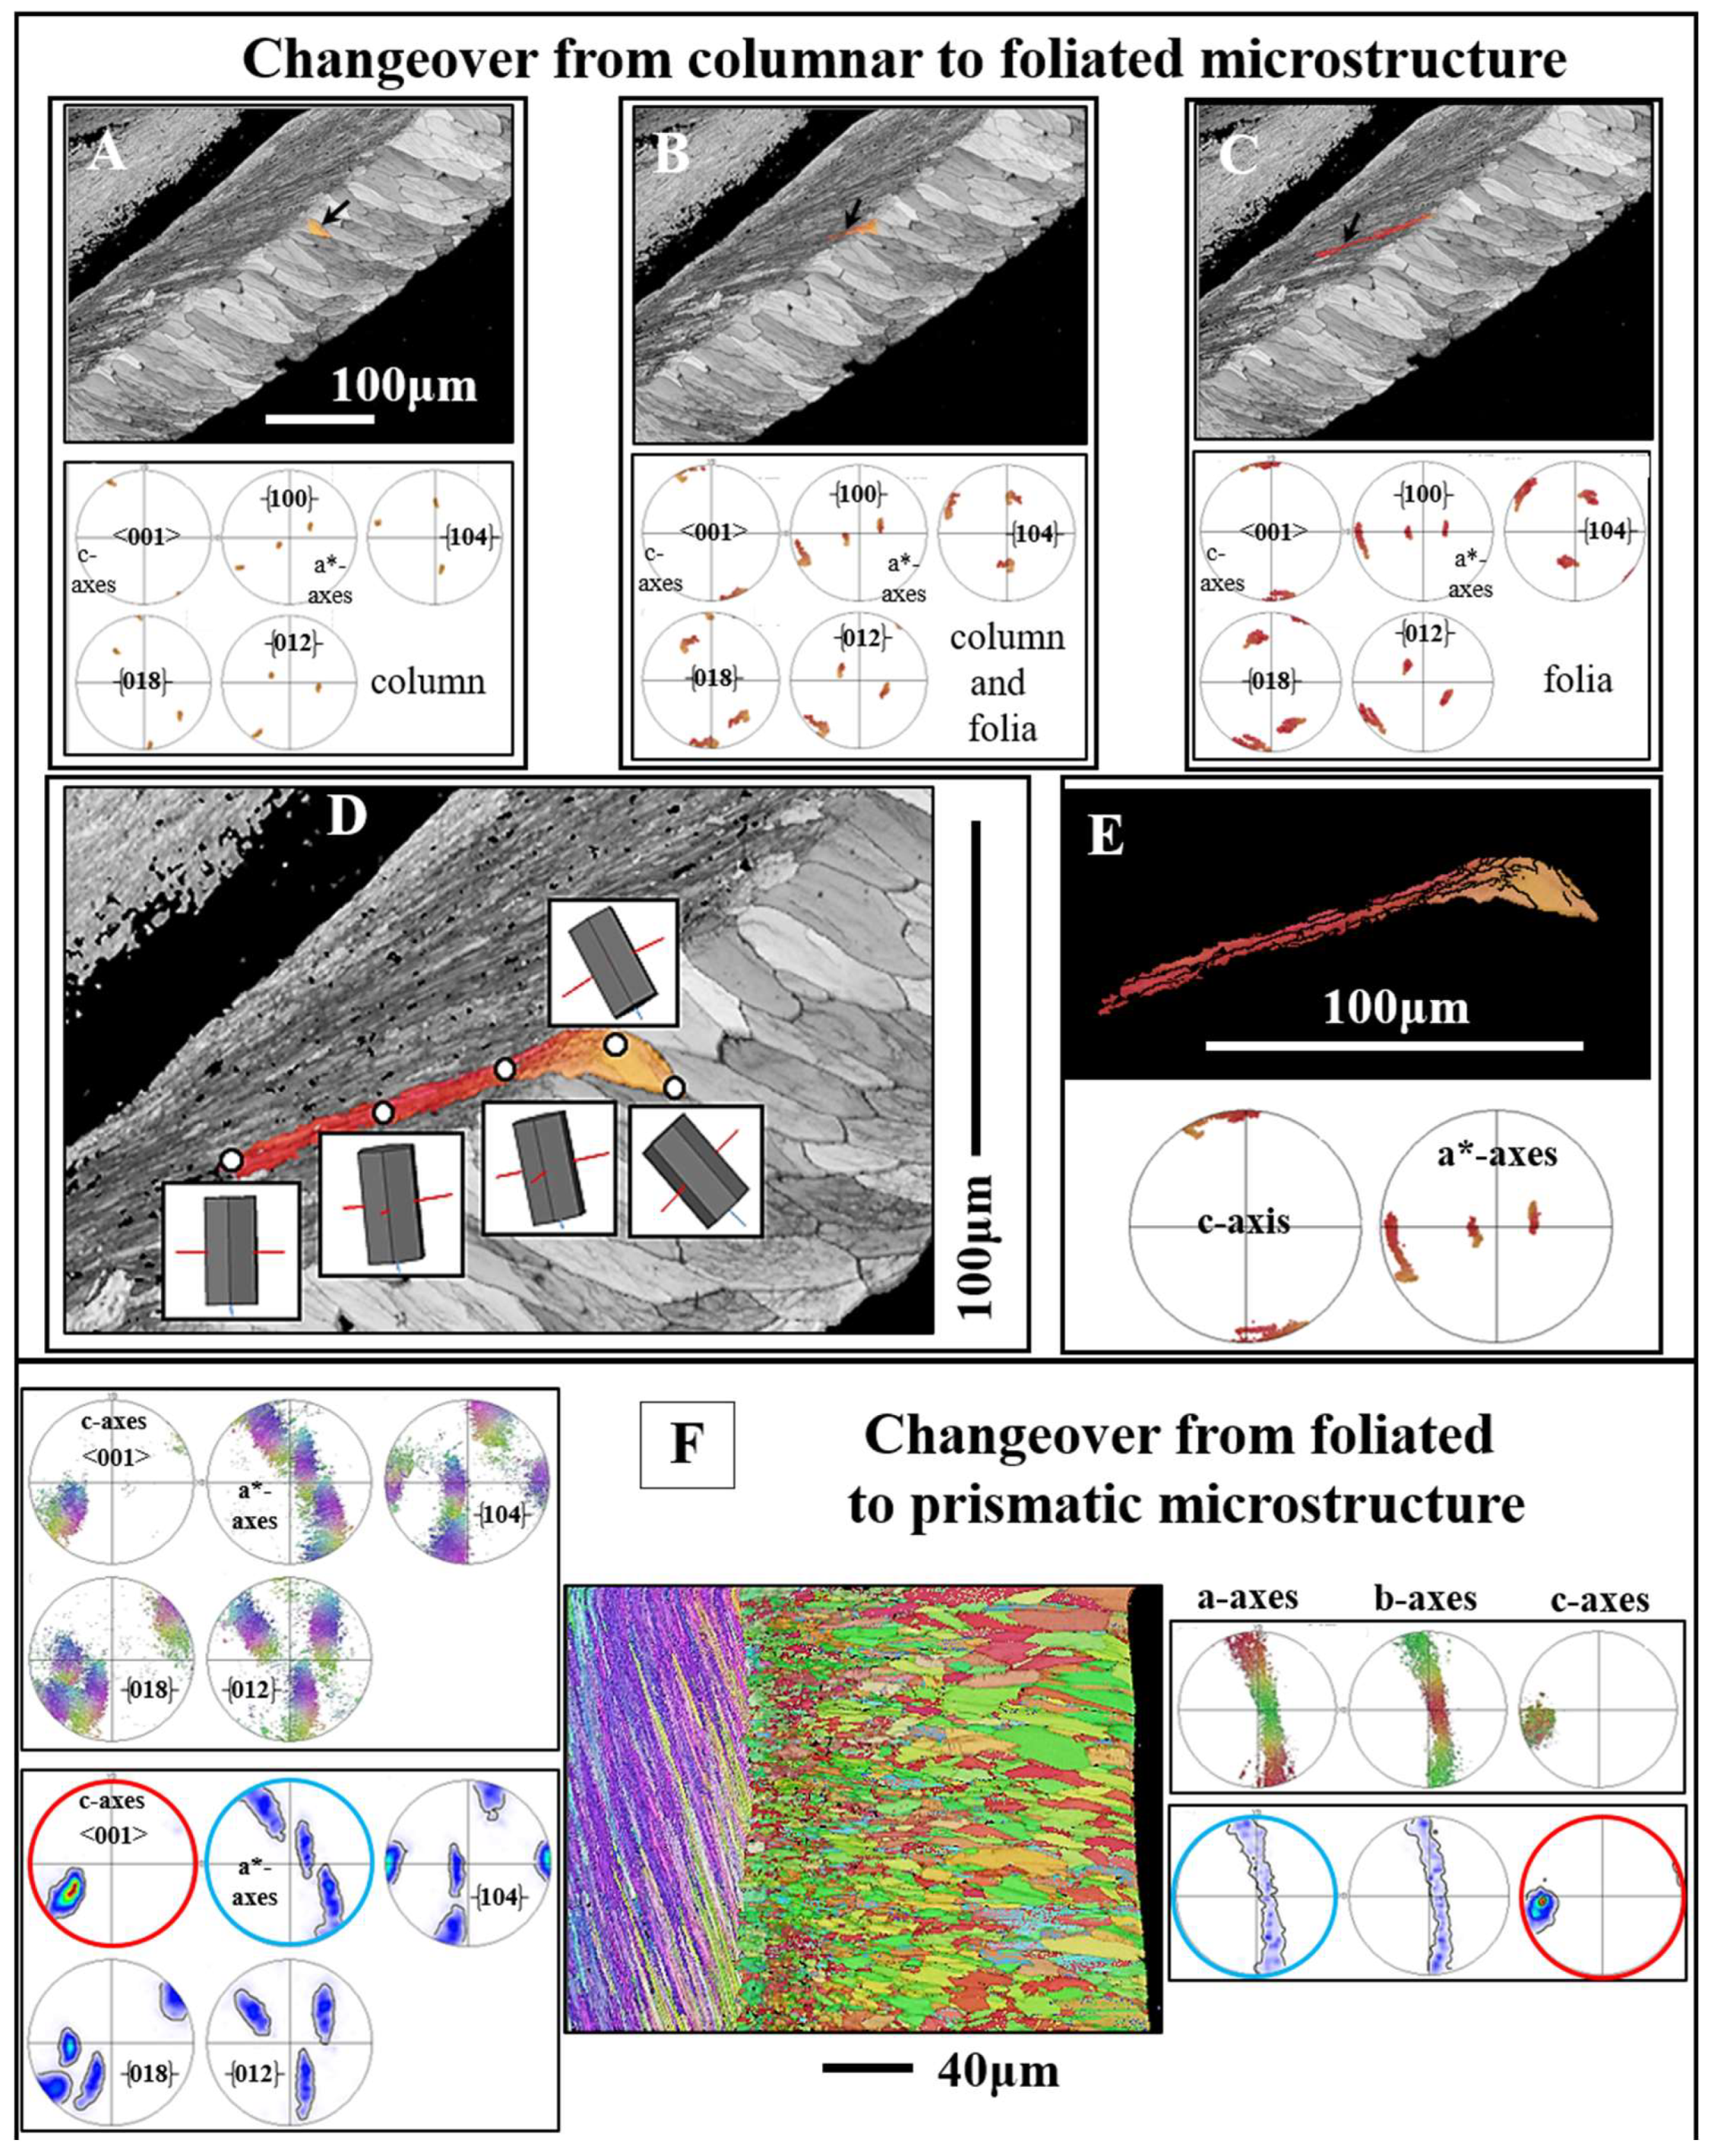
Figure 16.
EBSD scans, color-coded for crystal orientation, visualize calcite c- and a*-axes orientation at the changeover from foliated to chalky calcite (A to C). We show with pole figures c-axis ({001} pole figure) and a*-axes ({100} pole figure) as well as the {104, {018} and {012} orientations. These are shown for (i) only the foliated calcite and (ii) for the foliated calcite and the, to the calcite attaching, chalk blades. In addition, we give corresponding relative frequency-misorientation angle diagrams for the crystal orientations given in A to C. We do not find a crystal twin-related changeover from foliated to chalk calcite. If the latter was the case, we would need to observe in the misorientation angle diagrams for the folia and the directly adjacent chalk crystals a marked peak in either 60°, 78.1°, 78.8° and 104° misorientation, as defined according to the twin laws of calcite [42,43]. We demonstrate with the absence of a marked peak at 60°, 78°/79° and 104° misorientation and the {001}, {104, {018} and {012} pole figures that foliated and chalk calcite are not twinned and that the changeover from folia to chalk calcite is not given with a calcite twin related crystallographic operation. At EBSD data acquisition and EBSD data evaluation, the three Euler angles were kept at 0°; φ1=0°, Φ=0°, φ2=0°. A to F: Magallana gigas.
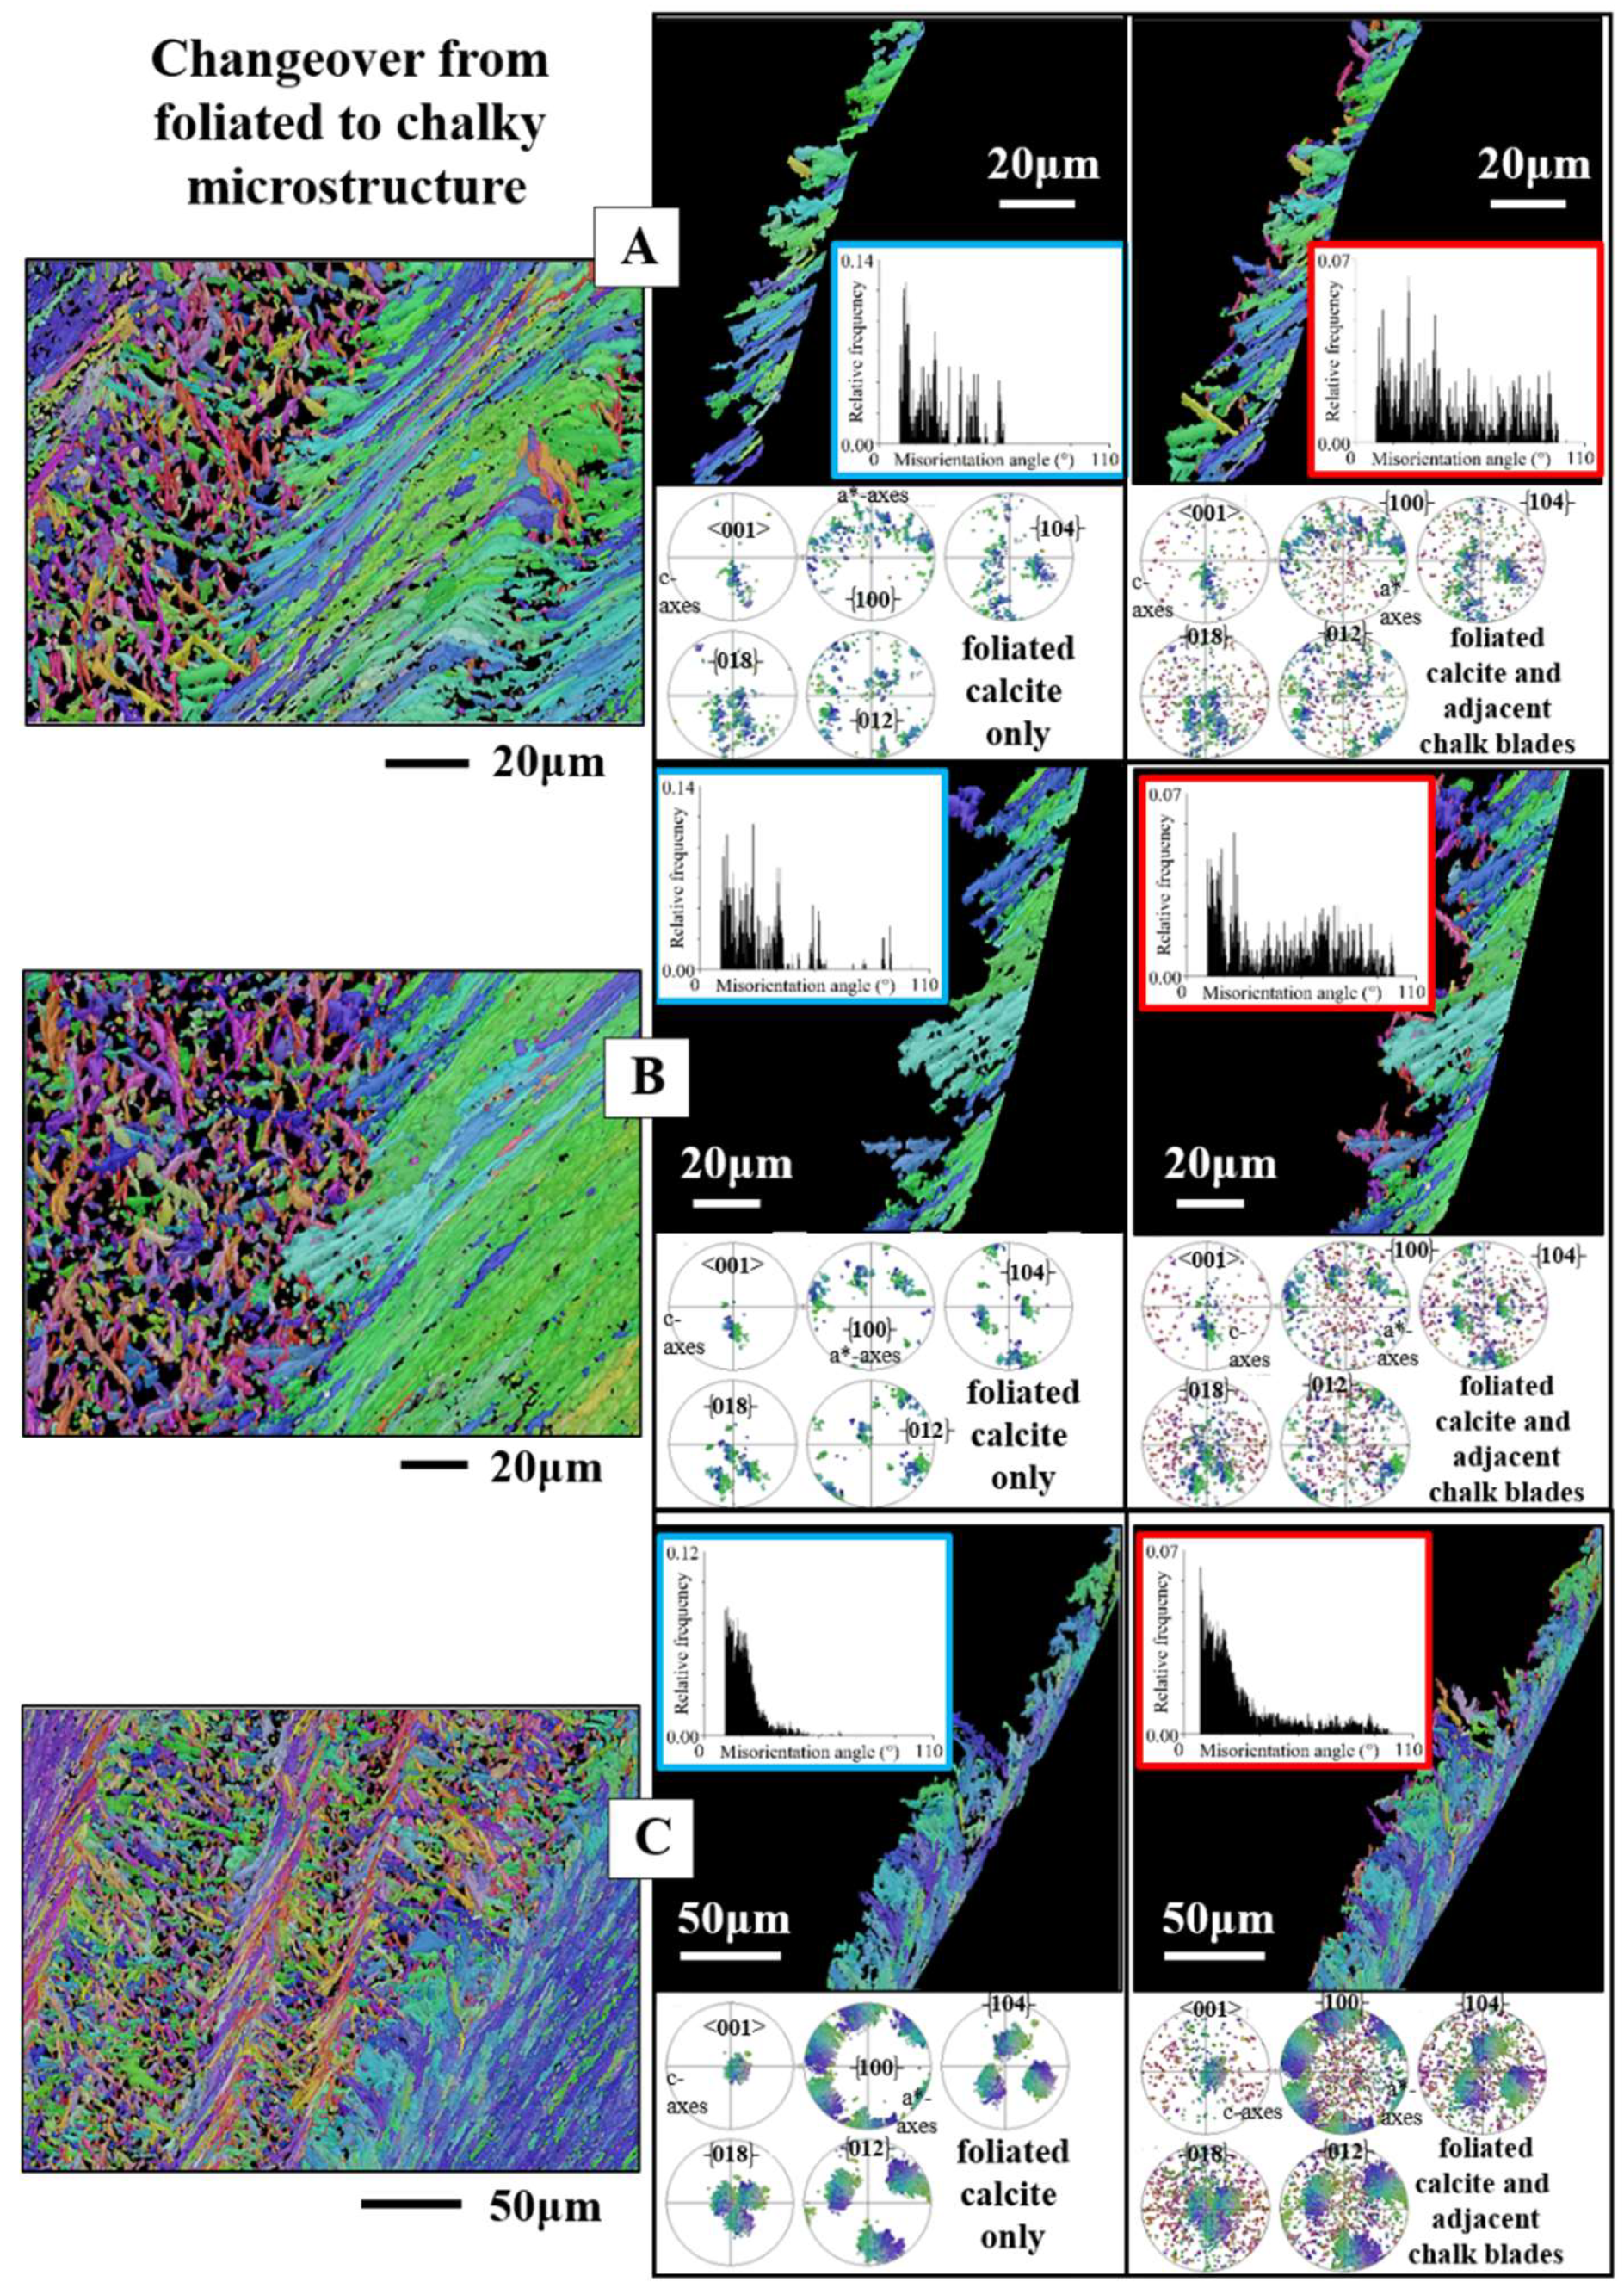
Figure 17.
Enlargement of the relative frequency-misorientation angle diagrams shown in Figure 16. Framed in blue are misorientation angle diagrams for only the folia, framed in red are misorientation angle diagrams for the folia and the adjacent, directly touching, chalk blades. We do not observe a marked peak at 60°, 78.1, 78.8°, 104° misorientation. This demonstrates the absence of a calcite twin operation-related structural change from the foliated into the chalk microstructure. A to F: Magallana gigas.
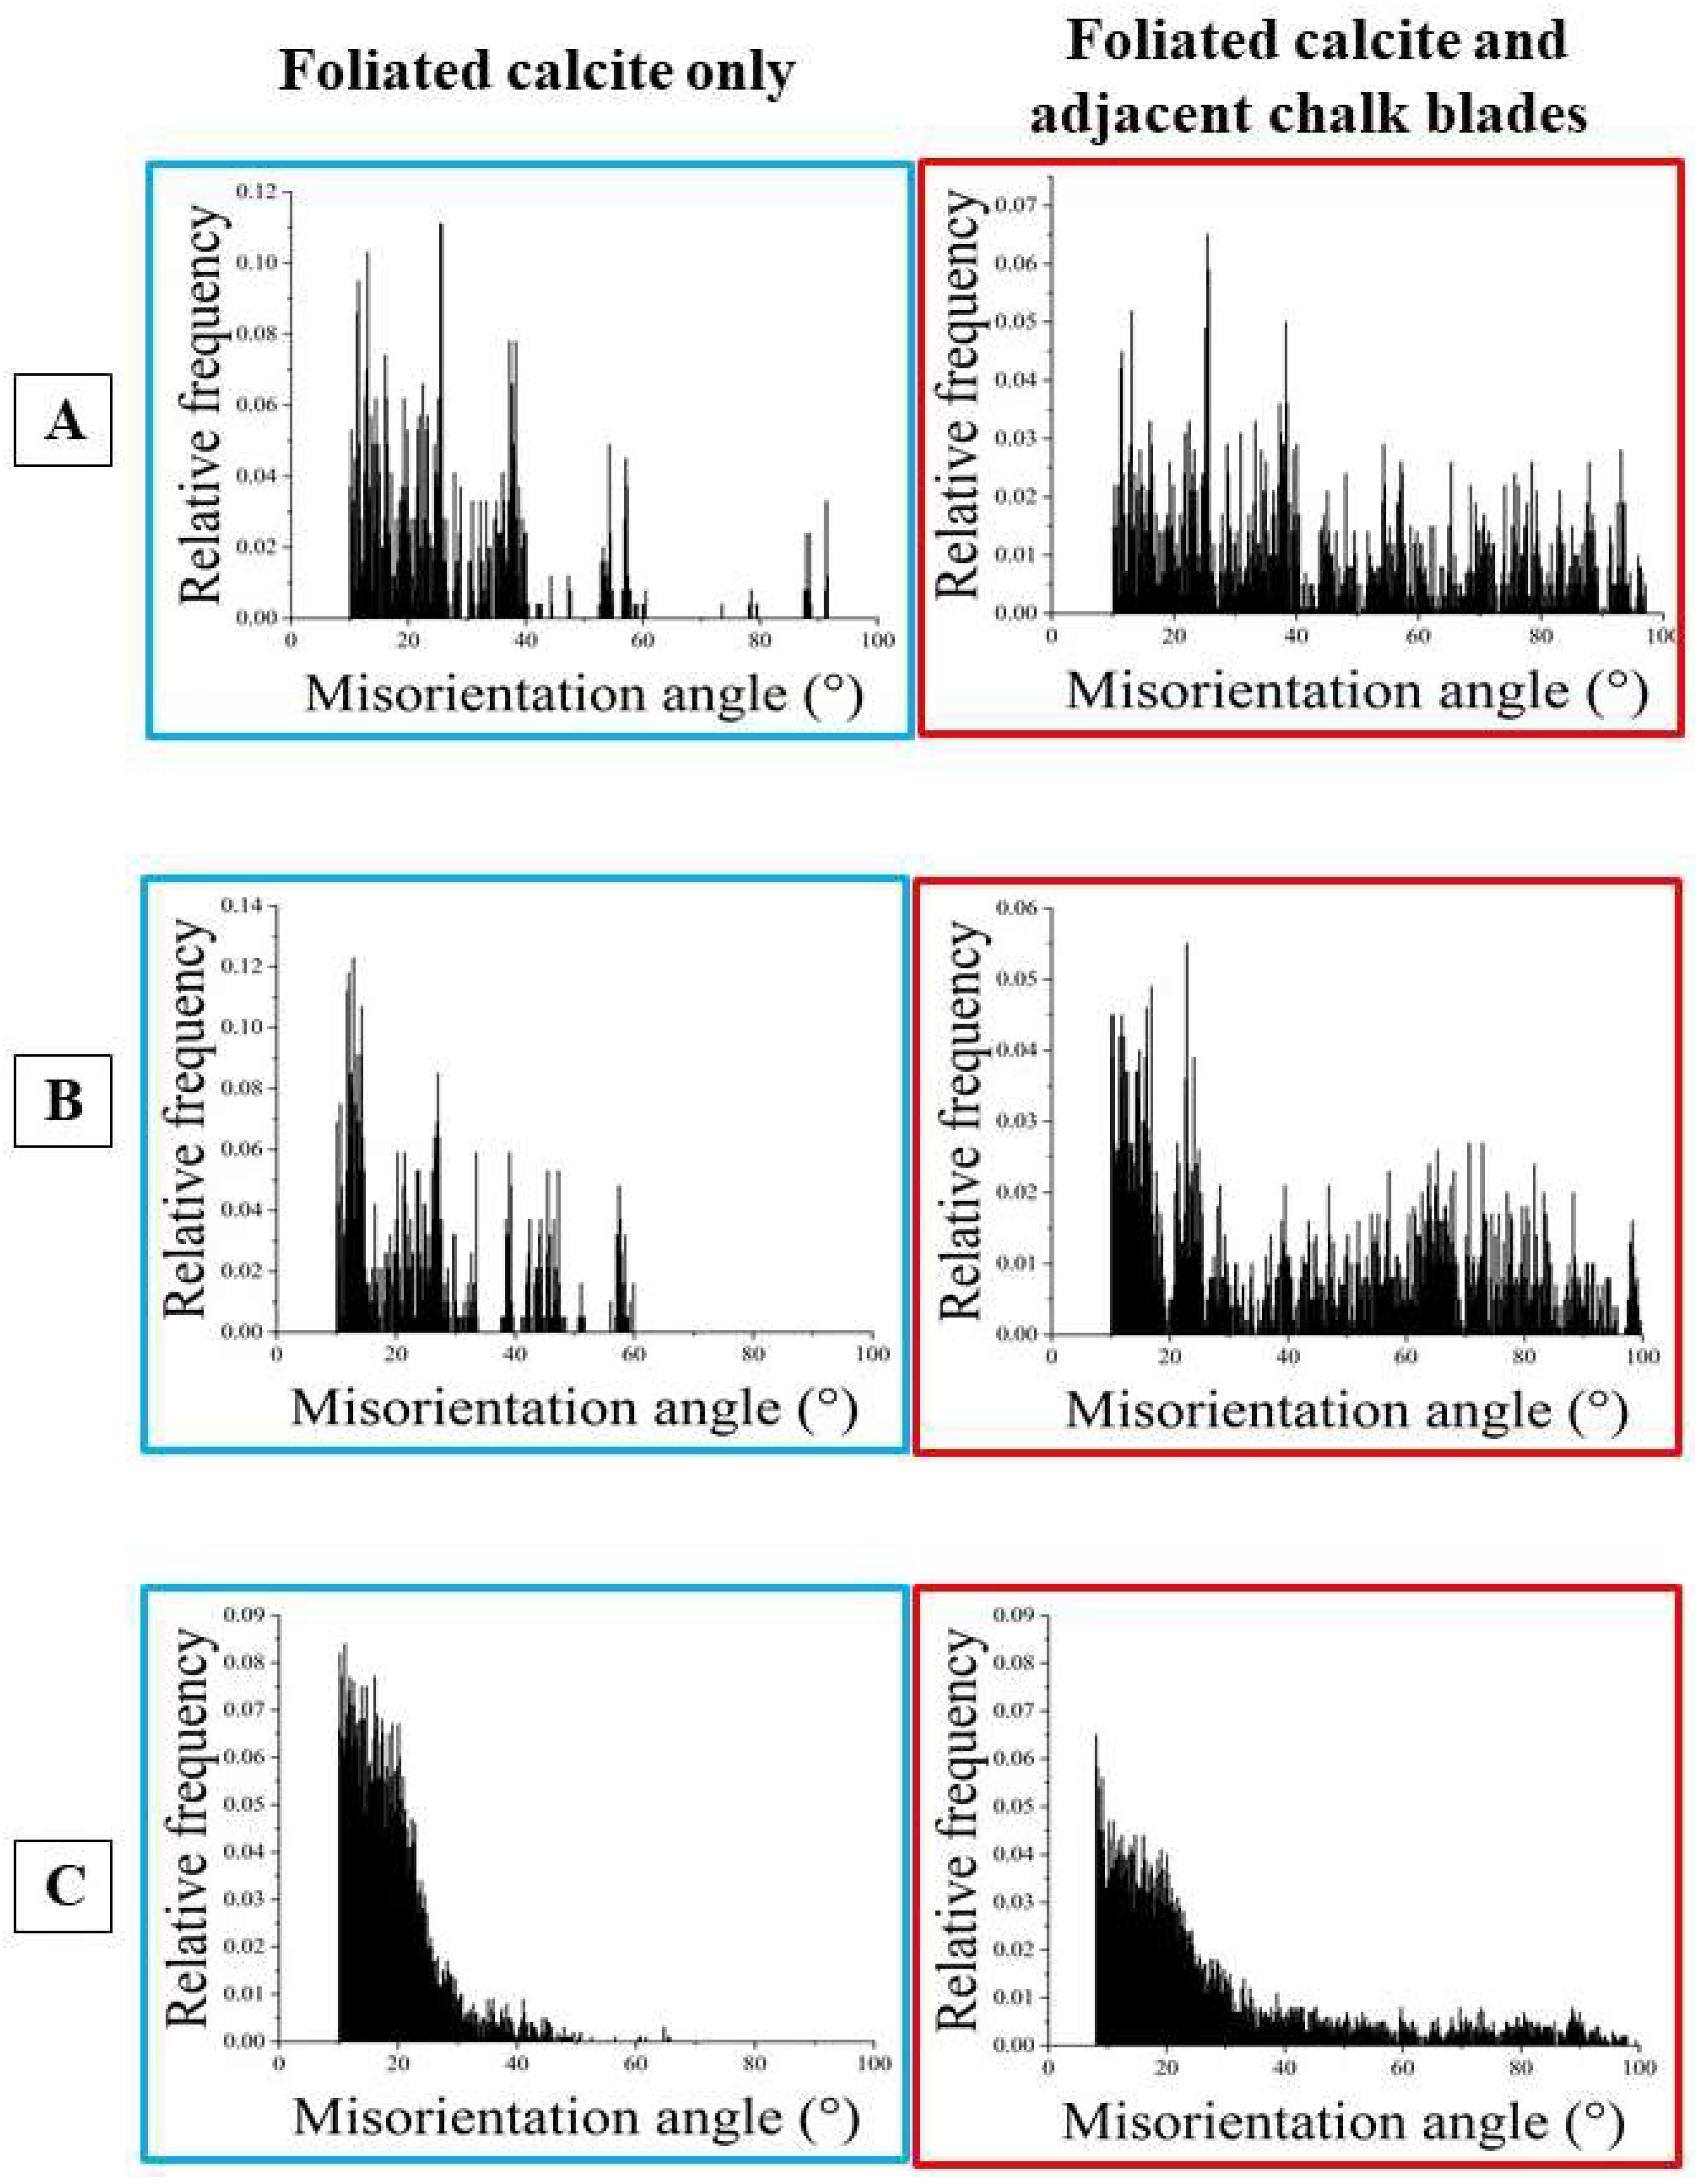
Figure 18.
The changeover from foliated to ‘dendritic’ calcite (A, D). The change from one microstructure into the other is rather abrupt. For the foliated and the adjacent dendritic, polyhedral, crystals (D) we do not find a marked peak at 60°, 78.1, 78.8°, 104° in the relative frequency-misorientation angle diagram (D), nor any indication of twin formation in the (001), (104), (018), (012) pole figures (D). This indicates that the changeover from the foliated to the ‘dendritic’ crystal shell portion is not the result of a calcite twin-related crystallographic operation. At EBSD data acquisition and EBSD data evaluation, the three Euler angles were kept at 0°; φ1=0°, Φ=0°, φ2=0°. A to D: Neopycnodonte cochlear.
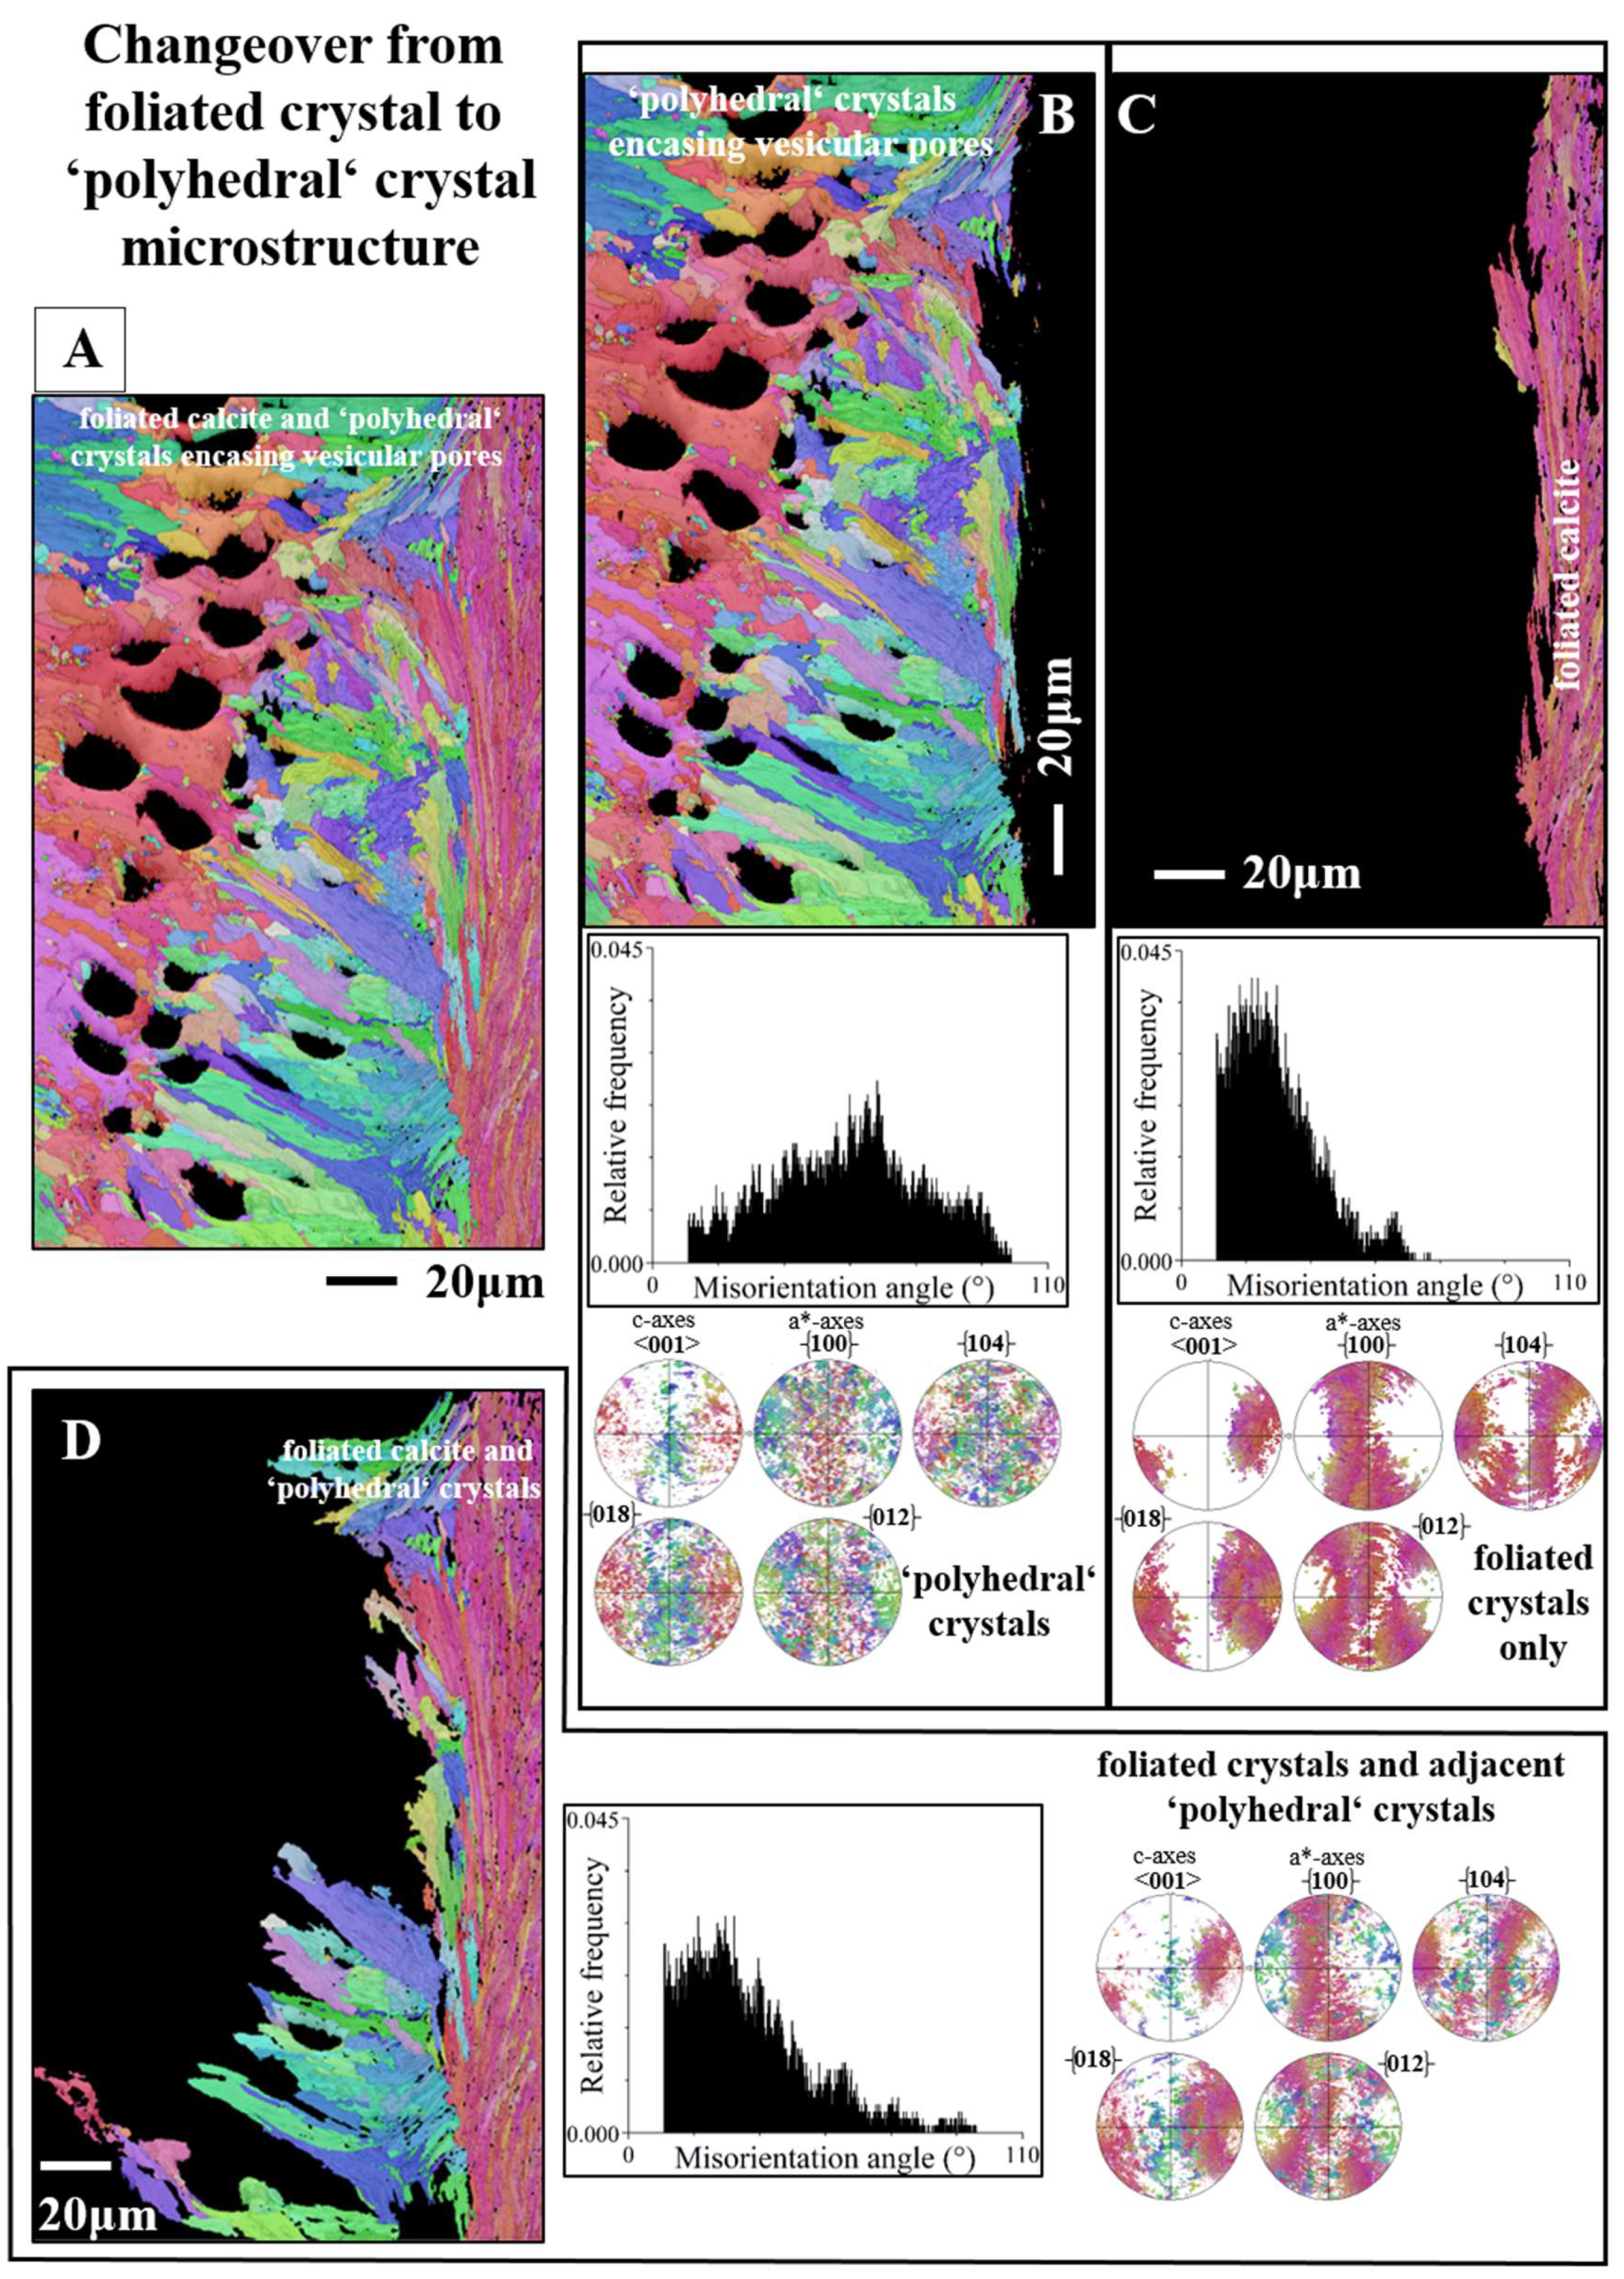

Table 1.
The different crystals that comprise Ostreoidea shells and the range of crystal co-orientation strength, expressed as MUD value, for individual crystals as well as for a particular microstructure. When the MUD value of a microstructure is considered, then we observe the highest crystal co-orientation strength for the myostraca and the lowest for the chalk and for the polyhedral crystals. When the MUD value of individual crystals is considered, we find the highest crystal co-orientation strength for individual rhombohedral crystals, followed by the individual prisms of the myostraca.
| MUD value of an EBSD scan covering many crystals |
MUD value of an EBSD scan over an individual crystal |
|
| Columnar crystals | 25-30 | 250-460 |
| Foliated crystals/crystallites |
18-67 | Folium: 591, 626 Foliated crystal: 174, 545 |
| Pallial prisms | 125-130 | 650-680 |
| Adductor prisms | 85-90 | 650-700 |
| Chalk blades/laths | 4-45 | 450-500 |
| Polyhedral crystals | 12-27 | 350-600 |
| Cementation granules | 13-18 | 600-650 |
| Rhombohedral crystals | - | 700, >700 |
Disclaimer/Publisher’s Note: The statements, opinions and data contained in all publications are solely those of the individual author(s) and contributor(s) and not of MDPI and/or the editor(s). MDPI and/or the editor(s) disclaim responsibility for any injury to people or property resulting from any ideas, methods, instructions or products referred to in the content. |
© 2025 by the authors. Licensee MDPI, Basel, Switzerland. This article is an open access article distributed under the terms and conditions of the Creative Commons Attribution (CC BY) license (http://creativecommons.org/licenses/by/4.0/).
Copyright: This open access article is published under a Creative Commons CC BY 4.0 license, which permit the free download, distribution, and reuse, provided that the author and preprint are cited in any reuse.


