Submitted:
29 January 2025
Posted:
30 January 2025
You are already at the latest version
Abstract
Background & Objectives: Apolipoproteins, specifically ApoA-I (a cardioprotective HDL component) and ApoB (associated with cardiovascular risk), are increasingly recognized for their value in diagnosing and predicting heart disease. This study focused on comparing these markers and the ApoB/ApoA-I ratio with traditional lipid profiles to assess their diagnostic and prognostic capabilities. Methods: In this cross-sectional study, 1,200 participants were categorized into three groups: control (n=250), training (n=450), and validation (n=500). Blood samples were analyzed for ApoB, ApoA-I, and conventional lipid profile. Advanced statistical methods, including logistic regression, ROC curve analyses, and propensity score matching, were applied to control for confounding factors and validate findings. Results: The training cohort showed significantly higher ApoB levels (1.20 ± 0.52 g/L) compared to controls (1.0 ± 0.40 g/L, p < 0.001), while ApoA-I levels were significantly lower (1.03 ± 0.34 g/L vs. 1.12 ± 0.34 g/L, p = 0.045). The ApoB/ApoA-I ratio was markedly elevated in the training group (1.46 ± 0.18) versus controls (1.06 ± 0.95, p < 0.001). ApoB proved to be the most reliable predictor of coronary artery disease with an AUC of 0.82, surpassing the ApoB/ApoA-I ratio (AUC 0.70) and ApoA-I (AUC 0.65). Cholesterol and triglycerides demonstrated weaker associations with CAD. Conclusion: ApoB and the ApoB/ ApoA-I ratio are superior markers for assessing CAD risk compared to traditional lipid profile. This investigation lends further support for incorporating apolipoprotein testing into clinical practice, enhancing CAD risk stratification, in particular for the high-risk population.
Keywords:
Apolipoprotein B
; ApoB/ ApoA-I Ratio
; Diagnostic Biomarkers
; Propensity Score Matching
1. Introduction
Coronary Artery Disease (CAD) is a typical multifactorial atherosclerotic pathology instigated by the deposition of fat/cholesterol beneath the endothelium, reducing coronary artery elasticity. The accumulated plaque causes the heart artery to narrow and diminishes blood flow to the heart muscles. The atherosclerotic plaque is an essential contributor to the development and progression of CAD. Clinical manifestation of CAD encompasses a congregation of acute and chronic conditions, including stable angina, acute coronary syndromes, and heart failure due to an insufficient supply of oxygenated blood to the myocardium because of narrowing or obstruction of a coronary artery [1].
Atherosclerosis develops by gathering lipids, lipoproteins, mainly low-density lipoproteins (LDL), and activated leukocytes in the vascular wall of coronary arteries. The foam cells, called lipid-laden alveolar macrophages, play a crucial role in developing atherosclerotic inflammatory disease [2].
The progression of atherosclerotic plaques takes an extended period, and mostly, it is asymptomatic or causes angina pectoris. When atherosclerotic plaque becomes unstable, it may rupture. The ruptured plaque, along with platelet aggregation, forms thrombosis in coronary arteries and may cause myocardial infarction [3]. The significant risk factors for establishing CAD and increased risk of Myocardial infarction (MI) are elderly age, male gender, excessive tobacco smoking, raised blood pressure/ HTN, sedentary lifestyle, diabetes mellitus, hyperlipidemia and obesity [4].
Reliable risk assessment indicators could benefit clinical investigation, prevention, and management of CAD. Traditional lipid profile measurement, which includes total cholesterol, Triglycerides, LDL, and high-density lipoproteins (HDL), has long been used as risk assessment biomarkers for CAD [5]. Results from various studies suggested that apolipoproteins (ApoA-I & Apo-B) and ApoB /ApoA-I ratios are superior to traditional lipids in estimating coronary risk [6].
ApoA-I and Apo-B are both structural and functional components of lipoproteins involved in cholesterol transport within the body and the atherosclerosis pathway. In fact, both Apo-A1 and HDL-C are well-known for their anti-atherogenic effects. Research studies indicated that Apo-B is more superior to LDL-C in predicting CAD, and its high levels lead to bad lipoproteins. In contrast, high levels of ApoA-I lead to the production of good HDL. Numerous population studies have indicated that CAD events were positively associated with high Apo-B levels, so Apo-B measurement should be integrated into clinical assays [7].
The main apolipoproteins, ApoB and ApoA-I, play crucial roles in atherosclerosis and its effects, as well as in lipid transport. Each LDL, IDL, and VLDL particle compromises a single molecule of ApoB. ApoA-I is the principal protein in HDL particles. The ApoB count signifies the overall quantity of atherogenic particles; an elevated count correlates with an increased risk of coronary artery disease [8].
ApoB serves as a significant transport protein of atherogenic particles responsible for atherosclerosis, while Apo-A1 plays an anti-atherogenic role by facilitating cholesterol transport within HDL-C. The lecithin-cholesterol acyltransferase (LCAT) enzyme is also activated by ApoA-I, which helps HDL transport more cholesterol back to the liver [9].
The ApoB/ ApoA-1 ratio is especially significant as it precisely measures the balance between atherogenic and protective lipoproteins. A higher ratio means more presence of cholesterol in the blood and hence is a greater chance of forming obstacles on arterial walls [10]. In addition to its diagnostic value, testing for apolipoproteins has practical benefits. Unlike conventional lipid profile, fasting is not required, and ApoB and ApoA-I levels can be accurately measured even in frozen samples. The measurement of Apolipoproteins is generally unaffected by triglyceride levels, minimizing potential errors. This makes apolipoprotein testing more accessible and cost-effective in many countries [11].
The European Society of Cardiology (ESC) and the European Atherosclerotic Society (EAS) advised in their 2019 guidelines that Apo-B should be prioritized for the diagnosis of coronary artery disease, particularly in patients with metabolic syndrome, diabetes mellitus, obesity, hypertriglyceridemia, or reduced HDL-C levels [12].
To our knowledge, ApoA-I, Apo B, and the Apo B/A ApoA-I ratio are not routinely included in the lipid profile or regularly assessed for CAD risk in Pakistan. Cardiologists typically advise, and clinical laboratories perform only traditional lipid profiles for risk assessment and diagnosis of CAD. Therefore, we designed this study with the following aims and objectives;
- To evaluate whether Apolipoproteins and their ratios serve as superior diagnostic and prognostic markers for CAD risk assessment compared to the traditional lipid profile;
- To compare the diagnostic accuracy of Apolipoproteins and the ApoB/ ApoA-I ratio with traditional lipid parameters in predicting the severity of coronary artery disease.
2. Materials and Methods
2.1. Study Design & Data Collection
This cross-sectional study was conducted at PMAS. ARID Agriculture University, Rawalpindi, in conjunction with the tertiary level cardiac institute, Rawalpindi Institute of Cardiology (RIC), Pakistan, between January 2021 and December 2023. The ethical approval of this study was obtained from the ethical committees of both PMAS Arid Agriculture University, Rawalpindi and RIC for the use of humans as experimental subjects.
A total of 1,200 participants were enrolled over the study period. Informed consent was obtained from all participants in accordance with the Declaration of Helsinki and its revisions. Study participants were further divided into three cohorts, namely Control Cohort (Individuals without any clinical or laboratory evidence of CAD after all investigations; n = 250), Training Cohort (Retrospective diagnosed CAD patients who visited the outpatient department and were on statin or lipid-lowering therapy; n = 450) and Validation Cohort (Prospective patients who presented at the RIC emergency department with the onset of chest pain and were later diagnosed with NSTEMI; n = 500).
We calculated the sample size to achieve 80% power and a 95% confidence level, with a 5% margin of error, to ensure reliable results. Using estimates of expected effect size and variability from previous lipid and cardiovascular biomarker studies, we determined that 400 patients per group would provide sufficient statistical power to detect significant differences in ApoA-I, ApoB, and the ApoB/ApoA-I ratio [13].
Patients in the Validation Cohort were included based on the first diagnosis of NSTEMI (Non-ST-elevation myocardial infarction) confirmed through clinical symptoms, electrocardiogram (ECG) findings, and positive Troponin results. Patients with a history of statin use, previous history of MI, prior primary percutaneous coronary intervention, coronary artery bypass graft surgery, any non-ischemic cardiac disease, or negative Troponin results were excluded from the validation cohort (n=870). Patients having comorbidities like chronic liver (HBs Ag or Anti HCV Positive) or kidney disease (Serum creatine >2.5 mg/dl) or having malignancy were excluded from all study cohorts (n=280).
2.2. Laboratory Workup
The Biochemical analyses (total cholesterol, LDL, HDL, triglycerides, Apo A, Apo B, and the Apo B/Apo A ratio) of all recruited samples were performed at the Pathology Department of RIC by using the Atellica Solution (Siemens). Additionally, liver function tests were also conducted to assess liver-related confounding factors. Standardized test procedure was used, and all analyses were done with normal and pathological controls to confirm the authentic results for diagnostic and comparative studies.
2.3. Coronary Angiography
Patients enrolled in the validation cohort had coronary angiography within the initial 48 hours of admission to the coronary care unit. Standard angiographic views were obtained for all patients. Coronary revascularization strategies were tailored to each patient based on the findings. Coronary angiographic data were interpreted by experienced cardiologists and categorized as per the guidelines of the American College of Cardiology/American Heart Association (ACC/AHA) angiographic [14].
2.4. Statistical Analysis
The finalized data were combined and processed for analysis in R-4. 1. 0 and SPSS 22.0 software. The data distribution was first tested for normality using Shapiro–Wilk's test. Descriptive analysis continuous data were characterized by the mean and standard deviation (±SD), whereas categorical variables were presented as counts and percentages. We first established the relationships between variables by correlation analysis and then generated a heat map of the correlation matrix. Linear regression was conducted to examine relationships between variables with Pearson correlation coefficients (r ≥ 0.6). The Chi-square test was employed to analyze categorical data between the two groups (disease versus control), while Student's t-test was utilized to compare continuous variables.
Analysis of PSM was performed to reduce the imbalance of baseline confounders (Very high and low biochemical values, age, smoking status, BMI, family history of diabetes, and physical activity). Both univariate and multivariate analyses were undertaken to study whether ApoB/ApoA-I ratio could serve as the independent diagnostic index for CAD in the entire cohort.
ROC curve analysis was conducted to determine the optimal cut-off value for the Apolipoproteins and Apo B/ ApoA-I ratio, assessing its diagnostic accuracy. Sensitivity and specificity values were also derived from the ROC. The results were further validated using an independent / validation cohort (n = 500) to confirm the findings and strengthen the reliability of the conclusions. Statistical significance was established at P ≤ 0.05, while P ≤ 0.01 was regarded as highly significant.
3. Results
3.1. Overview of Demographic and Clinical Characteristics of Participants
The overall workflow of this study is given in Figure 1. The comparative analysis of the training and control cohort revealed several significant differences across both descriptive and biochemical parameters. The mean age of study participants enrolled in the training cohort was significantly greater (p < 0.001) than that of the control group (55.48 ± 10.4 vs 51.25 ± 13.0 years). The training cohort participants had a significantly higher BMI (25.46 ± 4.1 kg/m²) than the control cohort (23.98 ± 3.4 kg/m²). There was a higher proportion (p < 0.001) of smokers, diabetics, and individuals with a positive family history, with frequencies of 82.20%, 61.3%, and 60.89%, respectively, in the training cohort, when compared to the Control group (Table 1).
The analysis of biochemical markers indicated that patients in the training cohort exhibited considerably reduced levels of ApoA-I (1.03 ± 0.34 g/L) relative to controls (1.12 ± 0.34 g/L, p = 0.045) and markedly elevated levels of ApoB (1.20 ± 0.52 g/L vs. 1.0 ± 0.40 g/L, p < 0.001). The ApoB/A-I Ratio was also significantly elevated in the training cohort (1.46 ± 0.18) compared to controls (1.06 ± 0.95, p < 0.001). Traditional lipid profile also showed similar findings; cholesterol levels were notably higher in CAD patients (175.14 ± 53.38 mg/dL) compared to controls (148.16 ± 48.6 mg/dL, p = 0.04), alongside increased triglycerides (191.87 ± 91.91 mg/dL in CAD patients vs. 167.34 ± 80.9 mg/dL in controls, p = 0.03). Furthermore, markers of metabolic diseases, such as Glucose and serum alanine aminotransferase (ALT), were significantly elevated in the Training group (150.14 ± 64.13 vs. 127.8 ± 60.20 mg/dL, p = 0.001) and (62.31 ± 86.32 U/L vs. 37.05 ± 21.9 U/L, p = 0.03) respectively (Table 1).
3.2. Demographic & Biochemical Characteristics of Validation Cohort
A total of 500 participants were enrolled in the validation cohort, out of them 54% males and 46% females. The mean age of the participants was 53.75 years (SD ± 12.64). As shown in the table 3.2, there were significant differences between several variables of validation and control cohort. In baseline characteristics, the validation cohort had a notably higher BMI (26.14 vs. 23.98 kg/m², p = 0.000) and higher percentages of smokers, diabetes prevalence, and positive family history of CAD, with a frequency of 60%, 54.67%, and 64.29% respectively (Table 2).
For biochemical parameters, the validation cohort exhibited lower ApoA-I levels (0.88 vs. 1.12 g/L, p = 0.000) but higher ApoB levels (1.44 vs. 1.0 g/L, p = 0.000), resulting in a significantly higher ApoB/A-I ratio. Additionally, the validation cohort showed elevated levels of cholesterol (192.25 vs. 148.16 mg/dL, p = 0.000) and triglycerides (206.51 vs. 167.34 mg/dL, p = 0.002). HDL levels were lower in the validation cohort (32.65 vs. 36.04 mg/dL, p = 0.000), while LDL levels were markedly higher (125.30 vs. 94.78 mg/dL, p = 0.000). Ratios such as Chol/HDL, TG/HDL, and LDL/HDL were significantly elevated in the validation cohort. Furthermore, glucose levels were higher in the validation cohort (151.34 vs. 127.8 mg/dL, p = 0.015), and ALT levels were also significantly increased (77.46 vs. 37.05 U/L, p = 0.014) (Table 2).
3.3. Correlation Analysis Between Biochemical and Descriptive Parameters
Correlation analysis between all the parameters indicated ApoB exhibited a strong positive correlation with the ApoB/A-I Ratio (r = 0.72), LDL (r = 0.47), and the LDL/HDL ratio (r = 0.44). A moderate positive correlation was detected between ApoB and BMI (r = 0.19) as well as with family history (r = 0.16). APO-A was negatively correlated with the APO B/A Ratio (r = -0.64) and APO-B (r = -0.38). HDL showed a significant negative correlation with the APO B/A Ratio (r = -0.27) and the LDL/HDL Ratio (r = -0.28). The strongest associations were seen between APO-B, APO B/A Ratio, LDL, and HDL, which were critical in understanding lipid metabolism and cardiovascular risk (Figure 2).
3.4. Univariate and Multivariate Analysis (Post PSM)
The univariate regression model indicated that the association between APO-A and CAD risk is significant (p< 0.001) with an odds ratio (OR) of 0.19, indicating a significant protective role against CAD phenotype. APO-B and the APOB/APO A Ratio demonstrated strong positive associations with p-values of < 0.001 and ORs of 3.10 and 1.65, respectively, suggesting their potential roles as markers for increased risk. Among the conventional lipid markers, LDL/HDL showed a significant association with an OR of 1.56 (95% CI: 1.42 - 1.70, p-value: < 0.001), while cholesterol displayed a marginally significant association (p-value: 0.0069). LDL showed borderline significance with a p-value of 0.054, which is slightly above the conventional 0.05 threshold. ALT exhibited a weaker but significant association with an OR of 1.00 and a p-value of 0.00402, indicating that liver function may have a minor influence on cardiovascular risk, though it is not a primary predictor (Table 3).
Following propensity score matching (PSM) analysis, a multivariate analysis was performed to control for confounding variables such as age, gender, and family history of diabetes (Table 4). ApoA-I maintained its protective role in the multivariate model with an OR of 0.25 (95%, p-value: < 0.001). ApoB remained a strong positive predictor with an OR of 2.94 (95% CI: p-value: < 0.001). However, the ApoB/ApoA-I Ratio became less significant with an OR of 0.86 (95% CI: 0.74 - 1.02, p-value: 0.06376), suggesting that its predictive power diminishes when adjusted for other factors. In the multivariate analysis, cholesterol and LDL showed non-significant associations (p-values > 0.05) among the conventional lipid markers. However, LDL/HDL showed a significant association, with an OR of 1.36 (95% CI: 1.18 - 1.57, p-value: < 0.001), emphasizing its consistent role as a risk factor for CAD.
Our findings indicate that ApoB is a more robust predictor of CAD risk than both ApoA-I and the ApoB/ApoA-I Ratio in univariate and multivariate analyses. ApoB demonstrated a stronger association with CAD risk than traditional lipid markers like LDL and cholesterol. However, the LDL/HDL ratio was found to be a better predictor as compared to cholesterol, triglycerides, and HDL, even though the effect size here was not as higher as that of ApoB.
3.5. Analysis of ROC Curve for ApoA-I, ApoB, and ApoB/ApoA-I Ratio
The ROC analysis was performed to assess our dataset's predictive capability of ApoA-I, ApoB, and the ApoB/ApoA-I ratio. The Area Under the Curve (AUC) computed for each marker to assess their diagnostic efficacy, identified that ApoB is the strongest predictor among the three, exhibiting an AUC of 0.82, which signifies effective discrimination between individuals with and without CAD with a threshold value of 1.205. The ApoB/ApoA-I ratio exhibited a moderate AUC of 0.70, suggesting its moderate efficacy as a marker for CAD, indicating it is less robust than ApoB. Conversely, ApoA-I exhibited a lower AUC of 0.65 (Figure 3-4).
3.6. Effectiveness of Propensity Score Matching and Predictive Accuracy of the Model
Figure 5 highlights the effectiveness of propensity score matching in balancing the distribution of propensity scores between treated and control groups. Initially, there was a notable imbalance, with treated individuals having higher propensity scores, indicating a higher likelihood of treatment. After matching, the distributions became more aligned, reducing baseline differences and improving comparability (Figure 5). The ROC curve for the propensity score model was also analyzed, and we found an AUC of the PSM model was approximately 0.75, indicating that apolipoproteins are more sensitive markers for CAD risk than the conventional lipid profile (Figure 6).
4. Discussion
The diagnostic and prognostic significance of Apolipoproteins (ApoA-1, ApoB, and ApoB/A-1 ratio) in comparison to conventional lipid markers for prediction of CAD was explored in this study. Our findings revealed that the correlation between Apo B and the risk of CAD, including susceptibility to CAD, was greater than that for LDL or cholesterol, which is commensurate with other studies emphasizing apolipoproteins rather than lipids in cardiovascular risk assessment. The stronger association of atherogenic particles with Apo B supports the use of Apo B inclusion in the routine measurement along with conventional lipid profile especially among individuals with metabolic syndrome, diabetes or those with high triglyceride or LDL levels for risk prediction, earlier and accurate diagnosis of disease.
Several prospective studies, such as the INTERHEART study and the Apolipoprotein-related Mortality Risk (AMORIS) experiment, have demonstrated a positive linear relationship between an increased ApoB/ApoA-1 ratio and the risk of cardiovascular events [15]. The AMORIS trial demonstrated that individuals experiencing their first cardiovascular event before age 50 had higher levels of total cholesterol, triglycerides, LDL-C, glucose, ApoB, and the ApoB/ApoA-1 ratio compared to controls, persisting up to 20 years prior to the event [16].
A National study by Habib et al. (2022) at the Armed Forces Institute of Pathology emphasized the significance of ApoB as a biomarker for CAD. A robust positive connection was identified between increased ApoB levels and CAD, with 79.3% of CAD individuals exhibiting ApoB levels over 130 mg/dL [17]. Our research similarly revealed ApoB as a strong predictor of CAD, with elevated ApoB levels of 1.20 g/L (120 mg/dL) in the training cohort and 1.43 g/L (143 mg/dL) in the validation cohort. Both findings highlight that ApoB can be used as a standard biomarker for CAD screening, providing a more accurate evaluation than conventional lipid profiles alone. Habib et al. (2022) concentrated on the association between triglycerides and CAD, whereas our investigation examined the diagnostic efficacy of apolipoprotein B in comparison to the conventional lipid profile.
Our findings correspond with numerous other studies pertinent to this subject. A study in Kathmandu Valley, Nepal, revealed that patients with CAD exhibited elevated levels of total cholesterol, triglycerides, and LDL-C, coupled with Apo-B, and reduced levels of HDL cholesterol compared to the control group. These results correspond with our findings [18].
The investigation carried out by Liting P. and others indicated that patients with CAD had higher concentrations of total cholesterol, triglycerides and LDL-C and lower concentrations of HDL. Also, higher levels of ApoB and lower levels of ApoA-I were observed in CAD patients, as found in our results [10]. Similarly, Tian et al. (2019) proved the relationship between apolipoproteins and CAD, drawing attention to the fact that the ApoB/ApoA-I ratio is more reliable in forecasting CAD outcomes [15]. This reinforces the importance of our findings, which highlighted the importance of ApoB as a CAD biomarker in diagnosing treatment and risk assessment. According to Sniderman et al. (2013), LDL-C is a weak CAD risk factor when assessed in relation to ApoB, which is also consistent with our findings [19].
According to Tsimihodimos et al. (2007) and Chien et al. (2007), it has been noted that Apo-B could serve as a predictor for small LDL particle class, which is more atherogenic and has a great importance in causing atherosclerosis. Such findings support the claim that Apo-B has a much stronger association with CAD when compared to lipoprotein levels and other traditional lipid levels [20,21]. The 2019 ESC/EAS guidelines recommend the use of apolipoprotein B in place of LDL-C in the diagnosis of CAD, especially in patients with underlying metabolic syndrome, high triglycerides, or low LDL-C [12]. This also suggests that Apo-B is a more specific biomarker to spot the patients at risk of CAD. These guidelines also stated that Apo B is a superior and specific biomarker for evaluating CAD risk compared to LDL-C particles. The ESC and EAS guidelines recommend that Apo B measurement can be conducted with greater precision, accuracy, and cost-effectiveness in clinical chemistry laboratories without the necessity of 10-12 hours of fasting, owing to the availability of internationally standardized methods [22].
Lastly, an Oxford University publication prioritized Apo-B as a primary determinant of CAD, stating that it represents all liver-derived lipoprotein particles [23]. This further validates our findings and underscores the importance of including Apo-B measurements in clinical assessments of CAD risk.
5. Conclusions
This study demonstrates that ApoB, ApoA1, and the ApoB/ApoA1 ratio provide greater diagnostic and prognostic value than traditional lipid markers such as LDL-C and total cholesterol in evaluating CAD risk. Higher levels of ApoB and the ApoB/ApoA-1 ratio were significantly linked to an increased risk of coronary artery disease, whereas a protective effect was found for ApoA-1. ApoB measurements, in combination with conventional lipid profiles, offer a more thorough assessment of CAD risk, especially in high-risk groups like individuals with metabolic syndrome or diabetes.
Author Contributions
Conceptualization, Muhammad Noor ul Amin and Pakeeza Arzoo Shaiq; Data curation, Rafaqat Ishaq, Muhamamd Asad and Ghazala Raja; Formal analysis, Muhammad Noor ul Amin, Umm Habiba, Muhammad Ilyas and Pakeeza Arzoo Shaiq; Investigation, Muhammad Noor ul Amin, Asad Raja, Muhammad Ilyas, Rafaqat Ishaq and Muhamamd Asad; Methodology, Muhammad Noor ul Amin, Umm Habiba, Asad Raja and Abida Arshad; Project administration, Ghazala Raja; Software, Umm Habiba and Asad Raja; Supervision, Pakeeza Arzoo Shaiq; Validation, Muhammad Ilyas, Abida Arshad and Muhamamd Asad; Writing – original draft, Muhammad Noor ul Amin, Umm Habiba and Asad Raja; Writing – review & editing, Ghazala Raja and Pakeeza Arzoo Shaiq
Funding
This research did not receive any specific grant from funding agencies in the public, commercial, or not-for-profit sectors.
Institutional Review Board Statement
The study was conducted in accordance with the Decla-ration of Helsinki, as it involved human participants, and was approved by the Research and Ethics Review Committee of the Rawalpindi Institute of Cardiology (Approval No. RIC/RERC/01/21 dated 05/01/2021) and the Institutional Review Board (Ethics Committee) of Pir Mehr Ali Shah Arid Agriculture University, Rawalpindi (Approval No. PMAS-AAUR/IEC/18 dated 14/02/2019).
Informed Consent Statement
All participants involved in this study provided written informed consent prior to their inclusion. Participants were informed of their right to withdraw from the study at any time without any impact on their medical treatment or rights. Confidentiality and anonymity of all personal data were ensured.
Data Availability Statement
The data presented in this study are available on request from the corresponding authors. The data are not publicly available due to confidentiality and privacy concerns regarding patient information.
Acknowledgments
We would like to express our sincere gratitude to the Cardiologists and the laboratory staff of Rawalpindi Institute of Cardiology for their valuable support and collaboration. Special thanks to the research lab staff of the UIBB, ARID Agriculture University, Rawalpindi for their hard work and dedication throughout the course of this study.
Conflicts of Interest
The authors declare no financial interests or personal relationships that could have influenced the work reported in this paper.
Abbreviations
The following abbreviations are used in this manuscript:
| CAD | Coronary Artery Disease |
| LDL | Low-density lipoproteins |
| MI | Myocardial infarction |
| HDL | High-density lipoproteins |
| RIC | Rawalpindi Institute of Cardiology |
| NSTEMI | Non-ST-elevation myocardial infarction |
| PSM | Propensity score matching |
| AUC | Area under curve |
| ROC | Receiver operating characteristic |
| AMORIS | Apolipoprotein-related Mortality Risk |
References
- Adam, A. M.; Rehan, A.; Waseem, N.; Iqbal, U.; Saleem, H.; Godil, A. Prevalence of Conventional Risk Factors and Evaluation of Baseline Indices Among Young and Elderly Patients with Coronary Artery Disease. J. Clin. Diagn. Res. 2017, 11, 34–39. [Google Scholar] [CrossRef] [PubMed]
- Charla, E.; Mercer, J.; Maffia, P.; Nicklin, S. A. Extracellular vesicle signaling in atherosclerosis. Cell. Signal. 2020, 75, 109751. [Google Scholar] [CrossRef] [PubMed]
- Młynarska, E.; Czarnik, W.; Fularski, P.; Hajdys, J.; Majchrowicz, G.; Stabrawa, M.; Franczyk, B. From Atherosclerotic Plaque to Myocardial Infarction—The Leading Cause of Coronary Artery Occlusion. Int. J. Mol. Sci. 2024, 25, 7295. [Google Scholar] [CrossRef] [PubMed]
- Psaltopoulou, T.; Hatzis, G.; Papageorgiou, N.; Androulakis, E.; Briasoulis, A.; Tousoulis, D. Socioeconomic status and risk factors for cardiovascular disease: impact of dietary mediators. Hellenic J. Cardiol. 2017, 58, 32–42. [Google Scholar] [CrossRef]
- Velilla, T. A.; Guijarro, C.; Ruiz, R. C.; Piñero, M. R.; Marcos, J. V.; Pérez, A. P.; Soto, A. B. Consensus document for lipid profile determination and reporting in Spanish clinical laboratories. What parameters should a basic lipid profile include? Neurol. Perspect. 2023, 3, 100126. [Google Scholar] [CrossRef]
- Yaseen, R. I.; El-Leboudy, M. H.; El-Deeb, H. M. The relation between ApoB/ApoA-1 ratio and the severity of coronary artery disease in patients with acute coronary syndrome. Egypt. Heart J. 2021, 73, 1–9. [Google Scholar] [CrossRef]
- Aggarwal, J.; Kathariya, M. G.; Verma, P. K. LDL-C, NON-HDL-C and APO-B for cardiovascular risk assessment: looking for the ideal marker. Indian Heart J. 2021, 73, 544–548. [Google Scholar] [CrossRef] [PubMed]
- Walldius, G. The apoB/apoA-I ratio is a strong predictor of cardiovascular risk. In Lipoproteins in Health and Diseases; InTech: 2012, pp. 95–148.
- Behbodikhah, J.; Ahmed, S.; Elyasi, A.; Kasselman, L. J.; De Leon, J.; Glass, A. D.; Reiss, A. B. Apolipoprotein B and cardiovascular disease: biomarker and potential therapeutic target. Metabolites 2021, 11, 690. [Google Scholar] [CrossRef]
- Liting, P.; Guoping, L.; Zhenyue, C. Apolipoprotein B/apolipoprotein A1 ratio and non-high-density lipoprotein cholesterol. Herz 2015, 40, 1. [Google Scholar] [CrossRef]
- Welsh, C.; Celis-Morales, C. A.; Brown, R.; Mackay, D. F.; Lewsey, J.; Mark, P. B.; Welsh, P. Comparison of conventional lipoprotein tests and apolipoproteins in the prediction of cardiovascular disease: data from UK Biobank. Circulation 2019, 140, 542–552. [Google Scholar] [CrossRef]
- Mach, F.; Baigent, C.; Catapano, A. L.; Koskinas, K. C.; Casula, M.; Badimon, L.; Wiklund, O. 2019 ESC/EAS Guidelines for the management of dyslipidaemias: lipid modification to reduce cardiovascular risk. Eur. Heart J. 2020, 41, 111–188. [Google Scholar] [CrossRef]
- Ridker, P. M.; Rifai, N.; Cook, N. R.; Bradwin, G.; Buring, J. E. Non–HDL cholesterol, apolipoproteins AI and B100, standard lipid measures, lipid ratios, and CRP as risk factors for cardiovascular disease in women. JAMA 2005, 294, 326–333. [Google Scholar] [CrossRef] [PubMed]
- Writing Committee Members; Lawton, J. S.; Tamis-Holland, J. E.; Bangalore, S.; Bates, E. R.; Beckie, T. M.; Zwischenberger, B. A. 2021 ACC/AHA/SCAI guideline for coronary artery revascularization. J. Am. Coll. Cardiol. 2022, 79, e21–e129. [Google Scholar] [CrossRef]
- Tian, M.; Li, R.; Shan, Z.; Wang, D. W.; Jiang, J.; Cui, G. Comparison of Apolipoprotein B/A1 ratio, Framingham risk score and TC/HDL-c for predicting clinical outcomes in patients undergoing percutaneous coronary intervention. Lipids Health Dis. 2019, 18, 1–9. [Google Scholar] [CrossRef] [PubMed]
- Ivert, T.; Malmström, H.; Hammar, N.; Carlsson, A. C.; Wändell, P. E.; Holzmann, M. J.; Walldius, G. Cardiovascular events in patients under age fifty with early findings of elevated lipid and glucose levels–The AMORIS study. PLoS ONE 2018, 13, e0201972. [Google Scholar] [CrossRef]
- Habib, H.; Haroon, Z. H.; Aamir, M.; Bibi, A.; Javed, H.; Jaffer, S. R. Association of Apolipoprotein B and Triglyceride Levels with Coronary Artery Disease. Pak. Armed Forces Med. J. 2022, 72, 1641–45. [Google Scholar] [CrossRef]
- Tamang, H. K.; Timilsina, U.; Singh, K. P.; Shrestha, S.; Raman, R. K.; Panta, P.; Dahal, C. Apo B/Apo AI ratio is statistically a better predictor of cardiovascular disease (CVD) than conventional lipid profile: a study from Kathmandu Valley, Nepal. J. Clin. Diagn. Res. 2014, 8, 34. [Google Scholar]
- Sniderman, A. D.; Islam, S.; Yusuf, S.; McQueen, M. J. Is the superiority of apoB over non–HDL-C as a marker of cardiovascular risk in the INTERHEART study due to confounding by related variables? J. Clin. Lipidol. 2013, 7, 626–631. [Google Scholar] [CrossRef] [PubMed]
- Tsimihodimos, V.; Gazi, I.; Kostara, C.; Tselepis, A. D.; Elisaf, M. Plasma lipoproteins and triacylglycerol are predictors of small, dense LDL particles. Lipids 2007, 42, 403–409. [Google Scholar] [CrossRef]
- Chien, K. L.; Hsu, H. C.; Su, T. C.; Chen, M. F.; Lee, Y. T.; Hu, F. B. Apolipoprotein B and non-high density lipoprotein cholesterol and the risk of coronary heart disease in Chinese. J. Lipid Res. 2007, 48, 2499–2505. [Google Scholar] [CrossRef] [PubMed]
- Landmesser, U.; McGinniss, J.; Steg, P. G.; Bhatt, D. L.; Bittner, V. A.; Diaz, R.; ODYSSEY OUTCOMES Investigators. Achievement of ESC/EAS LDL-C treatment goals after an acute coronary syndrome with statin and alirocumab. Eur. J. Prev. Cardiol. 2022, 29, 554–562. [Google Scholar] [CrossRef]
- Zuber, V.; Gill, D.; Ala-Korpela, M.; Langenberg, C.; Butterworth, A.; Bottolo, L.; Burgess, S. High-throughput multivariable Mendelian randomization analysis prioritizes apolipoprotein B as key lipid risk factor for coronary artery disease. Int. J. Epidemiol. 2021, 50, 893–901. [Google Scholar] [CrossRef]
Figure 1.
The comprehensive workflow of the methodology employed in this study.
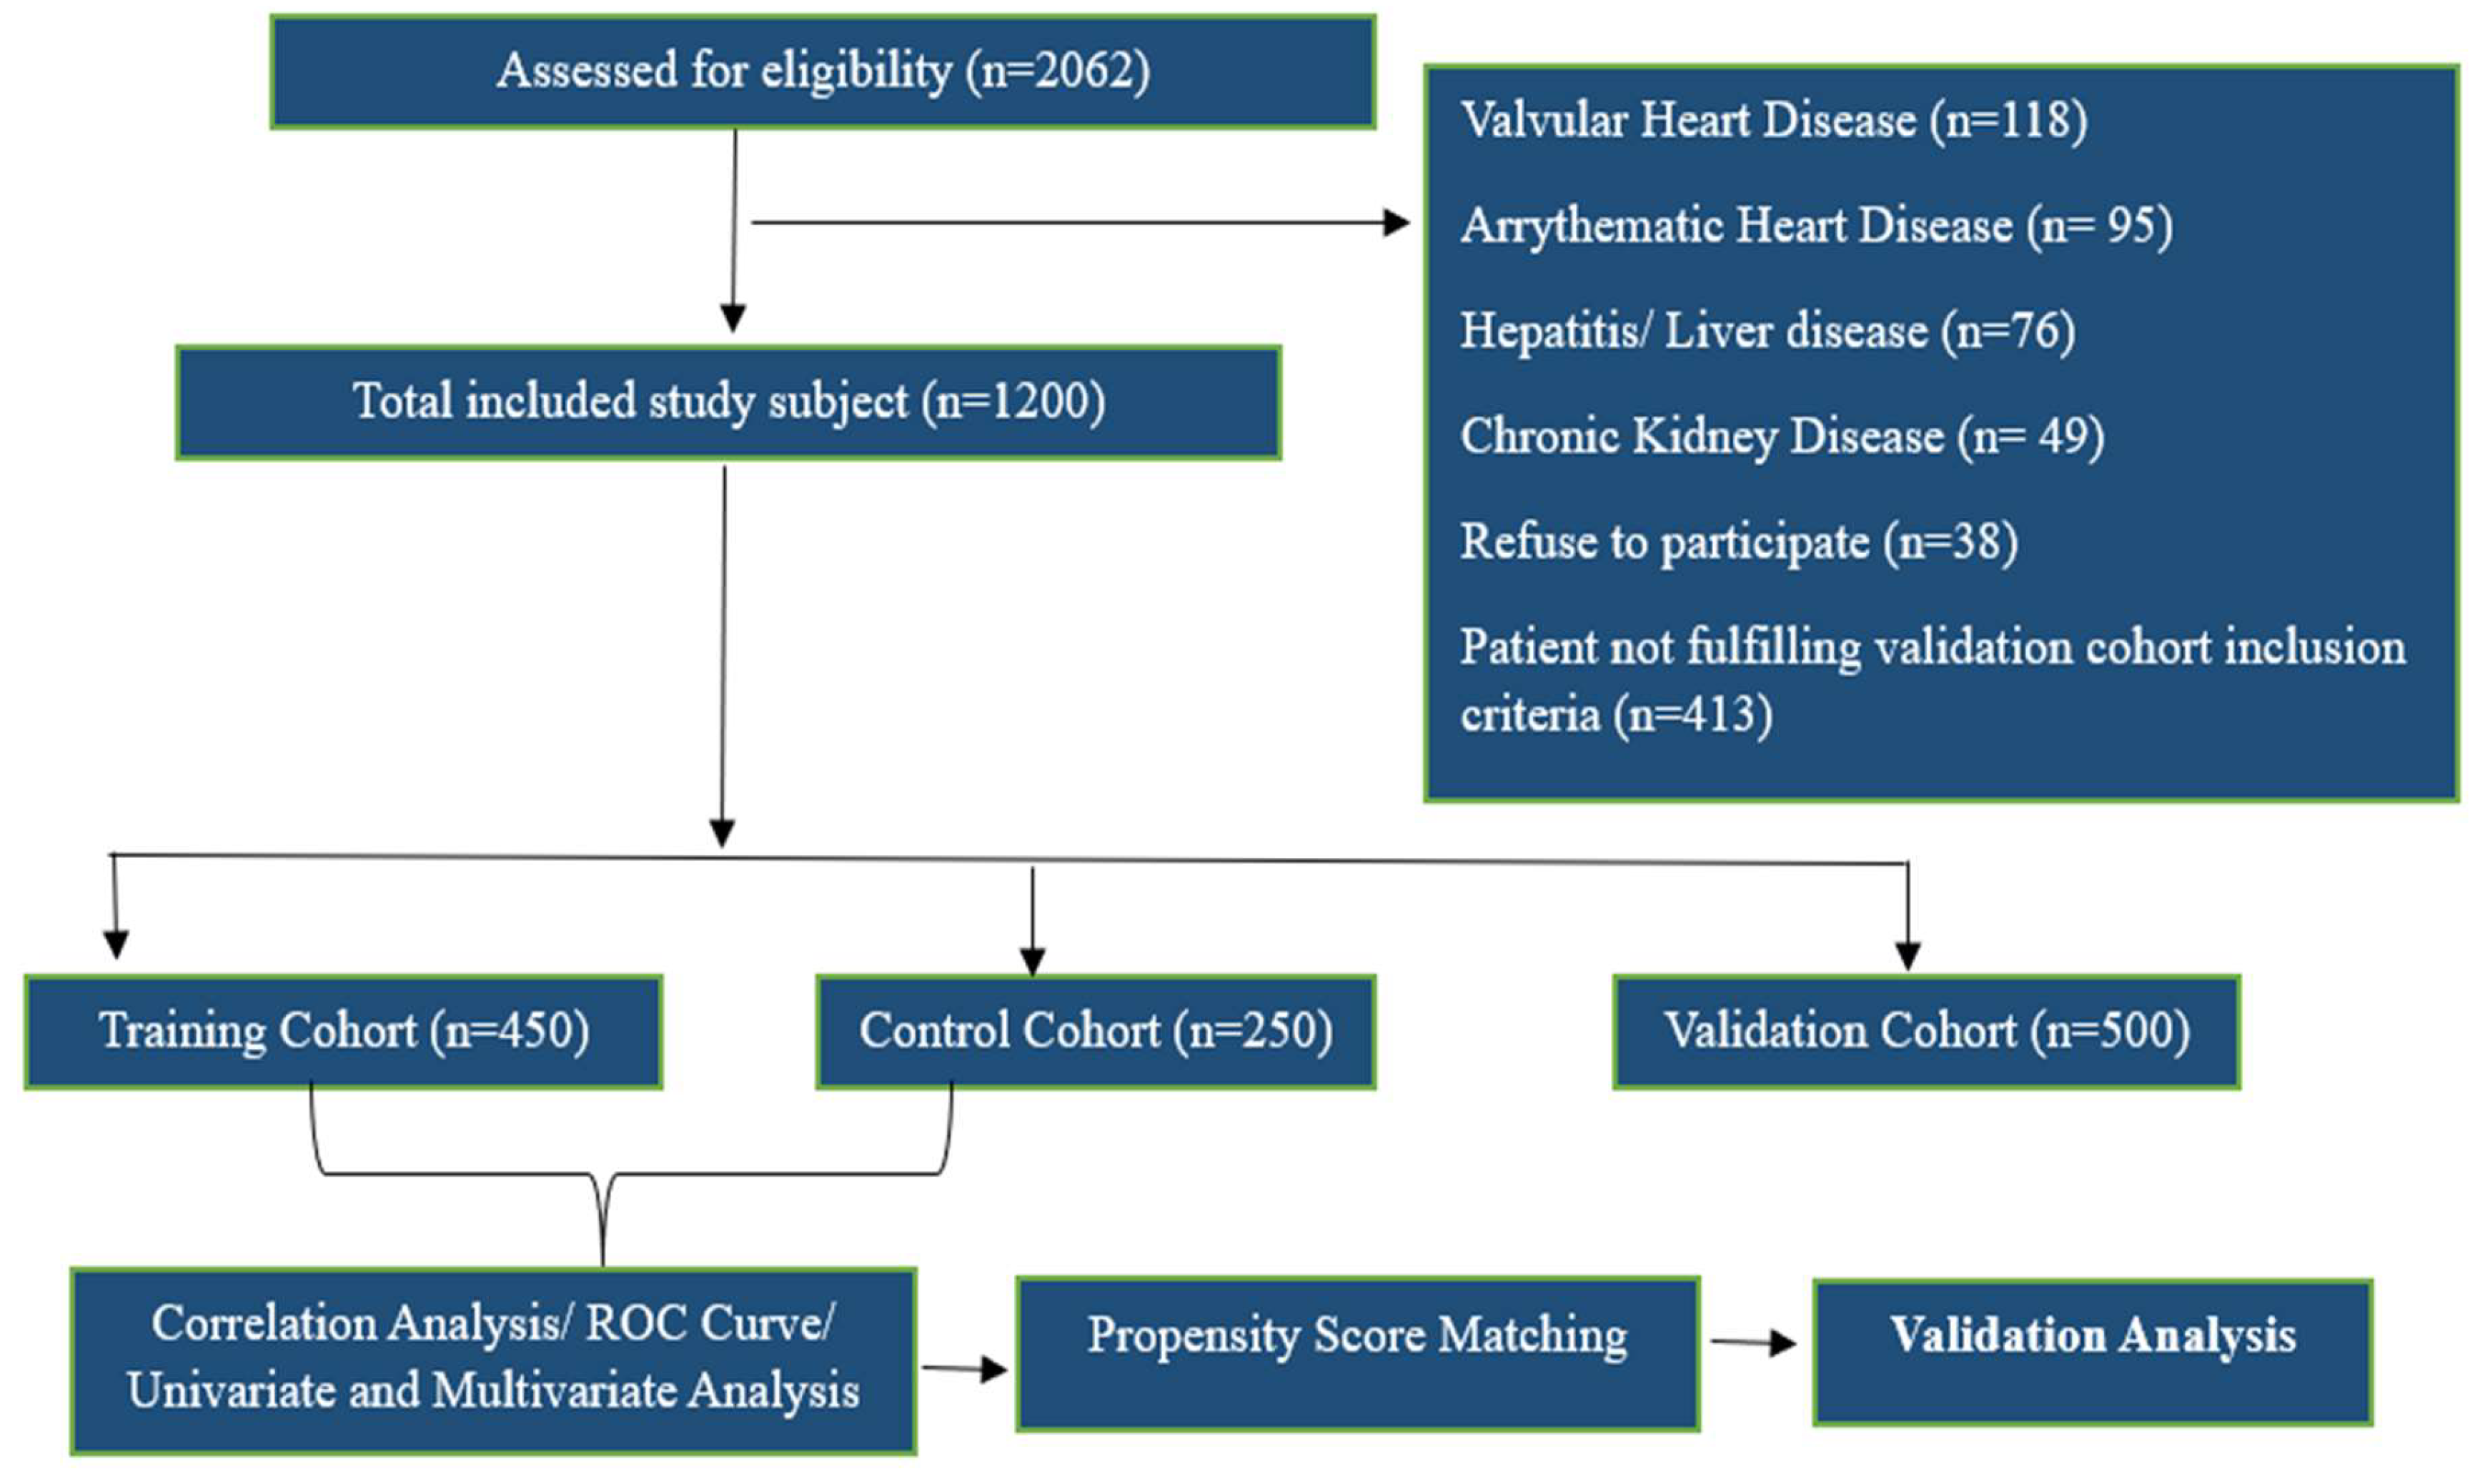
Figure 2.
Correlation Heatmap of Biochemical and Descriptive Parameters (Circular Representation) shows the relationships between all parameters, including baseline and biochemical parameters. Each circle's size and color reflect the correlation's strength and direction, with larger, darker circles indicating stronger links. Blue shades represented positive correlations, while red shades indicated negative ones.
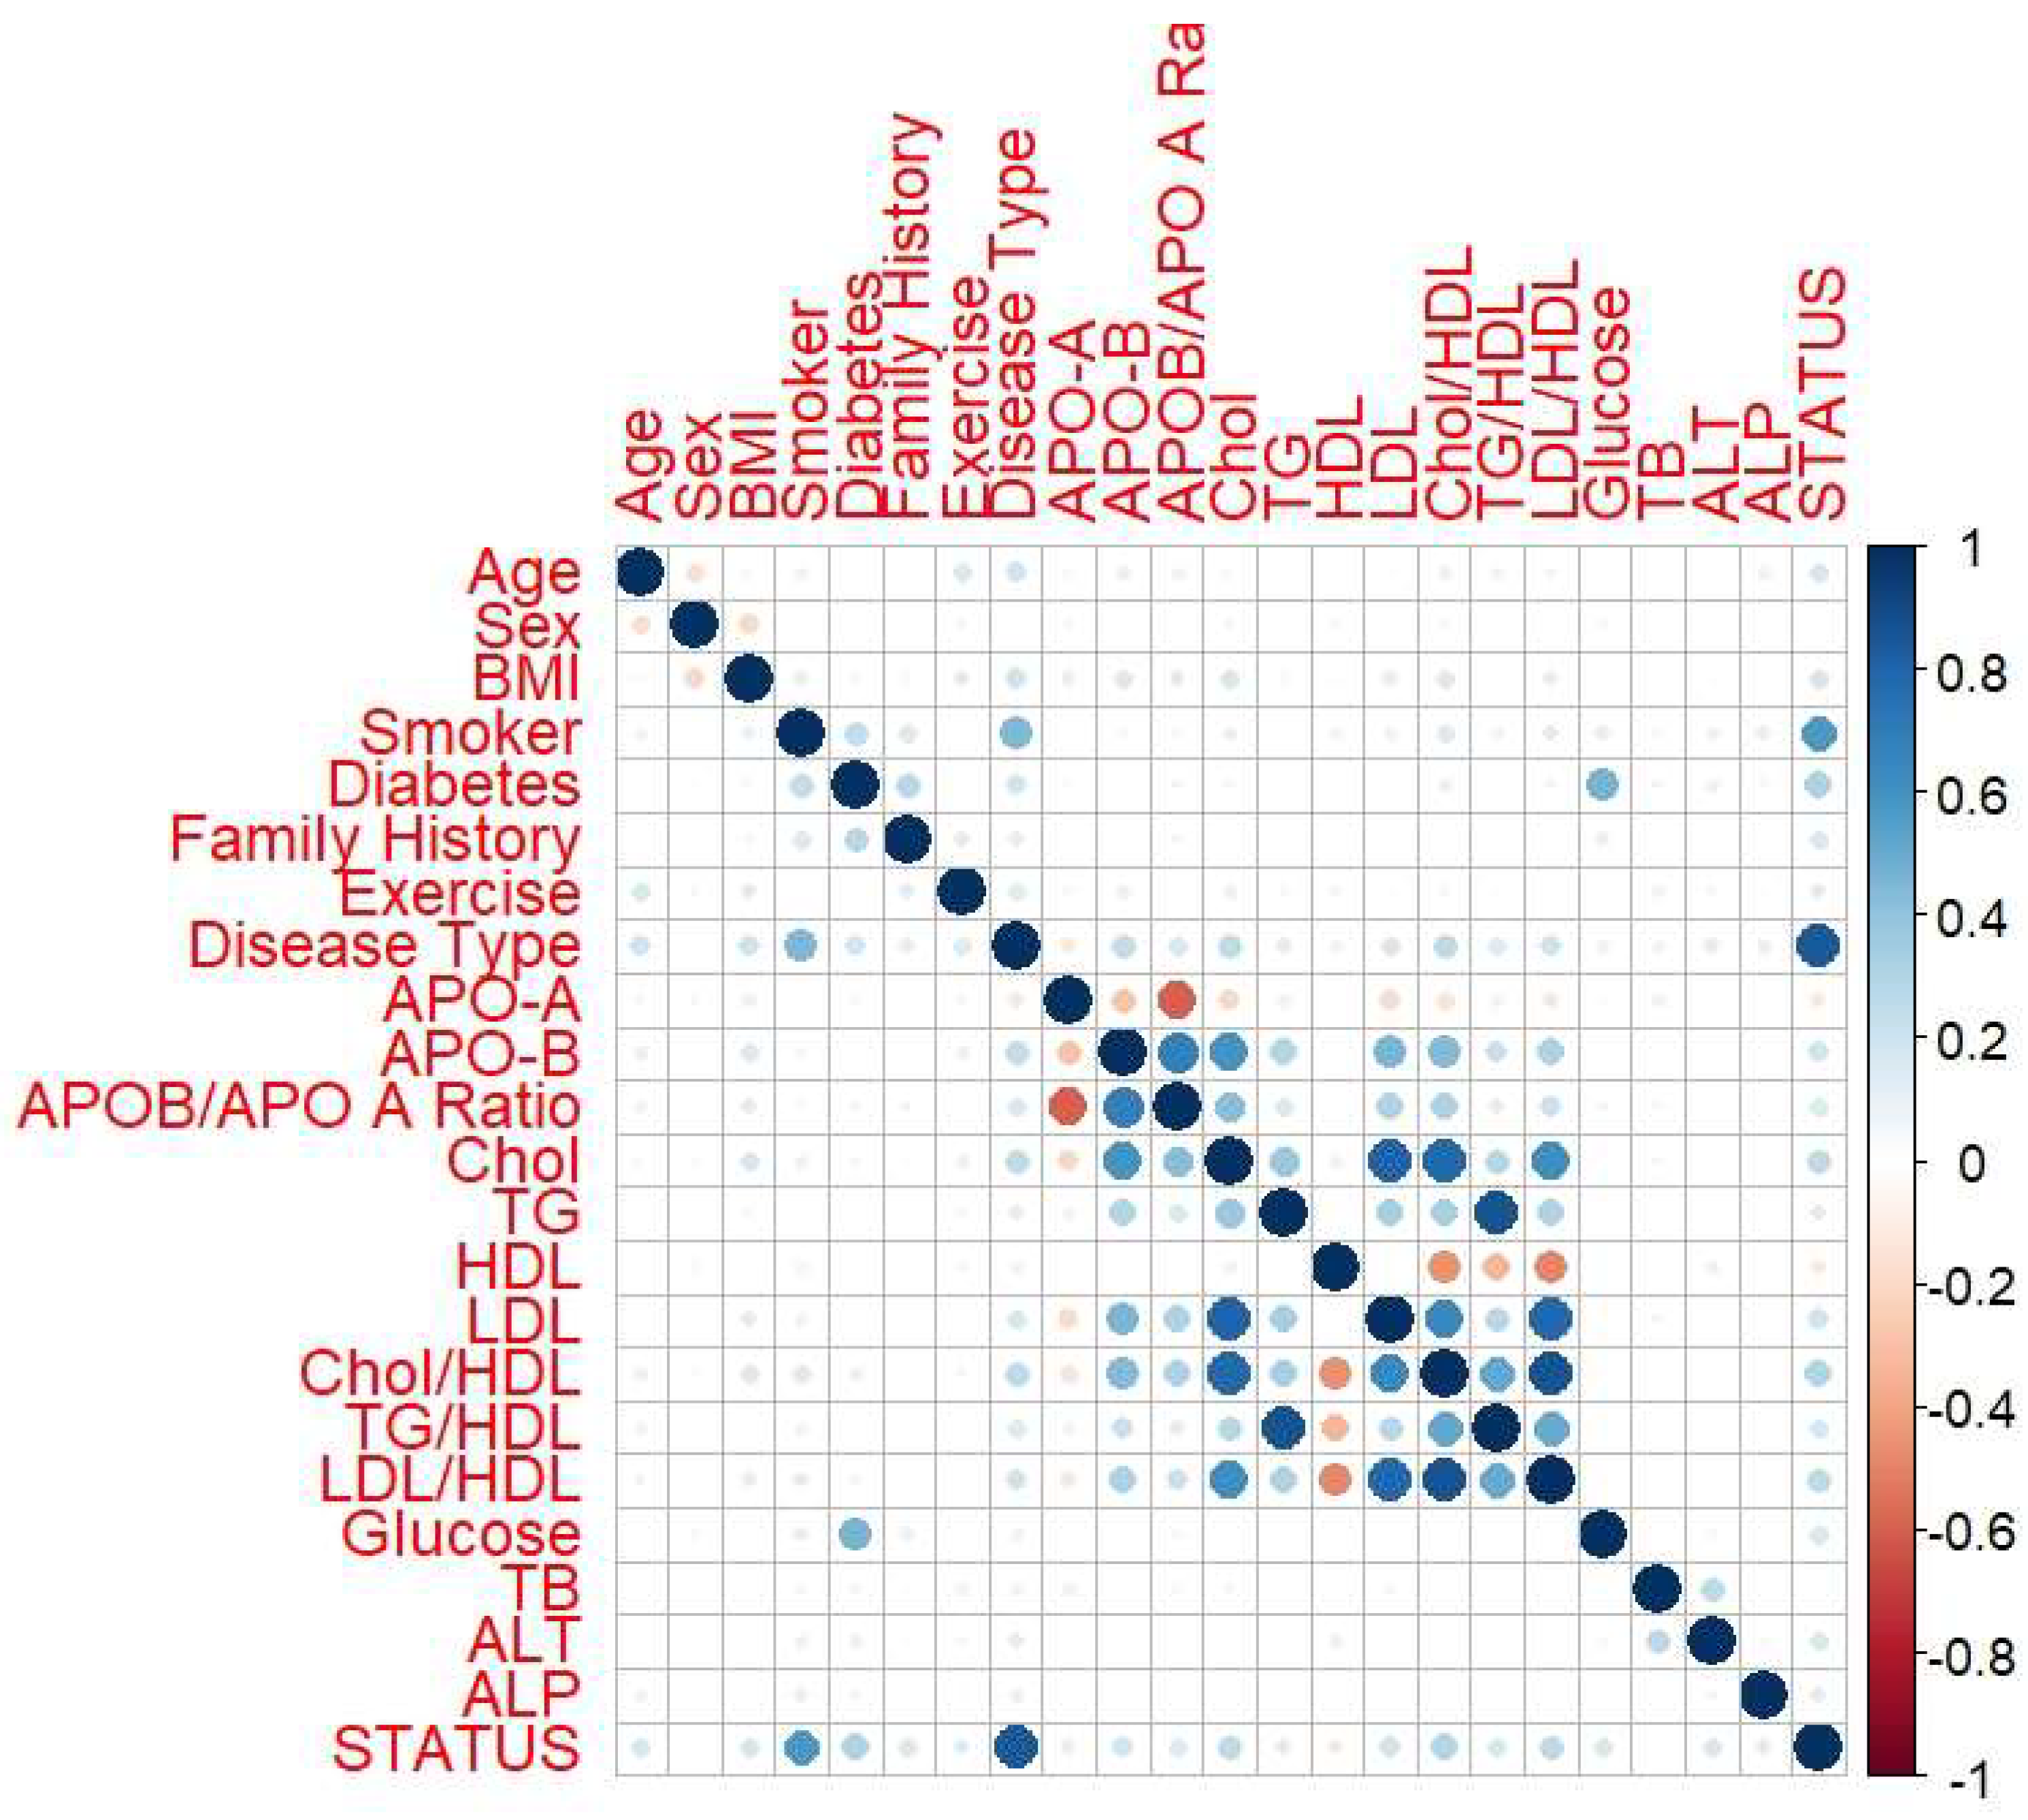
Figure 3.
Receiver operating characteristic (ROC) curve for the ApoA-I and ApoB.
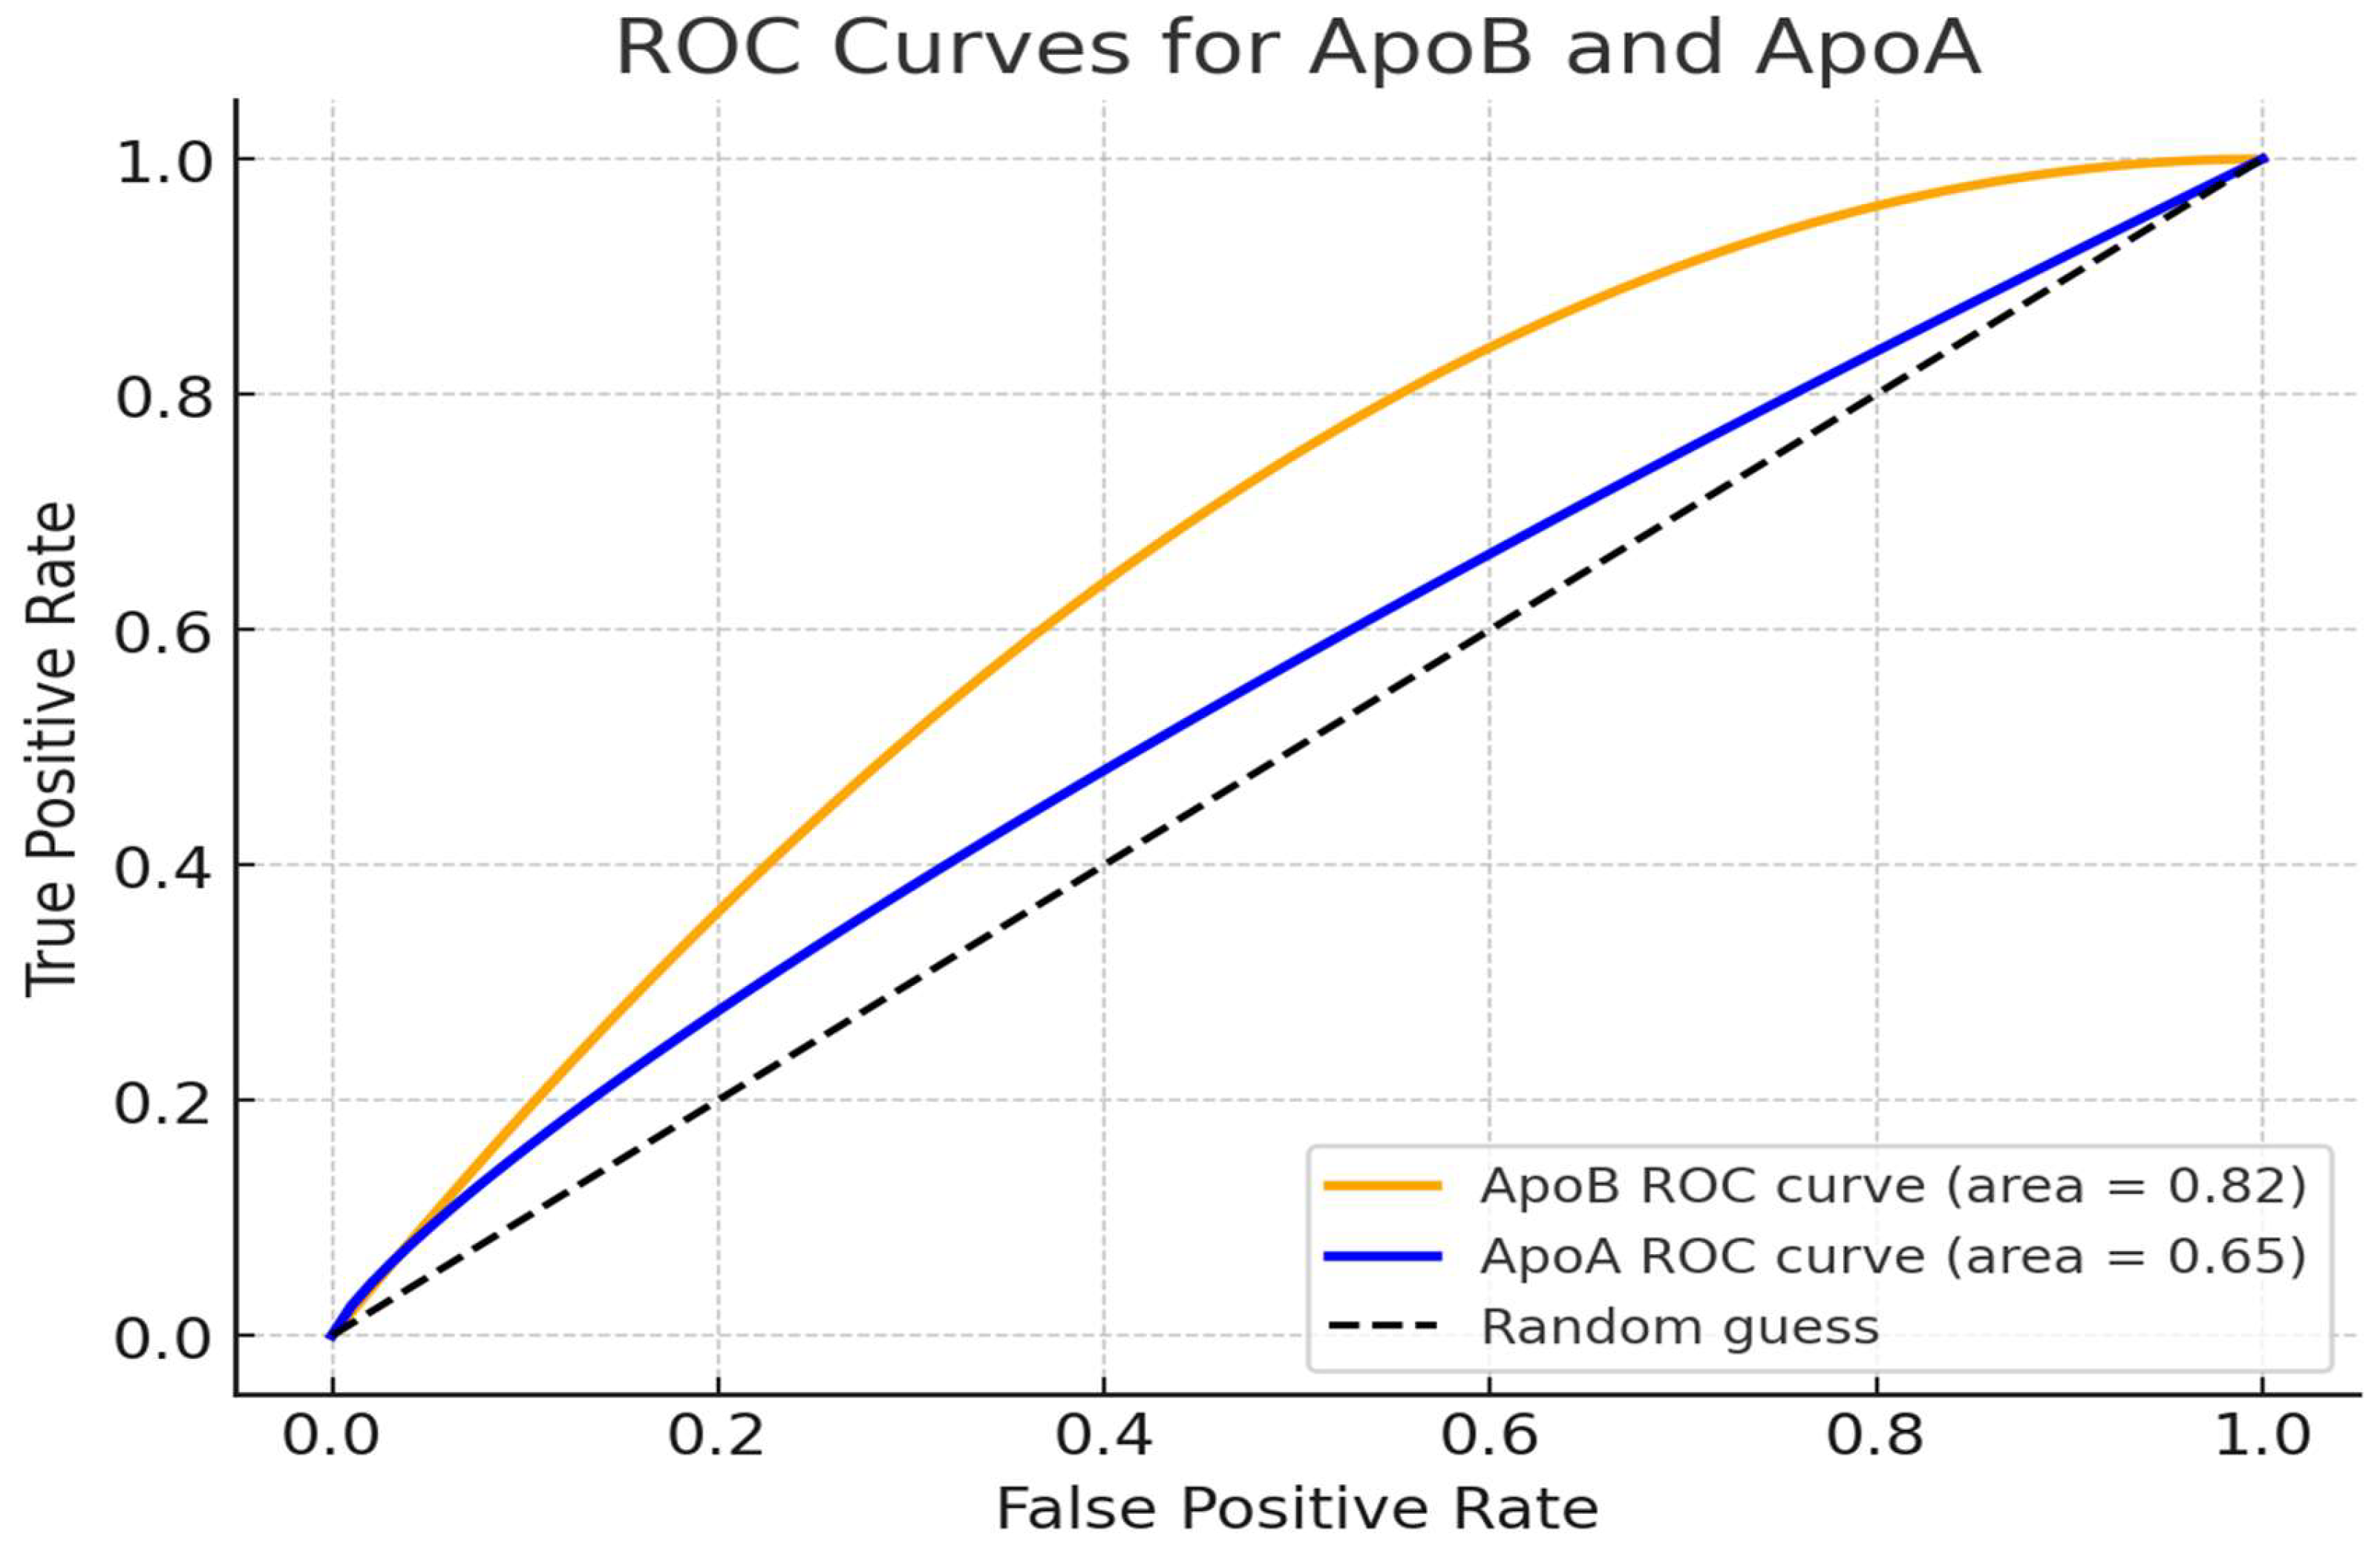
Figure 4.
Receiver operating characteristic (ROC) curve for the ApoB/ApoA-I ratio.
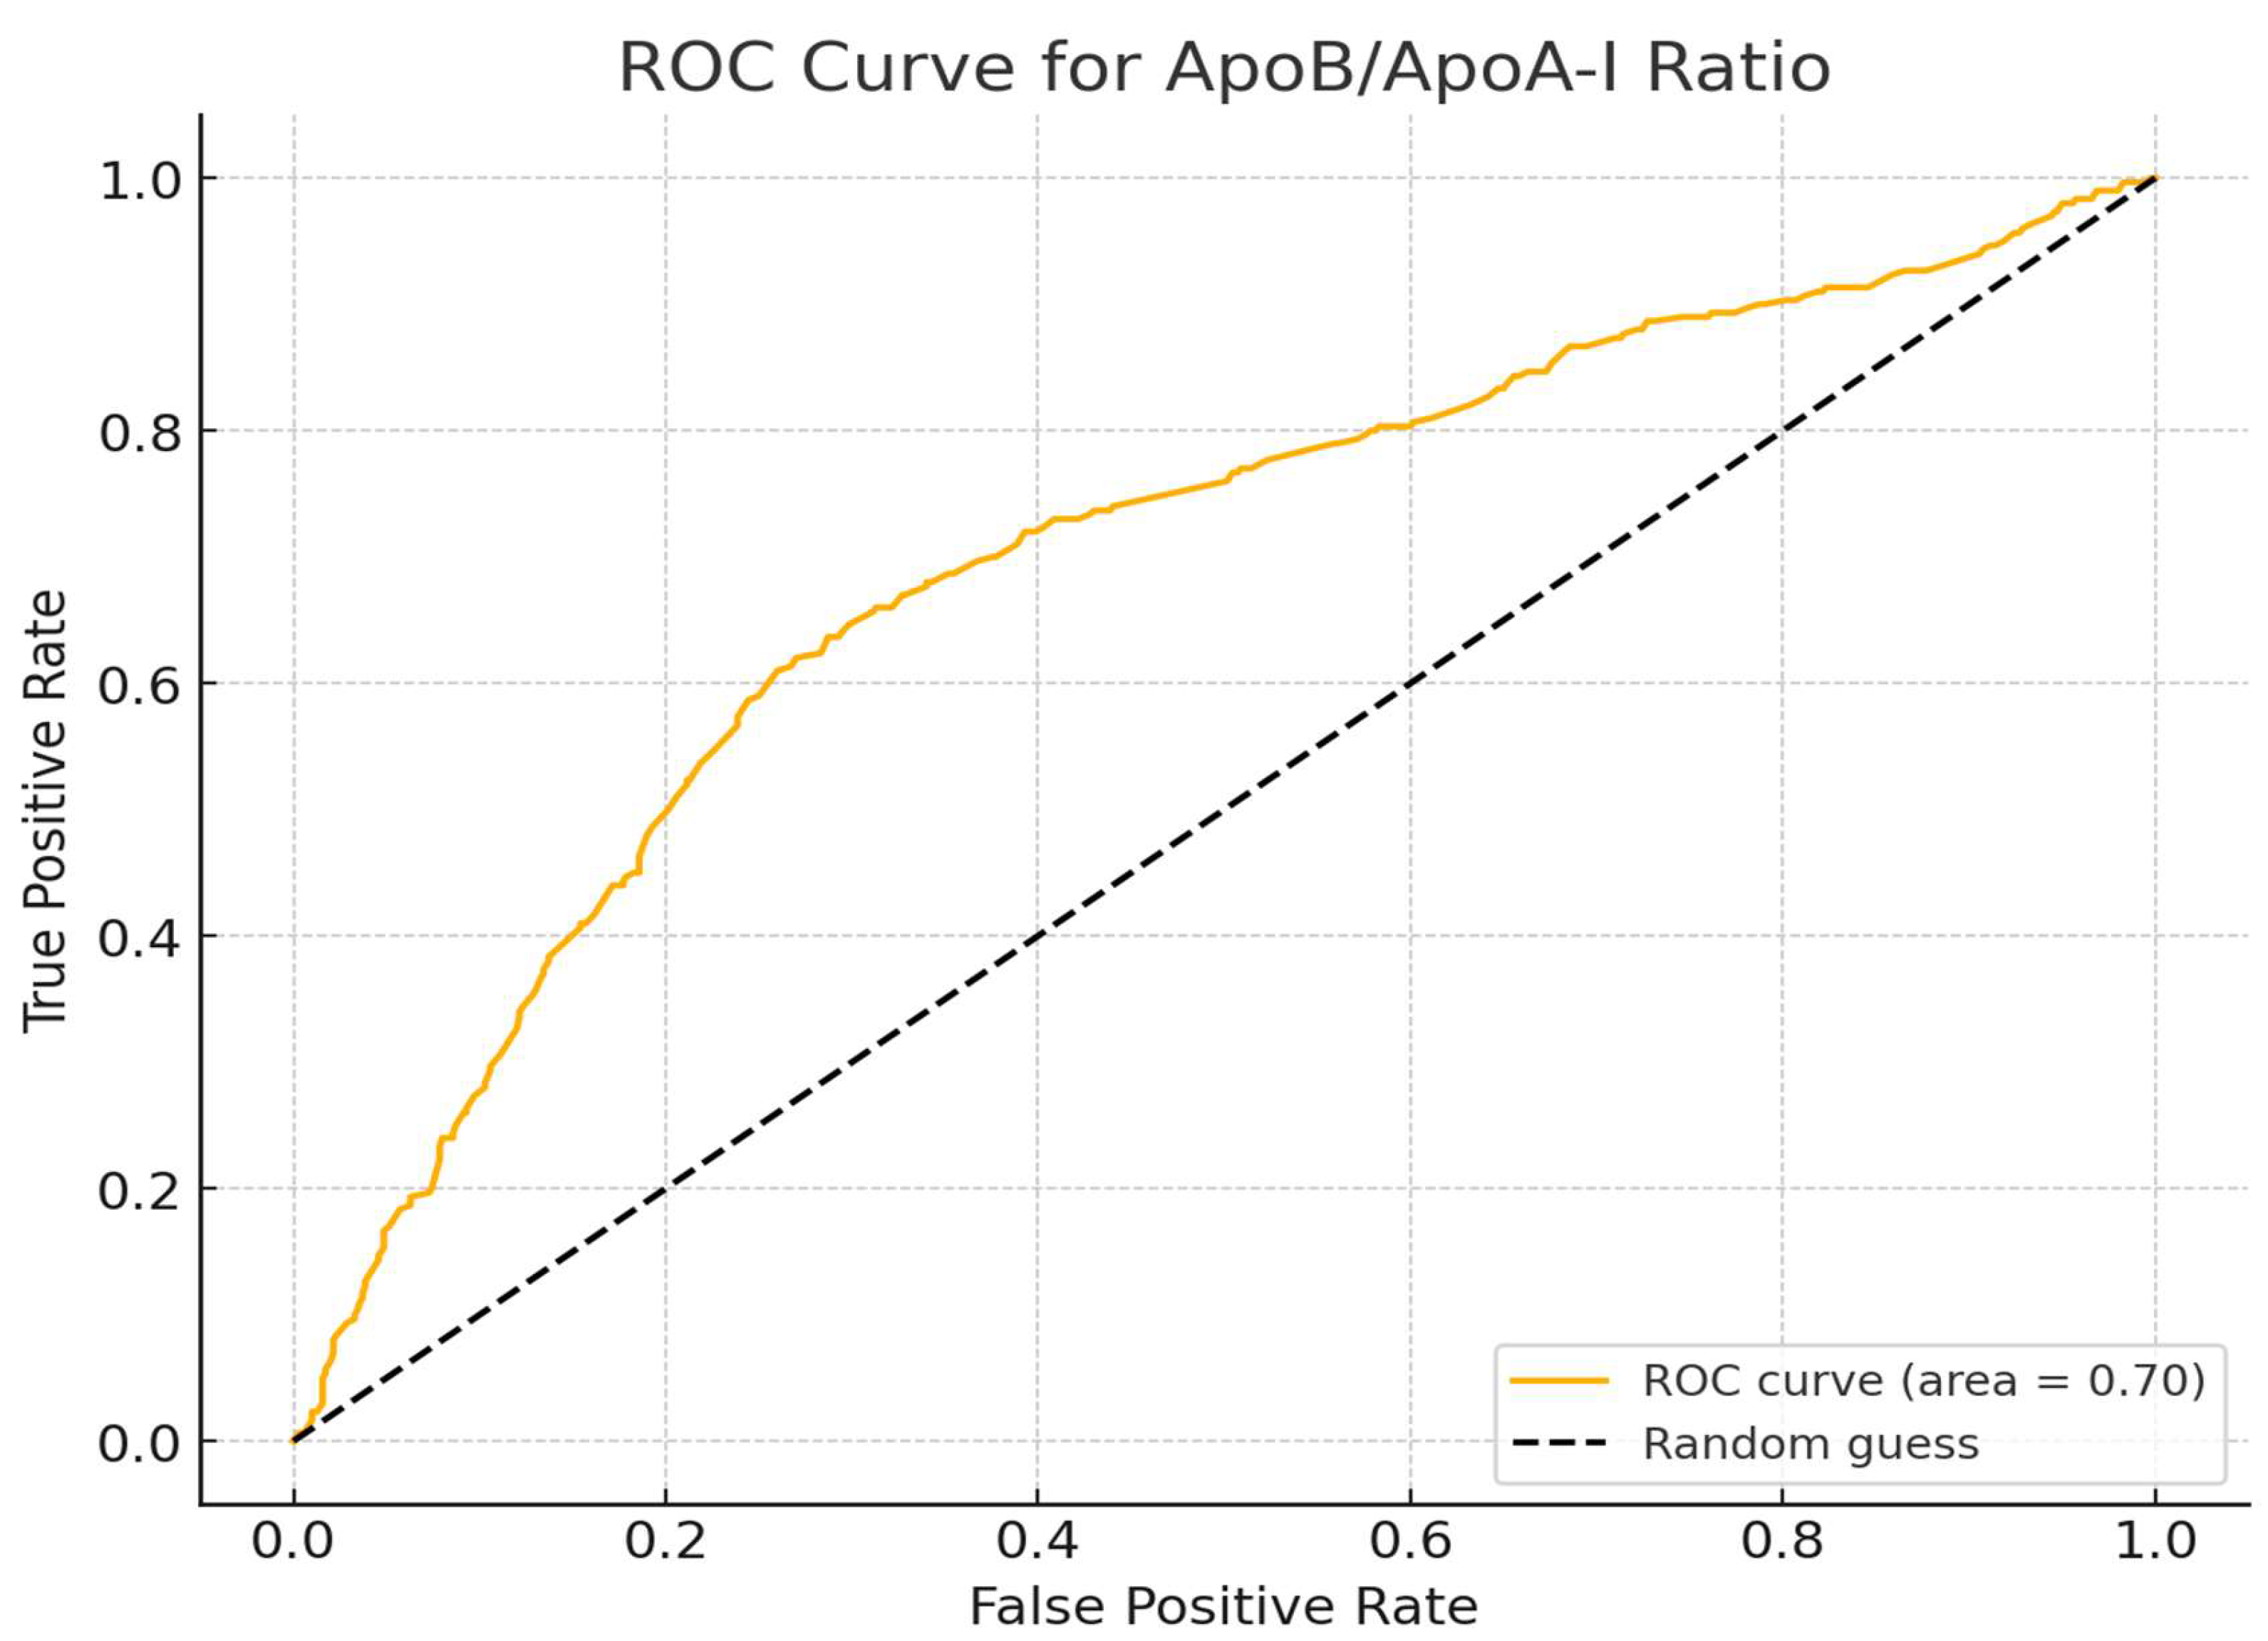
Figure 5.
eQQ plot for distribution of variables before matching and after matching.
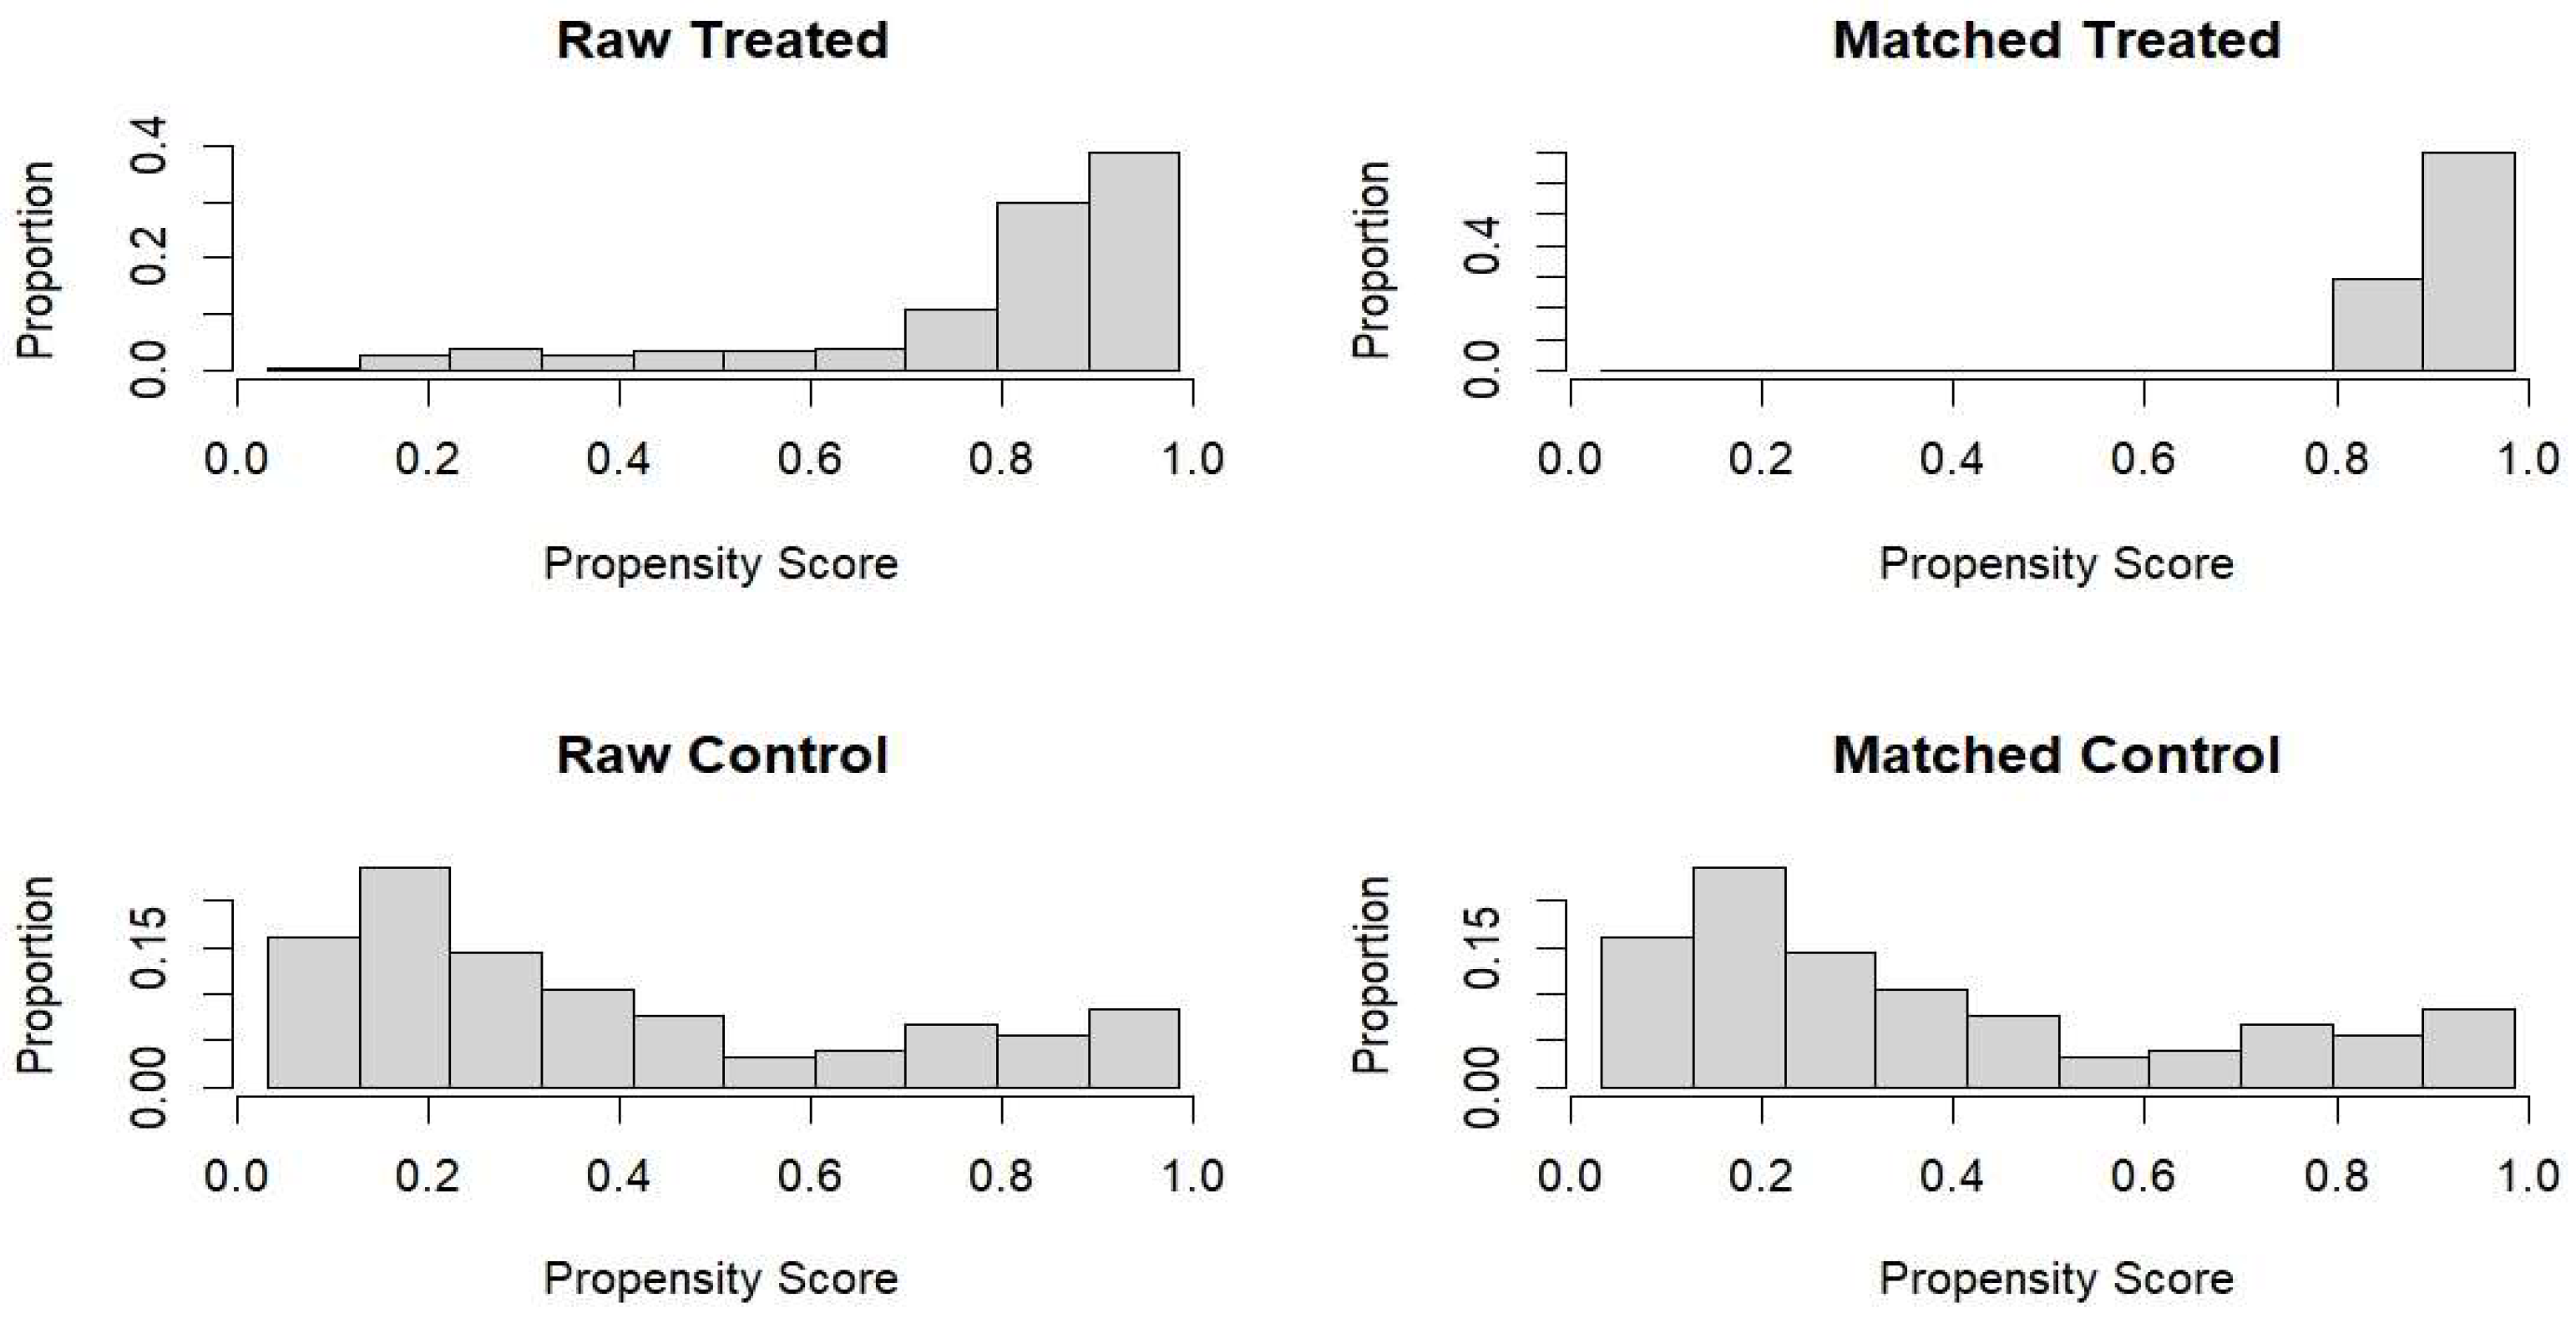
Figure 6.
Receiver operating characteristic (ROC) curve for the propensity score model.
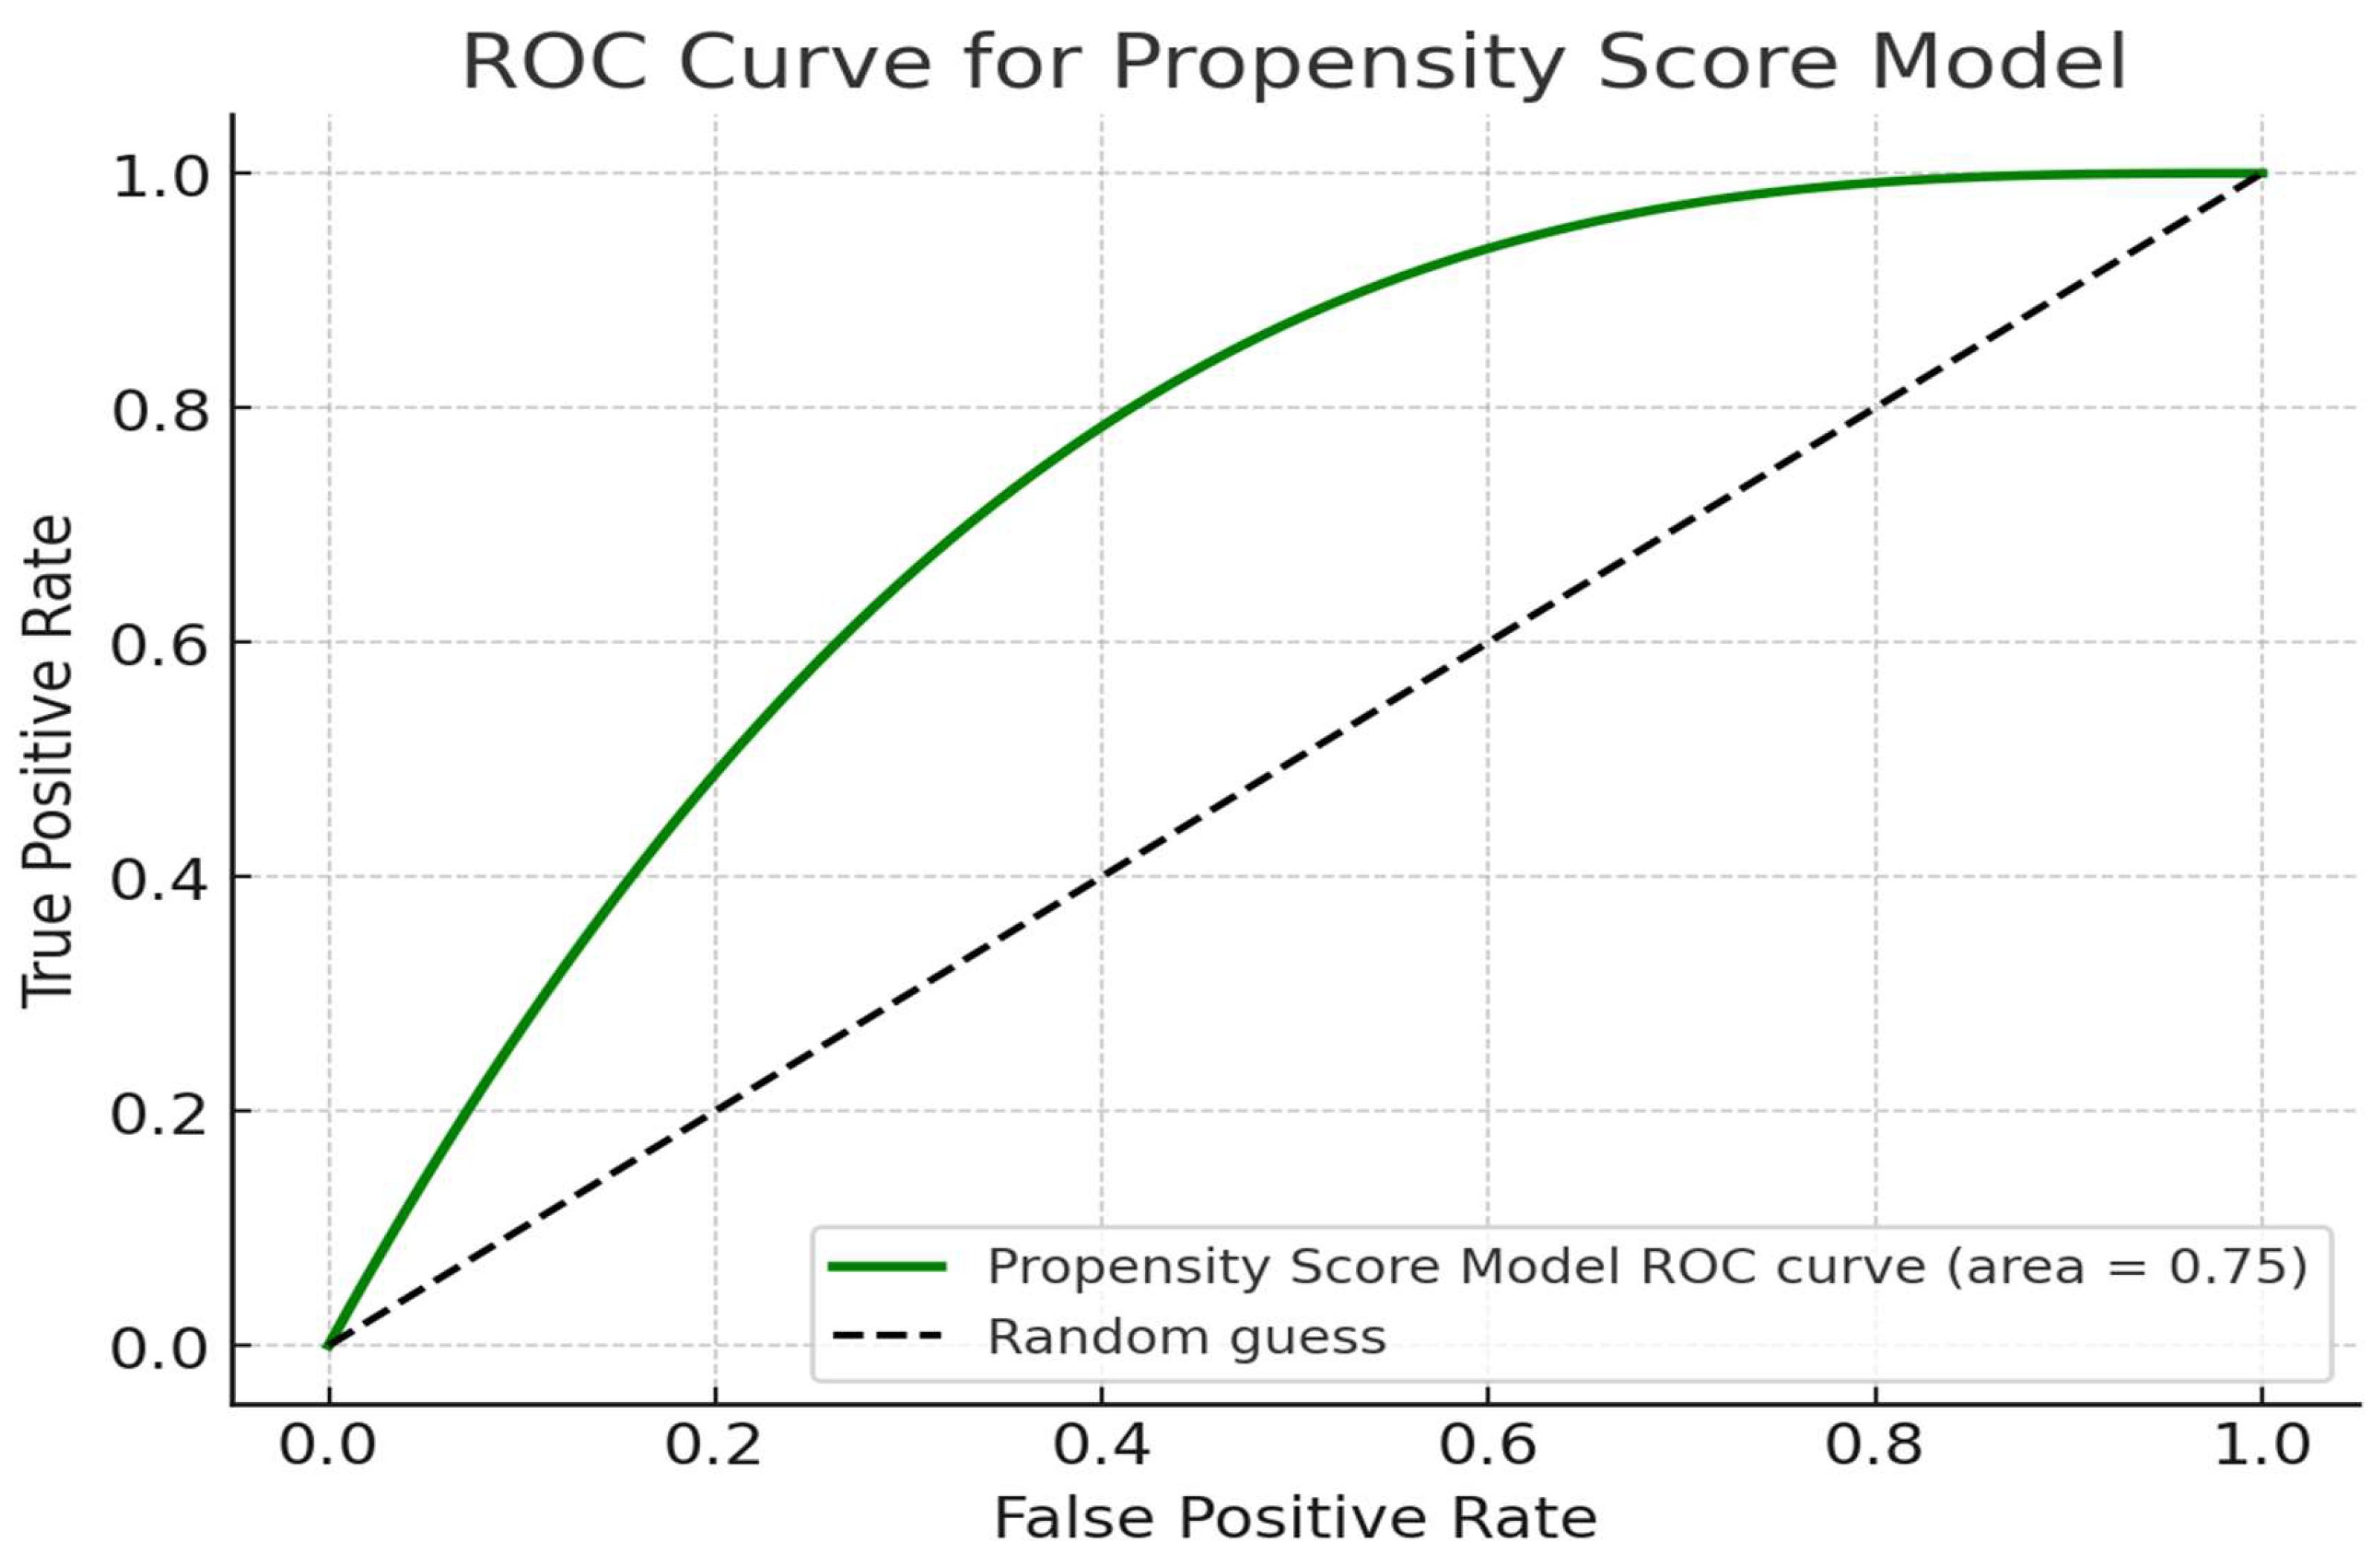

Table 1.
Comparison of descriptive and biochemical parameters between control and training cohorts.
| Parameter | Control (Mean ± SD) |
Training Cohort (Mean ± SD) | p-value | |
|---|---|---|---|---|
| Baseline Characteristics | ||||
| Age (years) | 51.25 ± 13.0 | 55.48 ± 10.4 | < 0.001 | |
| BMI (kg/m²) | 23.98 ± 3.4 | 25.46 ± 4.1 | 0.005 | |
| Smoker (%) | 24% | 82.20% | < 0.001 | |
| Exercise (%) | 18% | 20% | 0.03 | |
| Diabetes (%) | 30% | 61.30% | 0.001 | |
| Family History (%) | 44% | 60.89% | 0.001 | |
| Biochemical parameters | ||||
| ApoA-I (g/L) | 1.12 ± 0.34 | 0.95 ± 0.33 | 0.045 | |
| ApoB (g/L) | 1.0 ± 0.40 | 1.32 ± 0.54 | < 0.001 | |
| ApoB/A-I Ratio | 1.06 ± 0.95 | 1.76 ± 0.97 | < 0.001 | |
| Cholesterol (mg/dL) | 148.16 ± 48.6 | 183.69 ± 57.81 | 0.04 | |
| Triglycerides (mg/dL) | 167.34 ± 80.9 | 199.19 ± 97.94 | 0.03 | |
| HDL (mg/dL) | 36.04 ± 7.08 | 33.16 ± 8.21 | 0.001 | |
| LDL (mg/dL) | 94.78 ± 27.94 | 116.26 ± 38.87 | 0.001 | |
| Chol/HDL Ratio | 4.27 ± 1.50 | 5.79 ± 2.27 | 0.001 | |
| TG/HDL Ratio | 4.8 ± 2.46 | 6.36 ± 3.96 | 0.002 | |
| LDL/HDL Ratio | 2.72 ± 0.93 | 3.66 ± 1.52 | 0.002 | |
| Glucose (mg/dL) | 127.8 ± 60.2 | 150.74 ± 72.46 | 0.001 | |
| T.Bilirubin (mg/dL) | 0.59 ± 0.32 | 0.66 ± 0.43 | 0.040 | |
| ALT (U/L) | 37.05 ± 21.9 | 69.89 ± 128.31 | 0.03 | |
| ALP (U/L) | 91.18 ± 27.4 | 98.56 ± 43.34 | 0.04 | |
Table 2.
Demographic and baseline characteristics of validation cohort.
| Parameter | Control Cohort (Mean ± SD) | Validation Cohort (Mean ± SD) | p-value | |
|---|---|---|---|---|
| Baseline Characteristics | ||||
| Age (years) | 51.25 ± 13.0 | 53.75 (12.64) | 0.143 | |
| BMI (kg/m²) | 23.98 ± 3.4 | 26.14 (4.33) | 0.000 | |
| Smoker (%) | 24% | 60.00% | 0.000 | |
| Exercise (%) | 18% | 10% | 0.101 | |
| Diabetes (%) | 30% | 54.67% | 0.000 | |
| Family History (%) | 44% | 64.29% | 0.002 | |
| CAD Type | (DVCAD: 38.33, TVCAD: 33.33, SVCAD: 28.33] | 0.00% | N/A | |
| Biochemical parameters | ||||
| ApoA-I (g/L) | 1.12 ± 0.34 | 0.88 (0.32) | 0.000 | |
| ApoB (g/L) | 1.0 ± 0.40 | 1.44 (0.55) | 0.000 | |
| ApoB/A-I Ratio | 1.06 ± 0.95 | 2.06 (1.76) | 0.000 | |
| Cholesterol (mg/dL) | 148.16 ± 48.6 | 192.25 (62.25) | 0.000 | |
| Triglycerides (mg/dL) | 167.34 ± 80.9 | 206.51 (103.98) | 0.002 | |
| HDL (mg/dL) | 36.04 ± 7.08 | 32.65 (6.53) | 0.000 | |
| LDL (mg/dL) | 94.78 ± 27.94 | 125.30 (46.43) | 0.000 | |
| Chol/HDL Ratio | 4.27 ± 1.50 | 6.15 (2.60) | 0.000 | |
| TG/HDL Ratio | 4.8 ± 2.46 | 6.69 (4.31) | 0.000 | |
| LDL/HDL Ratio | 2.72 ± 0.93 | 4.02 (1.94) | 0.000 | |
| Glucose (mg/dL) | 127.8 ± 60.2 | 151.34 (80.90) | 0.015 | |
| T.Bilirubin (mg/dL) | 0.59 ± 0.32 | 0.69 (0.46) | 0.06 | |
| ALT (U/L) | 37.05 ± 21.9 | 77.46 (170.30) | 0.014 | |
| ALP (U/L) | 91.18 ± 27.4 | 98.49 (57.87) | 0.224 | |
Table 3.
Univariate analysis of analyzed biochemical markers associated with cad risk.
| Variables | OR | 95% CI (Lower - Upper) |
Std. Error | T value | p-value |
|---|---|---|---|---|---|
| APO-A | 0.19 | 0.13 - 0.27 | 0.19 | -7.48 | 7.40E-14 |
| APO-B | 3.1 | 2.47 - 3.88 | 0.14 | 8.01 | 1.13E-15 |
| APOB/APO A | 1.65 | 1.35 - 2.02 | 0.10 | 3.74 | 0.000198 |
| Cholesterol | 0.99 | 0.98 - 1.00 | 0.00 | -2.70 | 0.00691 |
| Triglycerides | 1 | 0.98 - 1.01 | 0.00 | -0.98 | 0.32659 |
| LDL | 1.01 | 1.00 - 1.02 | 0.00 | 1.93 | 0.05403 |
| LDL/HDL | 1.56 | 1.42 - 1.70 | 0.05 | 8.10 | 5.52E-16 |
| GLUCOSE | 1 | 0.98 - 1.01 | 0.00 | 0.18 | 0.8597 |
| ALT | 1.00 | 1.0 - 1.01 | 0.00 | 2.88 | 0.00402 |
Table 4.
Multivariate analysis of analyzed biochemical markers and CAD risks adjusted for confounding factors.
Table 4.
Multivariate analysis of analyzed biochemical markers and CAD risks adjusted for confounding factors.
| Variables | OR | 95% CI (Lower - Upper) |
Std. Error | T value | p-value |
|---|---|---|---|---|---|
| APO-A | 0.25 | 0.12 - 0.52 | 0.31 | -4.43 | 9.58E-06 |
| APO-B | 2.94 | 2.34 - 3.7 | 0.23 | 4.75 | 1.99E-06 |
| APOB/APO A | 0.86 | 0.74 - 1.02 | 0.10 | -1.85 | 0.06376 |
| Cholesterol | 0.99 | 0.98 - 1.0 | 0.00 | -2.70 | 0.00691 |
| Triglycerides | 1.00 | 0.98 - 1.0 | 0.00 | -0.98 | 0.32659 |
| LDL | 1.01 | 1 - 1.03 | 0.00 | 1.93 | 0.05403 |
| LDL/HDL | 1.36 | 1.18 - 1.57 | 0.09 | 3.27 | 0.00108 |
| GLUCOSE | 1.0 | 0.98 - 1.01 | 0.00 | 0.18 | 0.8597 |
| ALT | 1.0 | 1 - 1.01 | 0.00 | 2.88 | 0.00402 |
Disclaimer/Publisher’s Note: The statements, opinions and data contained in all publications are solely those of the individual author(s) and contributor(s) and not of MDPI and/or the editor(s). MDPI and/or the editor(s) disclaim responsibility for any injury to people or property resulting from any ideas, methods, instructions or products referred to in the content. |
© 2025 by the authors. Licensee MDPI, Basel, Switzerland. This article is an open access article distributed under the terms and conditions of the Creative Commons Attribution (CC BY) license (http://creativecommons.org/licenses/by/4.0/).
Copyright: This open access article is published under a Creative Commons CC BY 4.0 license, which permit the free download, distribution, and reuse, provided that the author and preprint are cited in any reuse.


