
Submitted:
28 January 2025
Posted:
29 January 2025
You are already at the latest version
Abstract
Imbalanced data pose a challenge to the evaluation of trained machine-learning models due to evaluation bias, leading to inappropriate models for real-world applications. Data augmentation serves as a possible solution, but it introduces uncertainty due to the augmentation strategy and the data quality. Comparing measures which rely on diverse statistical principles to assess classification performance in imbalanced data is beneficial in this uncertainty situations. Here, we approach this challenge proposing the accuracy score (AC-score) which combines sensitivity and specificity in an unbiased measure with two relevant properties. First, AC-score is symmetric with respect to both positive and negative classes, this implies that AC-score adapts to cases where both classes have equal importance. Second, AC-score penalizes more than other existing measures the models whose prediction favors one class over the other. We show that AC-score is more conservative than geometric mean, AUC-ROC and balanced accuracy, and we comment the cases in which this offers an advantage offering empirical evidence on artificial and real data classifications.
Keywords:
Class imbalance measures
; Performance measures
; Imbalanced datasets
; Classification
; Machine learning
Introduction
Class imbalance is a prominent problem in the field of machine-learning[1], which often causes misleading evaluations for classification models, and affects the training if metrics are used to guide the training process, e.g. using cross-validation to select hyperparameters. This problem arises when two classes have the same importance but different numbers of samples. Although the training problem can be remedied by making the class balanced with techniques[2] such as oversampling or undersampling[3], the evaluation problem cannot be solved together. Besides, oversampling is not always feasible due to reasons such as sampling difficulties and time or cost constraints. The data augmentation in oversampling introduces another layer of uncertainty to the training due to the quality of augmented data. Although different metrics have been proposed for specific tasks such as AUROC for medical data classification, new metric are needed to fairly evaluate performance of trained models on imbalanced data.
Although some metrics have been reported[4] as null-biased, which include TPR (i.e. sensitivity) and TNR (i.e. specificity), they are rarely used directly because they only evaluate for either positive or negative class. Other null-biased metrics come from combinations of TPR and TNR, including balanced accuracy[5] (BA), bookmaker informedness[6] (BM), area under the receiver operating characteristic curve[7] (AUROC) and Geometric mean[8] (GM). These metrics evaluate once for both classes. For inter-datasets comparison, the metrics should also keep the value of TPR or TNR if they are the same, thus, BM and all the power functions of GM (except for index of one) such as Index of balanced accuracy[9] (IBC) are excluded from further considerations. Among the rest, BA and AUROC fail to create penalty nonlinearly for more significantly imbalanced models. GM is the only metric to create nonlinear penalty, but there remains the problem of finding a continuous metric that penalizes as much as possible when the fitted models favor one class than the other, while keeping reasonable overall evaluations.
For this reason, in this study we propose accuracy score (AC-score), which is an unbiased metric using two unbiased metrics as components which are sensitivity and specificity, and evaluates at once for both classes. The name originates from that it uses the same variable as balanced accuracy. The profile surface of AC-score was given against its parameters, showing that AC-score creats harsher penalizations than GM for inappropriately fitted classifiers on imbalanced data. This characteristic was subsequently supported by tests on the SVHN dataset, which showed that AC-score is able to give fair evaluation and comparison for linear discriminant analysis (LDA) and nearest mean classifier (NMC). Among all the metrics, only AC-score, GM, AUROC and BA were able to give stable evaluations, and AC-score achieved the strongest penalization for more imbalanced favors to positive or negative class.
Results
2.1. AC-Score Characteristics
We compared evaluation profiles between AC-score and other null-biased metrics GM, AUROC (and BA as its equivalence, see 3.1) by plotting their evaluation against all parameter values. Figure 1a shows the overall profile of these metrics, and AC-score is shown to have the lowest evaluation everywhere in the plot, indicating AC-score has more pessimistic evaluations than GM, AUROC and BA. This constitutes an advantage since underestimating a model is safer than overestimation.
The sectional curves for these metrics are obtained by fixing one of the two parameters at constant (Figure1b-d by fixing TNR and Figure1e-g by fixing TPR). According to the surface profile, BA and AUROC do not create nonlinear evaluation when the difference between TPR and TNR varies. Compared to GM, AC-score penalizes more strongly when the difference between TPR and TNR gets larger. When TPR or TNR gets zero, AC-score converges to GM, but these are the scenarios of less interests. This characteristic indicates that AC-score has a harsher penalty to the TPR-TNR discrepancy, offering a fair evaluation and thus better fitting of classifiers on imbalanced data.
2.2. AC-Score Evaluates Fairly and Stably Performance of Classifiers on Imbalanced Dataset
To compare evaluations using different metrics for fitted models trained and make predictions on imbalanced data, tests were performed on one binary-pair of the SVHN dataset using LDA and NMC (see 3.3). Three different conditions of data imbalance were tested with negative to positive ratio N:P=1:3, 1:1 and 3:1 in test set respectively. Training set had the same N:P ratio as the test set and was 3:1 in size to test set.
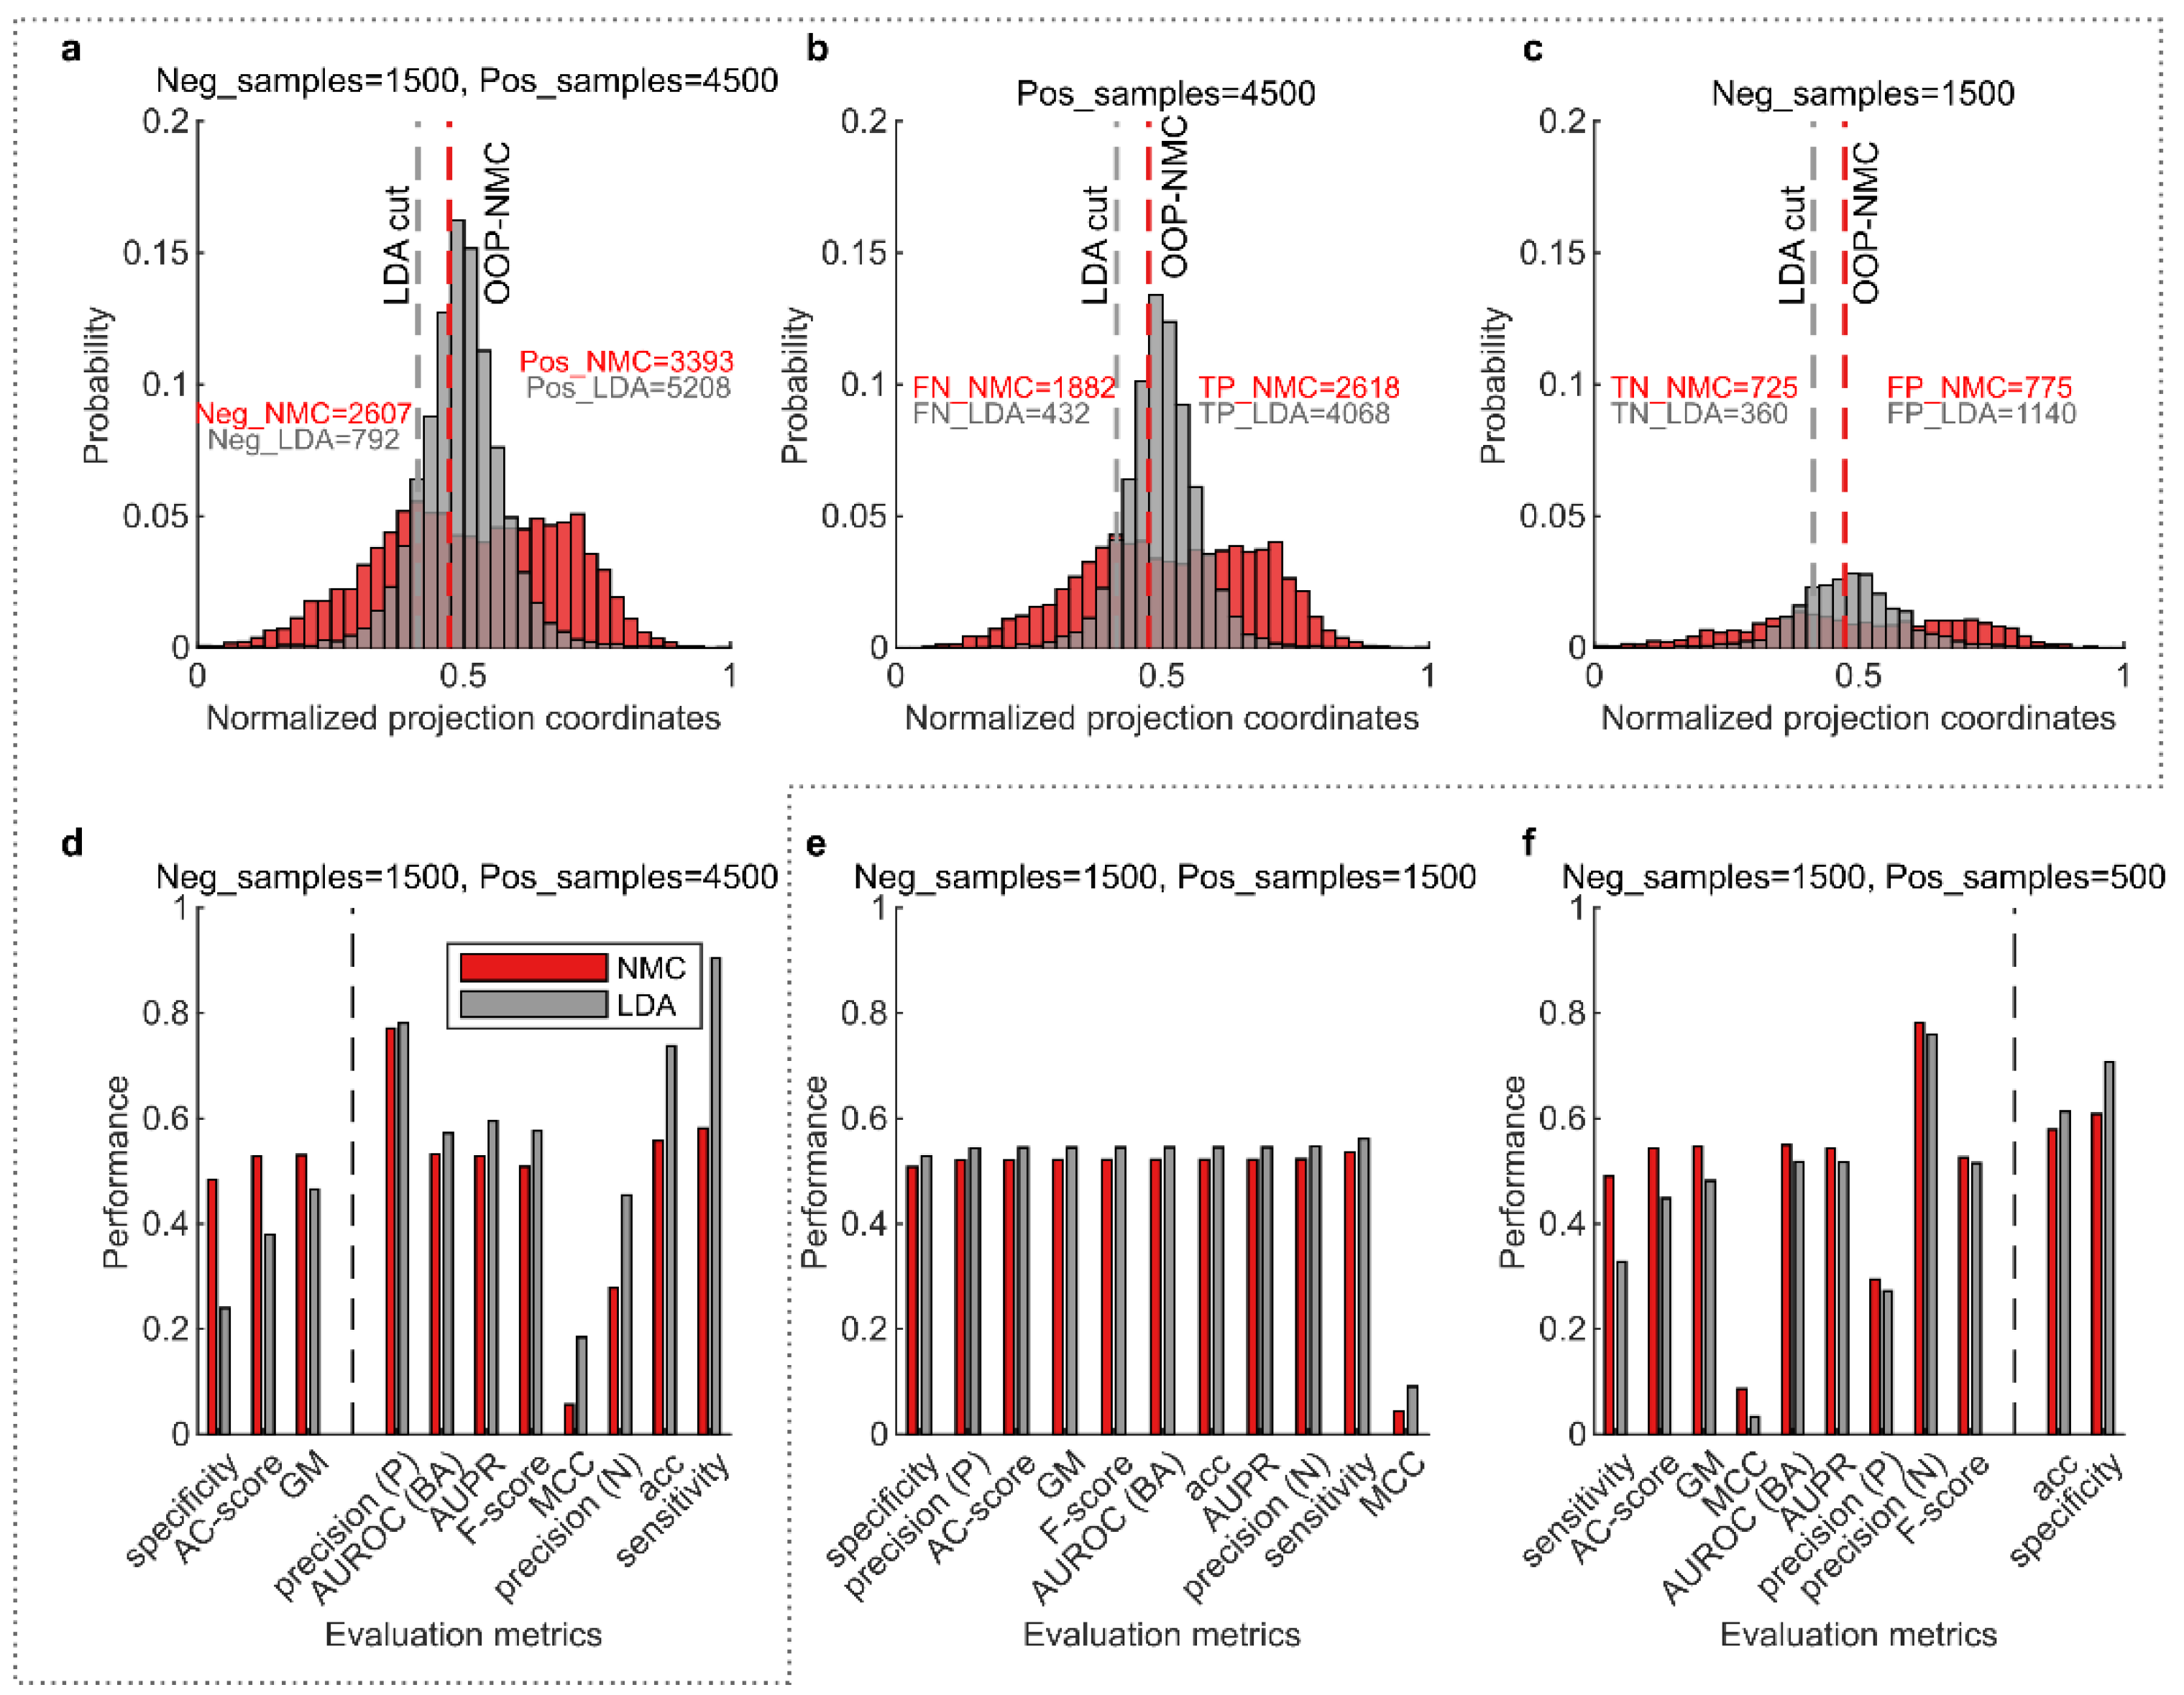
In the case where N:P=1:3 (Figure 2a-c), the NMC classifier equipped with optimal operating point (OOP) search along its discriminant had a more uniform data projection and the OOP was fitted near the middle of the projection. In contrast, due to the lack of the OOP search mechanism, LDA was fitted toward one side of the distribution (Figure 2a). To analyze, the training of NMC is guided by a score incorporating AC-score (see 3.3), while LDA was totally trained with its principle to maximize projection variance ratio. If dividedly by true labels (Figure 2b-c), NMC separated around the middle of each distribution, while LDA separated with an inclination for positive class, sacrificing the negative class which contributes less to its training due to less samples in this class.
In real applications, if the data are randomly sampled, it is reasonable to assume subsequent sampling follows the same distribution of the data in each class that has been already sampled. Hence, if we supplement negative samples in Figure 2c to as many as positive samples in Figure 2b, the sacrifice that was minor before will be magnified. In this situation, it can be indicated that LDA does not give a proper separation, under the conditions that two classes are as same important. However, Figure 2d shows that for all the metrics (ranked on x-axis according to performance difference between NMC and LDA) to the right of the gray dashed line, LDA performs better than AC-score, which are an evaluation of less incredibility. However, AC-score, GM and sensitivity are shown to be able to reflect fairly performance of classifiers.
Further tests were performed with class imbalance N:P=1:1 and 3:1 (Figure 2e-f). By comparing different conditions of class imbalance (Figure 2d-f), only AC-score and GM are stable metrics, while other metrics changed their position on x-axis ranked by performance difference between NMC and LDA. However, AC-score made more significant differentiation between LDA and NMC, especially in the presence of class imbalance (Figure 2 d and f), which is in align with the surface profile in the last section that it can creates harsher penalties for imbalance data evaluation.
Material and Methods
3.1. Evaluation Metrics
Performance evaluation metrics are defined using confusion matrix components, including true positive (TP), true negative (TN), false positive (FP) and false negative (FN), from which TPR and TNR can be calculated:
AC-score is defined by . The name originates from that it uses the same variable as balanced accuracy. Since TPR and TNR are both null-biased metrics, AC-score as their combination is also a null-biased metric. Other metrics using the combination of TPR and TNR are GM and AUROC, which are therefore also null-biased metrics. Their formulae are given by:
Additionally, BA is proved to be equal to the single test point AUROC for discrete classifiers6, i.e. it has only one test point aside from (0,0) and (1,1) on the curve.
Other evaluation metrics used in this study are given below:
Matthews correlation coefficient[10] (MCC):
Area under the precision-recall curve (AUPR):
3.2. Simulation on the Imbalanced SVHN Dataset
In section 2.2 we compared all the metrics on SVHN dataset. The binary classification was performed on the pair of number “1” and “6”. Three conditions of data imbalance were tested with proportion of negative to positive samples N:P being 1:3, 1:1 and 3:1 respectively, and the proportion of training data to test data was made to 3:1. For these conditions, 18,000, 9,000 and 6,000 training samples are used respectively, and 6,000, 3,000 and 2,000 test samples are used respectively.
3.3. Linear Classifiers
We made two modifications to the original NMC to augment its performance. First, the original NMC uses mean as centroid, but better performance may be achieved when the median is employed as centroid. Therefore, we implemented an adaptive version of NMC that select the best type of centroid according to the score for selecting OOP. Second, the original NMC uses the middle point as the cut, here the NMC is equipped with an OOP search mechanism enabling the training guided by a score that enhances performance.
The training of the classifier NMC is divided into two steps. In the first step the NMC discriminant was obtained by taking the unit vector pointing from centroid of negative class to the one of positive class. In the second step, the data points were projected onto the discriminant and an OOP search was performed from N-1 candidates, which are the middle points of any two consecutive points on the projection axis. The criterion for the best OOP is the score , where F-score was evaluated twice each time for one class because it is not a symmetric measure.
LDA discriminant was obtained using Matlab statistics and machine learning toolbox function fitcdiscr. The cut on the LDA discriminant is determined by its algorithm. A 5-fold cross-validation repeated for 10 times was performed to train the two classifiers. For NMC this was performed for the OOP search instead of the discriminant. For LDA this was performed for both the discriminant and the bias.
Metrics were evaluated in a balanced manner considering equal importance for both classes. Therefore, metrics that is not symmetric with both classes (except for metrics designed for evaluating one class such as sensitivity), which includes AUPR and Fscore, were evaluated for positive class and negative class individually, of which the average was taken as final evaluation.
3.4. Hardware and Software Specifications
The simulations were performed on Lenovo P620 workstation, equipped with AMD Ryzen Threadripper PRO 3995WX 2.7GHz CPU that has 64 cores and 128 threads. Ubuntu 20.04, MATLAB 2021b were used as the environments to run the algorithms.
Discussion and Conclusion
In real-world applications, there are situations in which different classes have equal importance but for practical reasons balanced data could not be collected, such as sample number constraints and data acquisition costs. Most existing performance evaluation metrics work for balanced or nearly balanced dataset, but would fail to offer proper evaluations in imbalanced cases. Therefore, to apply machine learning methods in such applications, appropriate metrics should be chosen to properly evaluate the classification performance and to better guide the training process of classifiers if evaluation is involved.
Moreover, linear binary classifiers involve a discriminant and an associated decision point. In real-world applications, the data points projected onto the discriminant may also reflect some special properties such as risk or cost, which needs to be balanced, and the balanced point is typically modelled in the middle of the projection. We could find that AC-score has such ability to make balanced fitting from imbalanced data, as in the second experiment it showed the tendency to fit in the middle of the projections.
To summarize, in this study we clarify the necessity of a metric that gives proper evaluation for classifiers trained on imbalanced data, and penalize the condition in which classifiers outperform for one class but underperform for the other class. Accordingly, we proposed AC-score that creates such penalty and penalizes more than the GM metric as well as AUROC and BA, when there is more discrepancy between performance for two classes. An example from real imbalanced data is given to show how most metrics are misleading, whereas AC-score is able to discover that a fitted model with high evaluations using other metrics was in fact biased. By considering the imbalance between classes, AC-score is able to make unbiased evaluations, and guide machine-learning models fitted appropriately.
Author Contributions
C.V.C. proposed the AC-score metric and designed the experiments and the content of the study. Y.W. realized the evaluation function, performed the experiments and collected the results. C.V.C and Y.W. analyzed the experiment results. C.V.C. designed and Y.W. realized the figures. Y.W. wrote the manuscript and C.V.C. corrected it.
Funding
This work is supported by the Zhou Yahui Chair professorship of Tsinghua University, the starting funding of the Tsinghua Laboratory of Brain and Intelligence, and the National High-level Talent Program of the Ministry of Science and Technology of China.
Data and code availability
The code to get results and produce figures in this study can be accessed from GitHub link: https://github.com/biomedical-cybernetics/AC-score
Acknowledgements
We thank: Syed Shafat Ali for the valuable scientific discussion. Yuchi Liu, Ruochen Xu, Wenli Zhu, Lixia Huang, and Weijie Guan for the administrative support at THBI.
Declaration of Competing Interest
The authors declare no competing interests.
References
- Krawczyk, B. Learning from imbalanced data: open challenges and future directions. Progress in Artificial Intelligence vol. 5 Preprint at (2016). [CrossRef]
- Batista, G. E. A. P. A., Prati, R. C. & Monard, M. C. A study of the behavior of several methods for balancing machine learning training data. ACM SIGKDD Explorations Newsletter 6, (2004). [CrossRef]
- Amin, A. et al. Comparing Oversampling Techniques to Handle the Class Imbalance Problem: A Customer Churn Prediction Case Study. IEEE Access 4, (2016). [CrossRef]
- Luque, A., Carrasco, A., Martín, A. & de las Heras, A. The impact of class imbalance in classification performance metrics based on the binary confusion matrix. Pattern Recognit 91, (2019). [CrossRef]
- Brodersen, K. H., Ong, C. S., Stephan, K. E. & Buhmann, J. M. The balanced accuracy and its posterior distribution. in Proceedings - International Conference on Pattern Recognition (2010). [CrossRef]
- Sokolova, M., Japkowicz, N. & Szpakowicz, S. Beyond accuracy, F-score and ROC: A family of discriminant measures for performance evaluation. in AAAI Workshop - Technical Report vol. WS-06-06 (2006). [CrossRef]
- Hanley, J. A. & McNeil, B. J. The meaning and use of the area under a receiver operating characteristic (ROC) curve. Radiology 143, (1982). [CrossRef]
- Tharwat, A. Classification assessment methods. Applied Computing and Informatics 17, (2018). [CrossRef]
- García, V., Mollineda, R. A. & Sánchez, J. S. Index of balanced accuracy: A performance measure for skewed class distributions. in Lecture Notes in Computer Science (including subseries Lecture Notes in Artificial Intelligence and Lecture Notes in Bioinformatics) vol. 5524 LNCS (2009). [CrossRef]
- Boughorbel, S., Jarray, F. & El-Anbari, M. Optimal classifier for imbalanced data using Matthews Correlation Coefficient metric. PLoS One 12, (2017). [CrossRef]
Figure 1.
Evaluation profile comparison between metrics. (a) Metric evaluation surfaces of AUROC, GM and AC-score in relation to TPR and TNR. (b-d) Sectional evaluation curves of AUROC, GM and AC-score obtained at TNR=1, 0.5, 0 respectively corresponding to the planes p1-p3 in (a). (e-g) Sectional evaluation curves of AUROC, GM and AC-score obtained at TPR=1, 0.5, 0 respectively, corresponding to the planes p4-p6 in (a). TPR: true positive rate; TNR: true negative rate; AUROC: area under the receiver operating characteristic curve; GM: geometric mean; BA: balanced accuracy.
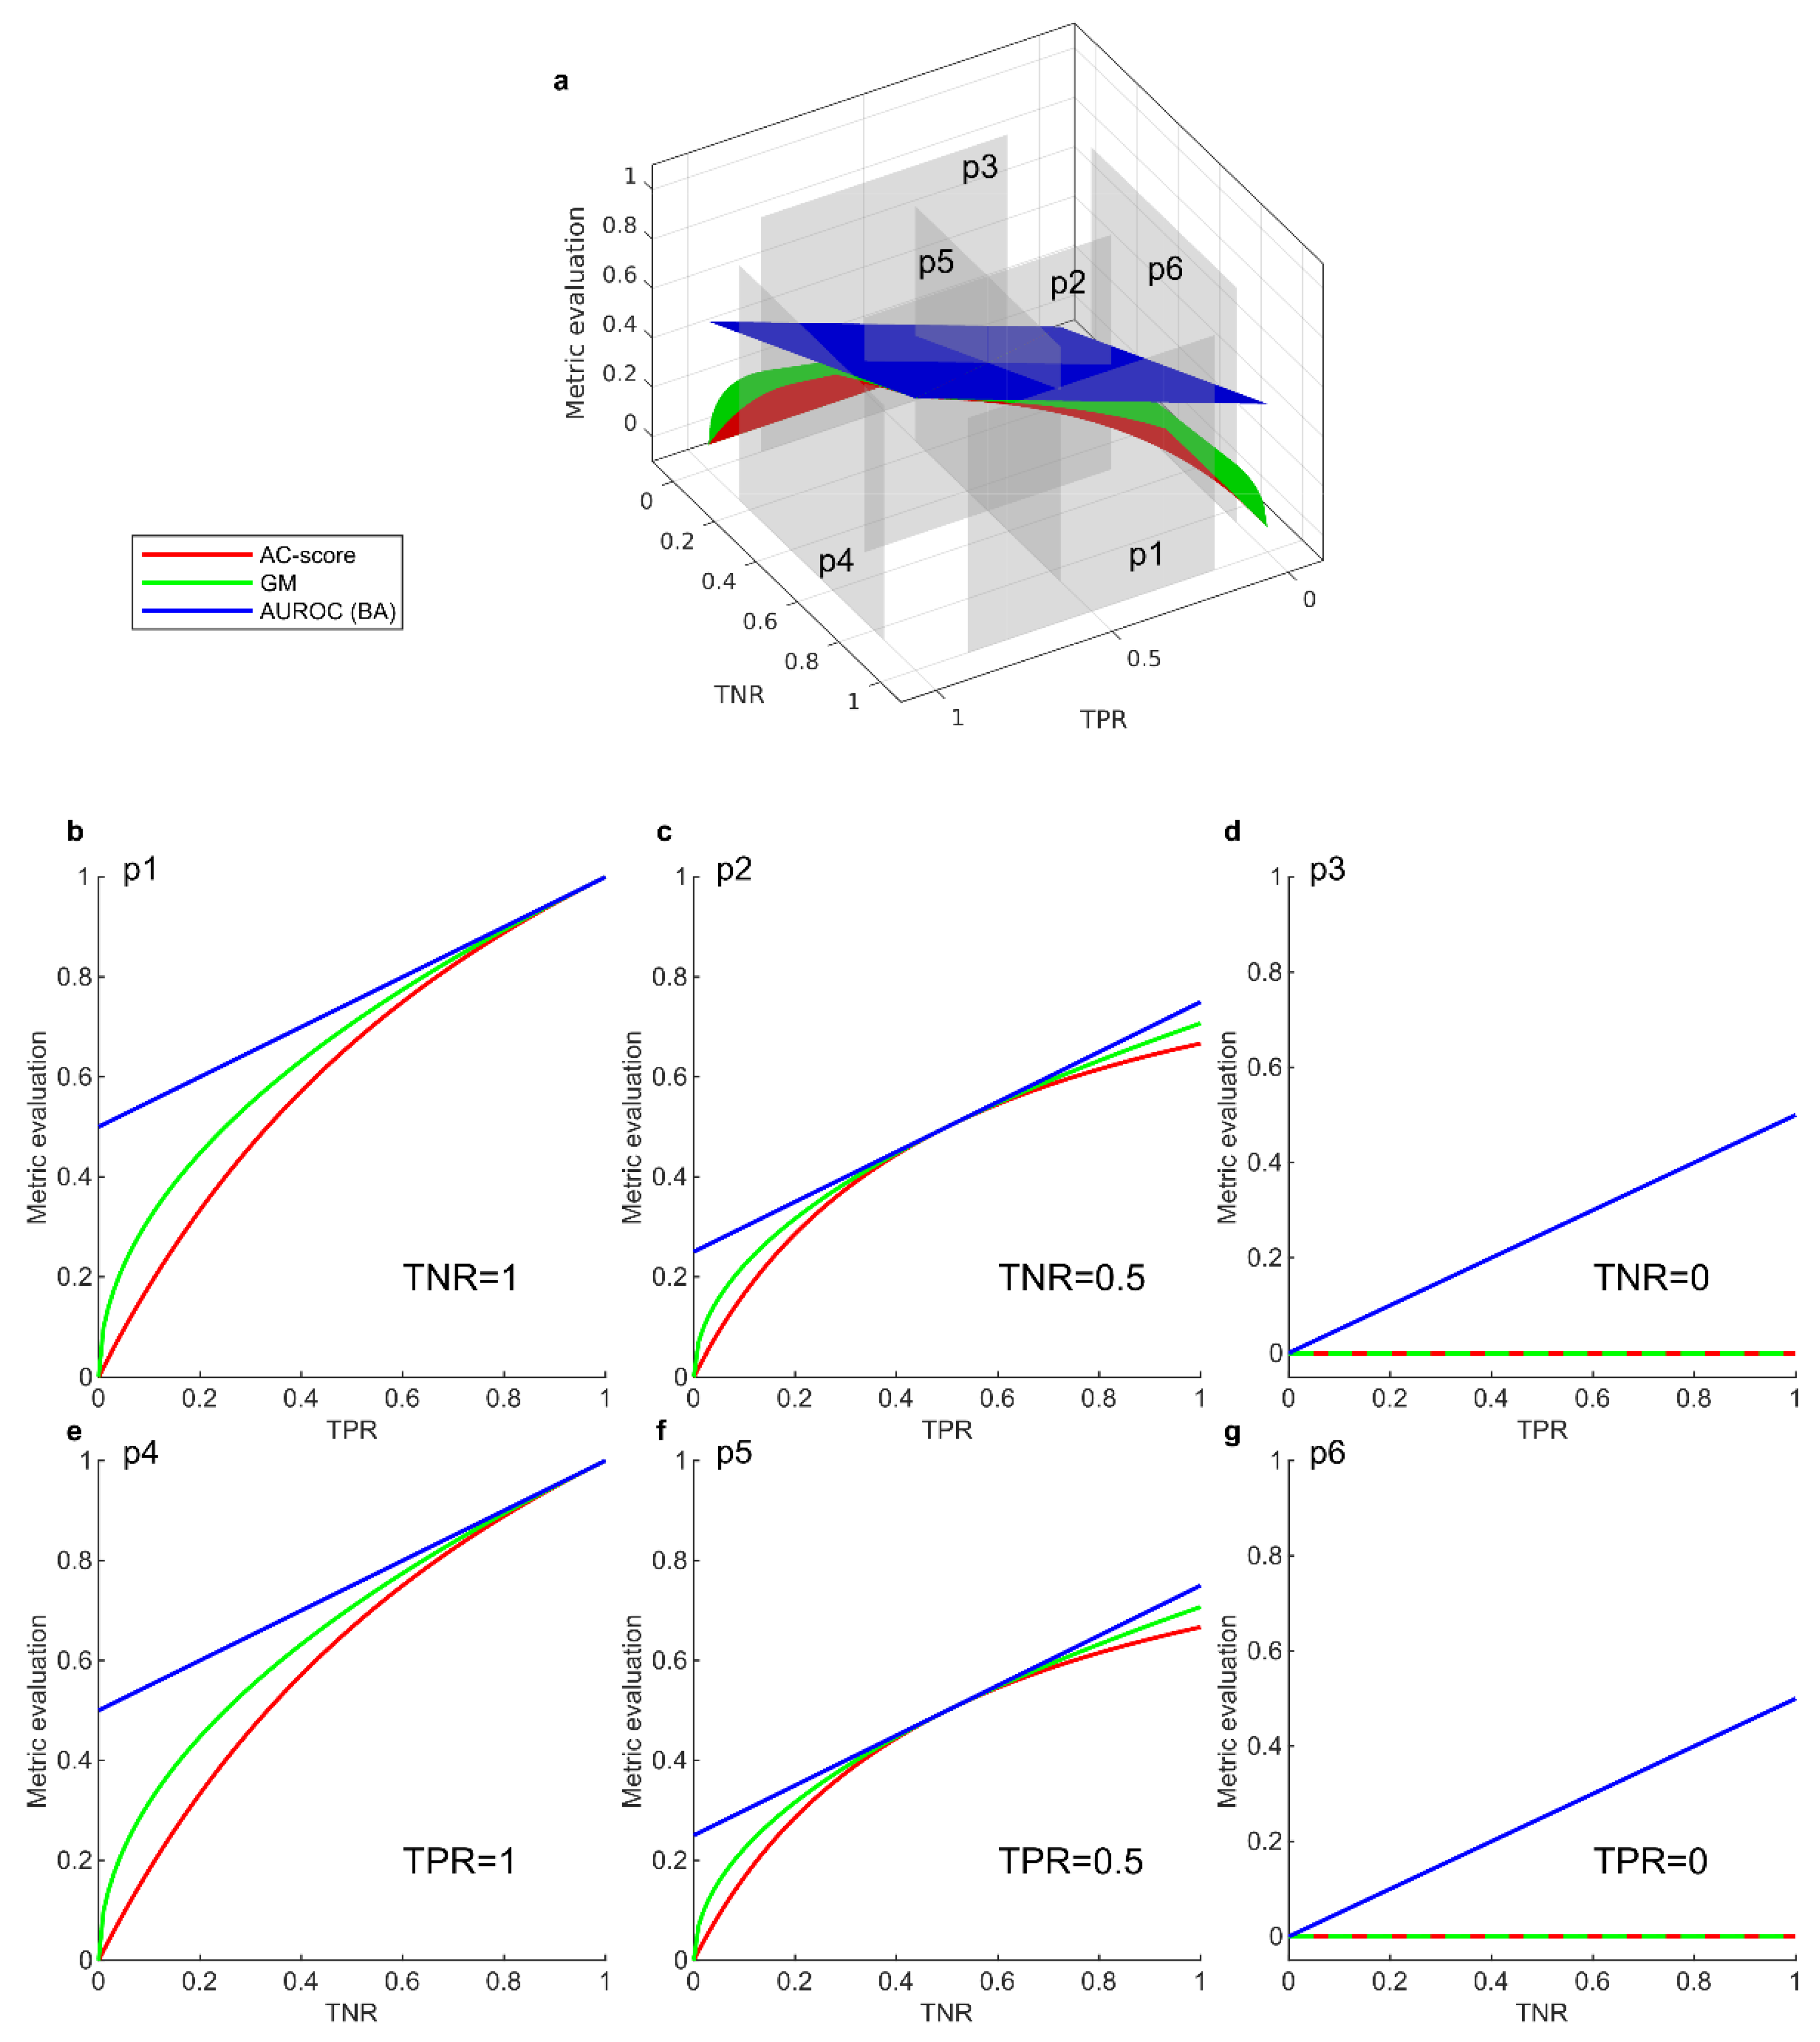
Figure 2.
Evaluation comparison between metrics on real data. (a-c) Distribution of normalized projection coordinates of the test set from one binary classification in SVHN obtained by NMC and LDA, including (a) both positive and negative samples; (b) positive samples; (c) negative samples. (d-f) Metric evaluation results with different conditions of class imbalance in test set: (d) original imbalance with N=1500 and P=4500, corresponding to (a-c); (e) no imbalance with N=1500 and P=1500; (f) reverse imbalance with N=1500 and P=500. Metrics are ranked on x-axis according to performance difference between NMC and LDA in (d-f). Training set had the same N:P class proportion as the test set and was 3:1 in size to test set. Precision (P) represents the precision evaluated for the positive class, and so forth for (N); Acc represents the accuracy; OOP: optimal operating point; GM: geometric mean; acc: accuracy; MCC: Matthews correlation coefficient; AUROC: area under the receiver operating characteristic curve; GM: geometric mean; BA: balanced accuracy; AUPR: area under the precision-recall curve.
Disclaimer/Publisher’s Note: The statements, opinions and data contained in all publications are solely those of the individual author(s) and contributor(s) and not of MDPI and/or the editor(s). MDPI and/or the editor(s) disclaim responsibility for any injury to people or property resulting from any ideas, methods, instructions or products referred to in the content. |
© 2025 by the authors. Licensee MDPI, Basel, Switzerland. This article is an open access article distributed under the terms and conditions of the Creative Commons Attribution (CC BY) license (http://creativecommons.org/licenses/by/4.0/).
Copyright: This open access article is published under a Creative Commons CC BY 4.0 license, which permit the free download, distribution, and reuse, provided that the author and preprint are cited in any reuse.


