
Submitted:
22 January 2025
Posted:
23 January 2025
You are already at the latest version
Abstract
Background: Rheumatoid arthritis (RA) is a dysbiosis of the gut microbiota, and diet is one of the powerful environmental factors that can alter the microbiota. The aim of the clinical study was to determine the effect of the Ideal Food Pyramid on gut microbiota in RA patients; as well as its effect on disease activity, biochemical findings and anthropometric measurements.
Methods: Thirty patients diagnosed with RA who met the inclusion criteria were randomly divided into diet and control groups and followed for 12 weeks. Gut microbiota composition was determined by 16S rRNA gene sequencing.
Results: At the end of the study, Simpson, Shannon and Chao-1 indices were higher in the diet group (16) than in the control group (14), although not significantly (p>0.05). At the phylum level, the relative abundance of Firmicutes increased and the abundance of Bacteroidetes decreased in the diet group at the end of the trial. At species level, Prevotella Copri, Bacteroides fragilis, Prevotella stercorea, Bacteroides uniformis decreased while Faecalibacterium prausnitzii, Roseburia faecis, Bacteroides ovatus, Akkermansia muciniphila, Coprococcus eutactus, Gemmiger formicilis, Ruminococcus bromii, Bifidobacterium longum species increased in the diet group.
Conclusion: The Ideal Food Pyramid has been determined to have many clinical benefits for RA patients, especially for the gut microbiota.
Keywords:
Gut Microbiota
; Rheumatoid Arthritis
; Ideal Food Pyramid11
1. Introduction
RA is a chronic, systemic inflammatory disease characterised by synovial hyperplasia, autoantibody production, cartilage and bone destruction, malformation and destruction of multiple joints [1]. RA is estimated to affect approximately 0.24 to 1 per cent of the population and is twice as common in women than in men [2]. RA is a form of arthritis that causes pain, swelling, stiffness and loss of function in the joints. This disease seriously affects quality of life with increasing morbidity and mortality [3]. Interactions between genetic factors, environmental factors and the presence of autoantibodies lead to an increased risk of developing RA [4]. In the last few years, emerging evidence has reported that intestinal dysbiosis plays a role in the onset of autoimmune diseases such as RA, suggesting its role in contributing to impaired immune tolerance [5,6]. Filamentous bacteria in the gut have been reported to trigger autoimmune arthritis through their effects on T helper 17 (Th17) cells [7]. Increasing evidence suggests that microbiome dysbiosis may disrupt intestinal barrier integrity, including the mucus layer and epithelial cell junctions, leading to increased intestinal permeability [8,9]. This situation fuels host immune responses and chronic inflammatory disorders by allowing the translocation of harmful microbiome-derived and environmental components into the mucosal layer and systemic circulation [9]. Patients with RA show significant differences in the composition of the gut microbiota compared with controls. The gut microbiome in individuals with RA has shown increased abundance of Prevotella (especially Prevotella Copri), Collinsella and decreased abundance of Bifidobacterium [5,10] Although the mechanism of how Prevotella copri contributes to the development of RA is still unclear, the high amount of Prevotella copri in the gut in patients with RA exacerbates the humoral immune response. Animal studies have demonstrated Th1 cell activity against Prevotella copri, which in turn induces activation of autoreactive T cells in mice. In addition, experiments have identified up-regulation of Th17-related cytokines such as IL-6 and IL-23 by Prevotella copri [10]. In addition to supporting disease activity, gut microbiota may also affect the response of patients with RA to treatment [11]. Therefore, gut microbiota constitutes a potential therapeutic target in patients with RA, both in terms of regulating disease and improving response to current therapies. The literature suggests that diet plays an important regulatory role in RA because it is an environmental factor that affects antigen production, inflammation, antioxidant defense mechanisms and gut microbiota [12,13]. One of the most powerful ways to change gut microbiota is through diet [14]. One of the mechanisms of pro- or anti-inflammatory action of the diet is the intermediate effect of the diet on the metabolic activity and composition of the intestinal microbiota. The gut microbiota is incredibly dynamic and responds rapidly to dietary changes [8]. High-fibre diets that are low in red meat and high in unsaturated fatty acids (e.g. Mediterranean diet, vegan, vegetarian) are associated with increased microbial diversity and a healthy microbiome composition with more beneficial bacteria (e.g. Bifidobacteria, Eubacterium, Roseburia, Lactobacillus). They are also associated with higher levels of short-chain fatty acids (SCFAs) [13]. In contrast, Western diets high in animal fat and protein and low in fiber increase pathogenic bacteria (e.g. Proteobacteria, Collinsella, Bacteroides, Enterobacteria) while decreasing beneficial bacteria (e.g. Bifidobacteria, Lactobacillus and Eubacterium) with an overall decrease in total bacterial abundance [13]. However, the available evidence on diet and RA is insufficient and evidence-based nutritional guidelines for the management of RA are currently lacking. Although the importance of the Mediterranean diet pyramid recommended for the general population in autoimmune diseases is emphasised, the results are contradictory and insufficient [15,16,17]. Recently, Rondanelli et al. recently proposed an adapted food pyramid for patients with RA based on the principles of the Mediterranean diet [12]. This pyramid has important differences from the Mediterranean diet;
1. The base contains 5 portions of vegetables and fruits (indicating the most beneficial types of vegetables) instead of carbohydrates;
2. Preferably gluten-free cereals consumption,
3. Daily consumption of seeds (flaxseed, chia seeds)
4. 2 flags are added to the top of the pyramid, emphasizing that RA patients should avoid salt and simple sugar intake and that it is beneficial to take omega 3, vitamin D and antioxidant supplements [12]. This pyramid provides bioactive nutrients, including fiber, antioxidants, polyphenols, vitamins, minerals, and omega-3 polyunsaturated fats, many of which may promote beneficial health effects via the gut microbiota. The aim of this study was to determine the effects of an Ideal Food Pyramid specifically designed for RA on disease activity, biochemical analyses, body composition and gut microbiota.
2. Materials and Methods
2.1. Clinical Trial Design
This study was conducted as a single centre, open-label, randomised, controlled, clinical trial in the Rheumatology Outpatient Clinic of Erciyes University Faculty of Medicine Hospital between May 2023 and January 2024. Power analysis calculation was not performed at the beginning of the study. According to the European League Against Rheumatism (EULAR)/American College of Rheumatology (ACR) classification criteria [18]. Thirty patients (14 control and 16 diet) who were diagnosed with RA and met the inclusion criteria were included in the study and post-study power analysis was performed. The results regarding the comparison of Prevotella levels between the study groups both baseline and end of trial the intervention were statistically significant (p<0.001). Post-test power values for type-I error probability of 5% were obtained as 100% both before and after the intervention. Since these values were above 94%, it was decided to terminate the study with the current sample size. The Ideal Food Pyramid specially prepared for RA was explained to the diet group and a nutrition programme suitable for the pyramid was created. Participants in the control group were asked to maintain their usual diet. Both groups were followed up for 12 weeks. Fecal samples, blood findings, anthropometric measurements and disease activity were collected at 0 and 12 weeks and compared. Erciyes University Faculty of Medicine Clinical Research Ethics Committee approved the study ethically (Approval Number: 2022/148 Date: 23.02.2022). The study is registered at ClinicalTrials.gov ID: NCT06621927. Release Date: 2024-09-27.
2.2. Participants
Inclusion criteria,
- Being diagnosed with RA by a rheumatologist and starting disease-modifying antirheumatic drug (DMARD) treatment.
- RA disease duration longer than 1 year
- Age range 18-65 years
- Body Mass Index (BMI)=18.5-40 kg/m 2
- Smoking three and less than three cigarettes a day
Exclusion criteria
- Diabetes, cancer, inflammatory bowel disease, kidney and liver disease, psychiatric disorders
- Use biological drugs, regular users of Non Steroidal Anti-inflammatory Drugs (NSAIDs), oral cortisol intake >12.5mg.
- Those who have used a special diet, herbal supplements, vitamin-mineral supplements (except D vit.), probiotics in the last 3 months
- Those who received antibiotic treatment in the last 3 months
- Pregnant or lactating women
- Patients were included in the study on a voluntary basis and signed an informed consent form.
2.3. Dietary Intervention
An individual specific nutrition programme was prepared for the diet group in accordance with the Ideal Food Pyramid prepared by Rondanelli et al. [12]. According to the pyramid, daily consumption of 5 portions of vegetables and fruit was recommended. Especially cruciferous vegetables and green leafy vegetables, red fruits and citrus fruits were recommended. Cereals are recommended as 3 servings of whole grains per day, preferably gluten-free. Sugar and sweeteners are excluded from the diet. Extra virgin olive oil (10g), omega-3 rich flax or chia seeds (10g), nuts (30g), spices such as turmeric, ginger, chilli, cinnamon, low fat yoghurt (125g) and low fat milk (150g) are among the daily recommendations. Although daily drinking of red wine (125 g) was among the recommendations, this recommendation was not made since there was no alcohol consumption among the patients. On a weekly basis, 3 portions of fish, white meat and legumes, preferably fatty, 2 portions of eggs and cheese per week, and 1 portion of red or processed meat per week are recommended. There are two flags at the top of the pyramid: the green flag indicates that taking vitamin D, omega 3 and antioxidant supplements may be beneficial, while the red flag indicates that salt and sugar intake is prohibited. In the diet group, a telephone call was provided by a dietitian every 15 days to increase dietary adherence. The phone call provided participants with the opportunity to ask questions about the diet plan (such as preparation, cooking) and to report any negative effects. No diet application was mentioned to the control group. They were told to continue their usual diet.
2.4. Data Collection
2.4.1. Anthropometric Measurements
Body weight (kg), body fat percentage (%), lean body mass (kg) were measured using Tanita BC 418MA brand (bioelectrical impedance analysis [BIA]). Weight measurements were recorded in kg with a sensitivity of 0.1 kg. BMI=Weight (kg)/Height (m2)" formula was calculated. For BMI measurement, individuals were asked not to perform heavy physical activity 24-48 hours before, not to drink alcohol 24 hours before, to come with at least 4 hours of fasting, not to consume too much liquid (water, tea, coffee) before the analysis (at least 4 hours) and not to keep metal objects on them. Waist circumference, hip circumference, wrist circumference, neck circumference and height measurements were taken by the researchers using a non-stretchable plastic tape measure in accordance with the technique. Hand grip strength was measured to obtain information about the muscle development of the patients. The Jamar hand dynamometer, recommended by the American Association of Hand Therapists (AETD), which has high validity and reliability and is therefore considered the gold standard, was used to measure hand grip strength. Patients were measured in a sitting position, shoulder adduction and neutral rotation, forearm in mid-rotation and supported, elbow in 90-degree flexion, wrist in neutral position, each hand was measured 3 times and the average of 3 measurements was taken [19].
2.4.2. Disease Activity
Firstly, the tender and swollen joints of all patients were identified by physical examination by a rheumatologist. The composite scores DAS28-ESR and DAS28-CRP include the number of tender and swollen joints in 28 joints, the patient's estimate of their general health on the VAS, and ESR or CRP [20]. The SDAI is calculated as the numerical sum of tender and swollen joint patient general assessment, physician general assessment and CRP level (mg/dL) [21].
2.4.3. Biochemical Parameters
After overnight fasting, blood samples were taken at the beginning and end of trial. Analyses were performed in the laboratory of Erciyes University Medical Faculty Hospital. Fasting plasma glucose (FPG), total cholesterol, triglyceride, low density lipoprotein (LDL) cholesterol, high density lipoprotein (HDL) cholesterol, , urea, creatinine, uric acid, aspartate aminotransferase (AST), alanine aminotransferase (ALT) measured by spectrophotometric method in Cobos c701 (Roche Diagnostic- Basel, Switzerland) autoanalyzer, CRP was measured by immunoturbidimetric method in Cobos c701 (Roche Diagnostic- Basel, Switzerland) autoanalyzer. Sedimentation rate will be measured by Vision C ESR autoanalyzer (Shenzhen, China).
2.4.4. Fecal Sampling and 16S Ribosomal RNA Gene Sequencing
Fecal samples were collected from all participants at the baseline and end of trial the study and stored at -80°C for further processing. After sample collection was completed, Deoksiribo Nükleik Asit (DNA) isolations were performed. DNA extraction from fecal samples was performed using the Qiagen Power Soil DNA Extraction Kit (Qiagen, Hilden, Germany). Quantification of double-stranded DNA (dsDNA) was performed using the Qubit dsDNA HS Assay Kit and a Qubit 2.0 Fluorimeter (Thermo Fisher Scientific, Waltham, MA, USA). After dsDNA measurements, extracted DNA samples were stored at --20°C until needed for subsequent analysis. 16S ribosomal RNA sequencing (rRNA) was performed using the "16S Metagenomic Sequencing Library Preparation: Preparation of 16S Ribosomal RNA Gene Amplicons for the Illumina MiSeq System" was performed on an Illumina MiSeq system (Illumina, San Diego, CA, USA) following the manufacturer's protocol for "Preparation of 16S Ribosomal RNA Gene Amplicons for an Illumina MiS MiSeq System". To construct the sequencing library, V4 hypervariable regions were amplified using primer sets 515F(5'--GTGCCAGCMGCCGCGGTAA---3') and 816R (5' GGACTACHVGGGTWTCTAAT-3') [22]. For final sequencing library preparation, 15% PhiX Control (v3) (Illumina, San Diego, CA., USA) was introduced into the library. The libraries were then subjected to cluster generation and sequencing in 250PE MiSeq runs generating at least 50,000 reads per sample.
2.4.5. Bioinformatics Analysis
Pair-end Illumina reads (2x250) were imported to the qiime2 environment [23]. Quality clipping, chimera detection, and cleaning of reads implemented through the Qiime2 Dada2 pipeline (via q2-dada2) [24]. Bases that have low phred score (<Q30) were cut out. Amplicon Sequence Variants (ASV) generated by Dada2 were mapped to database [25,26]. The Phyloseq [26] object was created from qiime2 artifact files in the R 4.1 environment [27,28]. Alpha diversity assessment, which was used to evaluate the diversity of related taxonomic units in a sample, was interpreted using three different indices, including Chao1, Shannon, and Simpson. P values between groups were calculated with Kruskal-Wallis test [29]. Beta diversity analysis, used to assess taxonomic differences between individuals, was calculated based on jaccard, bray-curtis, weighted and unweighted unifrac. Beta diversity statistical significance between groups was calculated using a PERMANOVA test via the Adonis function in the vegan R package. Specific differences between groups were determined by differential abundance analysis, Deseq2 R pack [30].
2.4.6. Statistical Analysis
Histogram, q-q graphs and Shapiro-Wilk test were used to evaluate data normality. Arithmetic mean and standard deviation, median (25th-75th percentile), frequency and percentage statistics were used to summarise the data. Independent two sample t test and Mann-Whitney U test were used for intergroup comparisons of quantitative data. Dependent two-sample t test and Wilcoxon test were used to compare pre- and post-diet parameters. Fisher's exact chi-square test was used to compare categorical data. Data were analysed using TURCOSA (Turcosa Analytics Ltd Co, Turkey, www.turcosa.com.tr) statistical software. Power analyses were performed with SigmaStat 3.5 statistical software (Systat Software Inc, San Jose, CA, USA). In all statistical analyses, the confidence interval was 95% and the significance level was accepted as p<0.05.
3. Results
A total of 30 randomly selected participants (diet 16, control 14) completed the study. The mean age of the control group was 53.71±7.36 years, while the mean age of the diet group was 49.25±10.44 years. The majority of the participants were women (%86.7). There was no significant difference between the two groups in terms of demographic characteristics at baseline (p>0.005) (Table 1).
3.1. Anthropometric Measurements
At the end of the trial, significant differences were found in all anthropometric measurements between the control and diet groups (Table 2).
3.2. Biochemical Parameters
At the end of trial, there were significant differences in CRP (p<0.001), ESR (p<0.001), LDL cholesterol (p=0.013) and total cholesterol (p=0.008) values between the diet and control groups. Uric acid decreased significantly in the diet group at the end of the trial (p=0.038) (Table 3).
3.3. Disease Activity
At the end of the twelve week dietary intervention, the number of tender joints decreased significantly (p<0.001). DAS28-ESR, DAS28-CRP and SDAI, which are scales used to determine the activity score of RA disease, decreased significantly in the diet group compared to baseline (p < 0.00, p<0.001, p=0.008, respectively) (Table 4).
3.4. Fecal Microbiota Composition
At the phylum level, in the diet group, at the end of 12 weeks, the abundances of Firmicutes (%45.184-%50.916), Actinobacteria (%0.927-%0.996), Verrucomicrobia (%0.434-%1.341), Elusimicrobia (%0.002-%0.238) and Euryarchaeota (%0.004-%0.119) increased, while the abundances of Bacteroidetes (%43.43-%42.682), Proteobacteria (%5.923-%3.011), Fusobacteria (%3.251-%0.009), Cyanobacteria (%0.35-%0.234) and Tenericutes (%0.401-%0.328) decreased. In the control group, Firmucutes (%47.651-%38.633), Proteobacteria (%4.393-%4.231), Actinobacteria (%1.723-%1.137), Cyanobacteria (%0.407-%0.07) decreased, while Bacteroidetes (%44.988-%55.63) and Verrucomicrobia (%0.605-%0.173) increased (Figure 1A).
Figure 1. Taxonomic analysis of microbiomes: Phylum (A), Genus (B) and Species (C) levels.
Microbiota composition is shown Figure 1B and Figure 1C according to genus and species levels. At the end of the trial, in the diet group, the genus levels of Prevotella (%28,134-%25,234), Bacteroides (%20,806-%19,511), Lachnospira (%5,635-%5,001), Clostridium (%2,021-%0,54), Blautia (%1,976-%1,573), Sutterella (%1,494-%0.896), Stretococcus (%0.594-%0.338), Lactobacillus (%0.233-%0.043), Collinsella (%0.242- %0.141) decreased in abundance; Faecalibacterium (%13.023 - %16.844), Roseburia (%4.002% -% 4.615), Oscillospira (%3.406 - %4.061), Ruminococcus (%2.185 - %3.519), Akkermansia (%0.547-%1.61), Coprococcus (%1.888-%2.887), Parabacteroides (%0.919-%1.457), Gemmiger (%0.988-%1.136), increased. (%0.988-%1.136), increased. In the control group, at the end of trial; Prevotella (%25.783-%38.719), Megasphaera (%1.185-%2.513), Alistipes (%0.85-%1.254), Oscillospira (%2.63-%2.879) relative abundances increased while Bacteroides (%19.953, %17.972), Faecalibacterium (%13.209-%12.759), Coprococcus (%5.452-%1.587), Parabacteroides (%2.97-%2.23), Blautia (%3.082-%1.172), Blautia (%3.082-%1.172), Gemmiger (%2.182-%0.972), Ruminococcus (%2.405-%2.253), Sutterella (%1.813-%1.258), Bifidobacterium (%1.258-%1.016), Lachnospira (%2.04-%1.199), Dorea (%1.102-%0.395), Akkermansia (%0.732-%0.166) relative abundances decreased.
At the species level, in the diet group, Prevotella copri (44.112% - 39.508%), Bacteroides fragilis (3.494% - 2.539%), Prevotella stercorea (3.582% - 1.621%), Bacteroides uniformis (3.114% - 2.962%), [Ruminococcus] gnavus ( 2.293%-0.611%), [Eubacterium] dolichum (1.145%-0.01%) species decreased; Faecalibacterium prausnitzii (22.419% - 28.151%), Roseburia faecis (2.322% - 3.611%), Bacteroides ovatus (0.795% - 2.84%), Akkermansia muciniphila (0.947% - 2.71%) increased. In the control group, at the end of trial, Prevotella Copri (45.02%-56.228%), Bacteroides ovatus (2.915%-3.755%), Roseburia faecis (2.497%-2.869%), while the relative abundance of its species increases; Faecalibacterium prausnitzii (23.153%-18.752%), Gemmiger formicilis (3.856%-1.435%), Bacteroides uniformis (2.905%-2.838%), Parabacteroides distasonis (2.326%-1.212%), Ruminococcus bromii (1.439%-1.241%), Akkermansia muciniphila (1.293%-0.244%), species have decreased in relative abundance. Bar plot representation of family, order and class levels of bacteria are given in the supplementary material (Appendix A1, Appendix A2 and Appendix A3, respectively).
3.5. Alpha and Beta Diversity
Although the median of the Amplicon Sequence Variant (ASV) value in the fecal samples taken at the end of trial in the diet group was higher than baseline, no significant difference was found in the Simpson and Shannon index of ASV levels (p=0.26, p=0.51, respectively). Simpson is an alpha measurement expressing the diversity of species. In the control group, the species dominance distribution in the 25th and 75th percentile ranges is similar in the baseline and end-of-trial fecal sample data (p=0.92) (Figure 2A). The Shannon index is a measure of uniformity and richness that takes entropy into account. At the end of trial, the Shannon index increased in the diet group (p=0.51) and decreased in the control group (p=0.98) (Figure 2B). Beta diversity measurements were used to compare differences in community composition of two different samples. According to Bray-Curtis (Figure 2C), Jaccard (Figure 2D) and unweighted UniFrac (Figure 2E), Principal coordinate analysis (PCoA) results, there is no statistically significant difference in microbial diversity between or within the control and diet group at baseline and at the end of trial.
Figure 2. Alpha diversity analysis and Beta diversity analysis.
4. Discussion
Our study is the first study to apply the Ideal Food Pyramid created for RA. In our study, we first showed that the diversity, composition and richness of the gut microbiota in the group of RA patients that applied a diet were different from the control group that did not apply a diet. These findings suggest that the gut microbiota composition may be affected by dietary intervention. In addition, the ideal food pyramid created for RA patients has shown positive effects on anthropometric measurements, disease activity and some biochemical markers. Diet has received significant attention as a potential environmental factor influencing the prognosis of RA [31]. Research data strongly suggests that diets with anti-inflammatory properties, such as the Mediterranean diet, which is rich in fish, vegetables, and fruits, may help improve symptoms and/or delay the onset of RA. Therefore, nutrition should be routinely addressed to facilitate disease management in RA [15,32]. Given that various abnormalities have been identified in the gut microbiota of RA patients and that a healthy diet can influence gut dysbiosis, diet is an important part of RA disease treatment [33]. The production of SCFA is one of the mechanisms by which the gut microbiota has been proposed to influence the differentiation of Treg cells and systemic inflammation [34]. SCFAs are a source of energy for intestinal epithelial cells, which have an indirect anti-inflammatory effect by improving tight junction assembly and enhancing intestinal barrier function. SCFAs, especially butyrate, acetate and propionate, are essential metabolites resulting from microbial fermentation of dietary fibres [34]. The positive effects of the Ideal Food Pyramid on microbiota may be due to its high content of dietary fibre, polyphenols and omega-3 fatty acids. The Ideal Food Pyramid rich in fibre includes vegetables, fruits, seeds, nuts and legumes, which are 'microbiota-accessible carbohydrates' (MAC). MACs may support the growth of SCFA-producing species and alter the gut microbiota [35]. In addition to dietary fiber, most polyphenols reach the intestine, where they are either absorbed or undergo extensive gastrointestinal biotransformation. They exert localized interactions with the microbiota and regulate the inflammatory, oxidative, and immune status of the gut epithelial layer [36]. ω-3 fatty acids also promote the production and secretion of intestinal alkaline phosphatase, which leads to changes in the composition of the intestinal microbiota. In addition, ω-3 fatty acids reduce lipopolysaccharide production and intestinal permeability, reducing inflammation and endotoxemia [37]. Although the literature is not consistent, there is a lot of evidence linking RA to dysbiotic gut disorders. However, there is a common finding across studies; there is an increase in the genus Prevotella, and particularly the species Prevotella Copri, in patients with early RA [38,39]. Chen et al. found high amounts of Prevotella copri in facal samples from patients with recent-onset RA [10]. Similarly, Seifert et al. showed that RA patients had significantly higher serum levels of anti-Pc-p27 IgA and anti-Pc-p27 IgG antibodies (immunogenic P. copri 27 kDa protein) than controls [40]. The mechanisms suggested to contribute to the pathogenesis of RA by Prevotella copri include induction of inflammatory responses and molecular mimicry [6]. In our present study, in accordance with these data, Prevotella genus and Prevotella copri species, which were at high levels at the beginning, decreased with dietary intervention. In the control group, both increased.
Faecalibacterium and Roseburia genera are decreased in RA and other inflammatory conditions [33,41]. Bacteria belonging to this genus are well-known butyrate producers, help to maintain the integrity and health of the intestinal epithelial barrier and show anti-inflammatory properties [41]. In addition, Faecalibacterium prausnitzii (F. prausnitzii), a species of the Faecalibacterium genus that is an important member of the human commensal gut microbiota with reduced abundance in RA patients, has been shown to maintain Th17/Treg balance and intestinal barrier function, and also exhibit significant anti-inflammatory effects [42]. F. prausnitzii reduces arthritis score, joint tissue damage, and the number of systemic immune cells secreting IL-17. In addition, it affects the composition of the gut microbiome and causes changes in SCFA concentrations. IL-1β, IL-17, and TNF-α levels were decreased in mice treated with F. prausnitzii. Therefore, F. prausnitzii may have a potential therapeutic effect in RA [43]. Although studies on microbiota in RA are limited, most of them are animal studies. In addition, the number of studies on the effect of diet on microbiota is very few. In a recent literature review, it was determined that dietary elements such as fibres, polysaccharides, resistant starch and peptides given to experimental animals were effective in the fight against RA [44].
When studies on humans are analysed, Peltonen et al. [45] conducted a study on 53 RA patients and found a significant change in gut flora after a one-year transition from a traditional diet to a vegan and then lactovegetarian diet. They also noticed a significant difference between the microbiota of test subjects in the high-low improvement group, suggesting a direct link between gut microbiota and disease activity levels. In a 2005 study, the authors reported that the Mediterranean diet or fasting treatments did not affect the gut microbiota in RA patients [46]. In a more recent study, RA patients with high adherence to the Mediterranean diet were shown to have a healthier gut microbiota. Almost complete absence of P. copri was observed compared to the low/medium compliance group [47].
To our knowledge, this comprehensive study is the first to investigate the protective effects of the Ideal Food Pyramid for RA patients on disease activity, biochemical parameters, anthropometric measurements and gut microbiota in RA patients. This protective effect is probably due to the RA-specific recommendations of the pyramid (anti-inflammatory, antioxidant, prebiotic content). Personalised nutrition and dietary guidance may improve diet quality and disease management.
Although this pyramid is similar to the Mediterranean pyramid recommended for the general population, there are important differences. The base of the pyramid emphasises the consumption of vegetables and fruit instead of carbohydrates (with particular reference to the types to be eaten) and carbohydrates preferably gluten-free. At the top of the pyramid is a red flag indicating that salt and sugar should be avoided and a green flag indicating that vitamin D, omega-3 and antioxidant supplements are beneficial. Our study has some limitations. The lack of blinding represents a potential bias that needs to be taken into account. Dietary intervention studies are difficult to implement and follow up. Although follow-up is done, it is also difficult to ensure compliance with the diet. Perhaps a compliance scale could be created to assess dietary adherence.
5. Conclusions
In conclusion, the Ideal Food Pyramid applied to RA patients for 12 weeks has positive effects on inflammation, lipid profiles, anthropometric measurements, disease activities, and especially on the gut microbiota. The evidence obtained from this study highlights the promising role of disease-specific tailored dietary intervention in regulating the gut microbiota as a complementary approach to traditional RA treatments. Focusing on diet to improve intestinal barrier function and modify dysbiosis in the microbiota may become an important part of “preventive” nutritional strategies. This is a valuable study as it is the first study to demonstrate the effect of this pyramid specifically created for RA on the microbiota. In the future, randomized clinical trials with larger sample sizes using the Ideal Food Pyramid in RA are needed to confirm our results.
Supplementary Materials
The following supporting information can be downloaded at the website of this paper posted on Preprints.org.
Author Contributions
The individual contributions of all authors are as follows: “Conceptualization, Ü.KM, B.Ç and G.C; methodology, Ü.KM, B.Ç and G.C; software, Ü.KM, B.Ç and G.C ; validation, Ü.KM, B.Ç and G.C; formal analysis, Ü.KM; investigation, Ü.KM; resources, Ü.KM; data curation, Ü.KM; writing—original draft preparation, Ü.KM; writing—review and editing, Ü.KM, B.Ç and G.C visualization, Ü.KM; supervision, Ü.KM; project administration, Ü.KM; funding acquisition, B.Ç;. All authors have read and agreed to the published version of the manuscript.”.
Funding
This study was granted by Erciyes University Scientific Research Fund under the code of TDK-2022-11834.
Institutional Review Board Statement
Erciyes University Faculty of Medicine Clinical Research Ethics Committee approved the study ethically (Approval Number: 2022/148 Date: 23.02.2022). The study is registered at ClinicalTrials.gov ID: NCT06621927. Release Date: 2024-09-27.
Informed Consent Statement
Informed consent was obtained from all subjects involved in the study.
Data Availability Statement
Authors agree to participate all data, if requested.
Acknowledgments
The authors would like to thank the participants for their involvement in the study. Also, thanks to Erciyes University Scientific Research Projects Unit for their support.
Conflicts of Interest
The authors declare no conflicts of interest.
Abbreviations
The following abbreviations are used in this manuscript:
| RA | Romatoid Artrit |
| Th17 | T helper 17 |
| SCFA | Short-Chain Fatty Acid |
| DAS28-ESR | Disease Activity Score-28 Erythrocyte Sedimentation Rate |
| DAS28-CR | Disease Activity Score-28-C Reactive Protein |
| SDAI | Simple Disease Activity Index |
| EULAR | European League Against Rheumatism |
| ACR | American College of Rheumatology |
| DMARD | Disease-Modifying Antirheumatic Drug |
| BMI | Body Mass Index |
| NSAIDs | Non Steroidal Anti-inflammatory Drugs |
| BIA | Bioelectrical Impedance Analysis |
| AETD | American Association of Hand Therapists |
| FPG | Fasting plasma glucose |
| LDL | Low Density Lipoprotein |
| HDL | High Density Lipoprotein |
| AST | Aspartate Aminotransferase |
| ALT | Alanine Aminotransferase |
| DNA | Deoksiribo Nükleik Asit |
| dsDNA | double-stranded Deoksiribo Nükleik Asit |
| rRNA | ribosomal Ribo Nükleik Asit |
| ASV | Amplicon Sequence Variants |
| MAC | Microbiota-Accessible Carbohydrates |
References
- Choy, E. Understanding the dynamics: pathways involved in the pathogenesis of rheumatoid arthritis. Rheumatology 2012, 51, v3–v11. [Google Scholar] [CrossRef] [PubMed]
- Venetsanopoulou, A.I.; Alamanos, Y.; Voulgari, P.V.; Drosos, A.A. Epidemiology and Risk Factors for Rheumatoid Arthritis Development. Mediterr. J. Rheumatol. 2023, 34, 404–413. [Google Scholar] [CrossRef] [PubMed]
- Tedeschi, S.K.; Frits, M.; Cui, J.; Zhang, Z.Z.; Mahmoud, T.; Iannaccone, C.; Lin, T.; Yoshida, K.; Weinblatt, M.E.; Shadick, N.A.; et al. Diet and Rheumatoid Arthritis Symptoms: Survey Results From a Rheumatoid Arthritis Registry. Arthritis Care Res. 2017, 69, 1920–1925. [Google Scholar] [CrossRef] [PubMed]
- McInnes, I.B.; Schett, G. The pathogenesis of rheumatoid arthritis. N Engl J Med 2011, 365, 2205–19. [Google Scholar] [CrossRef]
- Alemao, C.A.; Budden, K.F.; Gomez, H.M.; Rehman, S.F.; Marshall, J.E.; Shukla, S.D.; Donovan, C.; Forster, S.C.; Yang, I.A.; Keely, S.; et al. Impact of diet and the bacterial microbiome on the mucous barrier and immune disorders. Allergy 2020, 76, 714–734. [Google Scholar] [CrossRef]
- Reyes-Castillo, Z.; Valdés-Miramontes, E.; Llamas-Covarrubias, M.; Muñoz-Valle, J.F. Troublesome friends within us: the role of gut microbiota on rheumatoid arthritis etiopathogenesis and its clinical and therapeutic relevance. Clin. Exp. Med. 2020, 21, 1–13. [Google Scholar] [CrossRef]
- Wu, H.J.; Ivanov, I.I.; Darce, J; Hattori, K.; Shima, T.; Umesaki, Y.; Littman, D.R.; Benoist, C.; Mathis, D. Gut-residing segmented filamentous bacteria drive autoimmune arthritis via T helper 17 cells. Immunity 201, 32, 815–827. [Google Scholar] [CrossRef]
- Zheng, D.; Liwinski, T.; Elinav, E. Interaction between microbiota and immunity in health and disease. Cell Res. 2020, 30, 492–506. [Google Scholar] [CrossRef]
- Allam-Ndoul, B.; Castonguay-Paradis, S.; Veilleux, A. Gut Microbiota and Intestinal Trans-Epithelial Permeability. Int. J. Mol. Sci. 2020, 21, 6402. [Google Scholar] [CrossRef]
- Chen J, Wright K, Davis JM, Jeraldo P, Marietta EV, Murray J, Nelson H, Matteson EL, Taneja V. An expansion of rare lineage intestinal microbes characterises rheumatoid arthritis. Genome Med 2016, 8, 43. [CrossRef]
- Wells, P.M.; Adebayo, A.S.; E Bowyer, R.C.; Freidin, M.B.; Finckh, A.; Strowig, T.; Lesker, T.R.; Alpizar-Rodriguez, D.; Gilbert, B.; Kirkham, B.; et al. Associations between gut microbiota and genetic risk for rheumatoid arthritis in the absence of disease: a cross-sectional study. Lancet Rheumatol. 2020, 2, e418–e427. [Google Scholar] [CrossRef] [PubMed]
- Rondanelli, M.; Perdoni, F.; Peroni, G.; Caporali, R.; Gasparri, C.; Riva, A.; Petrangolini, G.; Faliva, M.A.; Infantino, V.; Naso, M.; et al. Ideal food pyramid for patients with rheumatoid arthritis: A narrative review. Clin. Nutr. 2020, 40, 661–689. [Google Scholar] [CrossRef] [PubMed]
- Singh RK, Chang HW, Yan D, Lee KM, Ucmak D, Wong K, Abrouk M, Farahnik B, Nakamura M, Zhu TH, Bhutani T and Liao W. Infuence of diet on the gut microbiome and implications for human health. J Transl Med 2017, 15, 73.
- Illiano, P.; Brambilla, R.; Parolini, C. The mutual interplay of gut microbiota, diet and human disease. FEBS J. 2020, 287, 833–855. [Google Scholar] [CrossRef]
- Gunes-Bayir, A.; Mendes, B.; Dadak, A. The Integral Role of Diets Including Natural Products to Manage Rheumatoid Arthritis: A Narrative Review. Curr. Issues Mol. Biol. 2023, 45, 5373–5388. [Google Scholar] [CrossRef]
- Michalsen, A.; Riegert, M.; Lüdtke, R.; Bäcker, M.; Langhorst, J.; Schwickert, M.; Dobos, G.J. Mediterranean diet or extended fasting's influence on changing the intestinal microflora, immunoglobulin A secretion and clinical outcome in patients with rheumatoid arthritis and fibromyalgia: an observational study. BMC Complement. Altern. Med. 2005, 5, 22. [Google Scholar] [CrossRef]
- Sundström, B.; Johansson, I.; Rantapää-Dahlqvist, S. Diet and alcohol as risk factors for rheumatoid arthritis: a nested case–control study. Rheumatol. Int. 2014, 35, 533–539. [Google Scholar] [CrossRef]
- Aletaha D, Neogi T, Silman AJ, Funovits J, Felson DT, O Bingham C 3rd, Birnbaum NS, Burmester GR, Bykerk VP, Cohen MD, Combe B, Costenbader KH, Dougados M, Emery P, Ferraccioli G, Hazes JMW, Hobbs K, Huizinga TWJ, Kavanaugh A, Kay J, Kvien TK, Laing T, Mease P, Ménard HA, Moreland LW, Naden RL, T, Pincus T, Smolen JS, Stanislawska-Biernat E, Symmons D, Tak PP, Upchurch KS, Vencovsky J, Wolfe F, Hawker G. 2010 rheumatoid arthritis classification criteria: An american college of rheumatology/european league against rheumatism collaborative initiative. Ann Rheum Dis 2010, 69, 1580–1588.
- Lam, N.; Goh, H.; Kamaruzzaman, S.; Chin, A.; Poi, P.; Tan, M. Normative data for hand grip strength and key pinch strength, stratified by age and gender for a multiethnic Asian population. Singap. Med J. 2016, 57, 578–584. [Google Scholar] [CrossRef]
- van Riel PLCM. The development of the disease activity score (DAS) and the disease activity score using 28 joint counts (DAS28). Clin Exp Rheumatol 2014, 32, S-65-74.
- Aletaha, D.; Ward, M.M.; Machold, K.P.; Nell, V.P.K.; Stamm, T.; Smolen, J.S. Remission and active disease in rheumatoid arthritis: Defining criteria for disease activity states. Arthritis Rheum. 2005, 52, 2625–2636. [Google Scholar] [CrossRef] [PubMed]
- Caporaso, J.G.; Lauber, C.L.; Walters, W.A.; Berg-Lyons, D.; Huntley, J.; Fierer, N.; Owens, S.M.; Betley, J.; Fraser, L.; Bauer, M.; et al. Ultra-high-throughput microbial community analysis on the Illumina HiSeq and MiSeq platforms. ISME J. 2012, 6, 1621–1624. [Google Scholar] [CrossRef] [PubMed]
- Bolyen, E.; Rideout, J.R.; Dillon, M.R.; Bokulich, N.A.; Abnet, C.C.; Al-Ghalith, G.A.; Alexander, H.; Alm, E.J.; Arumugam, M.; Asnicar, F.; et al. Reproducible, Interactive, Scalable and Extensible Microbiome Data Science using QIIME 2. Nat. Biotechnol. 2019, 37, 852–857. [Google Scholar] [CrossRef] [PubMed]
- Callahan, B.J.; Mcmurdie, P.J.; Rosen, M.J.; Han, A.W.; Johnson, A.J.A.; Holmes, S.P. DADA2: High-resolution sample inference from Illumina amplicon data. Nat. Methods 2016, 13, 581–583. [Google Scholar] [CrossRef]
- Schloss, P.D. Amplicon Sequence Variants Artificially Split Bacterial Genomes into Separate Clusters. mSphere 2021, 6, e0019121. [Google Scholar] [CrossRef]
- Werner, J.J.; Koren, O.; Hugenholtz, P.; DeSantis, T.Z.; A Walters, W.; Caporaso, J.G.; Angenent, L.T.; Knight, R.; E Ley, R. Impact of training sets on classification of high-throughput bacterial 16s rRNA gene surveys. ISME J. 2011, 6, 94–103. [Google Scholar] [CrossRef]
- McMurdie, P.J.; Holmes, S. phyloseq: An R package for reproducible interactive analysis and graphics of microbiome census data. PLoS ONE 2013, 8, e61217. [Google Scholar] [CrossRef]
- Koffi, J.-M.N.; Koffi, K.K.; Bonny, S.B.; Bi, A.I.Z. Genetic Diversity of Taro Landraces from Côte d’Ivoire Based on Qualitative Traits of Leaves. Agric. Sci. 2021, 12, 1433–1446. [Google Scholar] [CrossRef]
- Kruskal, William H, and W. Allen Wallis. "Use of ranks in one-criterion variance analysis.". Journal of the American statistical Association 1952, 47, 583–621. [CrossRef]
- Love MI, Huber W, Anders S. Moderated estimation of fold change and dispersion for RNA-seq data with DESeq2. Genome Biol 2014, 15, 550.
- Philippou, E.; Nikiphorou, E. Are we really what we eat? Nutrition and its role in the onset of rheumatoid arthritis. Autoimmun. Rev. 2018, 17, 1074–1077. [Google Scholar] [CrossRef] [PubMed]
- Bäcklund, R.; Drake, I.; Bergström, U.; Compagno, M.; Sonestedt, E.; Turesson, C. Diet and the risk of rheumatoid arthritis – A systematic literature review. Semin. Arthritis Rheum. 2022, 58, 152118. [Google Scholar] [CrossRef] [PubMed]
- Picchianti-Diamanti, A.; Panebianco, C.; Salemi, S.; Sorgi, M.L.; Di Rosa, R.; Tropea, A.; Sgrulletti, M.; Salerno, G.; Terracciano, F.; D’amelio, R.; et al. Analysis of Gut Microbiota in Rheumatoid Arthritis Patients: Disease-Related Dysbiosis and Modifications Induced by Etanercept. Int. J. Mol. Sci. 2018, 19, 2938. [Google Scholar] [CrossRef] [PubMed]
- Koh A, De Vadder F, Kovatcheva-Datchary P, Bäckhed F. From Dietary Fibre to Host Physiology: Short-Chain Fatty Acids as Key Bacterial Metabolites. Cell 2016, 165, 1332–1345. [CrossRef]
- Merra G, Noce A, Marrone G, Cintoni M, Tarsitano MG, Capacci A De Lorenzo A. Influence of Mediterranean Diet on Human Gut Microbiota. Nutrients 2020, 13, 7.
- Deiana, M.; Serra, G.; Corona, G. Modulation of intestinal epithelium homeostasis by extra virgin olive oil phenolic compounds. Food Funct. 2018, 9, 4085–4099. [Google Scholar] [CrossRef]
- Kaliannan, K.; Wang, B.; Li, X.-Y.; Kim, K.-J.; Kang, J.X. A host-microbiome interaction mediates the opposing effects of omega-6 and omega-3 fatty acids on metabolic endotoxemia. Sci. Rep. 2015, 5, 11276. [Google Scholar] [CrossRef]
- Kishikawa, T.; Maeda, Y.; Nii, T.; Motooka, D.; Matsumoto, Y.; Matsushita, M.; Matsuoka, H.; Yoshimura, M.; Kawada, S.; Teshigawara, S.; et al. Metagenome-wide association study of gut microbiome revealed novel aetiology of rheumatoid arthritis in the Japanese population. Ann. Rheum. Dis. 2020, 79, 103–111. [Google Scholar] [CrossRef]
- Maeda, Y.; Kurakawa, T.; Umemoto, E.; Motooka, D.; Ito, Y.; Gotoh, K.; Hirota, K.; Matsushita, M.; Furuta, Y.; Narazaki, M.; et al. Dysbiosis Contributes to Arthritis Development via Activation of Autoreactive T Cells in the Intestine. Arthritis Rheumatol. 2016, 68, 2646–2661. [Google Scholar] [CrossRef]
- Seifert JA, Bemis EA, Ramsden K, et al. Association of antibodies to Prevotella copri in anti-cyclic citrullinated peptide-positive individuals at risk of developing rheumatoid arthritis and in patientswith early or established rheumatoid arthritis. Arthritis Rheumatol 2023, 75, 507–516. [CrossRef]
- Arvonen, M.; Berntson, L.; Pokka, T.; Karttunen, T.J.; Vähäsalo, P.; Stoll, M.L. Gut microbiota-host interactions and juvenile idiopathic arthritis. Pediatr. Rheumatol. 2016, 14, 44. [Google Scholar] [CrossRef] [PubMed]
- Zhou L, Zhang M, Wang Y, Dorfman RG, Liu H, Yu T, et al. Faecalibacterium prausnitzii produces butyrate to maintain Th17/Treg balance and to ameliorate colourectal colitis by inhibiting histone deacetylase Inflammation Bowel Dis 2018, 24, 1926–40.
- Moon, J.; Lee, A.R.; Kim, H.; Jhun, J.; Lee, S.-Y.; Choi, J.W.; Jeong, Y.; Park, M.S.; Ji, G.E.; Cho, M.-L.; et al. Faecalibacterium prausnitzii alleviates inflammatory arthritis and regulates IL-17 production, short chain fatty acids, and the intestinal microbial flora in experimental mouse model for rheumatoid arthritis. Arthritis Res. Ther. 2023, 25, 1–12. [Google Scholar] [CrossRef]
- Zhang, X.; et al. The oral and gut microbiomes are perturbed in rheumatoid arthritis and partially normalised after treatment. Nat Med 2015, 21, 895–905. [Google Scholar] [CrossRef]
- Peltonen, R.; Kjeldsen-Kragh, J.; Haugen, M.; Tuominen, J.; Toivanen, P.; Førre, Ø.; Eerola, E. CHANGES OF FAECAL FLORA IN RHEUMATOID ARTHRITIS DURING FASTING AND ONE-YEAR VEGETARIAN DIET. Rheumatology 1994, 33, 638–643. [Google Scholar] [CrossRef]
- Michalsen, A.; Riegert, M.; Lüdtke, R.; Bäcker, M.; Langhorst, J.; Schwickert, M.; Dobos, G.J. Mediterranean diet or extended fasting's influence on changing the intestinal microflora, immunoglobulin A secretion and clinical outcome in patients with rheumatoid arthritis and fibromyalgia: an observational study. BMC Complement. Altern. Med. 2005, 5, 22. [Google Scholar] [CrossRef]
- Diamanti, A.P.; Panebianco, C.; Salerno, G.; Di Rosa, R.; Salemi, S.; Sorgi, M.L.; Meneguzzi, G.; Mariani, M.B.; Rai, A.; Iacono, D.; et al. Impact of Mediterranean Diet on Disease Activity and Gut Microbiota Composition of Rheumatoid Arthritis Patients. Microorganisms 2020, 8, 1989. [Google Scholar] [CrossRef]
Figure 1.
Intestinal microbiota composition of the study groups at phylum, species and genus levels. Bacterial community relative abundance analysis at the phylum (1A), genus (1B) and species (1C) levels (relative abundance>1%; bacteria with relative abundances<1% were pooled in the “others” category and sorted by total concentration.
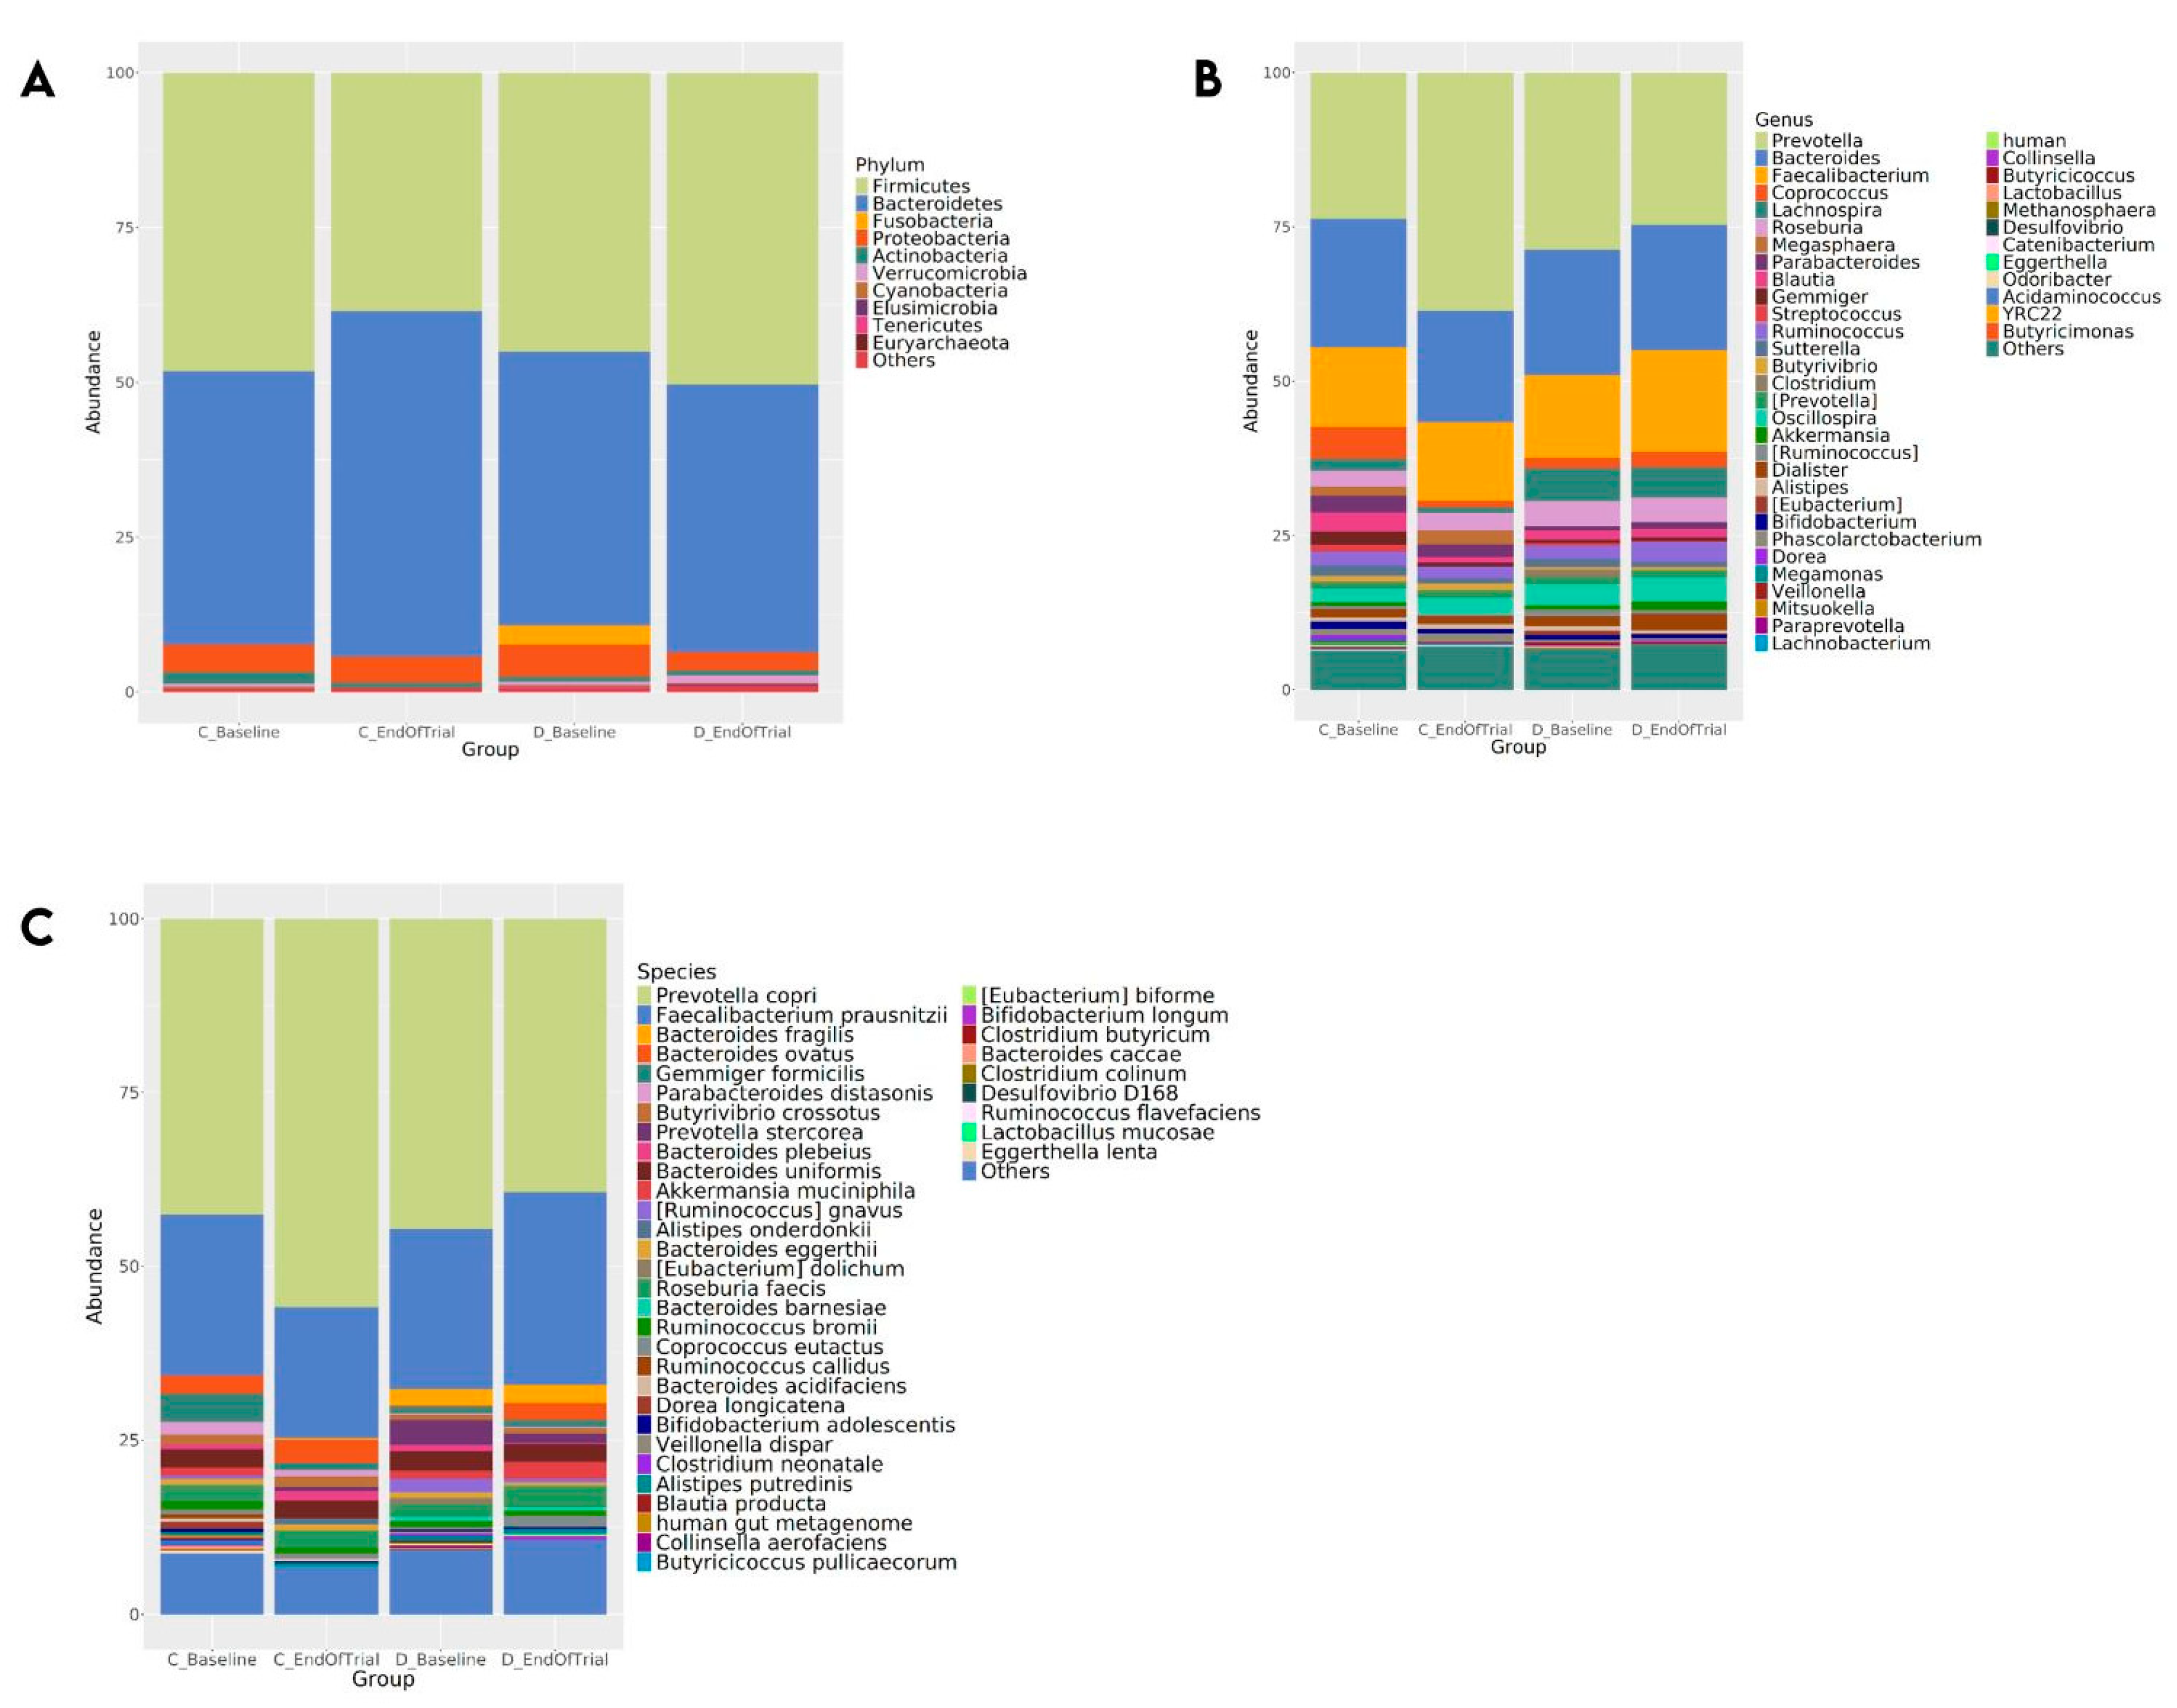
Figure 2.
Simpson index (2A) and Shannon index (2B) plotted by the treatment group and time point. The box spans the first and third quartiles. A horizontal line marks the median and the whiskers represent ±1.5 times the interquartile range. Outlier (panel b) is marked as individual point. Figure 2C,2D,2E shows PCoA 2D plots of beta diversity analysis of diet (baseline-end of trial) and control groups (baseline-end of trial). Each dot represents a fecal sample. Red circle, green triangle, blue square and purple plus represent control_baseline, control_post, diet_baseline and post_diet, respectively. C-E Differences between samples were measured by Bray-Curtis distances (2C), Jaccard distance (2D) and unweighted UniFrac distances (2E). The groups showed clustering in similar areas in Bray-Curtis (2C), Jaccard (2D) and unweighted UniFrac (2E) baseline coordinate analysis (PCoA) results.
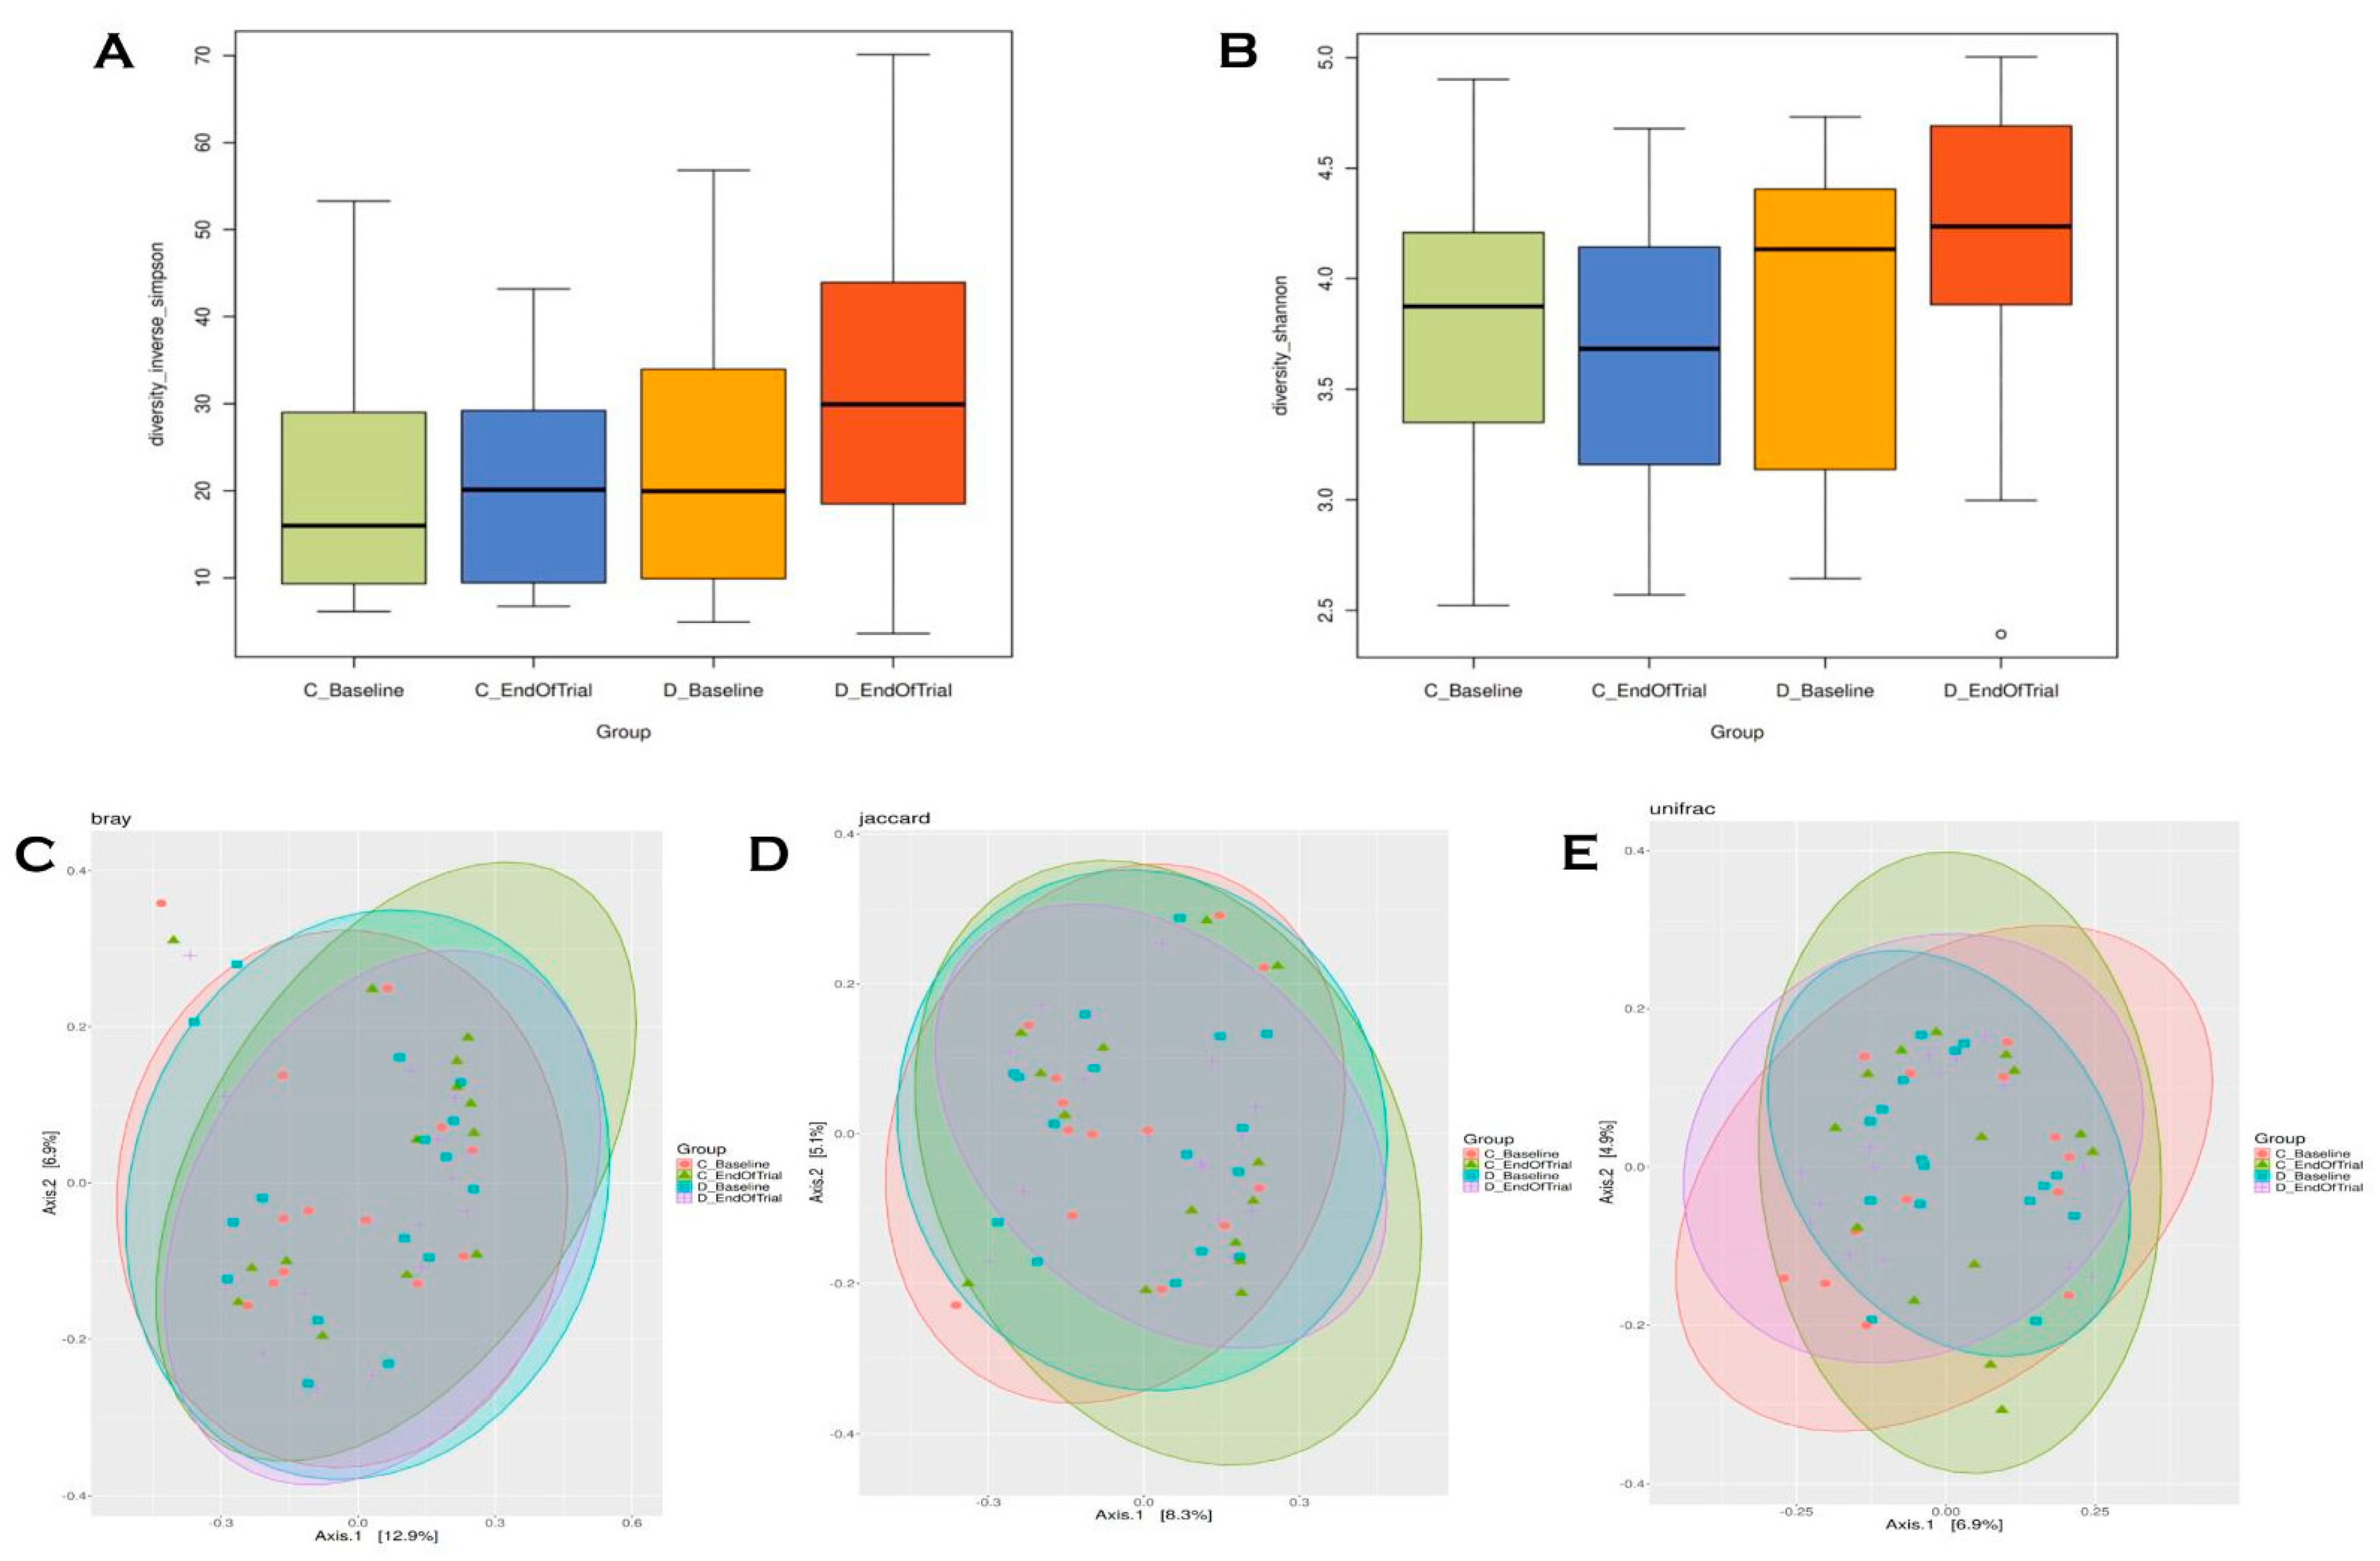

Table 1.
Patients' characteristics.
| Variables | Control (n=14) |
Diet (n=16) |
Total (n=30) |
p |
|---|---|---|---|---|
| Age | 53.71±7.36 | 49.25±10.44 | 51.33±9.26 | 0.193 |
| Sex | 1.000 | |||
| Female | 12 (%85.7) | 14 (%87.5) | 26 (%86.7) | |
| Male | 2 (%14.3) | 2 (%12.5) | 4 (%13.3) | |
| Place of residence | 1.000 | |||
| Urban | 13 (%92.9) | 15 (%3.8) | 28 (%93.3) | |
| Rural | 1 (%7.1) | 1 (%6.3) | 2 (%6.7) | |
| Marital status | 0.814 | |||
| Married | 11 (%78.6) | 13 (%81.3) | 24 (%80.0) | |
| Single | 0 (%0) | 1 (%6.3) | 1 (%3.3) | |
| 3 (%21.4) | 2 (%12.5) | 5 (%16.7) | ||
| Level of education | 0.200 | |||
| Primary School | 7 (%50.0) | 8 (%50.0) | 15 (%50.0) | |
| Middle School | 3 (%21.4) | 0 (%0) | 3 (%10.0) | |
| High School | 4 (%28.6) | 6 (%37.5) | 10(%33.3) | |
| University | 0 (%0) | 2 (%12.5) | 2 (%6.7) | |
| Employment | 0.814 | |||
| Housewife | 11 (%78.6) | 13 (%81.3) | 24 (%80.0) | |
| Full-time job | 2 (%14.3) | 3 (%18.8) | 5 (%16.7) | |
| Retired | 1 (%7.1) | 0 (%0) | 1 (%3.3) | |
| Socioeconomic status | 0.840 | |||
| Low | 5 (%35.7) | 4 (%25.0) | 9 (%30.0) | |
| Medium | 9 (%64.3) | 11 (%68.8) | 20 (%66.7) | |
| High | 0 (%0) | 1 (%6.3) | 1 (%3.3) | |
| Mode of delivery | ||||
| Vaginal birth | 14 (%100.0) | 16 (%100.0) | 30 (%100.0) | |
| Caesarean section | 0 (%0) | 0 (%0) | 0 (%0) | |
| Duration of breastfeeding (months) | 8.00±9.98 | 13.40±7.72 | 11.38±8.73 | |
| Physical activity | 0.440 | |||
| Inactive | 11 (%78.6) | 10 (%62.5) | 21 (%70.0) | |
| Minimal active | 3 (%21.4) | 6 (%37.5) | 9 (%30.0) | |
| Active | 0 (%0) | 0 (%0) | 0 (%0) | |
| Gingivitis | 1 (%7.1) | 2 (%12.5) | 3 (%10.0) | 1.000 |
| RA Disease Duration (Years) | 13.21±6.69 | 11.56±8.49 | 12.33±7.62 | 0.563 |
| Sleep duration (hours) | 6.57±1.28 | 7.13±1.26 | 6.87±1.28 | 0.244 |
Data are expressed as percentage (%) or mean±standard deviation.
Table 2.
Anthropometric Measurements.
| Parameters | Control (n=14) |
Diet (n=16) |
p |
|---|---|---|---|
| Body weight (kg) | |||
| Baseline | 79.75±12.80 | 75.26±13.52 | |
| End of trial | 80.96±13.14 | 73.81±13.49 | |
| p‡ | 0.009 | 0.020 | |
| Change | -1.20±1.46 | 1.45±2.22 | 0.001 |
| BMI (kg/m2) | |||
| Baseline | 31.44±6.06 | 29.18±4.90 | |
| End of trial | 31.93±6.31 | 28.57±4.69 | |
| p‡ | 0.012 | 0.015 | |
| Change | -0.49±0.62 | 0.61±0.89 | 0.001 |
| Percent fat (%) | |||
| Baseline | 37.04±7.24 | 35.74±7.81 | |
| End of trial | 42.91±10.20 | 33.70±7.99 | |
| p‡ | 0.001 | 0.014 | |
| Change | -5.87±5.31 | 2.04±2.93 | 0.000 |
| Fat mass (kg) | |||
| Baseline | 30.12±9.49 | 27.33±9.87 | |
| End of trial | 35.51±13.08 | 25.48±9.92 | |
| p‡ | 0.003 | 0.008 | |
| Change | -5.39±5.46 | 1.86±2.42 | 0.000 |
| Muscle mass (kg) | |||
| Baseline | 49.65±6.19 | 47.84±6.27 | |
| End of trial | 45.39±6.19 | 48.83±7.21 | |
| p‡ | 0.008 | 0.026 | |
| Change | 4.26±5.12 | -0.99±1.60 | 0.002 |
| Waist circumference (cm) | |||
| Baseline | 105.57±8.34 | 99.75±12.22 | |
| End of trial | 109.71±9.16 | 95.13±10.24 | |
| p‡ | 0.000 | 0.000 | |
| Change | -4.14±2.35 | 4.63±3.40 | 0.000 |
| Hip circumference (cm) | |||
| Baseline | 119.07±11.45 | 114.63±8.71 | |
| End of trial | 119.93±11.81 | 111.75±8.73 | |
| p‡ | 0.047 | 0.000 | |
| Change | -0.86±1.46 | 2.88±2.39 | 0.000 |
| Waist-Hip ratio | |||
| Baseline | 0.89±0.04 | 0.87±0.07 | |
| End of trial | 0.93±0.05 | 0.85±0.06 | |
| p‡ | 0.010 | 0.031 | |
| Change | -0.14±0.05 | 0.02±0.03 | 0.001 |
| Waist-height ratio | |||
| Baseline | 0.66±0.07 | 0.62±0.08 | |
| End of trial | 0.69±0.08 | 0.59±0.07 | |
| p‡ | 0.000 | 0.000 | 0.000 |
| Change | -0.03±0.02 | 0.03±0.02 | |
| Neck circumference (cm) | |||
| Baseline | 37.36±3.56 | 36.44±2.86 | |
| End of trial | 38.0±3.78 | 35.41±3.03 | |
| p‡ | 0.010 | 0.001 | |
| Change | -0.64±0.79 | 1.03±0.96 | 0.000 |
| Wrist circumference (cm) | |||
| Baseline | 17.93±1.77 | 17.19±1.67 | |
| End of trial | 18.43±1.83 | 16.66±1.67 | |
| p‡ | 0.001 | 0.001 | |
| Change | -0.50±0.44 | 0.53±0.50 | 0.000 |
| Height-Wrist ratio | |||
| Baseline | 9.00±0.99 | 9.41±0.83 | |
| End of trial | 8.75±0.93 | 9.72±0.86 | |
| p‡ | 0.001 | 0.001 | |
| Change | 0.25±0.21 | -0.30±0.28 | 0.000 |
| Hand grip strength (kg) | |||
| Right hand (kg) | |||
| Baseline | 12.43±4.94 | 19.06±5.74 | |
| End of trial | 9.93±4.05 | 23.13±6.09 | |
| p‡ | 0.000 | 0.000 | |
| Change | 2.50±1.45 | -4.06±2.72 | 0.000 |
| Left hand (kg) | |||
| Baseline | 13.07±4.80 | 18.25±6.92 | |
| End of trial | 9.79±3.79 | 22.44±6.39 | |
| p‡ | 0.000 | 0.000 | |
| Change | 3.29±1.98 | -4.19±2.34 | 0.000 |
Data are shown as mean ± standard deviation. Change: baseline-end of trial. p‡ as compared between the baseline and end of trial for the same group (control or diet); p value, as compared between the placebo and synbiotic groups.
Table 3.
Biochemical parameters.
| Variables | Control (n=14) |
Diet (n=16) |
p |
|---|---|---|---|
| FPG (mg/dL) | |||
| Baseline | 84.50(76.75-87.00) | 88.00(85.00-96.50) | |
| End of trial | 88.50(81.75-100.0) | 90.00(83.25-94.75) | |
| p‡ | 0.197 | 0.501 | |
| Change | -1.00(-12.50-1.25 | 1.00(-3.00-5.00) | 0.077 |
| CRP (mg/L) | |||
| Baseline | 5.27(2.19-13.33) | 4.39(2.31-7.67) | |
| End of trial | 11.50(4.90-18.57) | 2.16(1.46-3.86) | |
| p‡ | 0.002 | 0.015 | |
| Change | -3.63(-10.28- -1.04) | 1.01(0.03-3.22) | 0.000 |
| ESR (mm/s) | |||
| Baseline | 23.00(9.50-31.00) | 31.00(16.50-51.25) | |
| End of trial | 33.00(13.75-39.50) | 25.00(9.50-39.00) | |
| p‡ | 0.001 | 0.001 | |
| Change | -4.00(-9.75- -2.50) | 5.00(3.00-8.00) | 0.000 |
| AST (u/L) | |||
| Baseline | 20.00(14.50-21.75) | 18.00(15.00-22.00) | |
| End of trial | 18.00(14.75-24.25) | 20.50(14.00-22.00) | |
| p‡ | 0.728 | 0.362 | |
| Change | -1.00(-3.50-2.25) | -0.50(-3.75-2.00) | 0.918 |
| ALT (u/L) | |||
| Baseline | 17.00(10.25-25.25) | 17.00(12.50-21.00) | |
| End of trial | 16.50(11.50-30.00) | 17.00(11.75-22.75) | |
| p‡ | 0.484 | 0.706 | |
| Change | -0.05(-6.25-3.00) | -0.50(-4.50-3.00) | 0.854 |
| Uric acid (mg/dL) | |||
| Baseline | 4.70(4.38-5.73) | 3.70(3.43-4.18) | |
| End of trial | 4.70(4.15-5.50) | 3.40(2.80-4.45) | |
| p‡ | 0.875 | 0.038 | |
| Change | -0.16(-0.52-0.55) | 0.30(-0.05-0.48) | 0.208 |
| Creatinine (mg/dL) | |||
| Baseline | 0.73(0.65-0.88) | 0.66(0.58-0.76) | |
| End of trial | 0.71(0.63-0.86) | 0.62(0.58-0.73) | |
| p‡ | 0.363 | 0.080 | |
| Change | 0.02(-0.03-0.06) | 0.01(-0.01-0.07) | 0.667 |
| Triglycerides (mg/dL) | |||
| Baseline | 125.00(97.00-151.25) | 94.50(76.25-140.25) | |
| End of trial | 144.50(113.75-178.00) | 106.00(83.00-128.50) | |
| p‡ | 0.330 | 0.796 | |
| Change | -9.00(-54.25-24.25) | 8.00(-27.25-18.75) | 0.334 |
| LDL (mg/dL) | |||
| Baseline | 116.05(77.38-132.35) | 119.90(92.73-143.55) | |
| End of rial | 124.50(106.60-141.85) | 112.40(98.58-143.80) | |
| p‡ | 0.033 | 0.352 | |
| Change | -22.00(-41.50-10.78) | 5.30(-7.03-16.05) | 0.013 |
| HDL (mg/dL) | |||
| Baseline | 55.55(44.60-67.35) | 52.90(46.93-68.03) | |
| End of trial | 54.95(45.30-62.50) | 53.20(46.90-64.70) | |
| p‡ | 0.258 | 0.408 | |
| Change | 2.40(-5.90-8.83) | 0.55(-3.20- 5.08) | 0.951 |
| Total Cholesterol (mg/dL) | |||
| Baseline | 186.50(158.75-214.75) | 198.50(163.75-246.25) | |
| End of trial | 215.50(175.75-232.550) | 197.00(156.00-236.50) | |
| p‡ | 0.011 | 0.255 | |
| Change | -22.50(-41.00- -2.00) | 7.50(-8.25-27.00) | 0.008 |
Data are expressed as median (25th-75th percentile). Change: baseline-end of trial. p‡ as compared between the baseline and end of trial for the same group (control or diet); p value, as compared between the placebo and synbiotic groups.
Table 4.
Disease Activity.
| Variables | Control (n=14) |
Diet (n=16) |
p |
|---|---|---|---|
| Tender joints | |||
| Baseline | 5.57±4.72 | 5.69±4.64 | |
| End of trial | 11.50±6.36 | 1.94±2.74 | |
| p‡ | 0.000 | 0.000 | |
| Change | -5.93±3.69 | 3.75±2.35 | 0.000 |
| Swollen joints | |||
| Baseline | 0.00(0.00-0.00) | 0.00(0.00-0.00) | |
| End of trial | 0.50(0.00-2.00) | 0.00(0.00-0.00) | |
| p‡ | 0.023 | 0.102 | |
| Change | 0.00(-1.00-0.00) | 0.00(0.00-0.00) | 0.012 |
| DAS28-ESR | |||
| Baseline | 3.59±1.04 | 4.68±1.14 | |
| End of trial | 5.39±0.77 | 3.01±0.92 | |
| p‡ | 0.000 | 0.000 | |
| Change | -1.80±0.54 | 1.68±0.74 | 0.000 |
| DAS28-CRP | |||
| Baseline | 3.17±0.81 | 3.80±1.04 | |
| End of trial | 4.91±0.51 | 2.15±0.65 | |
| p‡ | 0.000 | 0.000 | |
| Change | -1.74±0.50 | 1.66±0.73 | 0.000 |
| SDAI | |||
| Baseline | 15.31±8.40 | 20.96±6.93 | |
| End of trial | 29.69±9.05 | 11.18±12.63 | |
| p‡ | 0.000 | 0.008 | |
| Change | -14.39±4.09 | 9.78±12.83 | 0.000 |
Data are presented as mean±standard deviation and median (25-75th percentile).Change: baseline-end of trial. p‡ as compared between the baseline and end of trial for the same group (control or diet); p value, as compared between the placebo and synbiotic groups.
Disclaimer/Publisher’s Note: The statements, opinions and data contained in all publications are solely those of the individual author(s) and contributor(s) and not of MDPI and/or the editor(s). MDPI and/or the editor(s) disclaim responsibility for any injury to people or property resulting from any ideas, methods, instructions or products referred to in the content. |
© 2025 by the authors. Licensee MDPI, Basel, Switzerland. This article is an open access article distributed under the terms and conditions of the Creative Commons Attribution (CC BY) license (http://creativecommons.org/licenses/by/4.0/).
Copyright: This open access article is published under a Creative Commons CC BY 4.0 license, which permit the free download, distribution, and reuse, provided that the author and preprint are cited in any reuse.


