
Submitted:
20 January 2025
Posted:
21 January 2025
You are already at the latest version
Abstract
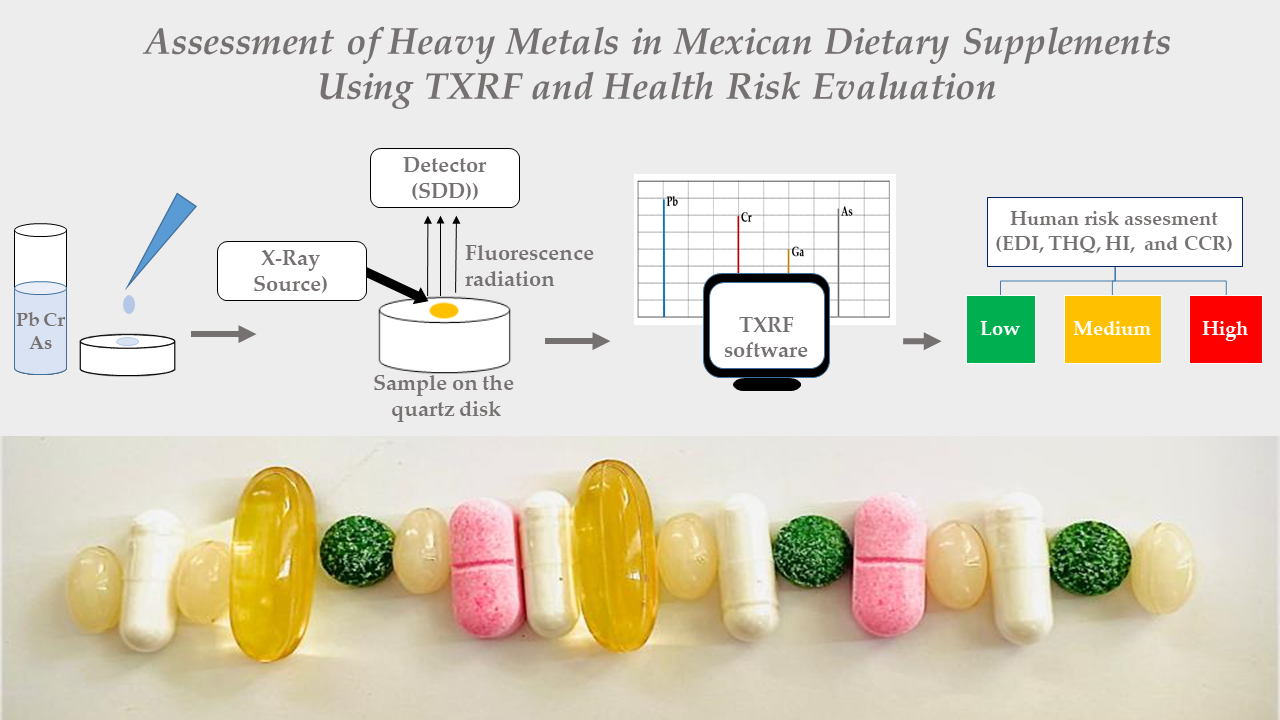
This study employed Total X-ray Fluorescence Spectrometry (TXRF) to analyze toxic heavy metals specifically lead (Pb), arsenic (As) and chromium (Cr) in 45 dietary sup-plement samples consumed by the Mexican population. A health risk assessment was conducted using the Target Hazard Quotient (THQ), Hazard Index (HI), and Cumula-tive Cancer Risk (CCR). The mean concentration of Pb, Cr, and As were found to be 1.99 ± 0.13, 26.88 ± 0.23, and 2.39 ± 0.11 mg/kg, respectively. The Estimated Daily In-take (EDI) of_Pb was below the reference levels established by the U.S. Environmental Protection Agency (USEPA) for all dietary supplements analyzed. In contrast, some EDI values for Cr and As exceeded the recommended limits. The THQ for Pb was less than 1 for all supplements, indicating low noncarcinogenic health risk; however, THQ values greater than 1 were observed for Cr and As. The HI values ranged from 0.004 to 4.8, with individual assessments indicating significant noncarcinogenic health risks associated with certain products. Nevertheless, the Cumulative Cancer Risk (CCR) values exceeding 1 suggest potential carcinogenic hazards linked to these supplements. Effective communication of these risks to consumers is crucial for promoting informed choices regarding dietary supplements and enhancing public health.
Keywords:
dietary supplements
; heavy metals
; TXRF
; health-risk assessment
1. Introduction
Dietary supplements, also referred to as food and nutritional supplements or nutraceuticals, are defined by the European Food Safety Authority [1]. These supplements may contain one or a combination of nutrients and pharmaceuticals, incorporating a variety of ingredients such as proteins, bioactive compounds, antioxidants, vitamins, flavonoids, and carotenoids. These compounds are utilized to prevent oxidative reactions and may include probiotics to enhance gut microbiota, enzymes to aid in digestive issues, and omega-3 fatty acids for disease prevention [2], among others. Ingredients in dietary supplements can be derived from both plant-based and non-vegan sources [3]. Unsurprisingly, there is a prevalent perception that over-the-counter dietary supplements are inherently safe with the belief that the positive effects outweigh any potential risks [1]. However, while dietary supplements offer numerous health benefits, the detection of various heavy toxic metals can significantly compromise products quality and consumer safety [4].
Heavy metals such as cadmium (Cd), lead (Pb), and arsenic (As) have been detected in dietary supplements, often exceeding recommended safety limits[5,6,7]. Other metals, such as Chromium (Cr), have also been detected as an essential nutrient required for glucose and fat metabolism; however, they can be toxic in large doses [8]. This contamination can arise from various sources; heavy metals may enter during plant cultivation, through air, water, and soil or cross-contamination during processing due to inadequate execution of operations or improper hygiene, transport, storage, and packaging, as well as may be added intentionally for their perceived therapeutic benefits or sale of supplements [5].
Regular consumption of multiple supplements can lead to cumulative exposure, raising concerns about long-term health impacts [9]. Chronic exposure to heavy metals can lead to serious health issues, including kidney damage and increased cancer risk [7]. Besides, heavy metals disrupt cellular events, including growth, proliferation, differentiation, damage-repairing processes, and apoptosis. Similar pathways such as oxidative stress by ROS generation, weakening the antioxidant defense, and inactivating enzyme [10].
The World Health Organization (WHO), the United States Environmental Protection Agency (USEPA), and the European Union (EU) have stablished risk evaluation models to estimate the harmful impact of toxic and non-toxic metals on human health through ingestion of dietary supplements. The estimated daily intake (EDI), target hazard quotient (THQ), hazard index (HI), carcinogenic risk (CR), and cumulative carcinogenic risk (CCR) are variables necessary for the risk estimation [5].
Obtaining raw materials, preparation, packaging, storage and transportation are the phases included in the manufacture of food supplements. Quality control in each of them is of vital importance to avoid contamination of products with heavy metals. However, due to dietary supplements are regulated as food manufactures are not required to pressented quality analyses to national o international agencies prior to sales [4]. Some nations have set strict quality control regulations such as maximun allowaded limits (MAL) for each metal [11].
As throughout the world, among the trends in the Mexican population are healthy habits and a good quality of life, which has led to a growing demand for dietary supplements. The nutritional supplements market in the country is almost 535,961,819 dollars annually, which is increasing [12]. Regulatory organizations in Committee noted that there were issues related to dietary supplements with regard to safety, efficacy, and quality [4].
However, there are few studies on the content of heavy metals in food supplements. One research examined the presence of Cu, Zn, Cd, Pb, and Hg in 24 dietary supplements purchased in the northwest Mexico. The most abundant toxic metals in dietary supplements were Pb (<0.003–66.32 mg/Kg), Cd (<0.001–2.90 mg/Kg), and Hg (<0.24–0.85 mg/Kg ) [4]. In another study the manganese (Mn), copper (Cu), lead (Pb), arsenic (As), and cadmium (Cd) in 26 items containing Ginkgo biloba were detected by graphite furnace atomic absorption spectrometry (GF-AAS). All products were contaminated with Pb, 54% with As, and 81% with Cd [13]. Another study, in the metropolitan area of Mexico, was performed on 23 products classified as herbal pharmaceuticals, food supplements, and traditional herbal remedies. Metal analysis was determined using a GF-AAS technique. The major part of the dietary supplements analyzed contain Cu, Pb, Cd, and As [14].
The research mentioned above shows a deep interest in carrying out safety analyses on dietary supplements because these products are widely consumed in Mexico, besides because of their property of bioaccumulating in different tissues and organs and because of their toxicity. Therefore, continuous monitoring and regulation is required to guarantee consumer safety. For this purpose, the most used analytical techniques to perform heavy metals analyses in dietary supplements are atomic Emission spectroscopy with inductively coupled plasma (ICP-OES)[5], inductively coupled plasma mass spectrometry (ICP-MS)[1,6], and GFAAS[13,15].
On the other hand, a suggested protocol was set to the use of TXRF technique (total reflection x-ray fluorescence spectroscopy) for trace analysis of toxic metal concentrations in dietary supplements [8]. Among its advantages are excellent sensitivity given by low limits of detection, and low energy spectrum background count [8].
Besides, the use of an internal standard allows easy quantification of, the sample size is small (as low as ng to µg based on sample preparation), and multielement simultaneous analysis[16]. Thus, the research aimed to assess the content of lead, arsenic, and chromium in dietary supplements available in Mexican stores using the TXRF analytical technique. Regarding the consumption of heavy metals through the ingestion of food supplements, an estimate of the risk to human health was made.
2. Materials and Methods
In this research, a validated methodology was used to analyze Pb, Cr, and As by TXRF in dietary supplement samples proposed by Beltrán et al. [8].
2.1. Chemicals
The reagents employed were of analytical grade such as nitric acid (HNO3, 69% w/w), hydrochloric acid (HCl, 36.5–38 % w/w), and hydrogen peroxide (H2O2, 30% w/w) (purchased from J.T. Baker (Mexico). Standard aqueous solutions of As and Cr were prepared from ICP standard stock solutions containing 1000 mg/L of each metal, which were purchased from Cresent Chemical Co., Inc. (Mexico) and from Sigma Aldrich (Mexico) were acquired the Pb and Ga standard solutions.
Calibration plots were used to calculate the heavy metal contents in the samples that were examined. Gallium was employed as an internal standard (IS) to improve the precision of quantitative analysis.
For each element, known concentrations were prepared into 10 mL volumetric flasks and filled to the mark with 0.31 M of HNO3 and 10 μg/L of Ga (IS) solution. Ultrapure water (resistivity of 18.2 MΩ.cm) was utilized for all dilutions and a clean routine of all glassware was realized with 10% HNO3 solution.
2.2. Sample Collection
The dietary supplements utilized in this study were acquired from drugstores or health food stores in Chihuahua, México, in 2023 and 2024. The samples were labeled for acid digestion (tablets, capsules, tea bags, and powder). For tablet and capsule sample digestion, 20 tablets and 20 capsules were ground separately using a mortar and pestle, whereas powder samples were weighed and digested directly. In the case of tea samples, one tea bag was left to rest in a cup of hot water (80°C) for 15 minutes. Then, 1 mL of this infusion was carried out to the digestion procedure.
2.3. Sample Preparation
To get rid of organic materials from the food supplement samples,acid digestion was performed. First, each sample was weighed between 0.020 and 0.050 g in polypropylene tubes. Then, 5 mL of H2O and 1 mL of HNO3 concentrated solutions were added to glass testing tubes. Reagents and sample mixtures were allowed to stand for 15 minutes. Afterward, 100 μL of H2O2, 485 μL of HNO3, and 100 μL of HCl concentrated solutions were incorporated into tubes, which were covered with their respective stopper. A vortex was used to shake the samples in the testing tubes, which were then placed into a bathwater at 80°C for eight hours. After acid digestion, samples were filtered. Finally, samples were prepared into 25 mL volumetric flasks and filled to the mark with 0.31 M of HNO3 and 10 μg/L of Ga (IS) solution.
2.4. TXRF Analysis
The sample introduction system uses quartz disks and a cassette to place them. Previously, quartz discs were coated with a silicon solution in isopropanol (Serva Eltrophoresis GmbH, Germany) before the deposition of the aqueous sample. An automatic micropipette was used to put a 10 µL drop of the sample in the center of the quartz disk and afterward dried at 80°C using a hot plate to make a small sample spot at the center of the disk.
Heavy metal analyses were carried out with a S2PICOFOX-TXRF spectrometer (Bruker AXS Microanalysis GmbH, Berlin, Germany), equipped with either a molybdenum (Mo) x-ray tube operated at 600 μA and 50 kV. The automatic sample changer (holder) allows up to 25 sample carriers to be loaded and analyzed. The TXRF software was called Spectra PICOFOX®7 and was used for instrument control and data acquisition. Each sample was measured for five minutes.
2.5. Quality Control
The analytical technique used was validated and fine-tuned by Beltral et al., However, new calibration curves, limits of detection (LOD), and limits of quantification (LOQ) were recalculated. Both the instrumental and chemical conditions, including the TXRF instrument, were exactly the same as those used by Beltrán et al.
For quality control purposes: i) blanks and samples were analyzed in triplicate during the measurement; ii) To correct possible instrumental noises and improve the precision of quantitative analysis, gallium was used as an internal standard; iii) Calibration curves were plotted linearly (y = mx + b), with "m" denoting calibration curve’s slope, "b" intercept, and "x" concentration (Table S1 and Figure S1, supplementary data). Linear regression equations were established, and detection limits (LOD and LOQ) were determined with lower values indicating sufficient sensitivity (Table S2, supplementary data).iv) Five runs of analysis of the different dietary supplements were carried out. In each of them, two samples were selected to perform a standard addition procedure and calculate the metals percentage recovery. Samples (V9, V10, A11, A12, V14, V15, V16, S27, M1, and C6) were spiked with a standard solution of 25 μg/L Pb, Cr, and As during the digested process.; v) additionally, the recovery percentage was calculated in a dietary supplement (Spring Valley Chromium Picolinate), which indicated on its label a known concentration of 1000 mg/Kg of chromium per tablet.
2.6. Human Health Risk Assessment
The model used by Naz et al. was used to assess the risk of contamination with heavy metals from dietary supplements on human health. For this, EDI, THQ, HI, and CCR were calculated for all metals (Pb, As, and Cr). The ATnon-cancer was set as 365 days/year x 30 years, and the adult body weight was set at 70 Kg. According to USEPA recommendation, EF (exposure frequency) and ED (exposure duration) were taken as 260 days/year and 30 years, respectively [5]. The daily supplement intake was calculated based on the recommended dose mentioned on the food supplement label [2,11].
2.6.1. Estimated Daily Intake (EDI)
EDI is a widely utilized concept in chemical threat evaluation. It defines the maximum amount of a chemical an individual can ingest daily throughout their lifetime without experiencing adverse effects [2]. Exceeding this threshold could have poisonous impacts. The EDI, expressed in mg.kg-1.day-1, was calculated for each metal using the following Equation (1), recommended by the US EPA[5,17]:
Where,
- C = Metal concentration in the sample in mg/kg for solid samples and mg/L for liquid samples.
- IR = Ingestion rate (calculated based on the recommended dose) in mg/day or mL/day.
- EF = Exposure frequency (260 days per year).
- ED = Exposure duration (30 years).
- BW = Body weight (70 kg).
- AT non cancer = Average exposure time (EF x ED), (365 days per year x 30 years).
2.6.2. Target Hazard Quotient (THQ) and Hazard Index (HI)
Based on Equation (1), the THQ was calculated for noncarcinogenic risk. This parameter was established for each metal following Equation (2), according to the USEPA:
Where,
- EDI
- = Estimated Daily Intake in mg.kg -1 bw.day-1
- EDI
- RfD = Reference Dose, in mg.kg -1 bw.day-1, which represents the tolerable daily intake of the metal via oral exposure. The RfDs of lead, arsenic, and chromium were established according to different international standards (Table 1).
2.6.3. Cummulative Carcinogenic Risk (CCR)
The CCR of carcinogenic effects is a person’s likelihood of developing cancer during his or her lifetime due to exposure to metals [5]. To establish this parameter, a slope factor is needed, which were stablished in Table 1. The calculation of this parameter was performed according to Equation (4 and 5).
Where,
CRMetal = EDIMetal x CSFMetal
CCR = ∑CR (Pb, As, and Cr)
- CSF = Cancer Slope Factor in (mg.kg -1 bw.day-1)- 1
- EDI = Estimated Daily Intake in mg.kg -1 bw.day-1
2.7. Statistical Analyses
Measuring the concentrations of heavy metals in dietary supplements is essential for safeguarding consumer heath and preventing potential health hazards. In México, only a limited number of research studies have assessed the health risks associated with the consumption of dietary supplements [4,13,14]. To achieve this objective, a chemometric modeling approach was employed, incorporating various analytical technques, including Pearson Correlation Coefficient (PCC), Principal Component Analysis (PCA), and Hierarchical Cluster Analysis (HCA). The variables selected for this study included the estimated daily intake of Pb, Cr, and As, designated as EDI_Pb, EDI_Cr, and EDI_As, respectively. Additionally, the Hazard Index (HI) variable was utilized in the analysis.
3. Results and Discussion
3.1. Dietary Samples Characteristics
Forty-five dietary supplements were purchased from local supermarkets and "health food stores," as they are commonly called in Mexico. The brands were selected randomly and according to their popularity among the Mexican citizens. The samples were coded according to their origin: Vegetal was coded as V (25 samples), Minerals as M (3 samples), Synthetic as S (6 samples), Combined as C (3 samples), and Animal as A (8 samples). Table 2 represents the sample ID, serving weight, daily recommended dosage as indicated on each label, ingestion rate, and therapeutic indication.
3.2. Quality Control
The stability of the internal standard measurements was mandatory in this study since this ensured the absence of instrumental noise and improved the data quality. The reproducibility of gallium measurements expressed as relative standard deviation (RSD) was 5% demonstrating a satisfactory value following FDA guidelines (% RSD <7) [8]. This value was obtained from five consecutive measurements of a standard of 10 µg/L of gallium per day for five days (n = 25).
Moreover, detection limits (µg/L) were determined by the blanks method: Pb (0.54), Cr (0.86), and As (0.64). The accuracy method was evaluated by the recovery percentages for Pb, Cr, and As in the selected samples, which were found in the following ranges: 83 ̶ 97, 89 ̶ 107, and 91 ̶ 106, respectively (Table 3). For all elements, % recovery values are less than 20%, as recommended by the US Pharmacopeia [8]. Furthermore, a percentage recovery for Cr of 107 % was obtained for the Chromium Picolinate sample, which was used as reference material.
3.3. Application to Real Samples
The maximum allowable levels (MAL) established by the United States Pharmacopeia for Pb, Cr, and As are 0.5, 15, and 0.15 mg/Kg, respectively (USP, 2012; Korfali et al., 2013). The contents of metals in dietary supplements are summarized in Table 4. The mean levels for Pb, Cr, and As were 1.99 ± 0.13, 26.88 ± 0.23, and 2.39 ± 0.11 mg/Kg, respectively. Cr is the most abundant element among all the studied metals.
3.3.1. Lead
The highest levels of Pb were above their maximum allowable levels (MAL) (0.5 mg/Kg) [21], with mean levels of 3.70, 2.41, 1.72, 1.25, and 0.69 mg/Kg for all dietary supplement categories (Table 4). Besides, the range concentration in mg/Kg for each category was as follows: 0.39 ̶ 9.03, 0.07 ̶ 1.75, 1.08 ̶ 4.51, 0.29 ̶ 1.81, and ˂LOD ̶ 8.17 for animal, combined, mineral, synthetic and vegetal, respectively. Other research reported Pb concentration in dietary supplements of 1.70, 0.84, and 3.7 mg/Kg [1,5,22]; these values were comparable with the Pb levels in this study. However, García-Rico et al. in México informed Pb levels much higher (4.81 mg/Kg) in various dietary supplements [4].
The supplement with the highest lead content was Sample A11 (9.03 mg/Kg), popularly known in Mexico as "Víbora de cascabel" (Rattlesnake), which is offered to the consumer as a blood purifier, for acne, allergies, anemia, asthma, arthritis, gallstones, kidney stones, cancer, diabetes, among others. It is a powder obtained by grinding the skin of the rattlesnake (Crotalus spp.) after having gone through a drying process. Notably, despite the multiple health benefits offered by the product, the Pb content is 18 times higher than that established by the USP. The health problem lies in the fact that lead chronic exposure in adults can cause multiple neurological disorders, such as nerve disorders, memory or concentration problems, and lack of muscular coordination, among others [9]. On the other hand, lead can compete with calcium absorption, affecting bone mineralization. Besides, the formation of reactive oxygen species (ROS) for Pb intoxication produce cellular damage [23].
3.3.2. Arsenic
Arsenic toxicity affects the cardiovascular, dermatologic, nervous, hepatobiliary, renal, gastrointestinal, respiratory systems, among others [24]. The harmfulness of As is related to the concentration of exposure, frequency and duration, organic and inorganic species, age, gender, and genetic and nutritional factors [23].
In this study, the As mean concentrations in the samples analyzed were 1.57, 0.67, 3.63, and 0.60 for the following categories: Animal, Mineral, Vegetal, and Combined, respectively (Table 4). Only the Synthetic category had a concentration (0.04 mg/Kg) below its MAL, set by US Pharmacopeia [21]. In contrast, the As concentration in dietary supplements from the, Lebanon, USA, and Poland exhibited 0.26, 0.37, and 0.26 mg/Kg, respectively, which were lower than results found in the present study [11,25,26]. Sample V13, a seaweed supplement, presented the highest arsenic levels (39.93 mg/Kg); this was a result within the concentration range of 2.3 ̶ 141 mg/Kg reported in several studies [27,28]. Some supplements use seaweed as a raw material, especially for weight loss. However, seaweed is a food obtained mainly from the coasts where waste containing heavy metals is illegally dumped [28].
3.3.3. Chromium
While Cr(III) is considered an essential nutrient and may help maintain standard glucose tolerance, there are safety concerns regarding its supplemental intake due to increasing evidence of genotoxicity [5]. The results of the chromium analysis for the Combined, Animal, and Synthetic categories were 1.12 mg/Kg, 7.69 mg/Kg, and 14.75 mg/Kg, respectively (Table 4). These values were lower than those reported by Mihai et al. in vitamin supplements, which ranged between 9.17 and 19 mg/Kg [29].
On the other hand, high averages in chromium concentrations were found for the Mineral (49.86 mg/Kg) and Vegetable (36.49 mg/Kg) categories. In the first case, for the Mineral category, this value was high because the sample M1 was found to have a content of 131.46 mg/Kg of Cr. This supplement is indicated for increasing energy and weight loss; it´s possible the intentional addition of chrome for these purposes. On the other hand, samples V16, V19, and V44 showed high concentrations of chromium: 135.41, 150.01, and 127.97 mg/Kg, respectively. These samples have in common the fact that they are also indicated for weight loss. Weight loss supplements are very popular; women (44.9%) are the principal consumers [30]. The problem is that Cr (III) possesses low membrane permeability and cannot penetrate the cell membrane, which confines it within the cell where it can bind to DNA, causing genetic damage and genomic instability. Another stable oxidation state for chromium is the Cr (VI) form, which enters many types of cells and, under physiological conditions, can be reduced by hydrogen peroxide (H2O2), glutathione (GSH) reductase, ascorbic acid, and GSH to produce reactive intermediates, including Cr (V), Cr (VI), thiol radicals, and hydroxyl. These species could attack DNA, proteins, and membrane lipids, disrupting cellular integrity and functions [31]. Exposure to chromium has been linked to the development of several cancers, including the lungs, larynx, bladder, bone, stomach, kidneys, testicles, and thyroid cancer [9].
3.4. Human Health Risk Assessment
3.4.1. Estimated Daily Intake
Table 5 shows the EDI of Pb, Cr, and As in dietary supplements, evaluating potential lifetime health risks to humans. The manufacturer's recommended daily dose was considered in this study. The calculated EDI for lead in all dietary supplements was below the RfD set at 0.0035 mg/kg bw/day established by the USEPA. Another study conducted in Mexico reported similar results in the analysis of dietary supplements [14]. This contrasts with the highest EDI of 5.46E-03 observed in research in Romania [15].
Maximum EDI for Cr was also reported as 5.44E-05 by Naz et al., 2024 [5] that is lower than the EDIs found in our results for V32, V20, V16, and M1, which were in a range of 3.76E-03 to 2E-02 mg/kg bw/day (Table 5), these values exceeded the reference value of 0.003 mg/kg bw/day estipulated by the Environmental Protection Agency (EPA) [18,32].
EDIs for the toxic metal As (inorganic) ranged from 1.07E-05 mg/kg bw/day for the lowest value, a pharmaceutical herbal product (V33), to the highest value for product V13 (traditional herbal remedy), with 1.7E -03 mg/kg bw/day (Table 5). Also, some dietary supplements of Animal origin were EDIs higher than the reference value of 0.0003 mg/kg bw/day set by (USEPA, 2024) [20]. Similarly, other studies from Mexico noted the highest EDI value for arsenic as 1.98E-02 for traditional herbal remedies used as dietary supplements [14]. The level of exposure to toxic metals can differ based on the recommended dosage by the manufacturer and the average body weight [5].
3.4.2. Total Hazard Quotient and Hazard Index
The target hazard quotient (THQ) indicates the potential risks to human health of the contaminants and was calculated for Pb, Cr, and As in dietary supplements (Table 5). Consumers may not experience negative health consequences if the THQ value exceeds 1. On the other hand, a THQ of one or higher than one denotes possible consumer risk exposure [33]. The THQ for Pb was less than 1 (THQ < 1) for all dietary supplements analyzed. According to Cr data, V19 and V32 samples had the highest THQ values at 3.05 and 4.75. The high Cr content in this samples could be due to the intentional addition of this element to these products, with the objetive to improve the body composition, glucose metabolism, lipid lipoprotein profile and blood pressure in overweight [34]. However, several studies have described that exposure to doses higher than the MAL of Cr can cause serious health problems [9,31].
In the arsenic analysis, THQs of 3.78 and 4.06 were obtained for V13 and V41 samples, respectively (Table 5), suggesting that the ingestion of these products may pose a risk to human health, due to the high As content. This As contamination is more common in dietary supplements of vegetal origin due to the fact that the main routes of exposure to the metal are food, water, soil and air [14], showing that greater scrutiny required for these products on sale in Mexico.
The mean cumulative health risks were determined and categorized as HI. The THQ for each metal was summed to obtain this parameter. HI's results are shown in Table 4. The minimum value for HI was 0.004, suggesting that no possible non-carcinogenic health concerns were associated with consuming the examined dietary supplements (Table 5). Similar results were obtained by Bandara et al. and Naz et al. where HI values were less than 1 [5,25]. Conversely, in another study realized in Mexico, the HI values were higher at 3.75, suggesting a comparatively elevated level of potential health risk [14]. In fact, in this research, some samples had HI˃1, such as A11, V13, and V41.
The high concentrations of arsenic and chromium in the analyzed supplements result in high daily intakes, which favors an increase in THQ.
The HI consider and estimate that the ingestion of a particular type of food would result in simultaneous exposure to several toxic elements. Although individual THQs calculed for individual elements in the dietary supplemets were lower than 1, because the cumulative effect indicate adverse health effects [35].
3.4.4. The Cumulative Cancer Risk (CCR)
The cumulative cancer risk associated with dietary supplements contaminated with heavy metals is a growing concern. This research calculated the CR (cancer risk) presented to human health by individual potential carcinogenic metals. This research indicates that while many dietary supplements, may contain heavy metals like Pb, Cr, and As, the health risks from typical consumption levels are often below critical thresholds. However, cumulative exposure from multiple supplements can pose significant risks.
Then, the CCR which may promote carcinogenic effects depending on exposure dose, was calculated from ingestion of Pb, Cr, and As. Values of TCR less than 1E-06 are considered tolerable, while those falling between ˃1E-06 and 1E-04 were considered within an acceptable range. Finally, values exceeding 1E-04 were considered intolerable [5,17]. Results were presented in Figure 1 and Table S3, supplementary data. More than 50% of the supplements analyzed presented a CCR in ranges more greater than 1E-04, with a probability of an individual developing cancer over their lifetime as a result of exposure to metals. It was no possible stablished a comparison with other studys realized in Mexico, due to they no evaluated a CCR value. However, similary to our results values in the ranges of acceptable and intolerable categories were found in the major part of the dietary supplements analized [15]. In contrast whit other investigation where the CCR of every sample fell within a acceptable range [5].
3.5. Multivariate Analysis
An exploratory examination of dietary supplements was conducted using multivariate and bivariate statistical analysis. PCA, HCA, and PCC were performed. IBM SPSS®version 22.0 was used for the study.
A PCC analysis was performed (Table 6) to obtain the degree of linear association between response variables such as EDI_Pb, EDI_Cr, EDI_As, and HI. The correlation analysis showed that there is a positive and high correlation (p < 0.0001) between the EDI_Cr variable and HI and between the variables EDI_As and HI. These results reinforce the fact that HI increases at higher concentrations of arsenic and chromium present in supplements. On the other hand, there was no statistically significant association between the variable EDI_Pb and the other variables analyzed (p>0.01).
According to the PCA analysis, the table of total explained variance obtained in the principal component analysis (Table S4, supplementary data) showed that two components that explain 75.15% of the global variability were retained. By its coefficients, Principal Component 1 is shown as a global index that controls 48.12% of the total variability and gives greater weight to HI, followed by EDI_Cr and EDI_As, without giving much weight to the EDI_Pb variable. Principal Component 2 will generate a contrast between supplements high in EDI_Pb and EDI_As and low in EDI_Cr versus supplements high in EDI_Cr and low in EDI_Pb and EDI_As. Figure 2 displays the sedimentation graph of eigenvalues obtained in the principal component analysis.
Synthetic supplement 28 (S28) has the lowest global level, and vegetal supplement 32 (V32) has the highest global level. It can be seen that there is no order according to their Origin, being interspersed when accommodated by this index (Table S5, supplementary data). Figure 3 was obtained when plotting the first two principal components. On the right side, there are high supplements in EDI_Pb and EDI_As and low in EDI_Cr, while on the left side, there are high supplements in EDI_Cr and low in EDI_Pb and EDI_As.
A Cluster Analysis was performed to have evidence of the feasibility of stratifying (grouping) the supplements into clusters that were homogeneous within them and significantly differentiated between the groups (Figure 4). Four groups (Table S6, supplementary data) were formed with an R2 of 0.95, which were shown to be different in a multivariate manner using the Wilks' Lambda statistic of MANOVA (p<0.0001) and in a univariate manner using ANOVAs with highly significant differences (p<0.0001) for the four variables considered.
4. Conclusions
It was possible to carry out the objective of analyzing Pb, Cr and As in samples of food supplements acquired in Mexico using a TXRF analytical technique. Besides, comprehensive analyses like human health risk evaluation and a chemometric approach for data interpretation have been done in the present investigation. Some supplements were found to have inappropriate amounts of heavy metals such as Pb and As; even though they were found to be below their MAL, their presence is unacceptable since the Agency for the Registration of Hazardous Substances (ATSDR) has classified them as the two most dangerous substances in the world because they are highly toxic and harmful to health. Chromium is a micronutrient detected in supplements, especially in those used for weight control, since this element has been associated with improved lipid and glucose metabolism. However, it was observed, and it is suspected that these supplements could be intentionally added with Cr. It should be considered that several studies have reported that an increase in the EDI of chromium can generate adverse health effects. The THQ and HI calculated for most of the supplements had values of less than one. However, more than half of the supplements were in an unacceptable risk category when calculating the cumulative cancer risk index. For this reason, consuming these dietary supplements may serve as a pathway for metals to enter the human body, leading to both toxicological and nutritional implications. Furthermore, the principal component analysis and the Cluster allowed the classification of the supplements into four groups, according to the EDIs and the HI. This research has some limitations and uncertainty. The number of supplements analyzed was limited, and the samples may not represent the full range of dietary supplements available on the market. Not all supplements are of Mexican origin; some of them are imported from other parts of the world. Therefore, geography, manufacturing practices, and raw materials used were not considered in this study. Using more modern and sustainable analytical techniques allows for better detection of metals in food supplements. The homogenization of regulatory frameworks would help to reduce the discrepancies that arise between different studies. Communicating the risks associated with consuming food supplements to the population would benefit consumers' health and allow them to choose the most appropriate products.
Supplementary Materials
The following supporting information can be downloaded at the website of this paper posted on Preprints.org, Table S1: Calibration curves; Figure S1: Calibration curves; Table S2: TXRF Limits of detection in the analysis of dietary supplements; Table S3: Cumulative cancer risks; Table S4: Principal Component Analysis; Table S5: Supplements ordered according to their value of Principal Component 1; Table S6: Cluster. Characterization of groups.
Author Contributions
“Conceptualization, BPBG; methodology, BPBG, AMP, and CCA.; software, BPBG and SEE.; validation, BPBG.; formal analysis, BPBG.; investigation, AMJO, CMM, and CCA.; resources, BPBG and AMJO.; data curation, BPBG and SEE.; writing—original draft preparation, BPBG and CMM.; writing—review and editing, BPBG.; visualization, AMJO, CMM, SEE, AMP, and CCA; supervision, AMJO and SEE.; project administration, BPBG.; Funding acquisition, BPBG. All authors have read and agreed to the published version of the manuscript.
Funding
This research received funding for publication through the Secretary of Research and Postgraduate Studies of the Autonomous University of Chihuahua.
Conflicts of Interest
Th e authors declare no conflicts of interest.
References
- Augustsson, A.; Qvarforth, A.; Engström, E.; Paulukat, C.; Rodushkin, I. Trace and Major Elements in Food Supplements of Different Origin: Implications for Daily Intake Levels and Health Risks. Toxicol. Reports 2021, 8, 1067–1080. [Google Scholar] [CrossRef] [PubMed]
- Gajewska, M.J. Analysis of the Content of Selected Heavy Metals in Dietary Supplements Available on the Polish Market. Farm. Pol. 2023, 79, 529–536. [Google Scholar] [CrossRef] [PubMed]
- Chopra, A.S.; Lordan, R.; Horbańczuk, O.K.; Atanasov, A.G.; Chopra, I.; Horbańczuk, J.O.; Jóźwik, A.; Huang, L.; Pirgozliev, V.; Banach, M.; et al. The Current Use and Evolving Landscape of Nutraceuticals. Pharmacol. Res. 2022, 175, 106001. [Google Scholar] [CrossRef]
- García-Rico, L.; Leyva-Perez, J.; Jara-Marini, M.E. Content and Daily Intake of Copper, Zinc, Lead, Cadmium, and Mercury from Dietary Supplements in Mexico. Food Chem. Toxicol. 2007, 45, 1599–1605. [Google Scholar] [CrossRef]
- Naz, M.; Ahmed, M.; Aftab, F.; Ali, M.A.; Sanaullah, M.; Ahmad, W.; Alshammari, A.H.; Khalid, K.; Wani, T.A.; Zargar, S. Contamination of Trace, Non-Essential/Heavy Metals in Nutraceuticals/Dietary Supplements: A Chemometric Modelling Approach and Evaluation of Human Health Risk upon Dietary Exposure. Food Chem. Toxicol. 2024, 190. [Google Scholar] [CrossRef] [PubMed]
- Jairoun, A.A.; Shahwan, M.; Zyoud, S.H. Heavy Metal Contamination of Dietary Supplements Products Available in the UAE Markets and the Associated Risk. Sci. Rep. 2020, 10, 18824. [Google Scholar] [CrossRef]
- Irshad, M.; Ahmed, M.; Ramzan, M.; Fatima, M.; Aftab, F.; Sanaullah, M.; Qamar, S.; Iftikhar, Z.; Wani, T.A.; Zargar, S. Appraisal of Potentially Toxic Metals Contamination in Protein Supplements for Muscle Growth: A Chemometric Approach and Associated Human Health Risks. J. Trace Elem. Med. Biol. 2024, 85, 127481. [Google Scholar] [CrossRef] [PubMed]
- Beltrán, B.G.; Ramos-Sanchez, V.; Chávez-Flores, D.; Rodríguez-Maese, R.; Palacio, E. Total Reflection X-Ray Fluorescence Spectroscopy (TXRF) Method Validation: Determination of Heavy Metals in Dietary Supplements. J. Chem. 2020, 2020. [Google Scholar] [CrossRef]
- Milanković, V.; Tasić, T.; Leskovac, A.; Petrović, S.; Mitić, M.; Lazarević-Pašti, T.; Novković, M.; Potkonjak, N. Metals on the Menu—Analyzing the Presence, Importance, and Consequences. Foods 2024, 13, 1890. [Google Scholar] [CrossRef]
- Balali-Mood, M.; Naseri, K.; Tahergorabi, Z.; Khazdair, M.R.; Sadeghi, M. Toxic Mechanisms of Five Heavy Metals: Mercury, Lead, Chromium, Cadmium, and Arsenic. Front. Pharmacol. 2021, 12, 643972. [Google Scholar] [CrossRef] [PubMed]
- Korfali, S.I.; Hawi, T.; Mroueh, M. Evaluation of Heavy Metals Content in Dietary Supplements in Lebanon. Chem. Cent. J. 2013, 7. [Google Scholar] [CrossRef]
- Uranga Valencia, L.P.; Villarreal Ramírez, V.H.; Macías López, M.G.; Ortega Montes, F.; Terrazas Gómez, M.I. Estudio de Mercado Para Suplementos Alimenticios Orgánicos En Delicias, Chihuahua. Rev. Biológico Agropecu. Tuxpan 2021, 9, 16–29. [Google Scholar] [CrossRef]
- Rojas, P.; Ruiz-Sánchez, E.; Ríos, C.; Ruiz-Chow, Á.; Reséndiz-Albor, A.A. A Health Risk Assessment of Lead and Other Metals in Pharmaceutical Herbal Products and Dietary Supplements Containing Ginkgo Biloba in the Mexico City Metropolitan Area. Int. J. Environ. Res. Public Heal. Artic. Public Heal. 2021, 18, 8285. [Google Scholar] [CrossRef]
- Rojas, P.; Ruiz-Sánchez, E.; Rojas, C.; García-Martínez, B.A.; López-Ramírez, A.M.; Osorio-Rico, L.; Ríos, C.; Reséndiz-Albor, A.A. Human Health Risk Assessment of Arsenic and Other Metals in Herbal Products Containing St. John’s Wort in the Metropolitan Area of Mexico City. Toxics 2023, 11. [Google Scholar] [CrossRef] [PubMed]
- Mustatea, G.; Ungureanu, E.L.; Iorga, S.C.; Ciotea, D.; Popa, M.E. Risk Assessment of Lead and Cadmium in Some Food Supplements Available on the Romanian Market. Foods 2021, 10, 581. [Google Scholar] [CrossRef]
- Yang, T.; Fan, X.; Zhou, J. Total Reflection X-Ray Fluorescence Spectroscopy. OALib 2020, 07, 1–12. [Google Scholar] [CrossRef]
- Romero-Estévez, D.; Yánez-Jácome, G.S.; Simbaña-Farinango, K.; Navarrete, H. Distribution, Contents, and Health Risk Assessment of Cadmium, Lead, and Nickel in Bananas Produced in Ecuador. Foods 2019, 8. [Google Scholar] [CrossRef] [PubMed]
- Hossain, E.; Nesha, M.; Chowdhury, M.A.Z.; Rahman, S.H. Human Health Risk Assessment of Edible Body Parts of Chicken through Heavy Metals and Trace Elements Quantitative Analysis. PLoS One 2023, 18. [Google Scholar] [CrossRef]
- Gebeyehu, H.R.; Bayissa, L.D. Levels of Heavy Metals in Soil and Vegetables and Associated Health Risks in Mojo Area, Ethiopia. PLoS One 2020, 15, e0227883. [Google Scholar] [CrossRef] [PubMed]
- USEPA Integrated Risk Information System | US EPA. Available online: https://www.epa.gov/iris (accessed on 13 January 2025).
- USP-NF Elemental Impurities—Limits and Elemental Impurities—Procedures | USP-NF. Available online: https://www.uspnf.com/official-text/accelerated-revision-process/accelerated-revision-history/elemental-impurities-limits-and-elemental (accessed on 14 January 2025).
- Ćwieląg-Drabek, M.; Piekut, A.; Szymala, I.; Oleksiuk, K.; Razzaghi, M.; Osmala, W.; Jabłońska, K.; Dziubanek, G. Health Risks from Consumption of Medicinal Plant Dietary Supplements. Food Sci. Nutr. 2020, 8, 3535–3544. [Google Scholar] [CrossRef]
- Tchounwou, P.B.; Yedjou, C.G.; Patlolla, A.K.; Sutton, D.J. Heavy Metal Toxicity and the Environment. EXS 2012, 101, 133–164. [Google Scholar] [PubMed]
- Budi, H.S.; Catalan Opulencia, M.J.; Afra, A.; Abdelbasset, W.K.; Abdullaev, D.; Majdi, A.; Taherian, M.; Ekrami, H.A.; Mohammadi, M.J. Source, Toxicity and Carcinogenic Health Risk Assessment of Heavy Metals. Rev. Environ. Health 2024, 39, 77–90. [Google Scholar] [CrossRef] [PubMed]
- Bandara, S.B.; Urban, A.; Liang, L.G.; Parker, J.; Fung, E.; Maier, A. Active Pharmaceutical Contaminants in Dietary Supplements: A Tier-Based Risk Assessment Approach. Regul. Toxicol. Pharmacol. 2021, 123, 104955. [Google Scholar] [CrossRef]
- Łozak, A.; Sołtyk, K.; Kiljan, M.; Fijałek, Z.; Ostapczuk, P. Determination of Selected Trace Elements in Dietary Supplements Containing Plant Materials. Polish J. Food Nutr. Sci. 2012, 62, 97–102. [Google Scholar] [CrossRef]
- Almela, C.; Algora, S.; Benito, V.; Clemente, M.J.; Devesa, V.; Súñer, M.A.; Vélez, D.; Montoro, R. Heavy Metal, Total Arsenic, and Inorganic Arsenic Contents of Algae Food Products. J. Agric. Food Chem. 2002, 50, 918–923. [Google Scholar] [CrossRef]
- Peng, Z.; Guo, Z.; Wang, Z.; Zhang, R.; Wu, Q.; Gao, H.; Wang, Y.; Shen, Z.; Lek, S.; Xiao, J. Species-Specific Bioaccumulation and Health Risk Assessment of Heavy Metal in Seaweeds in Tropic Coasts of South China Sea. Sci. Total Environ. 2022, 832, 155031. [Google Scholar] [CrossRef]
- Mihai, O.; Kawamoto, M.S.; LeBlanc, K.L.; Grinberg, P.; Nogueira, A.R.de A.; Mester, Z. Determination of Chromium Picolinate and Trace Hexavalent Chromium in Multivitamins and Supplements by HPLC-ICP-QQQ-MS. J. Food Compos. Anal. 2020, 87, 103421. [Google Scholar] [CrossRef]
- Pillitteri, J.L.; Shiffman, S.; Rohay, J.M.; Harkins, A.M.; Burton, S.L.; Wadden, T.A. Use of Dietary Supplements for Weight Loss in the United States: Results of a National Survey. Obesity 2008, 16, 790–796. [Google Scholar] [CrossRef]
- DesMarias, T.L.; Costa, M. Mechanisms of Chromium-Induced Toxicity. Curr. Opin. Toxicol. 2019, 14, 1–7. [Google Scholar] [CrossRef] [PubMed]
- Wong, C.; Roberts, S.M.; Saab, I.N. Review of Regulatory Reference Values and Background Levels for Heavy Metals in the Human Diet. Regul. Toxicol. Pharmacol. 2022, 130. [Google Scholar] [CrossRef]
- Ahmed, M.; Ahmad, M.; Khan, M.A.; Sohail, A.; Sanaullah, M.; Ahmad, W.; Iqbal, D.N.; Khalid, K.; Wani, T.A.; Zargar, S. Assessment of Carcinogenic and Non-Carcinogenic Risk of Exposure to Potentially Toxic Elements in Tea Infusions: Determination by ICP-OES and Multivariate Statistical Data Analysis. J. Trace Elem. Med. Biol. 2024, 84, 127454. [Google Scholar] [CrossRef]
- Diaz, M.L.; Watkins, B.A.; Li, Y.; Anderson, R.A.; Campbell, W.W. Chromium Picolinate and Conjugated Linoleic Acid Do Not Synergistically Influence Diet- and Exercise-Induced Changes in Body Composition and Health Indexes in Overweight Women. J. Nutr. Biochem. 2008, 19, 61–68. [Google Scholar] [CrossRef]
- Antoine, J.M.R.; Fung, L.A.H.; Grant, C.N. Assessment of the Potential Health Risks Associated with the Aluminium, Arsenic, Cadmium and Lead Content in Selected Fruits and Vegetables Grown in Jamaica. Toxicol. Reports 2017, 4, 181–187. [Google Scholar] [CrossRef]
Figure 1.
Representation of CCR of heavy metals in dietary supplements.
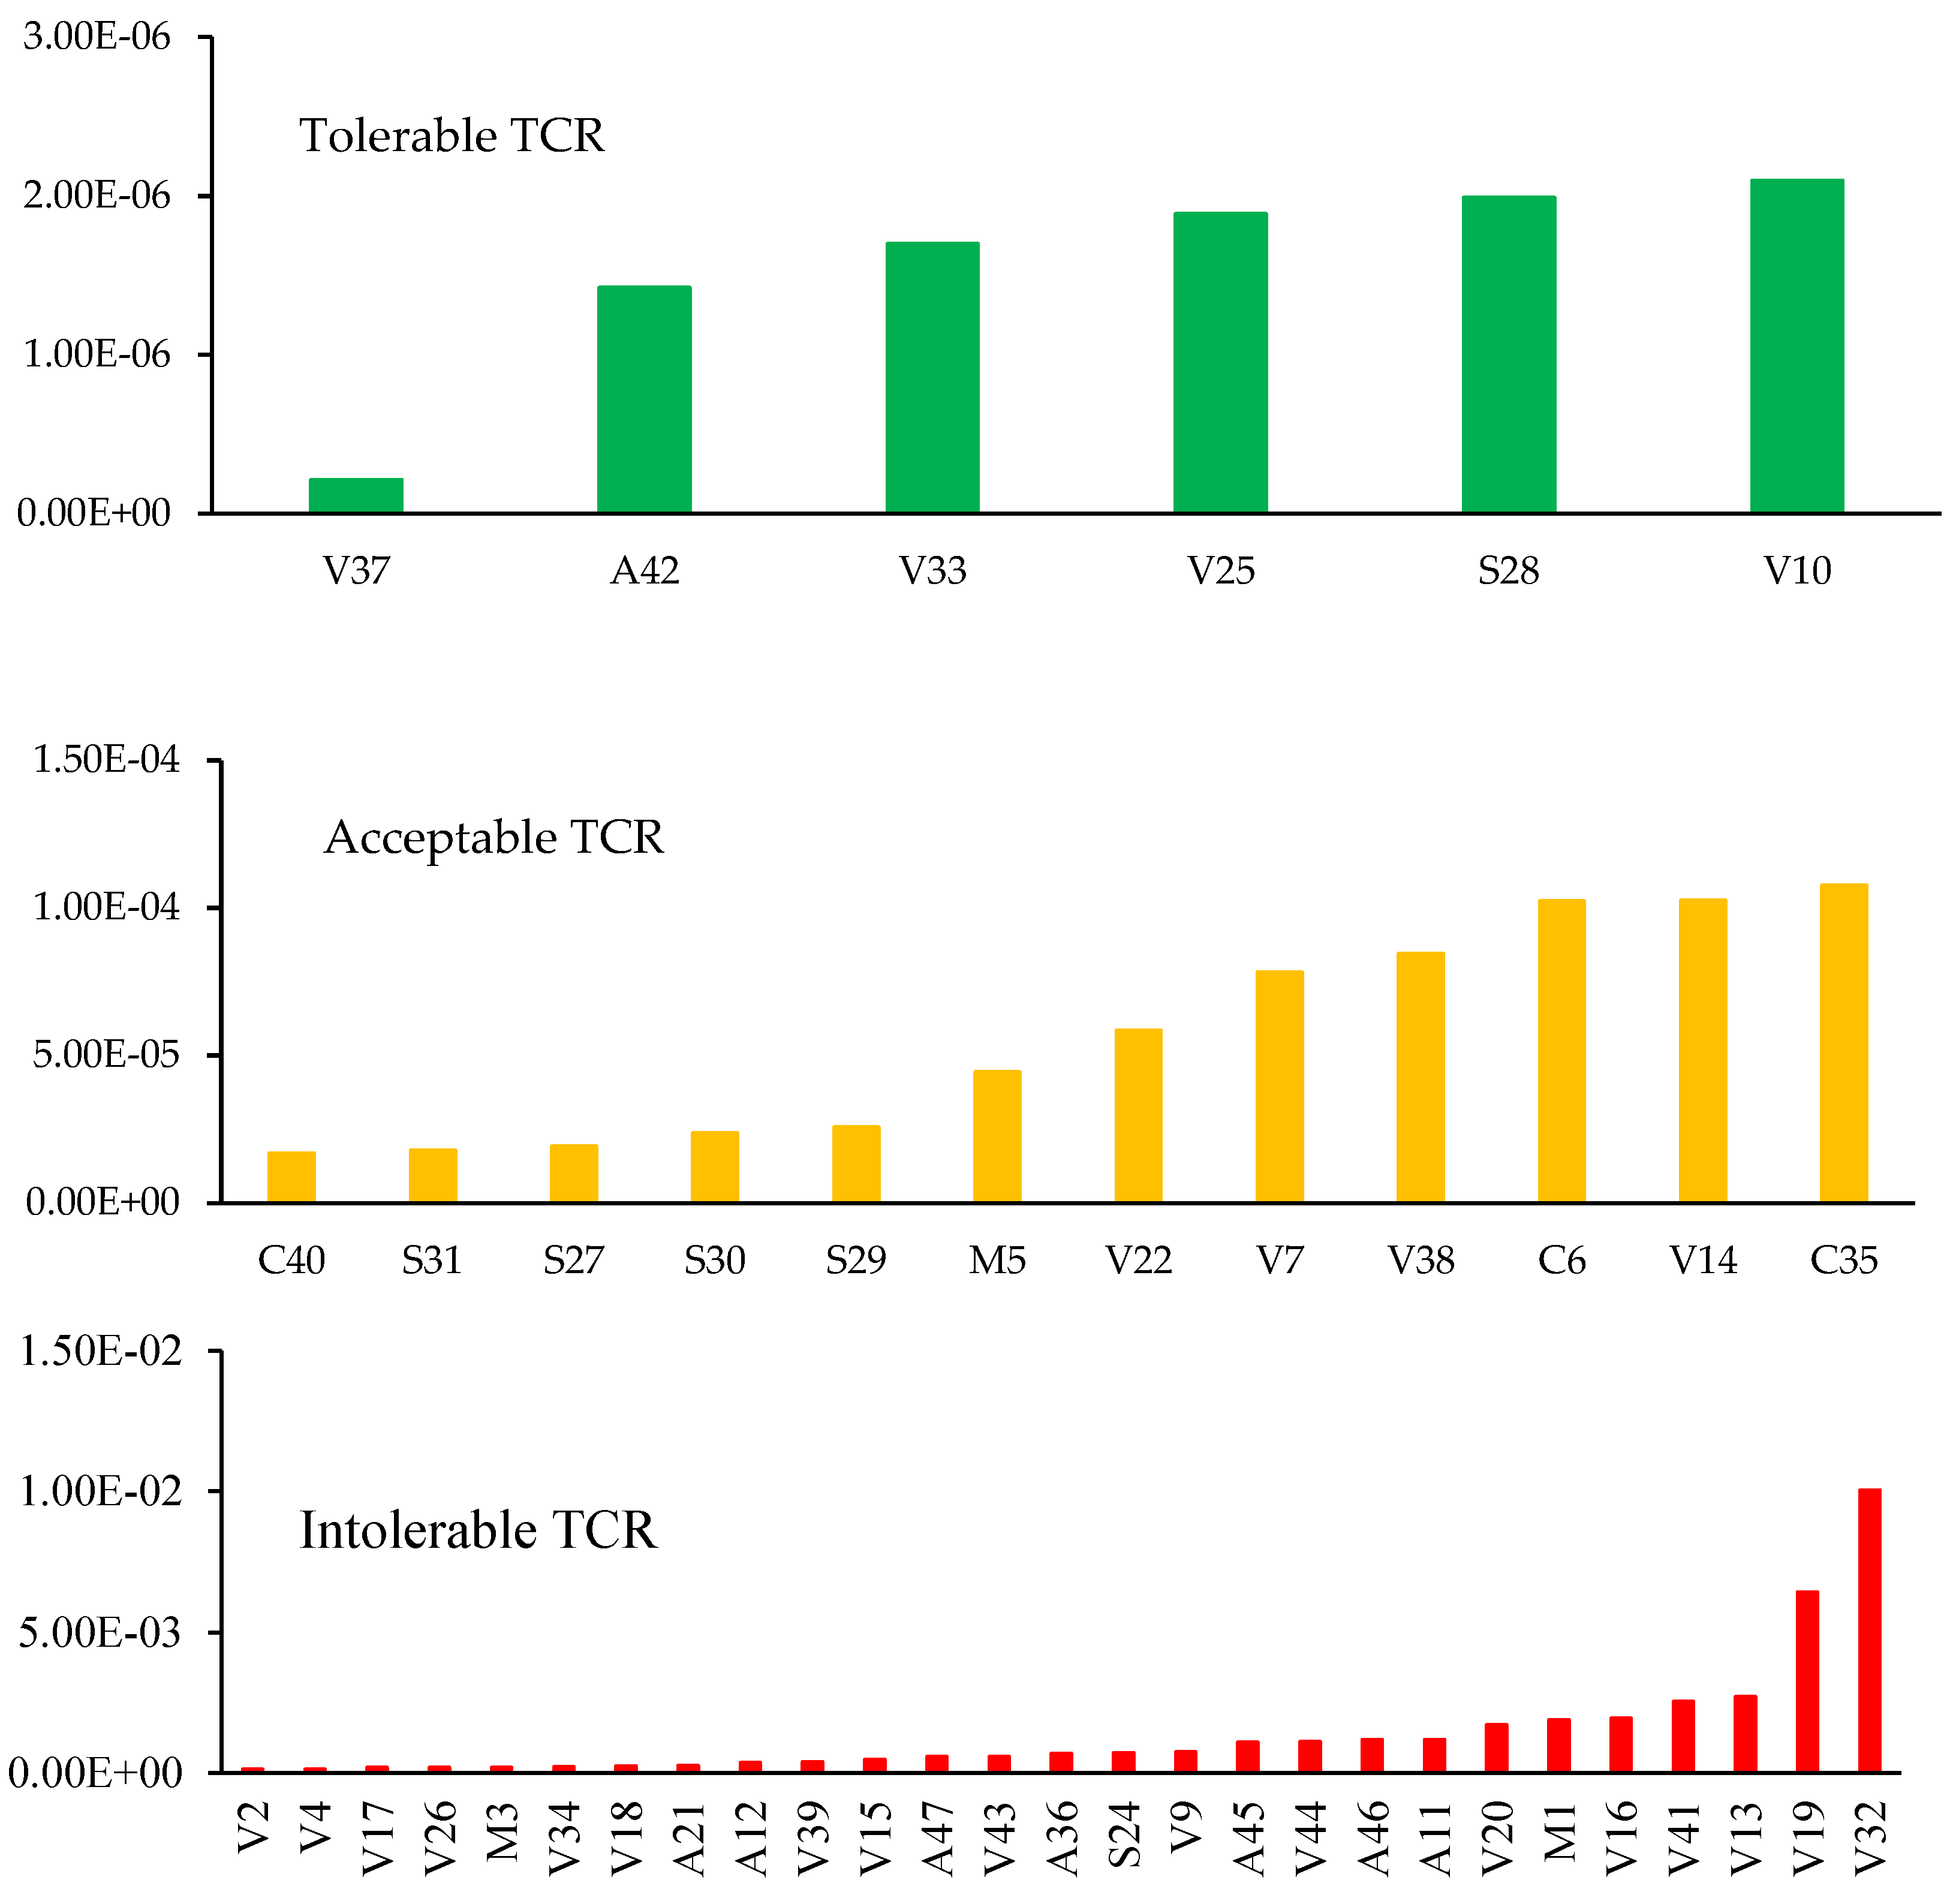
Figure 2.
Sedimentation graph obtained in the principal component analysis.
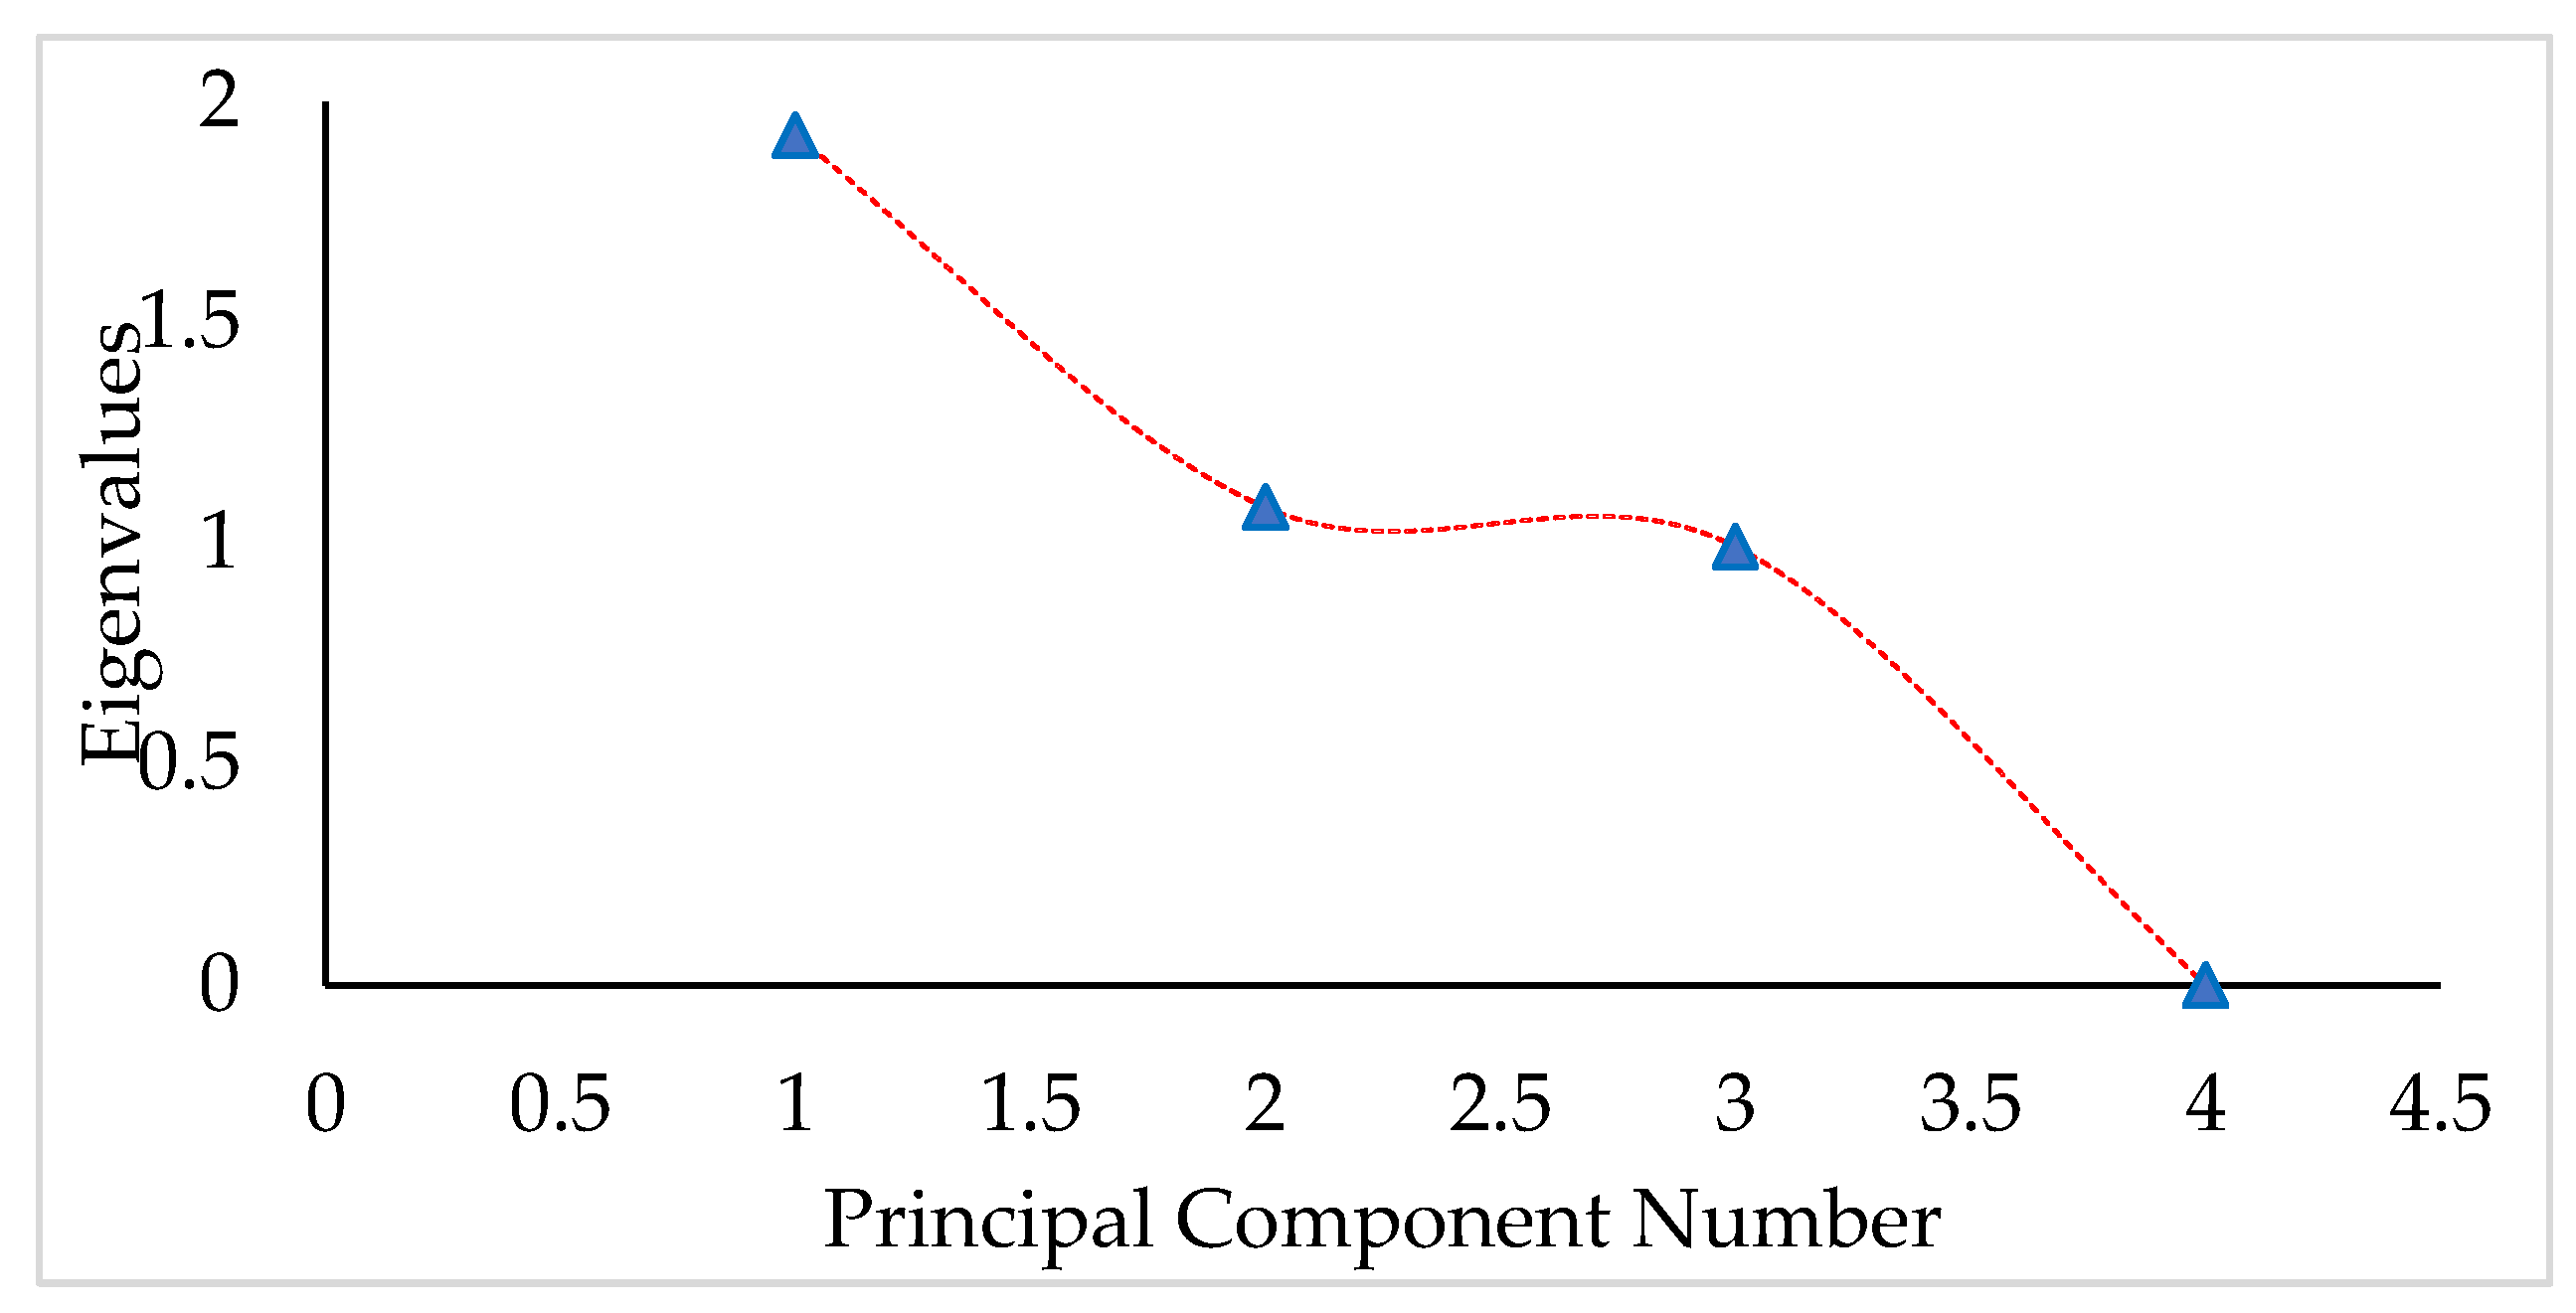
Figure 3.
Demonstration of PCA; Y axis, Principal component 1 and X axis, Principal component 2.
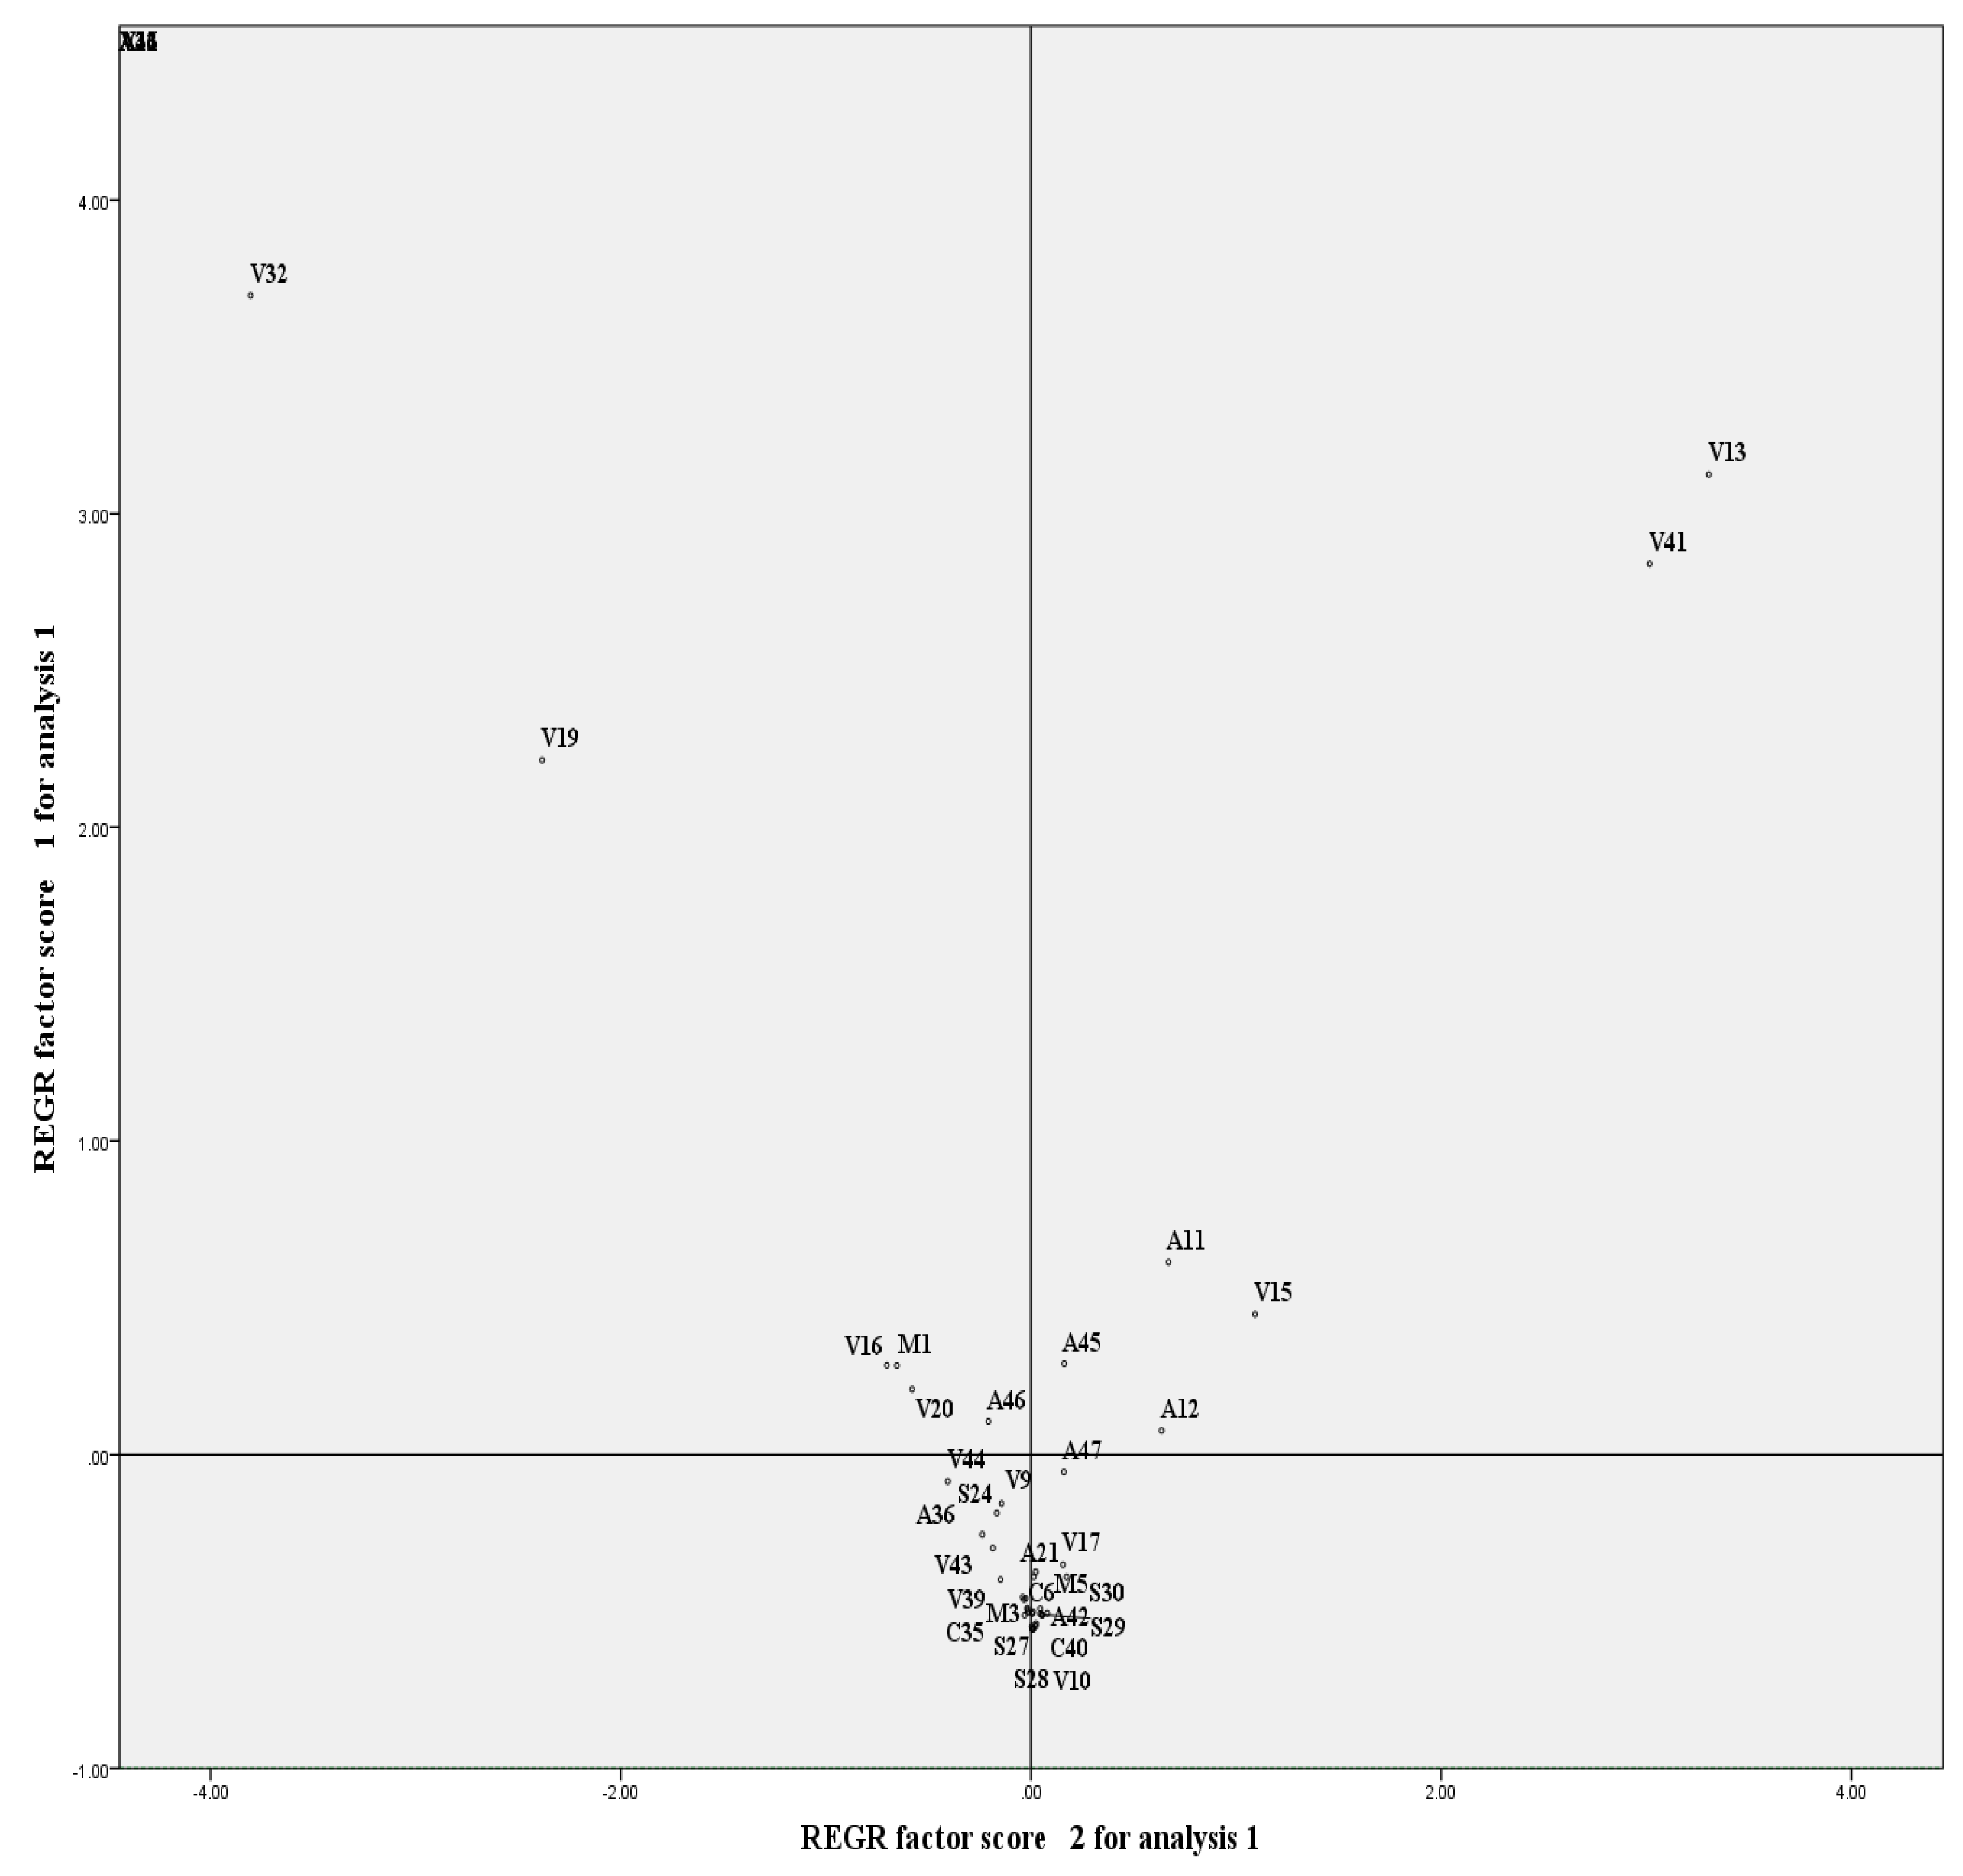
Figure 4.
Dendogram from Cluster Analysis.
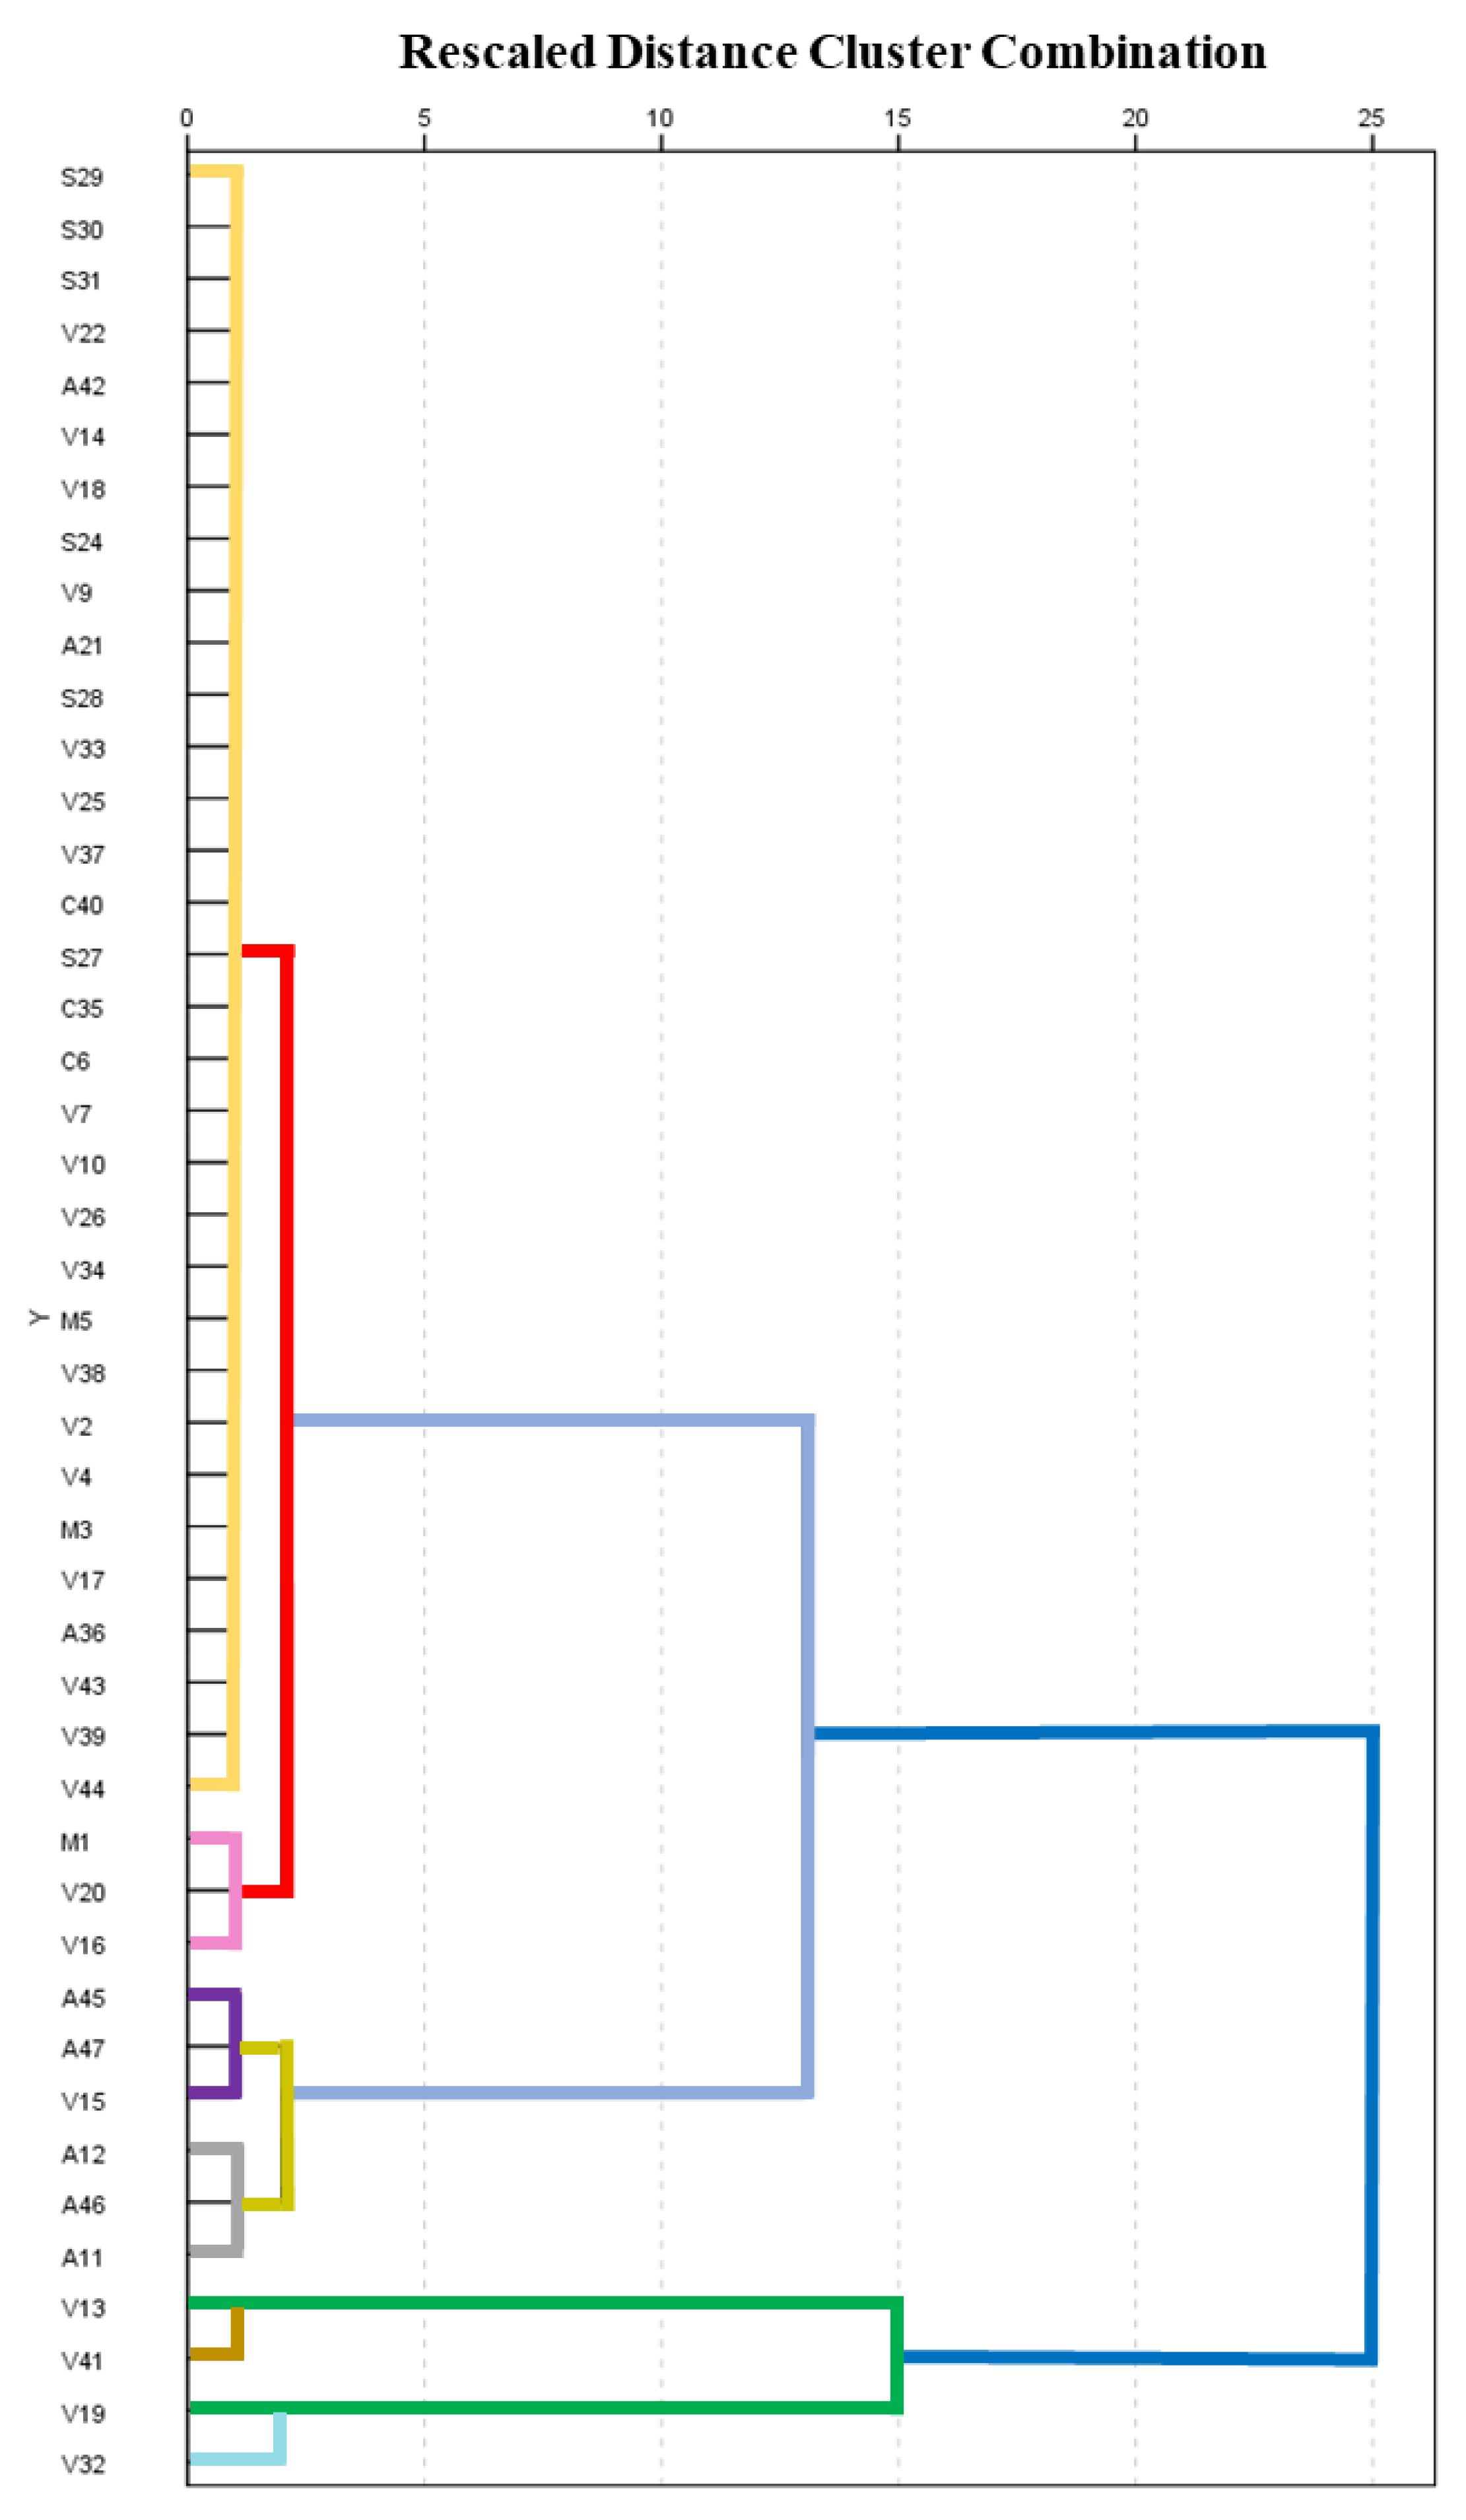

Table 1.
RfDs and CSFs values for each metal analyzed.
| Metal | RfD (mg.kg ̶ 1.day ̶ 1) | CSF (mg.kg ̶ 1.day ̶ 1) ̶ 1 | Reference |
|---|---|---|---|
| Pb | 0.0035 | 0.0085 | [5,15,18] |
| As | 3 x 10⁻⁴ | 1.5 | [19] |
| Cr | 0.003 | 0.5 | [5,18,19] |
Values utilized for EDIs and health risk assessment.
Table 2.
Characteristics of dietary supplements.
| Sample ID | *Dosage per day | Serving weight (Kg) |
IR (Kg/Day) | Therapeutic indication |
|---|---|---|---|---|
| M1 | 2 | 0.001 | 0.002 | Booster energy |
| V2 | 1 | 0.001 | 0.001 | Weight loss |
| M3 | 3 | 0.0005 | 0.002 | Weight loss |
| V4 | 1 | 0.002 | 0.002 | Improve digestion |
| M5 | 2 | 0.0005 | 0.001 | Booster energy |
| C6 | 2 | 0.0008 | 0.002 | Weight loss |
| V7 | 3 | 0.001 | 0.004 | Improve digestion |
| V8 | 3 | 0.001 | 0.003 | Weight loss |
| V9 | 3 | 0.001 | 0.003 | Improve digestion |
| V10 | 3 | 0.0005 | 0.002 | Improve glucose level |
| A11 | 6 | 0.0004 | 0.002 | Blood detoxifier |
| A12 | 1 | 0.03 | 0.03 | Muscle development |
| V13 | 6 | 0.0005 | 0.003 | Improve the immune system |
| V14 | 6 | 0.0005 | 0.003 | Weight loss |
| V15 | 1 | 0.03 | 0.033 | Improve the immune system |
| V16 | 4 | 0.0005 | 0.002 | Weight loss |
| V17 | 2 | 0.0005 | 0.001 | Weight loss |
| V18 | 2 | 0.0005 | 0.001 | Antioxidant |
| V19 | 6 | 0.001 | 0.006 | Weight loss |
| V20 | 3 | 0.001 | 0.004 | Improve digestion |
| A21 | 2 | 0.015 | 0.030 | Improve the immune system |
| V22 | 1 | 0.025 | 0.025 | Improve the immune system |
| S24 | 1 | 0.040 | 0.040 | Relaxing of the blood vessels |
| V25 | 1 | 0.002 | 0.002 | Improve digestion |
| V26 | 2 | 0.0005 | 0.001 | Antioxidant |
| S27 | 2 | 0.0005 | 0.001 | Regulation of the sleep cycle |
| S28 | 1 | 0.0006 | 0.0006 | Booster energy |
| S29 | 1 | 0.005 | 0.005 | Increased muscle mass |
| S30 | 1 | 0.005 | 0.005 | Increased muscle mass |
| S31 | 1 | 0.005 | 0.005 | Increased muscle mass |
| V32 | 6 | 0.001 | 0.006 | Weight loss |
| V33 | 3 | 0.0005 | 0.002 | Improve glucose level |
| V34 | 2 | 0.0005 | 0.001 | Antioxidant |
| C35 | 1 | 0.001 | 0.001 | Weight loss |
| A36 | 6 | 0.0004 | 0.002 | blood detoxifier |
| V37 | 3 | 0.001 | 0.003 | Weight loss |
| V38 | 6 | 0.0005 | 0.003 | Weight loss |
| V39 | 3 | 0.001 | 0.004 | Improve digestion |
| C40 | 1 | 0.0005 | 0.0005 | Booster energy |
| V41 | 6 | 0.0005 | 0.003 | Improve the immune system |
| A42 | 1 | 0.03 | 0.030 | Improve muscle development |
| V43 | 3 | 0.001 | 0.003 | Improve digestion |
| V44 | 1 | 0.001 | 0.001 | Weight loss |
| A45 | 3 | 0.003 | 0.009 | Muscle activity and cell growth |
| A46 | 3 | 0.003 | 0.009 | Muscle activity and cell growth |
| A47 | 3 | 0.003 | 0.009 | Muscle activity and cell growth |
* Dietary supplements presentation were in tables, capsules, powder, and liquid.
Table 3.
Results of the recovery study in the dietary supplements.
| aSample ID | Standard adition (µg/L) | bMetal concentration (µg/L) | % Recovery | ||||
|---|---|---|---|---|---|---|---|
| Pb | Cr | As | Pb | Cr | As | ||
| V9 | 0 | 4.03 ± 0.17 | 28.94 ± 0.17 | 0.40 ± 0.09 | 86 | 104 | 96 |
| 25 | 25.52 ± 1.28 | 55.5 ± 0.4 | 25.02 ± 0.52 | ||||
| V10 | 0 | 2.16 ± 0.07 | 0.397 ± 0.001 | ˂LOD | 95 | 96 | 91 |
| 25 | 25.94 ± 0.56 | 24.51 ± 0.15 | 22.65 ± 0.37 | ||||
| A11 | 0 | 3.83 ± 0.23 | 73.07 ± 0.29 | 0.70 ± 0.13 | 86 | 96 | 98 |
| 25 | 25.29 ± 0.22 | 97.13 ± 0.44 | 25.21 ± 0.34 | ||||
| A12 | 0 | 1.77 ± 0.03 | 0.3894 ± 0.0002 | 0.47 ±0.04 | 92 | 95 | 103 |
| 25 | 24.77 ± 0.32 | 24.10 ± 0.13 | 26.23 ± 0.36 | ||||
| V14 | 0 | 3.82 ± 0.12 | 0.414 ± 0.001 | 2.26 ± .06 | 94 | 102 | 97 |
| 25 | 27.29 ± 0.84 | 26.04 ± 0.24 | 26.49 ± 0.64 | ||||
| V15 | 0 | 2.43 ± 0.09 | 0.72 ± 0.01 | ˂LOD | 97 | 101 | 104 |
| 25 | 26.57 ± 0.87 | 25.95 ± 0.14 | 26.03 ± 0.18 | ||||
| V16 | 0 | 3.34 ± 0.02 | 151.66 ± 0.09 | 0.08 ± 0.02 | 96 | 96 | 99 |
| 25 | 27.29 ± 0.24 | 175.61 ± 0.79 | 24.76 ± 0.61 | ||||
| S27 | 0 | 0.26 ± 0.02 | 1.85 ± 0.04 | 0.21 ± .04 | 96 | 89 | 100 |
| 25 | 24.26 ± 0.96 | 24.09 ± 0.40 | 25.29 ± 0.11 | ||||
| M1 | 0 | 5.6 ± 0.7 | 163.01 ± 0.39 | 0.26 ± 0.02 | 83 | 107 | 106 |
| 25 | 26.4 ± 0.2 | 189.7 ± 0.8 | 26.75 ± 0.36 | ||||
| C6 | 0 | 2.65 ± 0.07 | 12.88 ± 0.42 | 0.09 ± 0.02 | 94 | 93 | 104 |
| 25 | 26.15 ± 0.18 | 36.2 ± 0.2 | 26.1 ± 0.3 | ||||
aThe results are reported as the Pb, Cr, and As concentration in the analyzed solutions. bResults are expressed as the mean value ± s (n = 3). s, standard deviation.
Table 4.
Heavy metals in dietary supplements samples.
| Sample ID | Pb (mg/Kg) | Cr (mg/Kg) | As (mg/Kg) |
|---|---|---|---|
| M1 | 4.51 ± 0.66 | 131.46 ± 0.39 | 0.21 ± 0.02 |
| V2 | 1.63 ± 0.02 | 12.97 ± 0.06 | 0.31 ± 0.04 |
| M3 | 1.08 ± 0.17 | 15.97 ± 0.46 | 0.46 ± 0.06 |
| V4 | 1.52 ± 0.07 | 11.19 ± 0.32 | 0.26 ± 0.02 |
| M5 | 1.64 ± 0.14 | 2.15 ± 0.01 | 1.34 ± 038 |
| C6 | 1.75 ± 0.06 | 8.47 ± 0.42 | 0.06 ± 0.09 |
| V7 | 0.82 ± 0.04 | 2.67 ± 0.06 | 0.12 ± 0.05 |
| V9 | 4.20 ± 0.16 | 30.14 ± 0.17 | 0.42 |
| V10 | 2.16 ± 0.06 | 0.1588 ± 0.0005 | ˂ LOD |
| A11 | 9.03 ± 0.22 | 34.68 ± 0.44 | 11.41 ± 0.65 |
| A12 | 1.58 ± 0.03 | 0.3476 ± 0.0001 | 0.424 ± 0.039 |
| V13 | 2.55 ± 0.06 | 6.31 ± 0.15 | 39.93 ± 0.32 |
| V14 | 2.51 ± 0.11 | 0.272 ± 0.001 | 1.49 ± 0.05 |
| V15 | 2.25 ± 0.09 | ˂ LOD | 0.66 ± 0.04 |
| V16 | 2.98 ± 0.03 | 135.41 ± 0.10 | 0.07 ± 0.03 |
| V17 | 1.98 ± 0.05 | 8.00 ± 0.33 | 5.91 ± 0.96 |
| V18 | 8.17 ± 0.05 | 29.81 ± 0.34 | 1.47 ± 0.03 |
| V19 | 2.59 ± 0.02 | 150.01 ± 0.03 | ˂ LOD |
| V20 | 2.64 ± 1.05 | 65.96 ± 0.33 | 0.12 ± 0.09 |
| A21 | 0.59 ± 0.07 | 1.15 ± 0.08 | ˂ LOD |
| V22 | 0.39 ± 0.04 | 0.32083 ± 0.00008 | ˂ LOD |
| S24 | 0.40 ± 0.02 | 2.49 ± 0.03 | ˂ LOD |
| V25 | 0.94 ± 0.07 | 0.16 ± 0.02 | ˂ LOD |
| V26 | 0.73 ± 0.4 | 22.52 ± 0.28 | 1.08 ± 0.02 |
| S27 | 0.29 ± 0.02 | 2.00 ± 0.04 | 0.23 ± 0.01 |
| S28 | 1.485 ± 0.002 | 0.420 ± 0.004 | ˂ LOD |
| S29 | 1.749 ± 0.009 | 0.687 ± 0.013 | ˂ LOD |
| S30 | 1.7857 ± 0.0005 | 0.632 ± 0.006 | ˂ LOD |
| S31 | 1.812 ± 0.001 | 0.466 ± 0.002 | ˂ LOD |
| V32 | 0.54 ± 0.10 | 233.20 ± 1.45 | 0.24 ± 0.06 |
| V33 | 0.49 ± 0.17 | ˂ LOD | 0.05 ± 0.02 |
| V34 | 0.47 ± 0.1 | 25.84 ± 0.71 | 0.93 ± 0.05 |
| C35 | 0.24 ± 0.14 | 14.52 ± 0.56 | 0.18 ± 0.02 |
| A36 | 0.41 ± 0.11 | 39.56 ± 0.45 | 0.25 ± 0.05 |
| V37 | 0.58 ± 0.12 | ˂ LOD | ˂ LOD |
| V38 | 0.53 ± 0.03 | 3.09 ± 0.18 | 0.28 ± 0.11 |
| V39 | ˂ LOD | 15.15 ± 0.23 | ˂ LOD |
| C40 | 0.07 ± 0.01 | 0.08 ± 0.02 | 1.55 ± 0.25 |
| V41 | ˂ LOD | 6.95 ± 0.09 | 37.11 |
| A42 | 0.39 ± 0.09 | ˂ LOD | ˂ LOD |
| V43 | 1.39 ± 0.20 | 24.16 ± 0.32 | 0.026 ± 0.008 |
| V44 | 0.86 ± 0.07 | 127.97 ± 0.48 | 0.31 ± 0.1 |
| A45 | 7.20 ±0.61 | 15.36 ± 0.15 | 0.47 ± 0.17 |
| A46 | 4.11 ± 0.17 | 18.21 ± 0.33 | ˂ LOD |
| A47 | 6.32 ± 0.17 | 8.71 ± 0.30 | ˂ LOD |
| Minimum | 0.0700 ± 0.0005 | 0.07800 ± 0.00008 | 0.0260 ± 0.0004 |
| Maximum | 9.03 ± 1.05 | 233.20 ± 1.45 | 39.93 ± 0.96 |
| Mean | 1.99 ± 0.13 | 26.88 ± 0.23 | 2.39 ± 0.11 |
Results are expressed as the mean value ± s (n = 3); s, standard deviation; ˂ LOD, values lower than TXRF limit detection.
Table 5.
Estimated Daily Intake (EDI), Target Hazard Quotients (THQ), and Hazard Index for lead, chromium and, arsenic from food supplements consumed by adults.
Table 5.
Estimated Daily Intake (EDI), Target Hazard Quotients (THQ), and Hazard Index for lead, chromium and, arsenic from food supplements consumed by adults.
| Sample ID |
EDI (mg/Kg bw/Day) | THQ | HI | ||||
|---|---|---|---|---|---|---|---|
| Pb | Cr | As | Pb | Cr | As | ||
| A11 | 3.10E-04 | 1.19E-03 | 3.91E-04 | 0.06 | 0.28 | 0.93 | 1.27 |
| A12 | 6.77E-04 | 1.49E-04 | 1.82E-04 | 0.14 | 0.04 | 0.43 | 0.60 |
| A21 | 2.53E-04 | 4.93E-04 | NA | 0.05 | 0.12 | NA | 0.17 |
| A36 | 1.41E-05 | 1.36E-03 | 8.57E-06 | 0.003 | 0.32 | 0.02 | 0.35 |
| A42 | 1.67E-04 | NA | NA | 0.03 | NA | NA | 0.03 |
| A45 | 9.25E-04 | 1.97E-03 | 6.002E-05 | 0.19 | 0.47 | 0.14 | 0.80 |
| A46 | 5.28E-04 | 2.34E-03 | NA | 0.11 | 0.56 | NA | 0.66 |
| A47 | 8.13E-04 | 1.12E-03 | NA | 0.17 | 0.27 | NA | 0.43 |
| C35 | 3.43E-06 | 2.07E-04 | 2.57E-06 | 0.001 | 0.05 | 0.01 | 0.06 |
| C40 | 5.00E-07 | 5.57E-07 | 1.11E-05 | 0.0001 | 0.0001 | 0.03 | 0.03 |
| C6 | 4.13E-05 | 2.00E-04 | 1.3E-06 | 0.01 | 0.05 | 0.0003 | 0.06 |
| M1 | 1.29E-04 | 3.76E-03 | 6.00E-06 | 0.03 | 0.89 | 0.01 | 0.93 |
| M3 | 2.31E-05 | 3.42E-04 | 9.86E-06 | 0.005 | 0.08 | 0.02 | 0.11 |
| M5 | 2.34E-05 | 3.071E-05 | 1.91E-05 | 0.005 | 0.01 | 0.05 | 0.06 |
| S24 | 2.30E-04 | 1.42E-03 | NA | 0.05 | 0.34 | NA | 0.38 |
| S27 | 4.10E-06 | 2.86E-05 | 3.29E-06 | 0.001 | 0.01 | 0.01 | 0.02 |
| S28 | 1.32E-05 | 3.75E-06 | NA | 0.003 | 0.001 | NA | 0.004 |
| S29 | 1.25E-04 | 4.91E-05 | NA | 0.03 | 0.01 | NA | 0.04 |
| S30 | 1.27E-04 | 4.51E-05 | NA | 0.03 | 0.01 | NA | 0.04 |
| S31 | 1.29E-04 | 3.33E-05 | NA | 0.03 | 0.01 | NA | 0.03 |
| V10 | 4.63E-05 | 3.40E-06 | NA | 0.01 | 0.0008 | NA | 0.01 |
| V13 | 1.09E-04 | 2.70E-04 | 1.71E-03 | 0.02 | 0.06 | 4.06 | 4.15 |
| V14 | 1.08E-04 | 1.17E-05 | 6.39E-05 | 0.02 | 0.003 | 0.15 | 0.18 |
| V15 | 1.06E-03 | NA | 3.11E-04 | 0.22 | NA | 0.74 | 0.95 |
| V16 | 8.51E-05 | 3.87E-03 | 2.00E-06 | 0.02 | 0.92 | 0.005 | 0.94 |
| V17 | 2.83E-05 | 1.14E-04 | 8.44E-05 | 0.01 | 0.03 | 0.20 | 0.23 |
| V18 | 1.17E-04 | 4.26E-04 | 2.10E-05 | 0.02 | 0.10 | 0.05 | 0.17 |
| V19 | 2.23E-04 | 1.29E-02 | NA | 0.05 | 3.05 | NA | 3.10 |
| V2 | 2.79E-05 | 2.22E-04 | 5.31E-06 | 0.01 | 0.05 | 0.01 | 0.07 |
| V20 | 1.36E-04 | 3.39E-03 | 6.17E-06 | 0.03 | 0.81 | 0.01 | 0.85 |
| V22 | 1.39E-04 | 1.15E-04 | NA | 0.03 | 0.03 | NA | 0.06 |
| V23 | 2.20E-03 | 1.73 | 3.27 | 0.45 | 410.75 | 777.45 | 1188.64 |
| V25 | 2.01E-05 | 3.43E-06 | NA | 0.004 | 0.001 | NA | 0.005 |
| V26 | 1.04E-05 | 3.22E-04 | 1.54E-05 | 0.002 | 0.08 | 0.04 | 0.12 |
| V32 | 4.63E-05 | 2.00E-02 | 2.06E-05 | 0.01 | 4.75 | 0.05 | 4.80 |
| V33 | 1.05E-05 | NA | 1.07E-06 | 0.002 | NA | 0.003 | 0.005 |
| V34 | 6.71E-06 | 3.69E-04 | 1.33E-05 | 0.001 | 0.09 | 0.03 | 0.12 |
| V37 | 2.49E-05 | NA | NA | 0.01 | NA | NA | 0.01 |
| V38 | 2.27E-05 | 1.32E-04 | 1.20E-05 | 0.005 | 0.03 | 0.03 | 0.06 |
| V39 | NA | 7.79E-04 | NA | NA | 0.19 | NA | 0.19 |
| V4 | 3.26E-05 | 2.40E-04 | 5.57E-06 | 0.01 | 0.06 | 0.01 | 0.08 |
| V41 | NA | 2.98E-04 | 1.59E-03 | NA | 0.07 | 3.78 | 3.85 |
| V43 | 6.55E-05 | 1.14E-03 | 1.23E-06 | 0.01 | 0.27 | 0.003 | 0.29 |
| V44 | 1.47E-05 | 2.19E-03 | 5.31E-06 | 0.00 | 0.52 | 0.01 | 0.54 |
| V7 | 4.22E-05 | 1.37E-04 | 6.1E-06 | 0.01 | 0.03 | 0.01 | 0.06 |
| V8 | 1.42E-02 | 5.41E-02 | NA | 2.90 | 12.85 | NA | 15.75 |
| V9 | 1.98E-04 | 1.42E-03 | 1.98E-05 | 0.04 | 0.34 | 0.05 | 0.42 |
NA, not applicable.
Table 6.
PCC demonstration of TMs and nHMs in dietary supplement samples.
| EDI_Pb | EDI_Cr | EDI_As | HI | ||
|---|---|---|---|---|---|
| EDI_Pb | Pearson correlation | 1 | 0.015 | 0.029 | 0.077 |
| Sig. (two-sided) | 0.924 | 0.848 | 0.613 | ||
| N | 45 | 45 | 45 | 45 | |
| EDI_Cr | Pearson correlation | 0.015 | 1 | -0.081 | 0.682** |
| Sig. (two-sided) | 0.924 | 0.598 | <0.0001 | ||
| N | 45 | 45 | 45 | 45 | |
| EDI_As | Pearson correlation | 0.029 | -0.081 | 1 | 0.672** |
| Sig. (two-sided) | 0.848 | 0.598 | <0.0001 | ||
| N | 45 | 45 | 45 | 45 | |
| HI | Pearson correlation | 0.077 | 0.682** | 0.672** | 1 |
| Sig. (two-sided) | 0.613 | 0.000 | 0.000 | ||
| N | 45 | 45 | 45 | 45 | |
**. The correlation is significant at the 0.01 level (2-tailed).
Disclaimer/Publisher’s Note: The statements, opinions and data contained in all publications are solely those of the individual author(s) and contributor(s) and not of MDPI and/or the editor(s). MDPI and/or the editor(s) disclaim responsibility for any injury to people or property resulting from any ideas, methods, instructions or products referred to in the content. |
© 2025 by the authors. Licensee MDPI, Basel, Switzerland. This article is an open access article distributed under the terms and conditions of the Creative Commons Attribution (CC BY) license (http://creativecommons.org/licenses/by/4.0/).
Copyright: This open access article is published under a Creative Commons CC BY 4.0 license, which permit the free download, distribution, and reuse, provided that the author and preprint are cited in any reuse.


