
Submitted:
21 January 2025
Posted:
22 January 2025
You are already at the latest version
Abstract
The feature retrieval technology for building floor plans has garnered significant attention in recent years. Efficient information retrieval is essential for the effective management and execution of construction projects. This paper presents a comprehensive exploration of four primary features in the retrieval of building floor plans: Semantic features, Spatial features, Shape features, and Texture features(3ST features). The extraction algorithms and principles associated with these features are analyzed, and relevant methods, such as wavelet transforms and Fourier shape descriptions, are discussed. Additionally, the performance of various retrieval algorithms is evaluated through experimental analysis, providing valuable insights for the retrieval of building floor plans. Finally, this study anticipates future directions for the development of feature retrieval technology in floor plans.
Keywords:
Floor plan feature retrieval
; 3ST features
; Wavelet transforms
; Fourier shape descriptions
Introduction
An architectural blueprint serves as a foundational representation of a building’s layout from an aerial perspective, encompassing a horizontal projection and a corresponding legend. It is a fundamental example of a construction drawing, illustrating the shape, size, and arrangement of the structure while detailing the dimensions and materials of walls and columns, as well as the types and placements of windows and doors. This blueprint is a crucial reference for delineating lines, erecting walls, installing doors and windows, executing interior and exterior finishes, and formulating budgets during the construction phase, as shown in Figure 1.
A floor plan is a two-dimensional (2D) horizontal projection of a building’s floors, effectively conveying the layout of its spatial components, such as regions, doors, and walls. Automatic floor plan retrieval has been actively studied over the past few decades [1]. A fundamental task in this area is segmenting a floor plan into regions (e.g., bedroom, living room) with accurate labels. However, the heterogeneous information present in floor plans complicates semantic segmentation, including tasks like line detection and region-growing segmentation [2]. With the emergence of deep learning neural networks (DNNs), DNN-based planar graph retrieval has gained significant popularity [3]. In particular, the integration of convolutional neural networks (CNNs) and recurrent neural networks (RNNs) has proven to be a powerful approach. Notable DNN architectures include Fully Convolutional Networks (FCN)[4], U-Net[5], and DeepLab [6]. These architectures have applications in various domains, including digitizing residential structures [7], analyzing and identifying elements in 2D building plans, constructing 3D models of buildings [8,9,10,11], evaluating the appeal of a building’s layout to users [12,13], and simulating immersive virtual reality (VR) indoor architectural environments [14].
The complexity and size of building plans necessitate large datasets for training deep learning models; however, issues such as blur, overlap, and distortion can negatively impact the accuracy of retrieval models. Conversely, prompt and precise retrieval of relevant plans can significantly enhance the work efficiency of designers, engineers, and architects. A robust retrieval system enables designers to swiftly identify similar design cases, foster innovation, and inform design decisions. Through the efficient retrieval and management of spatial layout, structural design, equipment configuration, and other resources, the building design and construction process can be optimized, ultimately minimizing resource waste. With the advancement of building information modeling (BIM) and intelligent building technology, the importance of efficiently and accurately retrieving and analyzing building plan features has grown significantly. This paper intends to thoroughly investigate the key features of building plan feature retrieval technology, including semantic, spatial, texture, and shape characteristics, emphasizing their significance and potential applications.
The main contributions of this paper are as follows:
- Through the systematic classification of various features in building floor plans, this paper offers a comprehensive framework to assist researchers and practitioners in understanding and applying these features more effectively. This classification not only aids theoretical research but also offers guidance for practical implementations.
- Through a detailed analysis of the four features, this paper presents innovative tools and methodologies for architectural designers and planners in selecting and optimizing schemes, illustrating how these tools collaboratively operate to extract and analyze building floor plan features. This advancement contributes to enhancing design efficiency and effectiveness.
1. Floor Plan Retrieval Overview
1.1. Overview of Floor Plan Feature Extraction
The floor plan retrieval method based on deep learning primarily employs models such as Convolutional Neural Networks (CNN), RC-Net, Faster R-CNN, Transformers, and Graph Matching Networks (GMN) to extract features from building floor plans. By identifying unique high-level semantic features and employing feature vectors to calculate image similarity, this approach enables effective retrieval of building floor plans. Prior to 2013, the forward extraction method was predominantly utilized, directly extracting relevant information or features from images, such as identifying and isolating structural components like walls, doors, and windows [15,16,17]. However, the efficiency of direct recognition is limited due to the lack of distinct features for these elements in the floor plan, whereas functional components, such as beds and tables, are more clearly defined [18]. To address this challenge, the reverse extraction method was introduced in 2019, also referred to as the inverse extraction method, which derives or generates new information from previously extracted data and utilizes algorithmic modeling to identify and remove functional components, thereby enhancing extraction efficiency [19].
In 2017, the reference [20] employed Convolutional Neural Networks (CNNs) to detect connection points, such as wall corners and door endpoints, in building floor plans. This method links these intersections and identifies doors in walls using an integer programming algorithm. In 2023, the reference [21] utilized the RC-Net framework to extract basic features from floor plan images using VGG encoders. One feature branch focuses on room boundaries and types, thereby optimizing the learning of features essential for predicting these characteristics. The final output is a room mask, which combines textual features from the text branch with room features to enhance accuracy. In 2021, reference [22] proposed a novel approach that integrates Graph Convolutional Networks (GCNs) and CNNs into an end-to-end architecture. This architecture includes a CNN backbone, a graph convolution header, and a detection header, which together form the baseline network for panoramic symbol recognition tasks. The CNN-GCN approach achieved state-of-the-art (SOTA) performance in semantic symbol recognition. In 2017, reference [15] employed DANIEL, a deep learning-based search framework, to extract both low-level and high-level semantic features. In 2019, reference [16] introduced a novel unified framework for floor plan retrieval using multimodal queries. CNNs were employed for feature extraction, while Cyclic GANs facilitated cross-domain sample generation, integrated with self-encoders for domain mapping, ultimately enabling similarity matching and retrieval. With advancements in Graph Neural Networks (GNNs), reference [23] analyzed planar graphs based on graph structures and GNNs in 2021, showing that GNNs outperform Faster R-CNN in both performance and accuracy, making them suitable for processing large building floor plans. In 2023, reference [7] introduced a technique for transforming 2D floor plans into 3D models. This method initially segments structural components such as walls and identifies associated symbols, including doors and windows. Subsequently, wall details are extracted from the predicted segmentation mask to generate semantic elements, which are then employed to construct a 3D model according to Industry Foundation Classes (IFC) standards.
Regarding the conversion of 3D models into architectural floor plans, reference [11] introduces FloorNet, an innovative deep neural network (DNN) architecture. This model performs pixel-level predictions of floor plan geometry and semantics from RGBD videos, which cover extensive 3D spaces. It then reconstructs vector graphic floor plans using established integer programming formulations. In another study, reference [24] utilizes VGG encoders to extract features from building floor plans and facilitates feature sharing through network learning. This research also proposes a spatial context module designed to transfer room boundary features from the top-layer decoder to the bottom-layer decoder, thereby improving the accuracy of room type predictions.
Additionally, reference [25] presents an automated framework for recognizing and reconstructing building floor plans. This approach involves extracting structural information from rooms using deep segmentation and detection neural networks, determining room dimensions through key point detection and cluster analysis, vectorizing room data via an iterative optimization method, and producing vectorized 3D reconstruction outputs. Lastly, reference [26] applies three techniques—Gaussian noise, Gaussian fuzzification, and random rotation—to enhance input floor plans. Furthermore, multiple rounds of random erosion operations are conducted on the target wall image to reduce the model’s sensitivity to pixel variations at wall edges, thereby improving its ability to effectively learn wall edge features. In summary, floor plan retrieval relies on image processing, feature extraction, image matching, and machine learning, encompassing a wide range of applications and complex algorithms. As the volume of data continues to grow, new technologies are constantly being developed and refined.
1.2. Overview of Floor Plan Retrieval Architecture
1.2.1. Network Feedforward Solutions
In the field of architecture, extracting deep features from building floor plans is crucial for tasks such as building identification, design, and analysis. The emergence of deep learning techniques has driven significant progress in computer vision and image processing, leading to the development of novel feed-forward neural network architectures tailored for the extraction of complex features from building floor plans. In the study by reference [24], a new approach is introduced for recognizing elements within building floor plans by constructing a hierarchical model of floor plan components. This method leverages the VGG deep convolutional neural network architecture combined with a room boundary-guided attention mechanism to improve floor plan recognition. By predicting both room boundary elements and room types, the model organizes floor plan components into a hierarchical structure, classifying them based on their placement within the interior or exterior of the building. Interior elements are further categorized into room boundary elements (including walls, doors, and windows) and room type elements (such as living rooms, bathrooms, and bedrooms), as shown in Figure 2.
A 2022 study introduces a feature extraction framework that combines a U-Net encoder-decoder with a graph convolutional network. This architecture consists of a contraction path with multiple convolutional and pooling layers, as well as a symmetric expansion path that includes an upsampling layer (transposed convolution) and regular convolution operations. The U-Net model effectively extracts features by merging shallow and deep information, capturing both local and global context within building floor plans. The upsampling layer facilitates feature fusion and spatial recovery, while the contraction path progressively consolidates low-level features into more abstract representations with larger receptive fields. The expansion path then restores these features to super-resolution, ensuring dense segmentation at the original resolution.
To enhance planar segmentation and vectorization processes, researchers have proposed the DeepLabv3+ network as the foundational model. By integrating dilated convolution and spatial pyramid pooling techniques, this framework excels at extracting multi-scale features, including structural elements, textual annotations, and symbolic representations from pixel maps. This advanced approach accurately identifies room configurations, dimensions, and types, effectively capturing the intricate structure and detailed nuances of buildings across various scales. The system significantly improves accuracy and generalization capabilities, particularly excelling in planar segmentation and vectorization tasks, including the detection of slant walls. The degree of match between the optimized polygons and the room contours is represented by , while the match between the polygonal regions and the internal areas of the room is denoted by .
In Equation (1), denotes the shortest distance from b to line segment , and in Equation (2) denotes the region covered by polygonal rasterization.
A groundbreaking study referenced in [45] introduces a novel neural network architecture aimed at understanding both layout types and room types within architectural blueprints. This sophisticated architecture incorporates an n-dimensional fully connected layer placed behind the fc7 layer of the widely used VGG-16 model [46], which has been pre-trained on the extensive ImageNet dataset. In addition, a 2m-dimensional fully connected (FC) layer is specifically designed to classify various floor types, while a parallel set of 2m-dimensional FC layers collaborates to identify distinct room types. Here, n represents the different layout types under investigation, while m denotes the room types awaiting classification.
However, upon further analysis of the parameter optimization process in VGG-16, we identified a significant limitation: the process is governed by a feedback loop of layout type classification errors and room existence classification errors. Although this methodology fine-tunes the network’s parameters, it overlooks the critical role of edges within the complex network of architectural information. As a result, the network fails to capture the intricate details embedded in the interconnections between rooms, limiting its ability to understand the spatial relationships inherent in architectural layouts.
1.2.2. Feature Extraction of Floor Plans Structural Elements
In building plan analysis, the selection of depth features primarily focuses on extracting relevant insights from the original blueprint to enhance operational efficiency. When extracting wall features, the inherent variability and irregularity in shape and size necessitate a sophisticated approach. This study integrates the ResNet-based Feature Pyramid Network (FPN) architecture with a semantic segmentation technique. The process includes applying a contour extraction algorithm to isolate individual wall segments, generating appropriate rectangular representations, and utilizing the Canny operator for precise edge feature extraction. In contrast, for features such as doors and windows, which are characterized by discrete and repetitive symbols, a bounding box detection neural network is seamlessly integrated with the Faster R-CNN model, yielding effective results.
In related studies, a segmentation network was used to extract key structural elements, including walls, rooms, windows, and doors. A subsequent vectorization algorithm was applied to these elements, followed by a detection model to identify symbols and text within the extracted data. This information, along with the lengths of measurement lines, facilitated the calculation of the floor plan’s scale. As room-type text provides insights into the function of specific spaces, Wang et al.[47] employed text-branching techniques to extract textual features and integrate them with room characteristics in the merge module. This method aimed to enrich semantic features for future predictive analysis. Furthermore, GAO et al.[26] performed rigorous statistical analysis to assess feature importance during deep feature selection. This process involved segmenting the drawing box, extracting wall features by isolating wall centerlines, and feeding the results into the next spatial merging module for boundary completion and integration. The resulting data was thoroughly filtered to eliminate errors, ensuring the accuracy and reliability of the final output.
1.2.3. Similarity Measure
YAMASAKI et al.[17] introduce a novel approach for planar graph retrieval based on a fully convolutional network (FCN) and a graph model structure. This method applies a semantic segmentation algorithm to planar graphs using the FCN to categorize each component. Vertices are established when the segmented object exceeds a threshold size of 1000, and edges are added if the distance between objects is less than 30, transforming the planar graph into a graph model structure. Additionally, a new algorithm is devised and optimized to extract MCS[48] and isolated points, with similarity calculations on MCS used for retrieving images with similar structures.
In Equation (3), is denoted as the similarity of vertices and in graphs G and H. It is obtained by comparing the size of the set of vertices in the two graphs Equation (4) is the edge weight between two vertices and . The similarity between graphs G and H is ultimately computed by summation.
For multimodal feature extraction, YUKI et al. [45] propose a method for converting planar images into graph structures. The authors argue that the diverse drawing styles of each floor plan hinder the performance of traditional neural networks. To address this challenge, they introduce a framework that jointly optimizes room layout and room style classifiers. Features are extracted using the VGG network, transforming the structural characteristics of rooms into graph-based representations and converting the retrieval of similar attributes in floor plans into graph-based retrieval. This framework achieves an accuracy of 0.49 at . Reference [49] presents a unified framework that leverages a graph embedding method to represent graphs extracted from layouts. A two-stage matching and retrieval method, comprising Room Layout Matching (RLM) and Room Decoration Matching (RDM), is proposed for feature matching and retrieval. The evaluation focuses primarily on the ranking of retrieval results to assess the method’s ability to identify layouts similar to the query in the database. However, this approach has several limitations: the matching process occurs in two stages, which introduces a lack of uniformity; key features such as room dimensions, which are crucial for buyers, are not considered; and the dataset suffers from limited sample variation. To address these challenges, DIVYA et al. [50] introduce an end-to-end framework for extracting high-level semantic features (e.g., room sizes, adjacencies, and furnishings) in a fine-grained retrieval approach. This method employs feature fusion to aggregate high-level semantic features for retrieving similar building floor plans. The total matching score M is computed by weighing the four extracted feature scores.
Equation (6) delineates the RAS (Room Adjacency String) score, denotes the CAR (Ratio of Carpet Area) score, indicates the number of furniture score, indicates the type of furniture score.
2. Semantic Feature Retrieval
2.1. Semantic Feature Analysis
The feature extraction process for building plans is challenging due to the presence of interfering elements such as thin axes and walls with specific thicknesses. To mitigate the impact of these interfering lines and emphasize wall features, recent research [26] employed linear downsampling on input images, resizing them to 512 × 512 pixels to approximate the receptive field size of ResNet50 (483 × 483 pixels). Additionally, two iterations of erosion using a 3 × 3 filtering kernel were applied to replace hollow walls with solid walls. To address data scarcity, three data augmentation techniques were applied to the input plan views: Gaussian noise, Gaussian blurring, and random rotation, in order to mitigate overfitting. Furthermore, zero to two rounds of random erosion operations were applied to target wall images to reduce sensitivity to pixel variations along wall edges, enhancing the model’s ability to learn wall edge features.
To improve the semantic information of room type features, a study [27] employed combinatorial mapping and its dual approach. This method utilized two VGG-based feature extraction branches to predict boundaries and room types, integrating orientation-aware kernels and boundary features to enrich semantic information and generate a compact representation of both geometric and semantic details. By leveraging machine learning algorithms, this approach demonstrated strong potential for floor plan analysis across diverse room styles, underscoring its notable generalization capabilities.
2.2. Rule Feature Extraction Retrieval
Before the advent of deep learning methodologies, traditional approaches to building floor plan retrieval relied on manually crafted features (e.g., match points, histograms, and eigenvalues)[28], alongside rule-based techniques. In the context of building floor plan retrieval, fundamental graphical components (such as rooms, doors, and windows) must first be identified within the architectural layout[29]. Conventional methods typically segregate textual and image data and employ handcrafted rules to identify elements within building floor plans. However, reliance on manual feature design and rule-based formulations introduces several limitations. Firstly, the manual creation of features and rules requires specialized expertise and experience but often fails to address the complexities and variations in diverse building layouts, resulting in error-prone outcomes. Secondly, this approach lacks universality and is unable to adapt to different architectural styles and types, requiring extensive customization for various scenarios.
As early as 1996, a study [30] proposed a prototype system for the automated recognition and interpretation of hand-drawn architectural floor plans. This system utilized pattern recognition techniques to analyze processed images, extract architectural components (e.g., rooms, walls, doors, and windows), and organize them into a structured format. In 2011, another study [31] employed Speeded Up Robust Features (SURFs), including edge extraction and boundary detection, to extract localized information from architectural floor plans. The extracted structural data was subsequently used for analysis and retrieval tasks. In content-based image retrieval (CBIR), symbolic localization enabled document retrieval based on a query image and allowed pinpointing the query image’s specific location. Furthermore, a graph-based retrieval method, referred to as the "room connectivity graph," was proposed in [32]. This method extracted room connectivity graphs from the polygonal representations of buildings, capturing their topological relationships. By evaluating the subgraph isomorphism between the query graph and the room connectivity graph, the similarity between the query graph and the building model in the database was determined. This approach, effective for smaller graphs, demonstrated its viability for specific retrieval challenges. Another study [33] introduced a retrieval technique based on visual cues, where spatial and line features were quantified using Runlength Histogram (RH). The similarity between two building floor plans was computed using the cardinal distance ( distance), and the retrieved similarity was verified through subjective observer evaluation.
In Equation (7), P and Q represent the signatures of distinct planar graphs. With the rise and advancement of machine learning algorithms, the inherent constraints imposed by conventional heuristics reliant on specific styles are effectively bypassed. A study published in [34] introduces a methodology grounded in statistical plane segmentation and structural pattern recognition for the analysis and interpretation of floor plans. This approach embraces a bottom up two-step recognition procedure, wherein textual content is segregated from images through text-image segmentation during data preprocessing before the recognition phase.
The initial step of the recognition process involves identifying fundamental building region blocks, such as walls, doors, and windows, at the pixel level using statistical plane-based segmentation. Subsequently, during the transformation of the pixel image into vector space, the wall entities are isolated, and amalgamated with the doors and windows, and the rooms are identified by locating enclosed areas in the solid plane to generate corresponding Figure 3.
According to the China Civil Building Design Terminology Standard [35] and the Industry Foundation Classes (IFC) standard, building plans are generally categorized into two primary components: structural components and functional components. Structural components mainly include load-bearing walls, non-load-bearing walls, columns, doors, windows, railings, and stairs. In contrast, functional components, which do not directly affect the load-bearing structure but contribute to spatial partitioning and aesthetic design, include furniture elements such as tables, beds, cabinets, and other furnishings [36]. During searches for building floor plans, these component types can be analyzed based on their characteristics and functions to improve search efficiency and accuracy.
In the field of building structural components, a study [37] introduced a lightweight and fully automated processing technique for analyzing building floor plans. Initially, the method applies regional segmentation using the mean integral projection function (IPF) to identify wall-containing regions. Subsequently, critical information, such as wall locations, is extracted using a sparse point pixel vectorization algorithm based on non-detailed data. Finally, a linear discriminative analysis algorithm, utilizing QR decomposition and generalized singular value decomposition, is employed to identify building components such as doors, windows, and wall openings.Another study [31] proposed an algorithm specifically designed to recognize and extract structural components, including walls, doors, and windows. The approach eliminates the exterior wall through successive erosion and expansion operations, extracts wall contours from connected components, applies polygon approximation to each contour to determine wall edges, and uses symbol recognition techniques such as SURF to detect doors and windows.
Given that structural components such as walls, doors, and windows exhibit non-distinct features and varied shapes in plan views, possessing strong abstraction and weak regularity, direct recognition efficiency may fall short of desired levels. Hence, initial recognition of functional components in the building floor plan, such as tables, beds, and chairs, becomes imperative. A study [19]introduces the Faster R-CNN model, leveraging three deep learning networks to recognize, locate, and remove functional components in building floor plans. Additionally, another research effort [24] devises a deep multi-neural network incorporating spatial context modules and room boundary-guided attention mechanisms to enhance the recognition performance of diverse elements in floor plans, encompassing walls, rooms, doors, and windows.
These diverse methodologies represent deep learning-based approaches for recognizing architectural floor plan elements. After element recognition, retrieval of building floor plan components necessitates matching recognition based on geometric features like shape, location, and more. In a scholarly work [38], researchers propose a sketch-based system (a.Scatch system) that extracts semantic structures from past projects. Initially, information such as walls, symbols, and texts is segmented, yielding thick, medium, and thin line images through erosion and expansion operations. Thick lines delineate building boundaries, medium lines represent internal structures, and thin lines signify architectural elements like doors, windows, and furniture. Subsequently, structural information is extracted and subjected to semantic analysis using Speeded-Up Robust Features (SURF). The extracted structures are then compared using graph-matching techniques to retrieve the most similar results. Another approach outlined in reference [39] revolves around PU learning, efficiently analyzing planar graphs to recognize diverse structural element styles with minimal user interaction. This method involves extracting regions of interest (RoIs) from the image, filtering RoIs similar to the query based on IoU thresholds, performing feature extraction using Haar-based kernels on the remaining RoIs, and ultimately retrieving similar RoIs through PU learning.
3. Texture Feature Retrieval
3.1. Gabor Wavelet Transform
The texture features of an image are intrinsically related to the surface structure of the object depicted. Image texture reflects local structural characteristics, specifically manifested as variations in the grayscale or color of pixels within a defined neighborhood. In the early 1970s, Haralick et al. introduced a co-occurrence matrix representation to characterize texture features [40]. Initially, a co-occurrence matrix is constructed based on pixel direction and distance, followed by the extraction of relevant statistics to serve as a texture representation. However, the texture properties derived from the co-occurrence matrix often lack visual similarity. Consequently, there is a need to explore feature extraction methods that align more closely with human visual perception.
In the early 1990s, following the introduction of the wavelet transform and the establishment of its theoretical framework, numerous researchers began investigating the application of wavelet transforms for texture representation. Empirical evidence has demonstrated the effectiveness of these studies. Manjunath and Ma [41] demonstrated that utilizing the Gabor wavelet transform for feature extraction in content-based image retrieval is more effective than employing the pyramid wavelet transform (PWT) and the tree wavelet transform (TWT). The Gabor filter comprises a collection of wavelets, each capturing energy at a specific frequency and orientation. According to this framework, the signal is expanded to obtain a local frequency description, effectively capturing the signal’s local characteristics and energy. Subsequently, texture features can be extracted from this collection of energy distributions. The variability in scale (frequency) and direction of the Gabor filter renders it particularly useful for texture analysis.
For an image defined with size , its high-frequency Gabor wavelet transform is represented as:
where s and t are the variables of the wavelet filter size, and is the complex transform of . is derived from equation (9), which is the wavelet function, generating a set of similar functions defined as:
Among them, W is referred to as the modulation frequency. It is derived from the Gabor wavelet equation (10).
Here, m and n represent the standards and directions of the small waves, where and ,
3.2. Texture Spectrum
After performing multi-scale and multi-directional filtering on an image, a multi-dimensional array is obtained:
These dimensions represent the energy of different scales and directions in the image. The main purpose of texture-based image retrieval is to find images or regions in images with similar textures. Assuming that an image or a region has the same texture, the mean value and standard deviation of the transform coefficients can be used to represent the texture characteristics of the region:
He DC et al. proposed the concept of texture spectrum in the early 1990s [43]. Compared with previous methods, texture spectrum has a clearer concept and requires less computation, and has received more and more attention in recent years. The following will describe in detail the basic method of texture spectrum model and some improved texture spectrum models. For a neighborhood in an image, as shown in Table 16, the nine pixels in the neighborhood are recorded as , where represents the pixel value at the center of the neighborhood. At the same time, a texture unit is defined, and contains 8 pixels. , where the value of is:
Where , C represents a positive constant, and corresponds to pixel i . For each element in , there are three possible values, so for 8 units there are possible values. The texture unit can be written as follows:
The image texture unit characterizes the textural features of a given pixel, specifically the relative grayscale relationship between the central pixel and its surrounding neighboring pixels. The occurrence frequency of all texture units within the image is quantified, and this frequency function delineates the texture information of the image under analysis. This function, referred to as the texture spectrum, encapsulates the distribution of all texture units. A texture spectrum histogram can be constructed with the horizontal axis representing the number of texture units (NTU) and the vertical axis indicating the occurrence frequency. Generally, an image comprises two components: texture primitives and random noise or background. The greater the proportion of texture components relative to the background, the more readily the texture features can be perceived by human vision. Regarding the texture spectrum, a higher percentage of texture components in an image yields a distinct peak distribution. Moreover, different textures are characterized by unique texture units with corresponding texture spectra. Thus, from this perspective, the texture information of an image is effectively represented by the texture spectrum.

Table 1.
Texture unit
| V1 | V2 | V3 |
|---|---|---|
| *V4 V6 | *V0 V7 | *V5 V8 |
4. Spatial Feature Retrieval
4.1. Topological and Geometric Feature
4.1.1. Topological Feature Retrieval
Conventional methods for locating room layouts primarily focus on matching room functions and adjacency, often neglecting the internal shapes of rooms. Inspired by the principles of shape grammar, Lee et al. introduce a novel approach that transforms building floor plans into a tree-like structure to address challenges in floor plan retrieval [51]. This method integrates internal layout considerations into similarity metrics, representing room layout structures through a hierarchical tree framework. Subsequently, floor plan retrieval is executed using tree editing distance as a metric for query similarity. Matching based on the tree structure is computationally efficient, preserving high-level feature information through parent-child relationships. In particular, this retrieval method, which is based on matching the shapes of structural hierarchies, eliminates the need to account for variations in room functions, resulting in a remarkable experimental efficacy of 53%. The tree editing distance [26] serves as the pivotal similarity metric between the query and the candidate parse tree. To compute the tree edit distance effectively, costs must be allocated to editing operations (relabeling, adding, deleting), necessitating an ordered arrangement of the tree to achieve polynomial complexity for the tree edit distance [44,48]. Initially, tree nodes are sorted based on the number of child nodes, and in cases of equal child nodes, by room size. The matching metric C is computed as follows.
In Equation (18), denotes the area covered by the parameterized shape at the node, while represents the mean absolute difference.
4.1.2. Geometric Feature Retrieval
The shape-based retrieval method offers several advantages over feature extraction-based approaches. It effectively manages transformations such as translation, rotation, and scaling, which leads to enhanced retrieval performance for complex building plan shapes. However, this method has limitations, including a tendency to mismatch building plans with similar shapes but different scales, as well as challenges in extracting shape features from non-geometric building plans. To address these issues, Rasika et al. introduce a multi-directional building plan retrieval approach based on FR-CNN and geometric features [52]. This method accounts for rotation during scanning and remains invariant to scale changes.
The process involves detecting the endpoints of doors on walls. After removing the door from the image, a blank area is left on the outer wall of the . Next, the endpoints of the same door are connected with a straight line to ensure continuity. Finally, the shape of the is obtained by tracing the outer wall. Geometric features such as area, corners, axes, distances, slopes, and angles are then computed. These geometric features are interdependent, and polygonal approximation can be used to represent the extracted profile.
The matching phase includes matching based on appearance features () and matching based on internal object features (). For the matching based on profile features, the query image () and the dataset image () are matched using Equation (12), and the average matching cost is calculated using Equation (13), where DS denotes the size of the dataset image, , denotes the jth feature, and denotes its corresponding count. Let denote the kth component of the jth feature. Here, the matching cost based on the shape features when =, =. If , then means that the feature is profile based ,and k denotes the index of the feature component.
The average feature matching cost (Avg) is calculated using Equation (19) and sorted in ascending order using Equation (20) to prioritize maximum similarity.
For internal object-based feature matching, the sorted results of external shape feature matching prior to the last image associated with the query are considered when calculating the matching cost, rather than the entire dataset. This is the case and when=, = calculating the matching cost using Equation (19). Further, the average matching cost for internal object features is calculated using Equation (20). Finally, the retrieval results are sorted in ascending order using Equation (21) to obtain a final ranked list of the query images, which includes the images before the last relevant image of the query image.
4.2. Multi-Dimensional and Shape Feature Retrieval
4.2.1. Multi-Dimensional Feature Retrieval
To expand content-based image retrieval technology to accommodate a large-scale image library, the adoption of effective multidimensional indexing techniques is essential. The challenges associated with this expansion can be categorized into two main aspects:
- High-dimensionality: Typically, the dimension of the image feature vector is on the order of .
- Non-Euclidean similarity measurement: The Euclidean distance metric often fails to adequately represent all human perceptions of visual content; consequently, alternative similarity measurement methods, such as histogram intersection, cosine similarity, and correlation, must be employed.
To address these challenges, a viable approach involves initially applying dimensionality reduction techniques to minimize the feature vector’s dimensionality, followed by the utilization of suitable multidimensional indexing methods.
Three primary research areas have significantly contributed to the development of multidimensional indexing technology: computational geometry, database management systems, and pattern recognition. Currently, popular multidimensional indexing technologies include the Bucketing grouping algorithm, k-d tree, priority k-d tree, quadtree, K-D-B tree, HB tree, R-tree, and its variants, such as the R+ tree and tree. In addition to these methods, clustering and neural network technologies, widely utilized in the field of pattern recognition, also represent viable indexing options. The history of multidimensional indexing technology can be traced back to the mid-1970s, when various indexing techniques, including the Cell algorithm, quadtree, and k-d tree, were introduced, although their effectiveness was initially limited. The demand for spatial indexing technology in Geographic Information Systems (GIS) and Computer-Aided Design (CAD) systems led to Guttman’s proposal of the R-tree index structure in 1984 [53]. Building on this foundation, several R-tree variants were developed, including Sellis et al.’s R+ tree [55] and Greene’s R-tree variant [54]. In 1990, Beckman and Kriegel introduced the R* tree, which is regarded as the most efficient dynamic R-tree variant [56]. However, even the R* tree struggles to effectively manage dimensionalities exceeding 20.
References [57] provide a comprehensive review and comparison of various indexing algorithms. Among these, White and Jain focus on developing a general or domain-specific indexing algorithm. Drawing inspiration from k-d trees and R-trees, they proposed the VAM k-d trees and VAMSplit R-trees. Experimental results indicate that VAMSplit R-trees demonstrate superior algorithmic efficiency, although they sacrifice the dynamic characteristics inherent to R-trees. In contrast, Ng and Sedighian [58] introduced a three-stage retrieval technique for image retrieval, comprising dimensionality reduction, evaluation and selection of existing indexing algorithms, and optimization of the chosen indexing algorithm. Given that nearly all tree-structured indexing techniques are primarily designed for traditional database queries (point queries and range queries), rather than for image retrieval, there is a pressing need to investigate new indexing structures that can fulfill the specific requirements of image retrieval. Tagare explored such an approach in [59] and proposed a method for tree structure adjustment, which enhances tree efficiency by removing nodes that impede the effectiveness of similarity queries.
4.2.2. Fourier Shape Descriptor
Shape features can generally be represented in two ways: as contour features or regional features. Contour features focus solely on the outer boundary of an object, while regional features encompass the entire area of the shape. The most common methods for these two types of shape features are Fourier descriptors and shape-independent moments.
The fundamental concept of Fourier shape descriptors is to utilize the Fourier transform of the object’s boundary for shape representation. Consider the contour of a two-dimensional object composed of a series of pixels with coordinates where , and N represents the total number of pixels on the contour. From the coordinates of these boundary points, three shape representations can be derived: the curvature function, centroid distance, and complex coordinate function. The curvature of a point on a profile is defined as the rate of change of the profile tangent angle relative to the arc length. The curvature function can be expressed as: . where is the tangent angle of the contour line, defined as:
The centroid distance is defined as the distance from the object boundary point to the object center, as follows:
The complex coordinate function is the pixel coordinate expressed by complex numbers:
The Fourier transform of the complex coordinate function generates a series of complex coefficients. These coefficients characterize the object’s shape in the frequency domain, with low-frequency components indicating macroscopic properties and high-frequency components detailing fine structural characteristics. A shape descriptor can be derived from these transformation parameters. To maintain rotation independence, only the magnitude information of the parameters is retained, while the phase information is omitted. Scaling independence is achieved by normalizing the magnitude of the parameter to the magnitude of the component (or the first non-zero parameter).
For the curvature function and the centroid distance function, we focus solely on the positive frequency coordinate axis because the Fourier transform of these functions is symmetric, specifically, . The shape descriptor derived from the curvature function is formulated as follows:
where represents the component of the Fourier transform parameter. Similarly, the shape descriptor derived from the centroid distance function is:
In the complex coordinate function, both positive and negative frequency components are utilized. The component is omitted as it pertains to the position of the shape. Consequently, the first non-zero frequency component is employed to normalize the remaining transformation parameters. The shape descriptor derived from the complex coordinate function is formulated as follows:
To ensure uniformity in the shape features of all objects in the database, the number of boundary points must be standardized to M before implementing the Fourier transform. For instance, M can be set as to leverage the fast Fourier transform, thereby enhancing the algorithm’s efficiency
4.2.3. Shape-Independent Moments
Moment invariants are a region-based technique for representing the shapes of objects. Assuming R is an object represented by a binary image, the -th order central moment of its shape is:
where is the center of the object. To achieve scale independence, the central moment can be normalized:
Based on these moments, Hu [60] proposed a series of seven moments that are independent of translation, rotation, and scaling:
In addition to the seven invariant moments mentioned above, various methods exist for calculating shape-independent moments. In reference [61], Yang and Albregtsen introduced a method for efficiently calculating moments in binary images using Green’s theorem. Since many effective invariants are derived from repeated experiments, Kapur et al. developed algorithms to systematically identify specific geometric invariants [62]. Gross and Latecki also devised a method that preserves the qualitative differential geometry of object edges during image digitization[62]. Furthermore, reference[63] discusses a framework of algebraic curves and invariants for representing complex objects in mixed scenes. This framework employs polynomial fitting to capture local geometric information and geometric invariants for object matching and recognition.
4.2.4. Shape Features Based on Inner Angles
In the reference [64], a method for expressing shape features based on internal angles was proposed. Similar to the Fourier descriptor, the object is first approximated as a polygon. The internal angles of polygons are crucial for shape representation and recognition and can be expressed as: Intra - angle .
Obviously, the shape description based on internal angles is independent of the shape’s position, rotation, and size, making it well-suited for image retrieval systems. Below is a series of definitions for shape features derived from internal angles:
Number of vertices: The more vertices a polygon has, the more complex its shape. It is reasonable to consider two shapes with different numbers of vertices as distinctly different shapes.
Internal Angle Mean: The average value of all internal angles of a polygon reflects its shape attributes to some extent. For example, the internal angle mean of a triangle is 60 degrees, which is notably different from the internal angle mean of a rectangle, which is 90 degrees.
Internal Angle Standard Deviation: The standard deviation of the internal angles of a polygon provides insight into the variability of the angles relative to the mean.
Where is the mean value of the interior angles, this standard deviation serves as a general descriptor of the polygon. The more regular the polygon, the smaller the value of . Therefore, it can be used to distinguish regular polygons from irregular ones.
Intra-angle Histogram: The angle range of to is first divided into k intervals, which serve as the k bins of the histogram. Then, the number of interior angles within each interval is counted. The resulting intra-angle histogram reflects the overall distribution of the interior angles.
We will take the calculation of the interior angle in Figure 4 as an example to introduce the calculation method of the interior angle. Let the center of the three points a, b, and c be p, then
Where o is the origin. If p is inside the polygon, then is less than , otherwise is greater than . When ,
When ,
5. Experimental and Performance Comparison of Various Algorithms
5.1. Datasets
The commonly used datasets in the field of floor plan retrieval include SESYD, FPLAN-POLY, and HOME, and are outlined as follows: Delalandre et al. introduced the SESYD (Systems Evaluation SYnthetic Documents) public dataset [65], a comprehensive document database synthesized using the 3gT (generation of graphical ground Truth) system. This dataset is primarily utilized in the GREC symbol recognition and discovery competition, comprising 10 classes of planar maps with 100 samples per class, totaling 28,065 symbols. The CVC-FP (Computer Vision Centre Floor Plan) dataset, introduced in [66], includes four subsets: Black dataset, Textured1 dataset, Textured2 dataset, and Parallel dataset. This dataset, consisting of 122 scanned documents, illustrates the relationship between architectural symbols and structural elements. Detailed labeling of these symbols enables more effective extraction of structural arrangements by floor plan analysis systems, thereby improving interpretive performance.
The FPLAN-POLY database [67] comprises 42 vector images featuring 38 symbolic models with 344 instances, assessing the presence of 8 structural conformations in each diagram. Reference [25]introduced the publicly available dataset ROBIN [68], tailored for building floor plan retrieval tasks. ROBIN encompasses three primary layout categories, further subdivided into 10 subcategories based on global map layout shapes. Designed to cater to potential buyer needs, ROBIN showcases diverse room types and quantities.
FloorPlanCAD, a large vector dataset proposed by reference [45], features 10,094 floor plan data entries from real-world sources, including homes, shopping malls, schools, and other structures. The dataset includes 6,382 training plans and 3,712 test plans. Similarly, the BRIDGE dataset proposed by reference [69]consists of over 13,000 building floor plan images, accompanied by task-specific annotations such as symbols, region descriptions, and paragraph details.
TAHIRA S et al. introduced the extensive SFPI (Synthetic Floor-Plan Images) dataset [70], comprising 10,000 datasets with 16 furniture categories totaling 300,000 furniture symbols. Data augmentation involving random angle rotations was applied to enhance dataset diversity. The detailed information regarding the aforementioned datasets is presented in Table 2.
5.2. Evaluation
In the domain of building plan retrieval, evaluation metrics play a pivotal role in assessing the performance of retrieval systems. Commonly used evaluation indicators include accuracy, F1 score, mean average precision (MAP), and the Matthews correlation coefficient (MCC) [77]. The MCC demonstrates superior performance when addressing category imbalance issues in datasets compared to other metrics such as accuracy, precision, and recall. To comprehensively evaluate the effectiveness and utility of retrieval methods, some studies have employed additional evaluation techniques. In this context, a retrieval is considered successful if one or more of the top five images in the results exhibit structural similarity to the query image. Retrieval performance is measured by determining the proportion of correctly similar images within the retrieval results. For instance, if three out of the first five images are structurally similar to the query image, the precision value would be 0.6, indicating that 60% of the retrieved images are correct matches.
5.3. Various Algorithms Performance Comparison
While precision, recall, and mean Average Precision (mAP) are commonly used performance evaluation metrics in the existing reference, this study demonstrates system performance by assessing feature extraction at each level. The features extracted from the normalized layer 1 exhibit strong performance, achieving an mAP value of 0.63. Conversely, the basic deep learning framework performs poorly when extracting features directly from the CNN, yielding an average accuracy of only 0.43. Furthermore, methods such as SIFT, HOG, run-length histogram, and OASIS produce suboptimal results in capturing the abstractness and sparsity of sketches [78,79]. The comparative retrieval performance of various methods is detailed in Table 3 below. Notably, the retrieval performance of the graph GCN method has significantly improved compared to previous techniques, achieving an mAP of 0.85.
In addition, we used several commonly used methods and compared the F1 value and mAp on the semantic features of different categories of plan views [80]. The experimental results are shown in Table 4. From Table 4, it is evident that the F1 scores for the GCN-based and DccpLabv3 methods differ significantly, and their corresponding mAP values are relatively small. However, as the number of categories increases, both the F1 and mAP values tend to decrease. This suggests that the characteristics of the categories significantly influence retrieval performance.
6. Conclusion
In the field of architectural floor plan feature retrieval technology, the comprehensive application of semantic, spatial, texture, and shape features has significantly enhanced both the accuracy and efficiency of retrieval processes. Semantic features contribute to a profound understanding of the functions represented by floor plan elements, while spatial features elucidate the relationships among various building layouts. Texture features enhance the visual coherence of the plans, and shape features facilitate the effective identification of diverse architectural styles. This paper provides an in-depth discussion of these feature retrieval methods and presents various fusion techniques to support future research aimed at achieving higher levels of automation and intelligence in retrieval systems. Ultimately, the findings will encourage the advancement and application of architectural floor plan data processing technology.
We believe that the following are potential directions for floor plan retrieval in the future:
-
Diverse graphic retrieval and cross-application including images, text, audio, video, etc.Future architectural design tools are likely to prioritize user experience by integrating multiple data sources for federated searches, thus providing richer and more accurate results. Enhancing the design process through personalized requirements and collaborative design will create a more enjoyable and efficient experience. Future research may delve into multimodal data representation, processing, and retrieval, combining floor plans with other modalities (such as text, 3D models, and satellite images) to gain a comprehensive understanding of architectural design. Moreover, in smart city planning, architectural design, and virtual reality (VR), multidimensional feature retrieval of floor plans will play an increasingly important role in achieving more accurate design, simulation, and optimization. In the study of cultural heritage protection and digitalization, multidimensional feature retrieval can facilitate the comparison, classification, and restoration of floor plan data for historical buildings and cultural relics.
-
Efficient feature extraction and indexing as well as personalized and adaptive retrieval.As the volume of data continues to increase, efficiently indexing and retrieving multidimensional features becomes essential. Future research may focus on designing more efficient and lightweight deep learning models, enabling real-time multidimensional feature extraction on mobile devices and embedded systems. By analyzing user interaction data, future floor plan retrieval systems will be able to adaptively adjust feature weights and optimization strategies to achieve personalized retrieval results. With minimal user feedback, the retrieval model can be continuously improved, thereby enhancing the overall performance of the system.
-
Interpretability of multi-dimensional data and data privacy security.As the complexity of deep learning models increases, interpretability becomes crucial. Future research may focus on developing models that can explain the relationship between multidimensional features and retrieval results, enabling users to understand the decision-making process of the retrieval system. Additionally, as data privacy concerns grow, ensuring efficient floor plan retrieval while protecting user privacy will be essential. Technologies such as differential privacy and federated learning should be integrated into the retrieval system. Furthermore, safeguarding sensitive architectural and design data from unauthorized access will emerge as an important research direction, particularly in floor plan retrieval for military and government building designs.
Author Contributions
Hongxing Ling and Guangsheng Luo are responsible for the writing and conception of the entire article, Nanrun Zhou is responsible for the guidance and review of the article, Xiaoyan Jiang is responsible for the overall revision and polishing of the paper, Liu Yang is responsible for the algorithm model, and Xiaogang Lin is responsible for the experimental part.
Data Availability Statement
For details, please refer to the files in the URL https://github.com/BYFCJX/download-floorplan-image-datasets
Acknowledgments
This work is supported by the Scientific and Technological In-novation 2030-Major Project of New Generation Artificial Intelligence (Grant no. 2020AAA0109300).
Conflicts of Interest
The authors declare that they have no conflict of interest.
References
- Kemble Stokes, H. : An examination of the productivity decline in the construction industry[J]. Rev. Econ. Stat. 63(4), 495 (1981).
- Zhengda, L. , Wang, T., Guo, J., Meng, W., Xiao, J., Zhang, W., Zhang, X.: Data-driven floor plan understanding in rural residential buildings via deep recognition. Inf. Sci. 567, 58–74 (2021). [CrossRef]
- Pizarro, P.N. , Hitschfeld, N., Sipiran, I., Saavedra, J.M.: Automatic floor plan analysis and recognition[J]. Autom. Constr. 140, 104348 (2022).
- Shelhamer, E. , Long J., Darrell T. Fully convolutional networks for semantic segmentation[J], In IEEE Transactions on Pattern Analysis and Machine Intelligence, pp. 640–651 (2017).
- Ronneberger, O. Fischer, P., Brox, T.: U-net: convolutional networks for biomedical image segmentation[C]. In: Navab, N., Hornegger, J., Wells, W.M., Frangi, A.F. (eds.) Medical Image Computing and Computer-Assisted Intervention—MICCAI 2015: 18th International Conference, Munich, Germany, October 5-9, 2015, Proceedings, Part III, pp. 234–241. Springer International Publishing, Cham (2015).
- Chen, L.-C. Zhu, Y., Papandreou, G., Schroff, F., Adam, H.:Encoder-decoder with atrous separable convolution for semantic image segmentation[C]. In: Ferrari, V., Hebert, M., Sminchisescu, C.,Weiss, Y. (eds.) Computer Vision – ECCV 2018: 15th European Conference, Munich, Germany, September 8–14, 2018, Proceedings, Part VII, pp. 833–851. Springer International Publishing,Cham (2018).
- ALEIXO C B, MARIUSZ T, ANNA H, et al. Automatic reconstruction of semantic 3d models from 2d floor plans[C].2023 18th International Conference on Machine Vision and Applications2023:1-5.
- PARK S, HYEONCHEOL K. 3DPlanNet: generating 3d models from 2d floor plan images using ensemble methods[J]. Electronics, 2021: 2729.
- ZHU J, ZHANG H, WEN Y M. A new reconstruction method for 3D buildings from 2D vector floor plan[J]. Computer-aided Design and Applications, 2014,11(6): 704-714.
- WANG L Y, GUNHO S. An integrated framework for reconstructing full 3d building models[J]. Advances in 3D Geo-Information Sciences, 2011: 261-274.
- CHEN L,WU J Y,YASUTAKA F. Floornet: a unified framework for floorplan reconstruction from 3d scans[C].Proceedings of the Europeanconference on computer vision,2018: 201-217.
- TARO N, TOSHIHIKO Y. A preliminary study on attractiveness analysis of real estate floor plans[C].2019 IEEE 8th Global Conference on Consumer Electronics,2019: 445-446.
- KIRILL S, NICOLAS P. Integratingfloor plans into hedonic models for rent price appraisal[J].Research Papers in Economics,2021.
- GEORG G, LUKAS F,KAUFMAN H,et al. Extraction of structural and semantic data from 2D floor plans for interactive andimmersive VR real estate exploration[J]. Technologies, 2018, 6(4):101.
- DIVYA S, NITIN G, CHATTOPADHYAY C,et al. DANIEL: a deep architecture for automatic analysis and retrieval of building floor plans[C].2017 14th IAPR International Conference on Document Analysisand Recognition, 2017.
- DIVYA S, NITIN G, CHATTOPADHYAY C,et al. A novel feature transform framework using deep neural network for multimodal floor plan retrieval[J]. International Journal on Document Analysis and Recognition, 2019, 22(4): 417-429.
- YAMASAKI T,ZHANG J, YUKI T,et al. Apartment structure estimation using fully convolutional networks and graph model[C].Proceedings of the 2018 ACM Workshop on Multimedia for Real Estate Tech,2018: 1-6.
- KIM H, SEONGYONG K, KIYUN Y. Automatic extraction of indoor spatial information fromfloor plan image: a patch-based deep learning methodology application on large-scale complex buildings[J].ISPRS International Journal of Geo-Information, 2021, 10(12): 828.
- MA K Y,CHENG Y,GE W,et al.Method of automatic recognition of functional parts in architecturallayout plan using Faster R-CNN [J].Journal of Surveying and Planning Science and Technology,2019,36(03):311-317.
- SHEHZADI T, KHURRAM A H, ALAIN P,et al. Mask-Aware semi-supervised object detection in floor plans[J]. Applied Sciences, 2022, 12(19):9398.
- WANG T, MENG W L,ZHENG D L,et al.RC-Net: row and column network with text feature for parsing floor plan images[J]. Journal of Computer Science And Technology, 2023, 38(3): 526–539.
- FAN Z W, ZHU L J,Li H H,et al. Floorplancad: alarge-scale cad drawing dataset for panoptic symbol spotting[C].Proceedings of the IEEE/CVF International Conference on Computer Vision, 2021: 10128-10137.
- CHRISTOFFER P, FREDERIK M, MARK P P, et al. Generalizing floor plans using graph neural networks[C].2021 IEEEInternational Conference on Image Processing, 2021: 654-658.
- ZENG Z L, Li X Z, Yu Y K,et al. Deep floor plan recognition using a multi-task network withroom-boundary-guided attention[C].Proceedings of the IEEE/CVF International Conference on Computer Vision, 2019: 9096-9104.
- LV X L, ZHAO S C, YU X Y,et al. Residential floor plan recognition and reconstruction[C].Proceedings of the IEEE/CVF Conference on Computer Vision and Pattern Recognition, 2021: 16717-16726.
- GAO M,ZHANG H H,ZHANG T R, et al. Deep learning based pixel-level public architectural floor plan space recognition[J]. Journal of Graphics, 2022, 43(2): 189.
- YANG L P, MICHAEL W. Generation of navigation graphs for indoor space[J/OL]. International Journal of Geographical Information Science[J], 2015: 1737-1756.
- SARDEY M P, GAJANAN K. A Comparative Analysis of Retrieval Techniques in Content BasedImage Retrieval[C]. Computer Science and amp; Information Technology, 2015.
- LIU C, WU J J,PUSHMEET K,et al. Raster-to-Vector: revisiting floorplan transformation[C].2017 IEEE International Conference on Computer, 2017:2214-2222.
- AOKI Y, SHIO A, ARAI H, et al. A prototype system for interpreting hand-sketched floor plans[C].Proceedings of 13th International Conference on Pattern Recognition, Vienna, 1996:747-751.
- SHERAZ A, MARCUS L, MARKUS W,et al. Improved automatic analysis of architecturalfloor plans[C].2011 International Conference on Document Analysis and Recognition,2011:864-869.
- RAOUL W, INA B, KLEIN R,et al.The room connectivity graph: shape retrieval in the architectural domain[J]. 2008.
- LLUÍS-P D L H, DAVID F, ALICIA F, et al. Runlength histogram image signature for perceptual retrieval of architectural floor plans[M].IAPR International Workshop on Graphics Recognition,2013.
- LLUÍS-PERE D L H, SHERAZ A, MARCUS L, et al. Statistical segmentation and structural recognition for floor plan interpretation[J]. International Journal on Document Analysis and Recognition, 2014: 221-237.
- Ministry of Housing and Urban-rural Developmentof the People’s Republic of China.GB 50352-2005. General principles for civil engineering design[S]. Beijing:China Publishing Group,2005:101-108.
- YANG, L. Research and implementation of building image retrieval based on deep learning[D].Xi’an:Xi’an University of Architecture and Technology,2022.
- ZHANG H X, LI Y S, SONG C.Block vectorization of interior layout plans and high-efficiency 3D building modeling [J]. Computer Science and Exploration,2013,7(1):63-73.
- MARKUS W, MARCUS L, ANDREAS D. A.SCAtch - a sketch-based retrieval for architectural floor plans[C].In 2010 12th International Conferenceon Frontiers in Handwriting Recognition,2010:289-294.
- IORDANIS E, MICHALIS S, GEORGIOS P. PU learning-based recognition of structural elements in architectural floor plans[J]. Multimedia Tools and Applications, 2021, 80(9): 13235-13252.
- Haralick R M, Shanmugam K, Dinstein I H. Textural features for image classification[J]. IEEE Transactions on systems, man, and cybernetics, 1973 (6): 610-621.
- Manjunath B S, Ma W Y. Texture features for browsing and retrieval of image data[J]. IEEE Transactions on pattern analysis and machine intelligence, 1996, 18(8): 837-842.
- Daugman J, G. Uncertainty relation for resolution in space, spatial frequency, and orientation optimized by two-dimensional visual cortical filters[J]. JOSA A, 1985, 2(7): 1160-1169.
- He D C, Wang L. Texture features based on texture spectrum[J]. Pattern recognition, 1991, 24(5): 391-399.
- CLAUDIO M, RENATO P, MURA,et al.Walk2Map: extracting floor plans from indoor walk trajectories[J]. Computer Graphics Forum, 2021: 375-388.
- YUKI T, NAOTO I, TOSHIHIKO Y, et al. Similar floor plan retrieval featuring multi-task learning of layout type classification and room presence prediction[C].2018 IEEE International Conference on Consumer Electronics,2018: 1-6.
- KAREN S, ANDREW Z. Very deep convolutional networks for large-scale image recognition[C].International Conference on Learning Representations, 2015.
- Wang T, Meng W L, Lu Z D, et al. RC-Net: Row and Column Network with Text Feature for Parsing Floor Plan Images[J]. Journal of Computer Science and Technology, 2023, 38(3): 526-539.
- CAO Y Q, JIANG T, THOMAS G. A maximum common substructure-based algorithm for searching and predicting drug-like compounds[J]. Bioinformatics, 2008, 24(13): i366-i374.
- DIVYA S, CHIRANJOY C, GAURAV H,et al. A unified framework for semantic matching of architectural floorplans[C].2016 23rd International Conference on Pattern Recognition,2016.
- DIVYA S, CHIRANJOY C. High-level feature aggregation for fine-grained architectural floor plan retrieval[J]. IET ComputerVision, 2018, 12(5): 702-709.
- LEE P K, BJORN S. Shape-Based floorplan retrieval using parse tree matching[C].2021 17th International Conference on Machine Vision and Applications, 2021: 1-5.
- RASIKA K, KRUPA J, CHIRANJOY C, et al. A rotation and scale invariant approach for multi-oriented floor plan image retrieval[J]. Pattern Recognition Letters, 2021: 1-7.
- Boston, M. A dynamic index structure for spatial searching[C]. Proceedings of the ACM-SIGMOD. 1984: 547-557.
- Greene, Diane. An implementation and performance analysis of spatial data access methods. Proceedings[C]. Fifth International Conference on Data Engineering. IEEE Computer Society, 1989.
- Sellis T, Roussopoulos N, Faloutsos C. The R+-tree: A dynamic index for multi-dimensional objects[J]. 1987.
- Beckmann N, Kriegel H P, Schneider R, et al. The R*-tree: An efficient and robust access method for points and rectangles[C].Proceedings of the 1990 ACM SIGMOD international conference on Management of data. 1990: 322-331.
- White D A, Jain R C. Similarity indexing: Algorithms and performance[C].Storage and Retrieval for Still Image and Video Databases IV. SPIE, 1996, 2670: 62-73.
- Ng R T, Sedighian A. Evaluating multidimensional indexing structures for images transformed by principal component analysis[C]. Storage and Retrieval for Still Image and Video Databases IV. SPIE, 1996, 2670: 50-61.
- Tagare H, D. Increasing retrieval efficiency by index tree adaptation[C].1997 Proceedings IEEE Workshop on Content-Based Access of Image and Video Libraries. IEEE, 1997: 28-35.
- Hu M, K. Visual pattern recognition by moment invariants[J]. IRE transactions on information theory, 1962, 8(2): 179-187.
- Yang L, Albregtsen F. Fast computation of invariant geometric moments: A new method giving correct results[C].Proceedings of 12th International Conference on Pattern Recognition. IEEE, 1994, 1: 201-204.
- Kapur D, Lakshman Y N, Saxena T. Computing invariants using elimination methods[C].Proceedings of International Symposium on Computer Vision-ISCV. IEEE, 1995: 97-102.
- Cooper D B, Lei Z. On representation and invariant recognition of complex objects based on patches and parts[C].International Workshop on Object Representation in Computer Vision. Berlin, Heidelberg: Springer Berlin Heidelberg, 1994: 139-153.
- Zhuang, Y. Intelligent Multimedia Information Analysis and Retrieval with Application to Visual Design[J]. Doctor Dissertation of Zhejiang University, 1998.
- Delalandre M, Valveny E, Pridmore T, et al. Generation of synthetic documents for performance evaluation of symbol recognition and spotting systems[J]. International Journal on Document Analysis and Recognition (IJDAR), 2010, 13(3): 187-207.
- LLUÍS-PERE DL H, ORIOL R T, SERGI R M,et al. CVC-FP and SGT: a new database for structural floor plan analysis and its groundtruthing tool[J]. International Journal on Document Analysis and Recognition,2015, 18: 15-30.
- MARÇAL R, AGNÉS B, JOSEP L. Relational indexing of vectorial primitives for symbol spotting in line-drawing images[J]. Pattern Recognition Letters, 2010, 31(3): 188-201.
- Sharma D, Gupta N, Chattopadhyay C, et al. Daniel: A deep architecture for automatic analysis and retrieval of building floor plans[C]. 2017 14th IAPR international conference on document analysis and recognition (ICDAR). IEEE, 2017, 1: 420-425.
- SHREYA G, VISHESH M, CHIRANJOY C, et al. BRIDGE: building plan repositoryfor image description generation, and evaluation[C].2019 International Conference on DocumentAnalysis and Recognition,2019:1071-1076.
- TAHIRA S, KHURRAM A H, ALAIN P,et al. Mask-Aware semi-supervised object detection in floor plans[J]. Applied Sciences, 2022, 12(19):9398.
- Kiyota, Y. Frontiers of computer vision technologies on real estate property photographs and floorplans[J]. Frontiers of Real Estate Science in Japan, 2021, 325.
- Dodge S, Xu J, Stenger B. Parsing floor plan images[C].2017 Fifteenth IAPR international conference on machine vision applications (MVA). IEEE, 2017: 358-361.
- Pizarro Riffo P, N. Wall polygon retrieval from architectural floor plan images using vectorización and Deep Learning methods[J]. 2023.
- Fan Z, Zhu L, Li H, et al. Floorplancad: A large-scale cad drawing dataset for panoptic symbol spotting[C]. Proceedings of the IEEE/CVF international conference on computer vision. 2021: 10128-10137.
- Ebert F, Yang Y, Schmeckpeper K, et al. Bridge data: Boosting generalization of robotic skills with cross-domain datasets[J]. arXiv preprint, arXiv:2109.13396, 2021.
- Mishra S, Hashmi K A, Pagani A, et al. Towards robust object detection in floor plan images: A data augmentation approach[J]. Applied Sciences, 2021, 11(23): 11174.
- NAOKI K, TOSHIHIKO Y, KIYOHARU A, et al. Users’preference prediction of real estate propertiesbased on floor plan analysis[J]. IEICE Transactions on Information and Systems, 2020: 398-405.
- DIVYA S, NITIN G, CHIRANJOY C, et al. REXplore: a sketch based interactive explorer for real estates using building floor plan images[J]. 2018 IEEE International Symposium on Multimedia, 2018:61-64.
- ATHARVA K, RASIKA K, KRUPA J,et al. RISC-Net: rotation invariant siamese convolution network for floor plan image retrieval[J]. Multimedia Tools and Applications, 2022: 41199-41223.
- Fan Z, Zhu L, Li H, et al. Floorplancad: A large-scale cad drawing dataset for panoptic symbol spotting[C].Proceedings of the IEEE international conference on computer vision. 2021: 10128-10137.
- GAL C, URI S,VARUN S, et al. Anonline algorithm for large scale image similarity learning[J]. Neural Information Processing Systems,Neural Information Processing Systems,2009.
- DIVYA S, CHIRANJOY C,GAURAY H. Retrieval of architectural floor plans based on layout semantics[J].IEEE 2016 Conference on Computer Vision and Pattern Recognition,2016.
Figure 1.
Building floor plan.
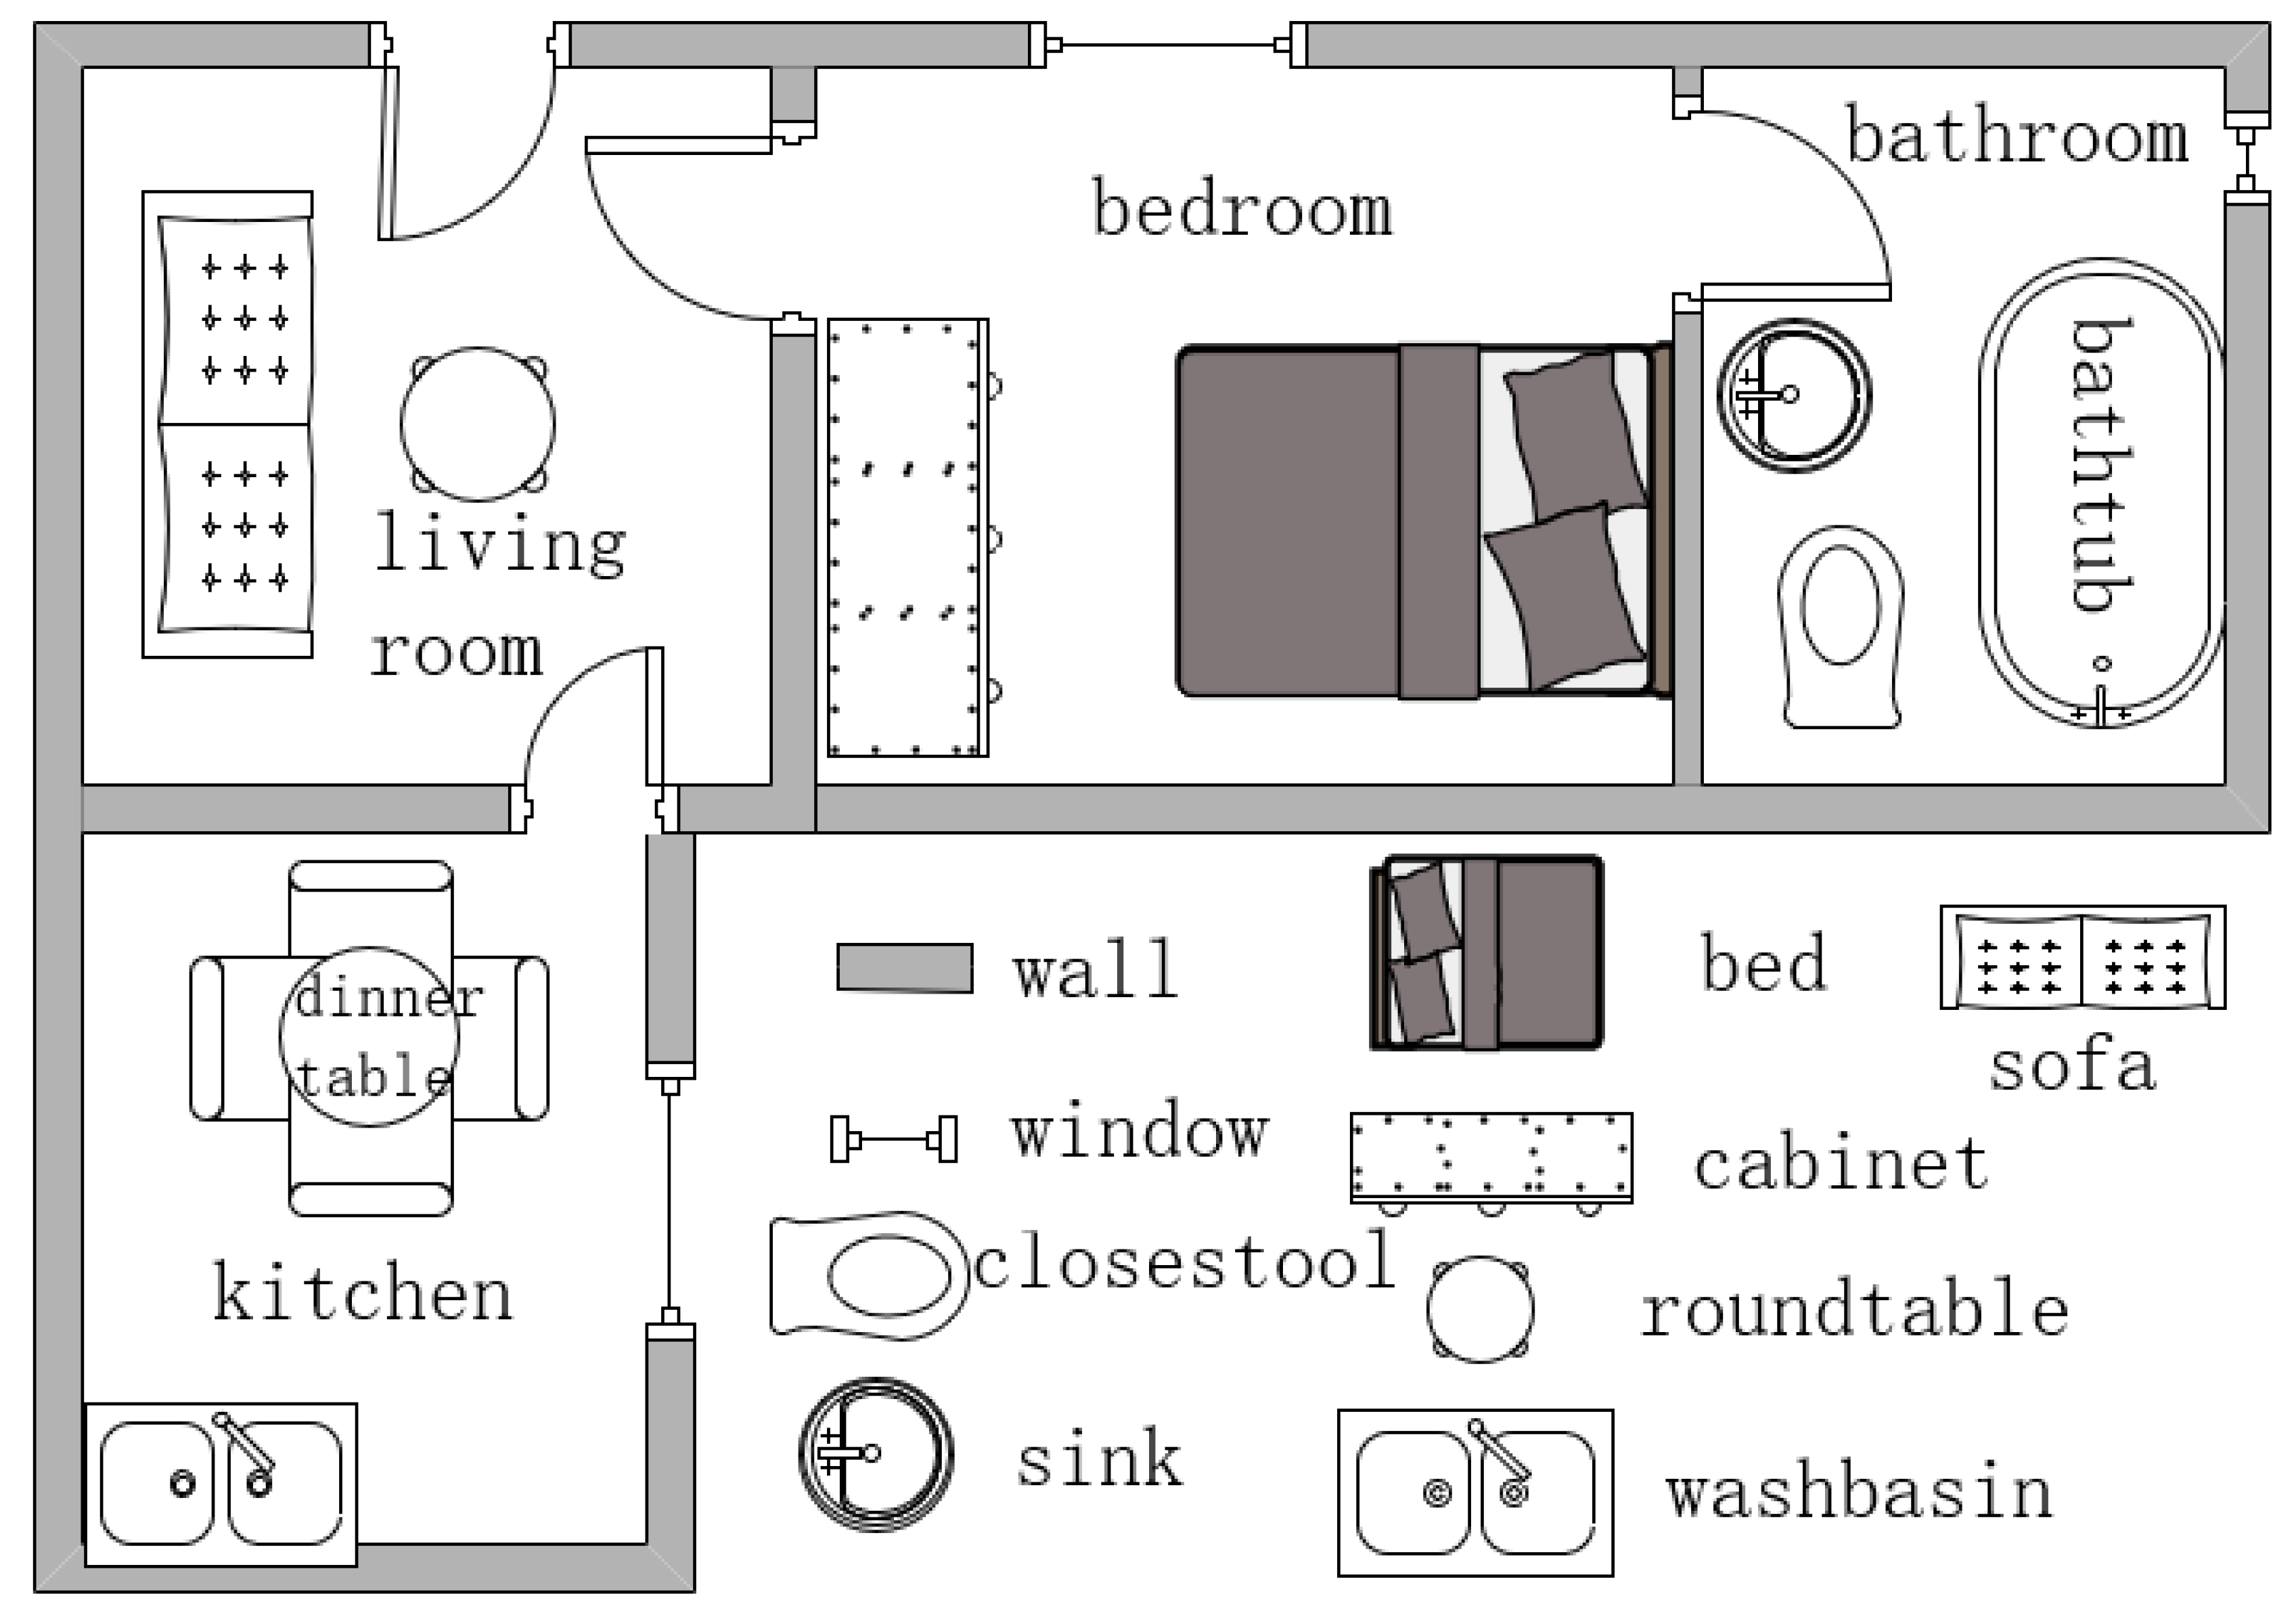
Figure 2.
Building identification hierarchy diagram
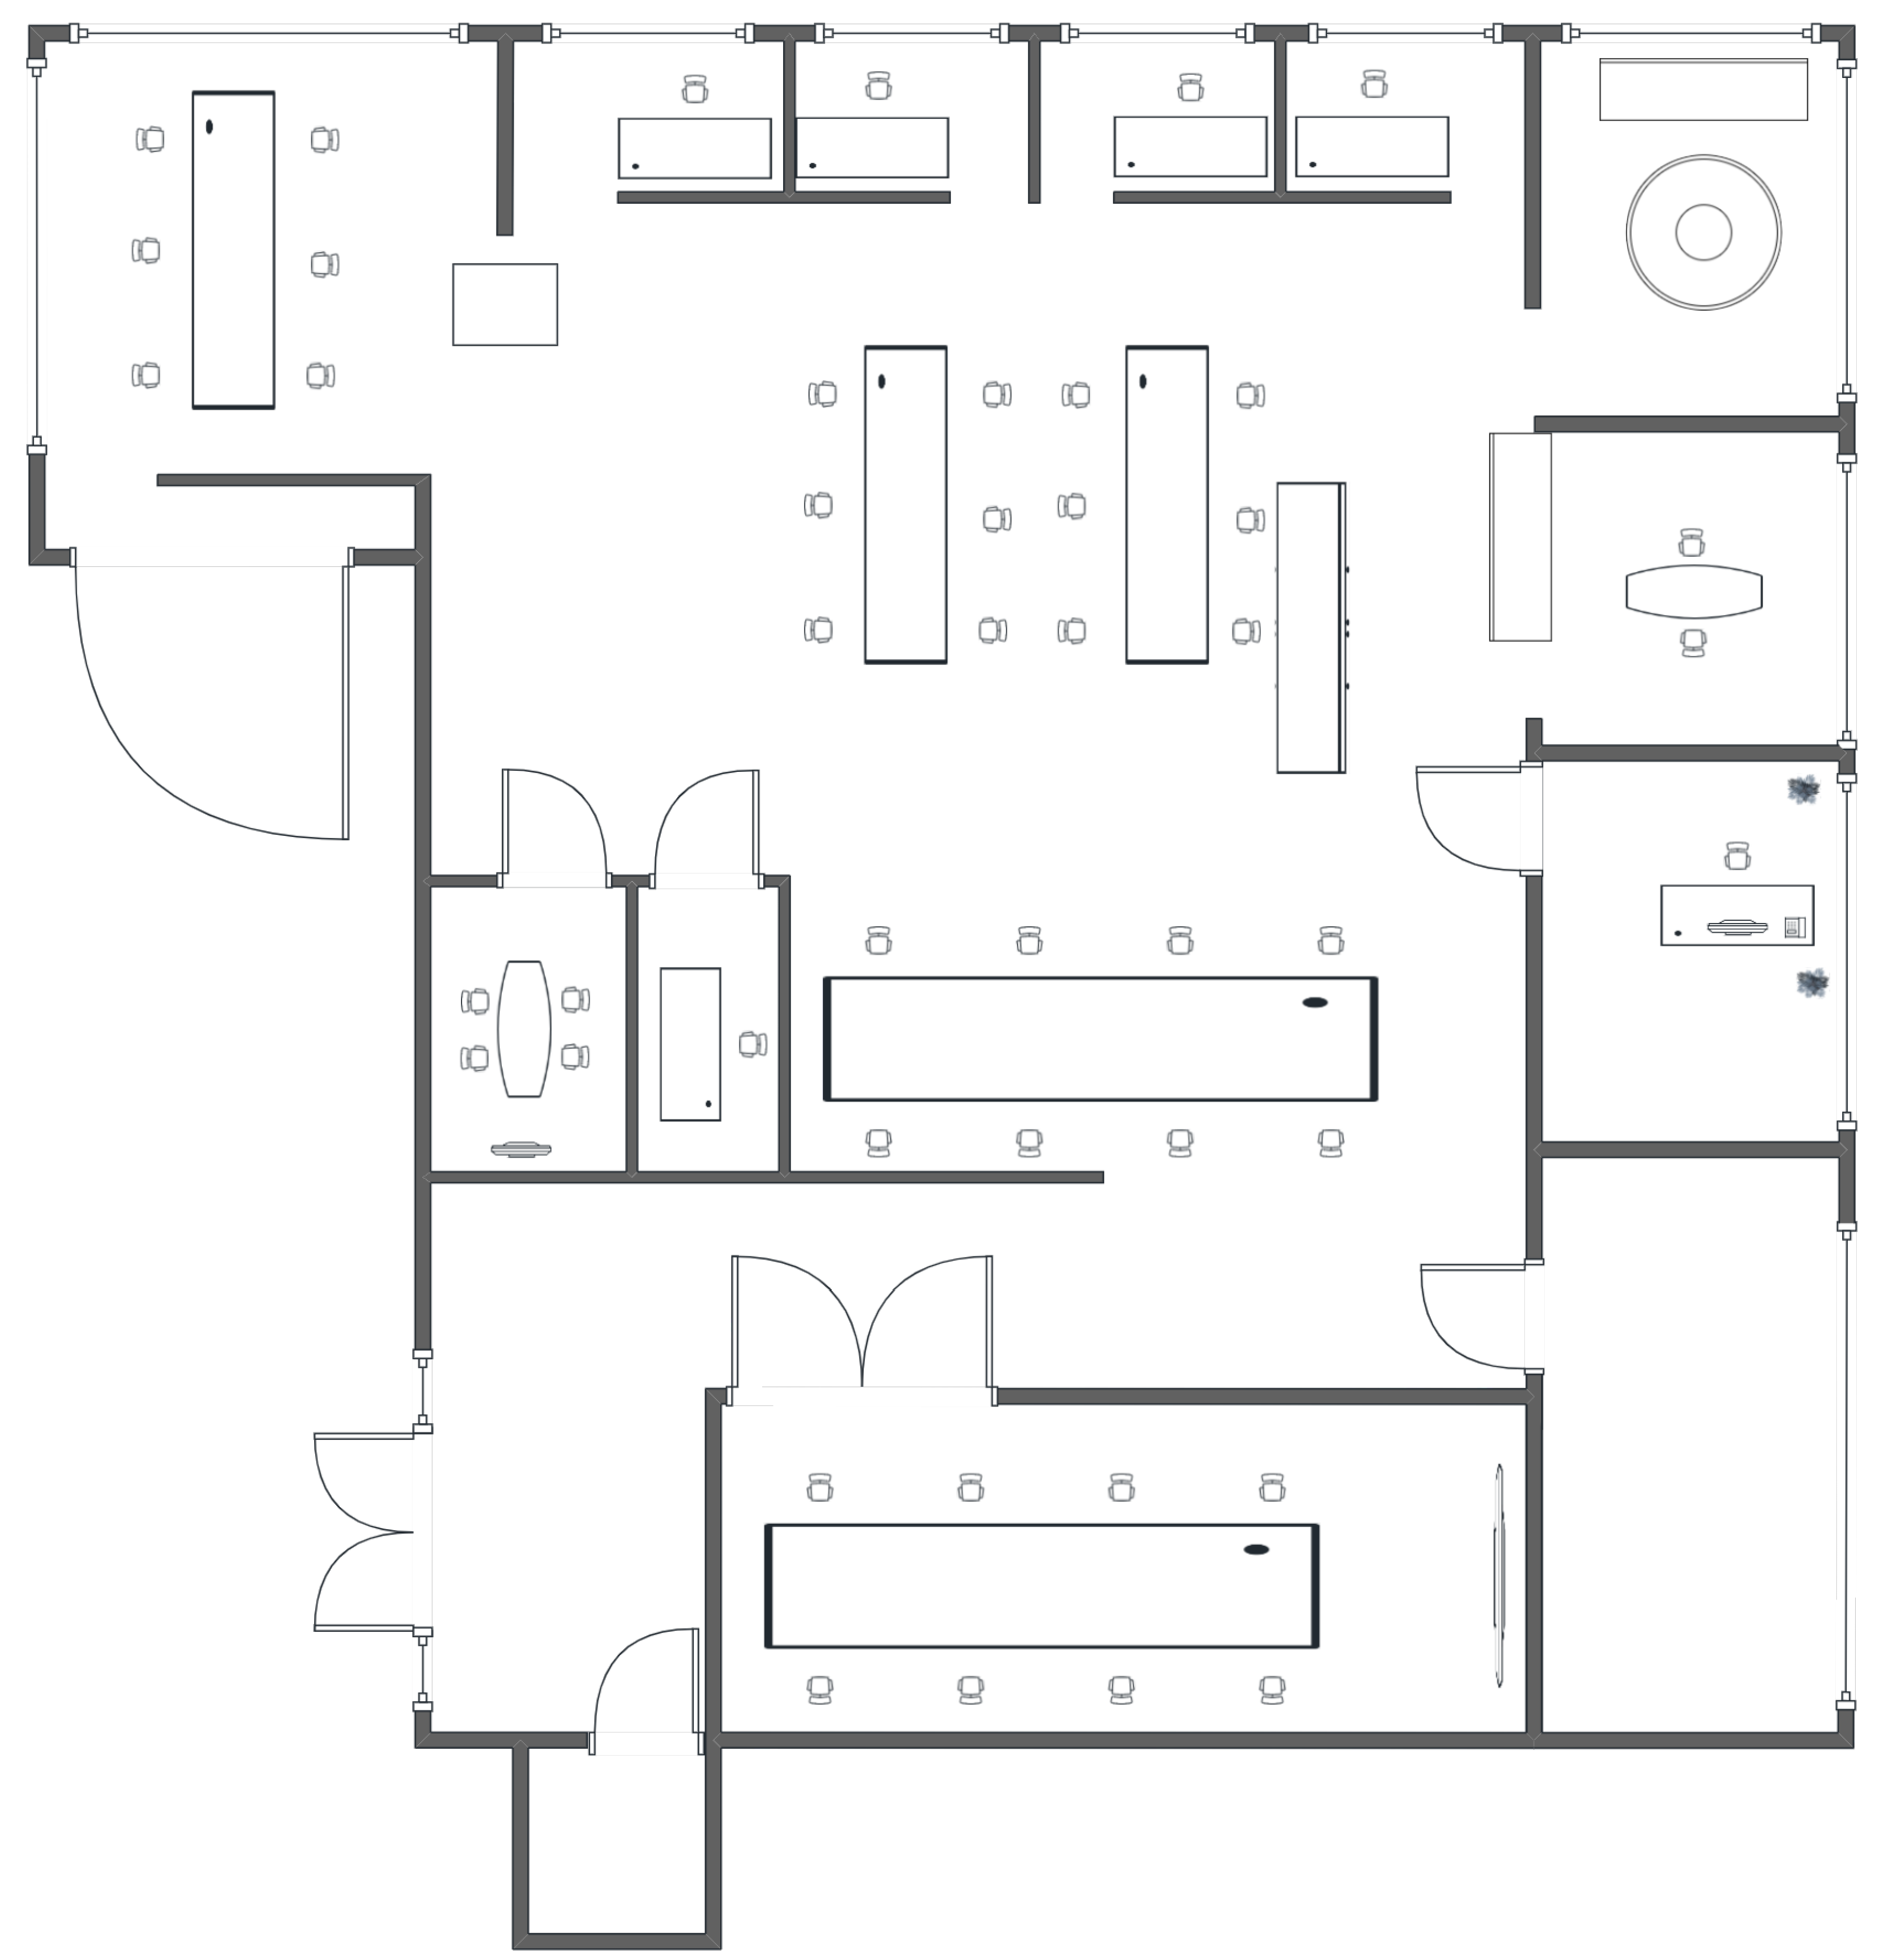
Figure 3.
Building plan inspection process
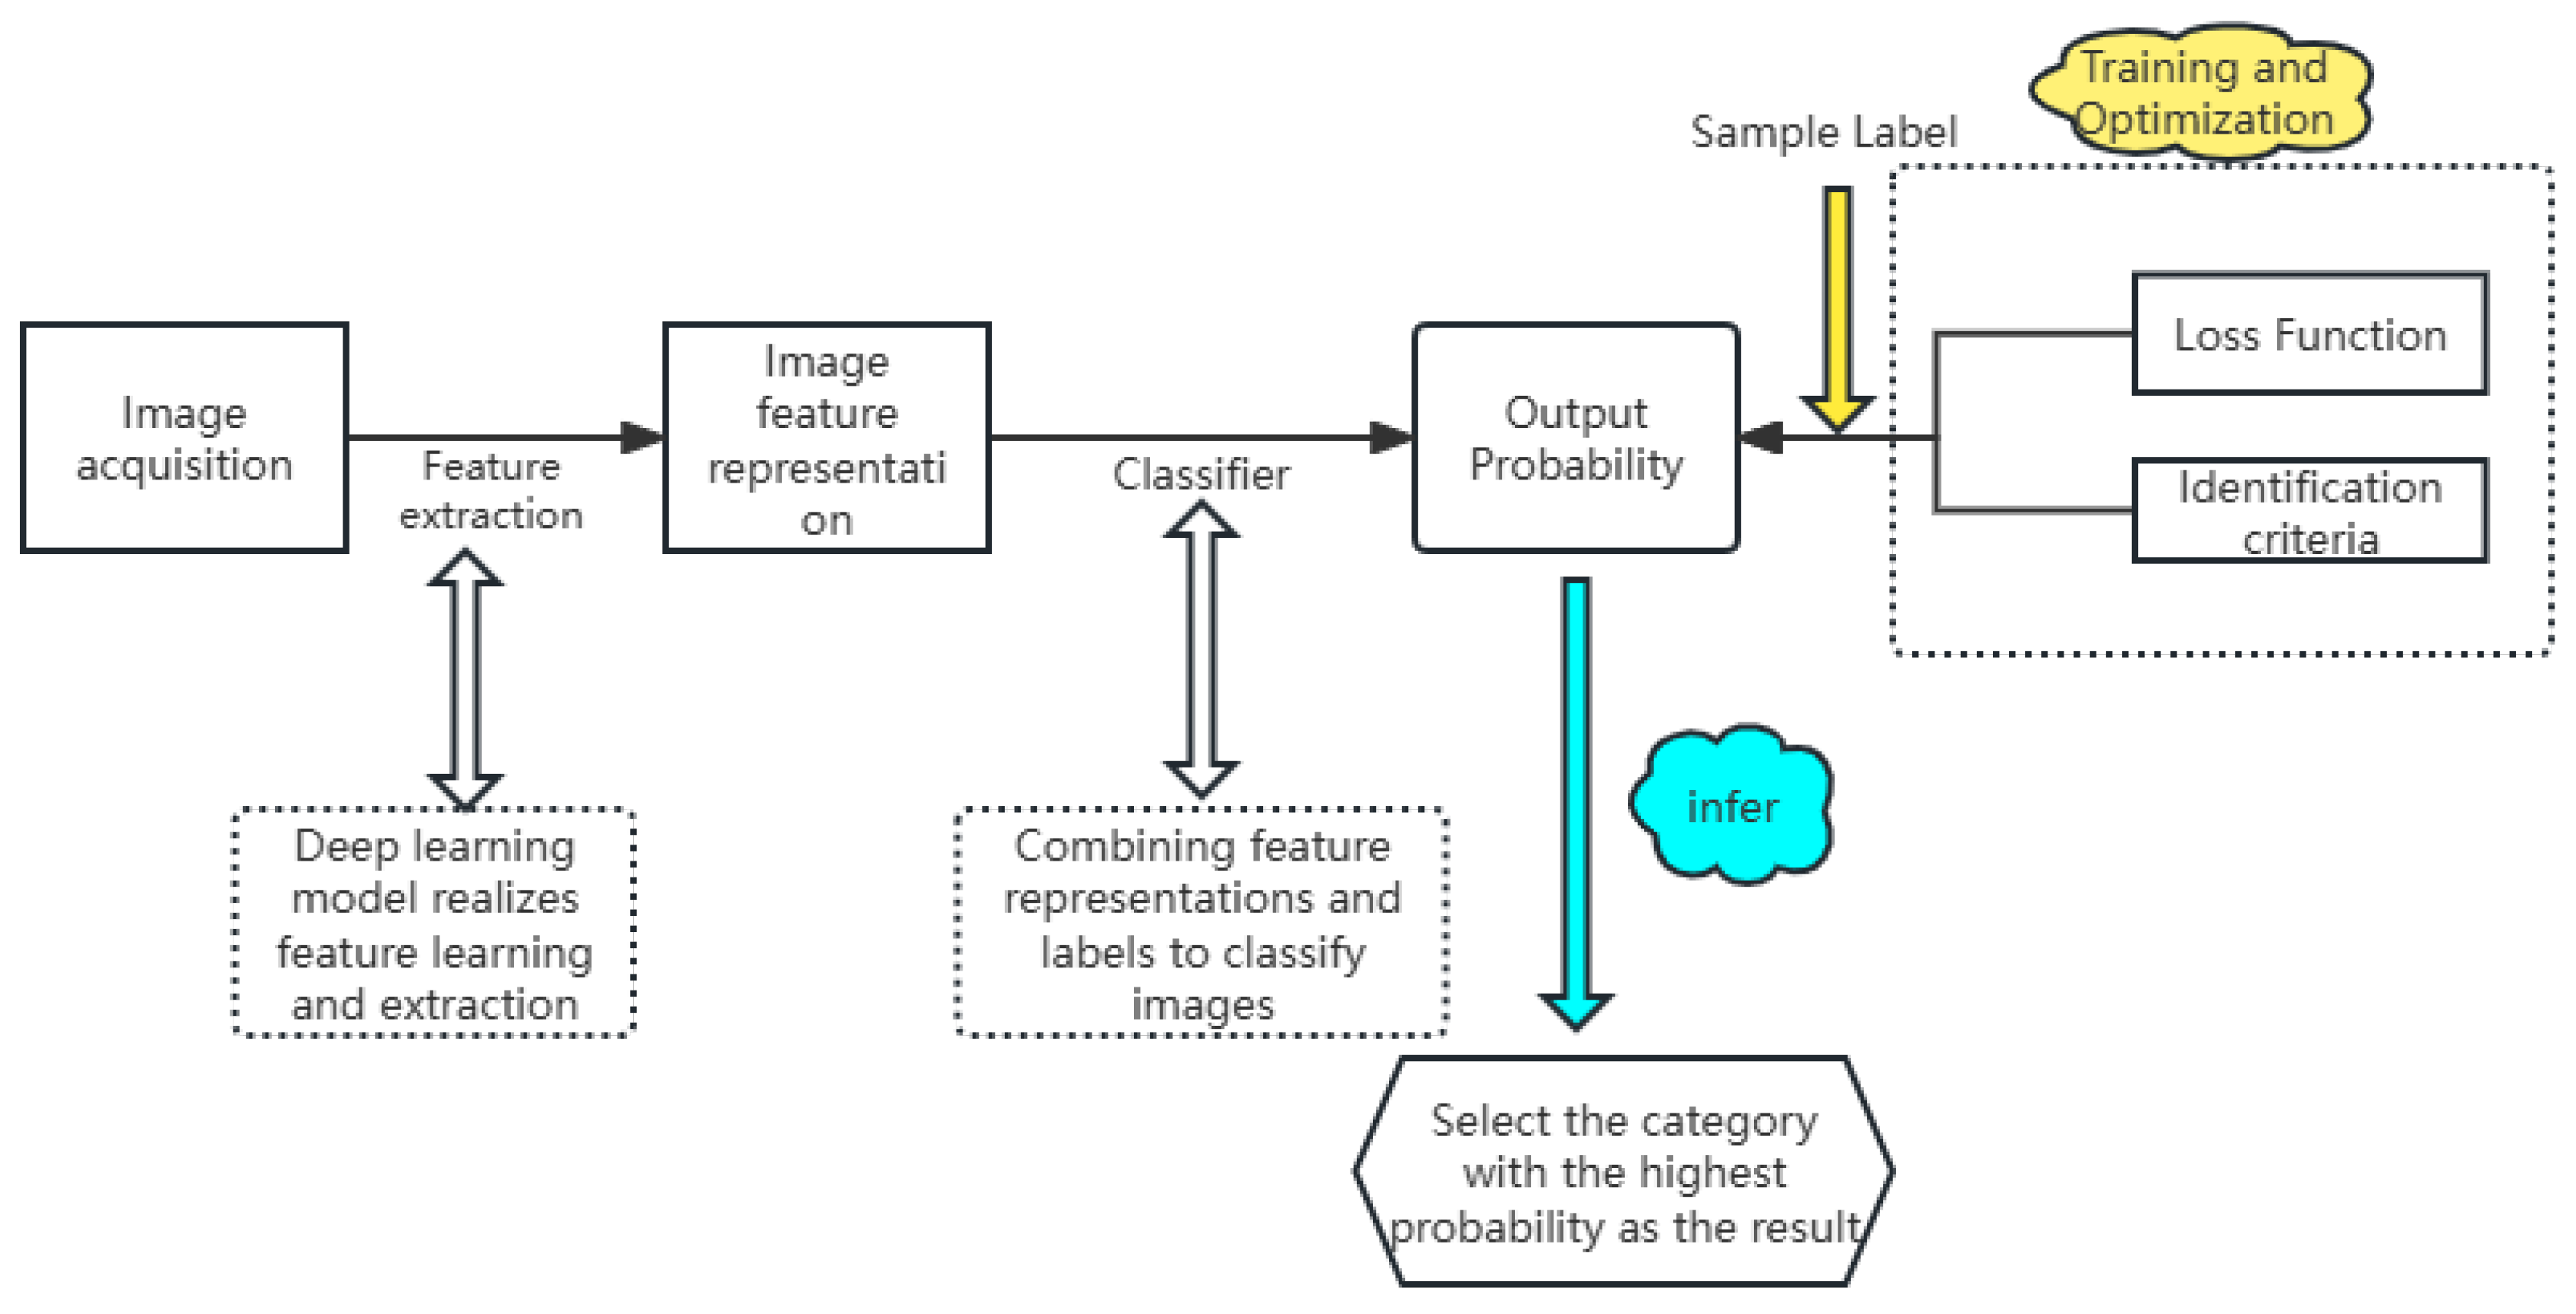
Figure 4.
Interior angle histogram
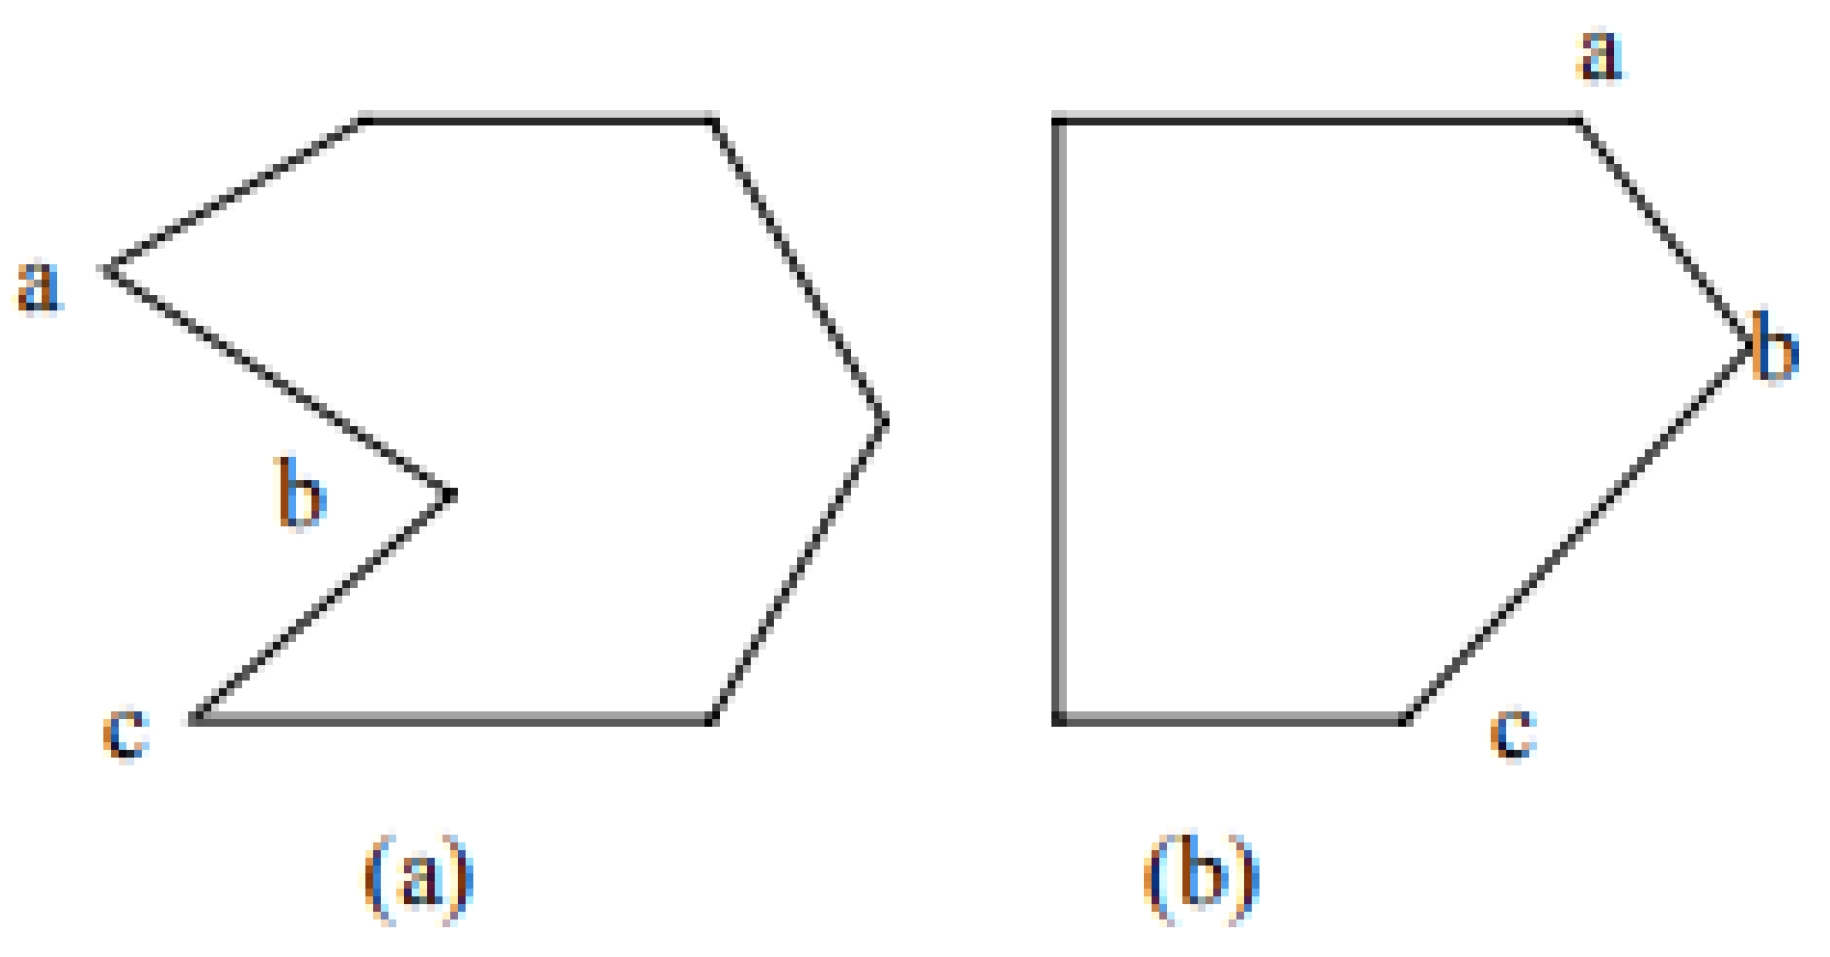
Table 2.
Summary of data sets mentioned in this article
| Dataset name | Number of pictures | usage | public | year |
|---|---|---|---|---|
| SESYD [65] | 1000 | Retrieval,Symbol localization | yes | 2010 |
| LIFULL HOME’S Dataset [71] | 8300 ten thousand | Retrieval,Deep learning,Text mining | yes | 2015 |
| CVC-FP [72] | 122 | Semantic segmentation | yes | 2015 |
| FPLAN-POLY [73] | 42 | Symbolic positioning | yes | 2010 |
| ROBIN [68] | 510 | Retrieval,Symbol location | yes | 2017 |
| FloorPlanCAD [74] | 10094 | Panoramic Symbol Positioning | yes | 2021 |
| BRIDGE [75] | 13000 | Symbol Recognition Scene Map Composition Retrieval Building Plan Analysis |
yes | 2019 |
| SFPI [76] | 10000 | Symbol positioning Building plan analysis |
yes | 2022 |
Table 3.
Building plan retrieval performance comparison
| methodology | dataset | performance | year |
|---|---|---|---|
| RLH + Chechik et al. [81] | ROBIN | Map=0.10 | 2009 |
| RLH + Chechik et al. [81] | SESYD | Map=1.0 | 2009 |
| BOW + Chechik et al. [81] | ROBIN | Map=0.19 | 2009 |
| BOW + Chechik et al. [81] | SESYD | Map=1.0 | 2009 |
| HOG + Chechik et al. [81] | ROBIN | Map=0.31 | 2009 |
| DANIEL [15] | ROBIN | Map=0.56 | 2017 |
| Sharma et al. [49] | ROBIN | Map=0.25 | 2016 |
| CVPR [82] | ROBIN | Map=0.29 | 2016 |
| MCS [82] | HOME | - | 2018 |
| CNNs(update) [36] | HOME | Accuracy=0.49 | 2018 |
| Sharma and Chattopadhyay [50] | ROBIN | MAP=0.31 | 2018 |
| Sharma and Chattopadhyay [50] | SESYD | MAP=1.0 | 2018 |
| FCNs [17] | HOME | MAP=0.39 | 2018 |
| REXplore [78] | ROBIN | MAP=0.63 | 2018 |
| Rasika et al. [52] | ROBIN | MAP=0.74 | 2021 |
| RISC-Net [79] | ROBIN | MAP=0.79 | 2022 |
| GCNs | ROBIN | MAP=0.85 | – |
Table 4.
Comparison of semantic features of different categories of floor plans and F1 values and mAP of commonly used retrieval methods.
Table 4.
Comparison of semantic features of different categories of floor plans and F1 values and mAP of commonly used retrieval methods.
| 6]*Class | Semantic Symbol Spotting | Instance Symbol Spotting | |||
|---|---|---|---|---|---|
| weighted Fl | mAP | ||||
| GCN-based DccpLabv3+ | Faster R-CNN | FCOS | YOLOv3 | ||
| single door | 0.885 | 0.827 | 0.843 | 0.859 | 0.829 |
| double door | 0.796 | 0.831 | 0.779 | 0.771 | 0.743 |
| sliding door | 0.874 | 0.876 | 0.556 | 0.494 | 0.481 |
| window | 0.691 | 0.603 | 0.518 | 0.465 | 0.379 |
| bay window | 0.050 | 0.163 | 0.068 | 0.169 | 0.062 |
| blind window | 0.833 | 0.856 | 0.614 | 0.520 | 0.322 |
| opening symbol | 0.451 | 0.721 | 0.496 | 0.542 | 0.168 |
| stairs | 0.857 | 0.853 | 0.464 | 0.487 | 0.370 |
| gas stove | 0.789 | 0.847 | 0.503 | 0.715 | 0.601 |
| refrigerator | 0.705 | 0.730 | 0.767 | 0.774 | 0.723 |
| washing machine | 0.784 | 0.569 | 0.379 | 0.261 | 0.374 |
| sofa | 0.606 | 0.674 | 0.160 | 0.133 | 0.435 |
| bed | 0.893 | 0.908 | 0.713 | 0.738 | 0.664 |
| chair | 0.524 | 0.543 | 0.112 | 0.087 | 0.132 |
| table | 0.354 | 0.496 | 0.175 | 0.109 | 0.173 |
Disclaimer/Publisher’s Note: The statements, opinions and data contained in all publications are solely those of the individual author(s) and contributor(s) and not of MDPI and/or the editor(s). MDPI and/or the editor(s) disclaim responsibility for any injury to people or property resulting from any ideas, methods, instructions or products referred to in the content. |
© 2025 by the authors. Licensee MDPI, Basel, Switzerland. This article is an open access article distributed under the terms and conditions of the Creative Commons Attribution (CC BY) license (http://creativecommons.org/licenses/by/4.0/).
Copyright: This open access article is published under a Creative Commons CC BY 4.0 license, which permit the free download, distribution, and reuse, provided that the author and preprint are cited in any reuse.


