Preprint
Article

This version is not peer-reviewed.

The Effects of Sodium Fructose Diphosphate on BLood Coagulation Reaction Time and Plasma Coagulation Factor Activity Tests In Vitro

Submitted:

20 January 2025

Posted:

22 January 2025

You are already at the latest version

Abstract

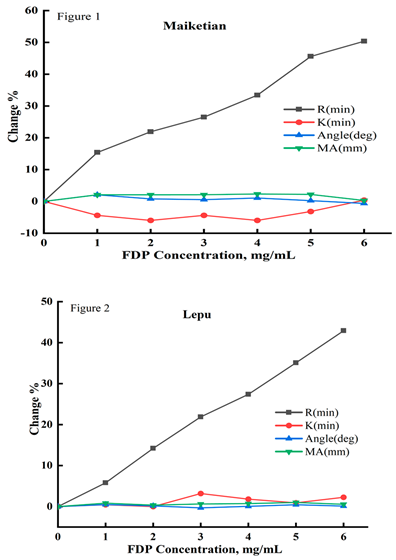
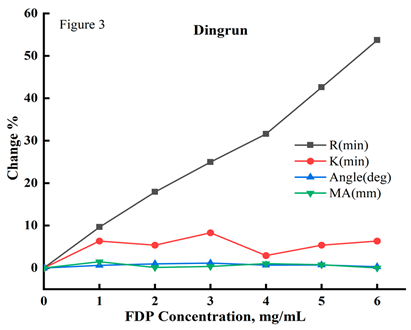
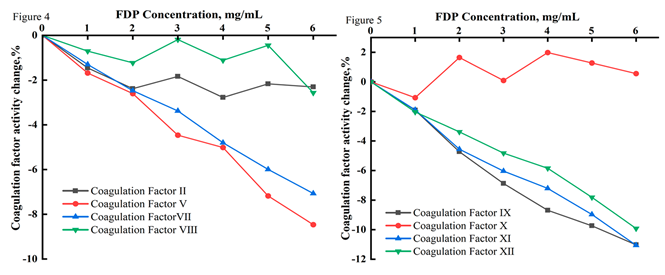
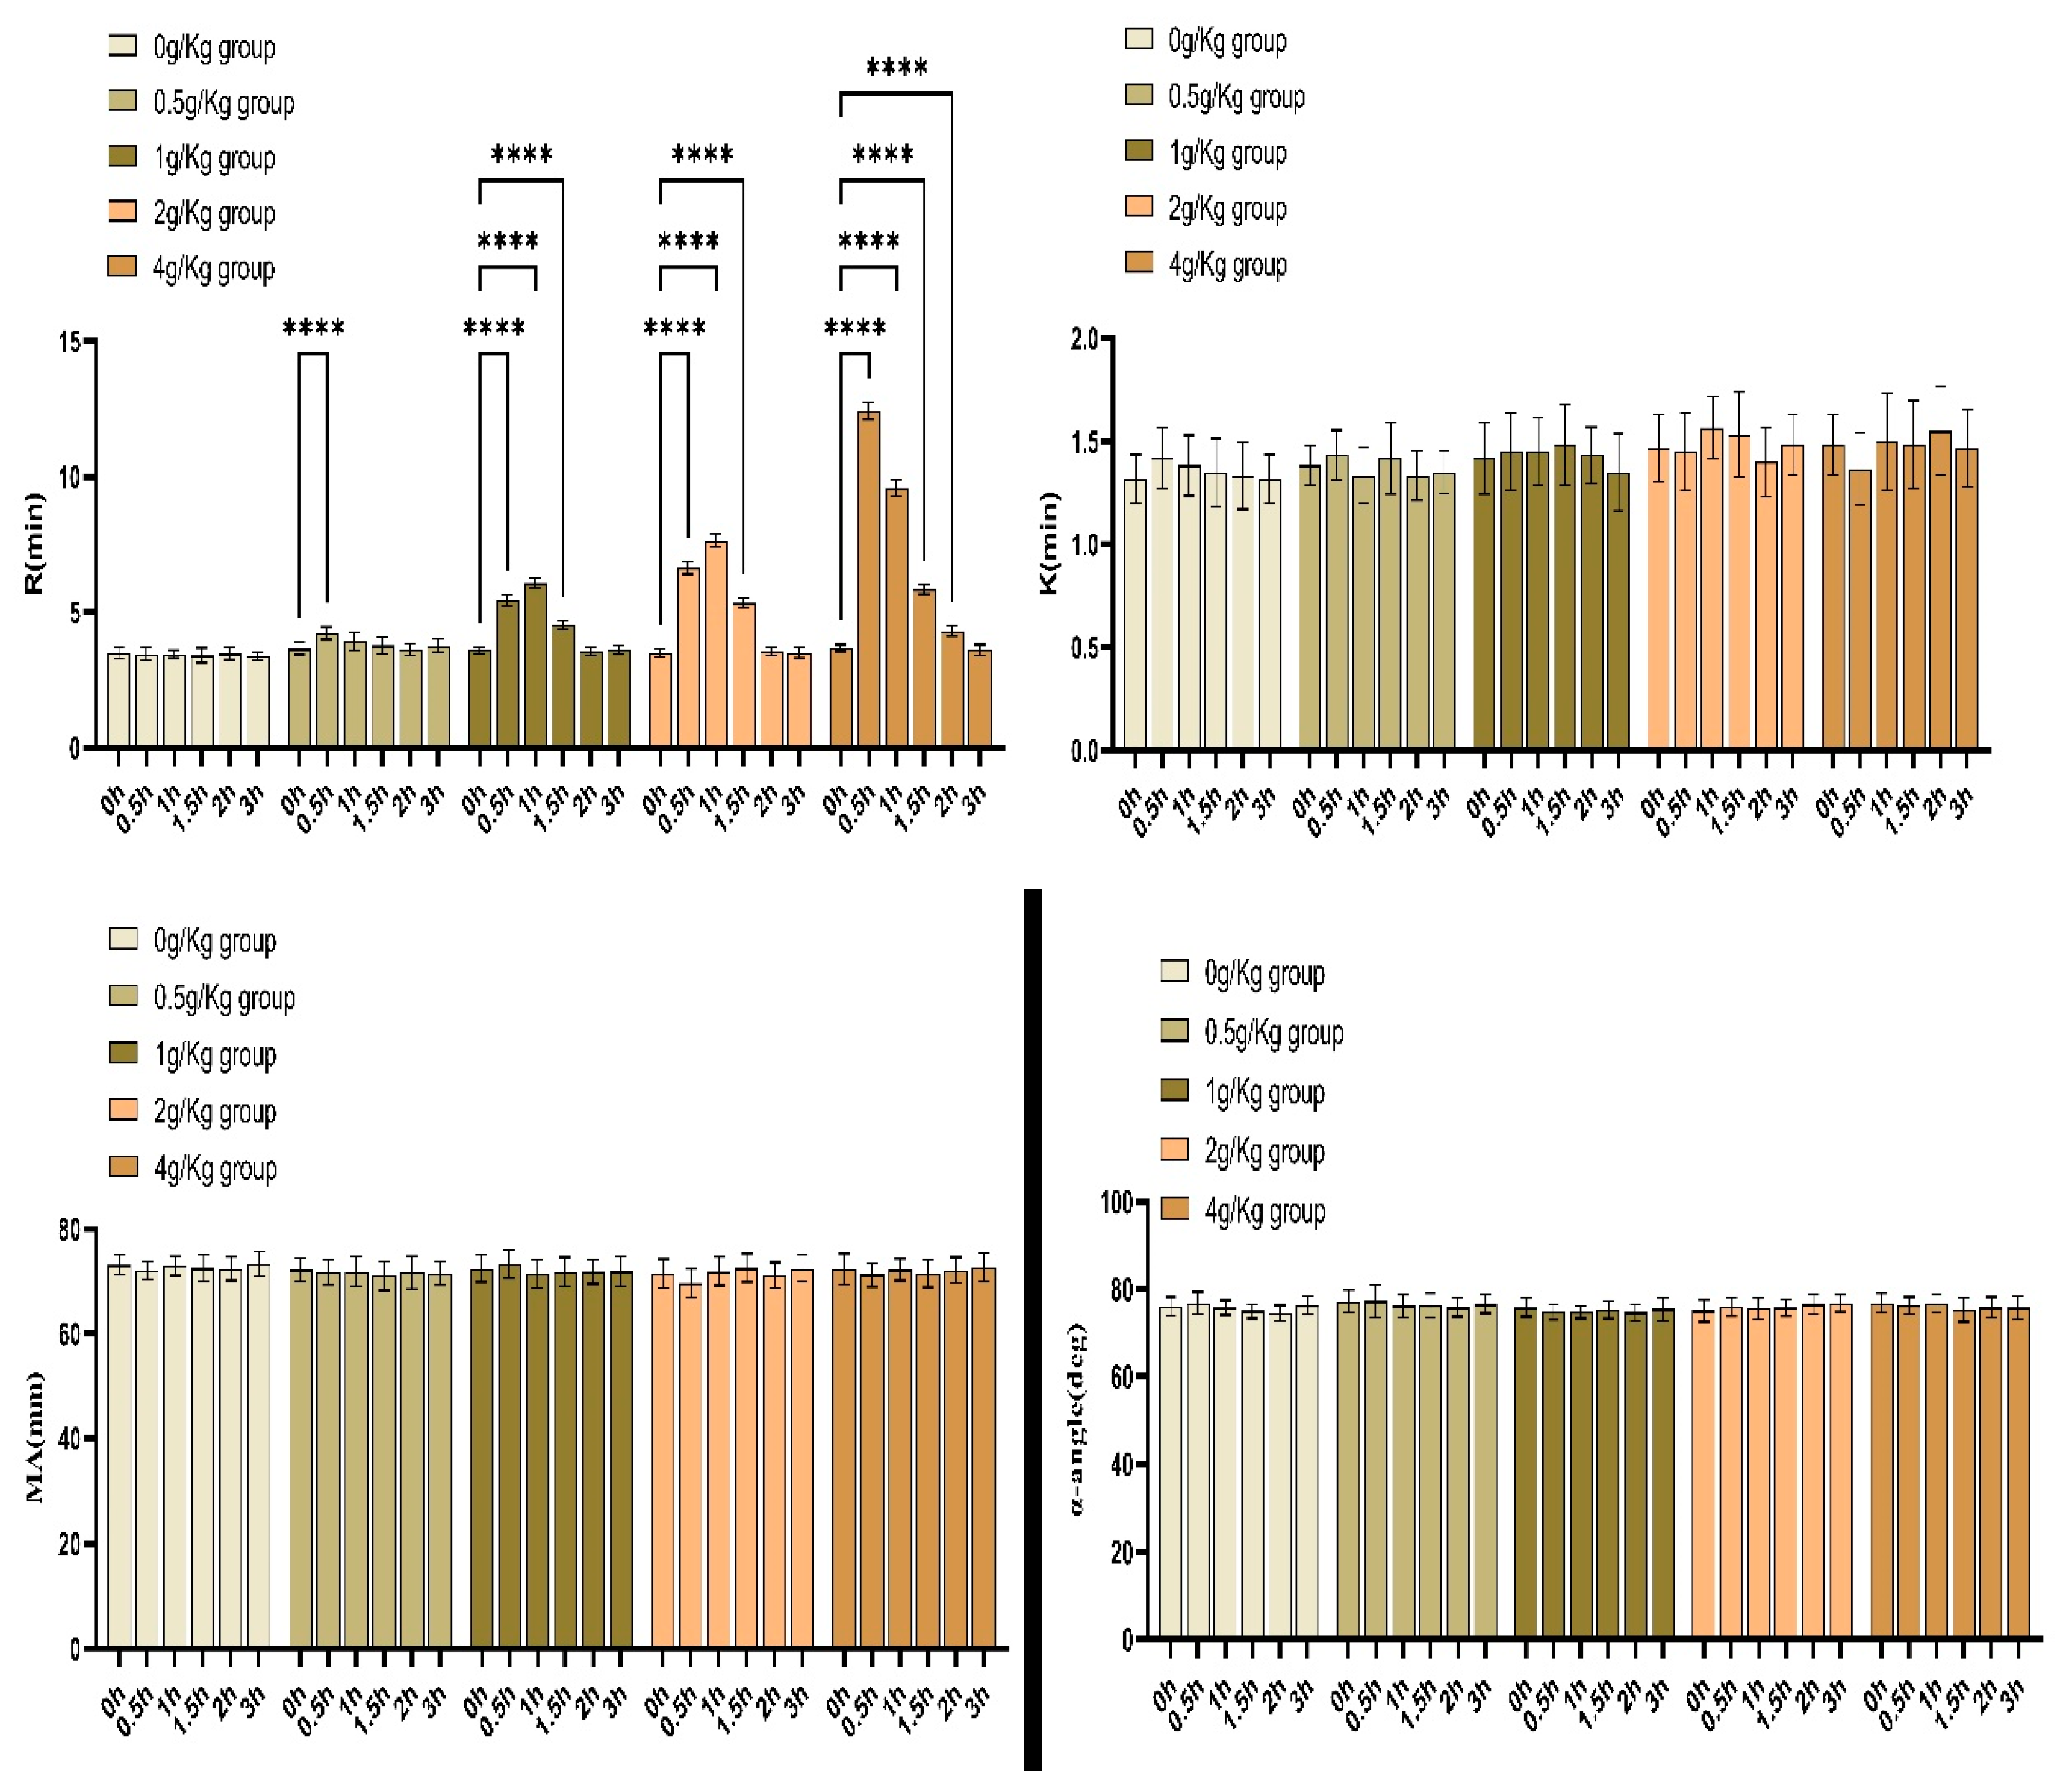
Objective To investigate the effects of sodium fructose diphosphate (FDP) on blood coagulation reaction time and plasma coagulation factor activity in vitro. Method The thromboelastogram detection system provided by three different manufacturers (Maiketian, Lepu, and Dingrun) was used to determine the blood coagulation reaction time (R) , clotting time (K), α-angle, and maximal amplitude (MA) of blood samples mixed with different concentrations FDP and the samples before dosing.The activities of coagulation factors II, V, VII, VIII, IX, X, XI and XII for plasma mixed with FDP were determined by automatic hemagglutination analysis system. The difference of test results between the experimental group with FDP and the control group without FDP was compared. The correlation between FDP concentration and the results of thrombologram or coagulation factor activity was analyzed by linear regression. New Zealand white rabbits were selected for the experiment on the effect of the drug on blood coagulation in vivo, and the changes of the thrombologram test results (R, K, α-angle, MA) at each time point after injection of FDP groups with the same dose were analyzed. According to the changes of the thrombologram test results before and after injection, statistical analysis was conducted to determine whether there were statistical differences in the effect of the drug on blood coagulation function. Result The results of thrombologram provided by three different manufacturers showed that the R value of blood sample was significantly correlated with the blood FDP concentration (P < 0.000), and the correlation coefficient r was 0.988 (Maiketian), 0.999 (Lepu) and 0.996 (Dingrun), respectively. There was no significant correlation between FDP concentration and K, α-angle , or MA (P > 0.05). The results of in vitro experiments showed that plasma coagulation factor V, VII, IX, XI and XII activities were significantly negatively correlated with plasma FDP concentrations (P < 0.000), and the correlation coefficients r were -0.995, -0.990, -0.989, 0.997, 0.995, respectively. The activities of II, VIII and X were not significantly affected by FDP (P > 0.05). In vivo experiments of New Zealand white rabbits showed that 0.5h after intravenous 0.5g/Kg FDP administration , 0.5h, 1h and 1.5h after 1g/Kg administration, 0.5h, 1h and 1.5h after 2g/Kg administration, and 0.5h, 1h, 1.5h and 2h after 4g/Kg administration, there were statistical differences in the R values of thrombologram compared with those before administration (P < 0.05), and the R values increased significantly after administration. That is, the blood coagulation reaction time is prolonged. Conclusion FDP can affect the results of blood coagulation test in vivo and vitro. It may really affect the function of our coagulation system.

Keywords: 
;  ;  

Introduction

Sodium fructose diphosphate (fructose-1, 6-diphosphate ,FDP) is an intermediate product of intracellular glycolytic metabolism with regulatory function of key enzyme activities of glucose metabolism [1]. Exogenous FDP enters the cell through the cell membrane to activate phosphofructokinase and pyruvate kinase to increase the concentration of adenosine triphosphate and phosphocreatine in the cell, and promote the inward flow of potassium and calcium ions, which is beneficial to the energy metabolism of the cell and glucose utilization under the state of ischemia and hypoxia [2], so as to make the ischemic tissue cells to reduce the damage, and to further improve the activity and function of the cells [3,4]. The drug began to be used in clinical practice in the 1980s, and subsequently, it has been widely used in the treatment of a variety of diseases, such as cardiovascular disease, acute adult respiratory distress syndrome, parenteral nutrition, digestive gastrointestinal disease postoperative, anemia, chronic obstructive pulmonary disease, renal insufficiency and so on [3,4]. FDP has a wide range of pharmacological effects, from the molecular level to participate in the regulation of a variety of intracellular metabolic processes, thereby improving cellular energy metabolism, increasing energy utilization, inhibiting the generation of free radicals, maintaining cell membrane stability, accelerating tissue repair, and maintaining organ function [4,5]. A large number of studies have confirmed that FDP can be used individually or adjunctively in the treatment of various causes of tissue ischemia, hypoxia and organ damage [5], exogenous FDP has almost no toxic side effects in the process of drug administration, and there is almost no contraindication, can be administered orally or intravenously, and has been widely used in the clinical environment, which has shown good social and economic benefits.
Although a large number of studies have shown that the use of FDP in the treatment of many diseases is efficacious and has few toxic side effects, the side effects of this drug are still not well understood and have only been sporadically reported, and so far, even less is known about whether this drug has any effect on the coagulation process. Thromboelastography (TEG) is a sensitive test used to reflect the coagulation process in whole blood, allowing a comprehensive assessment of platelet function, plasma factor activity, fibrin polymerization and fibrinolysis [6,7]. In this article, we further explored and clarified whether FDP has an effect on the blood coagulation process and on the activities of its coagulation factors (II, V, VII, VIII, IX, X, Ⅺ, Ⅻ) through in vitro experiments using TEG and coagulation factor activity monitoring.

Results

For the first time, we confirmed in vitro with experimental results that FDP pooled in plasma had a significant inhibitory effect on the activities of coagulation factors V, VII, IX, Ⅺ, and Ⅻ, whereas no inhibitory effect has been shown on the activities of coagulation factors II, VIII, and X. Thus,FDP can prolongs the reaction time of blood clotting test. Our experiments have proved that FDP is likely to prolong the blood clotting reaction time more or less to varying degrees In vitro and vivo.It is not difficult to see that we have reason to believe that FDP inhibits the activity of clotting factors and thus prolongs the reaction time of blood coagulation.
Correlation between FDP concentration and the results of TEG tests. Correlation analysis showed that the results of coagulation reaction time (R, min) by TEG routine testing was positively correlated with FDP concentration(p<0.000). The correlation coefficients between R and FDP concentration were 0.988, 0.999, and 0.996 for the thrombelastography testing systems provided by three different manufacturers, namely, Makotian, Lepu, and Dinrun, while no significant correlation was observed for coagulation formation time (K, min), coagulation angle (α-Angle), and coagulation maximal amplitude (MA, mm); the correlation results were as shown in Table 1, Figure 1, Figure 2 and Figure 3.
Preprints 146700 i001
Preprints 146700 i002
Figure 1, Figure 2 and Figure 3: Abbreviations: FDP, fructose diphosphate; Maiketian, Maiketian TX thromboelastography analyzer detection system; Lepu, Lepu CFMS LEPU-8880 thromboelastography analyzer detection system;Dingrun,Dingrun DRNX-III thromboelastography detection system. The thromboelastography coagulation time (R, min), coagulation time (K,min), maximum amplitude (MA,mm),and alpha angle(Angle) of the pooled blood after mixed with different concentrations FDP in vitro dected respectively by the Maiketian (Figure 1), Lepu (Figure 2), and Dingrun (Figure 3) thromboelastography analysis systems. The results of R were increased in a FDP concentration (0-6mg/mL) dependent way after the addition of FDP in the mixed blood in vitro. All three detection systems showed that as the concentration of FDP increased, the R results of sample showed a dependence on the increase of FDP concentration (0-6mg/mL). The Maiketian detection system showed an increase of 0~50.35%, Lepu 0~42.9% and Dingrun 0~53.68%,while the result of k, MA, and Angle showed no significant changes. The R value increase with the increase of FDP concentration in blood samples, showing a linear positive correlation trend.
Correlation of plasma coagulation factor (II, V, VII, VIII, IX, X, Ⅺ, Ⅻ) activities with their plasma FDP concentrations. The experiments results in vitro showed that plasma coagulation factor V, VII, IX, XI and XII activities were significantly negatively correlated with plasma FDP concentrations (P < 0.000), and the r of correlation coefficients was -0.995, -0.990, -0.989, 0.997, 0.995, respectively. The activities of II, VIII and X were not significantly affected by FDP (P > 0.05). The experimental results showed that the factors activities V, VII, IX, Ⅺ, and Ⅻ activities of the plasma pooled with different concentrations FDP in vitro(final concentrations of 0, 1, 2, 3, 4, 5, and 6 mg/mL) decreased dependently with the increase in the concentration of FDP, and that no significant changes in the activities of II, VIII, and X coagulation factors were observed (Table 2, Figure 4 and Figure 5).
Preprints 146700 i003
Abbreviations: FDP, Fructose diphosphate.
Figure 4 and Figure 5. The mean change with the activity for plasma coagulation factors (II, V, VII, VIII, IX, X, Ⅺ, Ⅻ) of mixed blood with different concentrations of FDP added was determined by Sysmex CS5100 Coagulation Analyzer System (?x±s, n=11). With the increase of FDP concentration (0, 1, 2, 3, 4, 5 and 6mg/mL),the activities of Coagulation factorⅤ,Ⅶ,Ⅸ,Ⅺ and Ⅻ showed a significant downward trend(p < 0.000) , while Ⅱ,Ⅷ and Ⅹ showed no significant statistical changes.
The results of blood coagulation reaction time for New Zealand white rabbits tested by thromboelastogram at different time points before and after FDP intravenous injection with different concentrations
The ANOVA results of blood thromboelastography at each time point after administration showed that R values were statistically different between the groups at each time point after administration and before(P < 0.05). There were no statistically significant differences for the K, α-angle , and MA values at each time point before and after administration between the different dose groups (P > 0.05) (Table 3). Analysis of variance (ANOVA) comparing the R-values at different time points within each dose group showed that there were statistically significant differences between the R-values of the 0.5g/kg group at 0.5h post-dose, the 1g/kg group at 0.5h, 1h and 1.5h post-dose, and the 2g/kg group at 0.5h, 1h and 1.5h post-dose, and the 2g/kg group at 0.5h, 1h, 1.5h, and 2h post-dose and their R-values prior to the administration of the drug (P<0.01); and there were no statistical differences (P>0.05) for the K, α-angle and MA values between time points compared with their pre-dose; ANOVA results showed no statistically significant differences (P > 0.05)(Figure 5).

Discussion

Up to now, we have reviewed a large number of literatures, and the author has not reported whether FDP has an effect on coagulation reaction time and the experimental results of coagulation factor activity. Members of our research team inadvertently discovered in their daily work that FDP had an impact on the results of the coagulation reaction time experiment (the thromboelastogram test system was provided by Macfield manufacturers). In order to further confirm this phenomenon, we have chosen Lepu and Dingrun to provide corresponding detection systems, and the results have been fully verified. Therefore, the coagulation reaction time detection system provided by three different manufacturers was used in this study to fully verify the reliability and repeatability of this phenomenon. Further study revealed that FDP had a significant inhibitory effect on the activity of some coagulation factors (V, VII, IX, Ⅺ, Ⅻ), and the intensity of inhibition was increased in a concentration-dependent way by FDP, whereas no significant change was seen in the activity of factors II, VIII, and X. The R result of TEG is the time it takes for the clotting system to activate in the blood sample until the TEG device can detect clot formation, reflecting the time when the clotting system is activated. The time it takes for the curve amplitude to reach 2 mm is commonly referred to as the coagulation reaction time R [8]. It provides information on the associated thrombin generation prior to fibrin chain deposition and also reflects the dynamic balance between coagulation factors and coagulation inhibitors.
The reference range of R for normal adult is 5-10 min, which is influenced by the most important factors including the relevant coagulation factors in the blood and the anticoagulants used by the patient. Usually, when R is shortened, it indicates that the patient's coagulation system is initiated faster, suggesting that the patient's coagulation factor activity is increased. Conversely, it suggests that the patient has reduced or deficient coagulation factor activity [9]. When serial concentrations of FDP were added to the blood specimens, the R of TEG were all significantly prolonged in a concentration-dependent way, which suggests that FDP may have an inhibitory effect on coagulation factor activity; or it may have an anti-activating effect on coagulation factors. We further tested their coagulation factor activities and found that the activities of coagulation factors V, VII, IX, Ⅺ, and Ⅻ were inhibited in a concentration-dependent manner by FDP. From the experimental results, R prolongation and coagulation factor activity reduction, the two results are mutually verified and coincide with each other, so we have reason to believe that FDP reduces coagulation factor activity or inhibits coagulation factor activation, prolongs the coagulation time of our coagulation system, and thus affects the function of coagulation system.
In order to verify whether the injection of FDP in vivo has an effect on coagulation function, we chose rabbits for experiments. Results of our experiments in New Zealand white rabbits show that FDP did have an effect on the coagulation reaction time (R) in rabbits, extending the coagulation reaction time, and the R value increased significantly with the increase of FDP dosage(Figure 5). In vitro and vivo, the drug may inhibit the coagulation initiation reaction process in the early stage of the coagulation process. Accordingly, it is reasonable to assume that the clinical use of this drug may prolong the patient's clotting time and even increase the risk of bleeding. Of course, since FDP is one of the substances normally metabolized in the body, all this experiment only used New Zealand white rabbits as the drug coagulation effect observation, and we did not conduct animal dynamics experiments.
PT, aPTT and TT reflect the function of extrinsic , intrinsic and common coagulation pathways [10]. As we have previously reported, in an in vitro assay, the PT, aPTT and TT assays of blood samples were significantly prolonged in a concentration-dependent way as the concentration of FDP increased [11]. Of course, this experiment is also an expansion and extension of previous experiments. Combined with the results of this experiment, that is, FDP inhibited the activity of coagulation factors (V, VII, IX, Ⅺ, and Ⅻ) or activated anti-coagulation factors (V, VII, IX, Ⅺ, and Ⅻ), it is not difficult to understand and see that, as the samples increased in the concentration of FDP, their coagulation factor activity was reduced, which led to the prolongation of PT, aPTT and TT. The results of the present experiment were mutually verified with the results reported in our last study; accordingly, we have reason to believe that the real reason for the prolongation of PT, aPTT and TT due to FDP is because of the inhibition of coagulation factor activity by FDP, which is a pleasing and meaningful as well as interesting thing to know.
FDP is a biochemically active substance in glucose metabolism and energy metabolism of human tissue cells, which can effectively provide bioenergy, promote the metabolic activity of biological tissue cells, enhance the functional activity of various tissues and organs, and facilitate the repair of damage caused by ischemia and hypoxia in the human heart, brain, liver, kidney and other solid organs and organs or tissue cells, so that clinically the drug has a wide range of uses [2,4,5]. The results of our study revealed the effect of FDP on in vitro coagulation assays, and therefore clinical care is required to exclude the effect of FDP combination on coagulation assays and to collect coagulation samples prior to the use of FDP. We have not conducted in vivo trials on humans yet, and it is unclear whether the drug contributes to the risk of bleeding, but clinicians should be concerned about whether there is an effect on coagulation and should carefully assess coagulation and bleeding trends when using the drug.
Our study has some limitations. We obtain the initial experimental drug concentration by assuming that the initial experimental drug concentration is based on the hypothetical dose used in the drug's instruction manual, which is recommended for adults to be given intravenously once a day at a dose of 5-10 g. Human blood accounts for about 7% of body weight, while plasma accounts for 55% of blood volume, and the theoretical expectation of plasma concentration FDP concentration in blood after 5-10g intravenous administration is about 1.86~ 3.71 mg/mL, calculated by a person with a normal weight of 70 kg. The initial final FDP concentration in this experiment was was set at 1 mg/mL and the maximum concentration 6 mg/mL, the simulated concentration in vitro, which covers the human blood concentration after intravenous administration. Our study showed that even with a blood concentration of 1 mg/mL, the blood TEG coagulation reaction time assay was significantly prolonged (p<0.000) as well as coagulation factors (V, VII, IX, Ⅺ, and Ⅻ) activities were significantly inhibited (p < 0.000). From this, we hypothesized that even the lowest therapeutic amount of FDP is likely to affect our coagulation function. The conclusion of our study is limited to in vitro study, which is one of the shortcomings of this study, and further in vivo experiments are needed. The purpose of our series experiments was to verify the correlation between FDP concentrations and clotting outcomes in vitro, rather than in vivo dosing concentrations. Their true concentrations in vivo are subject to validation of pharmacokinetic or pharmacodynamic data, which is one of the limitations of this study. Certainly, potentially useful studies in vitro can help to expose phenomena that may exist in vivo. It would be interesting to know if there is any indication that coagulation changes in treated patients when sodium fructose diphosphate is given. We look forward to the next potentially useful study, which will follow the peak measurements of the pharmacokinetic (PK) study, and further more valuable experimental results from blood samples taken at baseline and after FDP infusion. In addition, the specimens were from ordinary volunteers for normal physical examination, and patients with coagulation system diseases or taking medicine were excluded, and no additional volunteers were required to recruit, and the specimen selection scheme was fully approved by the hospital ethics committee.At the same time, this practice is also to reduce expenses and save funds.
In conclusion, our in vitro study confirmed that FDP has a clear and definite effect on our coagulation assay results, especially coagulation factor activity (V, VII, IX, Ⅺ, and Ⅻ) and coagulation reaction time . Whether FDP really affects our body's coagulation function should be of great concern to us.

Methods

Instruments and reagents. TEG analyzer and corresponding reagents from three different manufacturers( Makotian, Lepu and Dinrun) were used to analyze the blood sample coagulation reaction time (R), clotting formation time (K), coagulation Angle (α-Angle) and maximum amplitude (MA). The Maiketian TEG instrument reagent testing system is based on the Maiketian Haema TX Thromboelastography Test System and its corresponding reagents(Lot 20231101, Shenzhen Maiketian Biomedical Technology Co. Ltd.). LEPU CFMS LEPU-8880 Thromboelastography Analyzer and its reagents (Thrombelastograph General Cup Test Kit viscosity measuring, Lot 23SH0102.) were provided by Lepu Medical Technology Co. Ltd. Dingrun DRNX-Ⅲ Thrombelastograph Analyzer and its supporting reagents (Activated Coagulation Reagent, Lot 20230504) were manufactured by Chongqing Dingrun Medical Equipment Co. Ltd. The Sysmex Coagulation Testing System is based on the Sysmex CS5100 Coagulation Analyzer and its corresponding reagents, including Dade Actin Activated Cephaloplastin reagent for aPTT testing (Lot 562729A), Thromborel S for PT (Lot 568182), Coagulation Factor II Deficient Plasma (Lot 503659), Coagulation Factor V Deficient Plasma (Lot: 575712), Coagulation Factor Ⅶ Deficient Plasma (Lot 500776), Coagulation Factor VIII Deficient Plasma (Lot: 560857A), Coagulation Factor IX Deficient Plasma (Lot: 504172B), Coagulation Factor X Deficient Plasma (Lot 504029), Coagulation Factor Ⅺ Deficient Plasma (Lot 503358B), Coagulation Factor Ⅻ Deficient Plasma (Lot 503427), Standard Human Plasma (Lot 563120), CONTROL N (Lot 507936), CONTROL P (Lot 556743), and the reagents were provided by Siemens Medical Diagnostic Products GmbH, Germany. Sodium fructose diphosphate was purchased from Anhui Weilman Pharmaceutical Co. Ltd, China (Lot 20231001).
Sample testing methods and procedures. The following experimental procedures and protocols were approved by the Ethics Review Committee of Anhui No.2 Provincial People's Hospital, China [(R) 2024-037]. Prior to this test, all assay systems, except for normal calibration, were performed using commercially available control samples specified by the manufacturer of each assay system supporting traceability, including normal and abnormal quality control samples. Each sample was then tested on the machine with the assay system under normal conditions.
Blood sample collection and preparation. About 14 ml blood sample (no history of blood disorders such as platelet and coagulation disorders, and no medication that affects coagulation, such as aspirin, in the past 2 weeks) was randomly collected from 11 volunteers veins for normal physical health examination, sample anticoagulated by trisodium citrate at 1.09 mmol/L (blood-to-citric-acid anticoagulation ratio of 9:1).
Preparation and detection of thromboelastographic samples.
Take 7ml of anticoagulant blood samples prepared by each of the subjects mentioned above and 7 polyethylene graduated centrifuge tubes. Add 1ml sample and a certain weight of FDP (weighed accurately with an analytical balance) was added in each tube, so that the final FDP concentration of the mixture with blood and FDP in each tube was 0 (control tube), 1, 2, 3, 4, 5, and 6 mg/mL, respectively.The same procedure was performed on the other 10 mixed blood samples. In the same way,a total of 11 blood samples from different volunteers vein were prepared. The coagulation reaction time (R), clotting time (K), α-angle (α-Angle), and maximal amplitude (MA) were tested on the Maiketian , Lepu , and Dingrun thromboelastography systems, respectively.
Preparation and testing of coagulation factor plasma samples. Take 7ml of anticoagulant blood samples prepared by each of the subjects mentioned above and 7 polyethylene graduated centrifuge tubes. Add 1 ml blood sample to each tube. About 0.5ml plasma sample containing coagulation factor was obtained by centrifugation(centrifuged horizontally at 3000 r/min, R=15 cm, for 10min,) way. Then, a certain FDP was added to each plasma tube,and the final concentration of FDP in the mixture of plasma and FDP in each tube was 0 (control tube), 1, 2, 3, 4, 5, and 6 mg/mL, respectively.The same operation was carried out for the other 10 mixed plasma samples as described above. After lightly and thoroughly mixing, the coagulation factor II, V, VII, VIII, IX, X, Ⅺ, and Ⅻ activity of each mixed plasma sample was measured by a Sysmex CS5100 fully automated blood coagulation detection analyzer.
Animal experiment.
A total of 30 healthy adult male New Zealand Large White rabbits, weighing 2.3-3.0 kg, were purchased from the Laboratory Animal Center of Anhui Medical University under the license No. SYXK(Wan)2023-015. The animals were housed in separate cages with a 12 h/12 h light/dark cycle, and were given free access to food and water at room temperature of around 25℃ and relative humidity of approximately 50% for one week to familiarize themselves with the environment. The animals were routinely housed for one week to familiarize themselves with the environment. The rabbits were fasted 12 hours before each experiment and were given free access to water. Thirty New Zealand White rabbits were randomly divided into 5 groups of with FDP 0.0 g/kg (saline injection, i.e., control group), 0.5 g/kg, 1 g/kg, 2 g/kg and 4 g/kg, with 6 rabbits in each group. If the normal dose of 10g FDP is injected into a Chinese person (body weight 70 kg), the equivalent intravenous dose in a domestic rabbit (2.5 kg) is 0.467g/kg(10/70×3.27), roughly converted according to the body surface area. and the experimental groups (0.5, 1, 2 and 4 g/kg) were injected intravenously through the ear margins of the rabbits with the corresponding doses according to their body weigh. The injections were completed in less than one minute. The control group was injected with an equal volume of saline.One ml of blood sample was collected from the central artery of the ear before and 0.5 h, 1 h, 1.5 h, 2 h and 3 h after the administration of FDP, and placed in a polyethylene vacuum blood collection tube containing 3.8% sodium citrate with the ratio of 1:9(sodium citrate:blood). After being fully mixed and anticoagulated,the sample was completed with the detection ( R,K,α-angle and MA )of Maiketian thromboelastography system within 4 hours.
Statistical analysis. Before testing, each assay system was completed by the manufacturer to validate the performance of the assay system and qualified to pass the performance validation. Each sample was tested in three independent replicates according to the manufacturer's protocol and completed within two hours. The test results of samples with an FDP concentration of 0 mg/mL were used as control tubes, and the percentage change with the test results of each sample from the control tube was calculated in order to infer, based on the degree of change, whether the drugs had an effect on the results of the coagulation tests and to further assess the presence of concentration-dependent interferences in the coagulation tests. All statistical analyses were performed using Microsoft Excel 2003 (Microsoft Corporation, Redmond, WA, USA), linear regression analyses were performed using Statistical Products and Services Solutions 20.0 (SPSS20.0, IBM, Armonk, USA) statistical software. The Spearman Correlation coefficients were used to assess the correlation coefficients between FDP concentration and the R, K, α-Angle, MA, or coagulation factors activities of II, V, VII, VIII, IX, X, Ⅺ, and Ⅻ, respectively. To obtain linear regression equations, statistical hypothesis tests were performed on the regression coefficients to determine the presence or absence of a linear relationship, and P<0.05 was used to determine whether there was a significance. The sample of plasma or blood with0 mg/ml FDP was used as its corresponding control group, and P<0.05 was used to determine if significance existed.
Human and Animal Rights All procedures performed in study involving human participants were in accordance with the ethical standards of the institutional and/or national research committee and with the 1964 Helsinki declaration and its later amendments or comparable ethical standards. The study was approved by our Institutional Review Board, Anhui No.2 Provincial People's Hospital, China [(R) 2024-037].
Ethical approval The purpose of this study was to investigate the effects of FDP on coagulation reaction time and coagulation factor activity tests in vitro. This study was conducted in vitro and has no adverse effects on patients’ health, because the samples was randomly collected from 11 volunteers and experimenters did not have direct contact with volunteers. Demographic and clinical data were collected by a questionnaire. The the Ethical Committees of The Anhui No.2 Provincial People's Hospital approved the study [protocol number :No. [(R) 2024-037] and all the participants provided their written informed consent in accordance with the Declaration of Helsinki.

Authorship Contributions

Participated in research design: Tongqing Chen and Yalong Zhang, Conduct experiments: Tongqing Chen and Xingguo Zhong. Contribute new reagents or analytic tools: Yuan Fang. Perform data analysis: Lin Zhou. Wrote or contributed to the writing of the manuscript: Tongqing Chen and Yuan Fang.

Competing interest

The authors declare no competing interests.

Data availability statement

All relevant data are within the manuscript.

Acknowledgements

This work was supported by a fund from the Anhui Provincial Health Commission (Health Research Program of Anhui, AHWJ2023BAc20016; and Health Research Program of Anhui, AHWJ2023BAa20021).

References

  1. Zhang CS. et al. Fructose-1,6-bisphosphate and aldolase mediate glucose sensing by AMPK. Nature. 548(7665):112-116(2017).
  2. Wang W, Liu M, You C, Li Z & Zhang YHP. ATP-free biosynthesis of a high energy phosphate metabolite fructose 1,6-diphosphate by in vitro metabolic engineering. Metab Eng. 42:168-174(2017).
  3. Alva N,Alva R & Carbonell T. Fructose 1,6-bisphosphate:A summary of its cytoprotective mechanism. Curr Med Chem. 23(39) :4396-4417(2016).
  4. Li TT, Xie JZ, Wang L,Gao YY & Jiang XH. Rational application of fructose-1, 6-diphosphate:From the perspective of pharmacokinetics. Acta Pharm. 65(2):147-157(2015).
  5. Donohoe PH, Fahlman CS, B ickler PE, etal. Neuroprotection and in-tracellular Ca2+ modulation w ith fructose-1, 6-bisphosphate during in vitro hypoxia-ischem ia involves phospholipaseC-dependent signaling[ J]. B rain Res, 917(2): 158 -166(2001).
  6. Lancé M D. A general review of major global coagulation assays: thrombelastography, thrombin generation test and clot waveform analysis[J]. Thrombosis journal, 13(1): 1(2015).
  7. Elliott, Andrea, Wetzel,Jeremy,et al. Thromboelastography in patients with acute ischemic stroke[J].International journal of stroke: official journal of the International Stroke Society. 10(2):194-201(2015).
  8. David WJ, James AD.TEG and ROTEM: technology and clinical applications[J]. Am J Hematol, 89(2):228-32(2014).
  9. Snorre BS, Jerard S, Joar S, etal. The use of thromboelastography (TEG) in massively bleeding patients at Haukeland University Hospital 2008-15[J]. Transfus Apher Sci, 58(1):117-121(2019).
  10. Kamal AH, Tefferi A, Pruthi RK. How to interpret and pursue an abnormal prothrombin time, activated partialthromboplastin time, and bleeding time in adults[J]. Mayo Clin Proc. 82(7):864-73(2007).
  11. Chen TQ, Duan Chen D , Lu Chen L, et al. The effects of fructose diphosphate on routine coagulation tests in vitro[J]. Sci Rep, 12(1):304(2022).
Figure 5. There were statistically significant differences between the R-values of the 0.5g/kg group at 0.5h post-dose, the 1g/kg group at 0.5h, 1h and 1.5h post-dose, and the 2g/kg group at 0.5h, 1h and 1.5h post-dose, and the 2g/kg group at 0.5h, 1h, 1.5h, and 2h post-dose and their R-values prior to the administration of the drug (P<0.0001); and there were no statistical differences (P>0.05) for the K, α-angle and MA values between time points compared with their pre-dose.
Preprints 146700 g001
Table 1. The coagulation time (R, min), coagulation time (K,min), maximum amplitude (MA,mm),and alpha angle(deg) of the pooled blood containing with different concentrations FDP in vitro detected by the Maiketian, Lepu, and Dingrun thromboelastography analysis systems, respectively(x±s, n=11);*p<0.000,There is a significant difference in statistical results compared to the control group (0mg/ml FDP).Abbreviations:FDP,Fructose diphosphate.
FDP(mg/mL) Maiketian Lepu Dingrun
R(min) K(min) Angle(deg) MA(mm) R(min) K(min) Angle(deg) MA(mm) R(min) K(min) Angle(deg) MA(mm)
0 5.66±0.49 2.52±0.27 67.35±2.76 63.51±2.28 6.90±0.46 2.20±0.26 68.14±2.53 63.8±2.62 6.65±0.36 2.05±0.27 69.37±2.51 64.14±2.43
1 6.53±0.50* 2.41±0.31 68.75±2.73 64.83±3.07 7.30±0.31* 2.21±0.26 68.47±2.00 64.33±2.85 7.29±0.49* 2.18±0.28 69.81±2.31 65.08±2.67
2 6.9±0.51* 2.37±0.28 67.89±2.48 64.84±2.88 7.88±0.38* 2.20±0.30 68.25±2.45 64.03±2.88 7.84±0.59* 2.16±0.27 70.05±2.44 64.23±2.52
3 7.16±0.55* 2.41±0.26 67.72±2.42 64.85±2.79 8.41±0.45* 2.27±0.27 67.93±2.27 64.20±2.53 8.31±0.61* 2.22±0.30 70.18±2.58 64.38±2.43
4 7.55±0.43* 2.37±0.20 68.08±1.78 65.00±2.73 8.79±0.47* 2.24±0.32 68.18±2.22 64.26±2.85 8.75±0.63* 2.11±0.25 69.84±2.14 64.81±2.48
5 8.24±0.49* 2.44±0.29 67.51±1.88 64.91±2.82 9.32±0.46* 2.22±0.33 68.45±2.07 64.44±2.74 9.48±0.63* 2.16±0.25 69.87±2.44 64.64±2.69
6 8.51±0.47* 2.53±0.30 66.92±2.22 63.70±3.10 9.86±0.45* 2.25±0.32 68.22±2.27 64.16±2.52 10.22±0.63* 2.18±0.25 69.57±2.13 64.15±2.44
r 0.988 0.106 -0.474 0.109 0.999 0.714 0.054 0.563 0.996 0.417 0.144 -0.057
Regression equation Yresult=0.4507XFDP+ 5.8693 Yresult=0.0032XFDP+2.4261 Yresult=-0.1279XFDP+68.129 Yresult=0.0318XFDP+64.425 Yresult=0.4939XFDP+6.8696 Yresult=0.0075XFDP+2.2046 Yresult=0.0046XFDP+68.22 Yresult=0.0546XFDP+64.01 Yresult=0.5714XFDP+6.6486 Yresult=0.0107XFDP+2.1193 Yresult=0.0182XFDP+69.758 Yresult=-0.0096XFDP+64.519
P 0.000 0.822 0.282 0.816 0.000 0.071 0.908 0.188 0.000 0.352 0.759 0.903
Table 2. Coagulation factor (Ⅱ、Ⅴ、Ⅶ、Ⅷ、Ⅸ、Ⅹ、Ⅺ、Ⅻ) activities(%)of the pooled plasma containing with different concentrations FDP in vitro detected by Sysmex CS5100 coagulation analysis system(?x±s, n=11);*p<0.000,There is a significant difference in statistical results compared to the control group (0mg/ml FDP).Abbreviations:FDP,fructose diphosphate.
FDP(mg/mL) Coagulation factor activities(%)
II
0 125.25±18.96 146.85±26.42 109.35±9.07 75.88±10.15 68.24±7.40 130.05±24.54 112.26±17.50 121.57±17.69
1 123.14±19.33* 144.94±25.13* 107.25±8.58* 74.44±10.08* 66.85±7.48* 128.16±22.13 111.47±17.27 120.27±20.73
2 121.99±18.83* 143.22±24.67* 104.18±8.31* 72.42±10.09* 65.93±7.52* 126.95±22.12 110.88±17.87 123.57±19.10
3 119.66±17.16* 141.89±24.15* 101.83±7.80* 71.30±10.30* 64.95±7.25* 127.66±22.27 112.05±17.60 121.68±20.00
4 118.97±17.29* 139.80±24.47* 99.85±7.04* 70.41±10.05* 64.25±7.51* 126.44±23.66 111.01±16.85 123.98±17.98
5 116.26±16.46* 138.05±23.52* 98.70±7.00* 69.07±9.87* 62.91±7.68* 127.23±23.57 111.76±18.21 123.12±17.22
6 114.65±16.38* 136.47±22.38* 97.29±7.10* 67.49±9.06* 61.47±7.35* 127.05±22.51 109.38±17.13 122.25±17.13
r -0.995 -0.99 -0.989 -0.997 -0.995 -0.737 -0.630 0.484
Regression equation Yresult=-1.735XFDP+125.19 Yresult=-1.7264XFDP+146.78 Yresult=-2.0575XFDP+108.81 Yresult=-1.3543XFDP+75.636 Yresult=-1.0668XFDP+68.143 Yresult=-0.4061XFDP+128.87 Yresult=-0.2832XFDP+112.11 Yresult=0.2911XFDP+121.48
P <0.000 <0.000 <0.000 <0.000 <0.000 0.059 0.129 0.27
Table 3. Thromboelastograms (R, K, α-angle, and MA) of different dose groups at different point time before and after FDP intravenous injection(x±s, n=6).
time(h) R(mim) F P
0g/Kg group 0.5g/Kg group 1g/Kg group 2g/Kg group 4g/Kg group
0a 3.52±0.21 3.67±0.23 3.62±0.12 3.50±0.14 3.67±0.12 1.38 0.26
0.5b 3.47±0.23 4.23±0.23* 5.45±0.21* 6.65±0.23* 12.43±0.32* 1241.1 0.000
1b 3.47±0.15 3.93±0.33 6.08±0.19* 7.65±0.23* 9.60±0.30* 643.8 0.000
1.5b 3.42±0.28 3.78±0.31 4.53±0.15* 5.35±0.19* 5.85±0.16* 122.1 0.000
2b 3.48±0.23 3.62±0.21 3.58±0.15 3.58±0.15 4.32±0.20* 18.7 0.000
3b 3.38±0.15 3.77±0.24 3.62±0.16 3.52±0.20 3.62±0.19 3.27 0.027
time(h) K(mim) F P
0g/Kg group 0.5g/Kg group 1g/Kg group 2g/Kg group 4g/Kg group
0a 1.32±0.12 1.38±0.10 1.42±0.17 1.47±0.16 1.48±0.15 1.33 0.286
0.5b 1.42±0.15 1.43±0.12 1.45±0.19 1.46±0.20 1.37±0.18 0.27 0.893
1b 1.38±0.15 1.33±0.14 1.45±0.16 1.57±0.14 1.50±0.24 1.75 0.171
1.5b 1.38±0.16 1.42±0.17 1.48±0.19 1.53±0.21 1.48±0.21 0.83 0.518
2b 1.33±0.16 1.33±0.12 1.43±0.14 1.40±0.17 1.55±0.22 1.78 0.165
3b 1.32±0.12 1.35±0.10 1.35±0.19 1.48±0.15 1.47±0.19 1.49 0.234
time(h) α-angle(deg) F P
0g/Kg group 0.5g/Kg group 1g/Kg group 2g/Kg group 4g/Kg group
0a 76.05±2.14 77.18±2.57 75.82±2.12 75.08±2.47 76.83±2.22 0.78 0.547
0.5b 76.82±2.54 77.35±0.23 74.83±1.83 75.97±2.15 76.30±1.91 0.86 0.504
1b 75.78±1.65 76.17±2.53 74.80±1.38 75.58±2.40 76.72±2.13 0.71 0.592
1.5b 75.02±1.60 76.27±2.81 75.32±2.04 75.77±1.95 75.38±2.73 0.27 0.896
2b 74.55±1.81 75.88±2.15 74.67±1.91 76.63±2.26 75.85±2.34 1.06 0.394
3b 76.28±2.07 76.63±2.20 75.43±2.54 76.88±2.17 75.78±2.68 0.32 0.863
time(h) MA(mm) F P
0g/Kg group 0.5g/Kg group 1g/Kg group 2g/Kg group 4g/Kg group
0a 73.13±1.92 72.22±2.27 75.52±2.61 71.47±2.76 72.35±2.91 0.34 0.849
0.5b 72.10±1.64 71.70±2.40 73.27±2.68 69.67±2.79 72.27±2.28 1.81 0.159
1b 72.95±1.86 71.85±2.85 71.43±2.75 71.92±2.71 72.23±2.09 0.31 0.868
1.5b 72.57±2.46 71.07±2.80 71.85±2.72 72.57±2.63 71.51±2.60 0.37 0.826
2b 72.40±2.26 71.72±3.13 71.87±2.31 71.22±2.40 72.12±2.44 0.19 0.943
3b 73.35±2.37 71.53±2.25 71.95±2.78 72.50±2.54 72.75±2.67 0.46 0.761
a: Before FDP injection; b:after FDP injection. P>0.05,No statistically significant difference between different dose groups at the same time point; P < 0.05, with statistically significant differences between the different dose groups at the same time point.*:P<0.01.
Disclaimer/Publisher’s Note: The statements, opinions and data contained in all publications are solely those of the individual author(s) and contributor(s) and not of MDPI and/or the editor(s). MDPI and/or the editor(s) disclaim responsibility for any injury to people or property resulting from any ideas, methods, instructions or products referred to in the content.
Copyright: This open access article is published under a Creative Commons CC BY 4.0 license, which permit the free download, distribution, and reuse, provided that the author and preprint are cited in any reuse.
Prerpints.org logo

Preprints.org is a free preprint server supported by MDPI in Basel, Switzerland.

Subscribe

Disclaimer

Terms of Use

Privacy Policy

Privacy Settings

© 2026 MDPI (Basel, Switzerland) unless otherwise stated