Submitted:
14 January 2025
Posted:
14 January 2025
You are already at the latest version
Abstract
Residual host cell DNA in biological products poses potential risks of tumorigenicity and infectivity. Therefore, current regulatory authorities including the World Health Organization (WHO), the Chinese Pharmacopoeia, and the U.S. Food and Drug Administration (FDA) have
limited the acceptance amounts of residual DNA (less than 10 ng or 3 ng/dose). Among various detection methods for residual DNA, quantitative PCR (qPCR) is recognized as the most practical method for its high sensitivity, accuracy, precision, and efficiency. This study aimed to develop a qPCR method for detecting residual Vero cell DNA to facilitate downstream purification and ensure quality control during vaccine manufacturing. We selected two highly repetitive Vero genomic DNA sequences as amplification targets: the "172 bp" sequence and the Alu repetitive sequence. The qPCR method was meticulously optimized and validated for linearity, quantitation limit, specificity, accuracy, repeatability, intermediate precision, and robustness. The "172 bp" sequence qPCR assay showed excellent linearity and amplification efficiency, establishing a dependable approach for quantifying residual Vero DNA in pharmaceuticals and for regulatory compliance monitoring.
Keywords:
Vero cell
; Exogenous DNA residue
; qPCR
; Method Validation
1. Introduction
Vero cell, a cell line that has been continuously passaged, is widely used for vaccine production. In 1962, two scientists Y. Yasumura and Y. Kawakita from Chiba University in Japan, first established Vero cell line [1]. The parent cells were derived from normal adult African green monkey renal epithelial cells. In 1964, Dr. B. Simizu introduced Vero cells at passage 93 to the tropical virus research laboratory in NIH Institute of Allergy and Infectious Diseases (NIAID), and the cell strain had been cultivated to passage 113, further submitted to ATCC for preservation [2]. At ATCC, the cell underwent 121th passages, and a cell bank was established as well. Afterwards, the cell was available to external entities. Aventis Pasteur first used Vero cells as the cell substrate for vaccine production [3]. In 2014, the complete genome of Vero cell line was sequenced by Japanese scientists. Since the primary green monkey kidney cells contain 60 chromosomes, the number of chromosomes in Vero cell line ranges from 52 to 62, mostly have 59 [4]. Moreover, Vero is one of the cell substrates recommended by WHO for human vaccine production. A variety of vaccine products from Vero cells have been successfully developed worldwide.
Biological products derived from Vero cells, such as Vero cell-adapted rabies vaccine [5], may contain specific impurities, including host cell DNA residues. Relevant studies have shown that host cell DNA residues from biological products are associated with potential tumorigenic and infectious risks, and DNA residues may also cause gene mutations through abnormal insertion. Hence, WHO and FDA allow up to 10 ng/dose of residual DNA in biological products or vaccines [6-7]. Chinese Pharmacopoeia allows up to 3 ng/dose for Vero cell rabies vaccine. To satisfy the local regulations, highly sensitive and accurate methods for the detection and quantitation of low level DNA are needed to meet the requirements.
Three methods have been recommended by medical administration for residual host cell DNA quantitation, including DNA hybridization assay, Fluorescent Dye assay, and qPCR [8]. Among these methods, qPCR is considered to be the most practical for residual DNA quantitation due to its high sensitivity, accuracy, precision, and rapid test. And only qPCR method is mentioned in the United States Pharmacopoeia [9].
The aim of this study is to develop a method for detecting residual Vero cell DNA based on qPCR. This method is more convenient to guide the downstream purification process, as well as to provide the quality control during manufacturing.

Table 1.
Comparison of detection limits of different residual DNA detection methods.
| Method | Limit of Detection (DL) |
| Spectrophotometry | 0.1 μg/mL |
| Fluorescent dye (PicoGreen) | 25-100 pg |
| Hybridization, randomly labeled DNA | 50 pg(10-12 g) |
| Hybridized, biotin-labeled probe | 2 pg |
| Hybridization, repeat sequence (SINE, Alu) | 5 pg |
| Immunoassay | 5-10 pg |
| PCR method, unique sequence DNA | fg(10-15 g) |
| PCR method, repetitive sequence (SINE,Alu) | ag(10-18 g) |
2. Materials and Methods
2.1. Cells
Vero cell was purchased from Cell Bank/Stem Cell Bank, Chinese Academy of Sciences. Cells were cultured in Eagle's minimum essential medium (Gibco) supplemented with 10% fetal bovine serum (FBS, Gibco) and 5% CO2 at 37℃, and passaged every 2-3 days. Other cell lines (CHO, HEK293T, HEK293, NS0 and MDCK) and common bacteria strains (E.coli and Pichia pastoris) were provided by HZSKBIO.
2.2. Reagents and Program
DNA preparation kit (Cat. SK030206DM50, magnetic beads method) was manufactured by HZSKBIO and in-house detection reagents (contain enzymes, buffers, probes and primers, etc) was prepared by HZSKBIO. Actual samples were collected by National Institutes for Food and Drug Control (NIFDC).
Sample DNA were extracted and detected following manufacturer’s instructions. The reaction program is as follows: 95℃ for 10 min, (95℃ for 15 s, and 60℃ for 1 min) for 40 cycles.
2.3. Bioinformatic Analysis
The key features of qPCR highlights suitable target sequences, probe primer design, and optimized reaction system. The specific target sequence should meet the following requirements: 1. The sequence is unique to the Vero cell genome; 2. The copy number is closely correlated to the size fragment of target sequence in Vero cell genome; 3. The sequence is less affected by inactivating agents, such as β-propionolide and formaldehyde.
The chromosome number of primary green monkey kidney cells is 60. The range of chromosome number of Vero cell line reported by ATCC varies from 52 to 62, with a mean of 59 [4]. And the haploid genome is 6.1 × 10⁹ bp. After analyzing the characteristics of the African green monkey genome, two highly repetitive sequences of Vero genomic DNA were selected as the amplification targets.
a. “172 bp” sequence (GenBank: V00145.1). Based on literature [10], a unique 172bp tandem repeat sequence of the Vero cell genome, that is about 6.8 ×10⁶ copies/haploid genome. Primers were designed to detect fragments of 99 bp and 154 bp on “172 bp” sequence.
b. Alu repetitive sequence (GenBank: X01476.1). Based on literature [11], Alu repetitive sequence of the Vero cell genome, that is about 3×10⁵ copies/haploid genome. Primers were designed to detect fragments of 151 bp and 221 bp on Alu repetitive sequence.
2.4. Method Development
As described above, amplicon of 99 bp and 154 bp for “172 bp” sequence and 151 bp and 221 bp for Alu repetitive sequence were selected. Parameters for standard curve were assessed, which contained 0.3 fg/μL, 3 fg/μL, 30 fg/μL, 300 fg/μL, 3 pg/μL and 30 pg/μL for “172 bp” sequence and 3 fg/μL, 30 fg/μL, 300 fg/μL, 3 pg/μL, 30 pg/μL and 300 pg/μL for Alu repetitive sequence.
Vero DNA was sonicated for a different duration to get a series of DNA fragments (Sonicater, SPEC-DW-12028B, power 1200W). DNA fragment size were assessed by electrophorese, and the influence of DNA length was analyzed by qPCR.
2.5. Method Validation
2.5.1. Linearity & Range
The standard curve was prepared from a 10-fold dilution series of Vero DNA. Then the linearity (R2 value), amplification efficiencies for the standard curves, relative standard deviation (RSD) and relative bias of samples were assessed.
2.5.2. Quantitation limit
Samples prepared from Vero DNA were tested in 10 replicates, and RSD and relative bias were further assessed.
2.5.3. Specificity
Interference of genomes from other species (CHO, E.coli, HEK293, HEK293T, Pichia pastoris, NS0 and MDCK) were tested in triplicate.
2.5.4. Accuracy
Samples with 30 pg/μL, 0.3 pg/μL and 0.006 pg/μL of Vero DNA were extracted and tested, and recovery was assessed in parallel.
2.2.5. Repeatability
Samples with 3 pg/μL and 0.03 pg/μL of Vero DNA were extracted and tested for 6 replicates respectively, and CV was assessed.
2.5.6. Intermediate Precision
Samples with 30 pg/μL, 0.3 pg/μL and 0.006 pg/μL of Vero DNA were extracted and tested by 3 technicians for total 3 individual results, and CV was assessed.
2.5.7. Robustness
Quantification limit was assessed using qPCR systems from different brand, including SHENTEK-96S (HZSKBIO), ABI7500 (Thermo), LightCycler480 II (Roche), CFX96 (Bio-Rad), FQD-96A(Bioer) and qTOWER3G(Jena).
2.6. Data Analysis
2.6.1. Calculation of Sample RSD
RSD = Standard deviation of detection value / mean detection value × 100%
2.6.2. Calculation of residual concentration of sample DNA
2.6.3. Relative Bias calculation:
2.6.4. Recovery calculation:
3. Results
3.1. Assay Optimization
3.1.1. qPCR Method for ”172 bp” Sequence Target Gene
Vero DNA showed superior linearity in the ranges of 0.3 fg/μL, 3 fg/μL, 30 fg/μL, 300 fg/μL, 3 pg/μL and 30 pg/μL, with correlation coefficients of 0.9997 and 0.9977. And the amplification efficiency were 88.8% and 87.7% for 99 bp and 154 bp, respectively (Figure 1).
Vero genomic DNA was subjected to ultrasonic treatment and electrophoresis, and then assayed by qPCR. Six tubes of Vero DNA (50 μL, 30 ng/μL) were prepared by sonication. One tube served as a negative control (0 min), and the rest of five tubes were subjected to ultrasonic fragmentation for 10 s, 1 min, 5 min, 10 min and 30 min, respectively, to obtain a series of DNA size fragments.
Left: Electrophoresis of DNA fragments with increasing sonication treatment time. Lane 1 is a DNA marker (DL2000 ladder), lane 2 is negative sample (0 min ultrasound), and lane 3 is 10 s ultrasound-treated sample; lane 4 is 1 min ultrasound-treated sample; lane 5 is 5 min ultrasound-treated sample; lane 6 is 10 minute ultrasound-treated sample; Lane 7 is 30 min ultrasound-treated sample. DNA marker: 2,000 bp, 1,000 bp, 750 bp, 500 bp, 250 bp and 100 bp from top to bottom.
Right: qPCR assay of gradient diluted DNA fragments of Vero DNA, concentration gradient: 100 pg/μL, 10 pg/μL, 1 pg/μL and 0.1 pg/μL.
As shown in Figure 2, the performance of qPCR from six fragmented DNA samples, which were diluted in four concentrations, showed no significant difference. Thus, the PCR reaction system was not affected by the size of the DNA fragments.
3.1.2. qPCR Method for Alu-Like Sequence Target Gene
Vero DNA showed good linearity in the ranges of 3 fg/ μL, 30 fg/ μL, 300 fg/μL, 3 pg/μL, 30 pg/μL and 300 pg/μL, with correlation coefficients of 0.9992 and 0.9998. And the amplification efficiency were 93.0% and 91.8% for 151 bp and 221 bp, respectively (Figure 3).
5 tubes of Vero genomic DNA (50μL, 30 ng/μL) was subjected to ultrasonic treatment and electrophoresis, and then detected by qPCR. Similarly, one tube served as negative control (0 min), and the remaining four tubes were subjected to ultrasonic fragmentation for 10 s, 1 min, 10 min and 30 min as mentioned above, respectively.
Left: Electrophoresis of DNA fragments with increasing sonication treatment time. Lane 1 is a DNA marker (DL2000 ladder), lane 2 is negative sample (0 min), and lane 3 is 10 s-treated ultrasonic sample; lane 4 is a 1 min-treated ultrasonic sample; lane 5 is a 10 min-treated ultrasonic sample; Lane 6 is a 30 min-treated ultrasound sample. DNA molecular weight standard: 2,000 bp, 1,000 bp, 750 bp, 500 bp, 250 bp, and 100 bp from top to bottom.
Right: qPCR assay of gradient diluted DNA fragments of Vero DNA, concentration gradient: 300 pg/μL, 30 pg/μL, 3 pg/μL, 300 fg/μL, 30 fg/μL and 3 fg/μL.
As shown in Figure 4, the performance of qPCR from five fragmented DNA samples, which were diluted in six concentrations, showed no significant difference. And the PCR reaction system is not affected by the size of DNA fragments.
3.1.3. Vaccine Drug Substance (DS) Sample Test
Three rabies vaccine DS solution and one Vero DNA National Standard for hybridization method were tested by all 4 detection reactions, results were shown in Table 2-3 and Figure 5.
The results showed that the copies of short amplicon were high and longer amplicon were less in the same sample; The larger the amplified fragment, the higher possibility of missed detection could occur.
The results showed that the Vero DNA concentration was stable for all four amplification targets using Vero DNA National Standard for hybridization method.
Vero DNA showed superior linearity for all four amplification targets. “172 bp” sequence can get higher DNA concentration for all 3 rabies vaccine DS solution because it kept 10 times higher repeat counts than Alu repetitive sequence in Vero genome. The detection value is stable for both of the target sequences using Vero DNA National Standard for hybridization method, suggesting that the established detection method is accurate and reliable. In 2010, FDA suggested that residual DNA fragments should be smaller than approximately 200 base pairs, which is less than the length of a functional gene [7]. Nevertheless, 154 bp from “172 bp” sequence was chosen for further validation.
3.2. Method Validation Results
3.2.1. Linearity & Range
Vero DNA showed superior linearity in the ranges of 3 fg/μL, 30 fg/μL, 300 fg/μL, 3 pg/μL and 30 pg/μL, with correlation coefficients of 0.9993, amplification efficiency of 92.5% and good precision and accuracy.
Figure 6.
Standard curve linearity graph. Vero DNA standards were assayed by qPCR with corresponding primers and probe.
Figure 6.
Standard curve linearity graph. Vero DNA standards were assayed by qPCR with corresponding primers and probe.
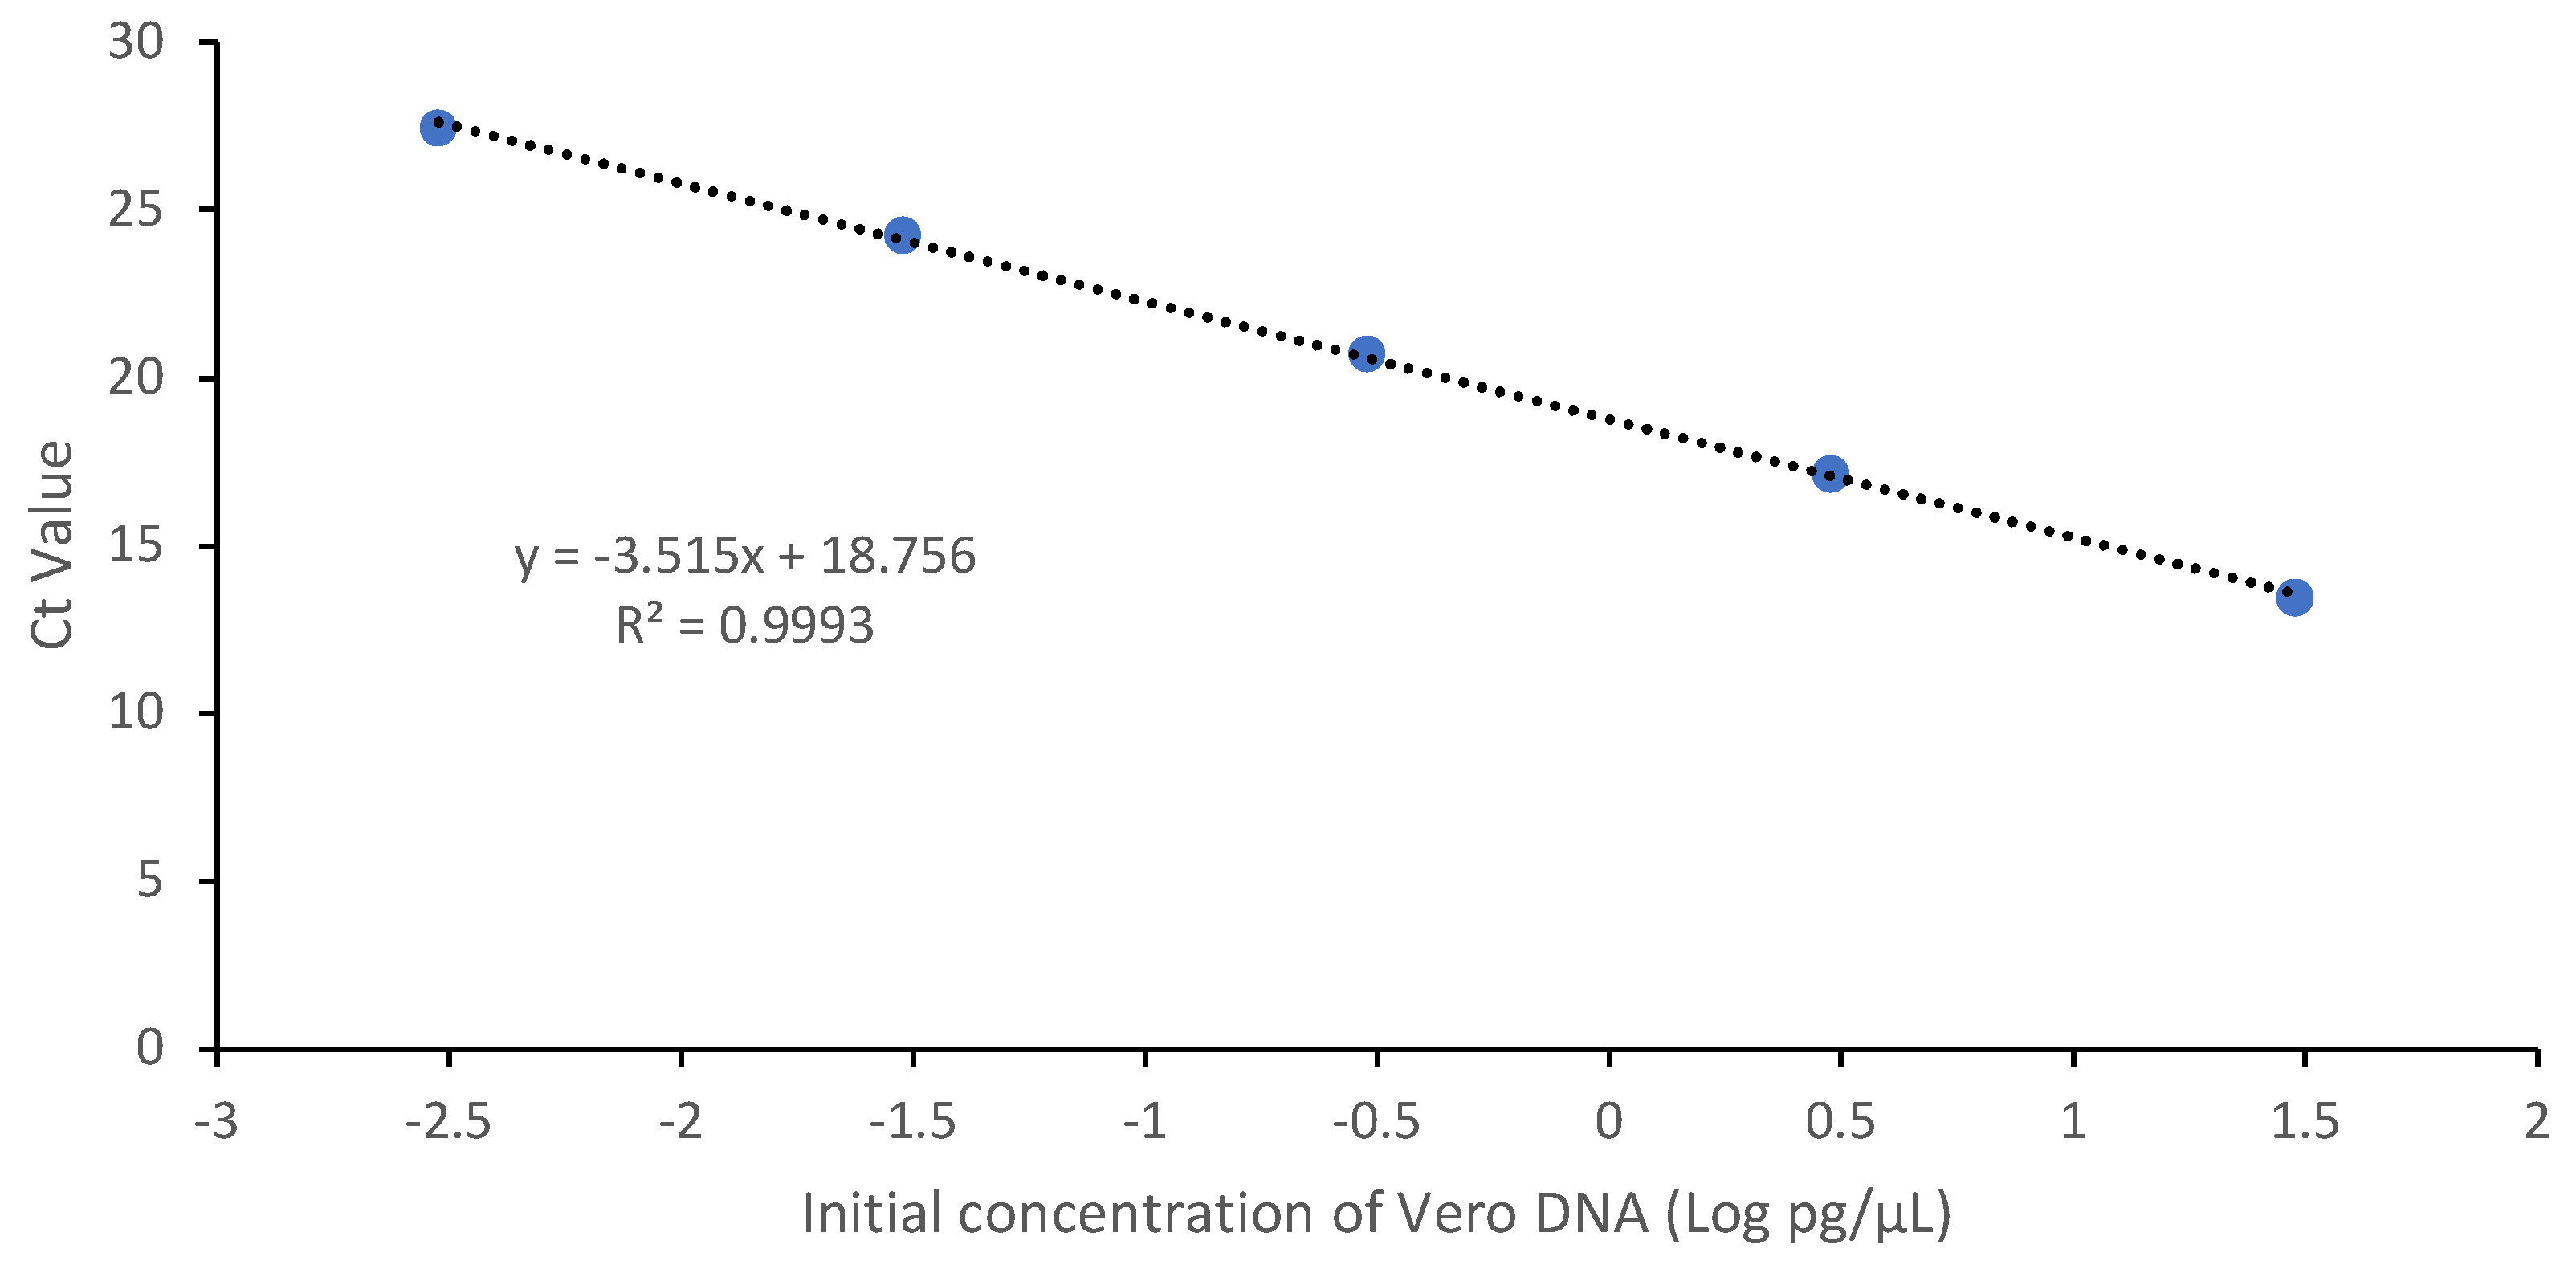
Table 4.
Results for Linear & Range tests.
| Sample | Theoretical Conc. (pg/μL) | Mean Value (pg /μL) |
RSD (%) |
Relative bias (%) |
| 1 | 3.00 × 101 | 3.09 × 101 | 4.7 | 3.1 |
| 2 | 3.00 | 2.73 | 0.4 | 9.0 |
| 3 | 3.00 × 10⁻¹ | 2.64 × 10⁻¹ | 0.9 | 11.8 |
| 4 | 3.00 × 10⁻² | 2.75 × 10⁻² | 2.5 | 8.5 |
| 5 | 3.00 × 10⁻³ | 3.03 × 10⁻³ | 10.2 | 0.9 |
| 6 | 3.00 × 10⁻⁴ | 3.12 × 10⁻⁴ | 87.0 | 4.0 |
3.2.2. Quantitation Limit
Results showed that RSD and relative bias of 3 fg/μL and 1 fg/μL was not more than 25%, both met the requirement. Thus, the quantitation limit of the method is 1 fg/μL.
Table 5.
Results for quantitation limit.
| Theoretical Conc. (pg/μL) |
3.00 × 10⁻³ (n=10) |
1.00 × 10⁻³ (n=10) |
3.00 × 10⁻⁴ (n=10) |
| Ave Conc. (pg/μL) |
2.95 × 10⁻³ | 1.08 × 10⁻³ | 4.53 × 10⁻⁴ |
| RSD(%) | 9.0 | 19.0 | 52.8 |
| Relative bias (%) | 1.6 | 7.7 | 51.1 |
3.2.3. Specificity
Specificity test was performed to detect any interference on Vero DNA detection by genomic DNA (3 ng) from CHO, E.coli, HEK293T, HEK293, Pichia pastoris, NS0 and MDCK. As shown in the Table 6, detection value of the interference DNA was lower than quantitation limit, suggest good specificity for the assay.
3.2.4. Accuracy
Vero DNA samples of three concentration were processed by DNA preparation kit, followed by the qPCR assay. The recovery rate was 87.7%-98.5% with RSD <25% (Table 7).
3.2.5. Precision
Repeatability was determined with two samples in single experiment, including DNA extraction and qPCR experiment. The RSD of samples were within 3.6% - 11.0%. Meanwhile intermediate precision was determined with three samples by two analysts in three independent runs within three days. The RSD of samples were within 12.4% - 18.3%.
Table 8.
Results for repeatability test.
| Theoretical value (pg) | Mean Value (pg) (n = 6) |
RSD (%) |
| 3.00 × 101 | 2.94 × 101 | 11.0 |
| 3.00 × 10⁻¹ | 2.63 × 10⁻¹ | 3.6 |
Table 9.
Results for intermediate precision test.
| Theoretical value (pg) | Mean Value (pg) (n = 6) |
RSD (%) |
| 3.00 × 10² | 2.50 × 10² | 16.7 |
| 3.00 | >2.35 | 12.4 |
| 6.00 × 10⁻² | 5.13 × 10⁻² | 18.3 |
3.2.6. Robustness
Robustness was tested on six instruments. Results showed that quantitation limit can reach 1.00 × 10⁻³ pg/μL on SHENTEK-96S and CFX96, and 3.00 × 10⁻³ pg/μL on ABI7500, FQD-96A, LightCycler480 II and qTOWER3G.
Table 10.
Results for robustness test.
| Instrument Model | Theoretical value (pg/μL) |
RSD (%) (n = 10) |
Relative bias (%) |
| SHENTEK-96S | 1.00 × 10⁻³ | 19.0 | 7.7 |
| ABI 7500 | 3.00 × 10⁻³ | 17.9 | 6.8 |
| CFX-96 | 1.00 × 10⁻³ | 17.9 | 16.7 |
| FQD-96A | 3.00 × 10⁻³ | 16.7 | 7.0 |
| LightCycler480 II | 3.00 × 10⁻³ | 17.3 | 13.0 |
| qTOWER3G | 3.00 × 10⁻³ | 12.2 | 5.7 |
Discussion
In recent years, qPCR method has been widely used in the routine detection of residual host cell DNA content determination due to its high specificity, high sensitivity, and wide linear range, rapid and high-throughput characteristics [12,13,14,15].
For residual Vero cell DNA quantification, we established qPCR methods for “172 bp” sequence and Alu repetitive sequence as target genes. The assay showed typical amplification curves, good specificity and sensitivity. All 4 detection reactions showed stable performance.
154 bp detection reaction from “172 bp” sequence was chosen for Vero DNA detection. The following reasons may be considered: First, “172 bp” sequence were 10 times higher copies in Vero genome than Alu repetitive sequence, so higher amount of residual DNA may be detected to achieve better control of risks such as carcinogenicity and infectivity caused by residual DNA. Second, “172 bp” sequence in Vero cells predominantly manifests as long tandem repeats, along with unrelated sequences. The long tandem repeats has a maximum observed number of 29 long tandem repeats, while the unrelated sequences accounts for approximately 37% of the entire genome [10]. This distinct fragment is unique to Vero cell genome, and the distribution of this sequence, along with its derivatives, is considered as a comprehensive representation of Vero cells. Thus, “172 bp” sequence can serve as a reliable marker for the quantitative assessment of residual Vero DNA [16,17]. Third, FDA’s recommendation that the size of residual DNA should not be greater than 200 bp, the quantitative amplification of the 154 bp reaction produces amplification products with no less than 154 bp and a long tandem repeat sequence, providing scientific validity for safety consideration.
The assay for 154 bp from “172 bp” sequence maintained good performance for linearity, range, accuracy, precision, quantitation limit, specificity and robustness, thus worth to be adopted for monitoring residual Vero DNA in pharmaceutical enterprises and regulatory authorities.
Author Contributions
Study design: S.C., Z.Y. and Y.L.; data analysis: D.Z., W.Z. W.W.; writing—original draft: W.Z.; writing—review and editing: D.Z., Z.W., S.C. and Z.Y. All authors have read and agreed to the published version of the manuscript.
Conflicts of Interest
The authors declare no conflicts of interest.
References
- Yasumura Y, Kawakita M. The research for the SV40 by means of tissue culture technique. Nippon Rinsho. 1963, 21, 1201–1219. [Google Scholar]
- N.S.Murthy and A. Mathew. Cancer epidemiology, prevention and control. Current. Science. 2004; 86, 518–527.
- M. Mimeault, N. Jouy, P. Depreux and J.P. Henichart. Synergistic antiproliferative and apoptotic effects induced by mixed epidermal growth factor receptor inhibitor ZD1839 and nitric oxide donor in human prostatic cancer cell lines. Prostate. 2005, 62, 187–199. [Google Scholar] [CrossRef]
- Osada N, Kohara A, etc. The genome landscape of the African green monkey kidney-derived Vero cell line. DNA Research. 2014, 21, 673–683. [Google Scholar] [CrossRef] [PubMed]
- Wu X, Smith TG, Rupprecht CE. From brain passage to cell adaptation: the road of human rabies vaccine development. Expert Rev Vaccines. 2011, 10, 1597–1608. [Google Scholar] [CrossRef]
- WHO. Recommendations for the evaluation of animal cell cultures as substrates for the manufacture of biological medicinal products and for the characterization of cell banks. Annex 3, TRS No 978.
- FDA. Guidance for Industry Characterization and Qualification of Cell Substrates and Other Biological Materials Used in the Production of Viral Vaccines for Infectious Disease Indications; FDA: New Delhi, India, 2010. [Google Scholar]
- Chinese Pharmacopoeia Commission. Pharmacopoeia of the People’s Republic of China; Chinese Pharmacopoeia Commission: Beijing, China, 2020. [Google Scholar]
- The United States Pharmacopeial Convention. United States Pharmacopeia. Chapter 509: Residual DNA Testing.
- Dinah, S. Singer. Arrangement of a highly repeated DNA sequence in the genome and chromatin of the African green monkey. Journal of Biological Chemistry. 1979, 254, 5506–5514. [Google Scholar]
- Giovanna Grimaldi, Cary Queen, etc. Interspersed repeated sequences in the African green monkey genome that are homologous to the human Alu family. Nucleic Acids Research. 1981, 9, 5553–5568. [Google Scholar] [CrossRef] [PubMed]
- Peper, G.; Fankhauser, A.; Merlin, T.; Roscic, A.; Hofmann, M.; Obrdlik, P. Direct real-time quantitative PCR for measurement of host-cell residual DNA in therapeutic proteins. J. Pharm. Biomed. Anal. 2014, 100, 123–130. [Google Scholar] [CrossRef]
- Varnamkhasti, F.A.; Kia, V.; Shokri, R.; Mehdipour Moghaddam, M.J.; Paryan, M. Design and development of a simple method for the detection and quantification of residual host cell DNA in recombinant rotavirus vaccine. Mol. Cell. Probes. 2021, 55, 101674. [Google Scholar] [CrossRef] [PubMed]
- Zheng, W.; Jiang, L.; Lei, Q.; Yang, J.; Gao, X.; Wang, W.; Zhang, Y.; Kong, T.; Chen, Q.; Li, G. Development and Validation of Quantitative Real-Time PCR for the Detection of Residual CHO Host Cell DNA and Optimization of Sample Pretreatment Method in Biopharmaceutical Products. Biol. Proced. Online. 2019, 21, 17. [Google Scholar] [CrossRef]
- Li J, Pan RW, etc. Evaluation of the Efficacy of the Vaccine Production Process in Removing Residual Host Cell DNA from the Vero Cell Rabies Vaccine. Vaccines. 2024, 12(12), 1379. [Google Scholar]
- Li, J.; Tang, J.-r.; Liu, J.-h.; Qu, X.-s.; Dong, G.-m. The probe selection in Vero cells DNA residue detection by spot hybridization. Chin. J. Pharm. Anal. 2008, 28, 1892–1895. [Google Scholar]
- Cao, S.; Dong, G.; Tang, J.; Li, J.; Liu, J.; Shi, L.; Li, C.; Wang, J. Development of a Vero cell DNA reference standard for residual DNA measurement in China. Hum. Vaccines Immunother. 2013, 9, 413–419. [Google Scholar] [CrossRef] [PubMed]
Figure 1.
Vero-99 linearity graph (a) and Vero-154 linearity graph (b). DNA standards were assayed by qPCR with corresponding primers and probe.
Figure 1.
Vero-99 linearity graph (a) and Vero-154 linearity graph (b). DNA standards were assayed by qPCR with corresponding primers and probe.
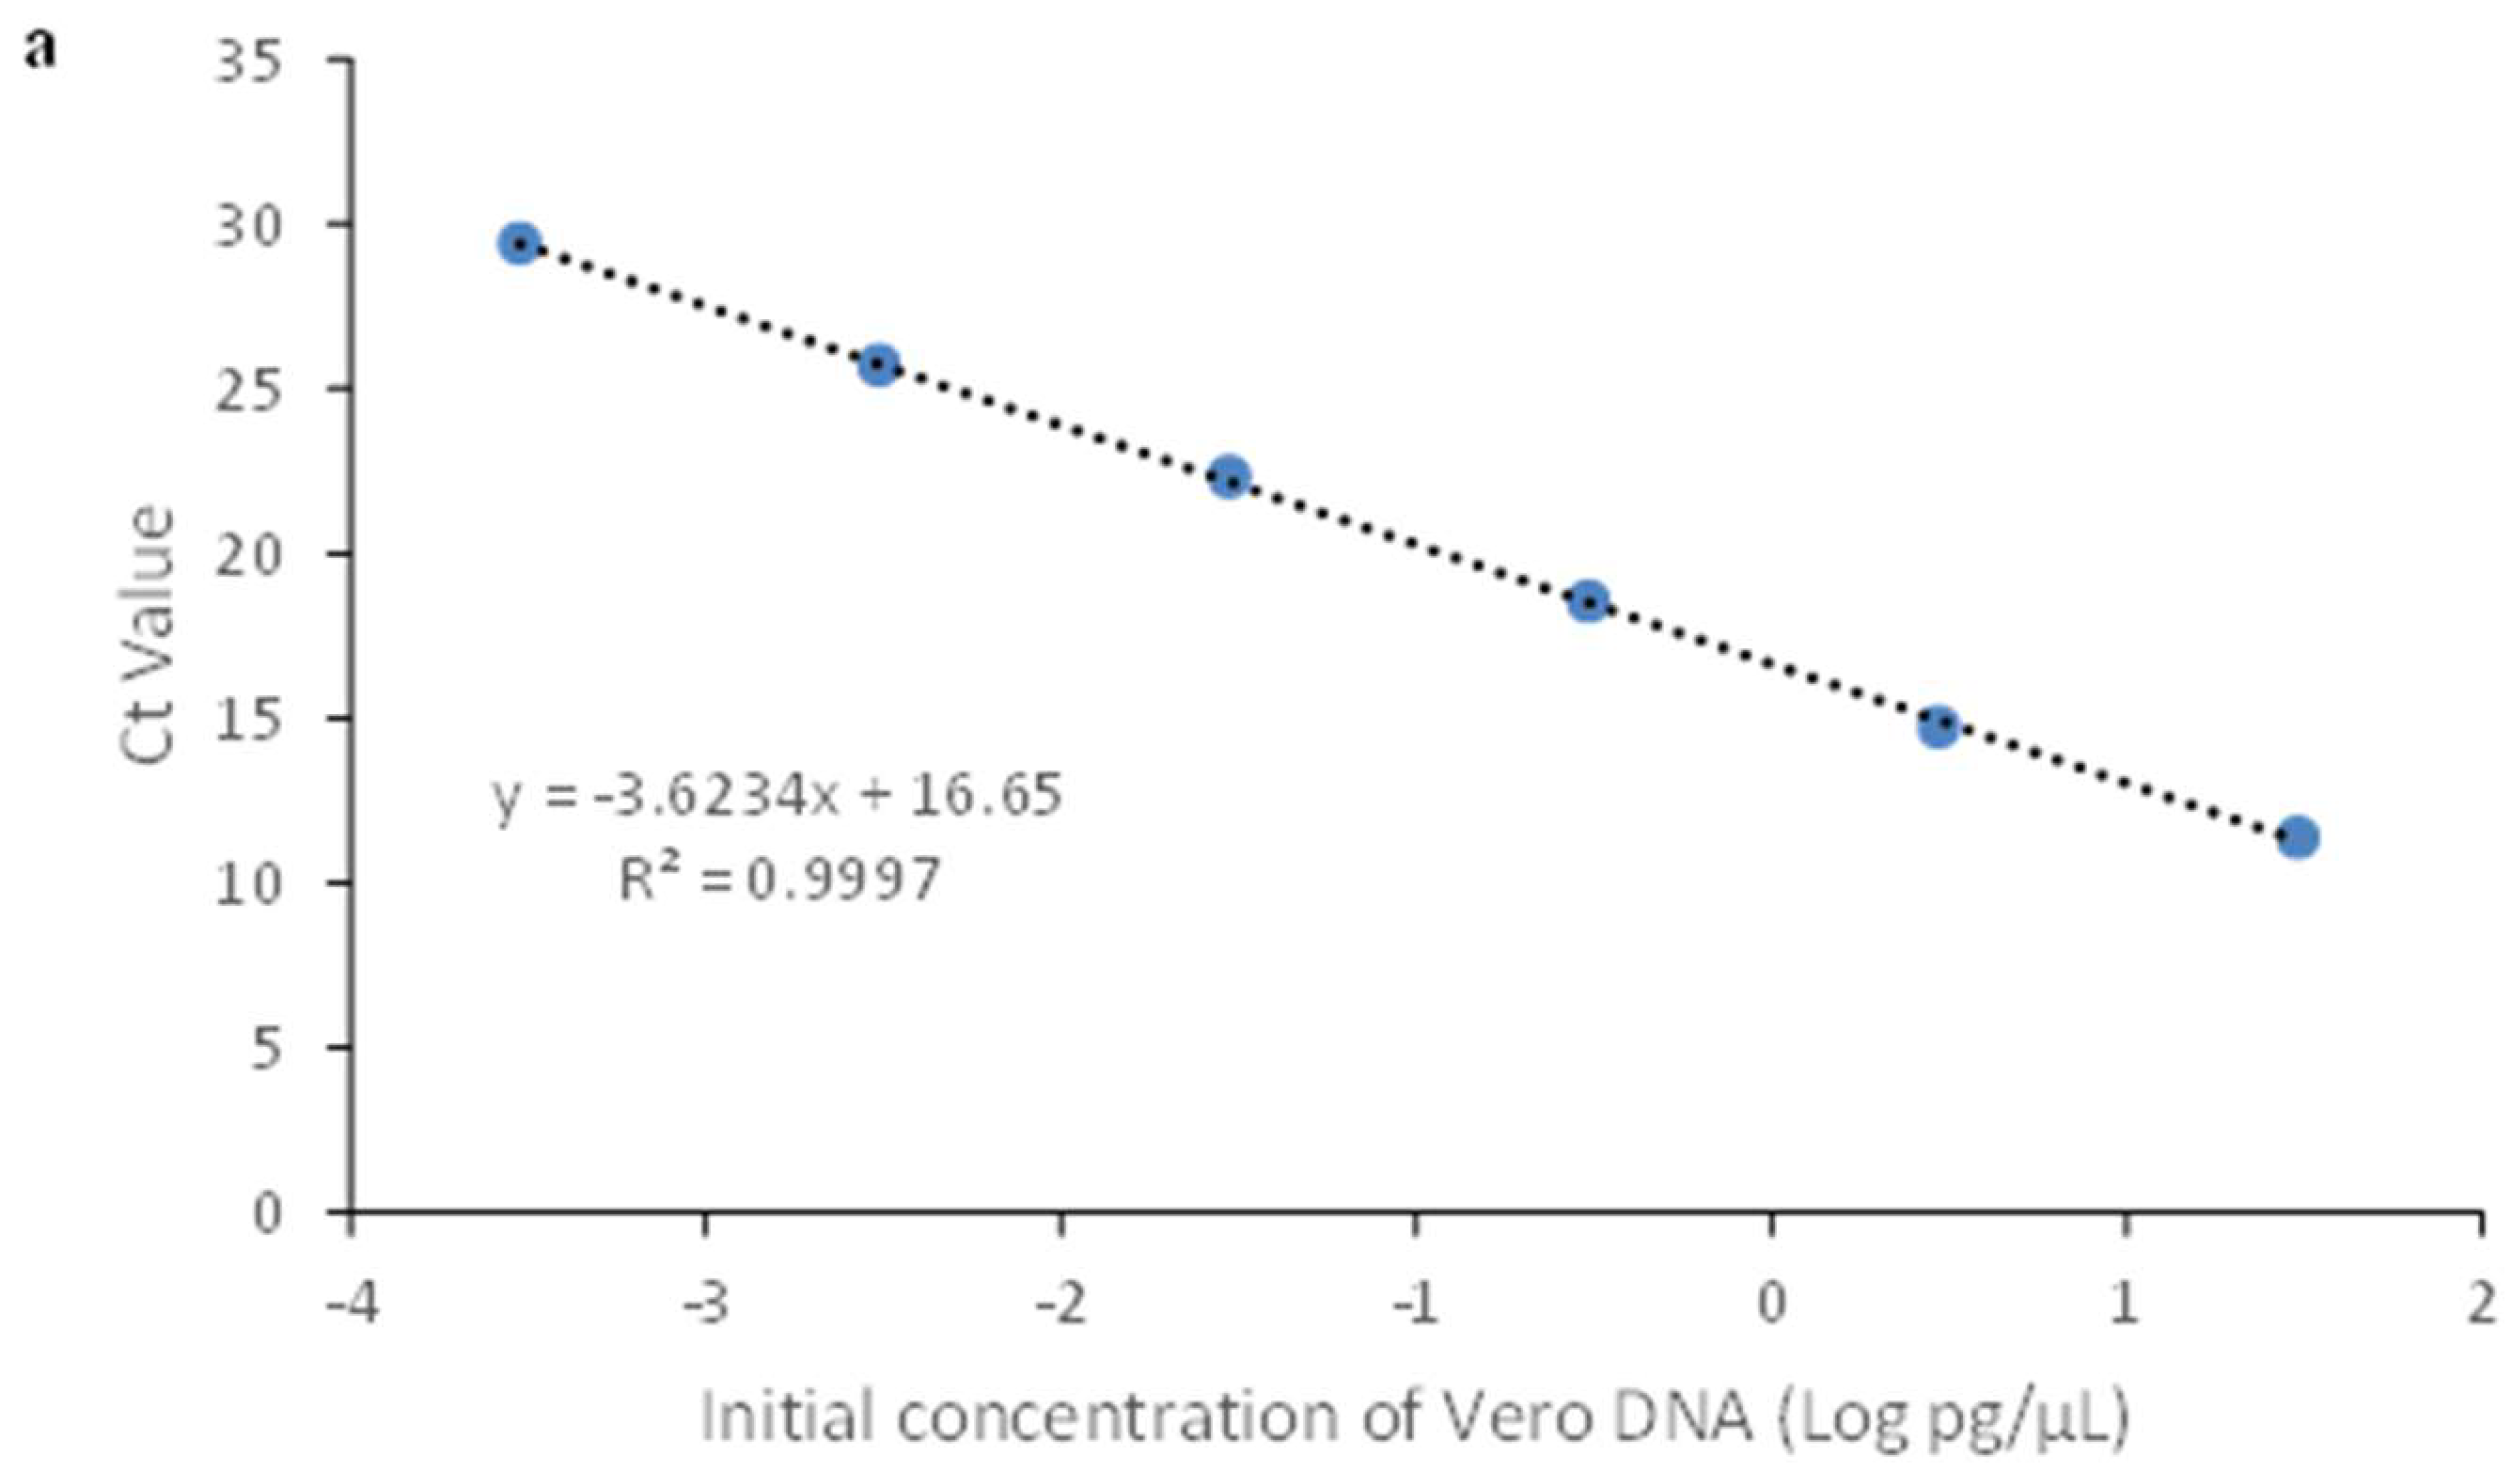
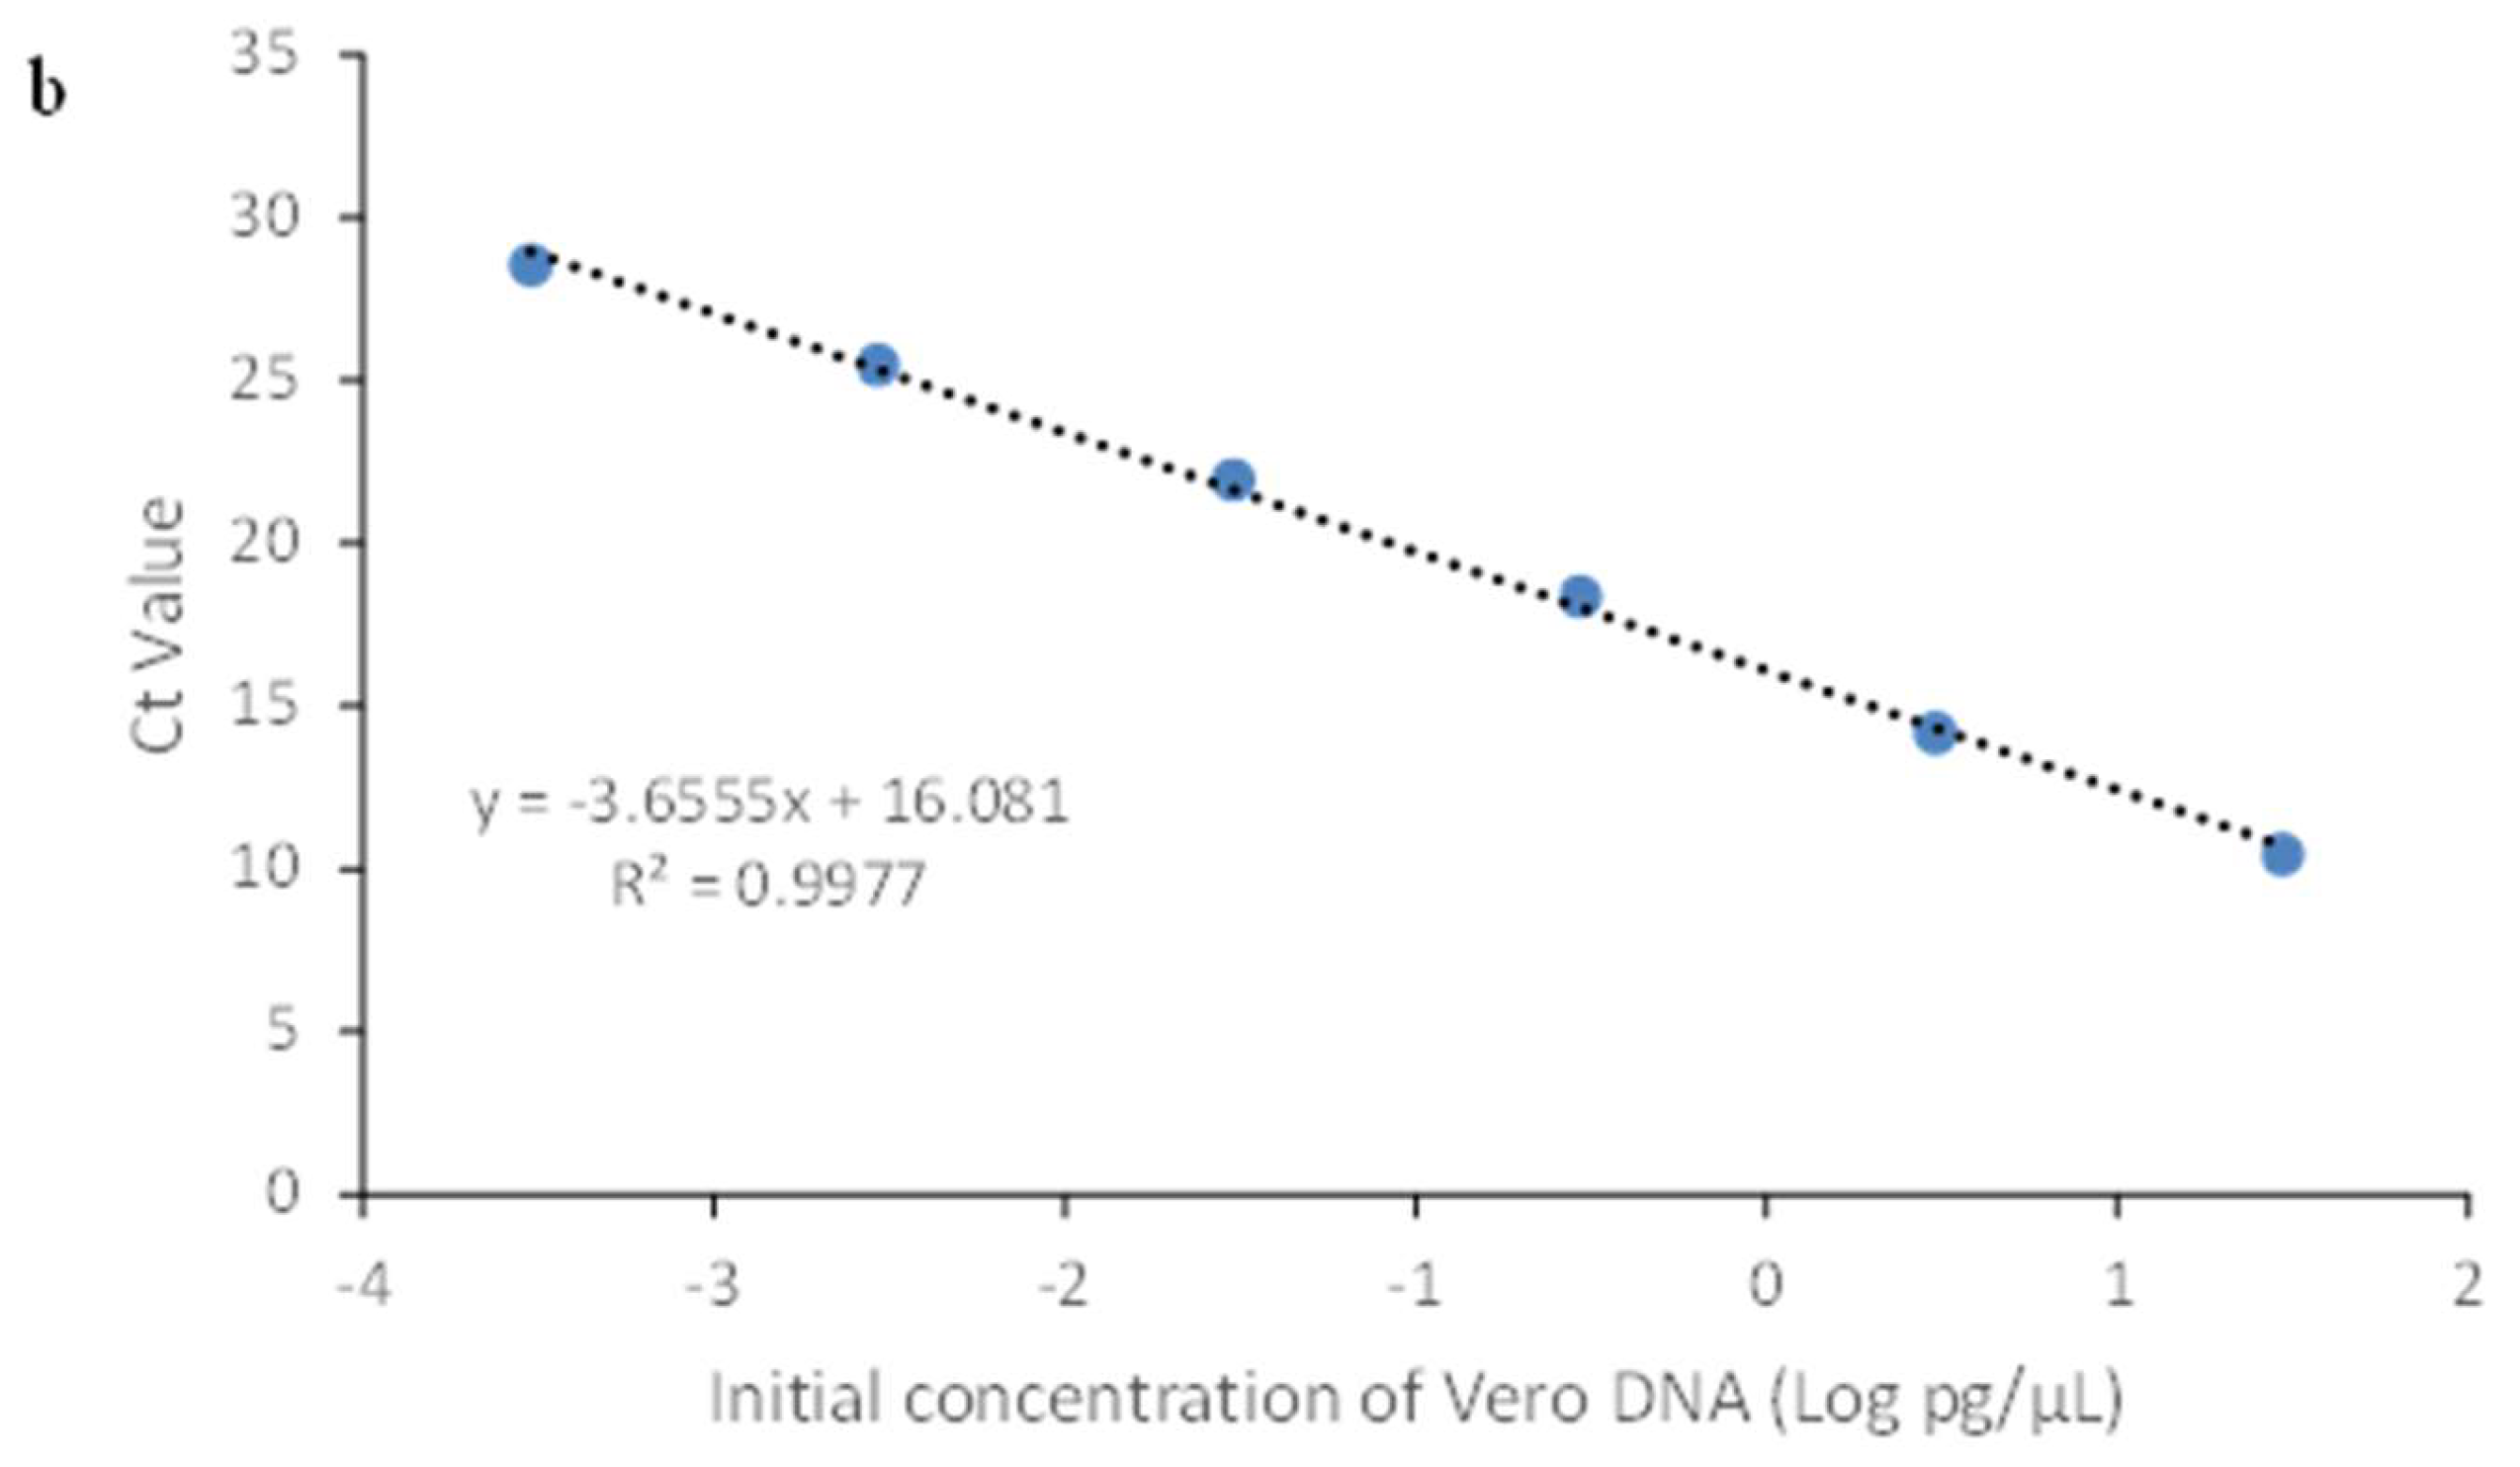
Figure 2.
Vero genomic DNA fragmentation experiment (Vero-99 amplification).
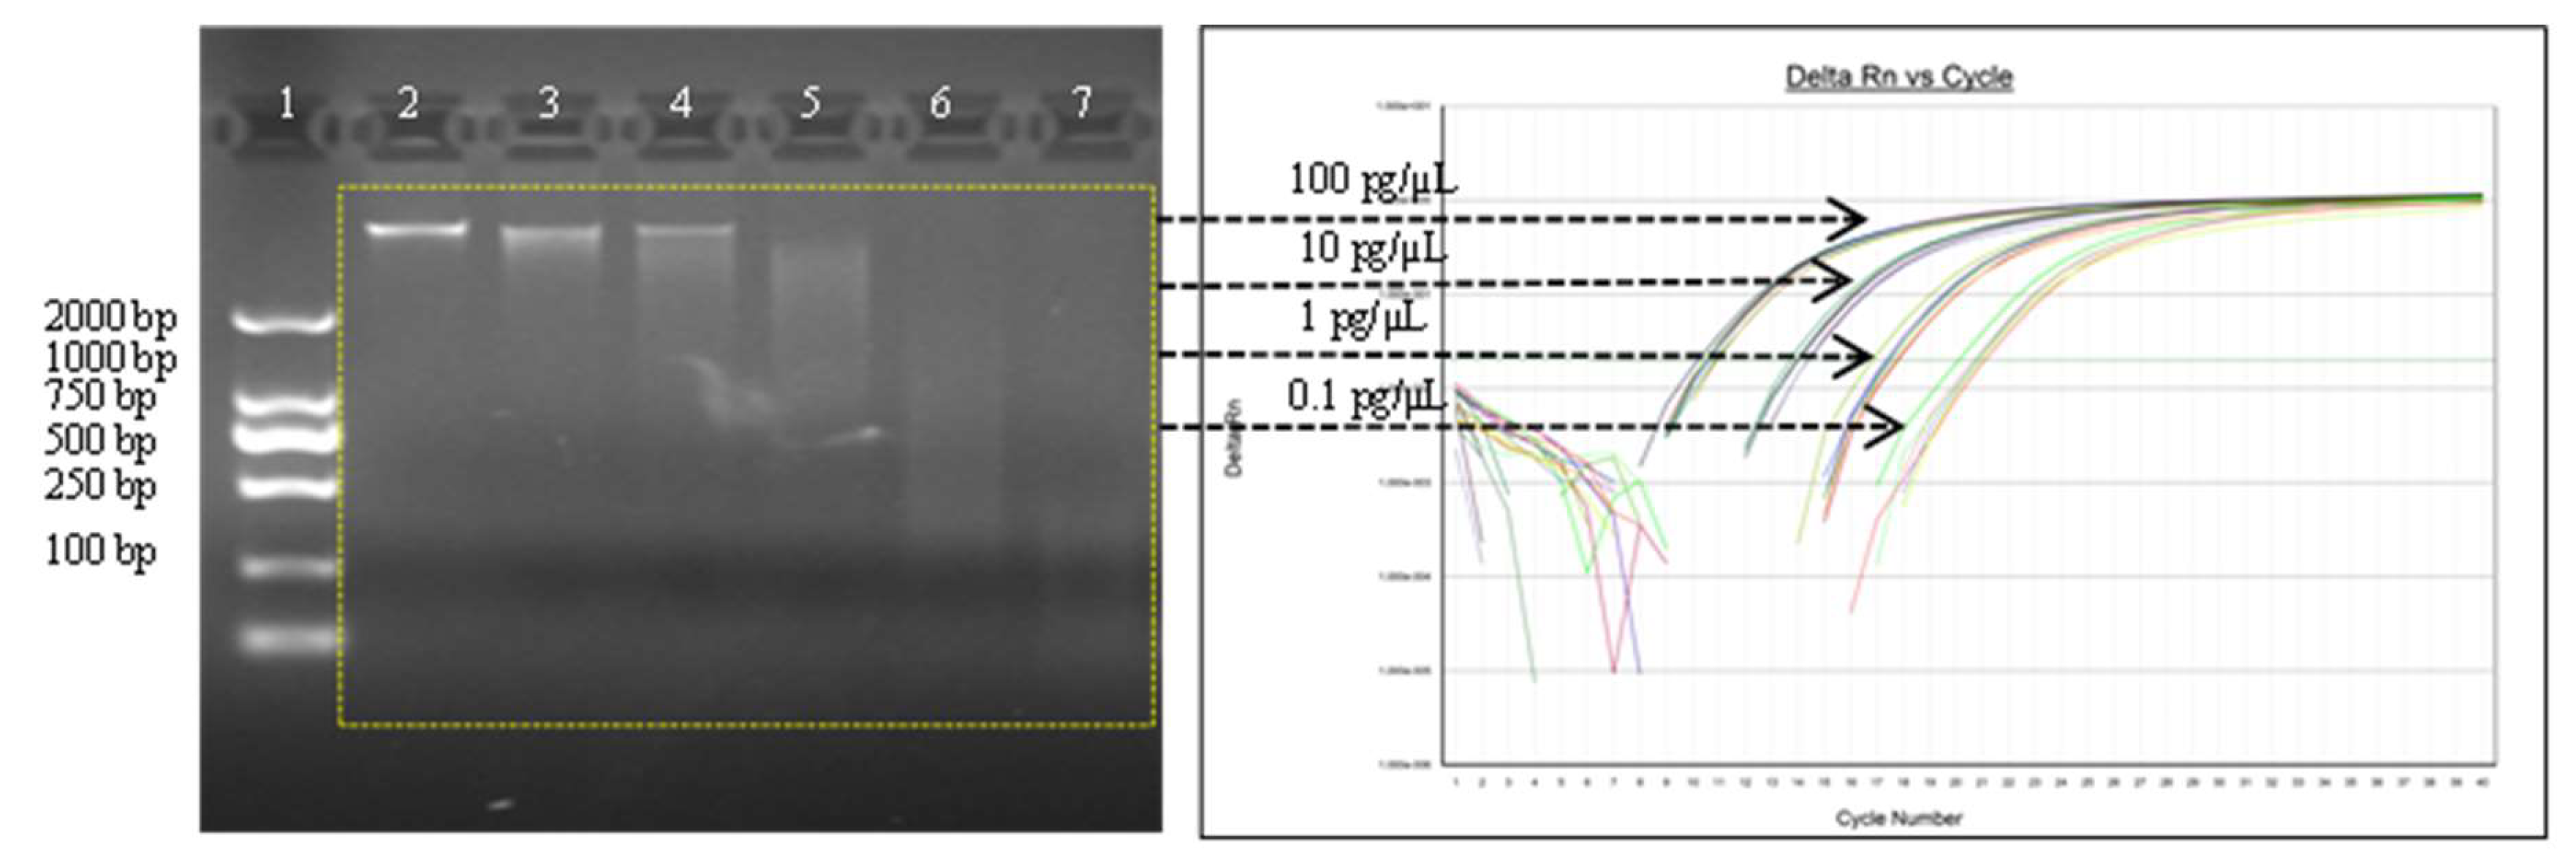
Figure 3.
Vero-151 linearity graph (a) and Vero-221 linearity graph (b). DNA standards were assayed by qPCR with corresponding primers and probe.
Figure 3.
Vero-151 linearity graph (a) and Vero-221 linearity graph (b). DNA standards were assayed by qPCR with corresponding primers and probe.
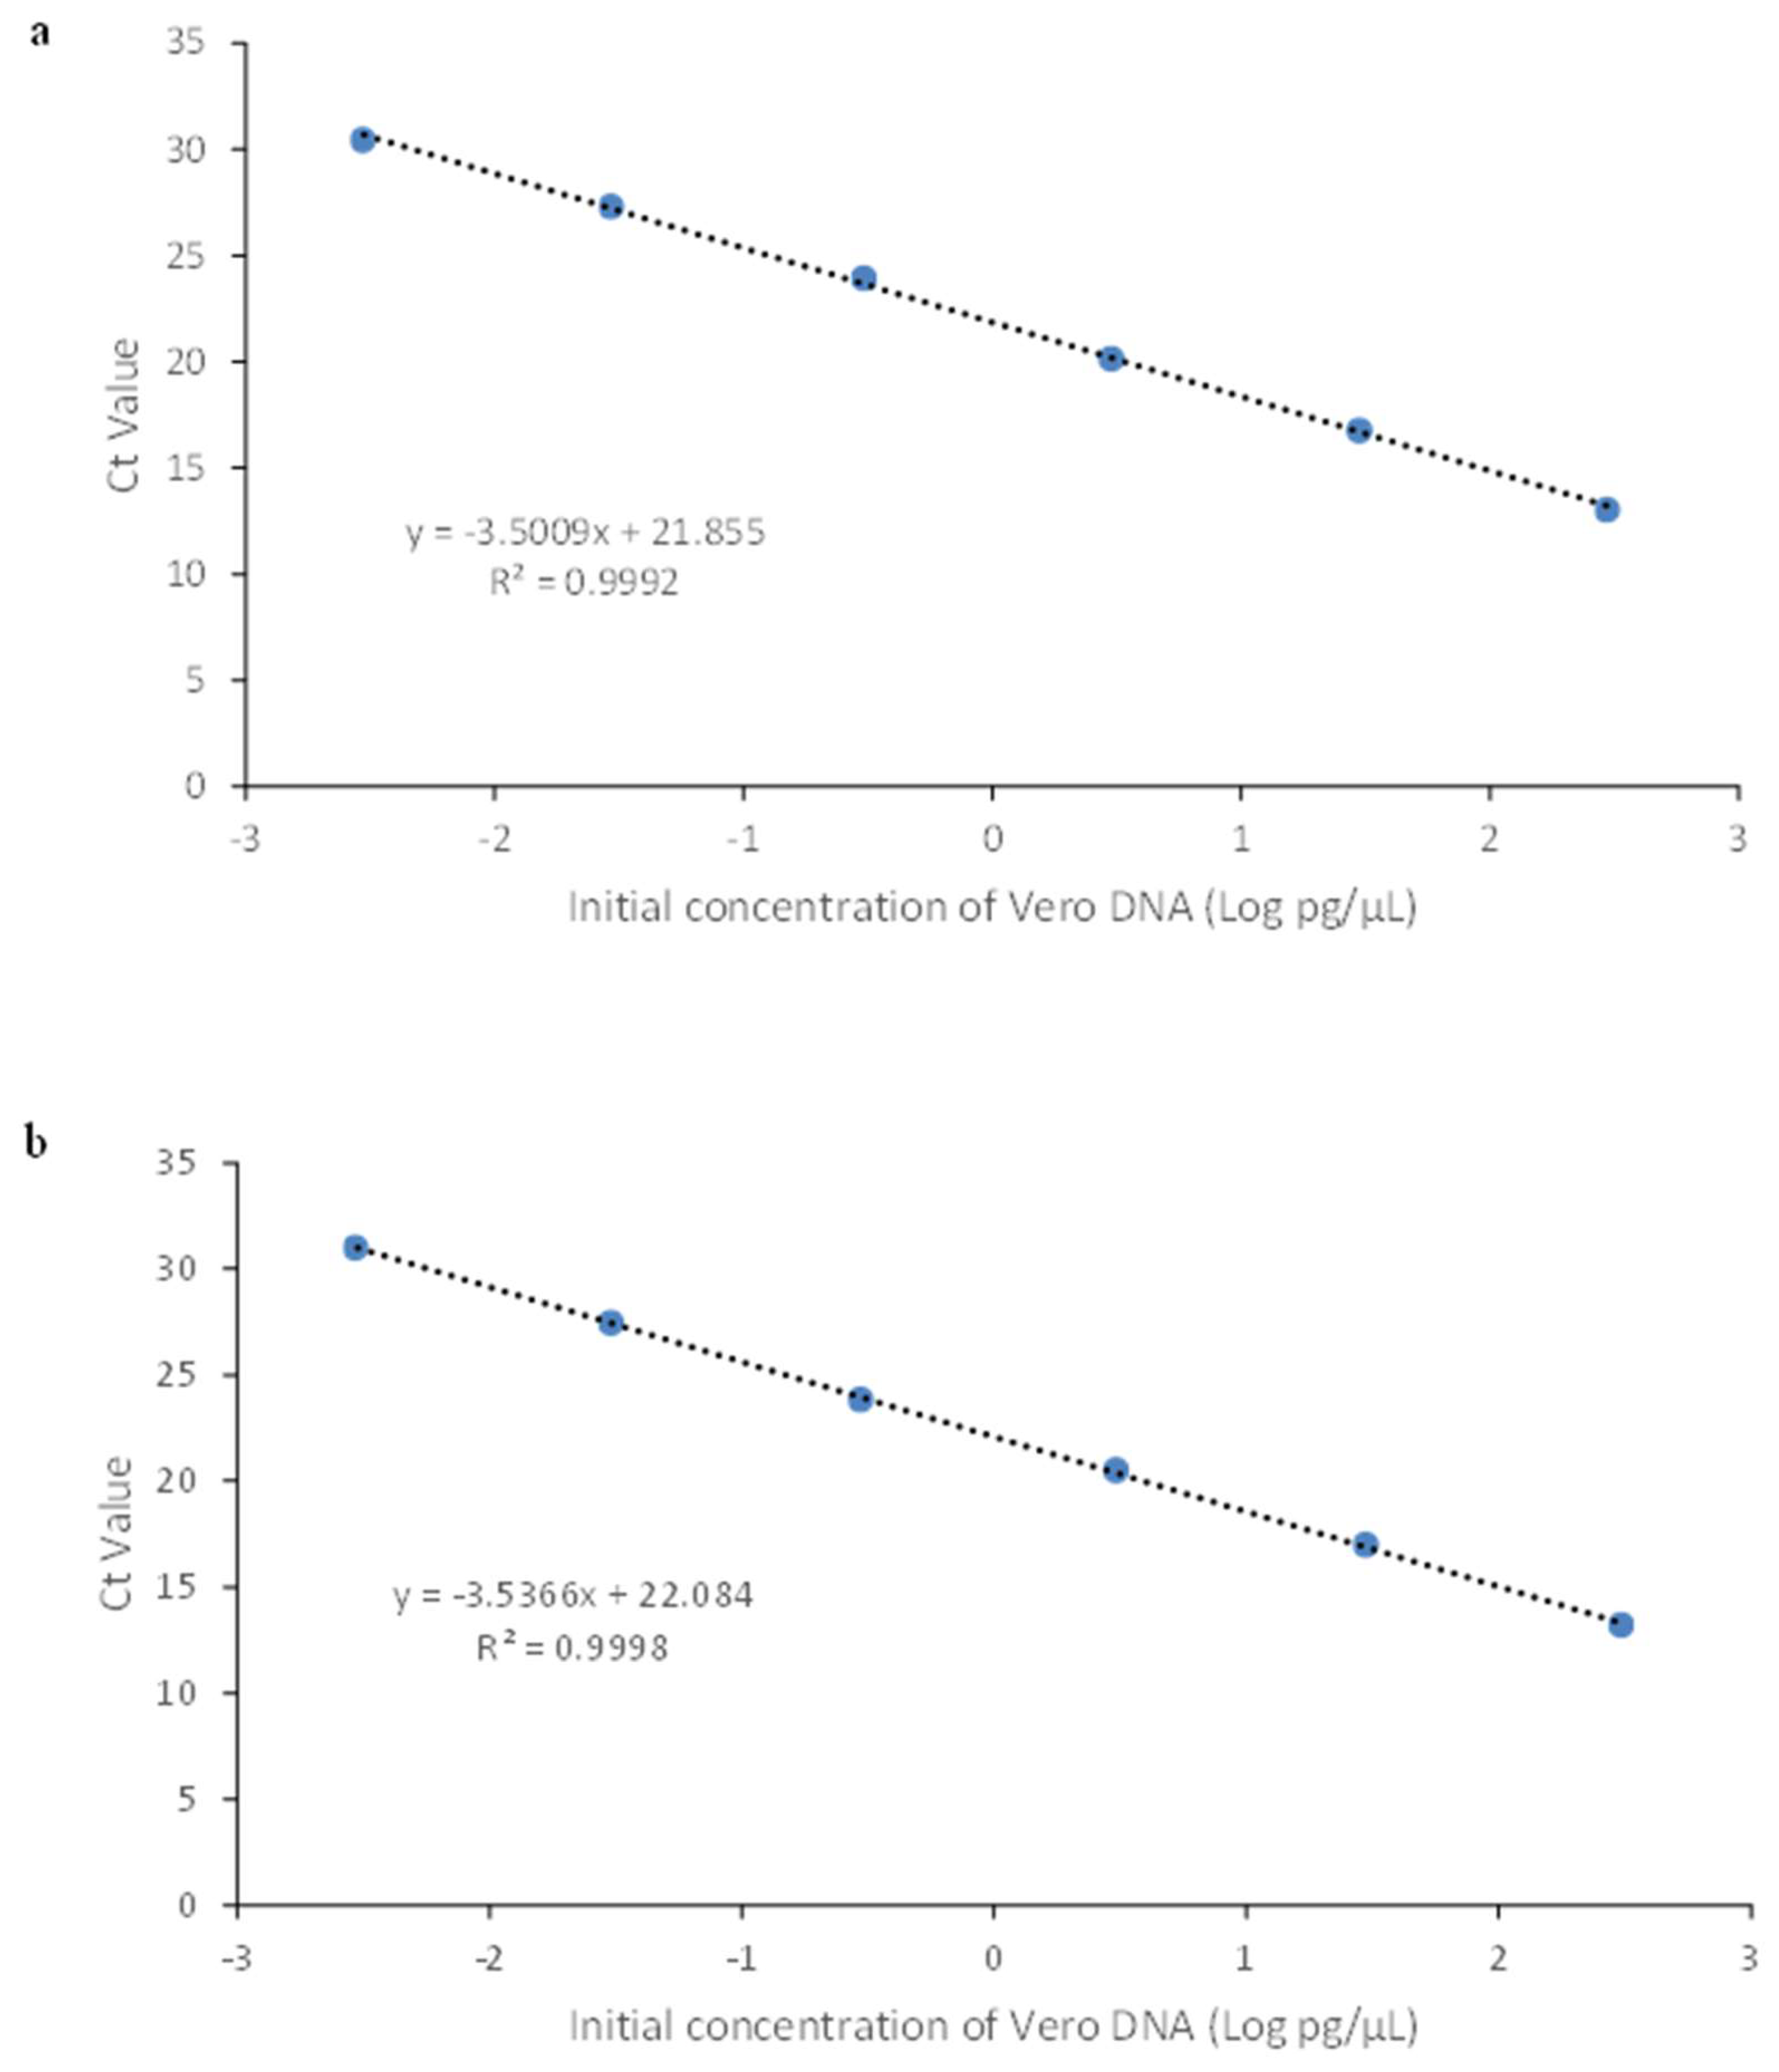
Figure 4.
Vero genomic DNA fragmentation analysis (vero-151 amplification).
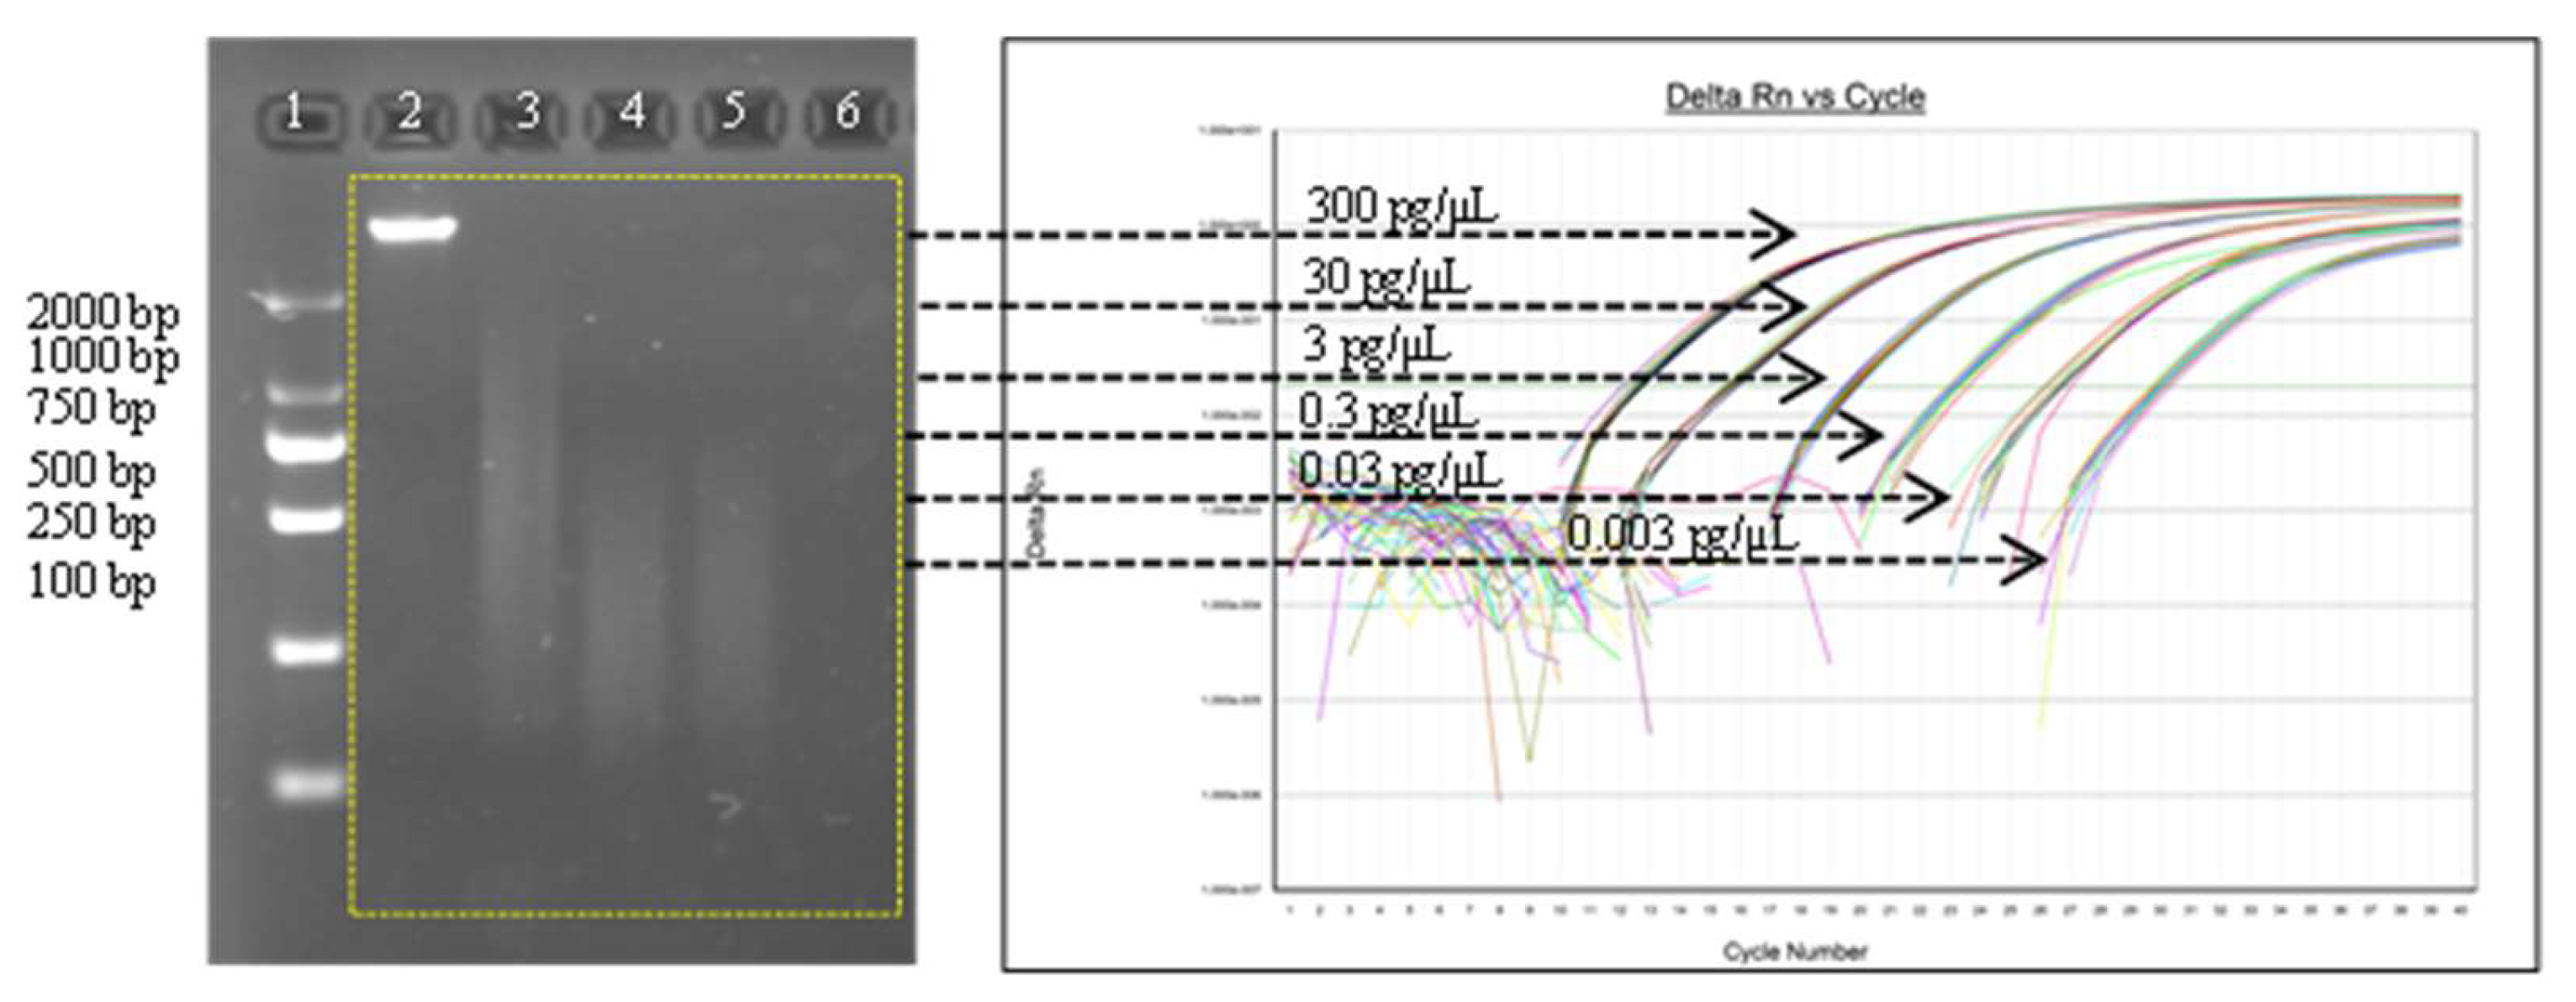
Figure 5.
Comparison of amplicon length and detection value of DS solution.
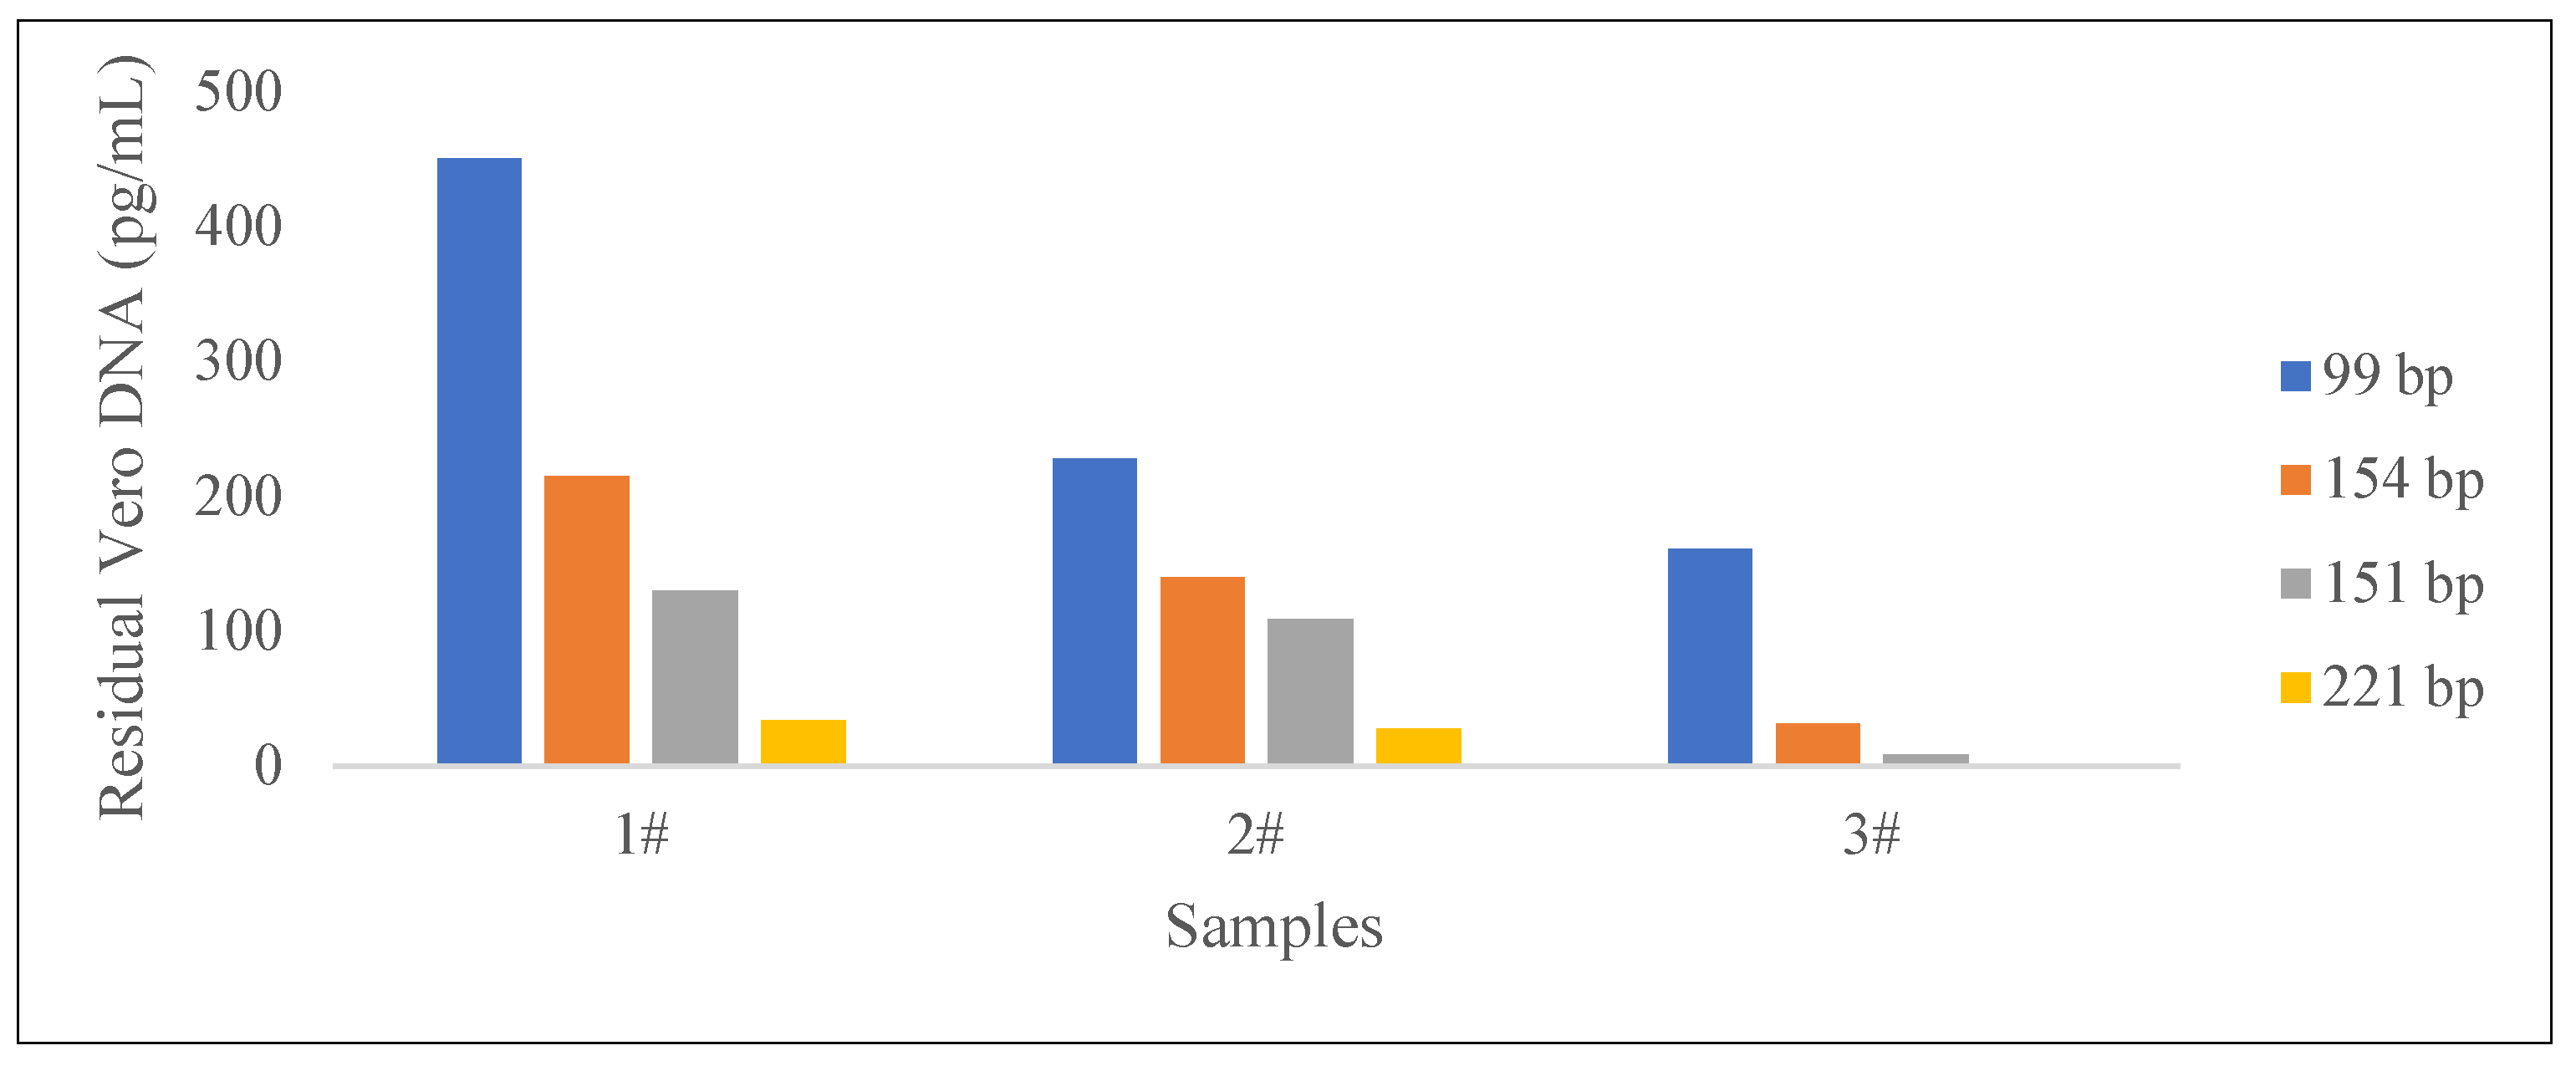
Table 2.
Test results of Rabies vaccine DS solution.
| Sample | Residual Conc. (pg/mL) |
Amplicon size, bp | Target sequence |
| 1 | 451 | 99 | “172 bp” sequence |
| 215 | 154 | ||
| 130 | 151 | Alu repetitive sequence | |
| 33.5 | 221 | ||
| 2 | 228 | 99 | “172 bp” sequence |
| 140 | 154 | ||
| 109 | 151 | Alu repetitive sequence | |
| 27.7 | 221 | ||
| 3 | 161 | 99 | “172 bp” sequence |
| 31.5 | 154 | ||
| 8.39 | 151 | Alu repetitive sequence | |
| 0.263 | 221 |
Table 3.
Test results of Vero DNA National Standard for hybridization method.
| Sample | Recovery (%) |
Residual Conc. (pg/mL) |
Amplicon size, bp | Target Sequence |
| Vero DNA National Standard for hybridization method | 77.3 | 6.80×10⁴ | 99 | “172 bp” sequence |
| 70.7 | 5.58×10⁴ | 154 | ||
| 75.4 | 6.49×10⁴ | 151 | Alu repetitive sequence | |
| 73.3 | 6.82×10⁴ | 221 |
Table 6.
Result for specificity test.
| Interfering DNA | Mean Value (pg/μL) |
| CHO | 2.32 × 10⁻⁴ |
| E.coli | <1.000 × 10⁻⁵ |
| HEK293T | <1.000 × 10⁻⁵ |
| HEK293 | <1.000 × 10⁻⁵ |
| Pichia pastoris | 2.57 × 10⁻⁵ |
| NS0 | <1.000 × 10⁻⁵ |
| MDCK | 1.15 × 10⁻⁵ |
Table 7.
Results for accuracy test.
| Expected DNA (pg) | Observed DNA, mean (pg) | Observed DNA, RSD (%) | Spike recovery (%) |
| 3.00 × 10² | 2.94 × 10² | 11.0 | 98.0 |
| 3.00 | 2.63 | 3.6 | 87.7 |
| 6.00 × 10⁻² | 6.05 × 10⁻² | 9.3 | 98.5 |
Disclaimer/Publisher’s Note: The statements, opinions and data contained in all publications are solely those of the individual author(s) and contributor(s) and not of MDPI and/or the editor(s). MDPI and/or the editor(s) disclaim responsibility for any injury to people or property resulting from any ideas, methods, instructions or products referred to in the content. |
© 2025 by the authors. Licensee MDPI, Basel, Switzerland. This article is an open access article distributed under the terms and conditions of the Creative Commons Attribution (CC BY) license (http://creativecommons.org/licenses/by/4.0/).
Copyright: This open access article is published under a Creative Commons CC BY 4.0 license, which permit the free download, distribution, and reuse, provided that the author and preprint are cited in any reuse.


