Submitted:
10 January 2025
Posted:
13 January 2025
You are already at the latest version
Abstract
Purpose: Medicare patients who die from cancer are responsible for about 30% of annual Medicare spending, most of which occurs during the last 30 days of life. Yet, there are significant and persisting knowledge gaps regarding which factors contribute to this high-intensity EoL spending. To that end, we conducted a retrospective analysis of SEER-Medicare data to identify risk factors associated with high-intensity EoL spending among older adults who died of breast, prostate, lung, or colorectal cancer.
Methods: We used multivariable linear regression to identify clinical, demographic, socioeconomic, and geographic characteristics associated with total inflation-adjusted Medicare spending in the last 30 days of life, including reimbursements for services provided in the inpatient and outpatient settings. Study subjects included U.S. Medicare beneficiaries aged 65 and older who died of breast, prostate, lung, or colorectal cancer between 2011 and 2015.
Results: Among 59,355 decedents (49.2% female; 21.2% of non-White race/ethnicity), factors associated with greater EoL spending were increased comorbidity burden, female sex, Black race, other race/ethnicity, stage III and IV disease, living in a more populated county, and state subsidization of patient Medicare premiums. EoL spending was lower among older patients, patients living in the Midwest, South, and West, patients living in more rural areas, and patients with poor performance status. Results were largely consistent across cancer types.
Conclusion: Our findings can inform targeted intervention development for patients with cancer who are at higher risk of high-intensity EoL spending, such as decision-support tools that facilitate referrals to palliative care for high-risk patients.
Keywords:
end-of-life
; palliative care
; geriatric oncology
; medicare spending
; cancer
1. Introduction
High-intensity end-of-life (EoL) care for patients with cancer often includes multiple transitions to the hospital and intensive care unit (ICU) and is associated with adverse outcomes, such as declines in patient functional abilities.[1,2] Importantly, aggressive EoL care is often not aligned with patient preferences[3,4] and can result in worse experiences for both caregivers and bereaved family members.[4,5] Intensive medical care, such as administering chemotherapy in the last few days of life, generates exorbitant medical spending without reversing the disease course.[6,7] In fact, two previous studies using Medicare data found that the 5-6% of cancer patients who died annually were responsible for about 27-30% of annual Medicare spending, and about 78% of this spending occurred during the last 30 days of life.[8,9] While a portion of this spending represents the intensity of medical needs at the EoL, a significant share is due to potential overuse of health services that does not align with patient preferences.[10] Given that a small fraction of Medicare beneficiaries is responsible for a significant portion of spending, finding ways to reduce EoL cancer spending provides a unique opportunity to reduce overall Medicare costs while improving patient centeredness and quality-of-care at the EoL.
There is a large body of research demonstrating that interventions such as upstream palliative care, earlier enrollment in hospice, EoL discussions, and do-not-resuscitate orders are associated with lower medical spending and improved EoL care quality.[6,7,11,12] However, significant disparities exist in the availability and uptake of hospice and palliative care among cancer patients,[13,14] which may be partially driven by workforce shortages in these specialties.[15,16] Given these limitations, we cannot universally rely on the current palliative care infrastructure to adequately prevent aggressive EoL care and spending for every single patient with cancer. Therefore, further research is needed to identify which attributes increase a patient’s risk of unnecessary high-intensity care and excessive medical costs at the EoL to help providers focus palliative care interventions toward high-risk patients, and to inform targeted research, education, and policy change.
Previous research has identified several factors associated with higher healthcare costs among cancer patients, such as age, race/ethnicity, comorbidity burden, sex, geographic variation, and disease stage.[17,18,19] However, there is much less research about which factors contribute to high cancer spending specifically at the EoL. A few recent studies have found that EoL costs are higher for cancer patients who are younger,[20,21,22,23] female,[23,24] members of racial and/or ethnic minorities,[23,24] live in urban areas,[23] have a higher comorbidity burden,[23,24] and live in areas where physicians have less comfort discussing EoL issues.[20] However, the majority of these studies evaluated long spending windows of 6-12 months before death. For Medicare patients with cancer, the EoL spending window is best defined as the last month of life, as previous research has found that almost 80% of spending occurs during the last 30 days of life for this population.[9] Additionally, clinicians often struggle with accurate prognostication, making it difficult to reliably estimate a patient’s final 6-12 months of life. However, the last month of life is a more discernible period for clinicians, providing a clear opportunity for the implementation of targeted interventions. Furthermore, previous studies on this topic only included one or two types of cancer in their analyses, which greatly limits the generalizability of the findings.
To date, there is no comprehensive study evaluating the impact of clinical, demographic, socioeconomic, and geographic predictors of high-intensity EoL spending across all common malignancies in the last 30 days of life. Identifying these predictors may help health systems and policymakers determine which patients would benefit most from targeted interventions such as referrals to palliative care, which in turn may reduce the healthcare system’s financial strain caused by high-intensity EoL care. To address these knowledge gaps, we conducted a population-based retrospective cohort study to evaluate and compare the receipt of and predictors for high-intensity EoL spending among Medicare decedents with breast, colorectal, lung, and prostate cancer. Collectively, these four malignancies represent approximately 50% of all new cancer diagnoses in the U.S.[25], enhancing the generalizability of our results as compared to previous research on this topic.
2. Methods
2.1. Sample Selection & Outcomes
We obtained our patient sample from the SEER-Medicare database, which is a population-based database that combines data from the Surveillance, Epidemiology, and End Results (SEER) program of cancer registries with administrative claims for healthcare services provided to Medicare beneficiaries. Using this dataset, we identified beneficiaries aged 65 years or older diagnosed with the four most common solid tumors including breast, colorectal, lung, and prostate cancers who died from cancer between 2011 and 2015. We excluded all beneficiaries who met any of the following criteria: (1) diagnosed with cancer at autopsy; (2) no histologic confirmation of their cancer diagnosis; (3) unknown dates of cancer diagnosis or death; (4) no continuous coverage for Medicare Parts A/B for 12 months before their death; (5) enrolled in hospice prior to their cancer diagnosis; and (6) no Medicare claims in the 90 days before their death. Our outcome was total inflation-adjusted Medicare spending in the last 30 days of life, including reimbursements for services provided in the inpatient and outpatient settings.
2.2. Covariates
All covariates were selected a priori for inclusion in the statistical models, on the basis of their clinical significance, the existing literature, their relevance for healthcare delivery, and a conceptual framework for the determinants of treatment intensity among seriously ill patients.[26] This selection process was informed through discussions with our team, which is comprised of practicing oncologists (Wulff-Burchfield, Olszewski, Egan, Trikalinos, Hugar), palliative care physicians (Wulff-Burchfield), and experts in health services research and EoL healthcare delivery (Bélanger, Baird, Panagiotou). As a result of this process, we hypothesized that the following categories could influence a patient’s likelihood of experiencing high-intensity EoL spending: patient-level clinical factors, patient-level demographic factors, area-level socioeconomic factors, physician/practice-related factors, and regional/geographic factors. Consequently, we included as many of these factors in our regression models as our data allowed.
Using the SEER database, we obtained patient-level demographic, clinical, and tumor characteristics at the time of diagnosis including the patient’s sex, age, marital status, race/ethnicity, and disease stage at diagnosis. Using the Census Tract file, we also ascertained area-level socioeconomic data at the time of diagnosis including the percent of people living in poverty in the patient’s census tract, whether the patient resided in a tract defined as either all urban, mostly urban, mostly rural, or all rural according to the Census Bureau’s Urban Rural Indicator Code, and the population in the patient’s county of residence.
Using Medicare claims billed during the 12 months prior to death, we ascertained each patient’s United States (U.S.) region at death, performance status (approximated by means of a validated claims-based disability indicator and categorized as poor or not poor),[27] comorbidities (measured using the National Cancer Institute (NCI) comorbidity index),[28] and a variable indicating whether the patient’s monthly premium for Part A and/or B coverage was subsidized by the state (“state buy-in”). All covariates were selected a priori based on clinical knowledge and relevance.
2.3. Statistical Analysis
We used univariate linear regression to assess the association of each covariate mentioned above with Medicare spending in the last 30 days of life by computing the regression coefficients and corresponding 95% confidence intervals (CI). Subsequently, we included all variables in a multivariable linear regression model regardless of their statistical significance in the univariate models. In all models, the outcome variable was a continuous measure of the sum of inpatient and outpatient Medicare spending in the last 30 days of life, and the vector of covariates included those previously listed. We used a Box-Cox transformation[29] for the outcome variable to ensure normality of the residuals of the linear regression model. This transformation is commonly used to transform non-normal random variables into normal ones and improved the model fit (for further explanation, please see Appendix 1 in Online Resource 1).
Our primary analysis pertained to the sample of patients diagnosed with any of the four cancers. We also performed exploratory subgroup analyses for each cancer separately. Finally, we also conducted a descriptive analysis to evaluate whether EoL Medicare spending was higher among patients who received high-intensity EoL care, which we measured as a composite outcome defined as the patient having at least one indication of aggressive EoL care.[30,31] These claims-based indicators of aggressive EoL cancer care are described in detail in Appendix 2 in Online Resource 2. They have been widely adopted in the literature and endorsed as quality-of-care measures by the American Society of Clinical Oncology (ASCO) and the National Quality Forum (NQF). We used SAS for data preparation and Stata for all statistical analyses. The type I error rate was set to α=0.05.
2.4. Sensitivity Analysis
Some of the covariates in our analysis (e.g., population in county of residence, marital status, etc.) were documented at the time of the patient’s cancer diagnosis, which may have changed between the patient’s diagnosis and death. For example, a patient may have been living in the Northeastern U.S. when they were diagnosed with cancer but later moved to the Western U.S. when they received EoL care. To assess the robustness of our findings to these variations, we performed a sensitivity analysis in which we restricted the sample to patients who died within 6 months of their cancer diagnosis because these covariates are less likely to change during this short time interval.
3. Results
3.1. Descriptive Results
We identified 59,355 decedents (50.8% males; 78.8% White race/ethnicity) who died of lung (n=39,330), colorectal (n=11,806), breast (n=4,862), or prostate (n=3,357) cancer. The mean age at diagnosis was 76 years and the mean age at death was 77 years. Approximately 54% of patients had stage IV disease at diagnosis, almost 40% had poor performance status, and 47% died within 6 months of diagnosis. Clinical, demographic, socioeconomic, and geographic characteristics are shown in Table 1. Across the four cancers, the median unadjusted Medicare spending in the last 30 days of life was $12,325.25 (Interquartile Range (IQR): $3,779.10 to $25,271.68) (Figure 1). Patients with lung cancer had the highest median EoL Medicare spending at $12,895.34 (IQR: $3,914.369 to $25,246.45) followed closely by patients with colorectal cancer whose median EoL Medicare spending was $12,269.94 (IQR: $3,633.81 to $29,159.15). Patients with prostate cancer had a median EoL Medicare spending of $10,071.54 (IQR: $3,420.203 to $21,961.33) and patients with breast cancer had the lowest EoL Medicare spending, with a median of $9,583.72 (IQR: $3,327.68 to $20,884.07).
Figure 2 presents all-cause unadjusted Medicare spending in the last 30 days of life by both type of high-intensity EoL care measure and cancer type. For every single cancer type, ≥2 inpatient admissions within 30 days of death was associated with the highest median all-cause Medicare spending in the last 30 days of life, ranging from $32,629.50 to $40,255.70. Conversely, receipt of any oral or parenteral chemotherapy in the last 14 days of life was associated with the lowest median all-cause Medicare spending in the last 30 days of life for all cancer types, ranging from $18,490.00 to $21,861.80.
3.2. Predictor Results
Table 2 shows the associations of clinical, demographic, socioeconomic, and geographic characteristics with all-cause Medicare spending in the last 30 days of life. Because we used a Box Cox transformation of our outcome, EoL Medicare spending, it is not possible to interpret the coefficients as exact dollar amounts. Rather, positive coefficients indicate that the variable is associated with an increase in EoL Medicare spending, negative coefficients indicate that the variable is associated with a reduction in EoL Medicare spending, and the magnitudes of the coefficients can be used to infer which variables have a more significant impact on EoL Medicare spending. We found that increased comorbidity burden (1.06, p<0.001), female sex (0.33, p<0.001), Black race (0.91, p<0.001), Other race/ethnicity (0.91, p<0.001), stage III at diagnosis (0.37, p<0.01), stage IV at diagnosis (0.39, p<0.001), higher population in the county of residence (0.56, p<0.001; 1.33, p<0.001), and state buy-in (0.72, p<0.001) were all associated with increased EoL Medicare spending. EoL Medicare spending was lower for older compared to younger patients (-0.05, p<0.001); patients residing in the Midwest, South, or West compared to the Northeastern U.S. (-1.40, p<0.001; -2.32, p<0.001; -0.66, p<0.001); patients living in all rural, mostly rural, or mostly urban as compared to all urban areas (-0.62, p<0.001; -0.77, p<0.001; -0.55, p<0.001); and patients with poor performance status (-5.36, p<0.001).
3.3. Regression Results for Additional Analyses
These associations were largely consistent across cancer types except for level of poverty and stage at diagnosis. In particular, there was no association between poverty level and EoL Medicare spending for patients with breast or lung cancer, while patients with prostate cancer residing in a census tract with 5% to <10% poverty, as compared to 0% to <5% poverty, had lower EoL Medicare spending. On the other hand, residing in a in census tract with 10% to <20% poverty or 20% to 100% poverty, as compared to 0% to <5% poverty, was associated with higher EoL Medicare spending for patients with colorectal cancer. There are also different associations observed among cancer type for stage at diagnosis. For all cancers combined, being diagnosed with stage III or IV cancer, as compared to stage I-II cancer, is associated with more EoL Medicare spending in the last 30 days of life. However, stage III or IV disease was associated with less EoL Medicare spending among patients with colorectal cancer.
The sensitivity analysis included a cohort of 27,821 patients who died within 6 months of diagnosis and indicated that a higher comorbidity burden, female sex, Black and other race/ethnicity, living in a more populated area, and state buy-in, were all associated with more Medicare spending in the last 30 days of life (Table 3). Conversely, older age, stage III or IV cancer at diagnosis, living in the Midwest, South or West, living in an all rural, mostly rural, or mostly urban area, and having a poor performance status were all associated with less Medicare spending in the last 30 days of life.
4. Discussion
We conducted a retrospective cohort study of Medicare patients with the four most common cancers to identify predictors of EoL Medicare spending and to examine which types of high-intensity healthcare utilization contribute most to EoL Medicare spending. We found that younger age, female sex, Black race/ethnicity, other race/ethnicity, state buy-in, higher comorbidity burden, higher stage at diagnosis, good performance status, and residing in a more populated county, the Northeast, or an all-urban census tract were all associated with greater EoL Medicare spending. Of all the ASCO quality benchmarks, we found that ≥2 inpatient admissions within 30 days of death was associated with the highest median all-cause EoL Medicare spending. Interestingly, a recent study found that inpatient hospital costs during the last month of life were 24% lower for cancer decedents who received early palliative care as compared to cancer decedents who did not receive early palliative care.[32] Overall, median all-cause Medicare spending in the last 30 days of life was $20,713.91 higher for patients who received high-intensity EoL care as compared to those who did not, highlighting how high-intensity EoL care places a significant financial strain on the healthcare system.
4.2. Demographic Predictors
The association of younger age with greater EoL Medicare spending is consistent with prior studies.[20,21,22,23] This expenditure difference is largely driven by lower intensity EoL care among older patients with cancer, which may reflect differences in patient or caregiver preferences by age. Among patients who were ≤74 at diagnosis, 47.42% received high-intensity EoL care, while only 37.44% of patients who were ≥85 at diagnosis received high-intensity EoL care. Previous research has suggested that older patients may feel less inclined than younger patients to undergo aggressive treatments only to gain a few more weeks with loved ones.[33] The association of female sex with greater EoL Medicare spending is also concordant with previous research that assessed cancer spending in the last 6-12 months of life.[21,22,23,24]
There is some research demonstrating that during the EoL, men experience a more rapid de-escalation of care in the ICU setting as compared to female patients.[34] Additionally, because women are more likely to outlive male partners within heterosexual couples, they may rely more on costly long-term care services to fulfill their EoL care needs. These findings could also reflect gender-based differences in EoL care decisions that are made by surrogate decision-makers such as children.
Our finding that Black and other minority races are associated with greater EoL Medicare spending as compared to White patients is also consistent with prior research.[22,23,24] A number of interrelated factors may contribute to racial disparities in EoL spending for cancer patients, including barriers to optimal patient-physician communication and specialty palliative care access, distrust of medical institutions among Black patients related to institutional racism, and the role of faith in determining preferences for high-intensity EoL care.[35,36,37]
4.3. Geographic Predictors
Several previous studies have also found that patients with cancer who reside in more populated areas have greater spending in the last year of life.[21,22,23] Higher EoL spending among patients who live in more densely populated areas may signify disparities in the use of EoL healthcare services.[38] Alternatively, these findings may be a reflection of Medicare reimbursing rural providers at lower rates than urban providers for the same services, due to factors such as lower market labor costs. Finally, these results could also indicate that a culture of high-intensity EoL care is more prevalent in urban areas.
4.4. Sensitivity Analysis
Predictors of EoL Medicare spending were largely consistent regardless of how long the patient survived after their cancer diagnosis. However, a more advanced stage at diagnosis was associated with lower EoL Medicare spending among patients who died within 6 months of diagnosis. Research has found that the accuracy of physician prognostication decreases as the duration of the doctor-patient relationship increases.[39,40] As such, physician prognostication may be more accurate for patients who survive for shorter periods of time after diagnosis, because there is less time for a physician’s judgment to be clouded by their emotional stake in the patient. This improved prognostication may lead patients to forego more highly aggressive care at the EoL, which would decrease EoL spending.
4.5. Recommendations for Policy & Practice
Professional societies have attempted to reduce the intensity of EoL care for patients with cancer, by creating quality measures and setting benchmark guidelines for physicians. However, our findings and other studies[41,42,43] indicate that these efforts alone have not been sufficient in reducing unnecessary and costly EoL care for many patients with cancer. For that reason, policymakers should shift their focus towards finding ways to better incentivize healthcare providers and health systems to meet the recommended EoL quality benchmarks. For example, value-based care systems that use financial incentives to improve healthcare quality while also reducing costs may be a promising solution. The Centers for Medicare and Medicaid Services’ (CMS) Oncology Care Model (OCM) decreased mean total episode payments by almost $300 in the first three years of the program,[44] in large part due to reductions in clinician visits, physician-administered drug use, and fewer imaging services.[44,45] Importantly, this reduced utilization did not have any negative effect on patient survival or quality of life. If the OCM were to incorporate the existing ASCO/NQF high-intensity EoL care quality measures, this model may also be able to reduce unnecessary EoL care utilization and expenditures.
Our results also indicate that there is an opportunity for development of decision support tools to alert physicians when they are treating patients at increased risk of excessive EoL spending. These point-of-care alerts would allow physicians to target EoL interventions, such as serious illness conversations and referrals to palliative care, to those patients who would benefit from them most. Although the decision support intervention from the 1995 SUPPORT study[46] did not precipitate patient outcome improvements, newly developed interventions that leverage recent technology are promising. In fact, a recent study evaluating the impact of an EHR-based intervention that delivered mortality predictions with behavioral nudges to oncology clinicians found that the rate of serious illness conversations was significantly increased among high mortality risk patients.[47] This provides support for utilizing the risk factors identified in this study to enhance ongoing machine learning efforts aimed to augment clinician prognostication.
5. Limitations
Our study has some limitations. First, our findings do not capture the outcomes of younger patients with these cancers, as the SEER-Medicare dataset is limited to patients 65 years and older. However, data from commercially insured patients indicate similar patterns in the use of high-intensity EoL care.[48] Second, our EoL spending outcome represents the sum of patient reimbursements for inpatient and outpatient services, and therefore does not include costs that are not reimbursed by Medicare. However, while our claims-based outcome may not include the entire sum of EoL healthcare spending, it covers all spending related to potentially unnecessary high-intensity EoL care, which is the focus of this study, and our outcome has been widely used by previous EoL cancer spending studies. Third, the ASCO/NQF high-intensity EoL care benchmarks that are used in the analysis are largely based on research conducted in the early 1990s.[30] However, despite innovations in cancer treatments, the primary features of high-quality EoL medical care have not evolved to include higher intensity interventions, and therefore these benchmarks remain appropriate for this analysis.
6. Conclusions
In conclusion, Medicare spending in the last 30 days of life was six times higher for patients with indicators of high-intensity EoL care. This demonstrates that high-intensity EoL care not only burdens patients and caregivers, but also adds substantial financial strain to the healthcare system. As such, there is a clear need for policies that incentivize healthcare providers and health systems to better align EoL care intensity with patient preferences and goals of care. We recommend that the risk factors identified in this study be used to inform targeted interventions, such as decision-support tools that facilitate referrals to palliative care for high-risk patients.
Model Fit Based on Box-Cox Transformation
Even though Box-Cox transforming the outcome variable before using it in the model does not necessarily translate to normally distributed residuals, the transformation resulted in improved the model fit based on the Akaike information criterion (AIC); lower AIC values indicate a better fitting model. The AIC of the model when using the Box-Cox transformed outcome was equal to 35,0878.40, while the AIC was equal to 1,113,823.00 when using the raw (untransformed) cost outcome.
Appendix 2
Claims-based Indicators of Aggressive Cancer Care at the EoL
Claims-based indicators of aggressive cancer care at the EoL included death in an acute care hospital, receipt of any oral or parenteral chemotherapy in the last 14 days of life (see below), one or more admissions to the intensive care unit (ICU) in the last 30 days of life, two or more emergency department (ER) visits in the last 30 days of life, or two or more inpatient admissions in the last 30 days of life. These indicators have been widely adopted in the literature and endorsed as quality-of-care measures by the American Society of Clinical Oncology (ASCO) and the National Quality Forum (NQF).1
Chemotherapy Endpoint
The endpoint of "use of chemotherapy within the last 14 days of life" was examined in a subgroup of patients who had available Medicare Part A and B (to account for office-administered chemotherapy) and Part D (to account for orally administered prescriptions for antineoplastic agents) claims, with a minimum of 3 months of coverage under Part D within the last 6 months of life. Chemotherapy drugs were identified using Healthcare Common Procedure Coding System (HCPCS) billing codes for outpatient hospital or physician office administration,2 and using the National Cancer Institute database of oral anti-cancer drugs for prescription drugs.3
References:
National Quality Forum Measures American Society of Clinical Oncology (ASCO) [Available from: https://www.asco.org/practice-patients/quality-measures/measures-library/national-quality-forum.
Cancer Medications Enquiry Database (CanMED), Surveillance Research Program SEER website tool, Version 1.12.2: Division of Cancer Control and Population Sciences, National Cancer Institute; [Available from: https://seer.cancer.gov/oncologytoolbox/canmed/.
A to Z list of Cancer Drugs: National Cancer Institute; [Available from: https://www.cancer.gov/about-cancer/treatment/drugs.
Author Contributions
Funding
The work of Dr. Olszewski is supported by the Leukemia and Lymphoma Society grant CDP-2339-22. The work of Dr. Leonidas Bantis reported in this publication was supported by the National Center For Advancing Translational Sciences of the National Institutes of Health under Award Number UL1TR002366. The funders had no role in the design and conduct of the study; collection, management, analysis, and interpretation of the data; preparation, review, or approval of the manuscript; and decision to submit the manuscript for publication.
Data Availability Statement
No data are available from the authors. SEER-Medicare data can be requested from the National Cancer Institute: https://healthcaredelivery.cancer.gov/seermedicare/.
Acknowledgements
This study used the linked SEER-Medicare database. The interpretation and reporting of these data are the sole responsibility of the authors. The authors acknowledge the efforts of the National Cancer Institute; Information Management Services (IMS), Inc.; and the Surveillance, Epidemiology, and End Results (SEER) Program tumor registries in the creation of the SEER-Medicare database. The collection of cancer incidence data used in this study was supported by the California Department of Public Health pursuant to California Health and Safety Code Section 103885; Centers for Disease Control and Prevention’s (CDC) National Program of Cancer Registries, under cooperative agreement 1NU58DP007156; the National Cancer Institute’s Surveillance, Epidemiology and End Results Program under contract HHSN261201800032I awarded to the University of California, San Francisco, contract HHSN261201800015I awarded to the University of Southern California, and contract HHSN261201800009I awarded to the Public Health Institute. The ideas and opinions expressed herein are those of the author(s) and do not necessarily reflect the opinions of the State of California, Department of Public Health, the National Cancer Institute, and the Centers for Disease Control and Prevention or their Contractors and Subcontractors.
Conflicts of Interest
Dr. Wulff-Burchfield reports receiving grants from Pfizer Global Medical Grants, personal fees from Astellas, personal fees from Aveo Oncology, personal fees from Bristol Myers Squibb, personal fees from Exelixis, personal fees from Janssen, personal fees from Targeted Oncology, personal fees from Aptutide Health, grant and non-financial support from Acer Therapeutics, other from Immunomedics, other from Nektar, outside the submitted work. Dr. Vyas reports receiving research grants from Merck & Co, Inc. and Rhode Island Department of Health. Dr. Olszewski reports receiving research funding from Precision Bio, Adaptive Biotechnologies, Celdex, Acrotech Biopharma, TG Therapeutics, Genmab, and Genentech and consultancy fees from Schrodinger, TG Therapeutics and Genmab. Courtney Baird, Pamela Egan, Lee Hugar, Nikolaos Trikalinos, Michael Liu, Emmanuelle Bélanger, and Orestis Panagiotou have no conflicts or disclosures to report.
Ethical Approval: Our institution's Committee for the Protection of Human Subjects designated this study as exempt because the data are de-identified (IRB Reference #1811002277).
Appendix 1
References
- 1: MD, Bradley EH (2017) Epidemiology And Patterns Of Care At The End Of Life: Rising Complexity, Shifts In Care Patterns And Sites Of Death Health Aff (Millwood) 36, 2017.
- 2: JM, Gozalo P, Trivedi AN, Bunker J, Lima J, Ogarek J, Mor V (2018) Site of Death, Place of Care, and Health Care Transitions Among US Medicare Beneficiaries, 2000-2015 JAMA 320, 2018.
- 8: JM, Clarridge BR, Casey V, Welch LC, Wetle T, Shield R, Mor V (2004) Family perspectives on end-of-life care at the last place of care JAMA 291, 2004.
- 2: AA, Keating NL, Ayanian JZ, Chrischilles EA, Kahn KL, Ritchie CS, Weeks JC, Earle CC, Landrum MB (2016) Family Perspectives on Aggressive Cancer Care Near the End of Life JAMA 315, 2016.
- 4: AA, Keating NL, Balboni TA, Matulonis UA, Block SD, Prigerson HG (2010) Place of death: correlations with quality of life of patients with cancer and predictors of bereaved caregivers' mental health J Clin Oncol 28, 2010.
- 8: MM, Balboni TA, Maciejewski PK, Bao Y, Prigerson HG (2015) Quality of Life and Cost of Care at the End of Life: The Role of Advance Directives J Pain Symptom Manage 49, 2015.
- 4: B, Wright AA, Huskamp HA, Nilsson ME, Maciejewski ML, Earle CC, Block SD, Maciejewski PK, Prigerson HG (2009) Health care costs in the last week of life: associations with end-of-life conversations Arch Intern Med 169, 2009.
- 1: JD, Riley GF (1993) Trends in Medicare payments in the last year of life N Engl J Med 328, 1993.
- 3: N (1984) Utilization and costs of Medicare services by beneficiaries in their last year of life Med Care 22, 1984.
- 7: SS, Kale M, Keyhani S, Roman BR, Yang A, Derosa AP, Korenstein D (2017) Overuse of Health Care Services in the Management of Cancer: A Systematic Review Med Care 55, 2017.
- 6: C, Kerr K, McGuire J, Rabow MW (2016) The Costs of Waiting: Implications of the Timing of Palliative Care Consultation among a Cohort of Decedents at a Comprehensive Cancer Center J Palliat Med 19, 2016.
- 3: S, Hsu SH, Huang S, Soulos PR, Gross CP (2017) Longer Periods Of Hospice Service Associated With Lower End-Of-Life Spending In Regions With High Expenditures Health Aff (Millwood) 36, 2017.
- 1: AZ, Hyer JM, Palmer E, Lustberg MB, Pawlik TM (2021) Racial/Ethnic Disparities in Hospice Utilization Among Medicare Beneficiaries Dying from Pancreatic Cancer J Gastrointest Surg 25, 2021.
- 8: YE, Williams CP, Jackson BE, Dionne-Odom JN, Taylor R, Ejem D, Kvale E, Pisu M, Bakitas M, Rocque GB (2019) Disparities in Hospice Utilization for Older Cancer Patients Living in the Deep South J Pain Symptom Manage 58, 2019.
- 1: AH, Bull JH, Swetz KM, Wolf SP, Shanafelt TD, Myers ER (2017) Future of the Palliative Care Workforce: Preview to an Impending Crisis Am J Med 130, 2017.
- 9: AH, Wolf SP, Troy J, Leff V, Dahlin C, Rotella JD, Handzo G, Rodgers PE, Myers ER (2019) Policy Changes Key To Promoting Sustainability And Growth Of The Specialty Palliative Care Workforce Health Aff (Millwood) 38, 2019.
- 2: ME, Black L, Benedict A, Roehrborn CG, Albertsen P (2010) Long-term medical-care costs related to prostate cancer: estimates from linked SEER-Medicare data Prostate Cancer Prostatic Dis 13, 2010.
- 1: B, Lin YS, Castel LD (2017) Cost drivers for breast, lung, and colorectal cancer care in a commercially insured population over a 6-month episode: an economic analysis from a health plan perspective J Med Econ 20, 2017.
- 6: KR, Lamont EB, Mariotto A, Warren JL, Topor M, Meekins A, Brown ML (2008) Cost of care for elderly cancer patients in the United States J Natl Cancer Inst 100, 2008.
- 1: NL, Huskamp HA, Kouri E, Schrag D, Hornbrook MC, Haggstrom DA, Landrum MB (2018) Factors Contributing To Geographic Variation In End-Of-Life Expenditures For Cancer Patients Health Aff (Millwood) 37, 2018.
- 2: LR, Bird CE, Schuster CR, Lynn J (2007) Age and gender differences in Medicare expenditures at the end of life for colorectal cancer decedents J Womens Health (Larchmt) 16, 2007.
- 1: LR, Bird CE, Schuster CR, Lynn J (2008) Age and gender differences in medicare expenditures and service utilization at the end of life for lung cancer decedents Womens Health Issues 18, 2008.
- 3: H, Qiu F, Boilesen E, Nayar P, Lander L, Watkins K, Watanabe-Galloway S (2016) Rural-Urban Differences in Costs of End-of-Life Care for Elderly Cancer Patients in the United States J Rural Health 32, 2016.
- 1: S, Rajan SS, Revere FL, Sharma G (2019) Factors Affecting Racial Disparities in End-of-Life Care Costs Among Lung Cancer Patients: A SEER-Medicare-based Study Am J Clin Oncol 42, 2019.
- Cancer Stat Facts: Common Cancer Sites. In: Editor (ed)^(eds) Book Cancer Stat Facts: Common Cancer Sites, City.
- 8: AS, Morrison RS, Wenger NS, Ettner SL, Sarkisian CA (2010) Determinants of treatment intensity for patients with serious illness: a new conceptual framework J Palliat Med 13, 2010.
- 5: AJ, Gardner LD, Zuckerman IH, Hendrick F, Ke X, Edelman MJ (2014) Validation of disability status, a claims-based measure of functional status for cancer treatment and outcomes studies Med Care 52, 2014.
- 5: CN, Legler JM, Warren JL, Baldwin LM, Schrag D (2007) A refined comorbidity measurement algorithm for claims-based studies of breast, prostate, colorectal, and lung cancer patients Ann Epidemiol 17, 2007.
- 2: GEP, Cox DR (1964) An Analysis of Transformations J Roy Stat Soc B 26, 1964.
- 3: CC, Neville BA, Landrum MB, Ayanian JZ, Block SD, Weeks JC (2004) Trends in the aggressiveness of cancer care near the end of life J Clin Oncol 22, 2004.
- 1: CC, Park ER, Lai B, Weeks JC, Ayanian JZ, Block S (2003) Identifying potential indicators of the quality of end-of-life cancer care from administrative data J Clin Oncol 21, 2003.
- e: H, Barbera LC, McGrail K, Burge F, Guthrie DM, Lawson B, Chan KKW, Peacock SJ, Sutradhar R (2022) Effect of Early Palliative Care on End-of-Life Health Care Costs: A Population-Based, Propensity Score-Matched Cohort Study JCO Oncol Pract 18, 2022.
- S: MB, Lynn J, Teno JM, Covinsky KE, Wu AW, Galanos A, Desbiens NA, Phillips RS (2000) Age-related differences in care preferences, treatment decisions, and clinical outcomes of seriously ill hospitalized adults: lessons from SUPPORT J Am Geriatr Soc 48, 2000.
- Lissauer M, Smitz-Naranjo L, Johnson S (2011) Gender influences end-of-life decisions. In: Editor (ed)^(eds) Book Gender influences end-of-life decisions. Critical Care, City.
- 9: W, Mallinger JB, Krishnan A, Shields CG (2006) Attitudes toward life-sustaining interventions among ambulatory black and white patients Ethn Dis 16, 2006.
- 1: PV, Davis B, Wright K, Marcial E (1993) The influence of ethnicity and race on attitudes toward advance directives, life-prolonging treatments, and euthanasia J Clin Ethics 4, 1993.
- 6: ED, Garrett JM, Evans AT, Danis M (1996) Differences in end-of-life decision making among black and white ambulatory cancer patients J Gen Intern Med 11, 1996.
- 4: NC, Campbell DG, Caringi J (2022) A qualitative study of rural healthcare providers' views of social, cultural, and programmatic barriers to healthcare access BMC Health Serv Res 22, 2022.
- 4: NA, Lamont EB (2000) Extent and determinants of error in doctors' prognoses in terminally ill patients: prospective cohort study BMJ 320, 2000.
- 1: RM, McClish DK, Bekes C, Scott WE, Morley JN (1991) Ego bias, reverse ego bias, and physicians' prognostic Crit Care Med 19, 1991.
- 4: GA, Cronin AM, Uno H, Schrag D, Keating NL, Mack JW (2016) Intensity of Medical Interventions between Diagnosis and Death in Patients with Advanced Lung and Colorectal Cancer: A CanCORS Analysis J Palliat Med 19, 2016.
- 2: DK, Samuel CA, Rosenstein DL, Dusetzina SB (2016) Investigation of Racial Disparities in Early Supportive Medication Use and End-of-Life Care Among Medicare Beneficiaries With Stage IV Breast Cancer J Clin Oncol 34, 2016.
- 7: LA, Yabes JG, Filippou P, Wulff-Burchfield EM, Lopa SH, Gore J, Davies BJ, Jacobs BL (2021) High-intensity end-of-life care among Medicare beneficiaries with bladder cancer Urol Oncol 39, 2021.
- 1: NL, Jhatakia S, Brooks GA, Tripp AS, Cintina I, Landrum MB, Zheng Q, Christian TJ, Glass R, Hsu VD, Kummet CM, Woodman S, Simon C, Hassol A, Oncology Care Model Evaluation T (2021) Association of Participation in the Oncology Care Model With Medicare Payments, Utilization, Care Delivery, and Quality Outcomes JAMA 326, 2021.
- e: B, Frytak J, Hayes J, Neubauer M, Robert N, Wilfong L (2020) Evaluation of Practice Patterns Among Oncologists Participating in the Oncology Care Model JAMA Netw Open 3, 2020.
- 1: AF, Jr, Dawson NV, Desbiens NA, Fulkerson WJ, Jr, Goldman L, Knaus WA, Lynn J, Oye RK, Bergner M, Damiano A, Hakim R, Murphy DJ, Teno J, Virnig B, Wagner DP, Wu AW, Yasui Y, Robinson DK, Kreling B, Dulac J, Baker R, Holayel S, Meeks T, Mustafa M, Vegarra J, Alzola C, Harrell FE, Jr, Cook EF, Hamel MB, Peterson L, Phillips RS, Tsevat J, Forrow L, Lesky L, Davis R, Kressin N, Solzan J, Puopolo AL, Barrett LQ, Bucko N, Brown D, Burns M, Foskett C, Hozid A, Keohane C, Martinez C, McWeeney D, Melia D, Otto S, Sheehan K, Smith A, Tofias L, Arthur B, Collins C, Cunnion M, Dyer D, Kulak C, Michaels M, O'Keefe M, Parker M, Tuchin L, Wax D, Weld D, Hiltunen L, Marks G, Mazzapica N, Medich C, Soukup J, Califf RM, Galanos AN, Kussin P, Muhlbaier LH, Winchell M, Mallatratt L, Akin E, Belcher L, Buller E, Clair E, Drew L, Fogelman L, Frye D, Fraulo B, Gessner D, Hamilton J, Kruse K, Landis D, Nobles L, Oliverio R, Wheeler C, Banks N, Berry S, Clayton M, Hartwell P, Hubbard N, Kussin I, Norman B, Noveau J, Read H, Warren B, Castle J, Turner K, Perdue R, Coulton C, Landefeld CS, Speroff T, Youngner S, Kennard MJ, Naccaratto M, Roach MJ, Blinkhorn M, Corrigan C, Geric E, Haas L, Ham J, Jerdonek J, Landy M, Marino E, Olesen P, Patzke S, Repas L, Schneeberger K, Smith C, Tyler C, Zenczak M, Anderson H, Carolin P, Johnson C, Leonard P, Leuenberger J, Palotta L, Warren M, Finley J, Ross T, Solem G, Zronek S, Davis S, Broste S, Layde P, Kryda M, Reding DJ, Vidaillet HJ, Jr, Folien M, Mowery P, Backus BE, Kempf DL, Kupfer JM, Maassen KE, Rohde JM, Wilke NL, Wilke SM, Albee EA, Backus B, Franz AM, Henseler DL, Herr JA, Leick I, Lezotte CL, Meddaugh L, Duffy L, Johnson D, Kronenwetter S, Merkel A, Bellamy PE, Hiatt J, Wenger NS, Leal-Sotelo M, Moranville-Hawkins D, Sheehan P, Watanabe D, Yamamoto MC, Adema A, Adkins E, Beckson A-M, Carter M, Duerr E, El-Hadad A, Farber A, Jackson A, Justice J, O'Meara A, Benson L, Cheney L, Medina C, Moriarty J, Baker K, Marsden C, Watne K, Goya D, Desbiens N, Fulkerson WJ, Carpenter CCJ, Carson RA, Detmer DE, Steinwachs DE, Mor V, Harootyan RA, Leaf A, Watts R, Williams S, Ransohoff D (1995) A Controlled Trial to Improve Care for Seriously III Hospitalized Patients: The Study to Understand Prognoses and Preferences for Outcomes and Risks of Treatments (SUPPORT) JAMA 274, 1995.
- e: CR, Parikh RB, Small DS, Evans CN, Chivers C, Regli SH, Hanson CW, Bekelman JE, Rareshide CAL, O'Connor N, Schuchter LM, Shulman LN, Patel MS (2020) Effect of Integrating Machine Learning Mortality Estimates With Behavioral Nudges to Clinicians on Serious Illness Conversations Among Patients With Cancer: A Stepped-Wedge Cluster Randomized Clinical Trial JAMA Oncol 6, 2020.
- e: A, Xu X, Zhang F, Ross-Degnan D, Wharam JF, Wagner AK (2021) Intensity of End-of-Life Care in a Cohort of Commercially Insured Women With Metastatic Breast Cancer in the United States JCO Oncol Pract 17, 2021.
Figure 1.
Distribution of Unadjusted Medicare Spending within 30 Days of Death. Sources: SEER-Medicare Dataset.
Figure 1.
Distribution of Unadjusted Medicare Spending within 30 Days of Death. Sources: SEER-Medicare Dataset.
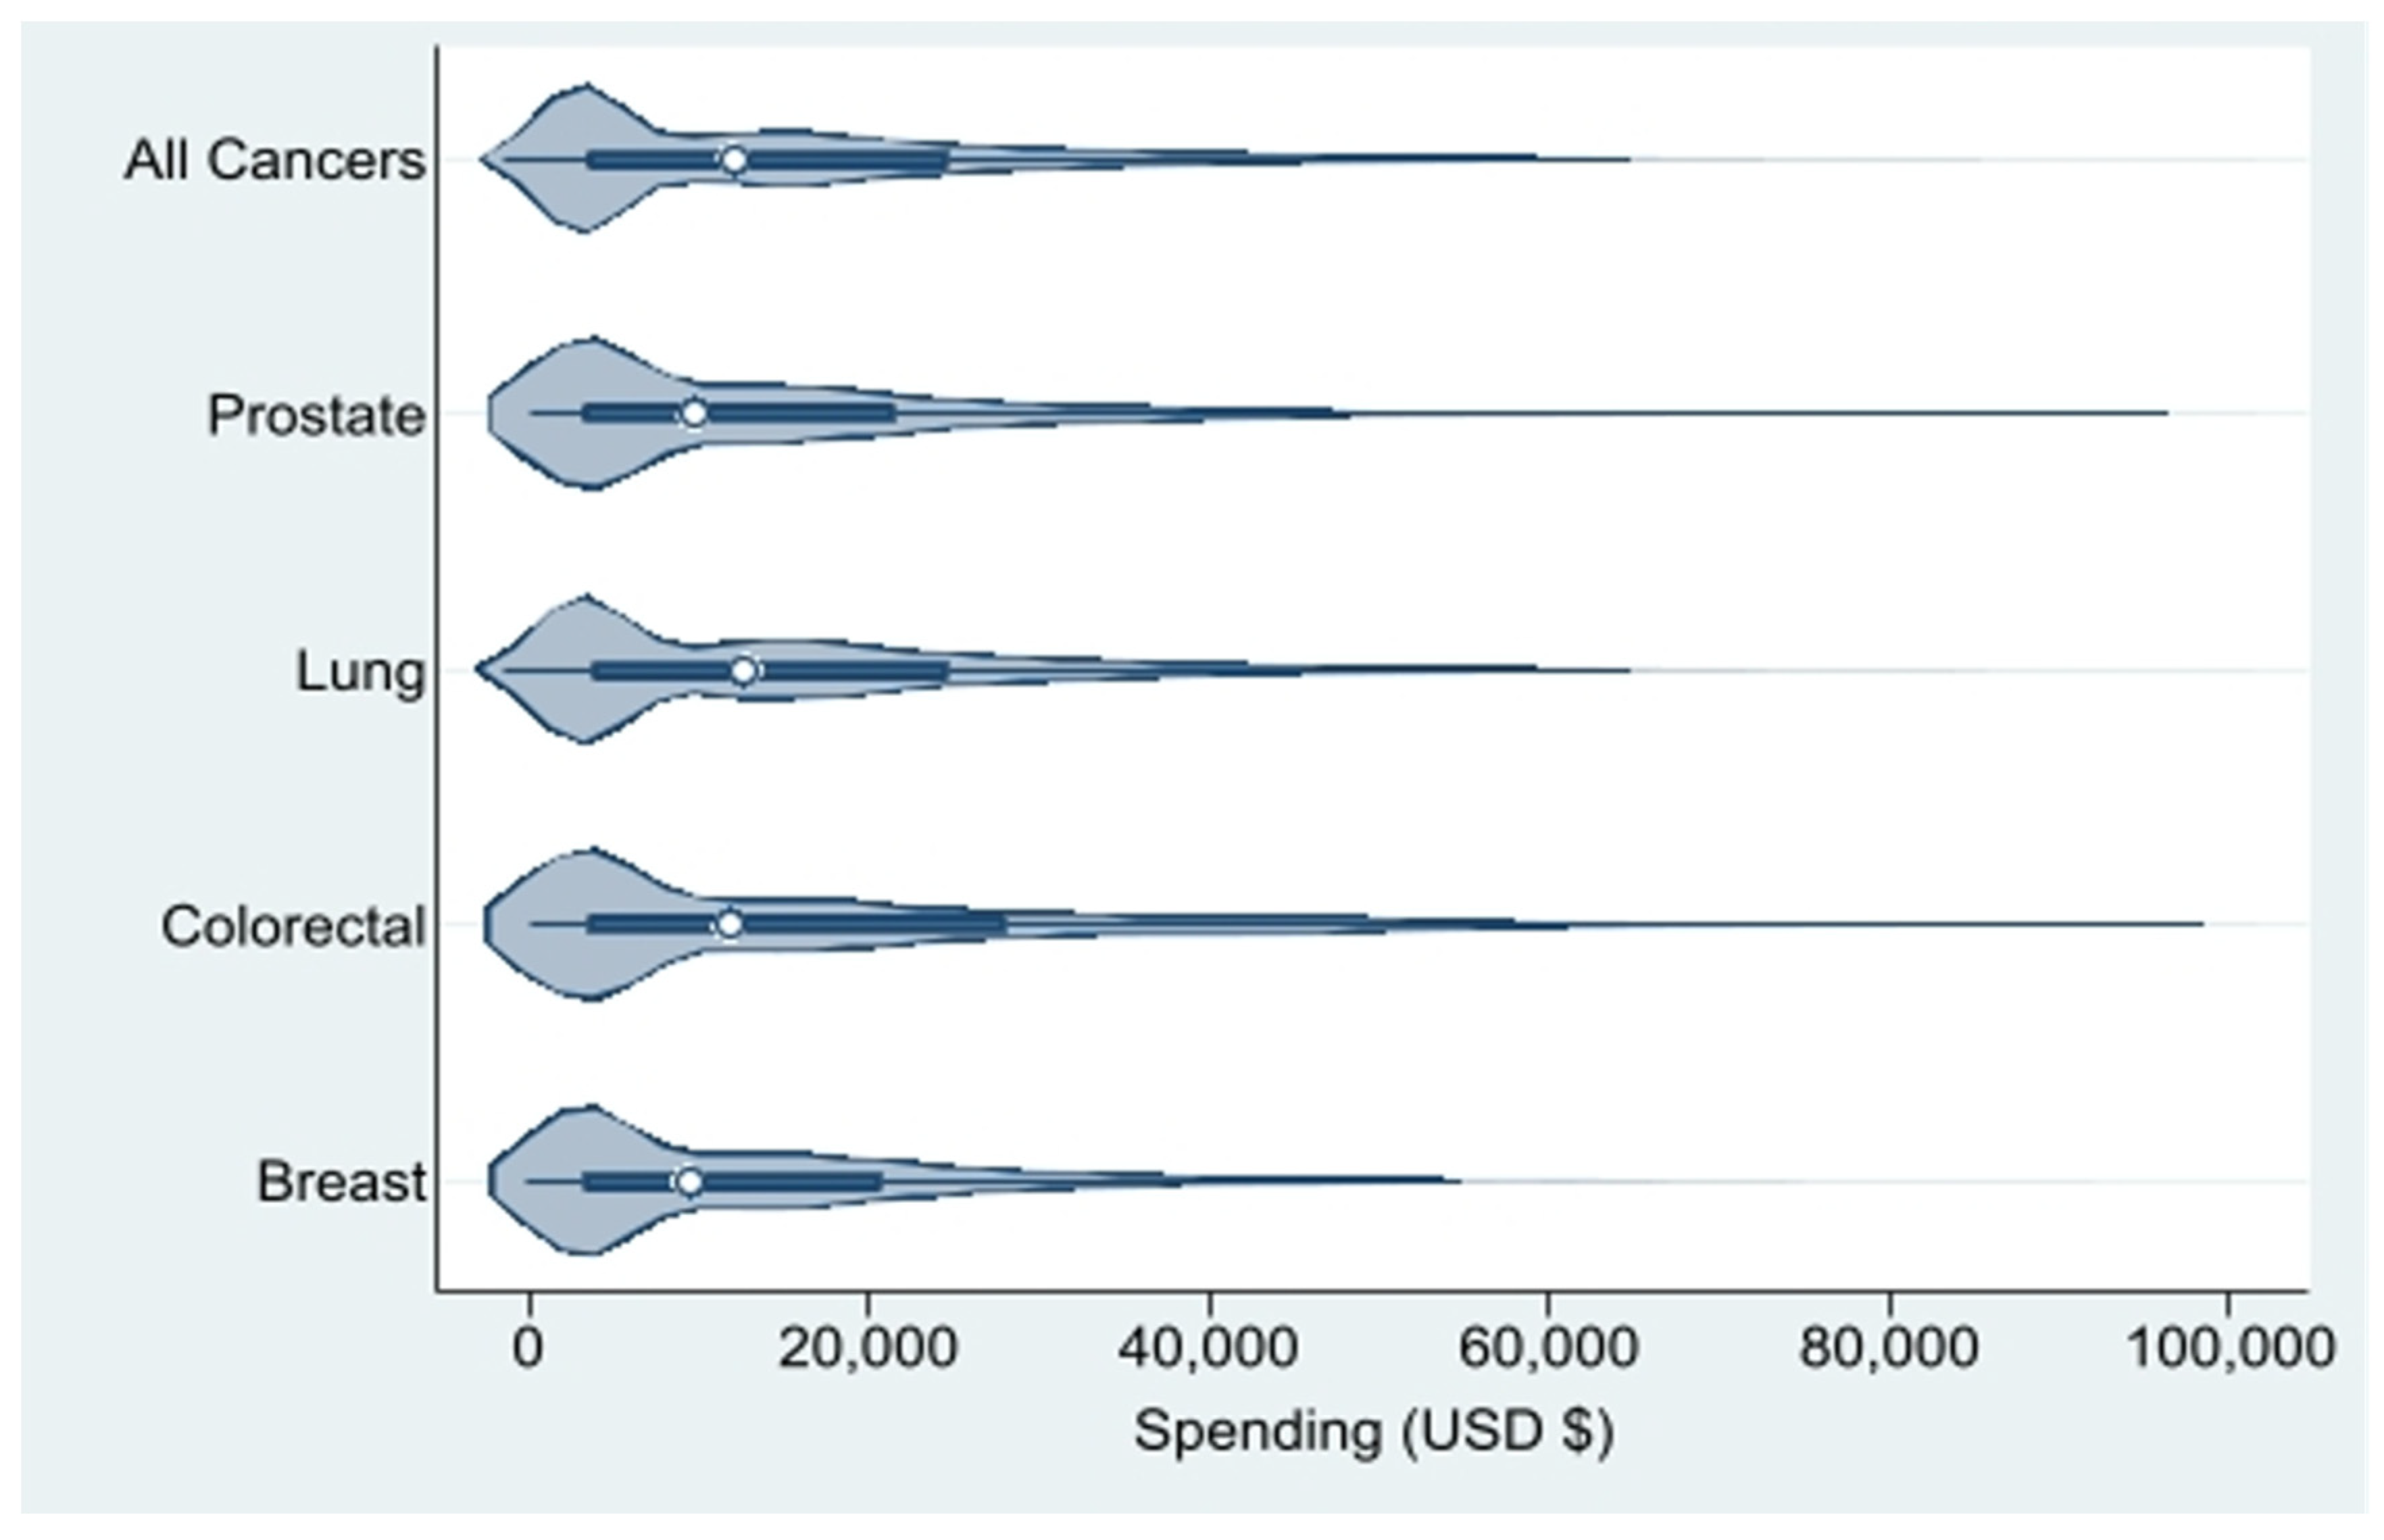
Figure 2.
Drivers of Unadjusted Medicare Spending within 30 days of Death by Cancer. Sources: SEER-Medicare Dataset.
Figure 2.
Drivers of Unadjusted Medicare Spending within 30 days of Death by Cancer. Sources: SEER-Medicare Dataset.
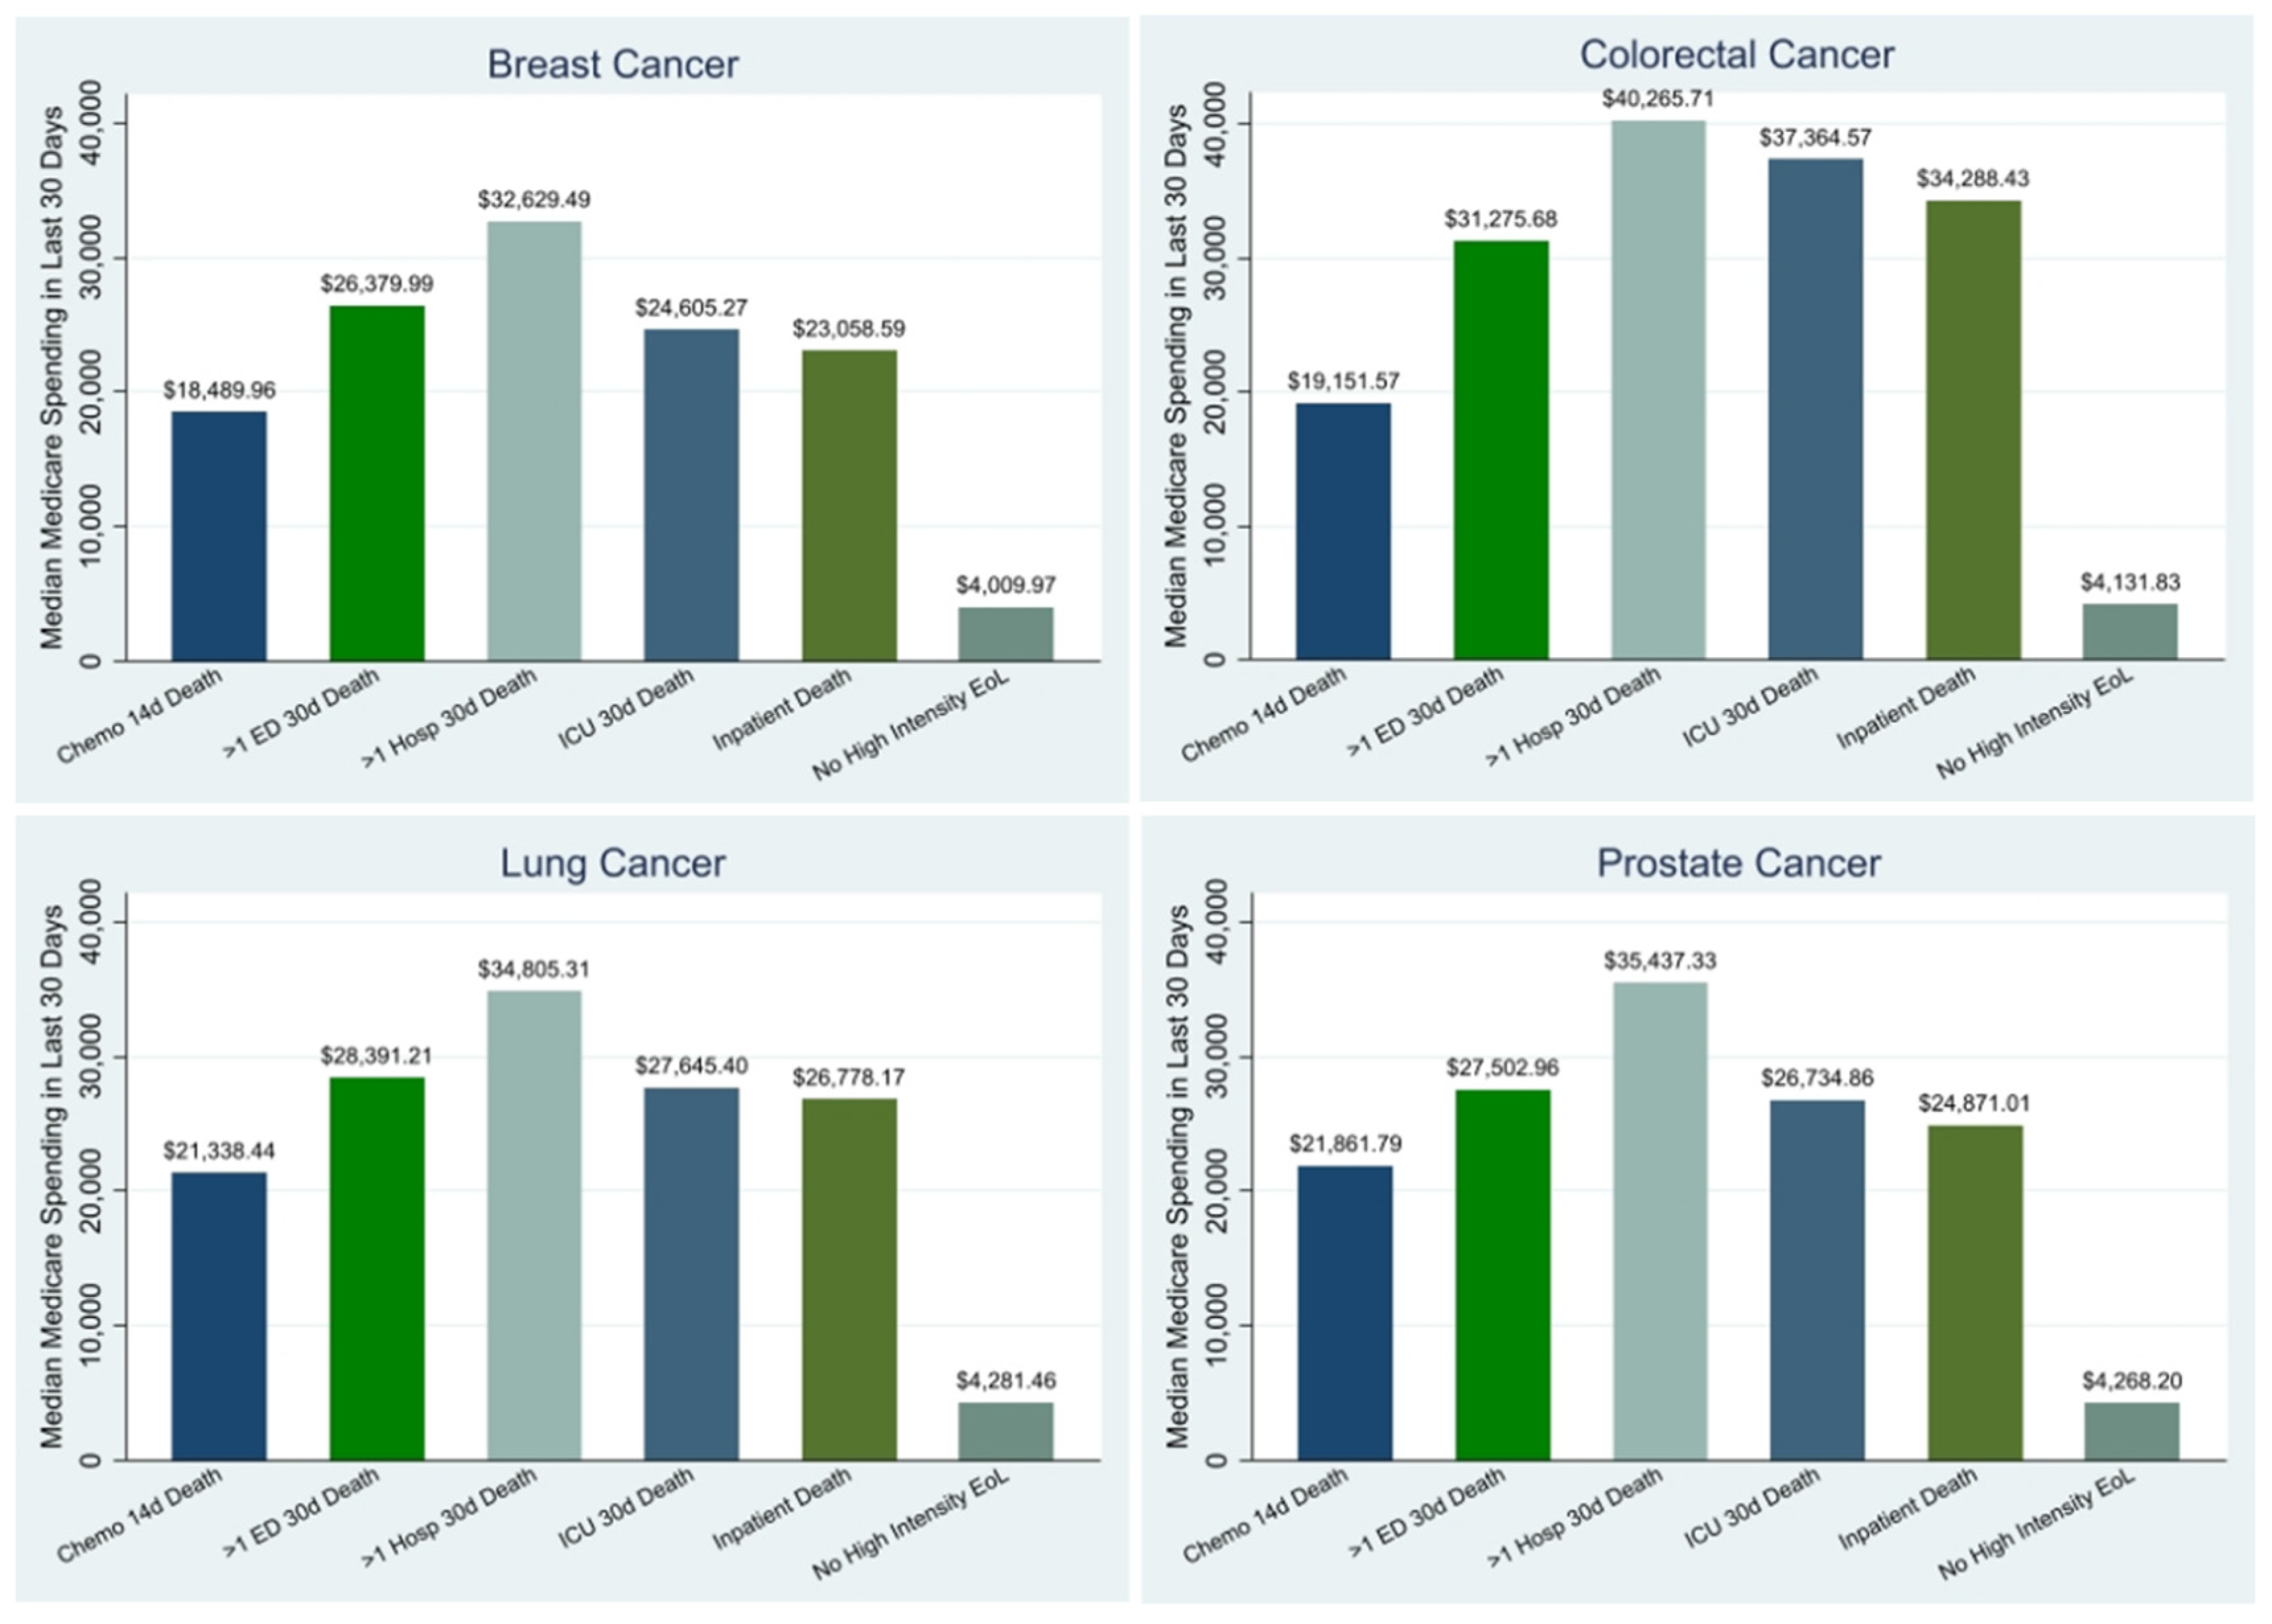

Table 1.
Sample Characteristics.
| All Cancers (N=59,355) | Breast Cancer (N=4,862) | Colorectal Cancer (N=11,806) | Lung Cancer (N=39,330) | Prostate Cancer (N=3,357) | |
|---|---|---|---|---|---|
| Clinical Characteristics | |||||
| NCI Comorbidity Index, mean (SD) | 3 (2) | 3 (2) | 3 (3) | 3 (2) | 3 (3) |
| Performance Status,No. (%) | |||||
| Not Poor | 35,753 (60.2%) | 2,449 (50.4%) | 6,132 (51.9%) | 25,022 (63.6%) | 2,150 (64.0%) |
| Poor | 23,602 (39.8%) | 2,413 (49.6%) | 5,674 (48.1%) | 14,308 (36.4%) | 1,207 (36.0%) |
| Stage at Diagnosis,No. (%) | |||||
| I-II | 10,182 (17.2%) | 1,540 (31.7%) | 2,554 (21.6%) | 5,173 (13.2%) | 915 (27.3%) |
| III | 13,391 (22.6%) | 920 (18.9%) | 2,649 (22.4%) | 9,722 (24.7%) | 100 (3.0%) |
| IV | 31,874 (53.7%) | 1,825 (37.5%) | 5,495 (46.5%) | 22,614 (57.5%) | 1,940 (57.8%) |
| Death within 6 Months of Diagnosis,No. (%) | |||||
| No | 31,534 (53.1%) | 3,595 (73.9%) | 6,677 (56.6%) | 18,512 (47.1%) | 2,750 (81.9%) |
| Yes | 27,821 (46.9%) | 1,267 (26.1%) | 5,129 (43.4%) | 20,818 (52.9%) | 607 (18.1%) |
| Demographic Characteristics | |||||
| Age at Diagnosis, mean years (SD) | 76 (8) | 77 (9) | 79 (8) | 76 (7) | 77 (8) |
| Age at Death, mean years (SD) | 77 (8) | 79 (9) | 80 (8) | 76 (7) | 79 (8) |
| Year of Death,No. (%) | |||||
| 2011 | 5,994 (10.1%) | 311 (6.4%) |
1,187 (10.1%) | 4,318 (11.0%) | 178 (5.3%) |
| 2012 | 11,099 (18.7%) | 679 (14.0%) | 2,078 (17.6%) | 7,859 (20.0%) | 483 (14.4%) |
| 2013 | 13,267 (22.4%) | 1,044 (21.5%) | 2,597 (22.0%) | 8,933 (22.7%) | 693 (20.6%) |
| 2014 | 14,130 (23.8%) | 1,286 (26.5%) | 2,883 (24.4%) | 9,016 (22.9%) | 945 (28.2%) |
| 2015 | 14,865 (25.0%) | 1,542 (31.7%) | 3,061 (25.9%) | 9,204 (23.4%) | 1,058 (31.5%) |
| Sex,No. (%) | |||||
| Female | 29,187 (49.2%) | 4,809 (98.9%) | 6,209 (52.6%) | 18,169 (46.2%) | 0.00 (0.0%) |
| Male | 30,168 (50.8%) | 53 (1.1%) |
5,597 (47.4%) | 21,161 (53.8%) | 3,357 (100.0%) |
| Race/Ethnicity,No. (%) | |||||
| White | 46,765 (78.8%) | 3,758 (77.3%) | 8,844 (74.9%) | 31,665 (80.5%) | 2,498 (74.4%) |
| Black | 5,863 (9.9%) | 616 (12.7%) | 1,328 (11.2%) | 3,453 (8.8%) | 466 (13.9%) |
| Hispanic | 3,261 (5.5%) | 274 (5.6%) |
855 (7.2%) |
1,892 (4.8%) | 240 (7.1%) |
| Other^ | 3,466 (5.8%) | 214 (4.4%) |
779 (6.6%) |
2,320 (5.9%) | 153 (4.6%) |
| Marital Status,No. (%) | |||||
| Married | 27,345 (46.1%) | 1,556 (32.0%) | 4,851 (41.1%) | 19,123 (48.6%) | 1,815 (54.1%) |
| Not Married | 28,942 (48.8%) | 2,957 (60.8%) | 6,340 (53.7%) | 18,507 (47.1%) | 1,138 (33.9%) |
| Geographic/Socioeconomic Characteristics | |||||
| U.S. Region at Death,No. (%) | |||||
| Northeast | 10,936 (18.4%) | 968 (19.9%) | 2,297 (19.5%) | 7,056 (17.9%) | 615 (18.3%) |
| Midwest | 7,337 (12.4%) | 606 (12.5%) | 1,436 (12.2%) | 4,898 (12.5%) | 397 (11.8%) |
| South | 17,370 (29.3%) | 1,349 (27.7%) | 3,113 (26.4%) | 12,050 (30.6%) | 858 (25.6%) |
| West | 23,679 (39.9%) | 1,936 (39.8%) | 4,951 (41.9%) | 15,306 (38.9%) | 1,486 (44.3%) |
| Population in County of Residence,No. (%) | |||||
| 249,999 or less | 16,477 (27.8%) | 1,231 (25.3%) | 3,136 (26.6%) | 11,195 (28.5%) | 915 (27.3%) |
| 250,000 to 999,999 | 12,507 (21.1%) | 1,014 (20.9%) | 2,473 (20.9%) | 8,298 (21.1%) | 722 (21.5%) |
| 1,000,000 or more | 30,318 (51.1%) | 2,613 (53.7%) | 6,183 (52.4%) | 19,804 (50.4%) | 1,718 (51.2%) |
| Rural/Urban Area at Diagnosis,No. (%) | |||||
| All rural | 5,425 (9.1%) | 374 (7.7%) |
993 (8.4%) |
3,761 (9.6%) | 297 (8.8%) |
| All urban | 34,935 (58.9%) | 2,917 (60.0%) | 7,194 (60.9%) | 22,907 (58.2%) | 1,917 (57.1%) |
| Mostly rural | 5,100 (8.6%) | 348 (7.2%) |
889 (7.5%) |
3,564 (9.1%) | 299 (8.9%) |
| Mostly urban | 13,058 (22.0%) | 1,021 (21.0%) | 2,590 (21.9%) | 8,731 (22.2%) | 716 (21.3%) |
| Poverty,No. (%) | |||||
| 0%-<5% poverty | 10,204 (17.2%) | 918 (18.9%) | 2,032 (17.2%) | 6,634 (16.9%) | 620 (18.5%) |
| 5% to <10% poverty | 14,420 (24.3%) | 1,234 (25.4%) | 2,856 (24.2%) | 9,497 (24.1%) | 833 (24.8%) |
| 10% to <20% poverty | 18,223 (30.7%) | 1,371 (28.2%) | 3,625 (30.7%) | 12,237 (31.1%) | 990 (29.5%) |
| 20% to 100% poverty | 15,092 (25.4%) | 1,243 (25.6%) | 3,048 (25.8%) | 9,943 (25.3%) | 858 (25.6%) |
| State Buy-in,No. (%) | |||||
| No | 45,838 (77.2%) | 3,640 (74.9%) | 8,748 (74.1%) | 30,745 (78.2%) | 2,705 (80.6%) |
| Yes | 13,517 (22.8%) | 1,222 (25.1%) | 3,058 (25.9%) | 8,585 (21.8%) | 652 (19.4%) |
Sources: SEER-Medicare Dataset, Census Tract File. ^Cell sizes were too small to show races within the “Other” category.
Table 2.
Multivariable Regression Results: Medicare Spending in the Last 30 Days of Life (Full Sample).
Table 2.
Multivariable Regression Results: Medicare Spending in the Last 30 Days of Life (Full Sample).
| All Cancers | Breast | Colorectal | Lung | Prostate | |
|---|---|---|---|---|---|
| Coefficient (95% CI) | Coefficient (95% CI) | Coefficient (95% CI) | Coefficient (95% CI) | Coefficient (95% CI) | |
| Clinical Predictors | |||||
| NCI Comorbidity Index | 1.06*** (1.03 to 1.09) |
0.99*** (0.87 to 1.10) |
1.07*** (0.99 to 1.15) |
1.10*** (1.06 to 1.14) |
0.94*** (0.80 to 1.08) |
| Performance Status | |||||
| Not Poor | 0 [Reference] | 0 [Reference] | 0 [Reference] | 0 [Reference] | 0 [Reference] |
| Poor | -5.36*** (-5.53 to -5.20) |
-4.62*** (-5.18 to -4.06) |
-6.31*** (-6.71 to -5.92) |
-5.33*** (-5.52 to -5.13) |
-4.43*** (-5.17 to -3.68) |
| Stage at Diagnosis | |||||
| I-II | 0 [Reference] | 0 [Reference] | 0 [Reference] | 0 [Reference] | 0 [Reference] |
| III | 0.37** (0.13 to 0.61) |
0.52 (-0.20 to 1.25) |
-0.83** (-1.38 to -0.29) |
0.89*** (0.58 to 1.19) |
0.82 (-1.21 to 2.85) |
| IV | 0.39*** (0.18 to 0.60) |
1.62*** (1.01 to 2.23) |
-1.72*** (-2.20 to -1.24) |
1.09*** (0.81 to 1.37) |
1.04** (0.26 to 1.81) |
| Demographic Predictors | |||||
| Age at Diagnosis | -0.05*** (-0.06 to -0.04) |
-0.16*** (-0.19 to -0.13) |
-0.04** (-0.06 to -0.01) |
-0.06*** (-0.07 to -0.05) |
-0.08*** (-0.12 to -0.03) |
| Sex | |||||
| Male | 0 [Reference] | 0 [Reference] | 0 [Reference] | 0 [Reference] | |
| Female | 0.33*** (0.16 to 0.49) |
1.97 (-0.69 to 4.62) |
0.18 (-0.22 to 0.58) |
0.34*** (0.15 to 0.54) |
|
| Race/Ethnicity | |||||
| White | 0 [Reference] | 0 [Reference] | 0 [Reference] | 0 [Reference] | 0 [Reference] |
| Black | 0.91*** (0.63 to 1.19) |
1.72*** (0.83 to 2.61) |
0.50 (-0.15 to 1.15) |
0.87*** (0.52 to 1.21) |
0.80 (-0.36 to 1.96) |
| Hispanic | 0.03 (-0.33 to 0.38) |
-0.33 (-1.53 to 0.88) |
-0.46 (-1.23 to 0.31) |
0.18 (-0.26 to 0.63) |
-0.66 (-2.11 to 0.79) |
| Other^ | 0.91*** (0.56 to 1.27) |
-0.17 (-1.55 to 1.22) |
0.13 (-0.68 to 0.95) |
1.20*** (0.78 to 1.62) |
1.07 (-0.69 to 2.82) |
| Marital Status | |||||
| Married | 0 [Reference] | 0 [Reference] | 0 [Reference] | 0 [Reference] | 0 [Reference] |
| Not Married | 0.16 (-0.01 to 0.33) |
-0.33 (-0.92 to 0.27) |
0.14 (-0.27 to 0.55) |
0.20* (0.00 to 0.40) |
0.15 (-0.60 to 0.89) |
| Geographic/Socioeconomic Predictors | |||||
| U.S. Region at Death | |||||
| Northeast | 0 [Reference] | 0 [Reference] | 0 [Reference] | 0 [Reference] | 0 [Reference] |
| Midwest | -1.40*** (-1.69 to -1.11) |
-1.25** (-2.22 to -0.27) |
-1.62*** (-2.33 to -0.92) |
-1.36*** (-1.70 to -1.01) |
-1.18 (-2.5 to 0.14) |
| South | -2.32*** (-2.59 to -2.06) |
-2.16*** (-3.06 to -1.27) |
-2.30*** (-2.94 to -1.66) |
-2.26*** (-2.57 to -1.95) |
-2.53*** (-3.74 to -1.32) |
| West | -0.66*** (-0.89 to -0.43) |
-0.37 (-1.14 to 0.41) |
-0.74** (-1.28 to -0.19) |
-0.67*** (-0.94 to -0.40) |
-0.21 (-1.23 to 0.82) |
| Population in County of Residence | |||||
| 249,999 or less | 0 [Reference] | 0 [Reference] | 0 [Reference] | 0 [Reference] | 0 [Reference] |
| 250,000 – 999,999 | 0.56*** (0.32 to 0.81) |
0.83 (-0.03 to 1.70) |
1.07*** (0.46 to 1.68) |
0.46** (0.17 to 0.75) |
-0.18 (-1.29 to 0.93) |
| 1,000,000 or more | 1.33*** (1.10 to 1.57) |
1.91*** (1.09 to 2.73) |
1.44*** (0.86 to 2.03) |
1.23*** (0.95 to 1.51) |
1.17* (0.11 to 2.24) |
| Rural/Urban Area at Diagnosis | |||||
| All urban | 0 [Reference] | 0 [Reference] | 0 [Reference] | 0 [Reference] | 0 [Reference] |
| All rural | -0.62*** (-0.95 to -0.30) |
0.09 (-1.09 to 1.27) |
-0.65 (-1.45 to 0.15) |
-0.61*** (-0.98 to -0.23) |
-1.97** (-3.4 to -0.53) |
| Mostly rural | -0.77*** (-1.08 to -0.46) |
0.79 (-0.33 to 1.91) |
-0.65 (-1.45 to 0.15) |
-0.93*** (-1.29 to -0.57) |
-0.87 (-2.22 to 0.48) |
| Mostly urban | -0.55*** (-0.76 to -0.34) |
-0.43 (-1.15 to 0.29) |
-0.39 (-0.91 to 0.13) |
-0.59*** (-0.84 to -0.34) |
-1.15* (-2.11 to -0.19) |
| Poverty | |||||
| 0% – <5% poverty | 0 [Reference] | 0 [Reference] | 0 [Reference] | 0 [Reference] | 0 [Reference] |
| 5% – <10% poverty | -0.10 (-0.35 to 0.14) |
-0.27 (-1.08 to 0.53) |
0.16 (-0.44 to 0.76) |
-0.11 (-0.40 to 0.18) |
-1.22* (-2.3 to -0.15) |
| 10% – <20% poverty | 0.07 (-0.18 to 0.31) |
0.48 (-0.35 to 1.31) |
0.76* (0.16 to 1.35) |
-0.19 (-0.48 to 0.10) |
-0.45 (-1.55 to 0.65) |
| 20% – 100% poverty | 0.09 (-0.18 to 0.36) |
-0.03 (-0.94 to 0.89) |
1.05** (0.40 to 1.70) |
-0.14 (-0.46 to 0.18) |
-0.90 (-2.09 to 0.3) |
| State Buy-in | |||||
| No | 0 [Reference] | 0 [Reference] | 0 [Reference] | 0 [Reference] | 0 [Reference] |
| Yes | 0.72*** (0.52 to 0.93) |
0.31 (-0.38 to 1.00) |
0.18 (-0.30 to 0.66) |
0.86*** (0.61 to 1.10) |
1.19* (0.2 to 2.18) |
Sources: SEER-Medicare Dataset, Census Tract File. ^Cell sizes were too small to show races within the “Other” category. Notes: * P-Value < 0.05; ** P-Value < 0.01; *** P-Value < 0.001.
Table 3.
Multivariable Regression Results: Medicare Spending in the Last 30 Days of Life (Sensitivity Sample).
Table 3.
Multivariable Regression Results: Medicare Spending in the Last 30 Days of Life (Sensitivity Sample).
| All Cancers | Breast | Colorectal | Lung | Prostate | |
|---|---|---|---|---|---|
| Coefficient (95% CI) | Coefficient (95% CI) | Coefficient (95% CI) | Coefficient (95% CI) | Coefficient (95% CI) | |
| Clinical Predictors | |||||
| NCI Comorbidity Index | 0.94*** (0.89 to 0.98) |
0.90*** (0.69 to 1.11) |
0.82*** (0.71 to 0.93) |
1.01*** (0.96 to 1.07) |
0.79*** (0.49 to 1.09) |
| Performance Status | |||||
| Not Poor | 0 [Reference] | 0 [Reference] | 0 [Reference] | 0 [Reference] | 0 [Reference] |
| Poor | -4.98*** (-5.24 to -4.73) |
-3.83*** (-4.89 to -2.76) |
-5.81*** (-6.41 to -5.20) |
-5.00*** (-5.29 to -4.72) |
-4.39*** (-6.08 to -2.69) |
| Stage at Diagnosis | |||||
| I-II | 0 [Reference] | 0 [Reference] | 0 [Reference] | 0 [Reference] | 0 [Reference] |
| III | -1.35*** (-1.78 to -0.92) |
0.81 (-1.09 to 2.70) |
-0.55 (-1.41 to 0.32) |
-0.25 (-0.80 to 0.29) |
7.53 (-2.20 to 17.26) |
| IV | -2.24*** (-2.62 to -1.86) |
0.86 (-0.58 to 2.30) |
-4.71*** (-5.43 to -4.00) |
-0.60* (-1.10 to -0.10) |
4.02*** (1.90 to 6.14) |
| Demographic Predictors | |||||
| Age at Diagnosis | -0.08*** (-0.10 to -0.06) |
-0.20*** (-0.26 to -0.13) |
-0.05** (-0.09 to -0.02) |
-0.12*** (-0.14 to -0.10) |
-0.04 (-0.14 to 0.06) |
| Sex | |||||
| Male | 0 [Reference] | 0 [Reference] | 0 [Reference] | 0 [Reference] | |
| Female | 0.49*** (0.26 to 0.72) |
1.44 (-3.87 to 6.76) |
-0.12 (-0.71 to 0.46) |
0.59*** (0.33 to 0.85) |
|
| Race/Ethnicity | |||||
| White | 0 [Reference] | 0 [Reference] | 0 [Reference] | 0 [Reference] | 0 [Reference] |
| Black | 0.66** (0.26 to 1.07) |
0.83 (-0.79 to 2.45) |
0.23 (-0.74 to 1.20) |
0.66** (0.19 to 1.12) |
0.87 (-1.57 to 3.31) |
| Hispanic | -0.12 (-0.64 to 0.40) |
-1.89 (-4.28 to 0.50) |
-1.37* (-2.55 to -0.19) |
0.27 (-0.33 to 0.86) |
-1.07 (-4.36 to 2.22) |
| Other^ | 0.72** (0.20 to 1.23) |
-1.28 (-4.00 to 1.44) |
0.27 (-0.98 to 1.52) |
0.97*** (0.40 to 1.54) |
2.67 (-2.85 to 8.19) |
| Marital Status | |||||
| Married | 0 [Reference] | 0 [Reference] | 0 [Reference] | 0 [Reference] | 0 [Reference] |
| Not Married | 0.08 (-0.16 to 0.32) |
0.42 (-0.70 to 1.55) |
0.06 (-0.54 to 0.66) |
0.01 (-0.26 to 0.27) |
-0.25 (-1.83 to 1.34) |
| Geographic/Socioeconomic Predictors | |||||
| U.S. Region at Death | |||||
| Northeast | 0 [Reference] | 0 [Reference] | 0 [Reference] | 0 [Reference] | 0 [Reference] |
| Midwest | -1.66*** (-2.07 to -1.24) |
-2.08* (-3.81 to -0.35) |
-1.58** (-2.60 to -0.57) |
-1.65*** (-2.12 to -1.18) |
-2.36 (-5.37 to 0.65) |
| South | -2.83*** (-3.21 to -2.46) |
-3.71*** (-5.29 to -2.12) |
-2.27*** (-3.21 to -1.34) |
-2.72*** (-3.15 to -2.30) |
-5.02*** (-7.71 to -2.34) |
| West | -0.92*** (-1.25 to -0.59) |
-1.26 (-2.66 to 0.14) |
-0.97* (-1.77 to -0.17) |
-0.85*** (-1.22 to -0.47) |
-1.50 (-3.81 to 0.82) |
| Population in County of Residence | |||||
| 249,999 or less | 0 [Reference] | 0 [Reference] | 0 [Reference] | 0 [Reference] | 0 [Reference] |
| 250,000 – 999,999 | 0.42* (0.07 to 0.77) |
1.19 (-0.42 to 2.80) |
0.60 (-0.28 to 1.48) |
0.36 (-0.03 to 0.75) |
-0.10 (-2.53 to 2.34) |
| 1,000,000 or more | 1.25*** (0.91 to 1.58) |
1.67* (0.15 to 3.19) |
1.34** (0.49 to 2.20) |
1.22*** (0.85 to 1.60) |
1.31 (-0.99 to 3.61) |
| Rural/Urban Area at Diagnosis | |||||
| All urban | 0 [Reference] | 0 [Reference] | 0 [Reference] | 0 [Reference] | 0 [Reference] |
| All rural | -0.60* (-1.05 to -0.14) |
1.00 (-1.16 to 3.16) |
-1.20* (-2.35 to -0.04) |
-0.58* (-1.09 to -0.07) |
-2.05 (-5.51 to 1.41) |
| Mostly rural | -0.79** (-1.23 to -0.34) |
1.24 (-0.83 to 3.31) |
-1.24* (-2.41 to -0.08) |
-0.76** (-1.26 to -0.27) |
-0.68 (-3.90 to 2.55) |
| Mostly urban | -0.48** (-0.79 to -0.18) |
-0.17 (-1.53 to 1.19) |
-0.85* (-1.60 to -0.09) |
-0.49** (-0.83 to -0.15) |
-0.61 (-2.61 to 1.38) |
| Poverty | |||||
| 0% – <5% poverty | 0 [Reference] | 0 [Reference] | 0 [Reference] | 0 [Reference] | 0 [Reference] |
| 5% – <10% poverty | -0.02 (-0.38 to 0.34) |
-0.62 (-2.11 to 0.86) |
0.09 (-0.79 to 0.97) |
0.02 (-0.38 to 0.42) |
0.23 (-2.19 to 2.65) |
| 10% – <20% poverty | 0.08 (-0.28 to 0.43) |
-0.50 (-2.03 to 1.03) |
0.84 (-0.04 to 1.71) |
-0.12 (-0.52 to 0.28) |
1.29 (-1.31 to 3.89) |
| 20% – 100% poverty | 0.12 (-0.27 to 0.51) |
0.34 (-1.40 to 2.07) |
0.76 (-0.19 to 1.72) |
-0.10 (-0.54 to 0.34) |
1.73 (-0.92 to 4.39) |
| State Buy-in | |||||
| No | 0 [Reference] | 0 [Reference] | 0 [Reference] | 0 [Reference] | 0 [Reference] |
| Yes | 0.75*** (0.46 to 1.04) |
0.02 (-1.27 to 1.31) |
0.54 (-0.17 to 1.25) |
0.83*** (0.50 to 1.16) |
0.00 (-2.19 to 2.20) |
Sources: SEER-Medicare Dataset, Census Tract File. ^Cell sizes were too small to show races within the “Other” category. Notes: * P-Value < 0.05; ** P-Value < 0.01; *** P-Value < 0.001.
Disclaimer/Publisher’s Note: The statements, opinions and data contained in all publications are solely those of the individual author(s) and contributor(s) and not of MDPI and/or the editor(s). MDPI and/or the editor(s) disclaim responsibility for any injury to people or property resulting from any ideas, methods, instructions or products referred to in the content. |
© 2025 by the authors. Licensee MDPI, Basel, Switzerland. This article is an open access article distributed under the terms and conditions of the Creative Commons Attribution (CC BY) license (http://creativecommons.org/licenses/by/4.0/).
Copyright: This open access article is published under a Creative Commons CC BY 4.0 license, which permit the free download, distribution, and reuse, provided that the author and preprint are cited in any reuse.


