Submitted:
09 January 2025
Posted:
09 January 2025
You are already at the latest version
Abstract
The present study seeks to analyze the impact of the externalities of investments in infrastructure on economic growth in Peru during the period 2000-2022. The research methodology is basic, quantitative approach, non-experimental, longitudinal design with explanatory scope, based on Solow's augmented model of economic growth. The OLS results indicate that the coefficient of variation of private income and the labor force is significantly and positively explained by GDP with an adjusted R2 of 0.94 that explains the variability of the model; Regarding the impact, the VAR model is used with impulse response tests and variance imbalance where it was found that investments in infrastructure and the workforce have a positive and significant impact on GDP. It is concluded that investments in infrastructure, especially private ones, have had a positive and significant impact on the economic growth of Peru during the period 2000-2022. These investments have acted as a key driver for the recovery and increase in GDP and thus the reduction of unemployment, while externalities, such as improvements in connectivity and productivity, have been fundamental to strengthen long-term economic development.
Keywords:
economic growth
; infrastructure investment
; workforce
; Solow model
1. Introduction
Infrastructure investment has been widely recognized as a key driver of global economic growth. In the international context, countries such as China and the United States have prioritized the modernization of their infrastructure to increase competitiveness and improve the quality of life of their citizens. According to a World Bank report, infrastructure investments in developing countries could raise GDP growth by 2% in the long term (Grupo Banco Mundial, 2021). This explains why countries that consistently invest in infrastructure achieve higher rates of sustained growth and more inclusive development. For example, Australia, China and Japan have exceeded their investment projections and need less of GDP for future investment. In contrast, Germany, the United Kingdom and the United States face significant gaps between their current spending and what is required to meet their spending needs (Thinking Heads, 2024). However, the challenges posed by the recent crisis indicate that infrastructure improvements for basic services account for up to 4.5% of GDP annually, and developing countries will need $2.4 trillion per year over the next seven years to address costs related to climate change, conflict and pandemics (Guangzhe, 2023).
At the regional level, Latin America faces a significant infrastructure deficit. The Inter-American Development Bank (IDB) states that the region needs to invest at least 3.2% of its GDP annually until 2030 to close the infrastructure gap and ensure sustained growth in line with the Sustainable Development Goals (SDGs) (Brichetti et al., 2021). However, in recent years, public investment in infrastructure in Latin American countries has averaged only 2% of their GDP, which has limited their growth potential and international competitiveness (BID, 2020). With respect to private investment in infrastructure, it is reported that, although improvements have been evidenced, it was reduced by 48%, in contrast to the average of the last 5 years, also considering the effects of the pandemic. (Grupo Banco Mundial, 2021). Despite this, some countries have made progress in key sectors, such as Brazil, Mexico and Chile, which have led investments in transportation and energy (Alvarez Pagliuca et al., 2022). The region as a whole has begun to address these challenges, with infrastructure projects aimed at improving connectivity and access to basic services, although imbalances in the distribution of these investments remain a considerable challenge.
The Peruvian case is illustrative of this problem. According to the National Institute of Statistics and Informatics (INEI), the Peruvian economy has experienced an average annual growth rate of 3.8% over the last 7 decades (INEI, 2020). Likewise, a sharp drop in GDP caused by the pandemic (10.9%) was experienced, followed by a rebound in 2021 due to economic stimulus measures (Grupo Banco Mundial, 2024). GDP in 2023 is reported to fall by 0.55%, mainly due to the decline in the manufacturing, trade and agriculture and fishing sectors (Comexperu, 2024). Another report reveals that this growth has been marred by infrastructure deficiencies, including lack of access to basic services, inefficient transportation, inefficient land acquisition and the elimination of interferences (Comexperu, 2024). In this regard, it is reported that Peru ranks 88th in the infrastructure pillar, among 141 economies evaluated. It is below countries such as Colombia, Brazil, Argentina, Mexico and Chile (Gonzales, 2021). Moreover, it is estimated that the investment needed to close this gap could amount to USD 14.5 billion for the period 2019-2038, highlighting the urgency of adopting effective policies in this area (Bonifaz et al., 2020).
In this sense, infrastructure acts as a catalyst that can amplify the positive effects of economic policies, creating an enabling environment for private investment and innovation.
Therefore, this study focuses on analyzing the impact of externalities of infrastructure investments and economic growth in Peru during the period 2000-2022. It seeks to provide a framework for understanding how externalities, derived from the analysis of how infrastructure investments have affected the country's economic growth. By addressing this issue, it is expected to contribute to the debate on public policies in Peru and their relationship with sustainable economic development.
This study is relevant because it seeks to analyze how these public and private infrastructure investments influence economic growth, especially in the Peruvian context, where infrastructure investments have been the subject of debate and political attention in recent decades.
The importance of this study lies in the need to provide empirical evidence on the relationship between infrastructure investments and economic growth in a developing country like Peru. Understanding this relationship can inform public policies and investment decisions, contributing to the design of more effective strategies to boost economic development. In addition, the analysis of the externalities generated by investments can provide a more complete picture of their impact on society.
The research will cover the period 2000-2022, analyzing data on gross public and private fixed investment, employed EAP and GDP based on the Solow economic growth model. Econometric models will be applied to determine the relationship between the variables and will evaluate changes in the impact of infrastructure investments in two specific contexts: the 2008-2009 international crisis and the COVID-19 pandemic. This approach will allow us to draw conclusions on the effectiveness of infrastructure investment policies on the country's economic growth.
Among the main limitations of this research is the reliance on secondary data, which may affect the accuracy of the analysis due to the quality or availability of the information. Also, the externalities of investments may be difficult to measure, as many of the benefits, such as social cohesion or environmental sustainability, are not directly quantified. Another limitation is that the specific context of Peru may not be fully extrapolable to other countries in the region, which restricts the general applicability of the findings.
The findings of this study not only contribute to the academic debate on economic development in developing countries, but also provide useful information for policy makers, helping to formulate more effective strategies to optimize the social and economic impact of infrastructure investments. Through a rigorous approach, this research seeks to enrich knowledge on the subject and suggest practical recommendations for the future.
2. Literature Review
2.1. Economic Growth
Economic growth is a key concept in economic theory, since it implies a sustained increase in the productive capacity of an economy, measured through an increase in Gross Domestic Product (GDP). Several authors have addressed this phenomenon, highlighting the importance of factors such as capital accumulation, technological progress and efficiency in the allocation of resources. Endogenous growth theory, proposed by authors such as Romer (1990) and Lucas (1988), argues that economic growth is generated internally, driven by innovation, investment in human capital and knowledge. According to this theory, policies that promote education, technological innovation and investments in infrastructure are fundamental to achieving sustained growth (Romer, 1990).
On the other hand, Solow (1956), in his neoclassical growth model, emphasized the role of capital accumulation, the importance of investments in physical infrastructure to increase productivity and, therefore, economic growth. In the case of Peru, investments in sectors such as transportation, energy and telecommunications have been essential to improve productivity and reduce regional inequalities, which is in line with the postulates of these models. In addition to the neoclassical and endogenous theories already mentioned, the business cycle theory of Schumpeter (1939) is relevant. The author proposed that growth is driven by innovation and boom and bust cycles, where technological advances create new opportunities that increase output and welfare. Infrastructure investments can generate such cycles by facilitating the emergence of new industries and increasing productivity.
Another perspective is the staged growth theory of Rostow (1991), who argues that economies must go through five stages of growth, and adequate infrastructure is key to the transition between them, particularly in the "take-off" and "maturity" phases. In the Peruvian case, infrastructure investments since 2000 have allowed progress in the consolidation of productive sectors and regional economic development.
Finally, the theory of inclusive growth of authors such as Ranis & Stewart (2005) focuses on how growth must be accompanied by an equitable distribution of its benefits in order to be sustainable in the long term. Infrastructure investments that improve access to services and connectivity in rural areas can contribute to this type of growth, promoting economic inclusion.
2.2. Infrastructure Investments
Infrastructure investments have been extensively studied in the context of economic growth. Economic theory recognizes that infrastructure is a public good that improves the efficiency of economies and generates positive externalities.
In this sense, Keynesian theories emphasize the importance of public spending on infrastructure as a way to stimulate aggregate demand and reactivate the economy. Keynes (1936) argued that, in periods of recession, public investments in infrastructure can revive the economy by generating employment and increasing demand for goods and services. Authors such as Aschauer (1989) have shown that investments in public infrastructure can increase private sector productivity, which boosts economic growth. According to Aschauer (1989) infrastructure contributes directly to growth by reducing production costs and increasing operational efficiency.
The basic needs theory of Doyal & Gough (1991) also highlights the importance of infrastructure, especially in areas such as drinking water, education and health, to meet the basic needs of the population and ensure human development. According to this perspective, investments in infrastructure not only contribute to economic growth, but also improve people's quality of life and enable developing economies to achieve inclusive growth.
On the other hand, the convergence theory of the Barro & Sala-i-Martin (1995) suggests that, if sufficient infrastructure investments are made, poorer regions can grow faster than richer ones, closing development gaps. This is particularly relevant for the Peruvian case, where regional inequalities are significant. In the Peruvian context, as mentioned above, the infrastructure gap is estimated to cost USD 14.5 billion, underscoring the need for policies that promote greater investment in this area.
2.3. Externalities of Infrastructure Investments
Externalities are side effects of an economic action that affect third parties not directly involved in the transaction. In the case of infrastructure investments, they generate both positive and negative externalities. According to Prud’homme, (2005), positive externalities of infrastructure include improved social welfare, job creation and poverty reduction. In the Peruvian context, infrastructure investments have had important impacts in rural areas, where access to basic services has improved significantly.
However, there are also negative externalities associated with infrastructure investments, such as environmental degradation and unequal access to services. Arrow (1969) and Coase (1960), in their analysis of externalities, suggest that government intervention is necessary to regulate these effects and ensure that the benefits of investments are distributed equitably. In Peru, challenges related to the planning and execution of infrastructure projects have generated problems of corruption and cost overruns, which limit the potential benefits of these investments.
2.4. Hypothesis
2.4.1. General Hypothesis
The externalities derived from infrastructure investments have a positive impact on economic growth in Peru between 2000 and 2022, contributing to the development of key sectors of the economy.
2.4.2. Specific Hypotheses
Infrastructure investments (public and private) have a positive and significant influence on Peru's economic growth during the period 2000-2022.
Infrastructure investments in Peru between 2000 and 2022 have shown a growing dynamic, reflected in the increase of public and private infrastructure, with direct effects on the expansion of the labor force and economic growth.
Investments in public and private infrastructure have a positive relationship in both the short and long term with Peru's economic growth, showing differential effects depending on the type of infrastructure.
The interaction between infrastructure investments and the labor force has boosted Peru's economic growth by generating a virtuous cycle in which improved infrastructure facilitates access to employment and improves labor productivity.
3. Materials and Methods
3.1. Research approach and type of research
The research approach is quantitative, which involves the collection and analysis of numerical data to test hypotheses and determine patterns among the variables analyzed. Hernández Sampieri et al. (2014) point out that this approach makes it possible to objectively measure relationships between variables using statistical tools.
The level of research is explanatory, because it seeks to analyze how infrastructure investment (public and private) influences economic growth, establishing cause-effect relationships. According to Hernández Sampieri et al. (2014), studies of this type seek to determine the reasons or causes that explain the phenomena, focusing on the "why" of these events.
3.2. Population
The study population is made up of historical data on GDP growth, infrastructure investment and the Economically Active Population (EAP). employed during the period 2000-2022. In this sense, for the GDP growth variable, information on gross domestic product was used, from which GDP growth will be measured. For the infrastructure investment variable, information on Gross Fixed Investment - Private (which measures investment in private infrastructure) and Gross Fixed Investment - Public (which measures investment in public infrastructure) was used. Finally, for the employed EAP variable, the three-month moving average of the employed EAP in thousands of people was used (see Table 1).
3.3. Sample
The sample is made up of 368 observations in total, covering the aforementioned period from 2000-2023, collecting data on a quarterly basis. Thus, 92 observations have been collected for each of the variables analyzed, based on statistics from the Central Bank of Peru (BCRP). This approach will allow us to explore the relationship between infrastructure investments and economic growth, maintaining a more direct and specific analysis in your research.
3.4. Analysis Unit
The unit of analysis corresponds to each of the observations taken for each variable: economic growth, public infrastructure investment, private infrastructure investment and employed EAP, at a point in time.
3.5. Data Collection Techniques and Instruments
3.5.1. Techniques
The main technique in this study is documentary analysis, which involves the review of secondary sources such as government reports, official statistics, and previous studies on infrastructure investments and economic growth. In this sense, in order to obtain the information, an exploration of the statistics of the Central Bank of Peru (BCRP) available on the institution's web page, which is of public use, was carried out.
3.5.2. Instruments
The instrument used is the data registration form, which will be used to organize and systematize the key information obtained from the documentary analysis, allowing its classification for subsequent analysis.
3.6. Data Processing and Analysis Techniques
3.6.1. Methodological process
The implementation of the econometric analysis will be done through VAR (Vector Autoregression) or VEC (Vector Error Correction) models, which can be broken down into several methodical steps.
3.6.2. Stationarity Analysis
Before estimating any model, it is crucial to verify whether the time series are stationary. For this purpose, the Augmented Dickey-Fuller (ADF) unit root test will be used to detect the presence of unit roots. This is done since; a VAR model requires the series to be stationary. If they are not, they must be differentiated.
3.6.3. Cointegration test
If the series are not stationary in levels, but are stationary in differences, it would indicate that they are integrated of order 1, so a cointegration test should be performed to verify the existence of long-term relationships. For this purpose, the Johansen test will be used to identify the number of cointegrating vectors and estimate a VEC model if cointegration exists.
3.6.4. Model Estimation
Model estimation comprises the VAR and VEC models. In stationary series, a VAR model is estimated by selecting the optimal number of lags using criteria such as AIC (Akaike Information Criterion) or BIC (Bayesian Information Criterion). On the other hand, when there is cointegration, a VEC model is estimated that will include error correction terms to capture the short-run dynamics while maintaining the long-run relationship between the variables.
On the one hand, we will evaluate the Impulse-Response functions, which analyze how a shock in infrastructure investment impacts economic growth over time. This analysis will help to understand the temporality of the effects. Next, Variance Decomposition, which will allow us to observe what proportion of the variation in economic growth can be attributed to shocks in infrastructure investment and other factors over time.
Finally, the Granger causality test, which will assess whether one time series, in this case infrastructure investments and labor force, can predict another time series, in this case economic growth, will be performed.
4. Solow model: Details and Mathematical Formulation
4.1. Basic Solow Model (1956)
4.1.1. Production Function
The production function in the model of Solow (1956) captures how the output of an economy relates to capital and labor inputs, adjusted by a technology factor. The production function in the Solow model is generally represented as a Cobb-Douglas function :
where:
- is the total product (GDP).
- is the labor force.
- is the capital stock.
- is the elasticity of output with respect to capital (usually ).
This function indicates that total output depends on the amount of capital and labor used in production. The relationship is based on the assumption of constant returns to scale.
4.1.2. Capital Accumulation
The dynamics of capital is given by the equation:
where:
- is the rate of change of capital.
- is the capital investment.
- is the capital depreciation rate, which reflects the loss of capital value over time.
4.1.3. Labor Force Dynamics
The labor force can be expressed as:
where:
- is the initial labor force.
- is the labor force growth rate, which can be estimated from demographic data.
4.1.4. Steady State
The steady state is reached when capital per capita and output per worker stabilize. The steady state condition is expressed as:
where:
- is the capital per worker in the steady state.
- is the savings or investment rate.
In this state, the economy grows at a rate equal to the population growth rate and GDP per capita will remain constant.
4.2. Extended Solow Model
The extended Solow growth model developed by Romer (1990) expands Solow's classical growth model by incorporating not only physical capital () and work (), but also factors such as human capital () and technological progress (). This model allows for a richer and more accurate representation of economic growth, considering both the accumulation of factors of production and the role of knowledge and education in the development process.
The basic extended Solow model can be expressed in the following way:
where:
- is the total product over time
- is the level of productivity or technological progress over time
- is the physical capital,
- is the work, and
- is human capital over time
- Production Equation:
The production model, in terms of factors of production, is as follows:
where:
- , and are the parameters that determine the elasticity of production with respect to each of the factors of production.
4.3. Theoretical Model Adapted to the study
Although the extended Solow model offers a more complete perspective for studying economic growth, in this study we have chosen to use the basic Solow model instead of the extended model due to its simplicity and direct approach, which facilitates the analysis of the impact of infrastructure investment on economic growth without the need to incorporate additional variables such as human capital or technological progress, which can be difficult to obtain and manage in contexts such as Peru.
This model allows focusing on physical capital and its relationship to gross domestic product (GDP), using more accessible and reliable data on infrastructure investment and economic growth. In addition, its simplified structure reduces mathematical complexity, making the analysis more accessible and suitable for an empirical study with limited data, without losing sight of the specific research objectives. This study is based on the approach of Laurente Blanco (2023), who made use of the basic Solow model for Peruvian.
4.3.1. Production function
The production function in the Solow model will be represented as a Cobb-Douglas function:
where:
- is the total product (GDP).
- is the workforce.
- is the capital stock.
- For this study, it is defined as:
- is the elasticity of output with respect to capital (usually ).
This function indicates that total output depends on investment in infrastructure (private and public) and jobs used in production. The relationship is based on the assumption of constant returns to scale.
The dynamics of capital will be given by the equation:
where:
- is the rate of change of capital.
- is the investment in capital (in this case, in infrastructure).
- is the capital depreciation rate, which reflects the loss of capital value over time.
As mentioned above, the labor force (will be measured by the three-month moving average of the economically active population (EAP) in employment (thousands of persons), an indicator used by Laurente Blanco (2023).
4.3.2. Steady State
The steady state is reached when capital per capita and output per worker stabilize.
The steady state condition is expressed as:
where:
- is the capital per worker in the steady state.
- is the rate of savings or investment (in this case investment in infrastructure).
In this state, likewise, the economy grows at a rate equal to the rate of population growth and, in the absence of technological growth, GDP per worker will remain constant.
Gross private and public fixed investment are key indicators for measuring infrastructure investment, as they reflect the spending decisions of both the private and public sectors in the construction and maintenance of capital goods, especially in infrastructure. According to Blanchard & Perotti (2002), public investment plays a crucial role in the development of essential infrastructure such as roads, bridges, and communication networks, which in turn facilitate economic growth. On the other hand, gross private fixed investment is related to private capital allocated to infrastructure such as commercial buildings, industries and private service networks, which are also critical for growth.
Both components (private and public) are necessary to provide a complete analysis of the impact of infrastructure on the economy. Aschauer (1989) emphasizes that both public and private investment in infrastructure generate positive externalities, stimulating economic growth and productivity improvement, which justifies their use as indicators of infrastructure investment. In this sense, there are several studies that have used private and public investment, such as the study of Romero Escalante (2023), which justifies the use of these indicators in this study.
On the other hand, gross fixed investment is a widely used measure to estimate the stock of capital in the economy, since it reflects the acquisition of fixed capital goods, such as machinery, infrastructure and equipment, which are incorporated into the production process. According to Griliches (1994) argues that investment in physical assets, recorded in gross fixed investment, adequately reflects capital accumulation, which is crucial for economic growth. In this regard, there are studies such as Akinbode et al. (2021), who uses the extended Solow model approach, and Abina & Mogbeyiteren (2021), which use gross fixed investment as a proxy for the capital stock, thus also justifying the introduction of infrastructure investment (private and public) in the Solow model equation.
5. Results
5.1. Evolution of variables
Figure 1 shows the evolution of the main variables (PBI, I_PRI, I_PUB y PEA) over the period 2000-2023. Each line shows how these variables have changed over time. The GDP graph shows a clearly increasing trend. Throughout the period, sustained GDP growth is observed, with some moments of deceleration or moderate falls. These declines may correspond to internal or external economic crises, such as the 2008 global financial crisis or the COVID-19 pandemic in 2020, which may have temporarily slowed economic growth.
Private Infrastructure Investment also shows a general growth trend, although with greater volatility than GDP. Significant peaks can be observed that coincide with periods of higher economic growth, which reinforces the relationship between private investment and GDP growth observed in the regression results. Sharp drops may be associated with economic crises or changes in investment policies.
The Private Infrastructure Investment graph shows a more stable evolution, but with lower growth compared to private investment. Public investment seems to have peaks at specific times, probably related to large government-driven infrastructure projects. The lower volatility suggests that public investment is less sensitive to economic cycles than private investment.
Finally, the labor force graph shows a steady growth of the labor force over time. This growth reflects the increase in Peru's economically active population, which has been an important factor in GDP growth, as observed in the regression model.
The evolution graphs suggest that private investment in infrastructure and GDP growth is highly correlated, while public investment has been more stable, but with less direct impact on GDP. The labor force, on the other hand, is growing steadily and seems to have a positive influence on the economy in the long run.
5.2. Descriptive Statistics
Table 2 provides an overview of the key variables (PBI, I_PRI, I_PUB, PEA) in terms of distribution over the period 2000-2023. GDP (Gross Domestic Product) averaged 98,964 million soles, with a maximum of 149,471 million soles and a minimum of 51,760 million soles. This reflects the sustained growth of the Peruvian economy in the period studied, with a considerable standard deviation of 29.677 million, indicating significant variability in the data.
With respect to I_PRI (Private Infrastructure Investment), the average was 18,183 million, with a maximum of 30,009 million and a minimum of 6,669 million. This reflects a steady increase, but with a high standard deviation (7,865 million), suggesting fluctuations in private investment.
With respect to I_PUB (Public Investment in Infrastructure) the average was 4,449 million, with a maximum of 10,377 million, the standard deviation is lower than that of private investment (2,561 million), indicating less volatility in public investment PEA (Economically Active Population). Finally, the average labor force was 4.221 million people, with a maximum of 5.106 million, the standard deviation (606) is relatively low, indicating that the labor force has grown steadily.
Additionally, skewness suggests that the distributions are more or less symmetric, except for public investment, which shows a slight positive skewness (0.77), indicating that there are more values close to the minimum. The kurtosis reveals that labor force (3.01) is closer to a normal distribution compared to the other variables. The Jarque-Bera test suggests that the data do not follow a normal distribution, with p-values less than 0.05 for all variables, however, the central limit theorem will be applied in this study, justifying the use of parametric tests.
It should be noted that the following estimates will use variables expressed on a logarithmic scale in order to linearize them and ensure greater homogeneity in their scale. In this regard, the logarithm of economic growth will be evaluated (, the logarithm of private infrastructure investment (), the logarithm of public infrastructure investment () and the logarithm of the occupied EAP ().
Table 3 shows the linear regression model (it should be noted that the variance inflation factor (VIF) was calculated to evaluate the presence of multicollinearity; it should be noted that the values were less than 10, which indicates that there is no multicollinearity among the variables included in the model) (see Appendix 1). The linear regression in Table 3 evaluates the impact of private investment, public investment and labor force on GDP growth. On the one hand, the LOGI_PRI (Private Investment in Infrastructure): The coefficient of 0.52 indicates that a 1% increase in private investment generates a 0.52 percentage point (pp) increase in GDP growth, which is highly significant (p = 0.00). This confirms that private investment is a strong driver of economic growth. On the other hand, the coefficient of LOGI_PUB (Public Investment in Infrastructure) is 0.03, but it is not statistically significant (p = 0.29), suggesting that public investment does not have a significant direct impact on GDP growth in this model. With respect to LOGPEA (Labor Force), the coefficient is 0.21 and is significant (p = 0.04), showing that a 1% increase in the labor force increases GDP growth by 0.21 pp. The labor force is therefore a positive factor for economic growth.
In addition, the adjusted R-squared (which introduces the variable penalty) is very high (0.94), indicating that the model explains 94% of the variation in GDP growth, suggesting an excellent fit. Regarding the overall significance of the model, the F-statistic indicates that the variables of the model are jointly significant in explaining GDP dynamics.
5.3. Unit Root
With respect to the unit root tests, Table 4 shows that, in levels, all variables (GDP, I_PRI, I_PUB, ADP) show high p-values (p>0.05), suggesting that they have a unit root. In first differences, the p-values are less than 0.05, which confirms that the series become stationary after differencing once. In this sense, it is confirmed that all series are integrated of first order.
5.4. Cointegration test
Table 5 shows the cointegration tests, which determine whether there is a long-run relationship between the variables. In that sense, the test statistics suggest that there is at least one significant cointegrating equation, because the null hypothesis that there are no cointegrating vectors (r=0, prob<0.05) is rejected and the hypothesis that there is at most one cointegrating vector (r=1, prob >0.05) cannot be rejected, meaning that the variables are cointegrated with a cointegrating vector and have a long-run relationship. In this sense, we proceed to estimate the error correction model.
5.5 Error Correction Vector Model
With respect to the estimated VEC model, it is observed how the long-run relationship and how the variables adjust in the short run towards their long-run relationship. In this sense, firstly, it can be seen in the Cointegration Equation that, in the long run, the coefficient of private infrastructure investment is -0.00741, which indicates that a positive change in private investment has a negative but very small (non-significant) impact on GDP in the long run. The coefficient of public infrastructure investment is -0.11261, implying that public investment also has a negative effect on GDP, but it is also not significant. Finally, the coefficient of -1.996379 shows a strong and significant negative relationship with GDP. This variable has a significant negative effect on economic growth. Likewise, the Error Correction term shows that, in the short run, the term for the speed of adjustment is (CointEq1 = -0.0839) is significant and negative, suggesting that, in the face of short-term deviations, GDP tends to adjust towards equilibrium at a moderate pace, since it is very close to -1 indicating a rapid adjustment.

Table 6.
Error Correction Vector (ECV) Estimation.
| Cointegration equation | |||||
| LOGPBI(-1) | C | LOGI_PRI(-1) | LOGI_PUB(-1) | LOGPEA(-1) | |
| coefficient | 1.00 | 6.19 | -0.00 | -0.11 | -1.99 |
| Desv. estándar | -0.15946 | -0.14086 | -0.26 | ||
| t- statistic | [-0.04] | [-0.79] | [-7.48] | ||
| Error Correction | |||||
| D(LOGPBI) | D(LOGI_PRI) | D(LOGI_PUB) | D(LOGPEA) | ||
| coefficient | -0.08 | -0.034743 | -0.204374 | 0.194744 | |
| Desv. estándar | -0.02 | -0.07666 | -0.18099 | -0.07367 | |
| t- statistic | [-3.09] | [-0.45] | [-1.12] | [ 2.64] | |
Note: The error correction vector was estimated considering three lags, given the best estimates obtained and, in addition, under the intercept specification and without trend in the cointegration equation and VAR.
Additionally, given that the logarithmic differences of the variables analyzed are stationary, the VAR model was estimated with these variables by calculating the impulse-response, variance decomposition and Granger Causality test.
5.6. Functions Impulse Response
Figure 2 shows the impulse-response function, which measures how one variable responds to a shock or impulse in another variable over time. In your study, the responses of GDP to impulses in private investment, public investment and labor force were analyzed.
It should be noted that for this study the optimal lagged test (each test at the 5% level) was performed as: LR: sequential modified LR test statistic FPE: final prediction error. AIC: Akaike information criterion. SC: Schwarz information criterion. HQ: Hannan-Quinn information criterion, which resulted in the use of four lags for the VAR model, i.e. applied to the impulse-response functions, variance decomposition and Granger causality test.
As for the Response of GDP to a shock in Private Investment, initially, GDP responds positively to a shock in private investment. The graph shows that the impact of an increase in private investment is immediate, with a significant response in the early periods. Over time, the GDP response declines slightly, but remains positive, reinforcing the role of private investment as a key driver of economic growth. The magnitude of the effect appears to stabilize, suggesting that the effects of an increase in private investment are sustained over the medium term.
As for the Response of GDP to a shock in Public Investment, the graph shows that GDP also responds positively to a shock in public investment, but the impact is considerably smaller compared to private investment. The initial response is weaker and the influence tends to dissipate more quickly. This result is consistent with the regression coefficients, where public investment showed a less significant effect on GDP. In the long run, public investment seems to have a more transitory impact compared to private investment.
As for the Response of GDP to a shock in the Labor Force, a shock in the labor force generates a positive and noticeable response in GDP. The graph shows that, following an increase in the labor force, GDP increases gradually, peaking in the early periods and then stabilizing. This result reinforces the importance of the labor force in economic growth, where a sustained increase in the number of workers would have a lasting positive effect on GDP.
5.7. Variance Decomposition
Table 7 shows the results of the variance decomposition, which indicates the relative contribution of the explanatory variables to GDP variability. In the first period, 63% of the variance of GDP is explained by private investment, while labor force explains 11.6%. Public investment has a smaller effect (6.1%). As the periods progress, the contribution of the labor force increases significantly (around 50% from the third period onwards), while private investment decreases slightly, but remains important (around 25-27%). For its part, public investment has a moderate impact on the variance of GDP, with values ranging between 6% and 17% over time, although it tends to increase as time passes.
5.8. Granger Causality
The Granger causality tests for each variable analyzed with respect to the logarithm of GDP are shown below.
Table 8 shows a directional causality between GDP and private investment in the four lags analyzed. This means that private investment influences GDP growth, but not vice versa (except for the last period).
With respect to public investment, Table 9 shows that there is evidence of bidirectional causality between public investment and GDP in some periods, as in the case of private investment, Granger causality to GDP in the four periods studied.
Table 10 shows that labor force causes significant changes in GDP in all lags, but GDP does not cause significant changes in labor force, indicating that GDP growth does not directly affect the size of the labor force.
6. Discussion
The analysis of the impact of infrastructure investments on economic growth in Peru between 2000 and 2022 reveals that these investments generate significant externalities that are crucial for the country's economy. Externalities, understood as spillover effects that investments produce on the economy, play a fundamental role in improving quality of life, competitiveness and long-term growth potential.
In this sense, the results of the study indicate that private investment in infrastructure has a significant positive effect on GDP growth. This finding is in line with recent studies that highlight the crucial role of infrastructure investment in boosting innovation and productivity (Jiang et al., 2020; Seidu et al., 2020). For example, Ibrahimov et al. (2023) found that a 1% increase in gross domestic investment can increase GDP per capita by 0.54%, suggesting that infrastructure investment is an essential driver of economic growth.
However, in contrast to the findings of this study, where public investment showed a non-significant effect, the research of Maciulyte-Sniukiene & Butkus (2022) indicates that different types of infrastructure can have different effects. This suggests that, while private investment is vital, public investment should be strategically directed toward sectors that demonstrate a clear impact on growth. The literature suggests that the impact of infrastructure investment varies significantly by type. The overall results on infrastructure investment could benefit from a more nuanced approach that considers different categories, such as telecommunications, transportation and electricity. For example, the study of Du et al. (2022) in China indicates that the quality of infrastructure has a non-linear impact on economic growth, suggesting that some investments are more effective in specific contexts. This is reflected in the results of the study, where it might be useful to explore the differential effects by type of infrastructure.
It is important to note that studies such as the Barrientos (2020) stress that education spending also generates positive externalities on growth, suggesting that the quality of the labor force may be as crucial as its quantity. This highlights the need for policies that not only expand the labor force, but also improve its training and skills.
The results of the study on cointegration and the long-run relationship between infrastructure investment and GDP suggest a pattern that aligns with the literature, although some studies, such as the one by Jiang et al. (2020), have found that investment in regional infrastructure does not always drive growth. This highlights the need for a more nuanced and contextual approach, suggesting that the institutional environment and local conditions are determinants in the effectiveness of infrastructure investment.
The findings underscore the importance of a strong institutional environment, as noted by Maciulyte-Sniukiene & Butkus (2022), where a less corrupt environment can improve growth performance. This reinforces the idea that infrastructure policies must be accompanied by measures that strengthen institutions and reduce corruption to maximize economic benefits.
In addition, the challenges of financing and regulation, discussed by Seidu et al. (2020), are key to attracting investment. Implementing policies that prioritize investment in strategic sectors, such as transportation and energy, could be crucial to improve the economic impact of public investment.
In summary, the results of the study are consistent with the existing literature in terms of the importance of infrastructure investment, as well as the resulting externalities, for economic growth. However, they also suggest the need for a more nuanced approach that considers the differences between types of infrastructure, the quality of the labor force, and the contextual conditions that may affect the impact of these investments. This could guide policymakers to develop more effective strategies that integrate infrastructure investment with institutional strengthening and human capital enhancement.
7. Conclusions
Based on the results obtained in the analysis of the impact of externalities in infrastructure investments (public and private) on Peru's economic growth during the period 2000-2022, using the Solow model, it is concluded that there has been a positive impact on the country's economic growth. Private investments in infrastructure show a positive and direct effect on the Gross Domestic Product (GDP), standing out as a crucial engine for economic development. On the other hand, public investments, although they have a positive influence, have a relatively more moderate impact compared to private investments. The externalities derived from these investments, which may have been due to improved connectivity, productivity and competitiveness, have been determining factors in driving national economic growth. These results suggest the need to continue promoting a favorable environment for infrastructure investment, both public and private, to strengthen the drivers of long-term economic growth.
The dynamics of infrastructure investments, labor force and economic growth during the 2000-2022 period indicate that there is an interdependent relationship between these variables. Infrastructure investments show an increasing trend, aligned with a sustained increase in GDP, while the labor force has also expanded, albeit at a slower pace. This suggests that, while economic growth benefits from the expansion of both variables, infrastructure investment acts as a main driver to boost the Peruvian economy.
Evaluation of the relationship between infrastructure investments, both public and private, and economic growth reveals that private investment has a more significant impact on GDP in the short and long term. It is established that private investment not only boosts economic growth immediately, but also establishes a solid foundation for future growth. Public investment, in contrast, has a positive but less robust effect, suggesting that government policies should focus on encouraging private investment to maximize its impact on economic growth.
The interaction between infrastructure investments and the labor force is shown to be a crucial factor for economic growth. The results show that the expansion of the labor force complements the positive effects of infrastructure investments, although its impact is less immediate. This highlights the importance of developing policies that not only encourage infrastructure investment, but also prioritize training and skills development of the labor force, thus ensuring more inclusive and sustained economic growth over time.
Author Contributions
Conceptualization, APS, APE, JVC, JDB and JCD; Data curation, APE and JVC; Formal analysis, APS and JDB; Investigation, APS, APE, JVC, JDB and JCD; Methodology, APS, JVC, JDB and JCD; Supervision, APS; Validation, APE; Writing—original draft, APS, APE, JVC, JDB and JCD; Writing—review and editing, APS, APE, JVC, JDB and JCD. All authors have read and agreed to the published version of the manuscript
Funding
This research received no external funding.
Data Availability Statement
The datasets generated during and/or analyzed during the current study are available from the corresponding author on reasonable request.
Conflicts of Interest
The authors declare no conflicts of interest.
Appendix
Annex 1.
Variance Inflation Factor (VIF).
| Coefficient | Uncentered | Centered | |
| Variable | Varianza | VIF | VIF |
| C | 0.38 | 5409.45 | NA |
| LOGI_PRI | 0.00 | 2138.75 | 5.99 |
| LOGI_PUB | 0.00 | 620.32 | 3.23 |
| LOGPEA | 0.01 | 10240.56 | 3.53 |
Annex 2.
Unit Circle Test
| Roots | Module |
| -0.99 | 0.99 |
| 0.006286 - 0.975078i | 0.98 |
| 0.006286 + 0.975078i | 0.98 |
| -0.030993 - 0.957845i | 0.96 |
| -0.030993 + 0.957845i | 0.96 |
| -0.93 | 0.93 |
| -0.275744 - 0.526473i | 0.59 |
| -0.275744 + 0.526473i | 0.59 |
| 0.355331 - 0.458589i | 0.58 |
| 0.355331 + 0.458589i | 0.58 |
| 0.56 | 0.56 |
| 0.417023 - 0.317991i | 0.52 |
| 0.417023 + 0.317991i | 0.52 |
| -0.455726 - 0.054315i | 0.46 |
| -0.455726 + 0.054315i | 0.46 |
| -0.20 | 0.20 |
References
- Abina, A., & Mogbeyiteren, O. (2021). Capital formation and economic growth in Nigeria: an econometric analysis. African Journal of Business and Economic Development, 1(12). Available online: https://www.ijaar.org/articles/ajbed/v1n12/ajbed-v1n12-Dec21-p11216.pdf.
- Akinbode, S. O., Dipeolu, A. O., Bolarinwa, T. M., & Olukowi, O. B. (2021). Effect of health outcome on economic growth in sub-Saharan Africa: a system generalized method of moment approach. Journal of Economics and Development, 23(3), 254–266. [CrossRef]
- Alvarez Pagliuca, C., Martínez Álvarez, J., Pereira Dos Santos, P., Serebrisky, T., & Suárez-Alemán, A. (2022). Financiamiento sostenible de la infraestructura económica y social en América Latina y el Caribe: tendencias, actores e instrumentos. [CrossRef]
- Arrow, K. J. (1969). The Organization of Economic Activity: Issues Pertinent to the Choice of Market versus Non-market Allocation. In The Analysis and Evaluation of Public Expenditure: The PPB System U.S, 59–73. Available online: https://api.semanticscholar.org/CorpusID:10214644.
- Aschauer, D. A. (1989). Is public expenditure productive? Journal of Monetary Economics, 23(2), 177–200. [CrossRef]
- Barrientos, C. (2020). Externalidades del gasto público destinado a la educación en el crecimiento económico. Revista Innova Educación, 2(1), 114–131. [CrossRef]
- Barro, R. J., & Sala-i-Martin, Xavier. (1995). Economic Growth. McGraw-Hill. Available online: https://books.google.com/books/about/Economic_Growth.html?hl=es&id=yo0WAQAAMAAJ.
- BID. (2020, January 28). La inversión en Infraestructura en América Latina y el Caribe no despega. BID. Available online: https://blogs.iadb.org/agua/es/infralatam-inversion-en-infraestructura-en-america-latina/.
- Blanchard, O., & Perotti, R. (2002). An Empirical Characterization of the Dynamic Effects of Changes in Government Spending and Taxes on Output. The Quarterly Journal of Economics, 117(4), 1329–1368. [CrossRef]
- Bonifaz, J. L., Urrunaga, R., Aguirre, J., & Quequezana, P. (2020). Brecha de infraestructura en el Perú: Estimación de la brecha de infraestructura de largo plazo 2019-2038. Inter-American Development Bank. [CrossRef]
- Brichetti, J. P., Mastronardi, L., Rivas, M. E., Serebrisky, T., & Solís, B. (2021). La brecha de infraestructura en América Latina y el Caribe: estimación de las necesidades de inversión hasta 2030 para progresar hacia el cumplimiento de los Objetivos de Desarrollo Sostenible. Inter-American Development Bank. [CrossRef]
- Coase, R. H. (1960). The Problem of Social Cost. The Journal of Law & Economics, 3, 1–44. Available online: http://www.jstor.org/stable/724810.
- Comexperu. (2024a, February 2). Situación y oportunidades de mejora para el transporte terrestre y urbano en el Perú. Comexperu. Available online: https://www.comexperu.org.pe/articulo/situacion-y-oportunidades-de-mejora-para-el-transporte-terrestre-y-urbano-en-el-peru.
- Comexperu. (2024b, February 16). Economía peruana cayó un 0.55% en 2023, el peor resultado desde 1998, sin considerar la pandemia. Comexperu. Available online: https://www.comexperu.org.pe/articulo/economia-peruana-cayo-un-055-en-2023-el-peor-resultado-desde-1998-sin-considerar-la-pandemia.
- Doyal, Len., & Gough, Ian. (1991). A theory of human need (Guilford Press, Ed.). Guilford Press. Available online: https://books.google.com/books/about/A_Theory_of_Human_Need.html?hl=es&id=u8C8QgAACAAJ.
- Du, X., Zhang, H., & Han, Y. (2022). How Does New Infrastructure Investment Affect Economic Growth Quality? Empirical Evidence from China. Sustainability, 14(6), 3511. [CrossRef]
- Gonzales, F. (2021, January 12). Hablemos sobre la importancia de la inversión en infraestructura. IPE. Available online: https://www.ipe.org.pe/portal/hablemos-sobre-la-importancia-de-la-inversion-en-infraestructura/.
- Griliches, Z. (1994). Productivity, R&D, and the Data Constraint. The American Economic Review, 84(1), 1–23. Available online: http://www.jstor.org/stable/2117968.
- Grupo Banco Mundial. (2021a). Infrastructure. Banco Mundial. Available online: https://www.worldbank.org/en/topic/infrastructure.
- Grupo Banco Mundial. (2021b, June 18). La carga viral en la inversión privada en infraestructura. Banco Mundial. Available online: https://www.bancomundial.org/es/news/feature/2021/06/18/inversion-privada-infraestructura-america-latina.
- Grupo Banco Mundial. (2024). Crecimiento del PIB (% anual) - Perú. Banco Mundial. Available online: https://datos.bancomundial.org/indicador/NY.GDP.MKTP.KD.ZG?locations=PE.
- Guangzhe, chen. (2023, May 15). Inversión privada en infraestructura: ¿cuál es la situación actual? World Bank. Available online: https://blogs.worldbank.org/es/voices/inversion-privada-en-infraestructura-cual-es-la-situacion-actual.
- Hernández Sampieri, R., Fernández Collado, C., & Baptista Lucio, M. D. P. (2014). Metodología de la Investigación (6ta. Edición). McGraw Hill España.
- Ibrahimov, Z., Hajiyeva, S., Seyfullayev, İ., Mehdiyev, U., & Aliyeva, Z. (2023). The impact of infrastructure investments on the country’s economic growth. Problems and Perspectives in Management, 21(2), 415–425. [CrossRef]
- INEI. (2020, May 11). En las últimas 7 décadas economía peruana creció a un promedio anual de 3,8%. INEI. Available online: https://m.inei.gob.pe/media/MenuRecursivo/noticias/np61_2020.pdf.
- Jiang, Y., Jiang, Y., & Zheng, J. (2020). Investment in Infrastructure and Regional Growth in China. Emerging Markets Finance and Trade, 56(9), 1942–1956. [CrossRef]
- Keynes, J. M. (1936). The General Theory of Employment, Interest and Money. Harcourt. Available online: https://www.files.ethz.ch/isn/125515/1366_keynestheoryofemployment.pdf.
- Laurente Blanco, L. F. (2023). Estimación y análisis de estabilidad del modelo de crecimiento económico de Solow para el Perú. FIDES ET RATIO, ISSN-e 2411-0035, ISSN 2071-081X, Vol. 26, No. 26, 2023, Págs. 177-198, 26(26), 177–198. Available online: https://dialnet.unirioja.es/servlet/articulo?codigo=9146451&info=resumen&idioma=ENG.
- Lucas, R. E. (1988). On the mechanics of economic development. Journal of Monetary Economics, 22(1), 3–42. [CrossRef]
- Maciulyte-Sniukiene, A., & Butkus, M. (2022). Does Infrastructure Development Contribute to EU Countries’ Economic Growth? Sustainability, 14(9), 5610. [CrossRef]
- Prud’homme, R. (2005). Infrastructure and Development. Journal of Infrastructure Development, 7, 39–55. Available online: https://documents1.worldbank.org/curated/fr/698521468762373585/pdf/28975.pdf.
- Ranis, G., & Stewart, F. (2005). Dynamic Links between the Economy and Human Development. Working Papers. Available online: https://ideas.repec.org/p/une/wpaper/8.html.
- Romer, P. M. (1990). Endogenous Technological Change. Journal of Political Economy, 98(5), S71–S102. Available online: http://www.jstor.org/stable/2937632.
- Romero Escalante, V. F. (2023). Investment in infrastructure and Peruvian economic development (1997 – 2020). Proceedings of the 21th LACCEI International Multi-Conference for Engineering, Education and Technology (LACCEI 2023). [CrossRef]
- Rostow, W. W. (1991). The Stages of Economic Growth. Cambridge University Press. [CrossRef]
- Schumpeter, J. A. (1939). Business Cycles: A Theoretical, Historical, and Statistical Analysis of the Capitalist Process. In McGraw-Hill Book Company (Ed.), JOURNAL OF COMPARATIVE RESEARCH IN ANTHROPOLOGY AND SOCIOLOGY. McGraw-Hill. Available online: https://www.mises.at/static/literatur/Buch/schumpeter-business-cycles-a-theoretical-historical-and-statistical-analysis-of-the-capitalist-process.pdf.
- Seidu, R. D., Young, B. E., Robinson, H., & Ryan, M. (2020). The impact of infrastructure investment on economic growth in the United Kingdom. Journal of Infrastructure, Policy and Development, 4(2), 217. [CrossRef]
- Solow, R. M. (1956). A Contribution to the Theory of Economic Growth. The Quarterly Journal of Economics, 70(1), 65. [CrossRef]
- Thinking Heads. (2024). La infraestructura global vuelve a la agenda. Thinking Heads. Available online: https://thinkingheads.com/latam/tendencia-global/la-infraestructura-global-vuelve-a-la-agenda/.
Figure 1.
Evolution of economic growth, private infrastructure investment, public infrastructure investment and EAP employed, 2000-2022.
Figure 1.
Evolution of economic growth, private infrastructure investment, public infrastructure investment and EAP employed, 2000-2022.
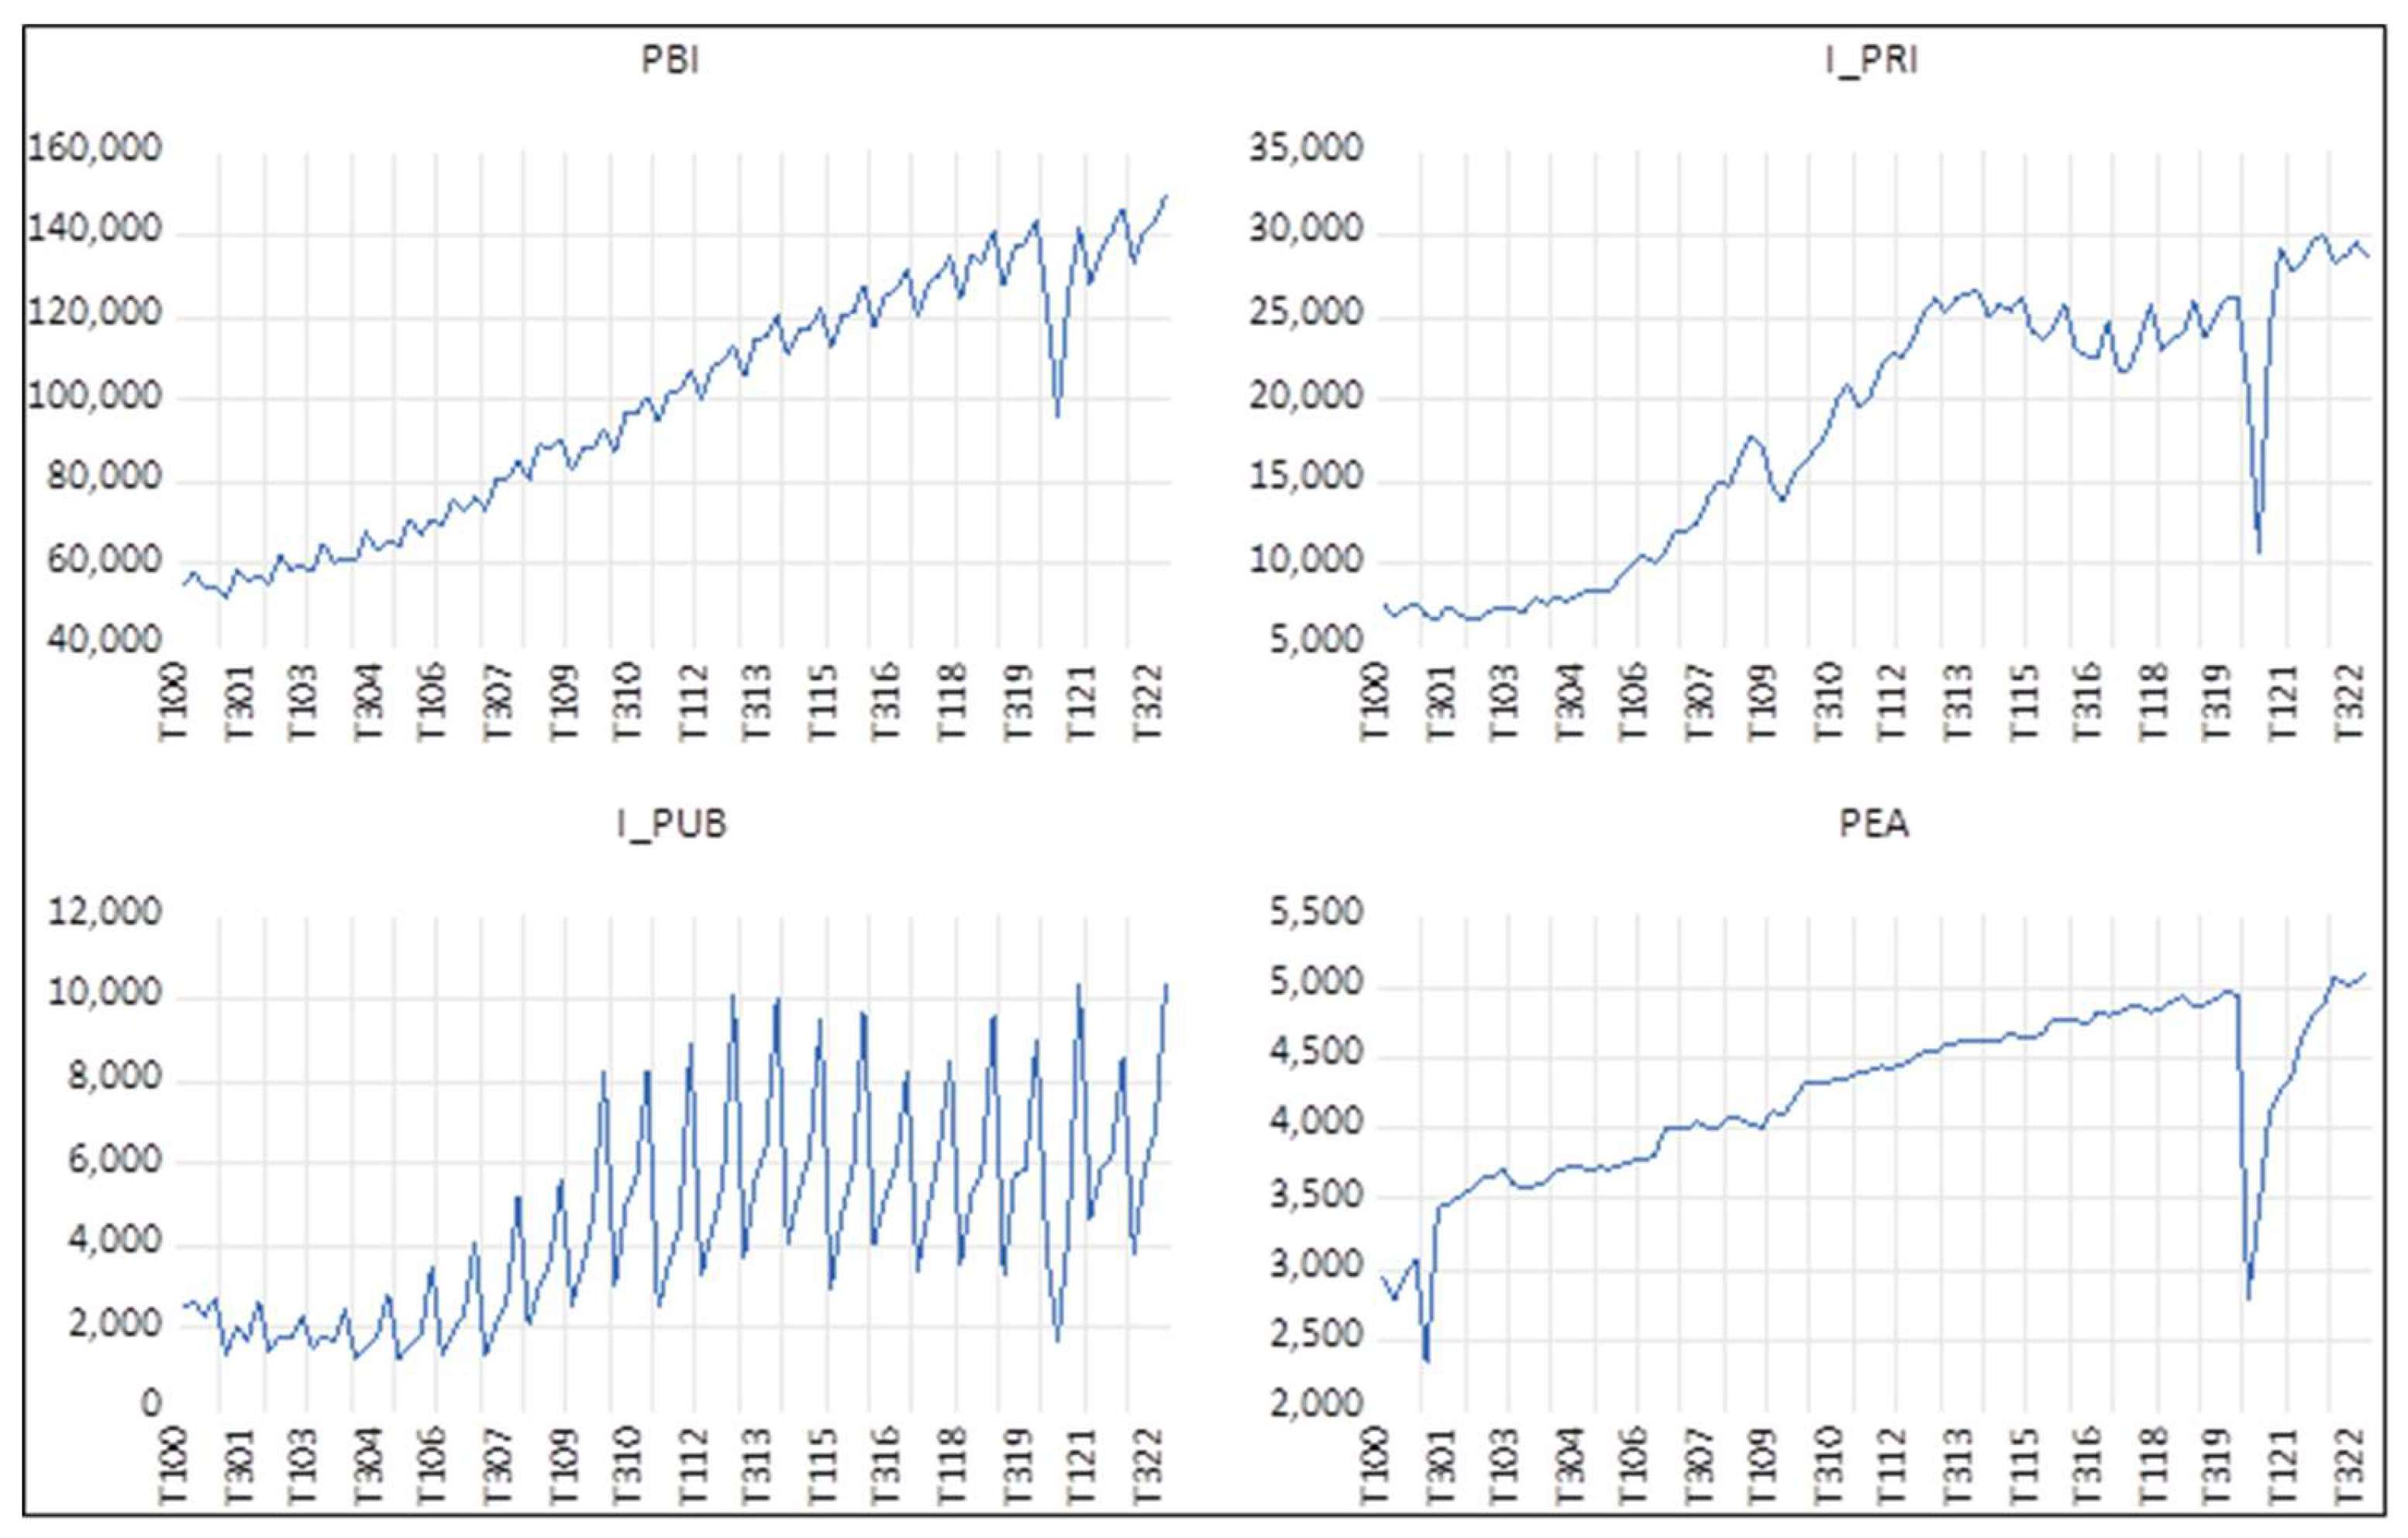
Figure 2.
Impulse Function Response of the GDP logarithm.
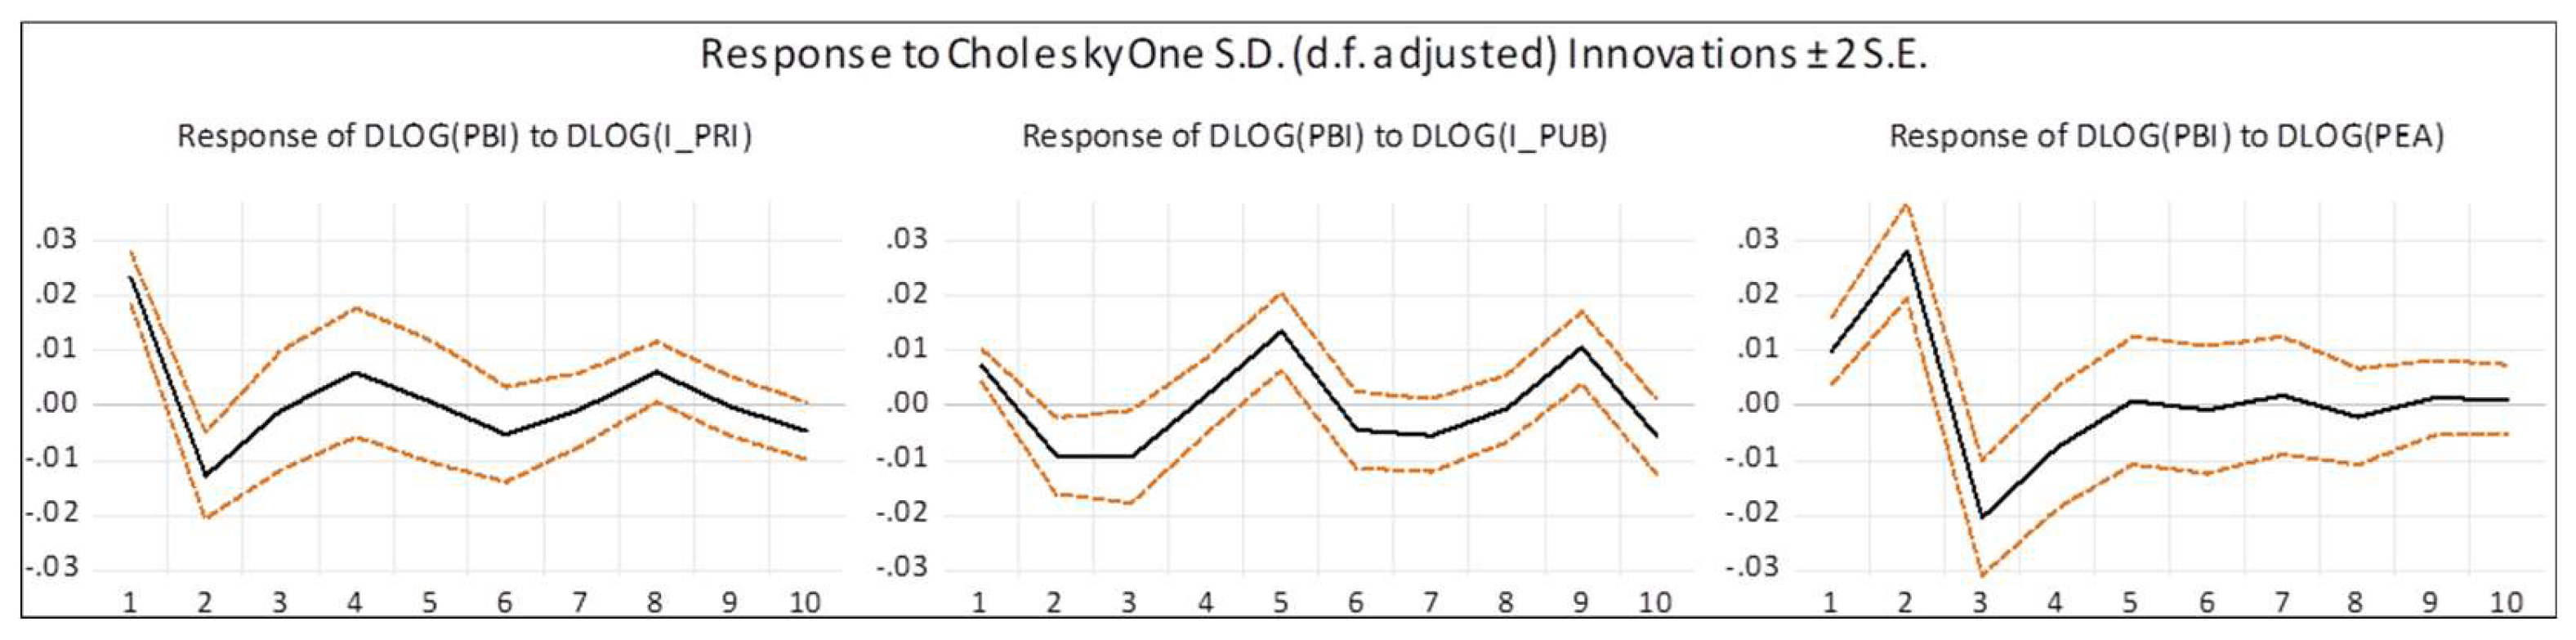
Table 1.
Description of variables.
| Variable | Indicator | Designation | Source |
| Economic growth | Percentage change in GDP | PBI | BCRP (Code: PN02538AQ) |
| Private Infrastructure Investment | Gross Fixed Investment - Private | I_PRI | BCRP (Code: PN02533AQ) |
| Public Infrastructure Investment | Gross Fixed Investment - Public | I_PUB | BCRP (Code: PN02534AQ) |
| Labor Force | Three-month moving average (thousands of persons) - Employed EAP | PEA | BCRP (Code: PN38051GM) |
Note: PBI, I_PRI, PEA are measured in millions s/. 2007 reals.
Table 2.
Descriptive statistics.
| PBI | I_PRI | I_PUB | PEA | |
| Mean | 98964.13 | 18183.27 | 4449.60 | 4221.66 |
| Median | 100821.10 | 20279.89 | 3816.66 | 4341.77 |
| Maximum | 149471.80 | 30009.50 | 10377.97 | 5106.93 |
| Minimum | 51760.37 | 6669.33 | 1265.64 | 2333.75 |
| Std. Dev. | 29677.31 | 7865.16 | 2561.13 | 606.62 |
| Skewness | -0.05 | -0.21 | 0.77 | -0.71 |
| Kurtosis | 1.63 | 1.51 | 2.65 | 3.01 |
| Jarque-Bera | 7.25 | 9.25 | 9.57 | 7.67 |
| Probability | 0.03 | 0.01 | 0.01 | 0.02 |
| Sum | 9104700.00 | 1672861.00 | 409363.00 | 388392.20 |
| Sum Sq. Dev. | 80100000000.00 | 5630000000.00 | 597000000.00 | 33486993.00 |
| Observations | 92 | 92 | 92 | 92 |
Table 3.
Estimation of the linear regression model.
| Variable | Coefficient | Std. Error | t-Statistic | Prob. |
| C | 4.44 | 0.618614 | 7.17 | 0.00 |
| LOGI_PRI | 0.52 | 0.040081 | 13.01 | 0.00 |
| LOGI_PUB | 0.03 | 0.025384 | 1.07 | 0.29 |
| LOGPEA | 0.21 | 0.102079 | 2.04 | 0.04 |
| R-squared | 0.94 | Mean dependent var | 11.45 | |
| Adjusted R-squared | 0.94 | S.D. dependent var | 0.32 | |
| S.E. of regression | 0.08 | Akaike info criterion | -2.15 | |
| Sum squared resid | 0.57 | Schwarz criterion | -2.04 | |
| Log likelihood | 103.10 | Hannan-Quinn criter. | -2.11 | |
| F-statistic | 450.41 | Durbin-Watson stat | 0.55 | |
| Prob(F-statistic) | 0.00 | |||
| Included observations: | 92 | |||
Table 4.
ADF Unit Root Test.
| Levels | First Differences | |||
| t-Statistic | Prob. * | t-Statistic | Prob. * | |
| PBI | -0.33 | 0.91 | -12.48 | 0.00 |
| I_PRI | -0.86 | 0.79 | -10.49 | 0.00 |
| I_PUB | -0.99 | 0.75 | -3.65 | 0.00 |
| PEA | -2.64 | 0.08 | -9.09 | 0.00 |
Note: The null hypothesis of the test indicates that the series have a unit root, while the alternate hypothesis indicates that they are stationary. The critical t-Statistic values of this test at 1%, 5% and 10% are -3.51, -2.89 and -2.58, respectively. *MacKinnon (1996) one-sided p-values.
Table 5.
Johansen cointegration test.
| Lags | r = 0 | r <= 1 | r <= 2 | r <= 3 | ||||
| Statistic | Prob.** | Statistic | Prob.** | Statistic | Prob.** | Statistic | Prob.** | |
| 1 | 95.07 | 0.00 | 25.75 | 0.14 | 4.83 | 0.82 | 0.82 | 0.36 |
| 2 | 74.59 | 0.00 | 27.21 | 0.09 | 7.30 | 0.54 | 2.09 | 0.14 |
| 3 | 81.25 | 0.00 | 29.23 | 0.05 | 9.41 | 0.32 | 3.13 | 0.07 |
| 4 | 68.39 | 0.00 | 29.83 | 0.05 | 14.94 | 0.06 | 3.82 | 0.05 |
Note: Cointegration tests are evaluated under the trace statistic. This test evaluates the residual autocorrelation matrix with two hypotheses: the null hypothesis indicates that there are less than or equal to a specified number of cointegrating vectors, and the alternative hypothesis suggests that there are more. Cointegration is determined by comparing the trace statistic with critical values. **MacKinnon-Haug-Michelis (1999) p-values
Table 7.
Decomposition of the Variance of the logarithm of the logarithm of the GDP.
| Period | S.E. | DLOG(PBI) | DLOG(I_PRI) | DLOG(I_PUB) | DLOG(PEA) |
| 1 | 0.03 | 19.19 | 63.00 | 6.14 | 11.66 |
| 2 | 0.04 | 14.92 | 34.67 | 6.72 | 43.67 |
| 3 | 0.05 | 14.45 | 27.07 | 8.54 | 49.91 |
| 4 | 0.05 | 13.94 | 27.44 | 8.36 | 50.251 |
| 5 | 0.06 | 17.37 | 24.43 | 13.45 | 44.74 |
| 6 | 0.06 | 18.21 | 24.60 | 13.70 | 43.47 |
| 7 | 0.06 | 18.07 | 24.35 | 14.46 | 43.11 |
| 8 | 0.06 | 17.88 | 25.19 | 14.27 | 42.64 |
| 9 | 0.06 | 19.17 | 23.77 | 16.75 | 40.29 |
| 10 | 0.06 | 19.86 | 23.73 | 17.176 | 39.22 |
Table 8.
Granger Causality of Private Infrastructure Investment.
| Null Hypothesis | Rezago | Obs | F-Statistic | Prob. |
| DLOG(I_PRI) no causa a la Granger a DLOG(PBI) | 1 | 90 | 4.97 | 0.02 |
| DLOG(PBI) no causa a la Granger a DLOG(I_PRI) | 0.73 | 0.39 | ||
| DLOG(I_PRI) no causa a la Granger a DLOG(PBI) | 2 | 89 | 7.56 | 0.00 |
| DLOG(PBI) no causa a la Granger a DLOG(I_PRI) | 0.32 | 0.72 | ||
| DLOG(I_PRI) no causa a la Granger a DLOG(PBI) | 3 | 88 | 12.88 | 0.00 |
| DLOG(PBI) no causa a la Granger a DLOG(I_PRI) | 1.51 | 0.21 | ||
| DLOG(I_PRI) no causa a la Granger a DLOG(PBI) | 4 | 87 | 7.42 | 0.00 |
| DLOG(PBI) no causa a la Granger a DLOG(I_PRI) | 4.13 | 0.00 |
Table 9.
Granger Causality of Public Infrastructure Investment.
| Null Hypothesis | Rezago | Obs | F-Statistic | Prob. |
| DLOG(I_PUB) does not cause the Granger to DLOG(PBI) | 1 | 90 | 12.73 | 0.00 |
| DLOG(PBI) does not cause the Granger to DLOG(I_PUB) | 0.60 | 0.44 | ||
| DLOG(I_PUB) does not cause the Granger to DLOG(PBI) | 2 | 89 | 6.42 | 0.005 |
| DLOG(PBI) does not cause the Granger to DLOG(I_PUB) | 7.65 | 0.00 | ||
| DLOG(I_PUB) does not cause the Granger to DLOG(PBI) | 3 | 88 | 5.46 | 0.00 |
| DLOG(PBI) does not cause the Granger to DLOG(I_PUB) | 3.56 | 0.01 | ||
| DLOG(I_PUB) does not cause the Granger to DLOG(PBI) | 4 | 87 | 2.87 | 0.02 |
| DLOG(PBI) does not cause the Granger to DLOG(I_PUB) | 2.58163 | 0.04 |
Table 10.
Granger Causality of Workforce Reversal.
| Null Hypothesis | Rezago | Obs | F-Statistic | Prob. |
| DLOG(PEA) does not cause the Granger to DLOG(PBI) | 1 | 90 | 30.14 | 0.00 |
| DLOG(PBI) does not cause the Granger to DLOG(PEA) | 1.49 | 0.22 | ||
| DLOG(PEA) does not cause the Granger to DLOG(PBI) | 2 | 89 | 16.96 | 0.00 |
| DLOG(PBI) does not cause the Granger to DLOG(PEA) | 0.19 | 0.82 | ||
| DLOG(PEA) does not cause the Granger to DLOG(PBI) | 3 | 88 | 16.98 | 0.00 |
| DLOG(PBI) does not cause the Granger to DLOG(PEA) | 1.34 | 0.26 | ||
| DLOG(PEA) does not cause the Granger to DLOG(PBI) | 4 | 87 | 17.68 | 0.00 |
| DLOG(PBI) does not cause the Granger to DLOG(PEA) | 1.589 | 0.18 |
Disclaimer/Publisher’s Note: The statements, opinions and data contained in all publications are solely those of the individual author(s) and contributor(s) and not of MDPI and/or the editor(s). MDPI and/or the editor(s) disclaim responsibility for any injury to people or property resulting from any ideas, methods, instructions or products referred to in the content. |
© 2025 by the authors. Licensee MDPI, Basel, Switzerland. This article is an open access article distributed under the terms and conditions of the Creative Commons Attribution (CC BY) license (http://creativecommons.org/licenses/by/4.0/).
Copyright: This open access article is published under a Creative Commons CC BY 4.0 license, which permit the free download, distribution, and reuse, provided that the author and preprint are cited in any reuse.


