Submitted:
09 January 2025
Posted:
09 January 2025
You are already at the latest version
Abstract
Biometrics-based authentication mechanisms can address the built-in weakness of conventional password or token-based authentication in identifying genuine users. However, 2D-based fingerprint biometrics authentication faces the problem of sensor spoofing attacks. 3D fingerprints are strong against sensor spoofing attacks. 3D fingerprints can be represented by a 3D point cloud. To apply conventional 2D fingerprint recognition methods to 3D fingerprints, the 3D point cloud needs to be converted into a 2D gray-scale image. However, the contrast of the generated image is often not of good quality for direct matching. In this work, we propose an image segmentation approach using U-Net to enhance the fingerprint contrast. The enhanced fingerprint images are then used for conventional fingerprint recognition. By applying the proposed method, the fingerprint recognition Equal Error Rate (EER) is improved, from 41.97% to 12.49%.
Keywords:
biometrics
; fingerprint
; 3D
; deep learning
1. Introduction
Biometrics-based authentication mechanisms can address the built-in weakness of conventional password or token-based authentication in identifying genuine users [1]. However, a 2D-based fingerprint biometrics authentication system faces the problem of sensor spoofing attacks where attackers can capture the latent fingerprints left unintentionally on glasses or other objects and then make rubber fingerprints to spoof the 2D fingerprint sensor [2,3,4].
A 3D fingerprint is captured contactlessly and can be represented by a 3D point cloud which is strong against sensor spoofing attacks. It also enjoys the benefit of being hygiene. However, how to make use of the 3D fingerprint point cloud for effective identity authenitcation is very challenging. Ding et al. [5] utilized surface and subsurface fingerprint information to enhance authentication accuracy while also making the system more resistant to forgery. He et al. [6] proposed estimating 3D finger angles from a 2D fingerprint image as a method to enhance fingerprint matching accuracy, with potential applications in forensic analysis. To facilitate the study on 3D fingerprints, Dong and Kumar [7] synthesized contactless 3D fingerprints and a new framework to match contactless to contact-based fingerprints. 3D fingerprints are strong against sensor spoofing attacks as it is infeasible to capture a 3D fingerprint left unintentionally anywhere.
The 3D fingerprint is a three-dimensional representation of a finger surface [8]. 3D fingerprints can be presented by a 3D point cloud, which is a collection of data points representing the surface of the finger that can be used to extract fingerprint features [9]. In contrast to 2D fingerprints that only include the surface pattern of a fingerprint, depth, and curvature of ridges can also be extracted from a 3D fingerprint which offers a higher level of security and spoof resistance [1].
3D fingerprint recognition involves capturing the fingerprint features from a 3D point cloud. One approach that simplifies 3D fingerprint recognition is to unwrap a 3D fingerprint to a 2D image [10] or flatten a 3D fingerprint [11] and then use a conventional 2D fingerprint recognition algorithm for the recognition. The resulting images from these methods may lack sufficient contrast or contain distorted sections, making them unsuitable for direct use in 2D-based fingerprint recognition. There are numerous situations where image quality is insufficient for reliable feature extraction, highlighting the necessity for studies on effective image enhancement methods. Ai and Kwon [12] proposed a U-Net enhancement method to increase image contrast for the images taken from surveillance cameras in very low-light conditions. Huang et al. [13] proposed a latent fingerprint enhancement method by using U-Net architecture where the model is trained progressively, starting with lower-quality images and gradually moving to higher-quality images. Liu and Qian [14] used a nested U-Net for latent fingerprint enhancement which uses synthetic latent fingerprints for training. Gavas and Namboodiri [15] proposed a modification of U-Net to enhance low-quality fingerprints.
In this study, we propose an image enhancement method by using a deep U-Net to improve the quality of flattened point cloud images. Note that the flattened point cloud images are fictitious because the gray intensity is not formed from the natural fingerprint ridge-valley structure as in most 2D fingerprint sensors. This work will be the first of its kind in the field.
2. Methodology
In this section, we first introduce a 3D point cloud flattening method, adapted from an existing 3D fingerprint unwrapping approach, which we use to convert 3D fingerprints into 2D grayscale fingerprint images. Subsequently, we present the proposed method aimed at enhancing these generated images. Algorithm 1 given below shows an overview of the proposed method.
| Algorithm 1: Processes used to enhance contrast of the generated gray-scale fingerprint image |
|
Data: 3D point cloud
Result: Enhanced gray-scale fingerprint image
|
2.1. Flattening 3D Fingerprint and Generating Gray-Scale Image
The flattening scheme used in our method is derived from a 3D point cloud unwrapping method that uses surface fitting [10]. In this method, the surface of a 3D fingerprint is modeled as the surface of a cylinder. We use this approach to fit a surface to the point cloud. However, instead of unwrapping the data, we flatten the 3D point cloud. However, instead of unwrapping the data, we flatten the 3D point cloud. This is achieved by subtracting the z-value of each point on the fitted surface from the z-value of its corresponding point in the point cloud.
To generate the fitted surface, the radius of the cylinder needs to be calculated. First, the length of the point cloud is segmented into slices, each with a width of one point. The central slice is then used to determine the radius of the cylinder. By using the chord length (width of the slice) and the arc height (the difference between the z-values of the highest and lowest points in the slice), the radius of the cylinder can be estimated, following a method similar to the one detailed in [16]. Figure 1a shows a sample 3D point cloud and Figure 1b shows the flattened point cloud by applying this concept.
By applying the method described in [11], a flattened 3D point cloud can be converted into a gray-scale image. In this approach, the height of the points (Z value) in the point cloud is used to determine the intensity levels of the corresponding pixels at the same X and Y locations in the gray-scale image. The point with the highest Z value is assigned an intensity of 0, while the point with the lowest Z value is assigned the highest intensity. Points with Z values in between are mapped to intensities ranging from 0 to 255 proportionally. In this way, pixels with higher intensities represent valleys, and those with lower intensities represent ridges on the fingerprint surface. Figure 2a and Figure 2b show the generated gray-scale images from the point clouds depicted in Figure 1a and Figure 1b respectively. It is obvious that these images are of poor quality and are not suitable for direct matching. We will present our solution for the image enhancement, which will be described in the following.
2.2. Fingerprint Enhancement by U-Net
This section describes our proposed method and the preliminary approaches employed for image enhancement using U-Net.
2.2.1. U-Net-Based Full Image Fingerprint Enhancement
In this method, the gray-scale images generated in Section 2.1, along with their corresponding ground truth images, are first used to train a U-Net model. The trained model is then applied to enhance the gray-scale fingerprints. Figure 3 illustrates the processes involved in the proposed method for generating training data.
For this purpose, the Hong Kong Polytechnic University 3D Fingerprint Images Database Version 2 [17,18] was utilized. Fingerprint impressions from the first 210 subjects in session 1 of this dataset were used to train the model. The input data for training was generated by converting the point clouds of these 210 subjects into gray-scale images. Each subject has six 3D point cloud impressions, resulting in a total of 1,260 gray-scale images used as training input.
For each point cloud in Dataset A, there are two corresponding contactless 2D fingerprints, each captured under different illumination conditions and originally used to generate the 3D point cloud data. However, these 2D images cannot be directly used as ground truth due to size differences with their 3D point cloud counterparts. In our experiments, the Region of Interest (ROI) of the 2D images was manually selected and cropped by detecting mutual minutiae between the 2D images generated from the 3D point clouds and the contactless 2D images. Figure 4 illustrates a sample contactless 2D image and its corresponding ROI.
Next, the ROI images were binarized by using VeriFinger [19]. Figure 5 shows the intensity of a section of a binarized image ranging from 0 to 255. The black lines show the position of the ridge patterns and the area in the middle of the black lines shows the position of the valley.
Figure 6a shows the barbarized image from the ROI image in Figure 4b. The binarization process for some impressions results in blank sections. Figure 6b shows a sample binarized image with such blank areas. The binarized images generated for all the ROI images, totaling 1,260 images, will be used as ground truth for training the model.
The U-Net enhancement model is illustrated in Figure 7 with an input and output image size of 352 × 248 pixels. The model includes 256 classes to cover all potential intensity levels in a gray-scale image. The training parameters are shown in Table 1. Figure 8a shows a sample generated gray-scale image, and (b) displays the enhanced image obtained using U-Net-based full-image fingerprint enhancement. It can be observed that the visibility of ridge and valley patterns in the enhanced image is significantly improved. Additionally, ridge and valley patterns in some sections that were previously difficult to detect are now clearly visible. However, the enhanced image contains some blank areas, which may result from blank regions in certain ground truth images, as shown in Figure 6b.
2.2.2. Patch-Based Fingerprint Enhancement Using a U-Net Model
In this method, in order the solve the problem of blank areas in the enhanced images in the previous method, we are going to use patch-based approach. The U-Net enhancement model shown in Figure 7 is also used here with image input and output size of 64 by 64 pixels. The same as the previous method, the first 210 subjects in Hong Kong Polytechnic University 3D Fingerprint Images Database Version 2 session one was utilized to train the model.
Figure 9 illustrates the steps involved in the proposed method for generating training data. Following a similar method to the previous approach, 3D point clouds are flattened and transformed into 2D grayscale images, with corresponding binarized 2D images subsequently generated. However, the binarization process for the ROI images in this method differs as follows:
- The entire ROI image is initially binarized using VeriFinger.
- Each individual color channel (e.g., red, green, and blue) of the ROI image is separately binarized using VeriFinger.
- By using Matlab, the four binarized outputs (one for the full image and three for the color channels) were merged.
To ensure proper alignment and avoid overlaps between ridge and valley patterns, only the blank areas (regions without ridge or valley patterns) from one binarized image are merged with the others. Figure 10 compares the binarized ROI images obtained using the previous method with those generated by the proposed method in this section in (a) and (b) respectively.
The intensity levels in the binarized images are also shifted to two values of 0 and 255 by using Matlab with 0 indicating ridge position and 255 indicating valley position. Figure 11 shows the intensity pattern in a section of a sample binarized ROI image.
Next, MINDTCT [20] is applied to the binarized images, assigning quality scores from 0 to 4 to blocks of 8x8 pixels in the fingerprint image. Blocks with a quality score of 0 represent the lowest quality sections, while blocks with a quality score of 4 indicate the highest quality sections. The lowest quality sections (quality 0 and quality 1) are excluded. Figure 12a shows a sample binarized image, and its quality-mapped image by excluding lowest quality sections (quality 0, and quality 1) is shown in (b).
The remaining sections of the binarized images are cropped into 64x64 pixel patches, which serve as ground truth patches. The corresponding input patches for each ground truth patch are generated by segmenting the 2D gray-scale images of the flattened point clouds, aligned with the locations of the ground truth patches. A total of 9,106 input patches and 9,106 ground truth patches were used for training the U-Net model. The training parameters are shown in Table 2.
The trained model can be used for fingerprint enhancement. First, the generated gray-scale fingerprints from the flattened point cloud were segmented into patches of 64 by 64 pixels. Next, the patches were enhanced by using the trained model. Lastly, the enhanced patches were merged together. Figure 13 shows a sample enhanced fingerprint obtained by merging the enhanced fingerprint patches. Figure 14a,b show another two sample enhanced fingerprint image by merging the enhanced patches with patch size of 32 and 112 pixels respectively. It can be observed that the patch-based method successfully resolves the issue of blank areas. However, there is still the problem of misaligned ridge and valley patterns, which may result from enhancing the patches separately.
2.2.3. U-Net-Based Full Image Fingerprint Enhancement by Using Quality Map
The objective of this method is to prevent blank spots in the enhanced image while ensuring that ridge and valley patterns remain properly aligned. To achieve this, we will use high-quality ground truth images for training and utilize the entire image to avoid issues with discontinuous ridge and valley patterns. The same U-Net enhancement model as shown in Figure 7 is also used here with image input and output size of 352 by 248 pixels. Figure 15 illustrates the processes involved in the proposed method for generating training data.
Similar to the method described in Section 2.2.1 the full-size generated gray-scale images were used as input data for the U-Net model, while the binarized ROI images served as ground truth data. MINDTCT [20] were also applied to the binarized images in this approach. Only the sections with the highest quality (quality 4) were used for training. The intensities of these sections were shifted to the range [1, 255], while the low-quality sections were assigned an intensity of zero. Figure 16a shows a sample binarized image from Figure 4a, and its quality-mapped image which only includes the highest quality sections of the binarized image (quality 4) is shown in (b). Finally, the input and ground truth images were augmented by horizontal flip, vertical flip, and both horizontal and vertical flip, resulting in a total of 5040 input and ground truth images.
The model includes 256 classes to cover all potential intensity levels in a gray-scale image. Class zero is excluded since it is used by the quality map to indicate the low-quality regions of the generated ground truth. The training parameters are shown in Table 3. Figure 17 shows the grayscale image generated from Figure 2, enhanced using the proposed method. Figure 18a,b show two additional flattened 3D point cloud samples. The enhanced images of these samples are shown in Figure 18c and d respectively. A comparison between the enhanced images produced by the revised proposed method and those generated in the previous sections, shown in Figure 13 and Figure 8b, demonstrates that the proposed method significantly reduces the size of blank areas in the enhanced images while also preventing misaligned ridge and valley patterns.
3. Experimental Result
This section describes the tool setup and the evaluation of the proposed method for enhancing fingerprint images.
3.1. Dataset
To train the model and test it, the Hong Kong Polytechnic University 3D Fingerprint Images Database Version 2 [17,18] is used. The fingerprint impressions of the first 210 subjects in session 1 of this dataset were used for training the model (Dataset A), and the fingerprint impressions of the subjects 211 to 300 (Dataset B) were used for testing in the first experiment. Session 2 of this database has 200 subjects (Dataset C) which was used for testing in the second experiment. In both sessions, each subject has 6 3D fingerprint impressions which are represented in 3D point cloud format with the dimensions of 900 by 1400 points. For each point cloud impression, two corresponding contactless 2D images are also available with dimensions of 1536 by 2048 which are captured with different illuminations.
3.2. Tools
The experiments were performed on a Dell workstation with a 12th generation Intel Core i9 CPU, 32Gb of RAM, and NVIDIA GeForce RTX 3060 GPU. Microsoft Windows 11 [21], Matlab R2023b [22], PyCharm 2024 [23], and Visual Studio 2022 [24] were used for training the model and running the experiments. MINDTCT [20] was used to generate quality maps, and VeriFinger SDK 13.1 [19] was used to calculate fingerprint-matching scores.
3.3. Setup
This section explains the preparation of input images and ground truth for constructing the training dataset required to train the model, as well as the preparation of the testing dataset.
The input data is generated by converting the 3D point clouds of Dataset A to gray-scale images as described in Section 2.1. The data is augmented by adding horizontal flip, vertical flip, and (horizontal and vertical) flip of each image to the training data to make a total of 5040 images.
Similar to the input data, the testing data is generated by converting the 3D point clouds of Dataset B and Dataset C to gray-scale images with a total of 540 and 1200 images respectively.
The ground truth images were generated using the method proposed in Section 2.2.3 and augmented in the same manner as the input images, resulting in a total of 5040 images. These input and ground truth images were used to train the U-Net model described in Section 2.2.3 and subsequently applied to enhance fingerprint images in our experiments.
Similar to the input data, the generated quality map images are augmented to make a total of 5040 images.
3.4. Experiment A
In the first experiment, the point clouds in Dataset B are first converted into gray-scale images using the method described in Section 2.1. Next, these images are enhanced using the proposed method detailed in Section 2.2.3. Following the FVC 2006 protocol, the genuine and imposter matching scores for the first impression of each subject are then calculated for both the gray-scale images and their enhanced versions. A total of 1350 genuine and 4005 imposter matching scores are obtained. Figure 19 presents the DET curve for the gray-scale images and their enhanced counterparts. The results indicate that the fingerprint recognition performance of the enhanced images has improved.
The Cumulative Match Characteristic (CMC) curve is shown in Figure 20. It can be observed that the identification accuracy of the enhanced gray-scale images has improved. The CMC curve is generated by identifying each subject’s first impression within a gallery that includes the subject’s second impression, along with all impressions from 89 other subjects, resulting in a gallery size of 535 impressions.
Table 4 presents the calculated Equal Error Rate (EER) and rank-1 accuracy for these experiments. The results show that fingerprint recognition performance and Identification accuracy are improved for the images enhanced by the proposed method.
3.5. Experiment B
In the second experiment, Dataset C is used for testing. Similar to the previous experiment, grayscale images are generated from the 3D point clouds using the method described in Section 2.1 and then enhanced using the proposed method detailed in Section 2.2.3. The genuine and imposter matching score for the gray-scale images and their enhanced images are calculated. For each case, there are 3000 genuine and 19900 imposter matching scores. Figure 21 shows the DET curve of the gray-scale images and their enhanced counterparts using the proposed method. The results demonstrate that the enhanced fingerprint images improve fingerprint recognition performance.
Figure 22 shows the CMC curve of gray-scale images and their enhanced counterpart. It can be observed that the fingerprint identification accuracy of the enhanced fingerprint images is improved compared to their gray-scale counterparts. The CMC curve is obtained by identifying each subject’s initial impression within a gallery that includes the subject’s second impression along with all impressions from 199 other subjects, resulting in a gallery size of 1195 impressions.
Table 5 shows the calculated EER of these experiments. The results of this experiment also show that fingerprint recognition performance and Identification accuracy are improved for the images enhanced by the proposed method.
3.6. Evaluation
In both experiments, the enhanced fingerprints achieved a lower EER and a higher Rank-1 accuracy. These results indicate that the proposed fingerprint enhancement method is effective in improving recognition and identification performance, particularly when the fingerprints are of very low quality.
4. Conclusion
In this work, a fingerprint enhancement method by classification of image pixels by using U-Net is presented. This method is particularly effective for enhancing low-quality fingerprints affected by distortions or missing sections. The experiments show that the proposed method can be used to improve the quality of low-contrast fingerprint images and improve fingerprint recognition and identification performance. For future work, we aim to further refine this method to achieve higher accuracy and improved recognition performance.
References
- Jain, A.K.; Ross, A.; Prabhakar, S. An introduction to biometric recognition. IEEE Transactions on circuits and systems for video technology 2004, 14, 4–20. [Google Scholar] [CrossRef]
- Galbally, J.; Marcel, S.; Fierrez, J. Image quality assessment for fake biometric detection: Application to iris, fingerprint, and face recognition. IEEE transactions on image processing 2013, 23, 710–724. [Google Scholar] [CrossRef] [PubMed]
- Cao, K.; Jain, A.K. Hacking mobile phones using 2D printed fingerprints. Dept. Comput. Sci. Eng., Michigan State Univ., East Lansing, MI, USA, Tech. Rep. MSU-CSE-16-2 2016, 6. [Google Scholar]
- Askarin, M.M.; Wong, K.; Phan, R.C.W. Planting attack on latent fingerprints. IET Biometrics 2018, 7, 396–404. [Google Scholar] [CrossRef]
- Ding, B.; Wang, H.; Chen, P.; Zhang, Y.; Guo, Z.; Feng, J.; Liang, R. Surface and internal fingerprint reconstruction from optical coherence tomography through convolutional neural network. IEEE Transactions on Information forensics and security 2020, 16, 685–700. [Google Scholar] [CrossRef]
- He, K.; Duan, Y.; Feng, J.; Zhou, J. Estimating 3D finger angle via fingerprint image. Proceedings of the ACM on Interactive, Mobile, Wearable and Ubiquitous Technologies 2022, 6, 1–22. [Google Scholar] [CrossRef]
- Dong, C.; Kumar, A. Synthesis of multi-view 3D fingerprints to advance contactless fingerprint identification. IEEE Transactions on Pattern Analysis and Machine Intelligence 2023. [Google Scholar] [CrossRef]
- Kumar, A. Contactless 3D fingerprint identification; Springer, 2018.
- Pang, X.; Song, Z.; Xie, W. Extracting valley-ridge lines from point-cloud-based 3D fingerprint models. IEEE computer graphics and applications 2012, 33, 73–81. [Google Scholar] [CrossRef]
- Chen, Y.; Parziale, G.; Diaz-Santana, E.; Jain, A.K. 3D touchless fingerprints: Compatibility with legacy rolled images. In Proceedings of the 2006 Biometrics Symposium: Special Session on Research at the Biometric Consortium Conference. IEEE; 2006; pp. 1–6. [Google Scholar]
- Askarin, M.M.; Hu, J.; Wang, M.; Yin, X.; Jia, X. A B-Spline Function based 3D Point Cloud Flattening Scheme for 3D Fingerprint Recognition and Identification. TechRxiv 2024. [Google Scholar] [CrossRef]
- Ai, S.; Kwon, J. Extreme low-light image enhancement for surveillance cameras using attention U-Net. Sensors 2020, 20, 495. [Google Scholar] [CrossRef]
- Huang, X.; Qian, P.; Liu, M. Latent fingerprint image enhancement based on progressive generative adversarial network. In Proceedings of the Proceedings of the IEEE/CVF Conference on Computer Vision and Pattern Recognition Workshops, 2020, pp.
- Liu, M.; Qian, P. Automatic segmentation and enhancement of latent fingerprints using deep nested unets. IEEE Transactions on Information Forensics and Security 2020, 16, 1709–1719. [Google Scholar] [CrossRef]
- Gavas, E.; Namboodiri, A. Finger-UNet: A U-Net based Multi-Task Architecture for Deep Fingerprint Enhancement. arXiv preprint arXiv:2310.00629, arXiv:2310.00629 2023.
- Askarin, M.M.; Wong, K.; Phan, R.C.W. Reduced contact lifting of latent fingerprints from curved surfaces. Journal of Information Security and Applications 2020, 53, 102520. [Google Scholar] [CrossRef]
- Yin, X.; Zhu, Y.; Hu, J. 3D fingerprint recognition based on ridge-valley-guided 3D reconstruction and 3D topology polymer feature extraction. IEEE transactions on pattern analysis and machine intelligence 2019, 43, 1085–1091. [Google Scholar] [CrossRef] [PubMed]
- Kumar, A. The Hong Kong Polytechnic University 3D Fingerprint Images Database Version 2.0. https://web.comp.polyu.edu.hk, 2015. (accessed ). 1 May.
- Neurotechnology. VeriFinger 13.1 SDK. http://www.neurotechnology.com/verifinger.html, 2024. (accessed 1 Jully 2024).
- National Institute of Standards.; Technology. MINDTCT. https: //www.nist.gov/, 2010.
- Microsoft. Microsoft Windows 11. https://www.microsoft.com, 2024. (accessed 1 Jully 2024).
- MathWorks. Matlab R2023b. https://au.mathworks.com, 2024. (accessed 1 Jully 2024).
- JetBrains. Pycharm. https://www.jetbrains.com/pycharm/, 2024. (accessed 1 Jully 2024).
- Microsoft. Visual Studio. https://visualstudio.microsoft.com/, 2022. (accessed 1 Jully 2024).
Figure 1.
(a) shows a sample 3D fingerprint point cloud. (b) shows the flattened 3D point cloud by using Cylinder surface fitting [10].
Figure 1.
(a) shows a sample 3D fingerprint point cloud. (b) shows the flattened 3D point cloud by using Cylinder surface fitting [10].
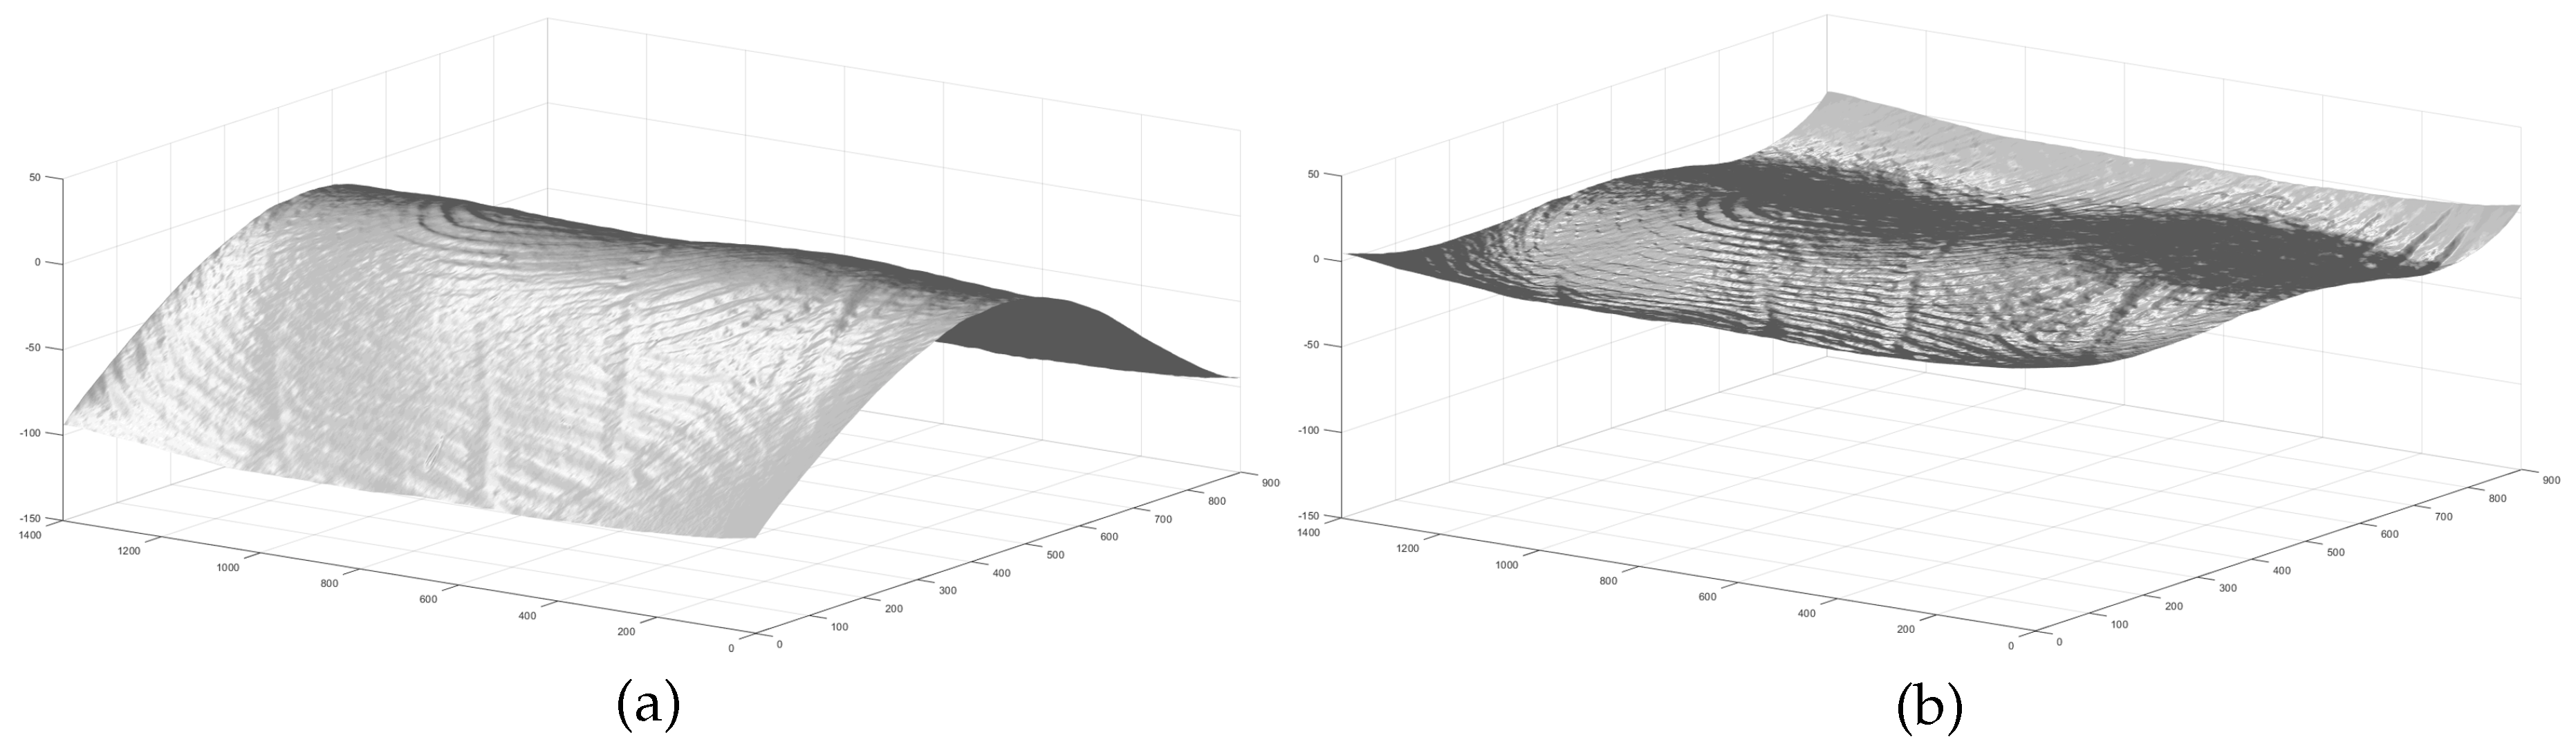
Figure 2.
(a) shows a generated gray-scale image from the sample 3D fingerprint point cloud in Figure 1a. (b) shows the generated gray-scale image from the flattened 3D point cloud in Figure 1b.
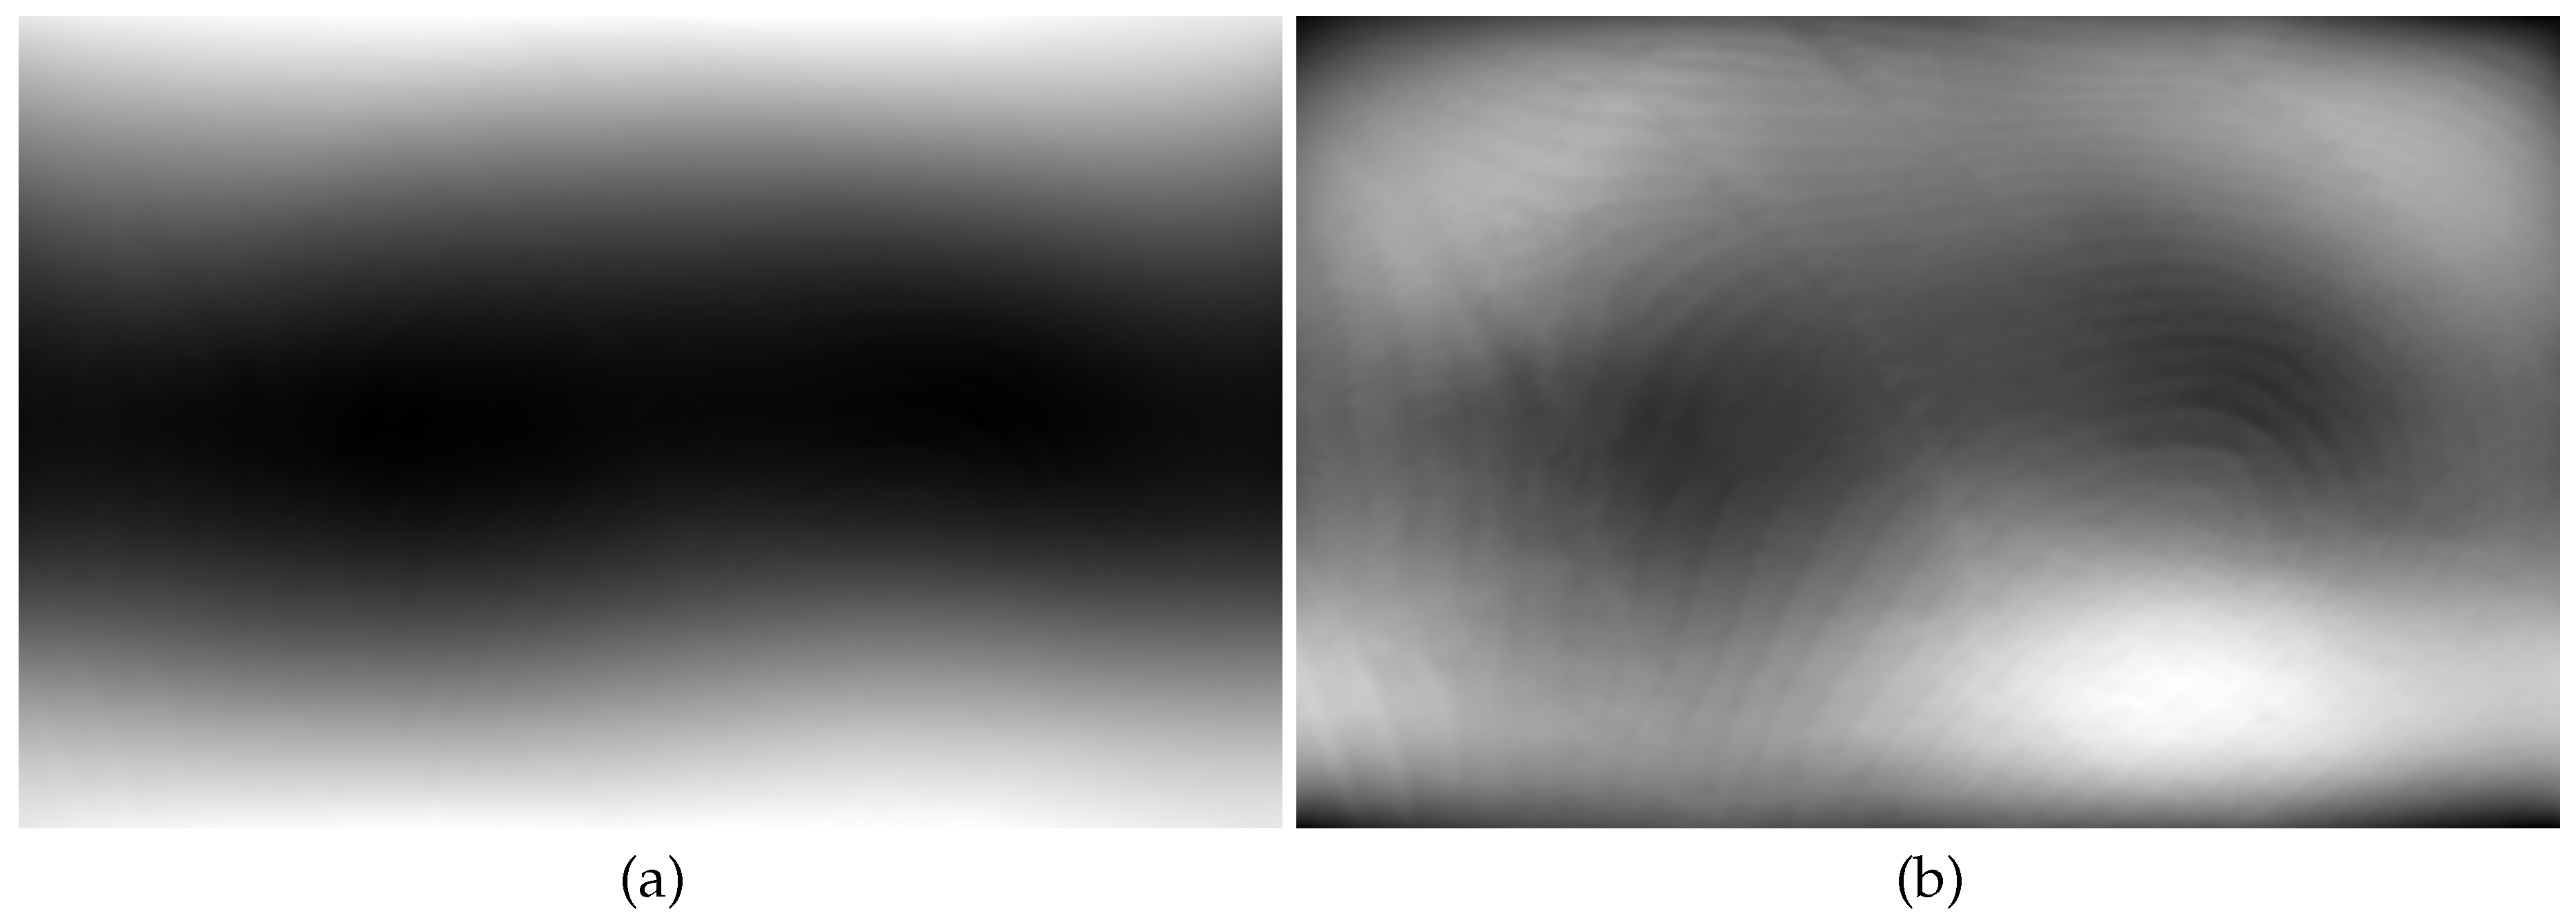
Figure 3.
Processes used in the proposed method for generating the training data for U-Net based full image training.
Figure 3.
Processes used in the proposed method for generating the training data for U-Net based full image training.
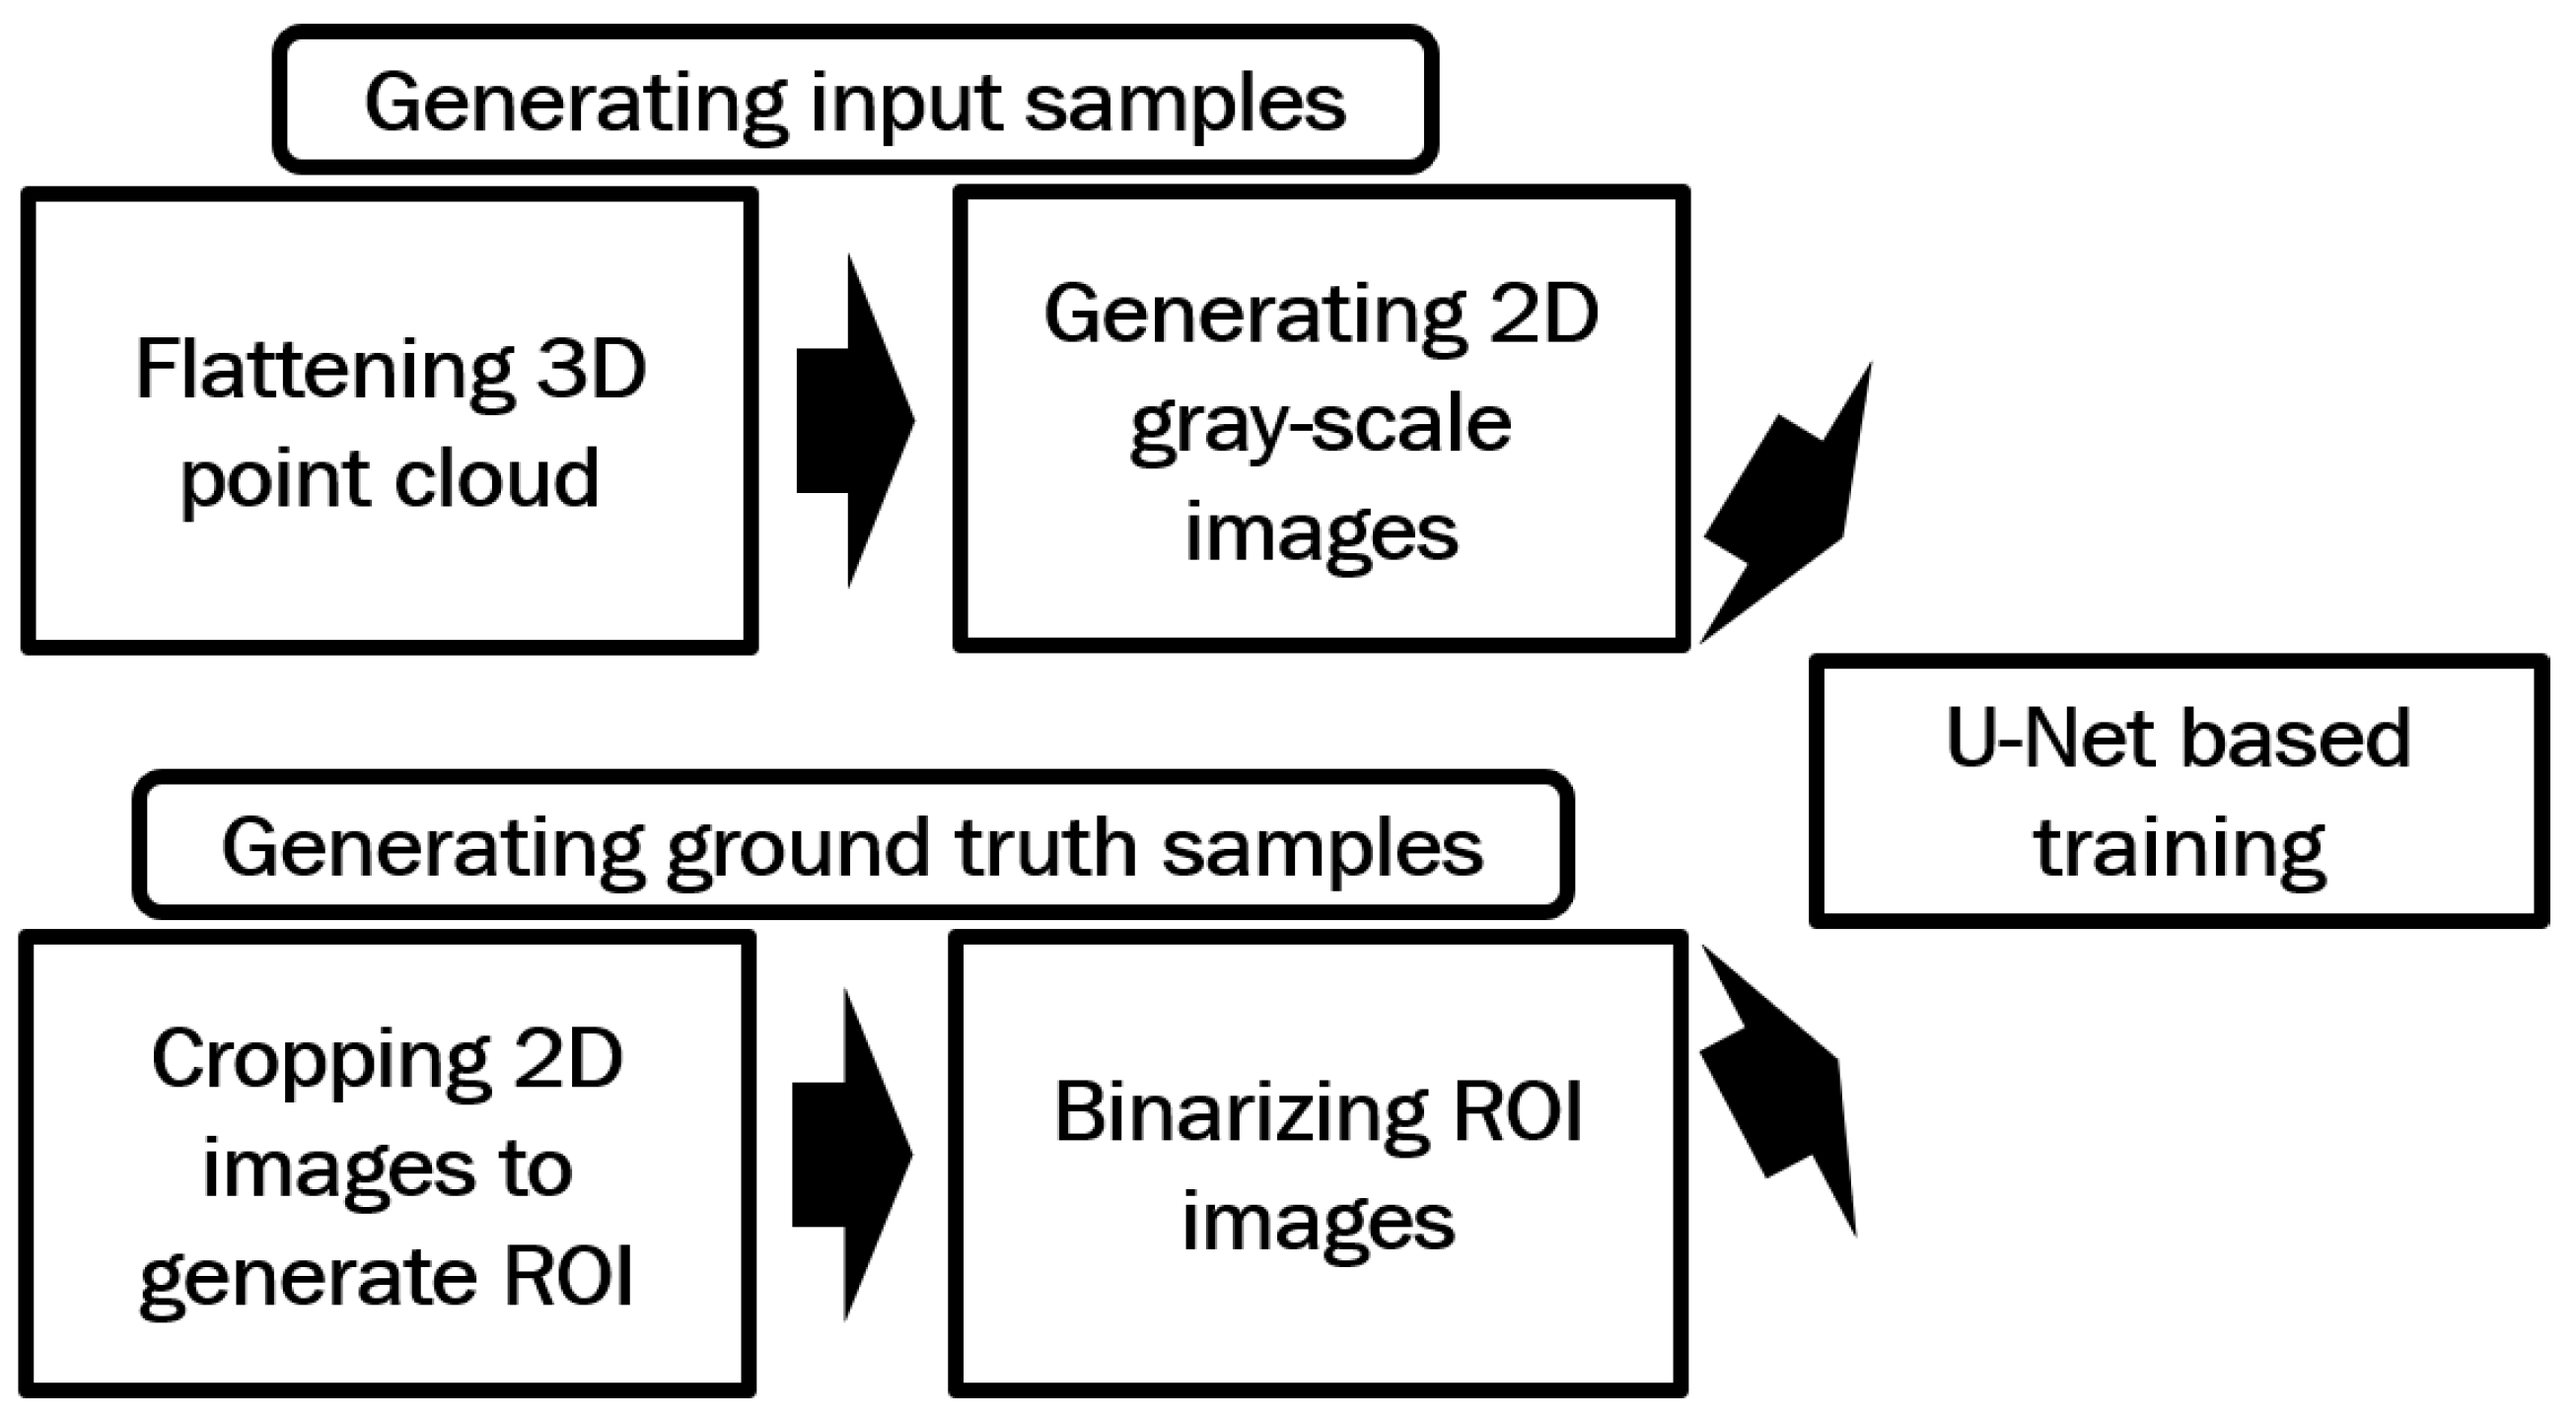
Figure 4.
A sample 2D image and its corresponding ROI are shown in (a) and (b) respectively.
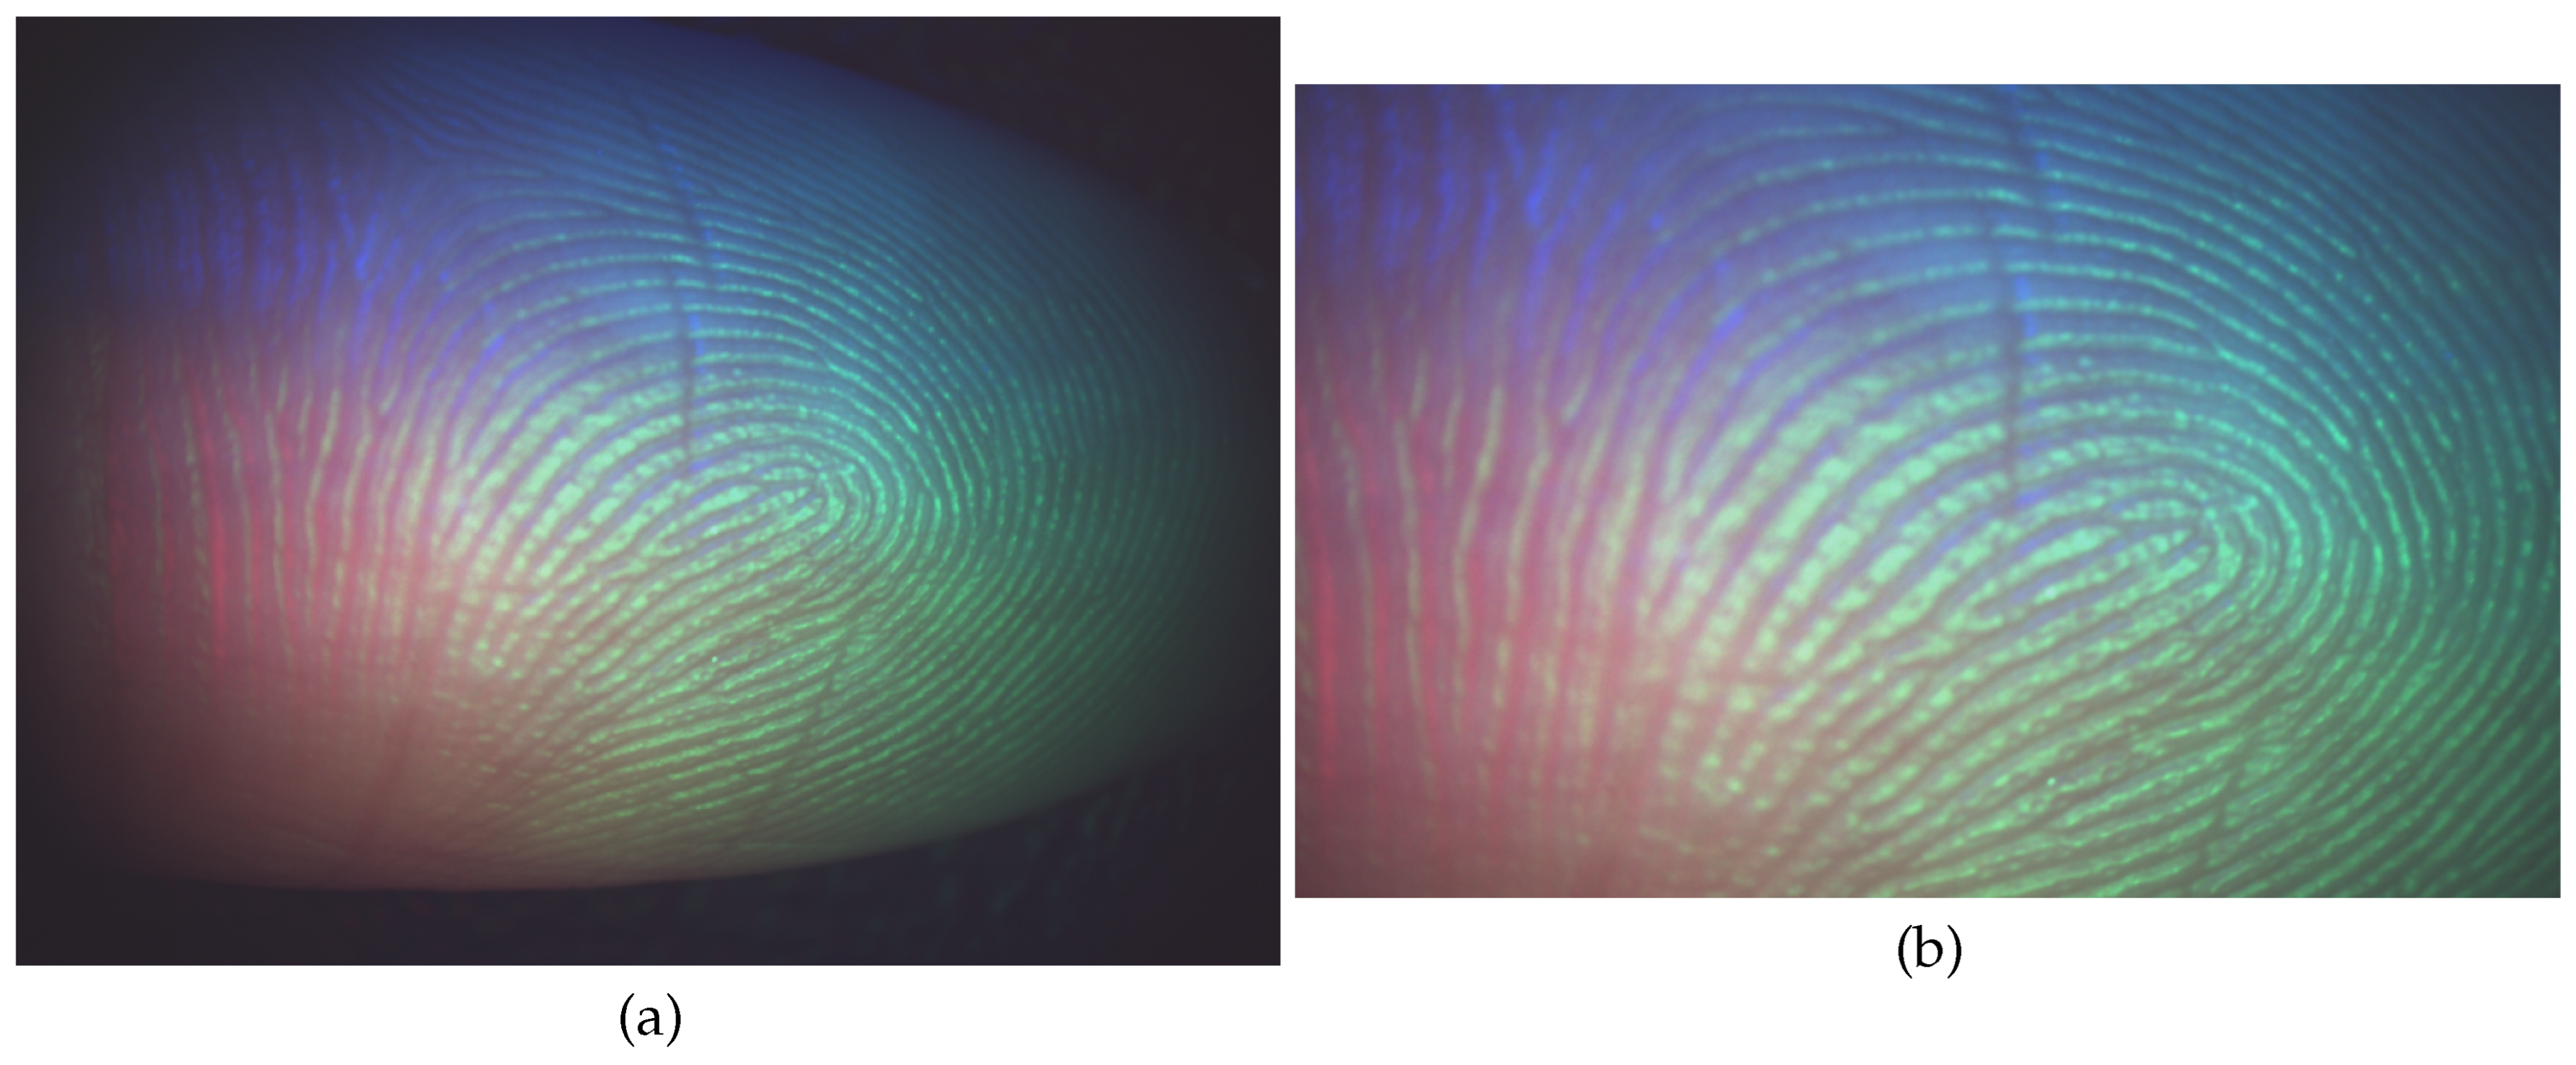
Figure 5.
A sample intensity pattern of a section of a binarized image ranging from 0 to 255. The black lines show the position of the ridge patterns and the area in the middle of the black lines shows the position of the valley.
Figure 5.
A sample intensity pattern of a section of a binarized image ranging from 0 to 255. The black lines show the position of the ridge patterns and the area in the middle of the black lines shows the position of the valley.
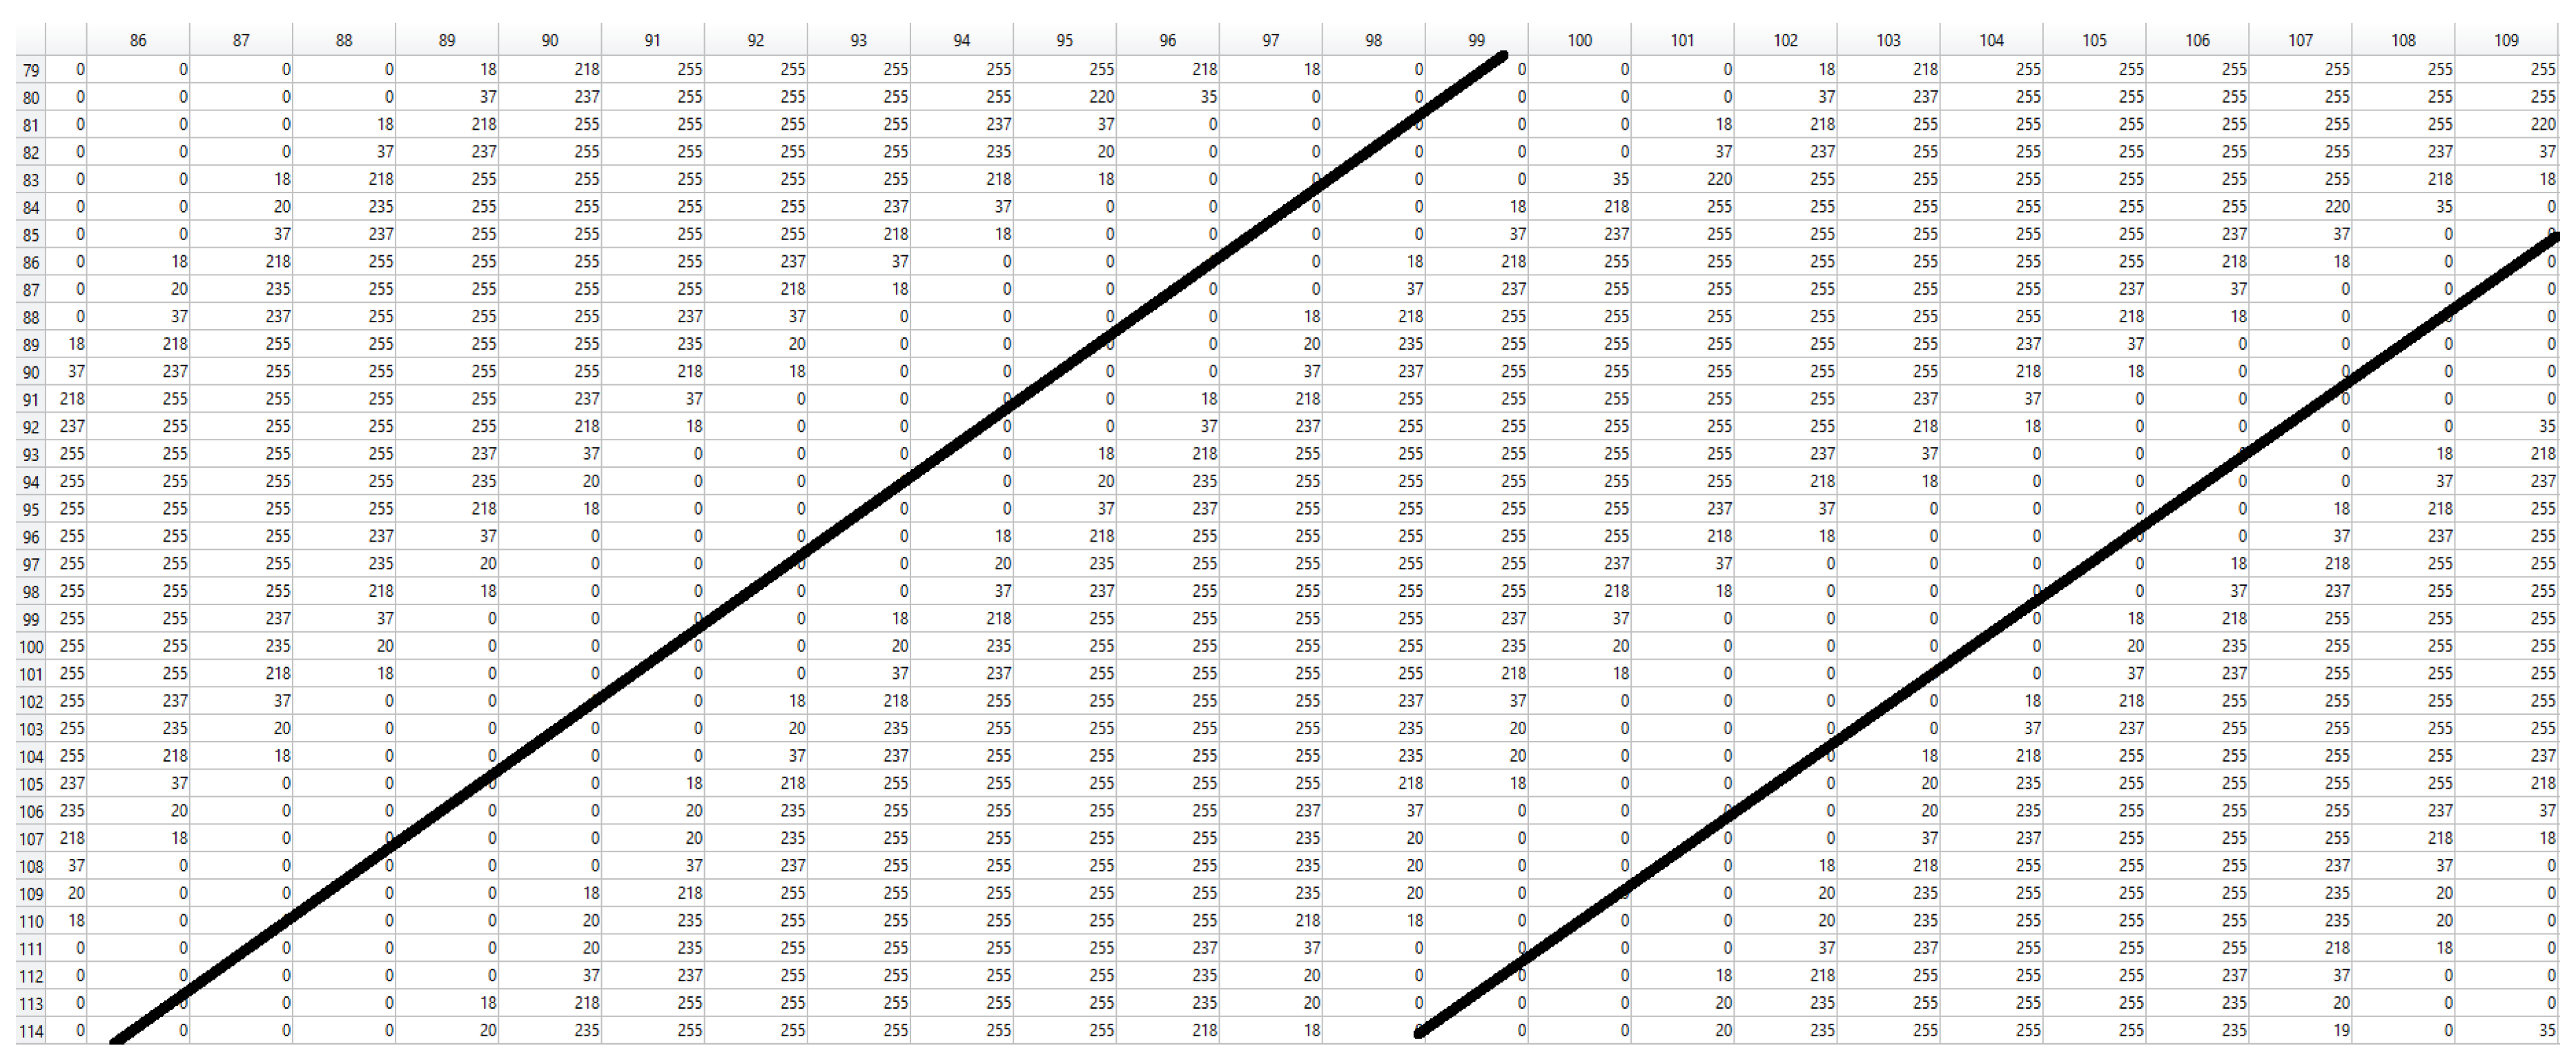
Figure 6.
A sample binarized image from Figure 4a shown in (a). (b) shows a sample binarized image with blank sections.
Figure 6.
A sample binarized image from Figure 4a shown in (a). (b) shows a sample binarized image with blank sections.
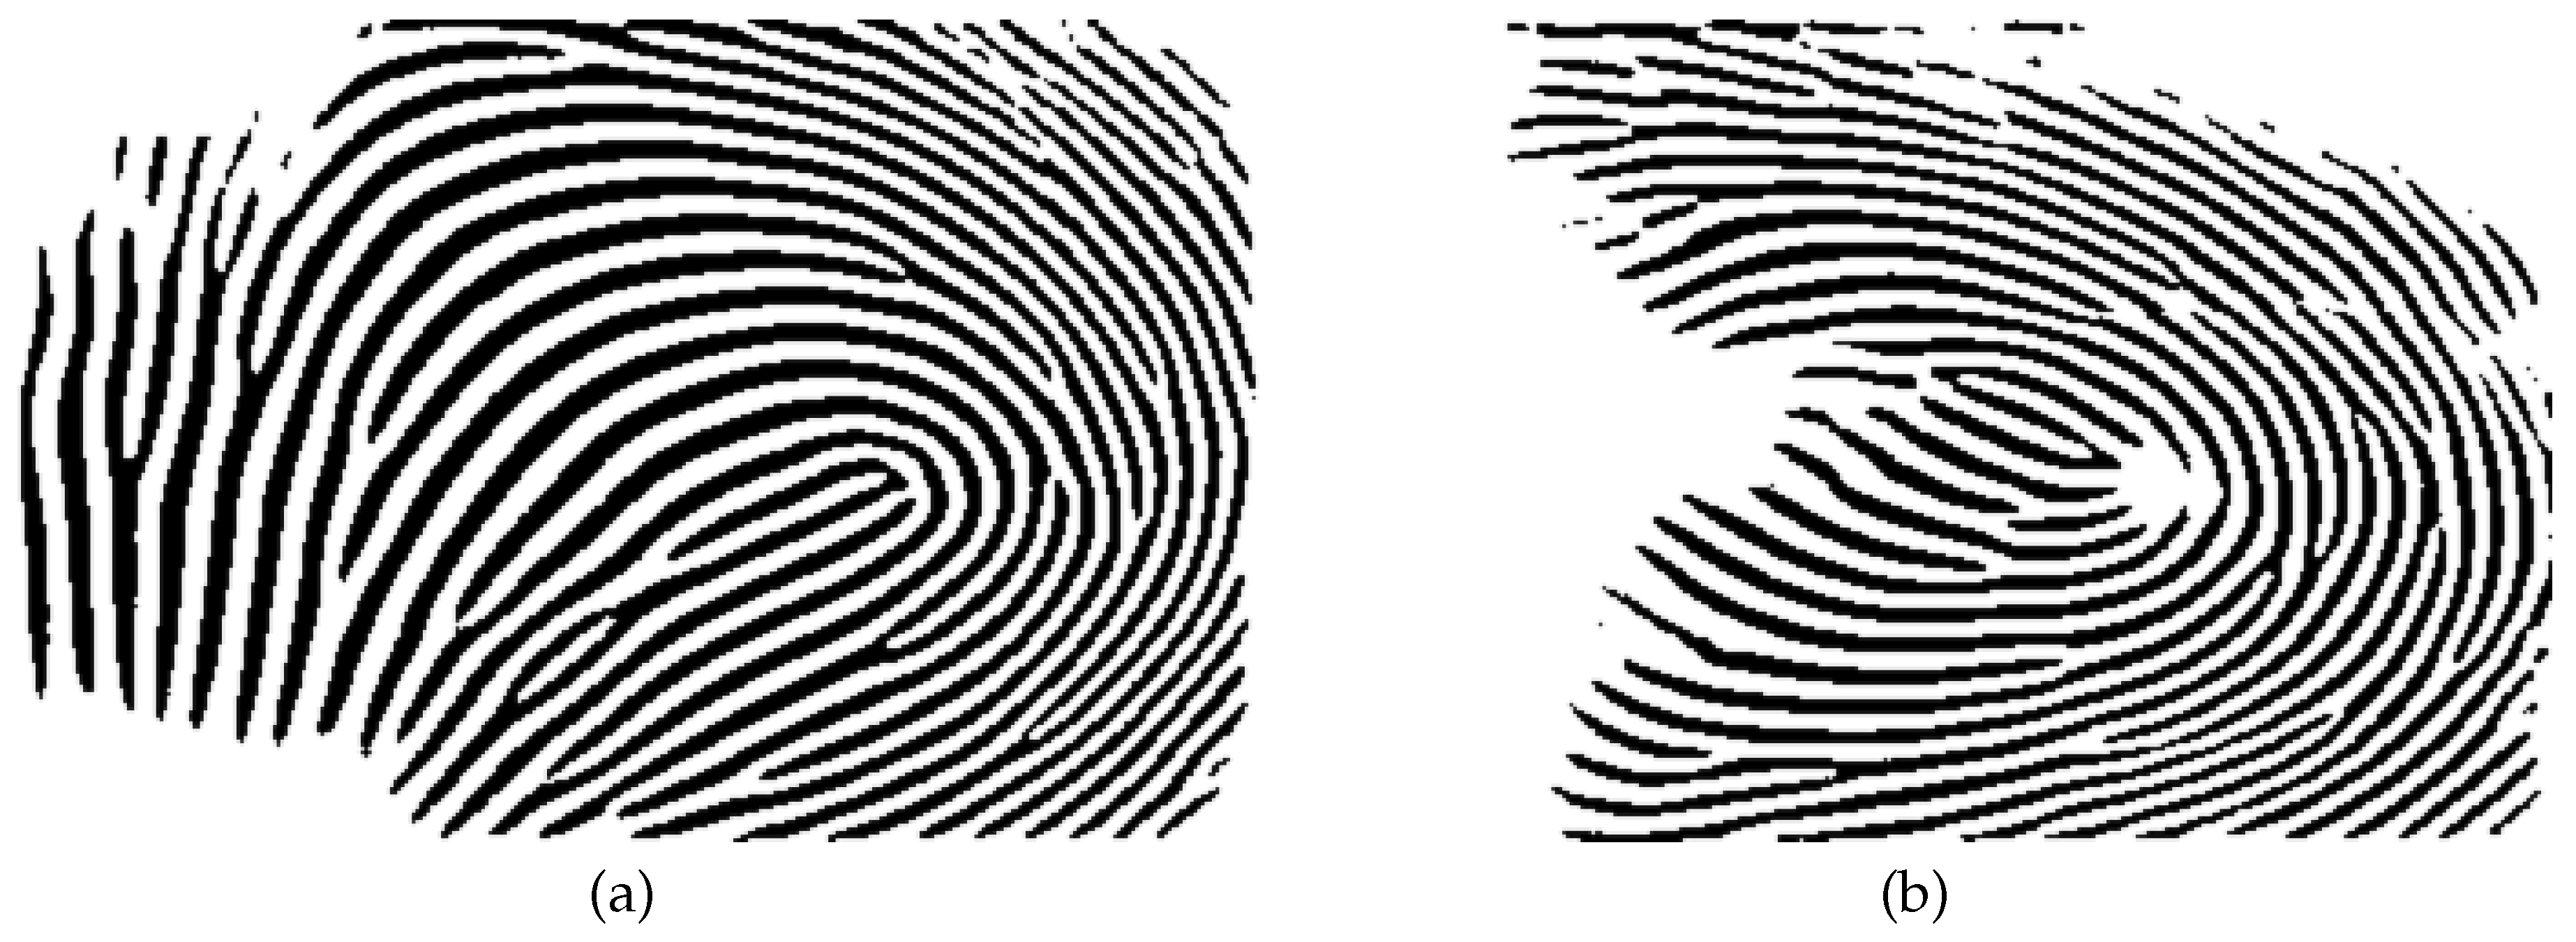
Figure 7.
The U-Net model that we used to enhance fingerprint images.
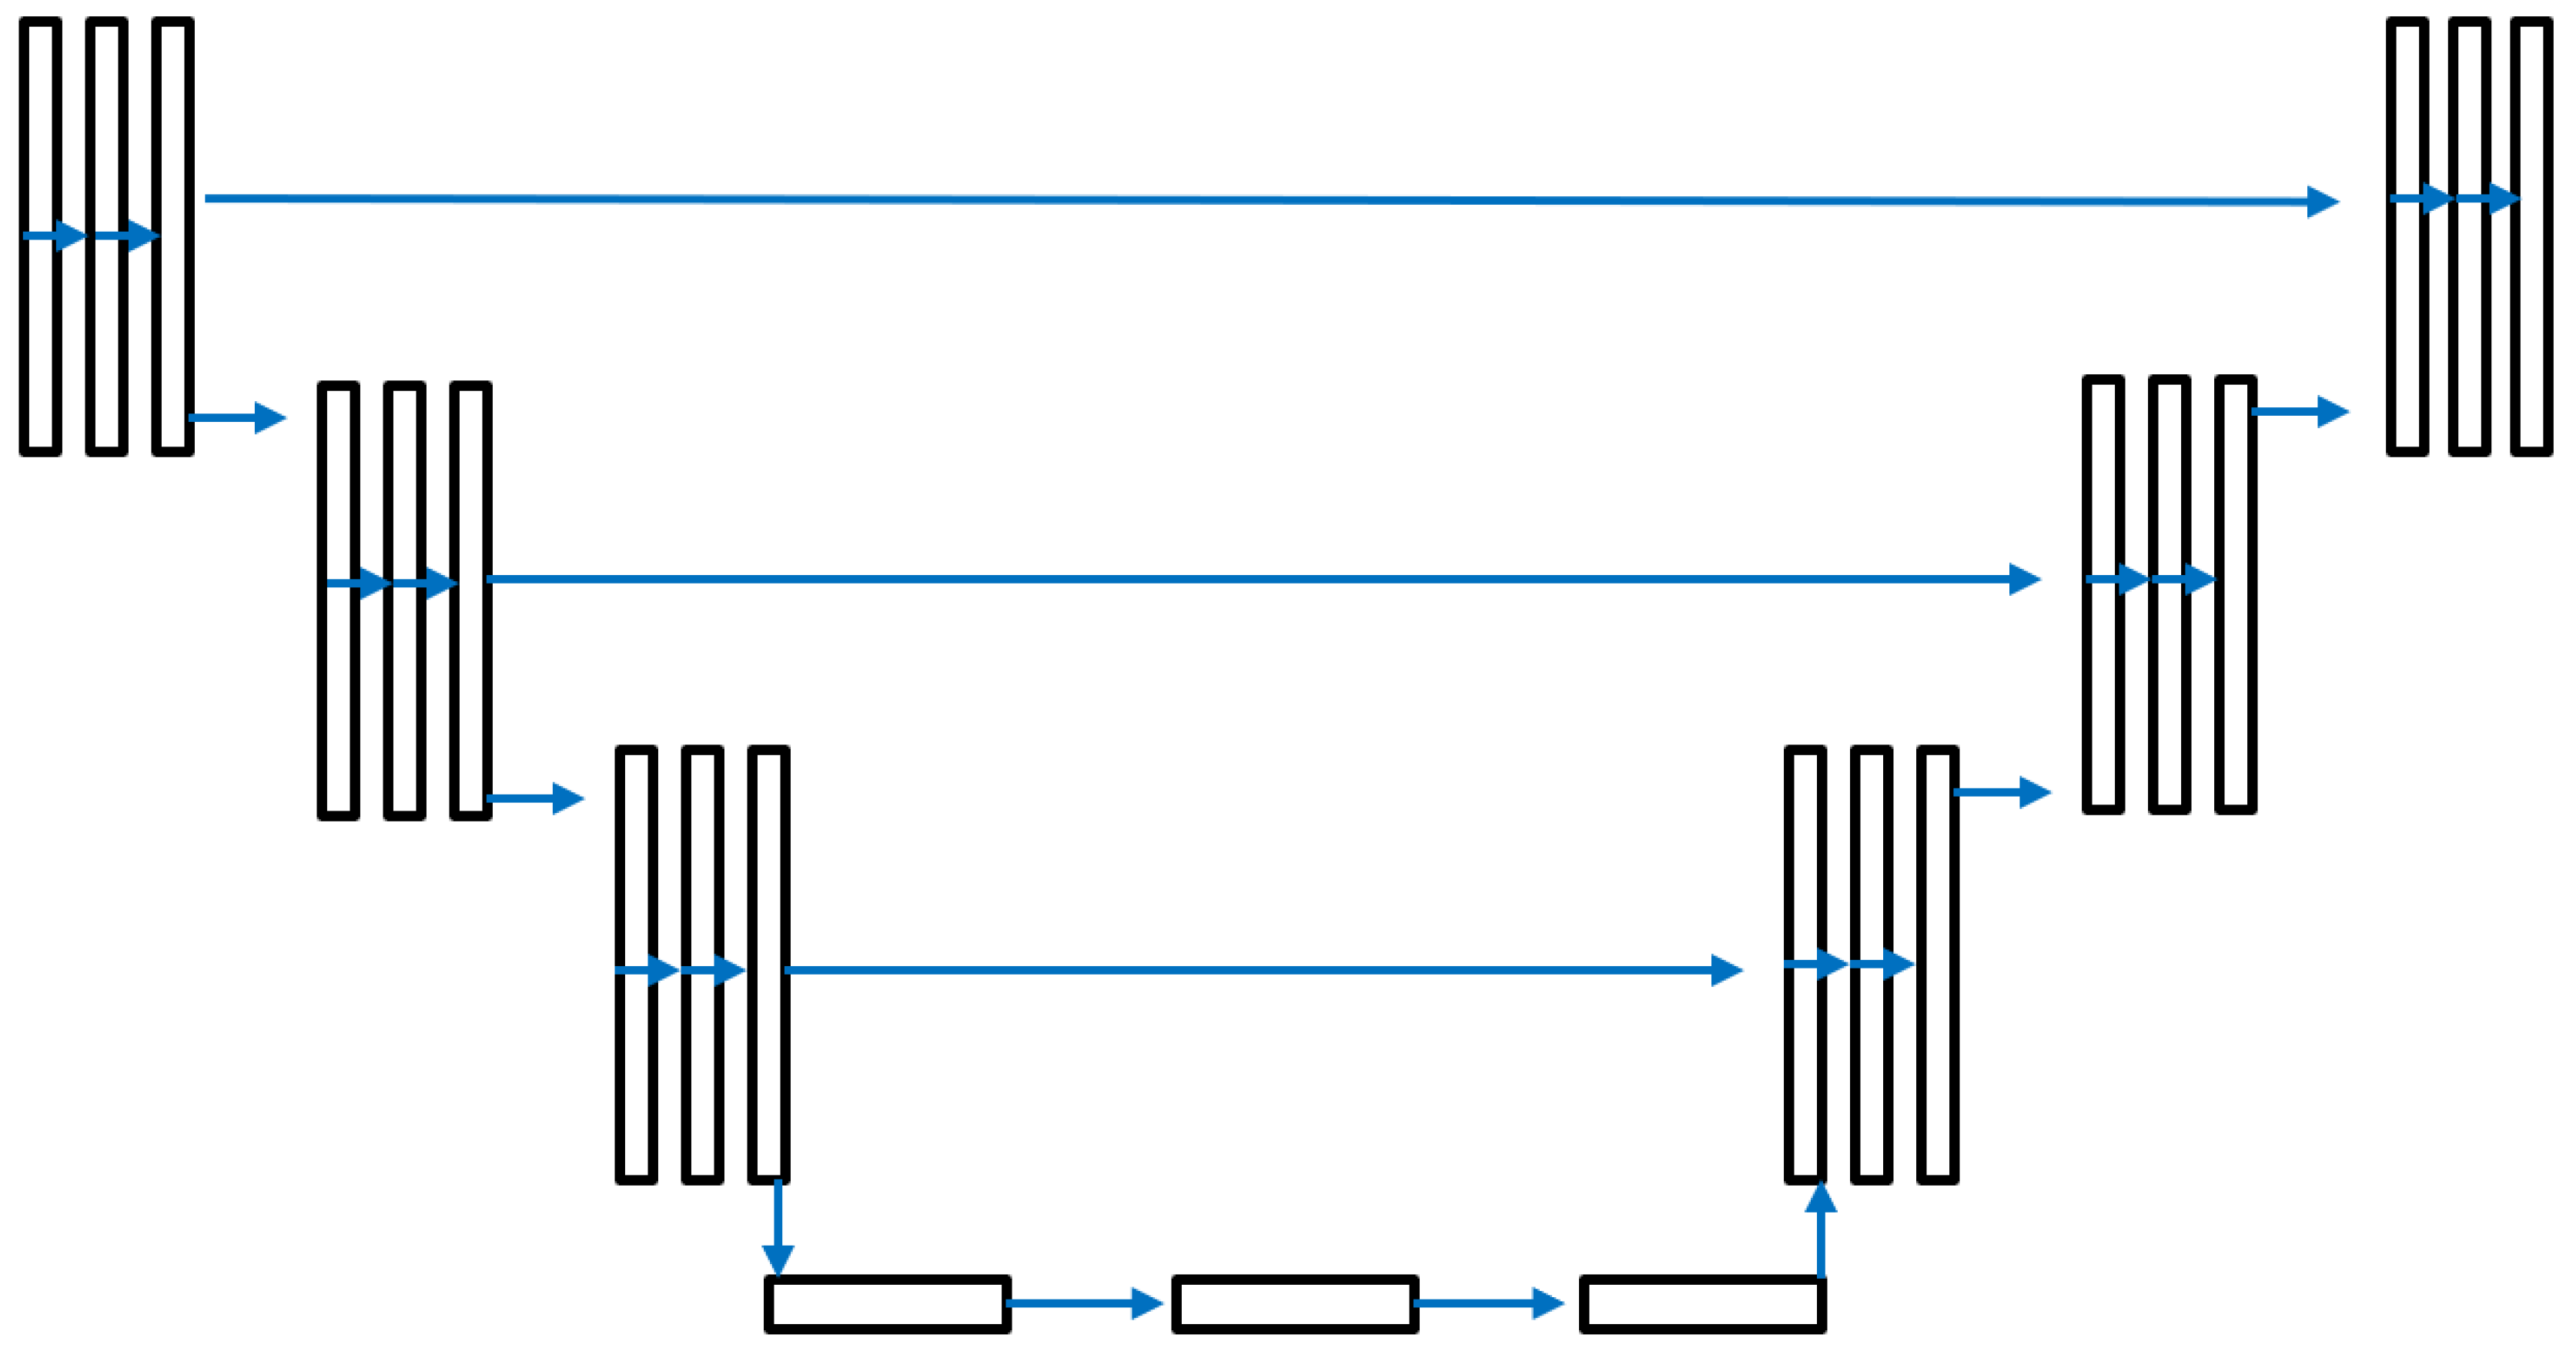
Figure 8.
(a) shows a sample generated gray-scale image, and (b) shows the enhanced image using U-Net-based full image fingerprint enhancement.
Figure 8.
(a) shows a sample generated gray-scale image, and (b) shows the enhanced image using U-Net-based full image fingerprint enhancement.
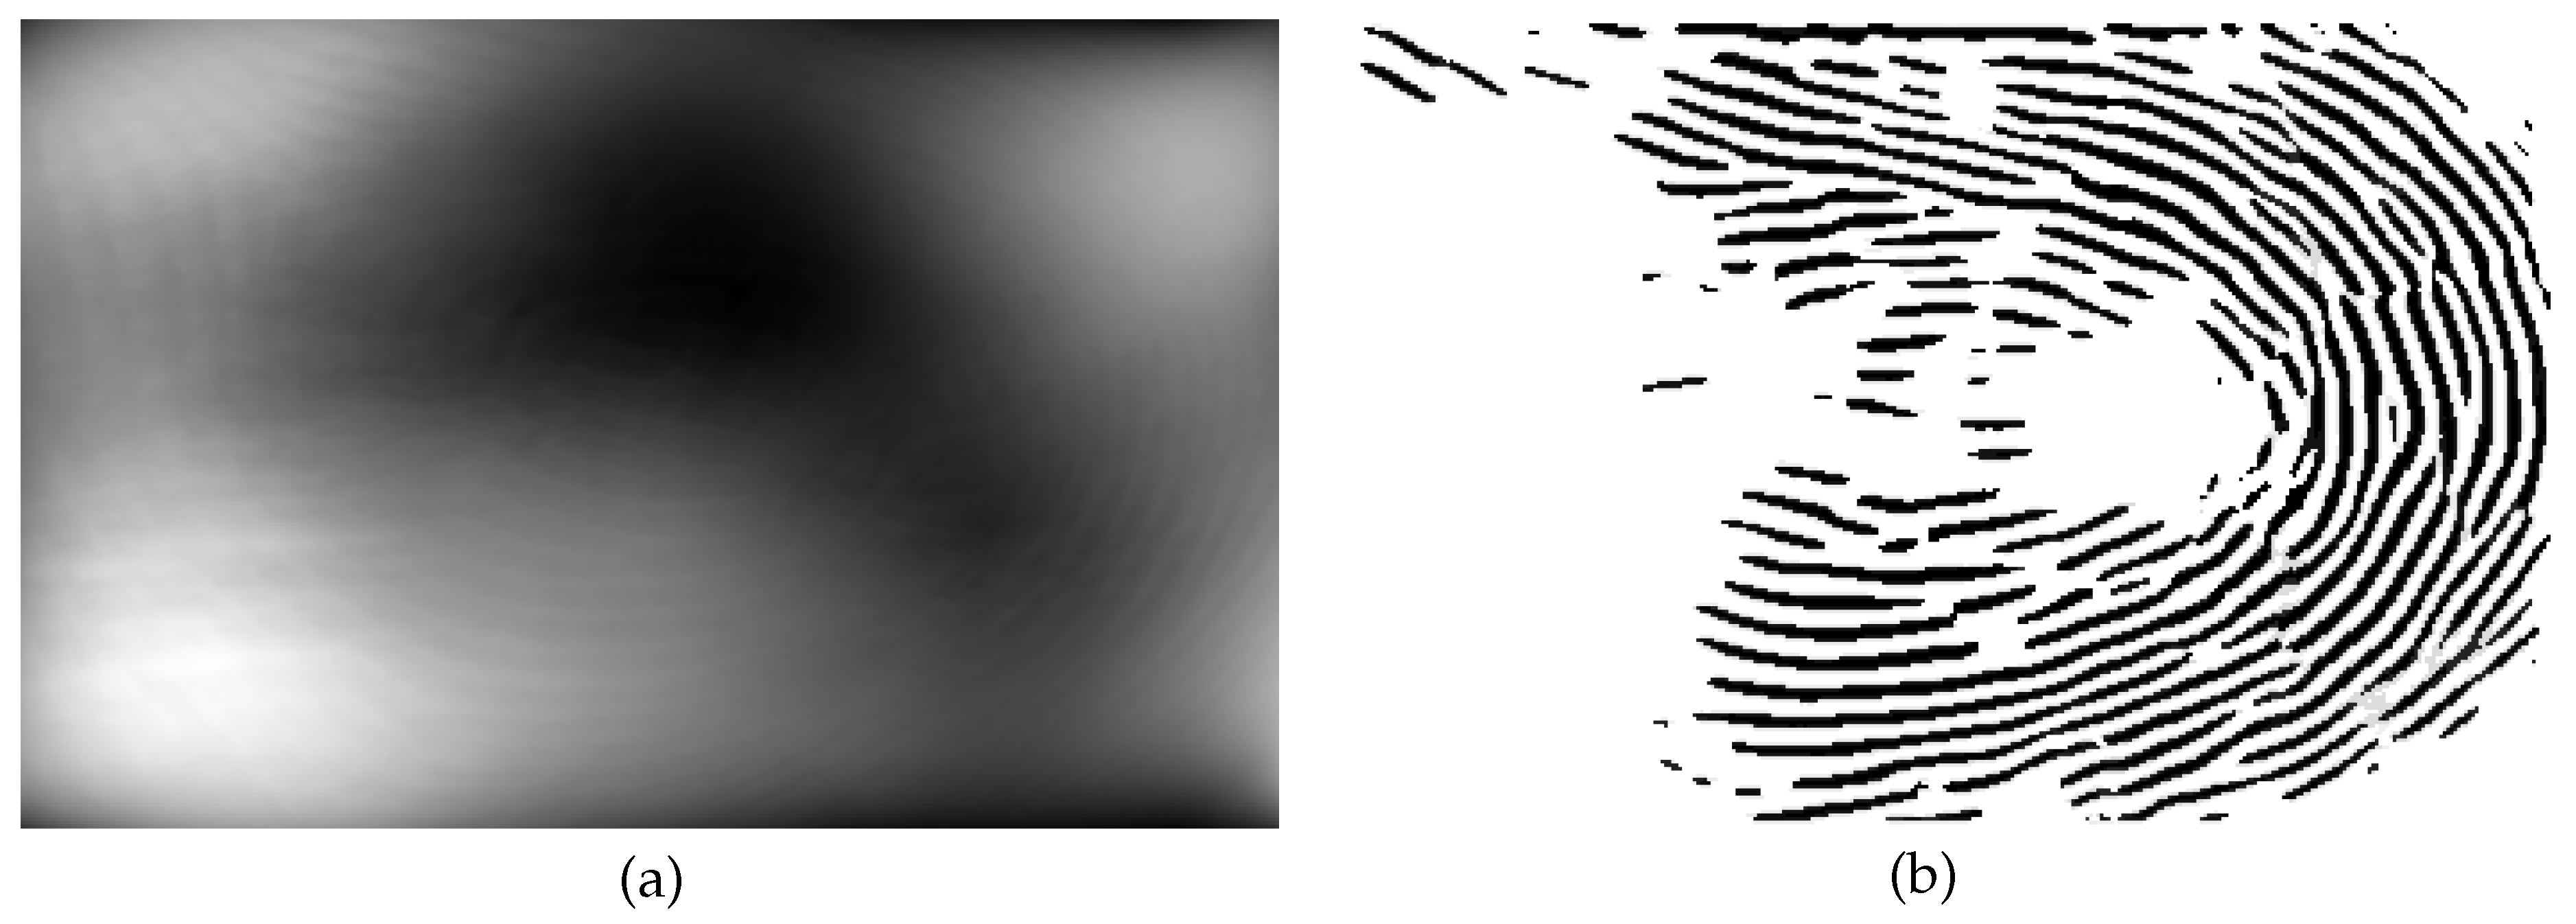
Figure 9.
Processes used in the proposed method for generating the training data for patch-based U-Net training.
Figure 9.
Processes used in the proposed method for generating the training data for patch-based U-Net training.
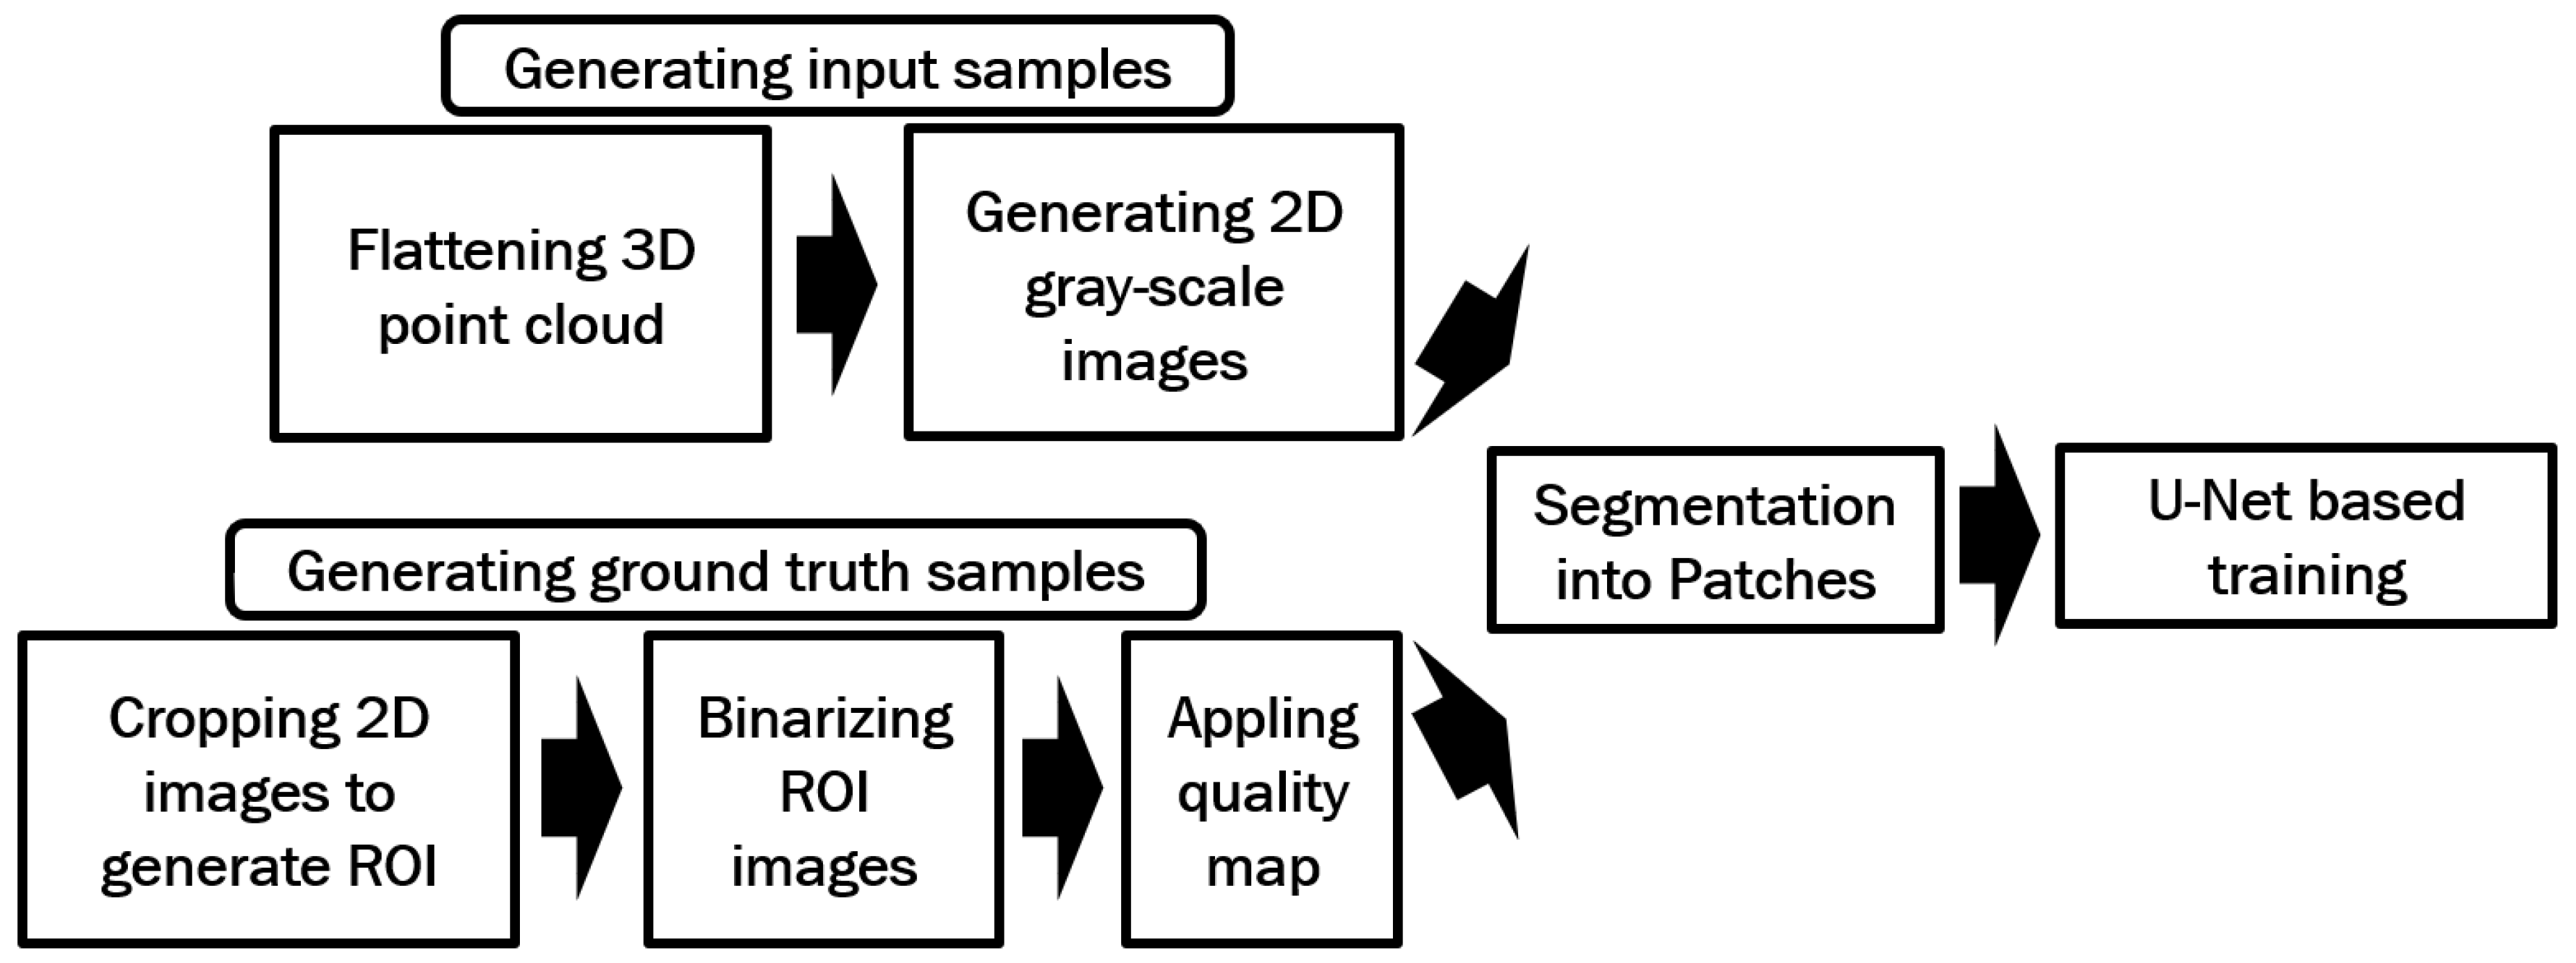
Figure 10.
A comparison of the binarized ROI images obtained using the method described in Section 2.2.1 and those generated in Section 2.2.2 is shown in (a) and (b), respectively.
Figure 10.
A comparison of the binarized ROI images obtained using the method described in Section 2.2.1 and those generated in Section 2.2.2 is shown in (a) and (b), respectively.
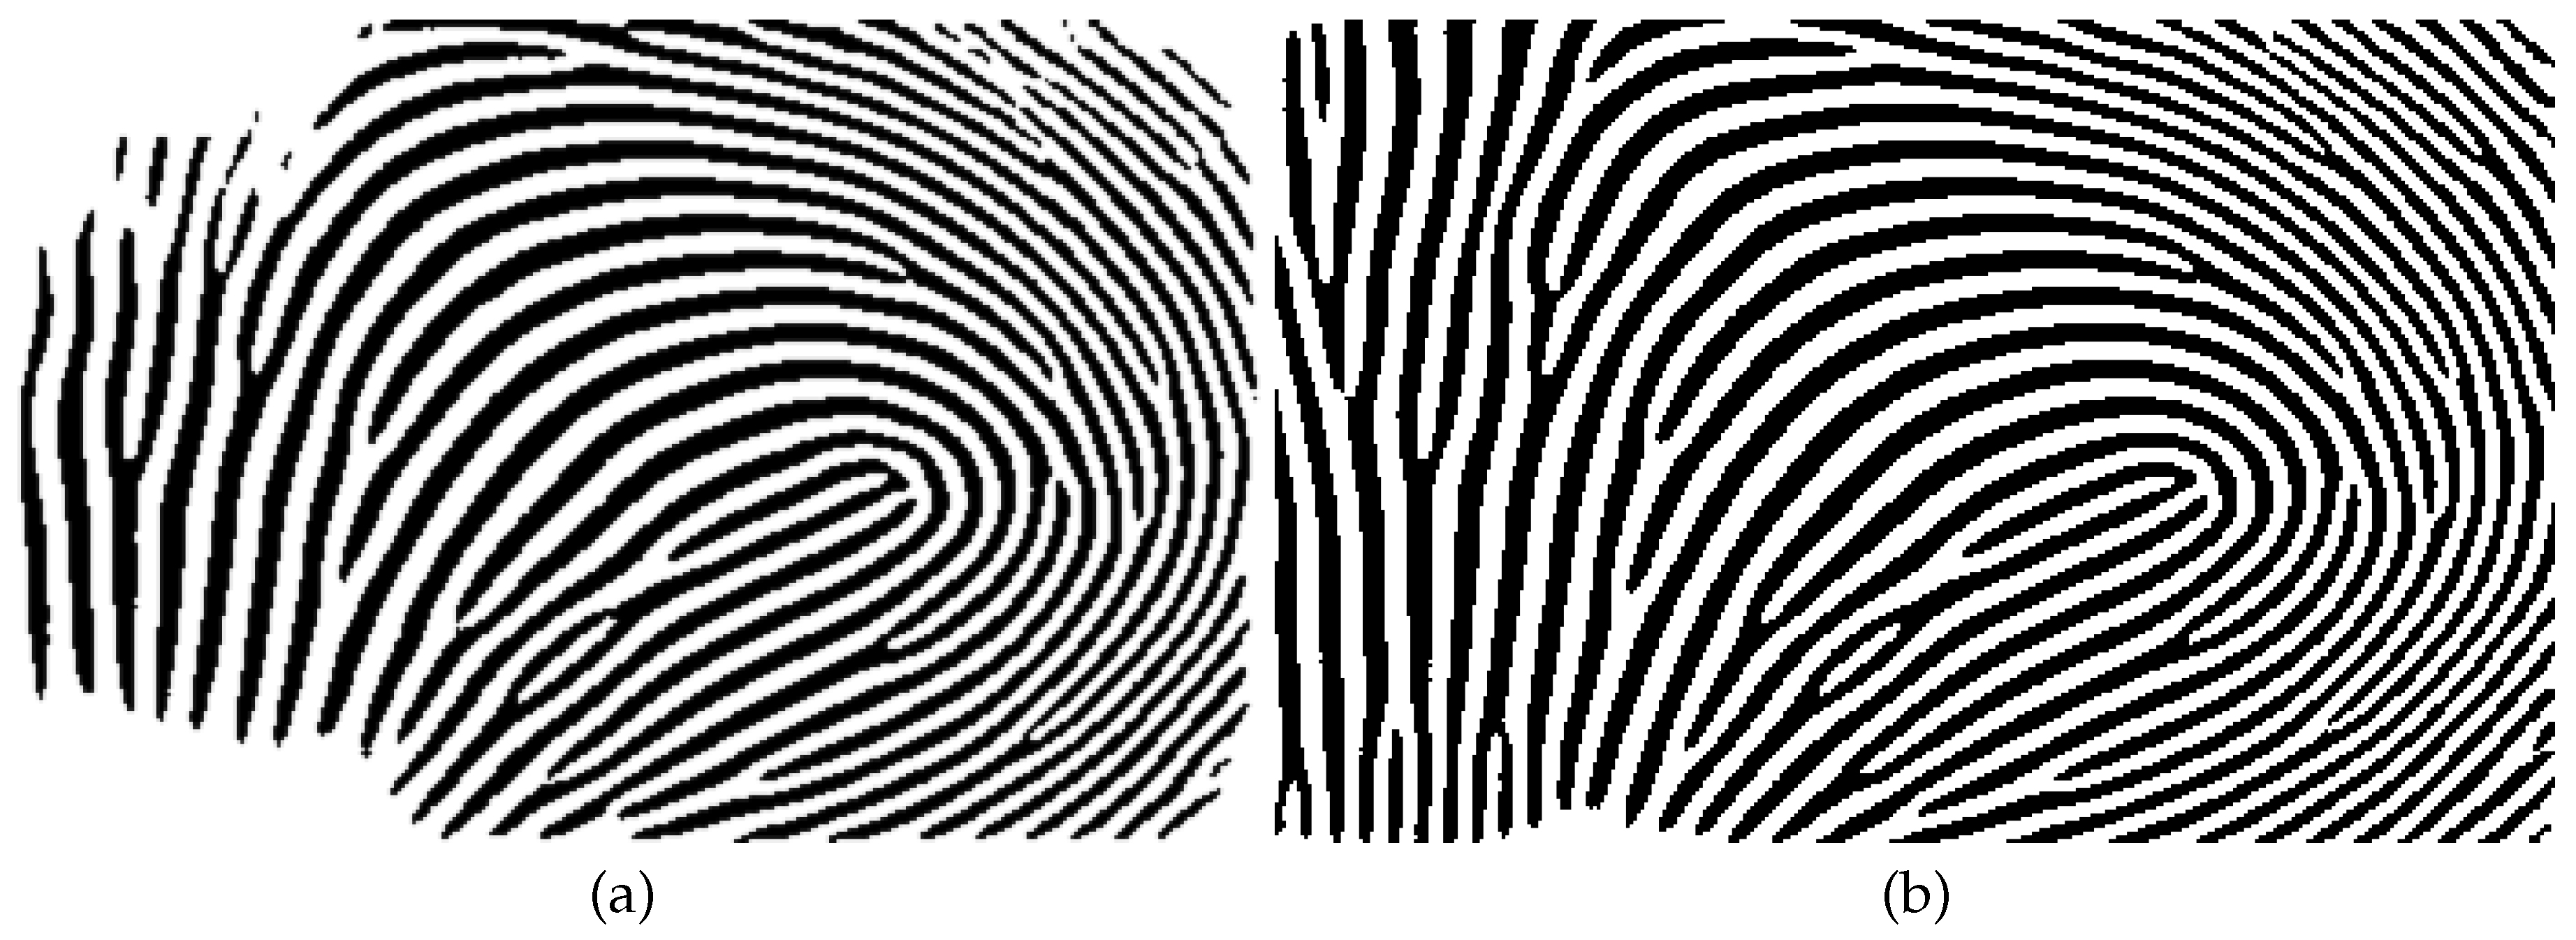
Figure 11.
The intensity pattern in a section of a sample binarized ROI image is shown.

Figure 12.
A sample binarized image shown in (a), and its quality-mapped image by excluding lowest quality sections (quality 0, and quality 1) is shown in (b).
Figure 12.
A sample binarized image shown in (a), and its quality-mapped image by excluding lowest quality sections (quality 0, and quality 1) is shown in (b).
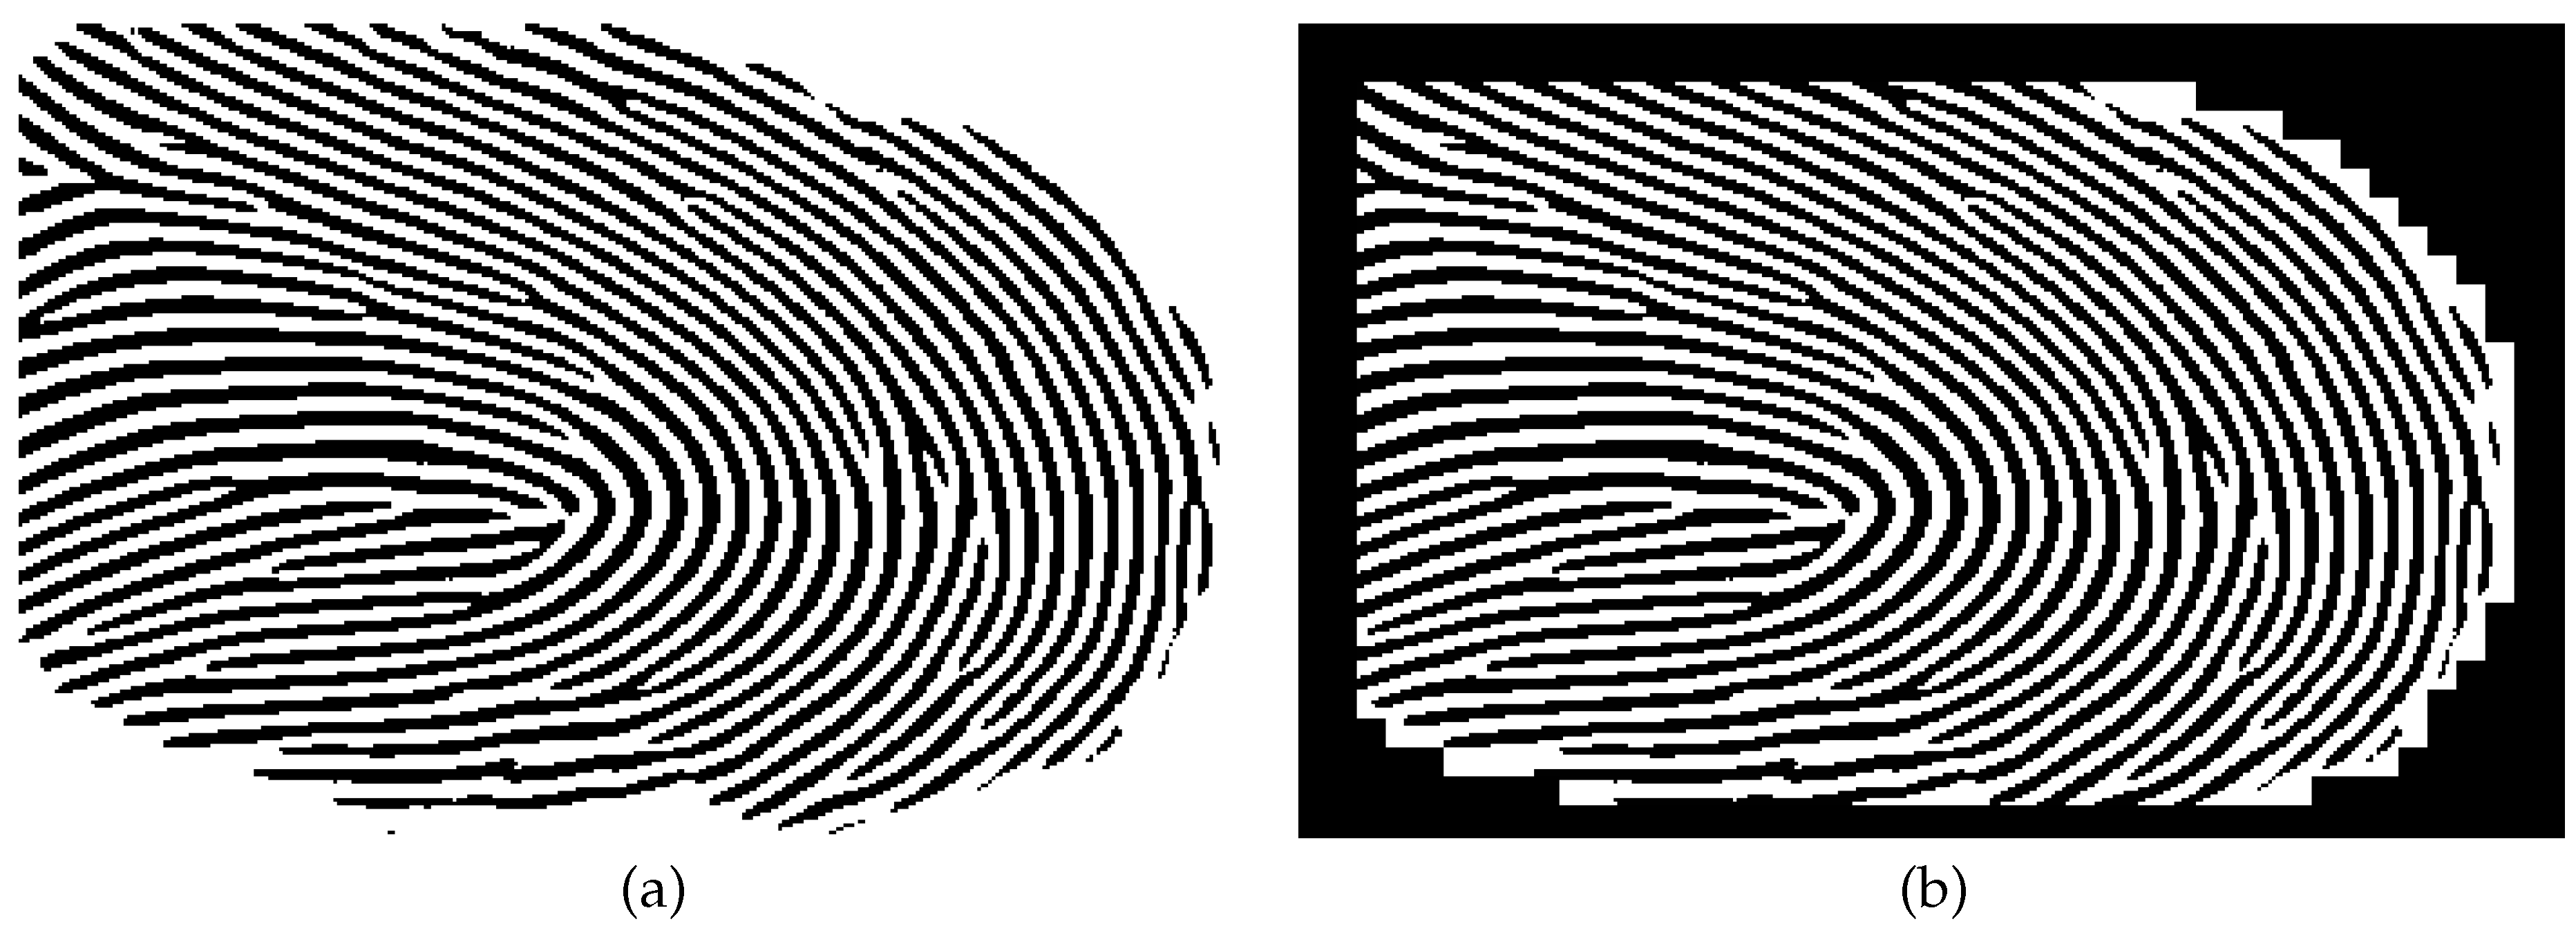
Figure 13.
A sample enhanced fingerprint image by merging the enhanced patches. The trained U-Net model were used the enhance the patches.
Figure 13.
A sample enhanced fingerprint image by merging the enhanced patches. The trained U-Net model were used the enhance the patches.
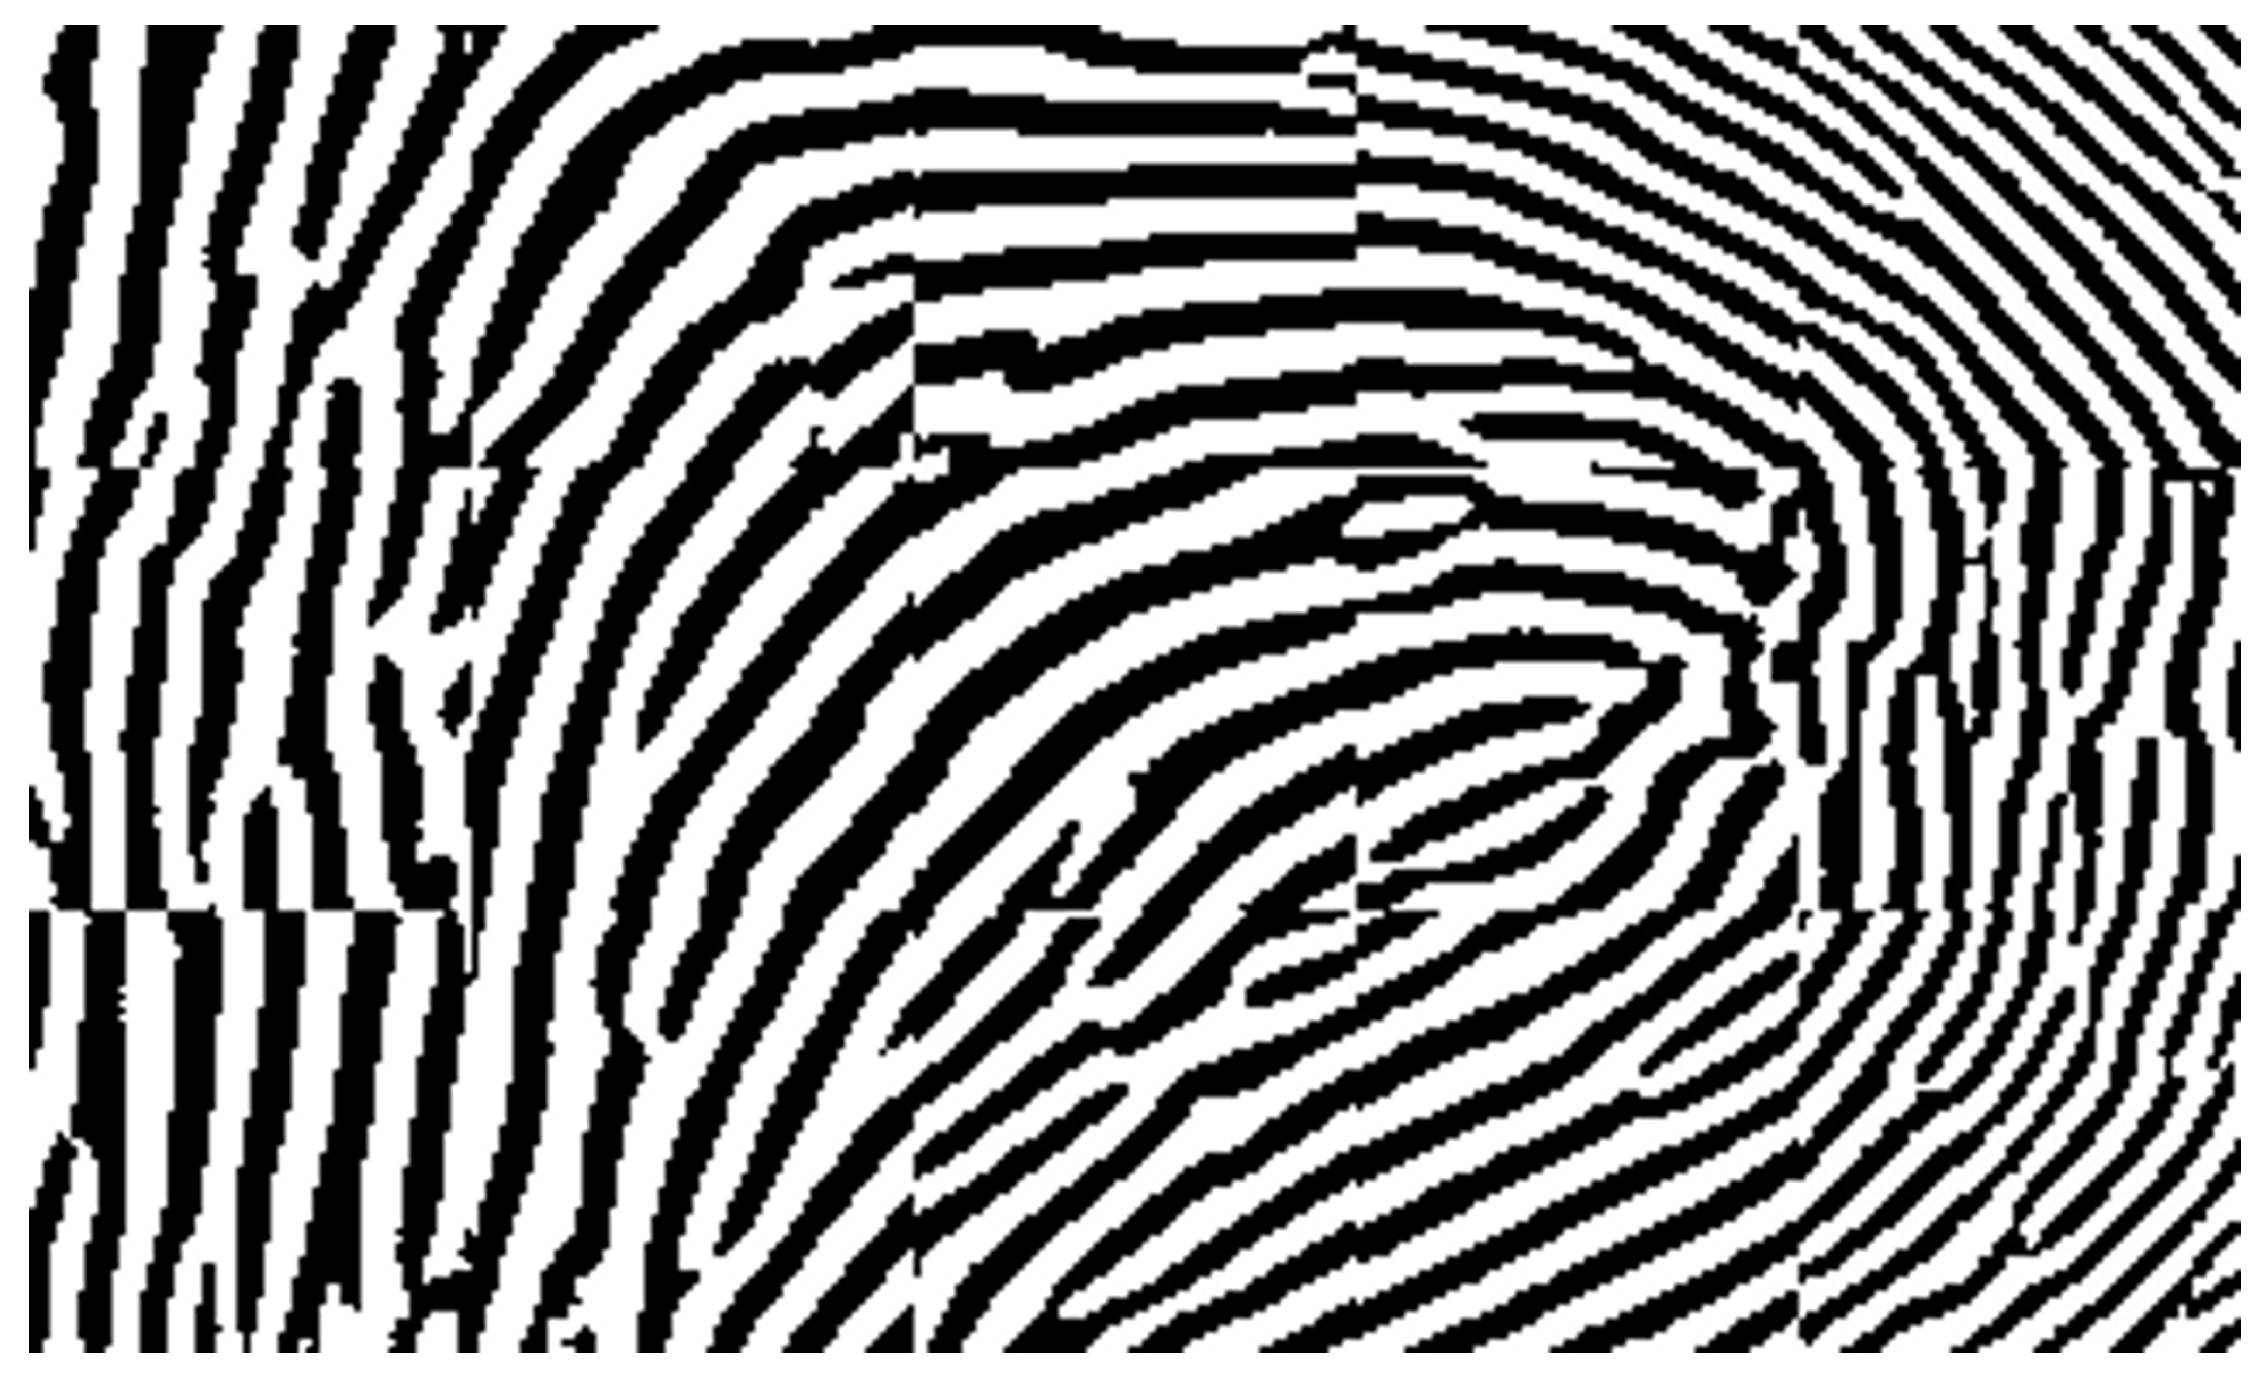
Figure 14.
A sample enhanced fingerprint image by merging the enhanced patches shown in (a) with patch size 32, and (b) with the patch size 112 pizels.
Figure 14.
A sample enhanced fingerprint image by merging the enhanced patches shown in (a) with patch size 32, and (b) with the patch size 112 pizels.
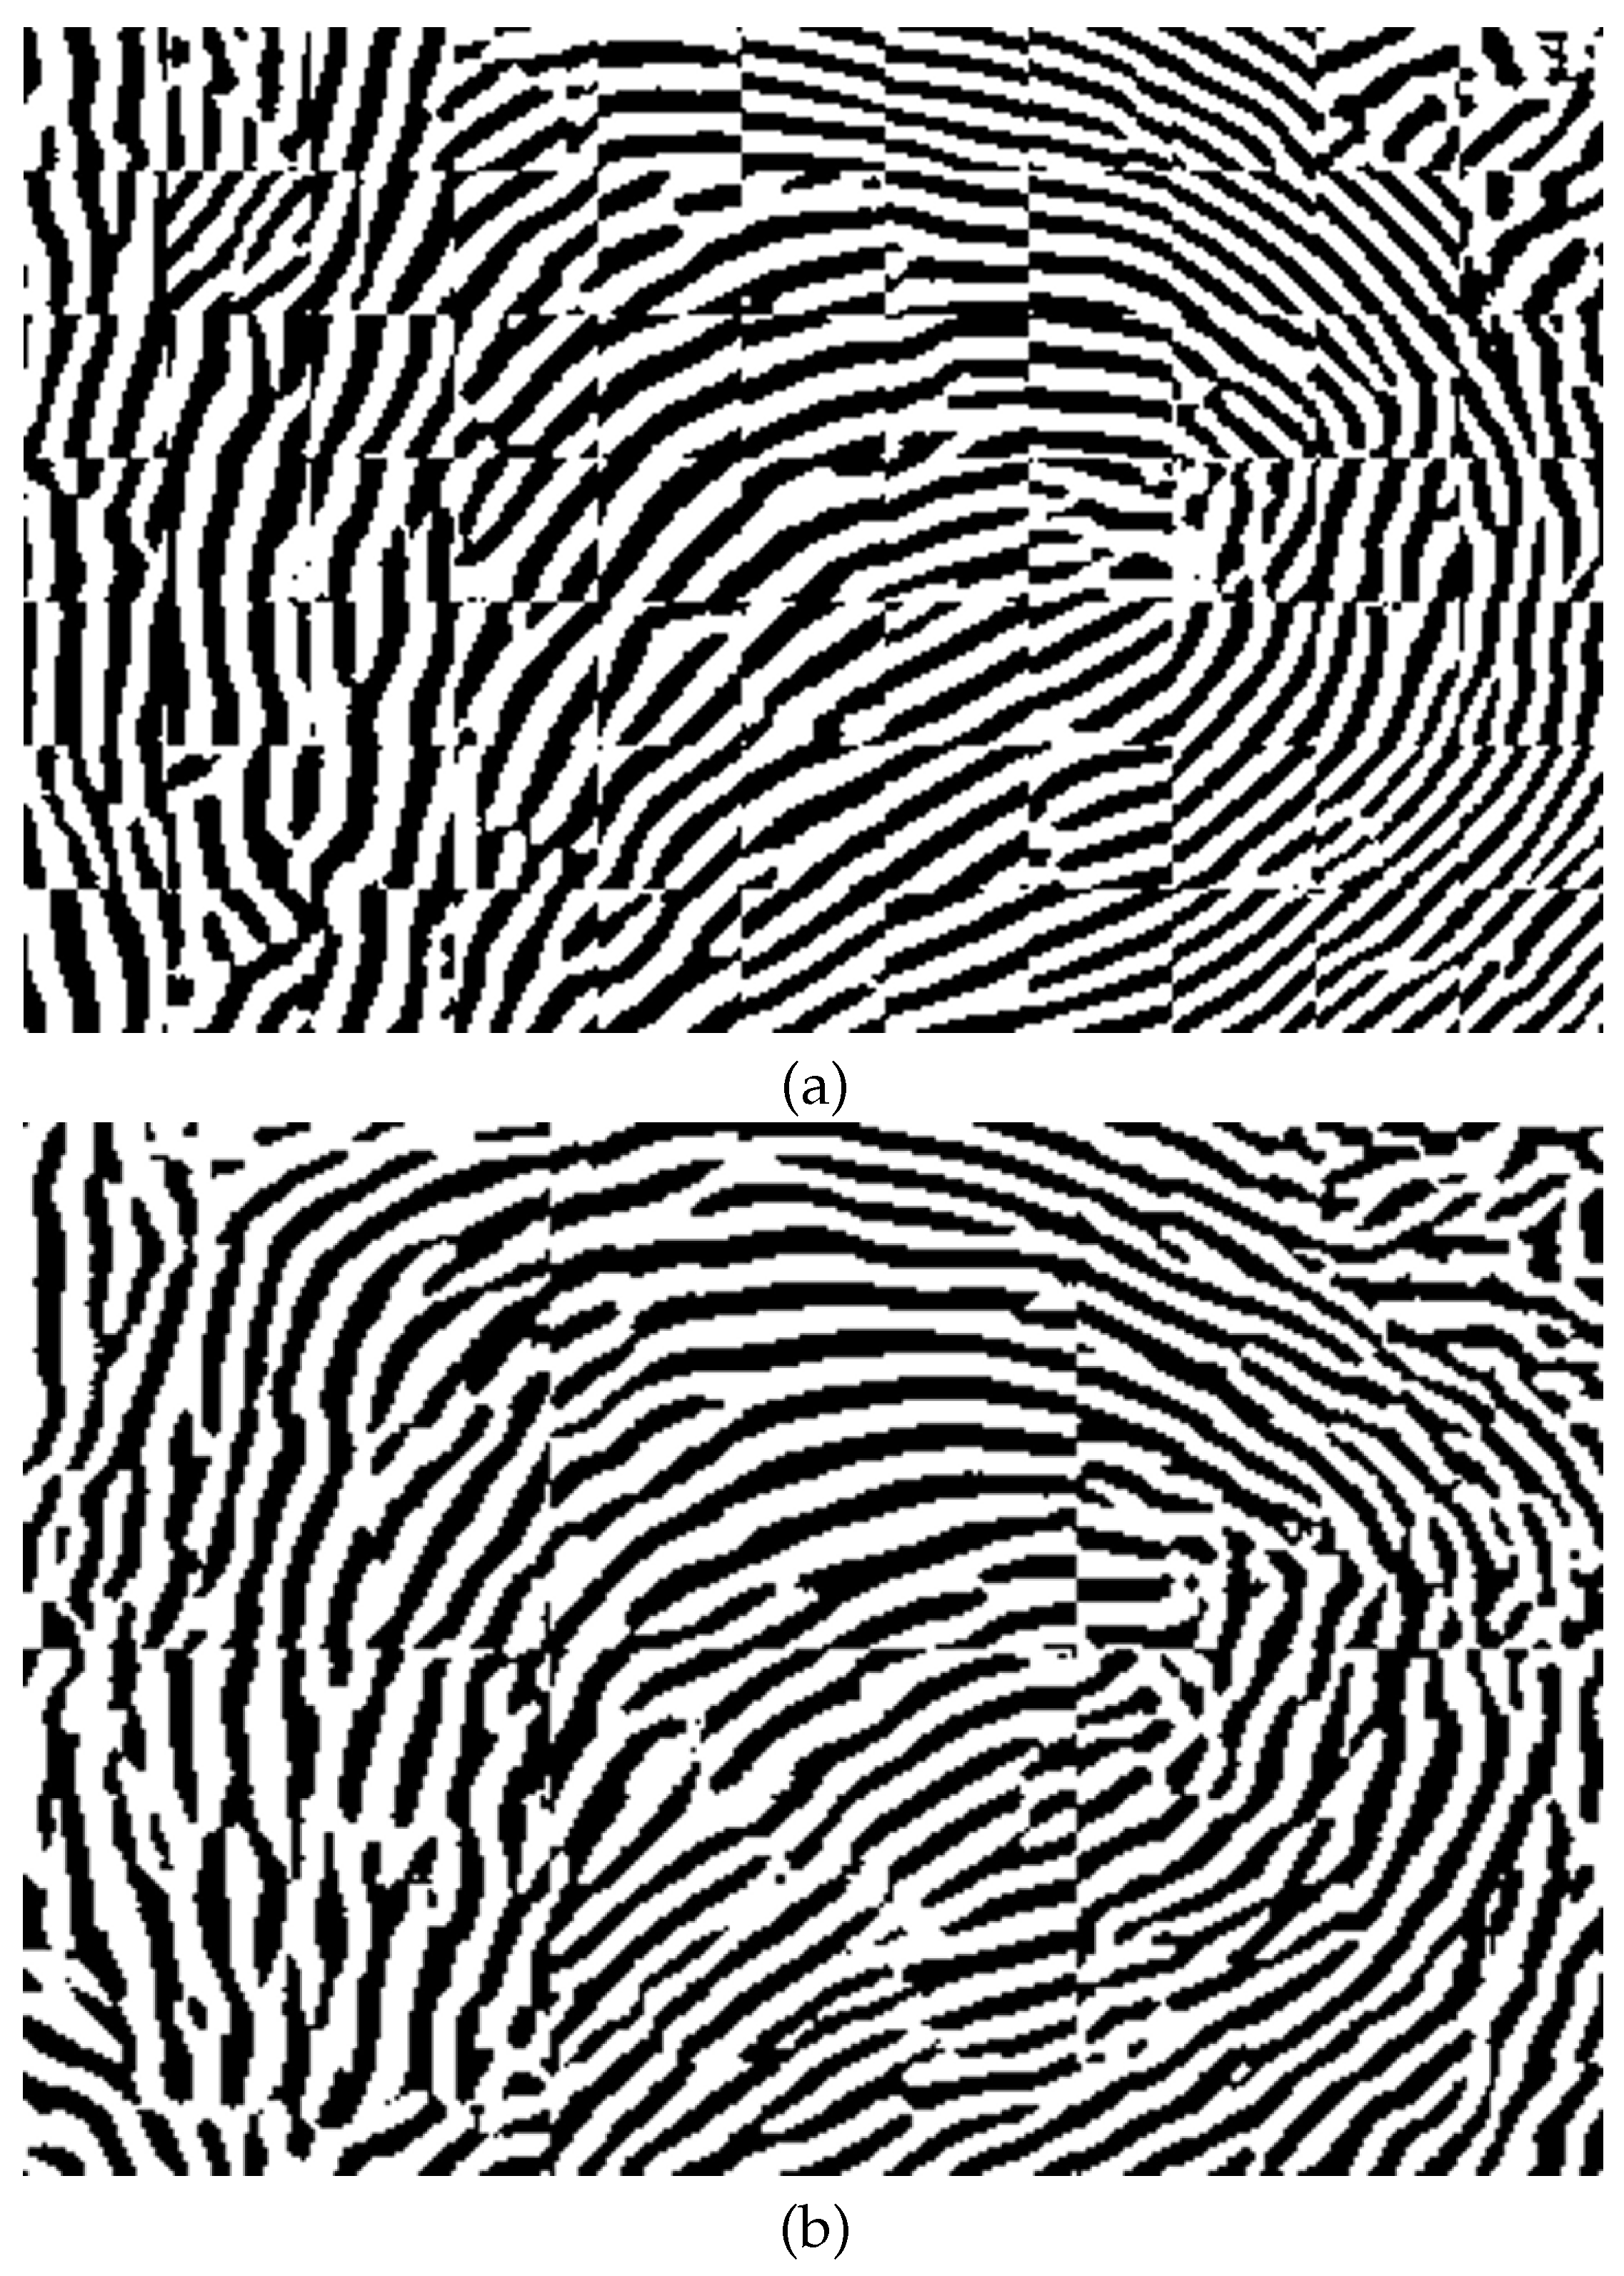
Figure 15.
Processes used in the proposed method for generating the training data for U-Net based training.
Figure 15.
Processes used in the proposed method for generating the training data for U-Net based training.
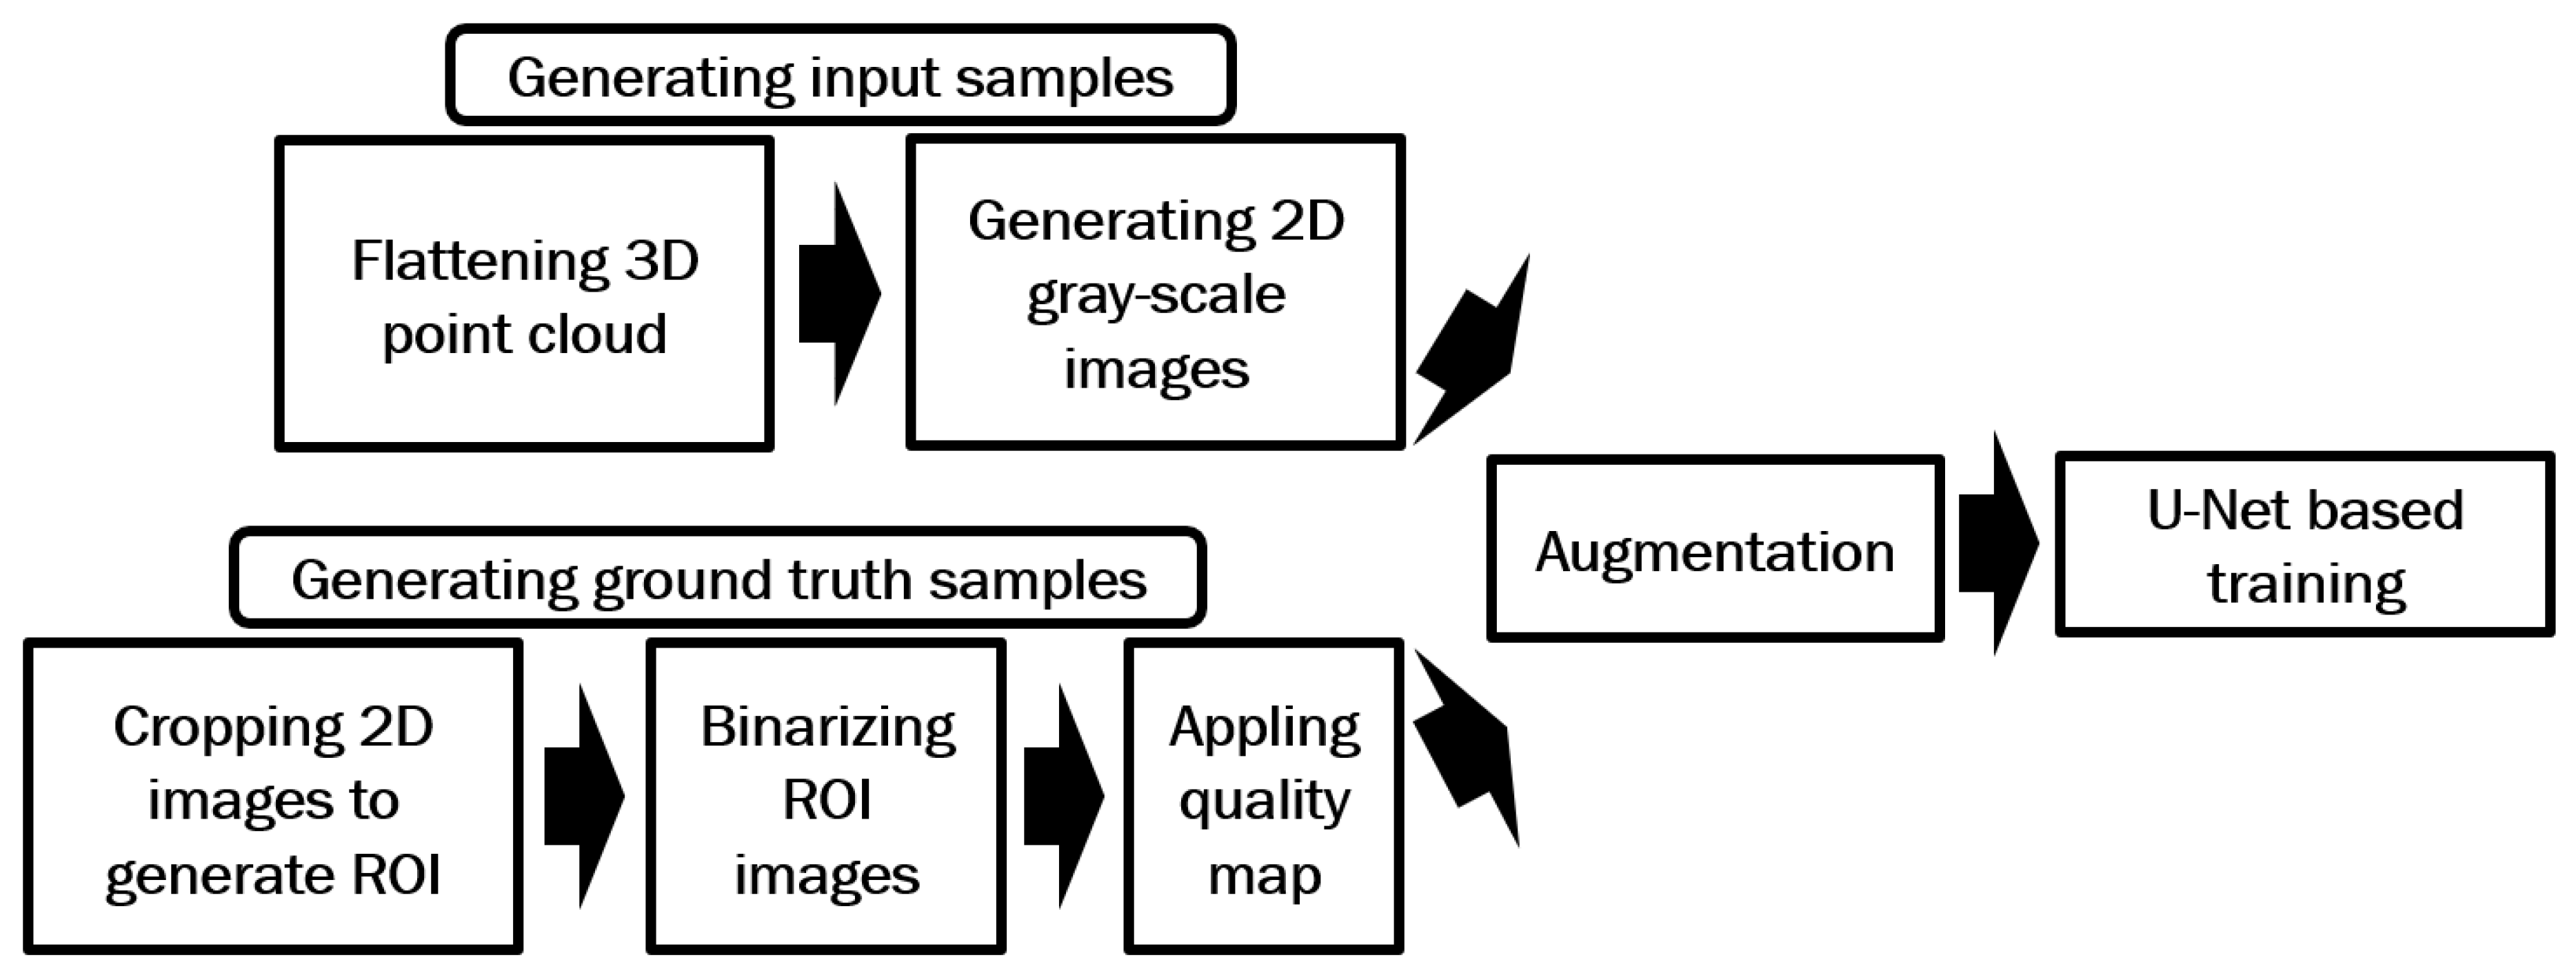
Figure 16.
A sample binarized image from Figure 4a shown in (a), and its quality-mapped image which only includes the highest qualiyt sections of the binarized image (quality 4) is shown in (b).
Figure 16.
A sample binarized image from Figure 4a shown in (a), and its quality-mapped image which only includes the highest qualiyt sections of the binarized image (quality 4) is shown in (b).
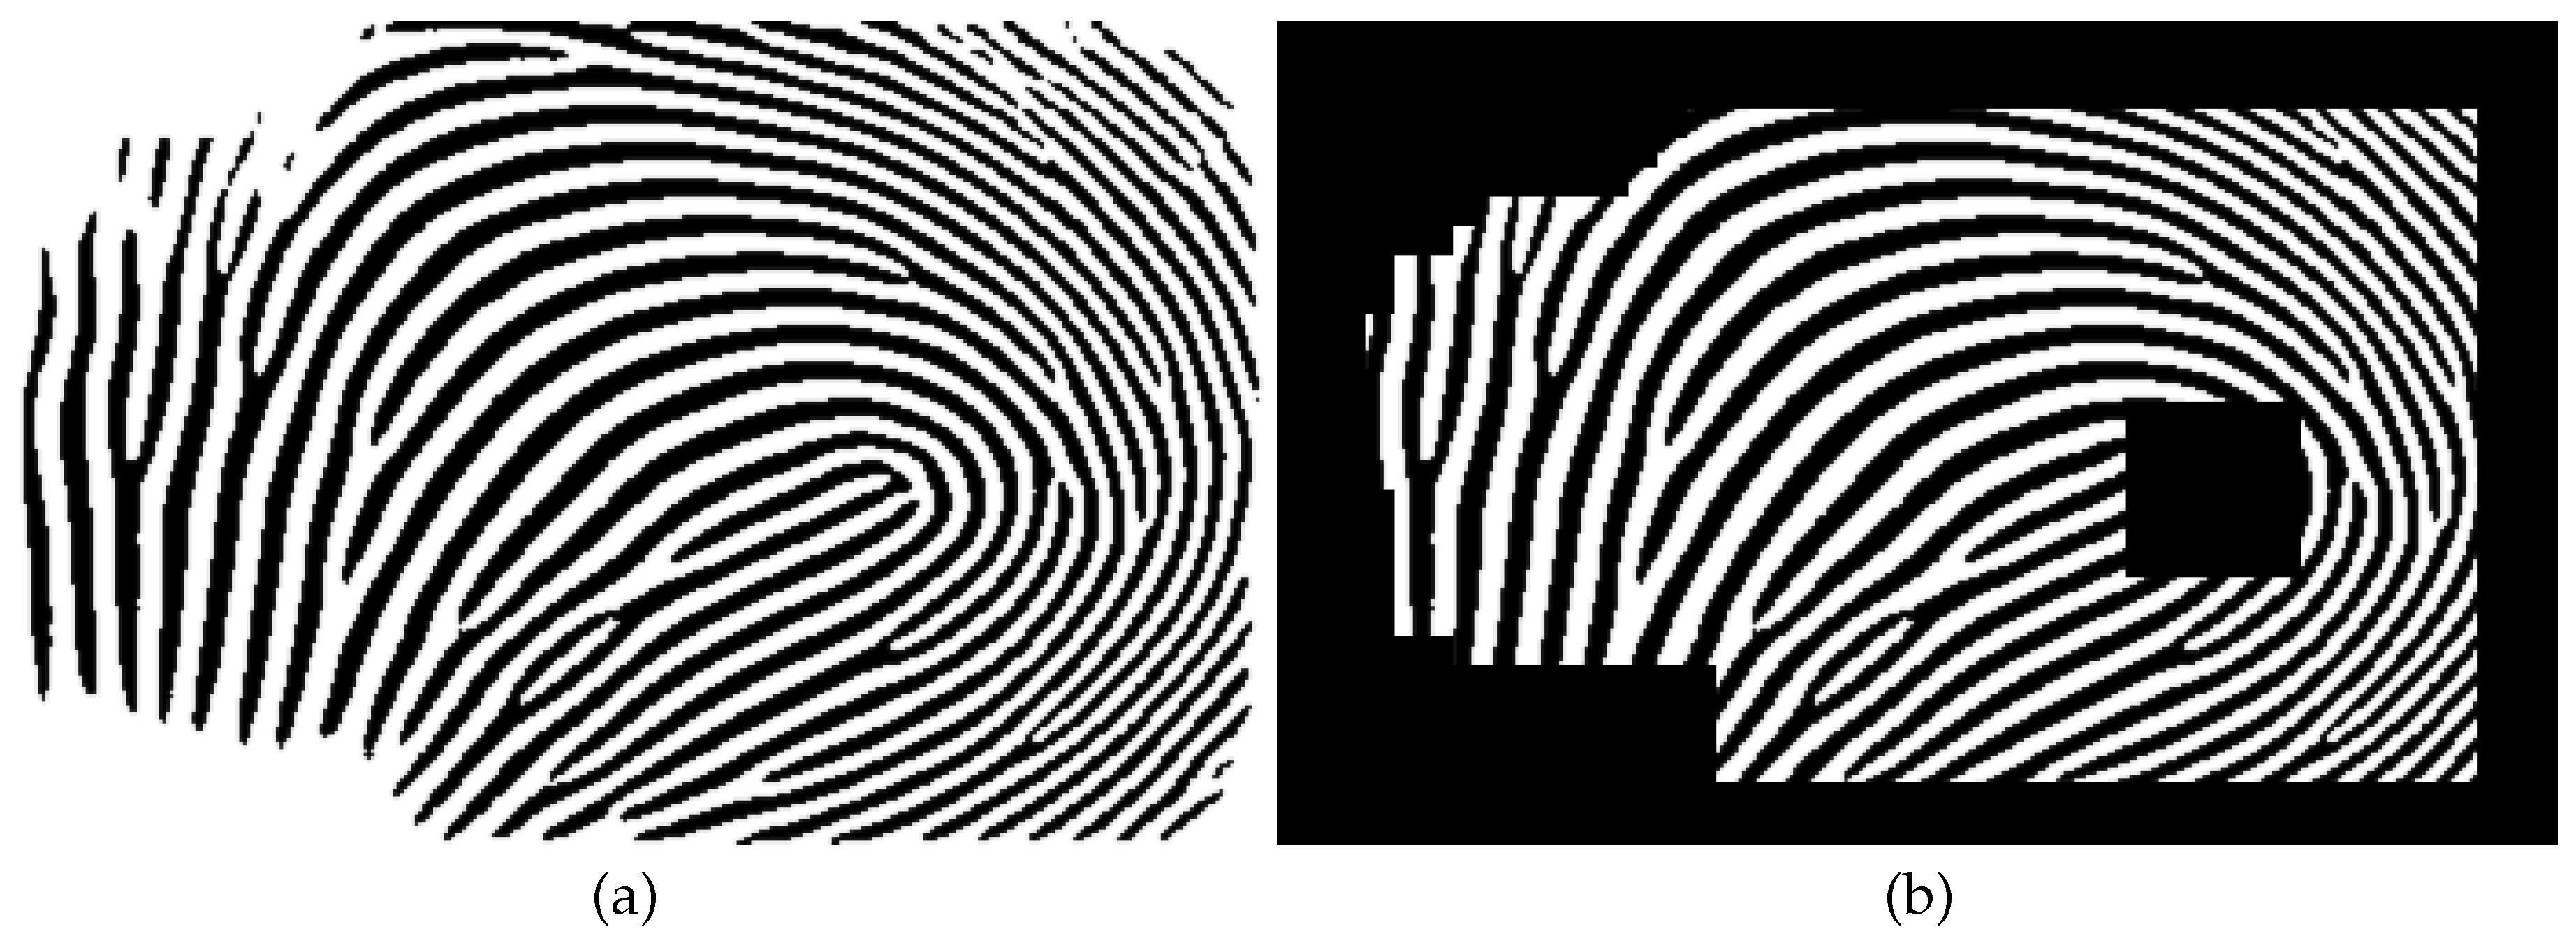
Figure 17.
(a) and (b) show two flattened 3D point cloud samples. The enhanced images of these samples are shown in (c) and (d) respectively.
Figure 17.
(a) and (b) show two flattened 3D point cloud samples. The enhanced images of these samples are shown in (c) and (d) respectively.
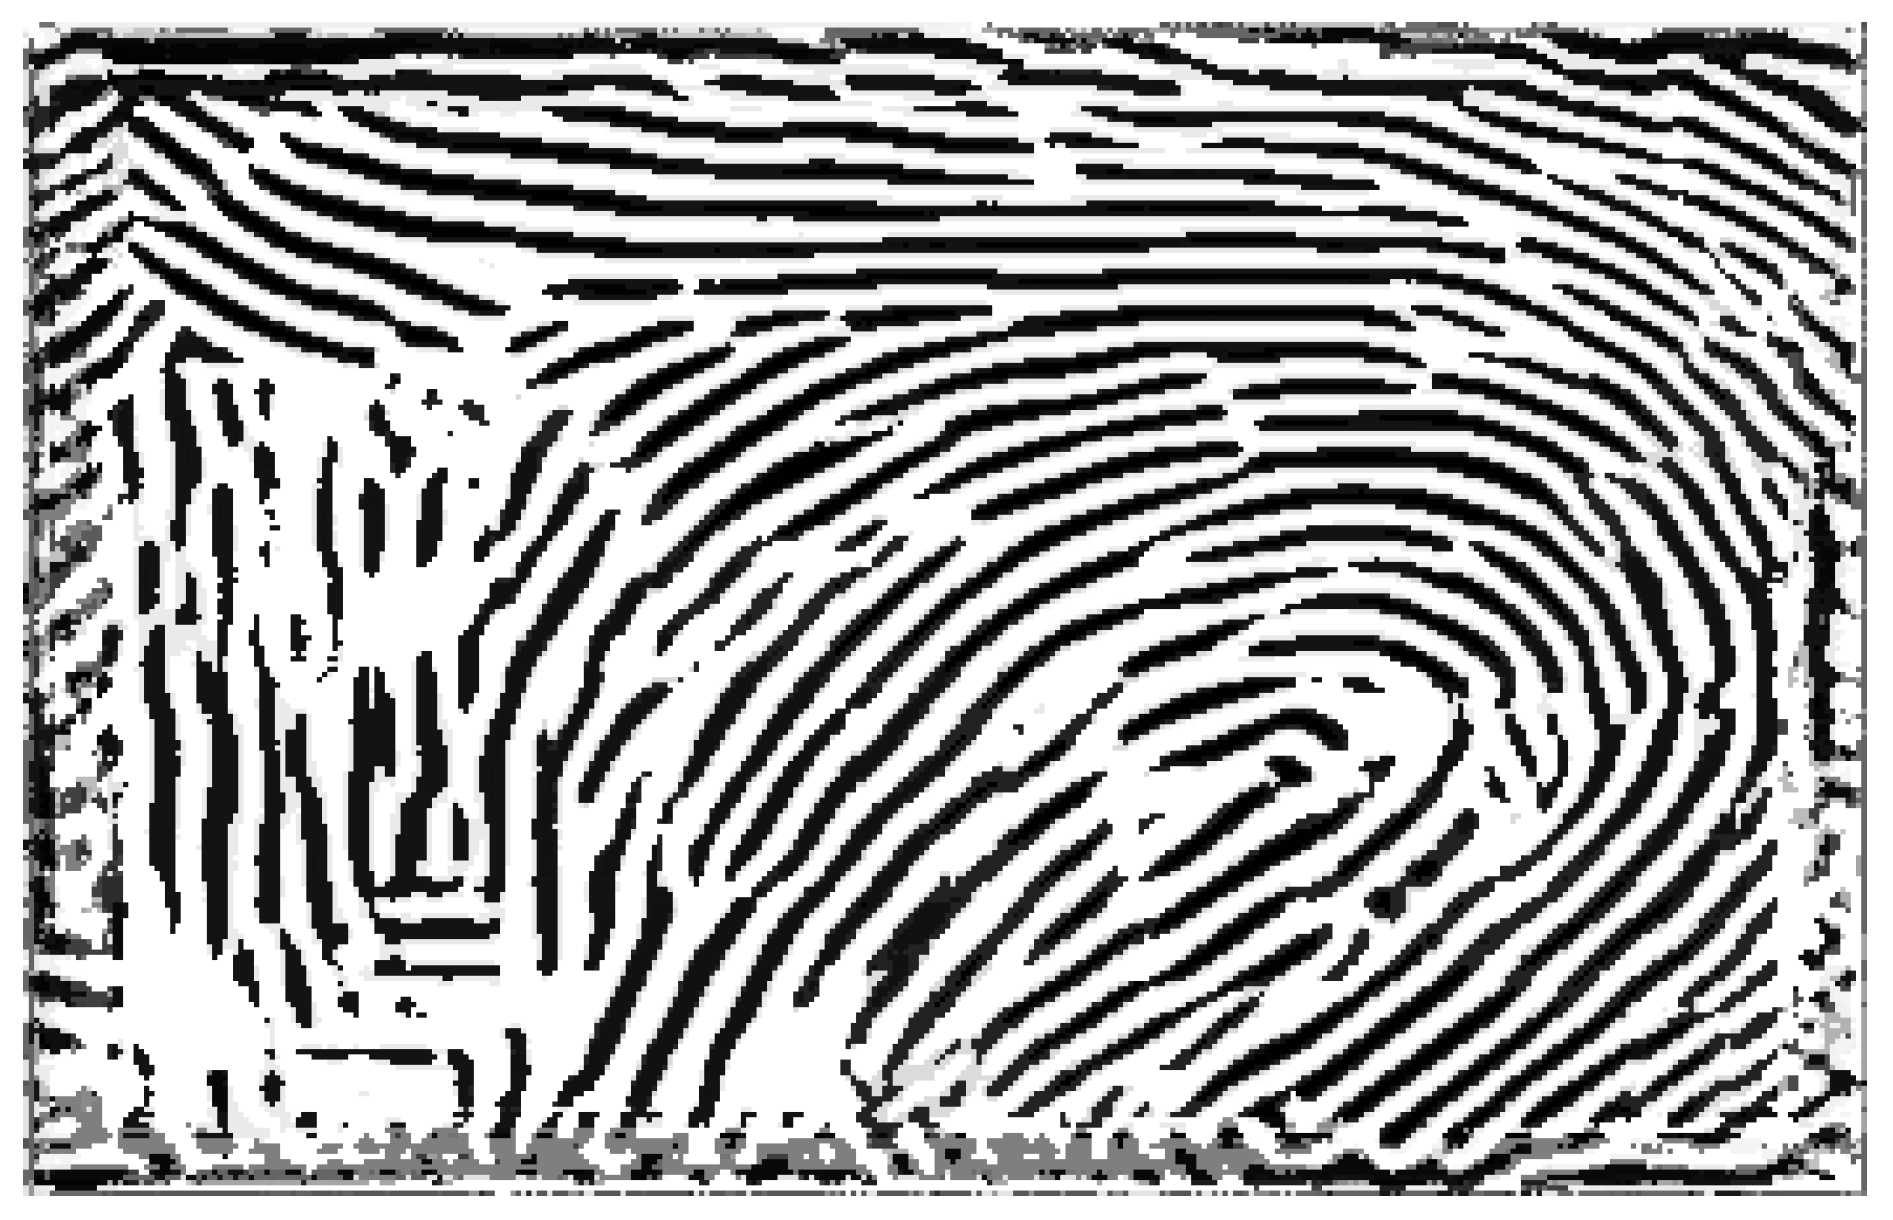
Figure 18.
The 2D images and their corresponding ROI images of the first 3D impression of the first person in the first session of the dataset are shown in (a), (b), (c), and (d).
Figure 18.
The 2D images and their corresponding ROI images of the first 3D impression of the first person in the first session of the dataset are shown in (a), (b), (c), and (d).
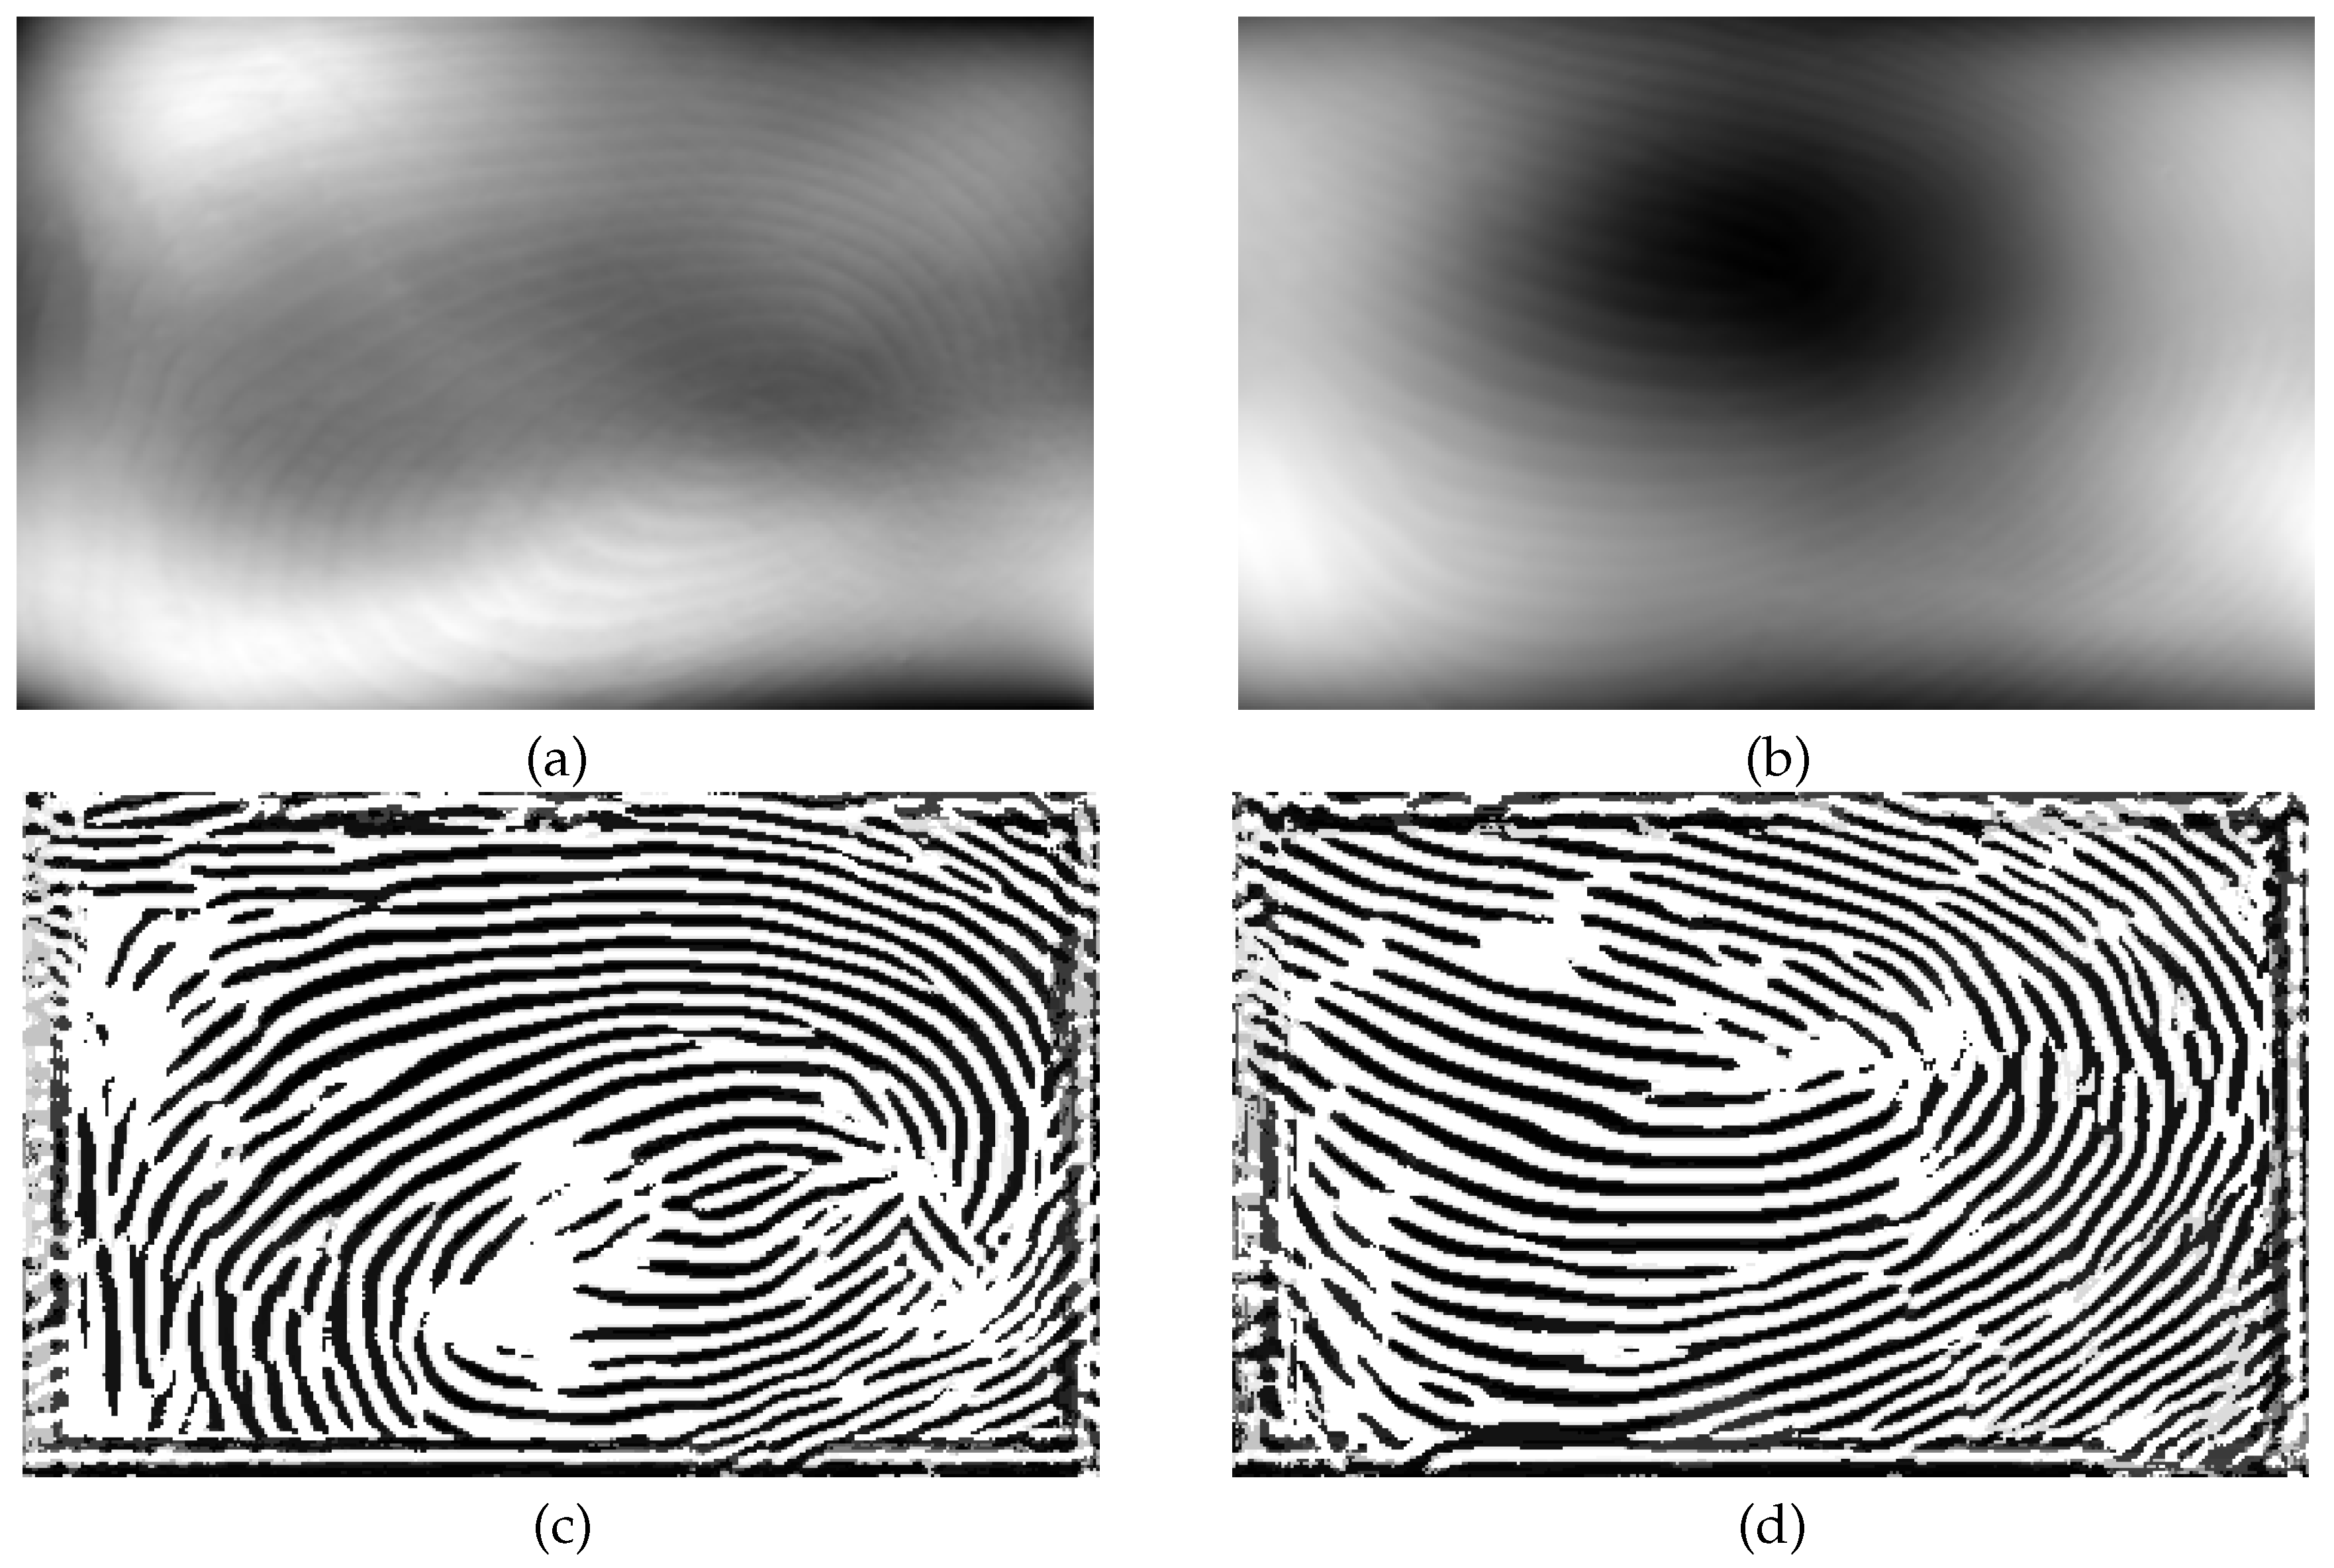
Figure 19.
DET curve of gray-scale images and enhanced gray-scale images for Dataset B.
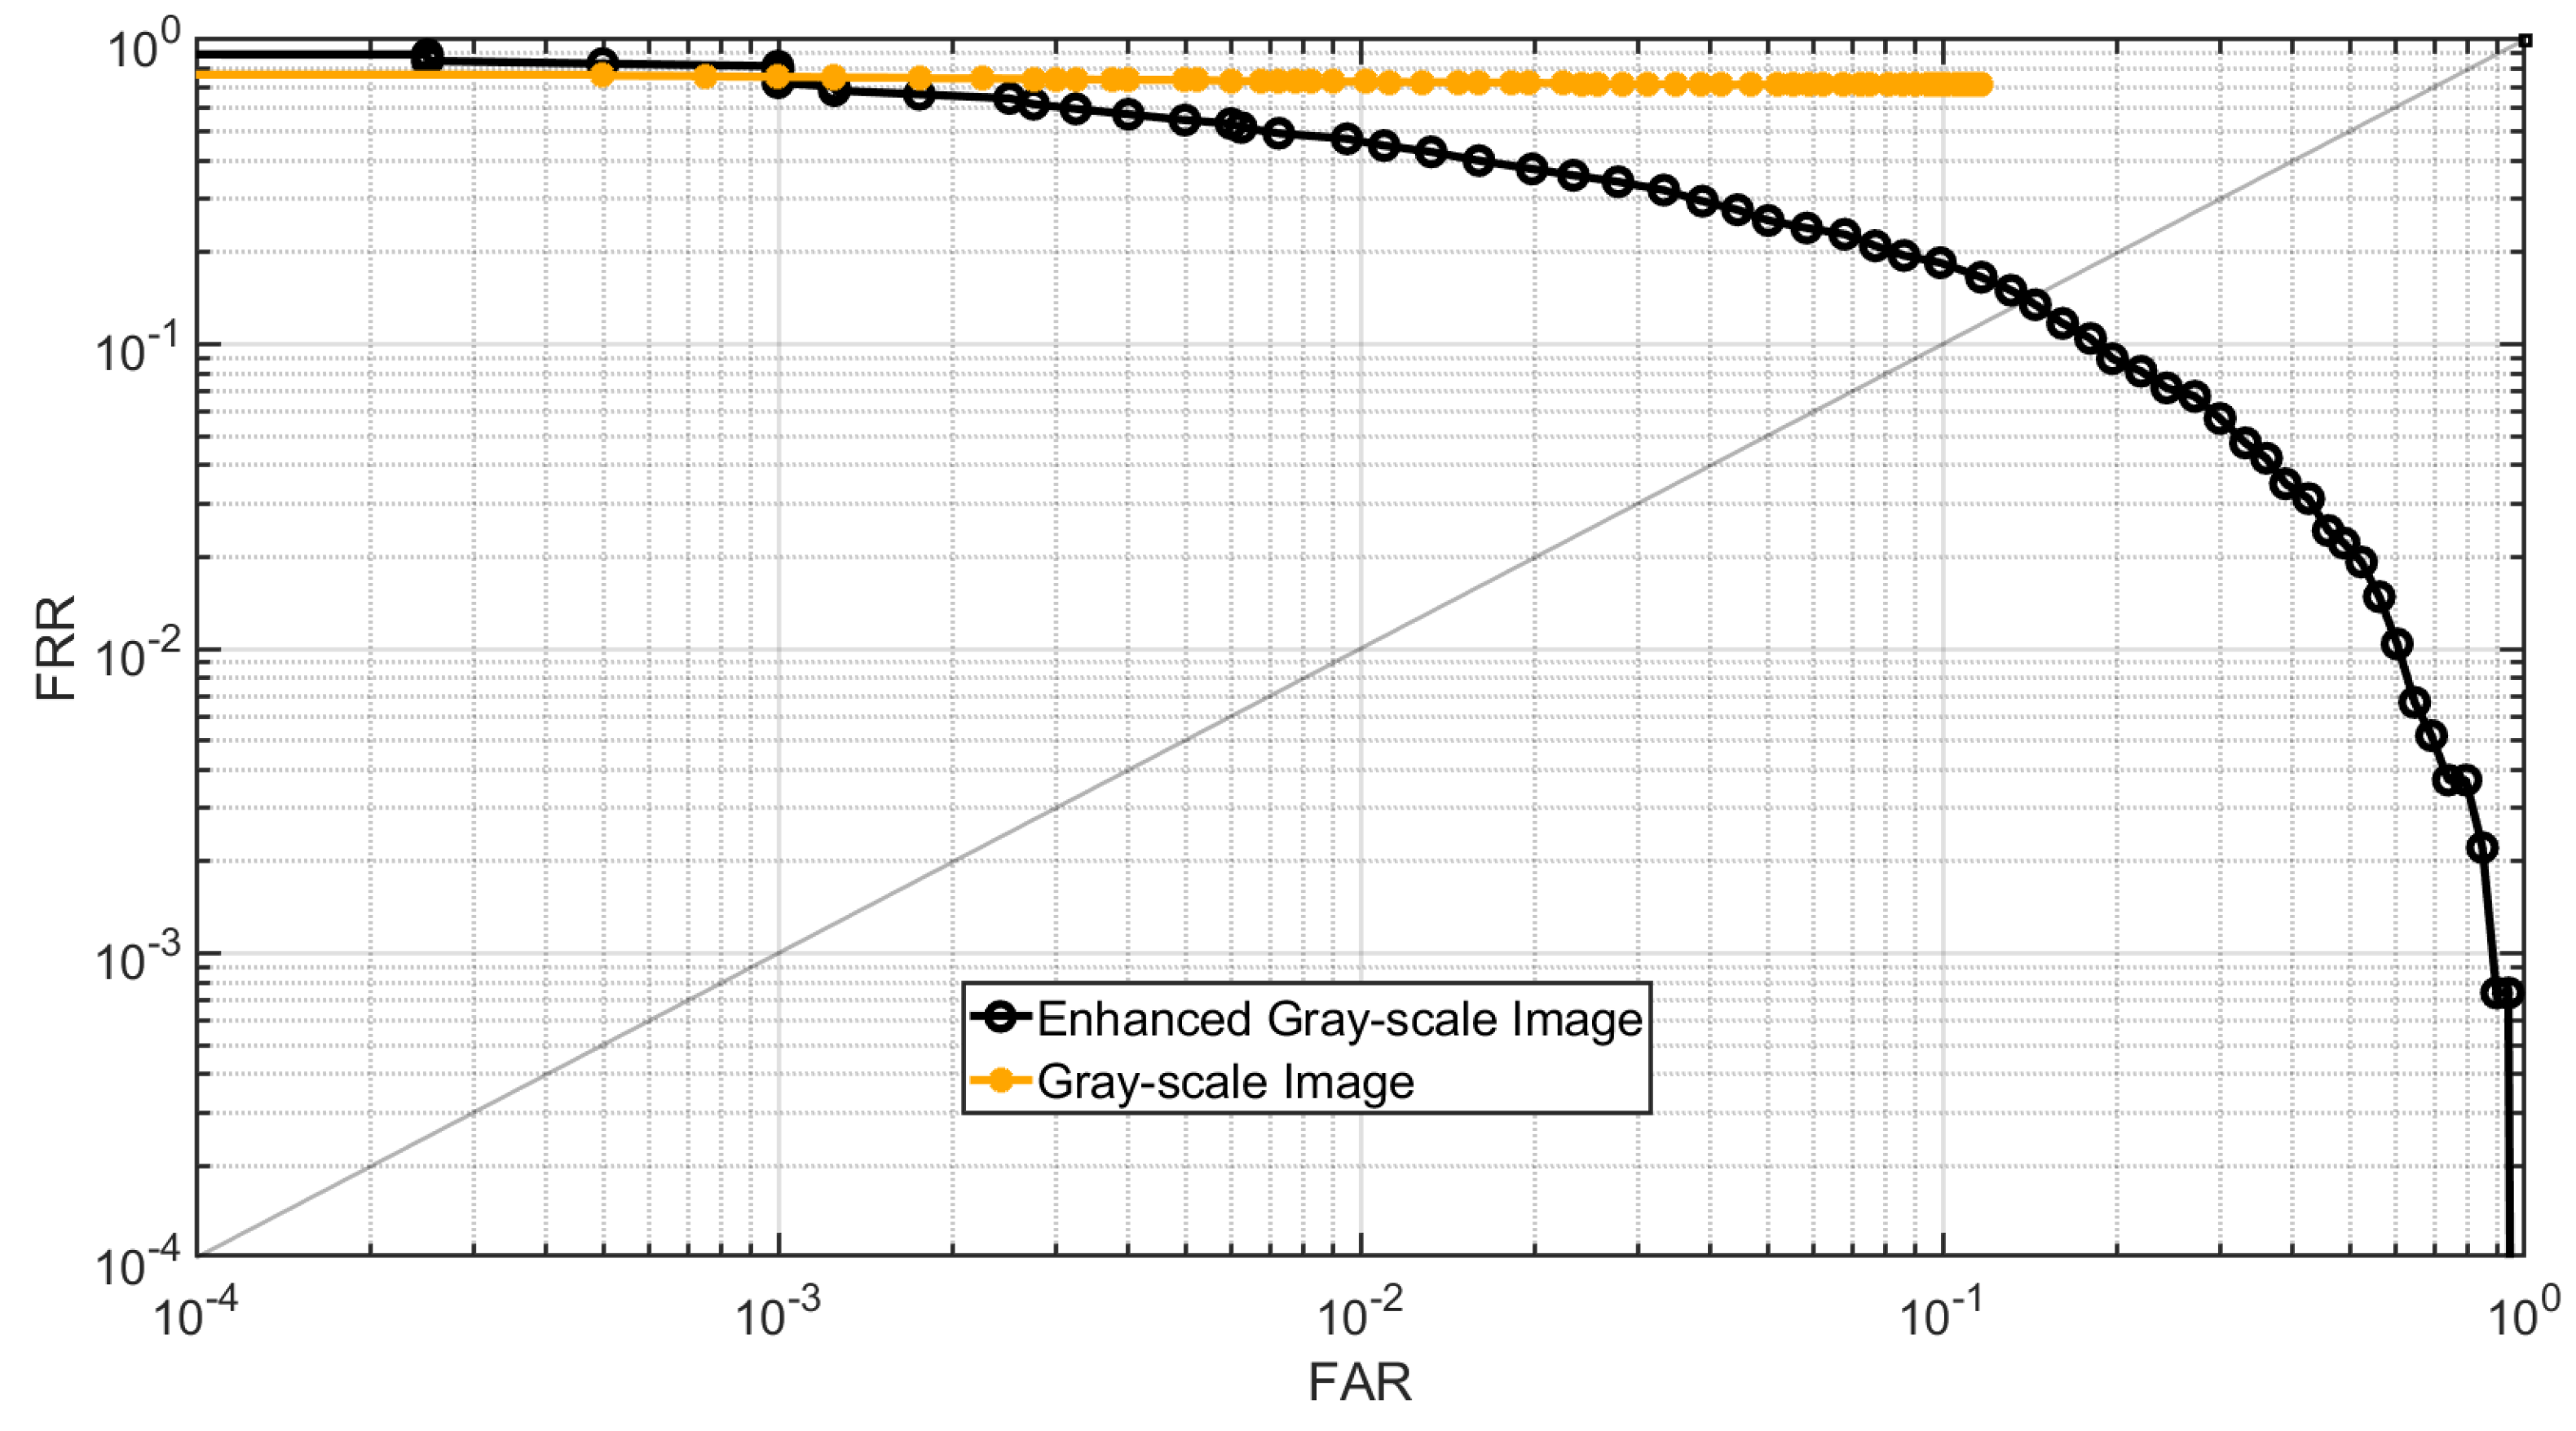
Figure 20.
CMC curve of gray-scale images and enhanced gray-scale images for Dataset B.
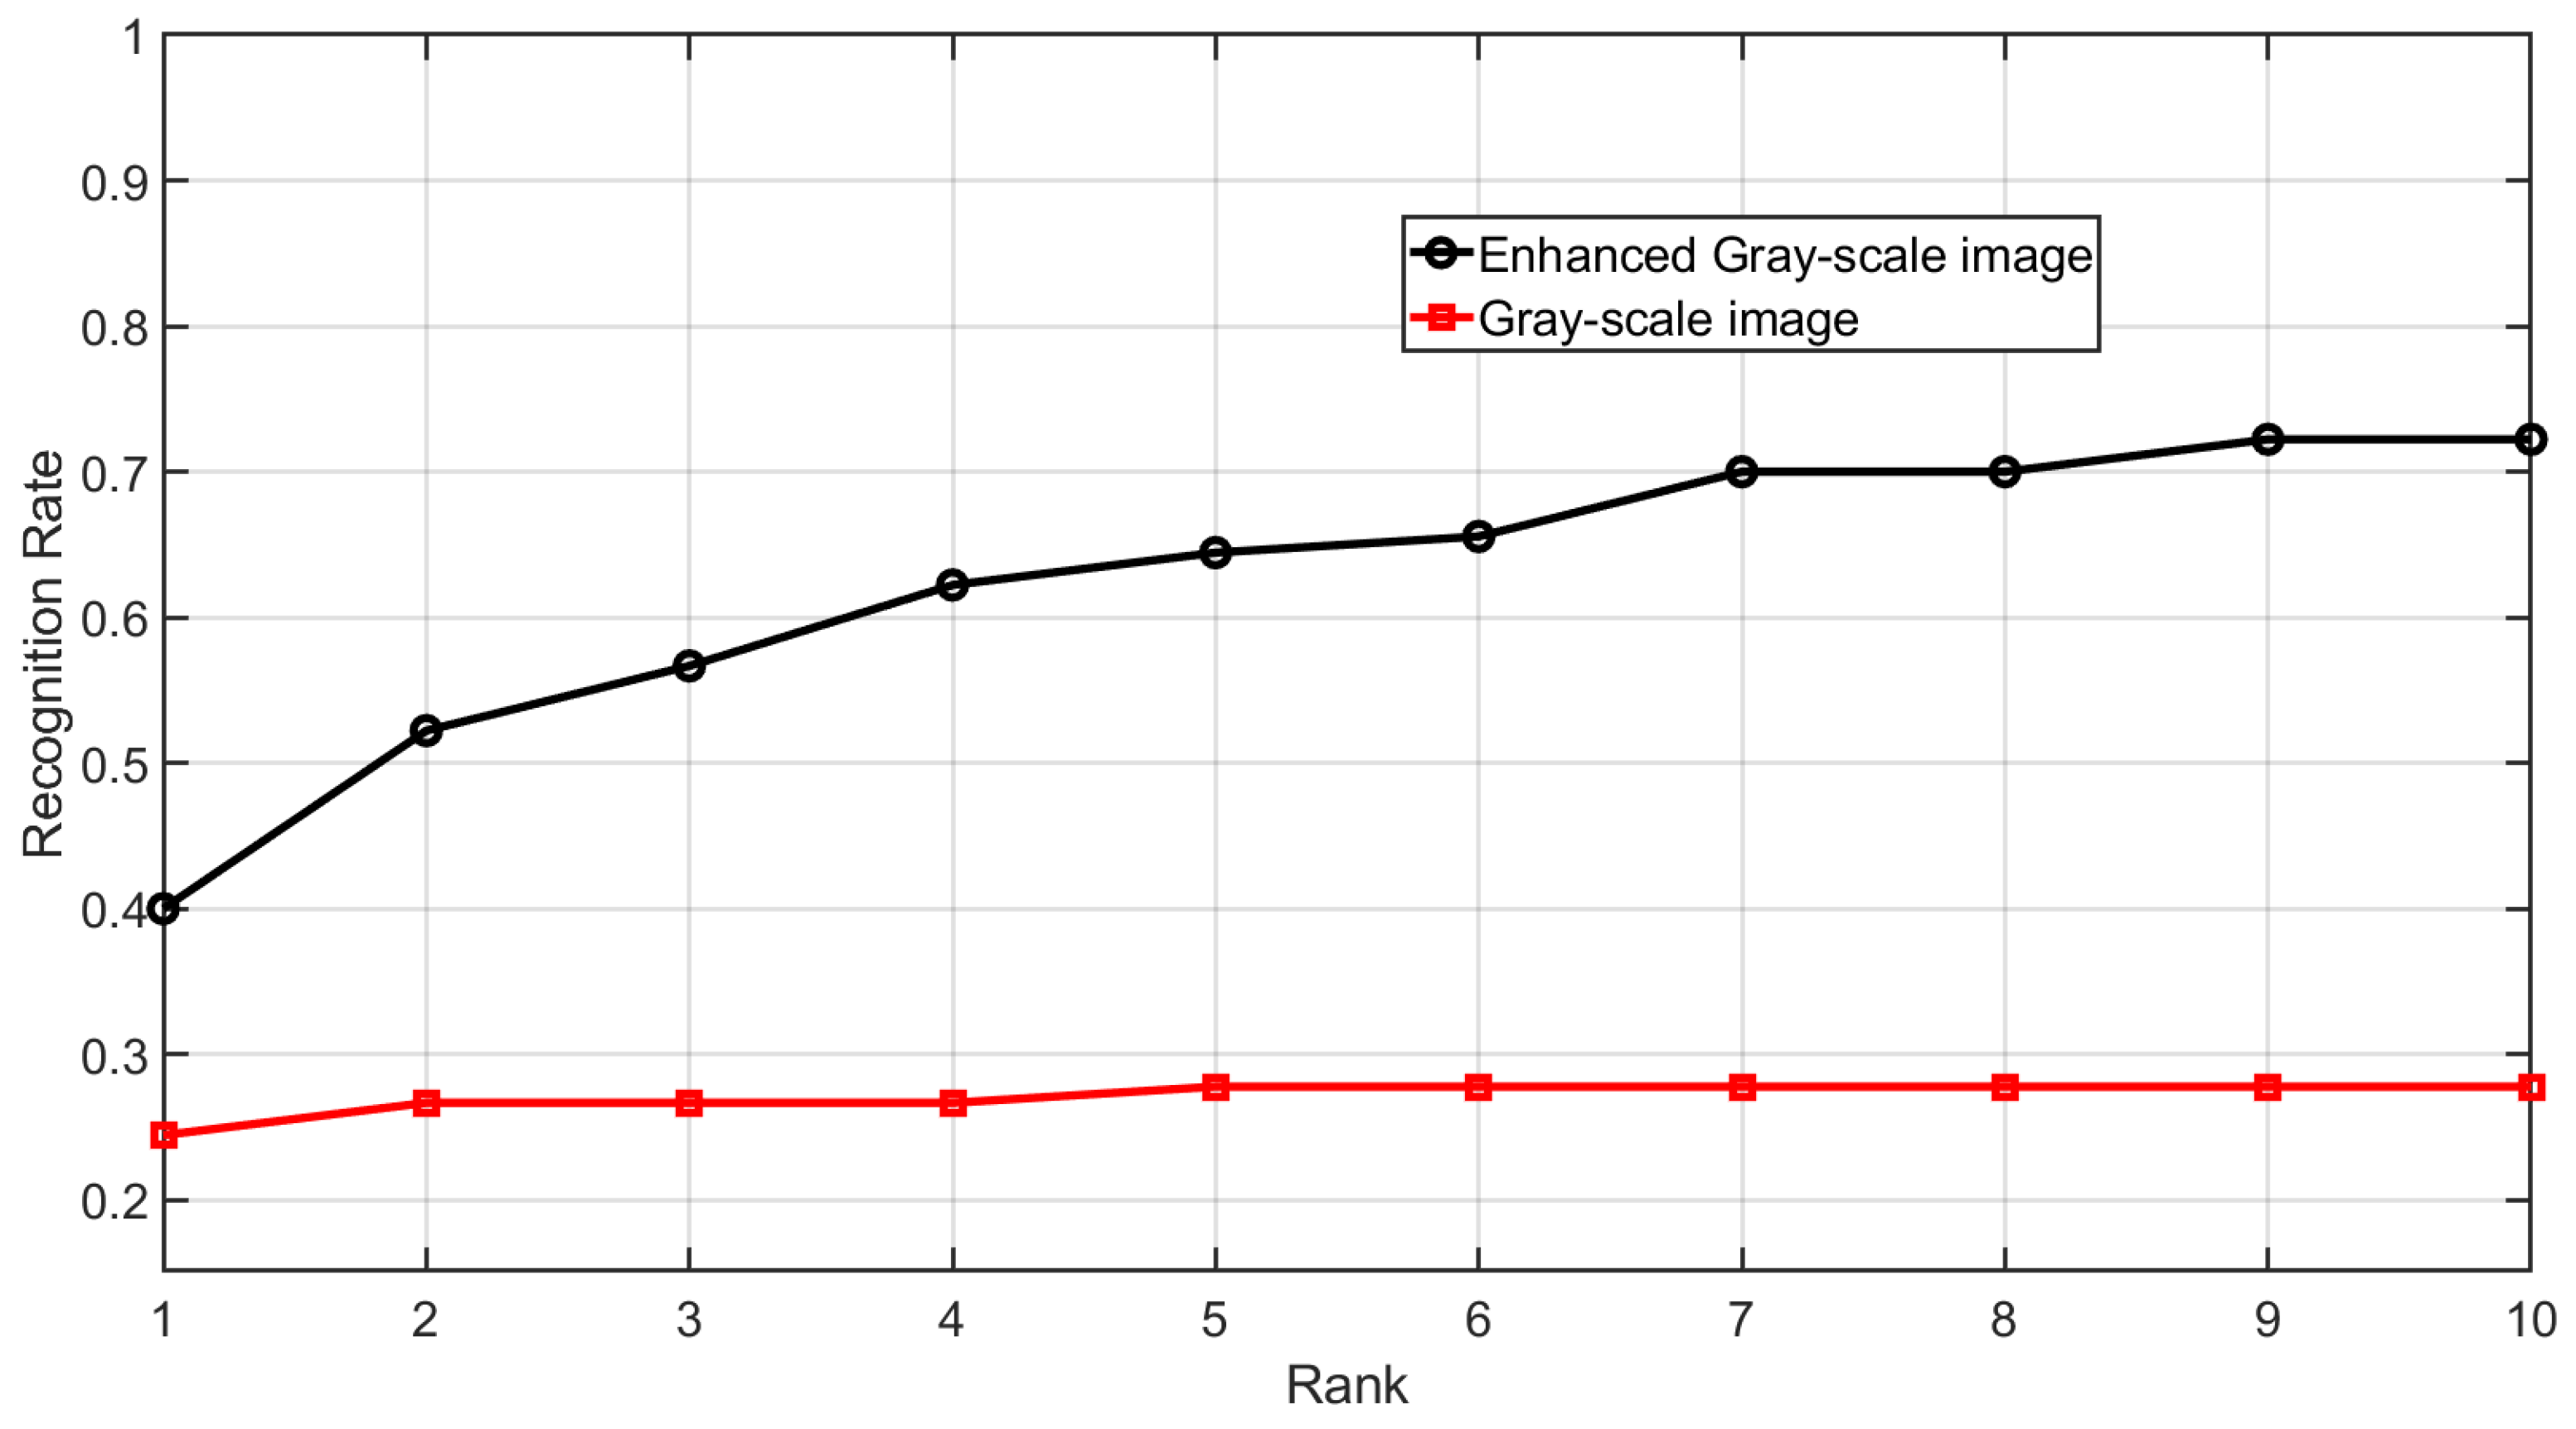
Figure 21.
DET curve of gray-scale images and enhanced gray-scale images for Dataset C.
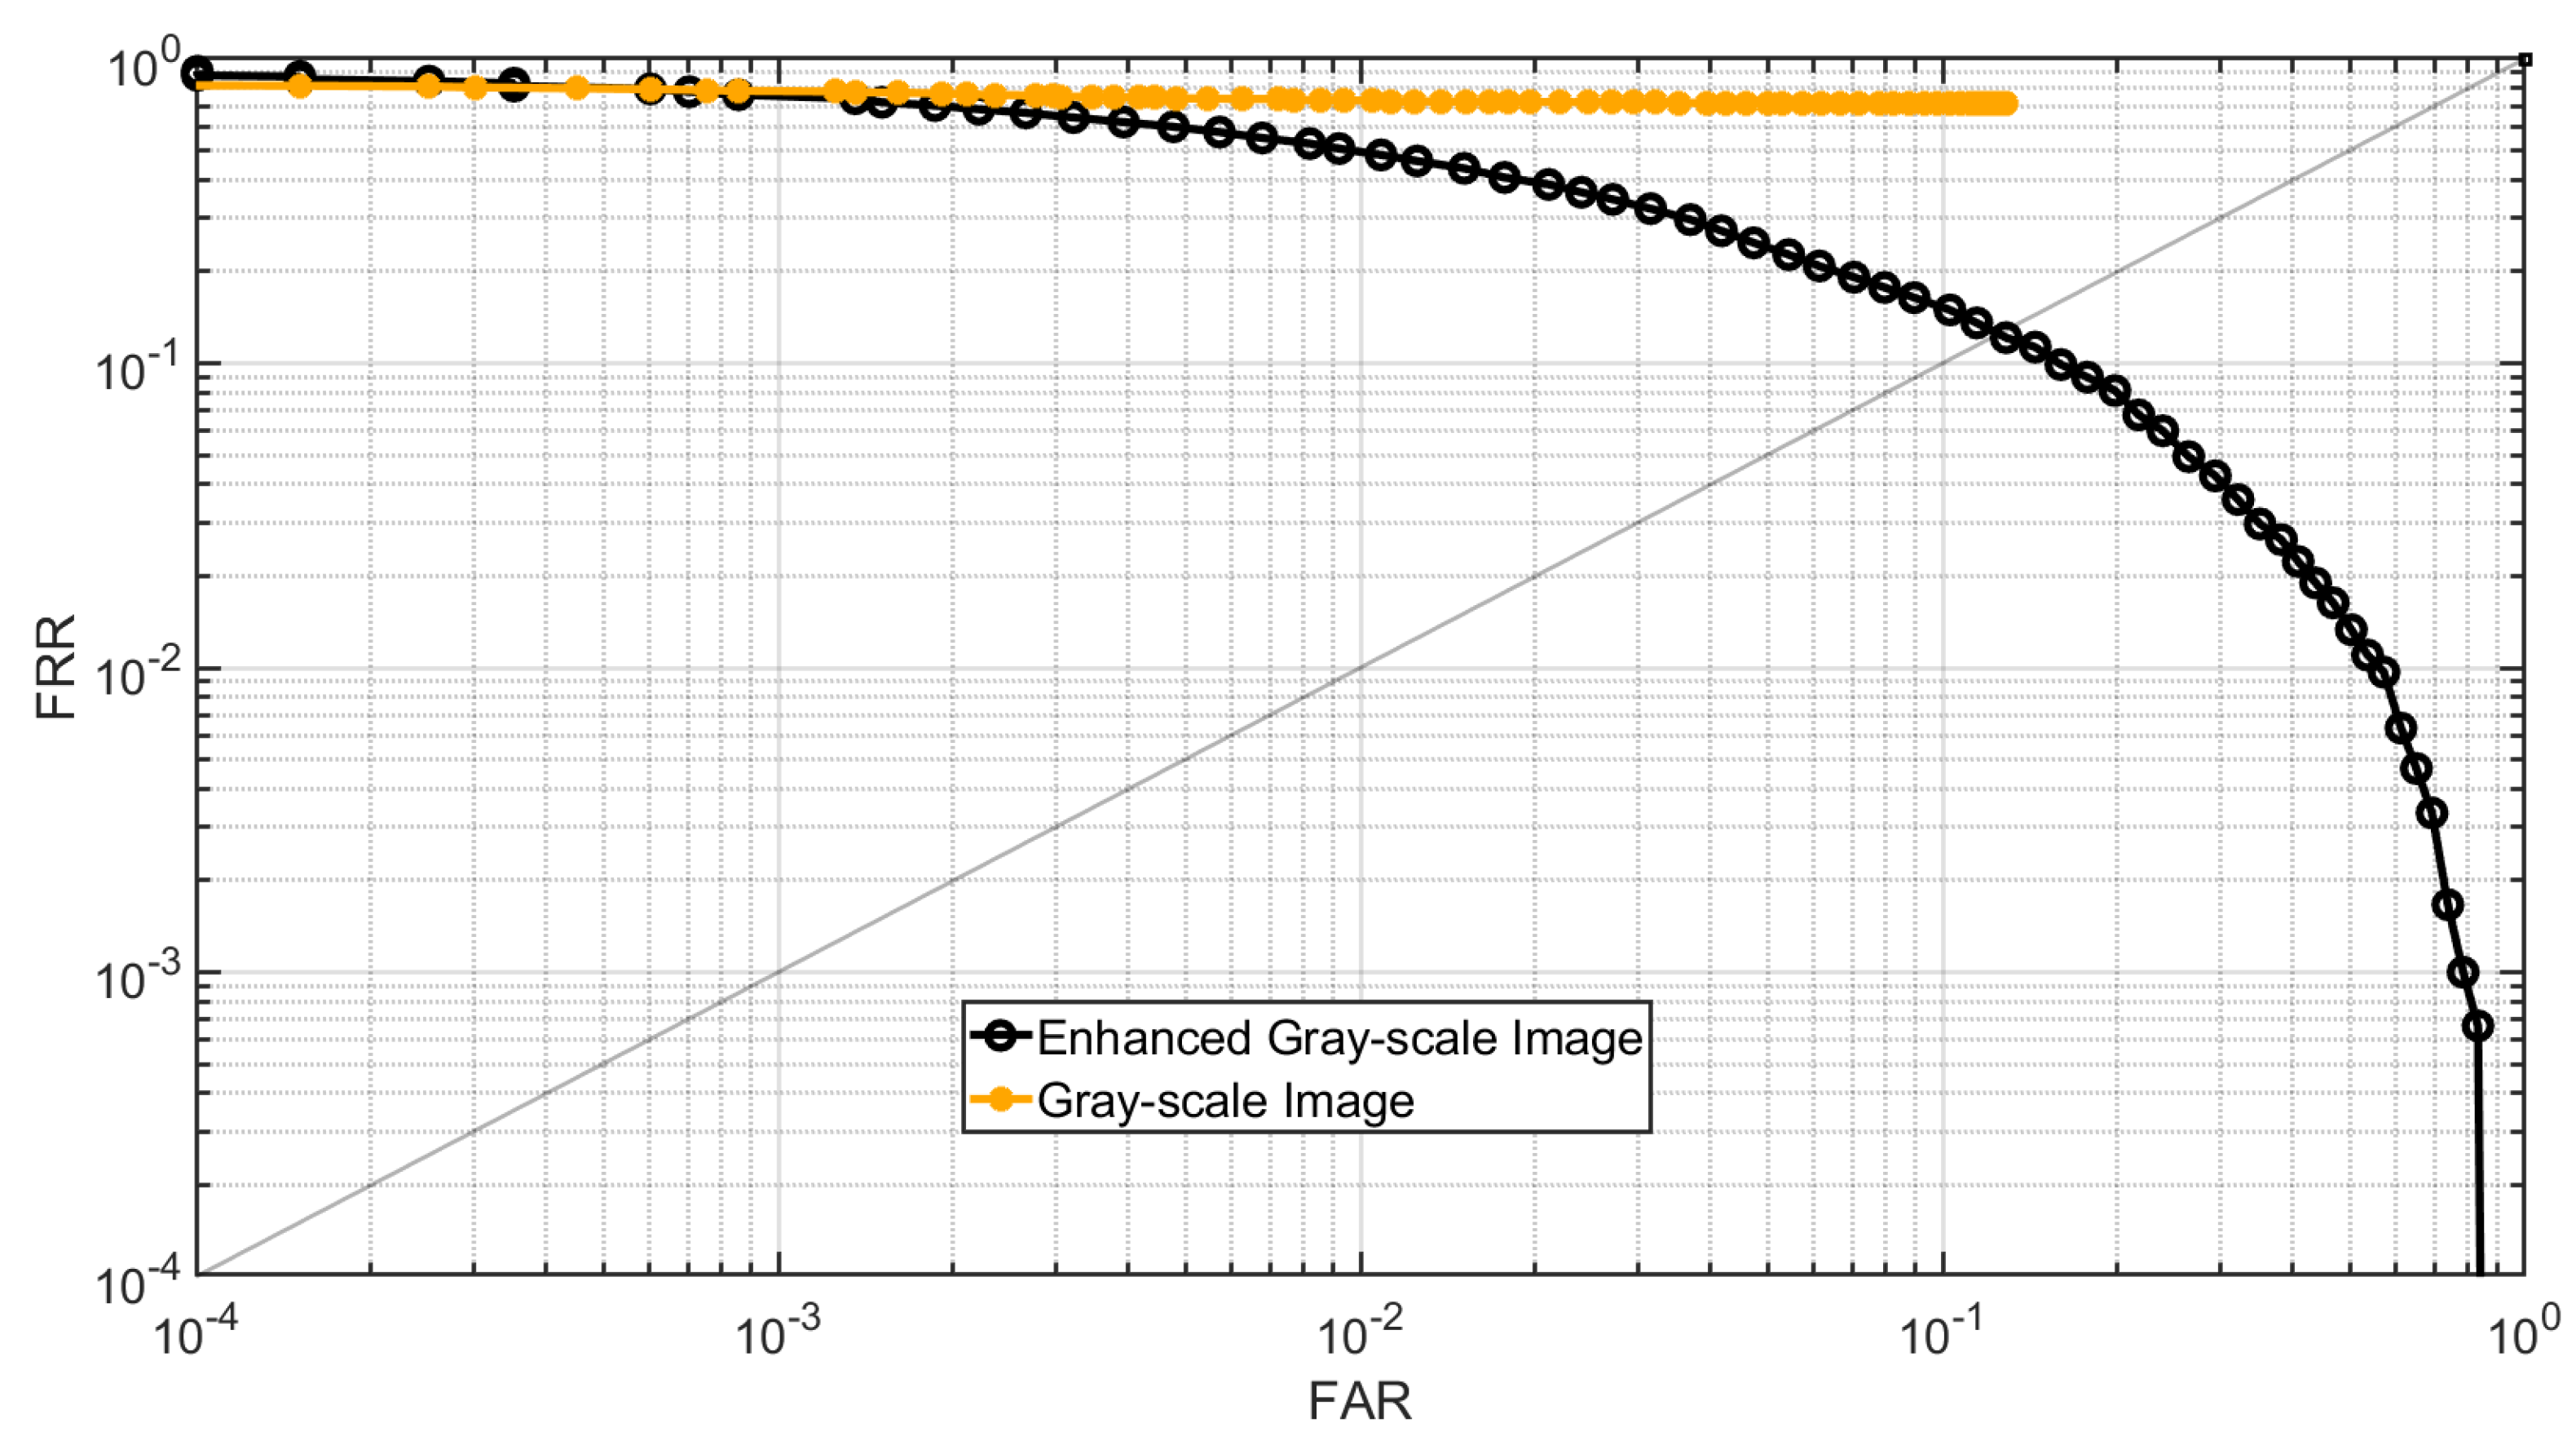
Figure 22.
CMC curve of gray-scale images and enhanced gray-scale images for Dataset C.
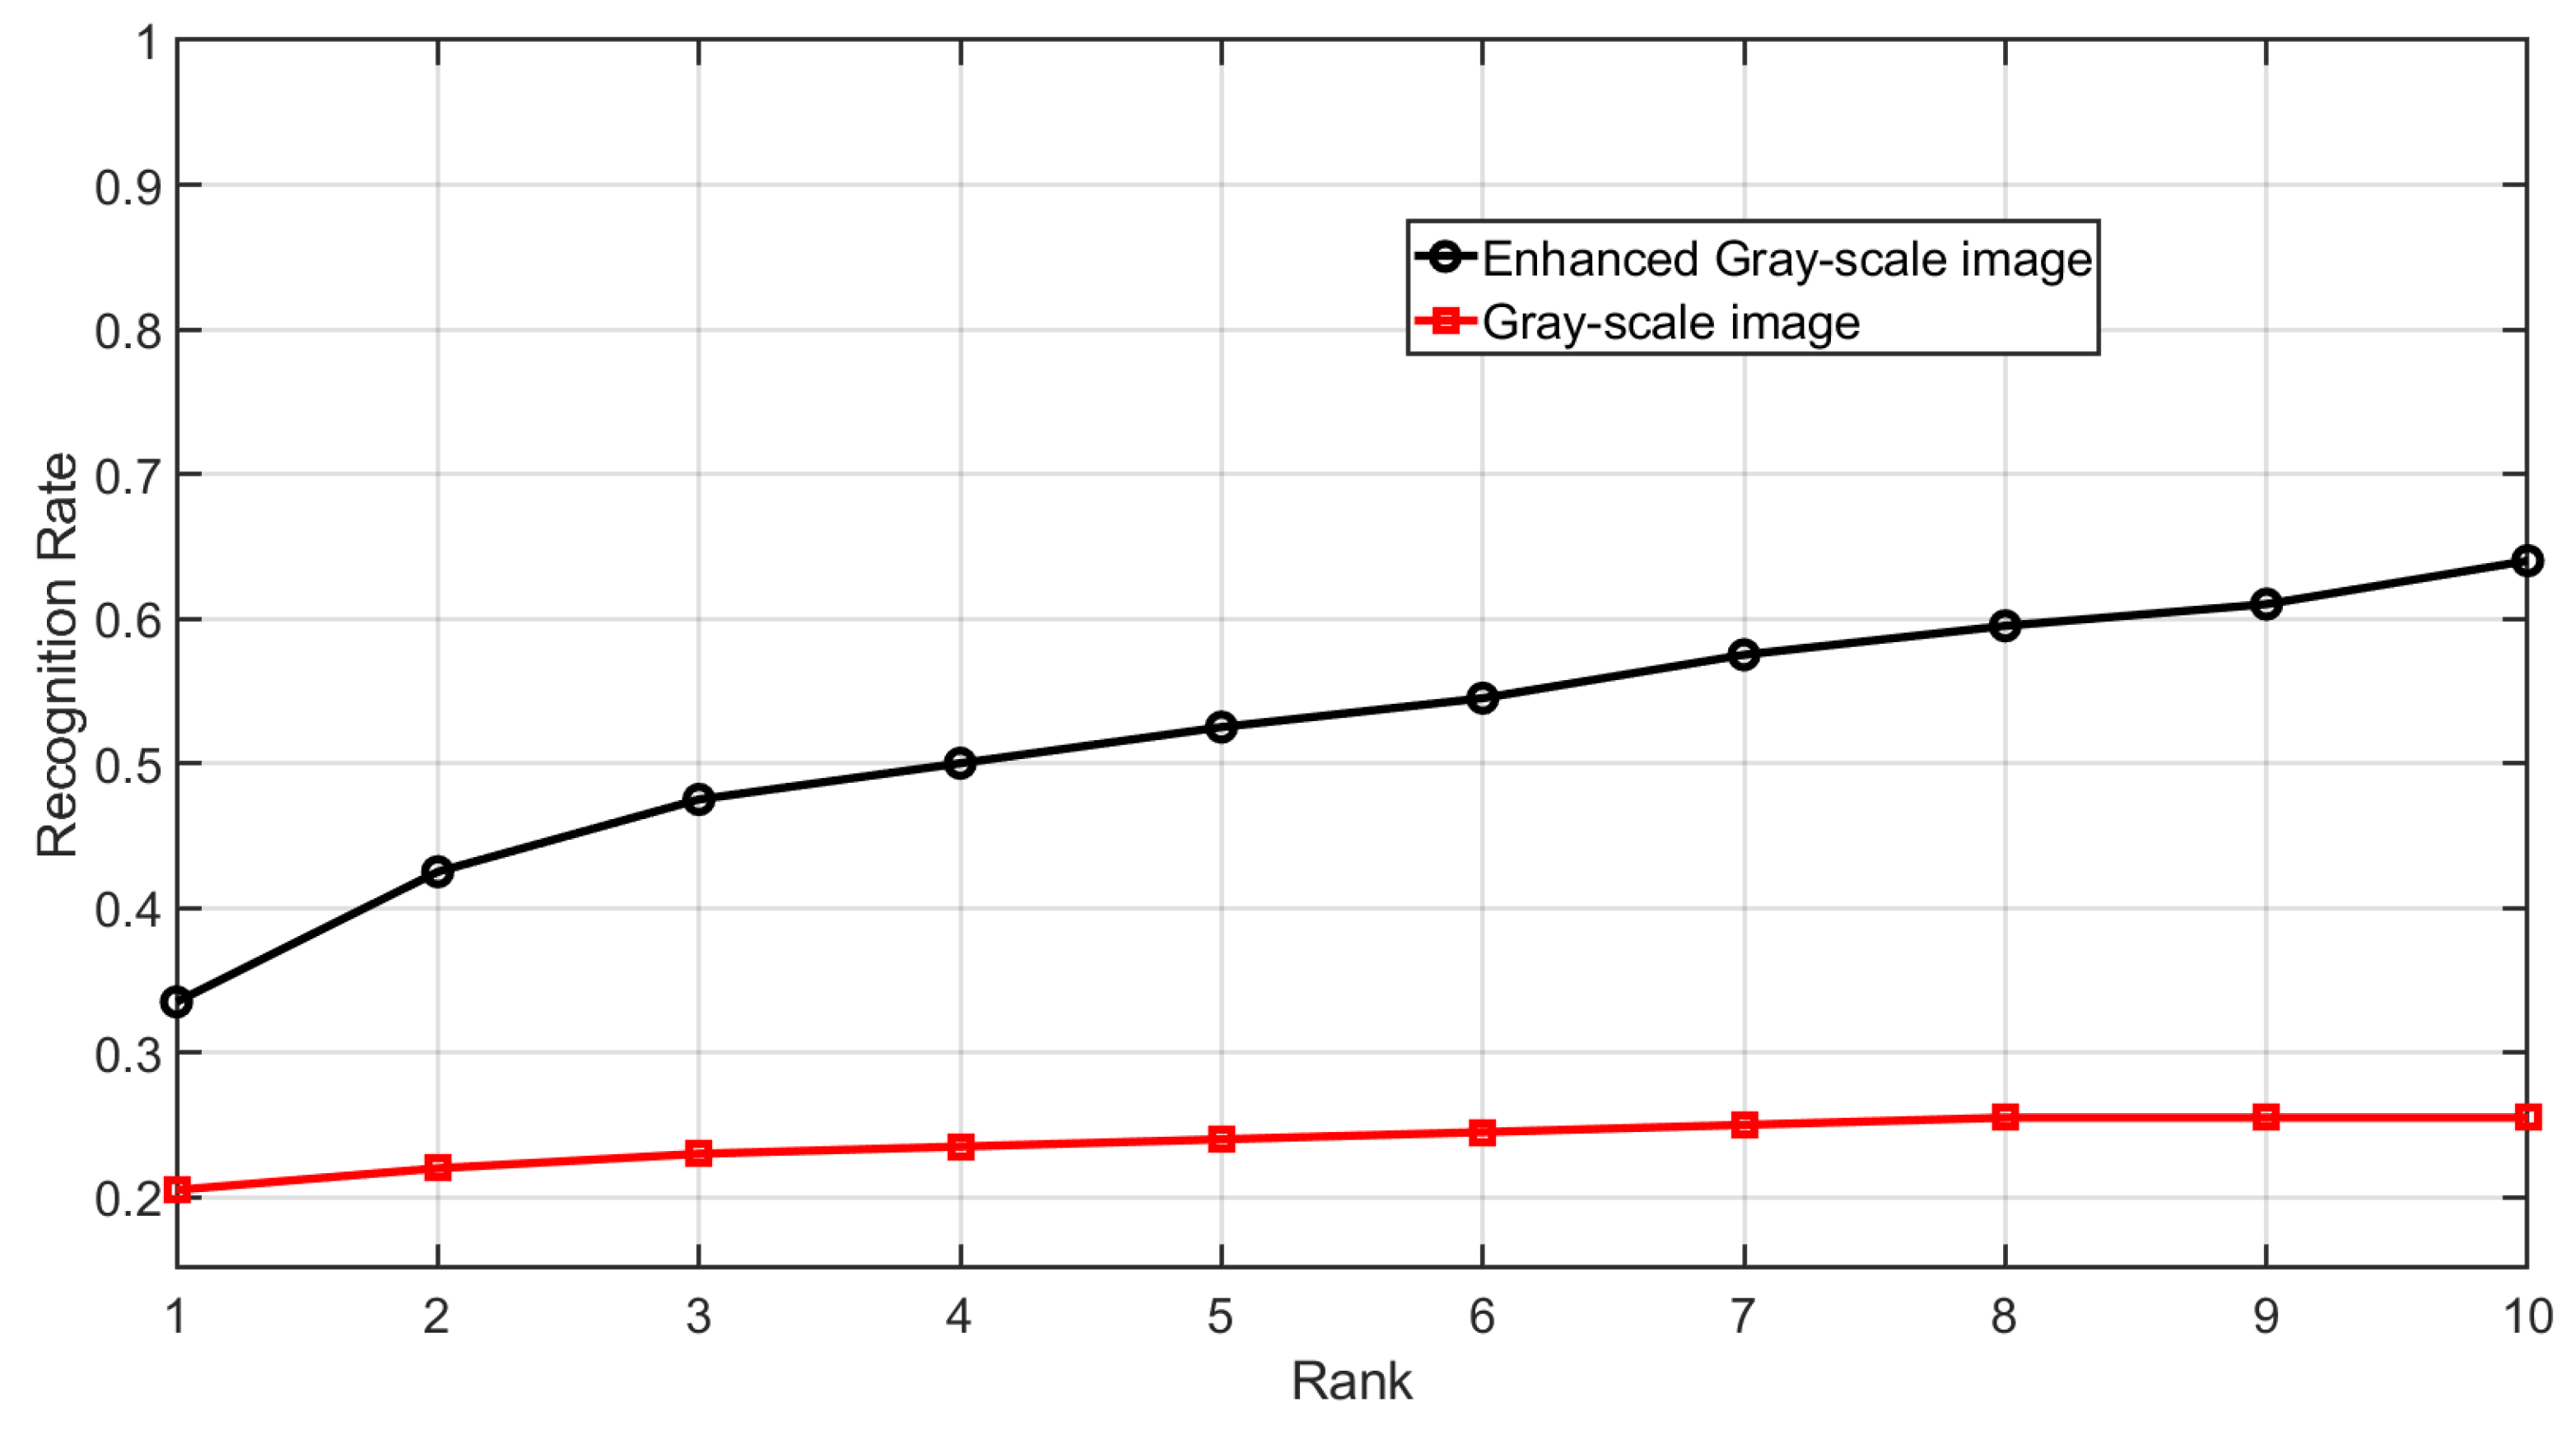

Table 1.
Parameters used in U-Net training.
| Loss Function | Sparse Categorical Crossentropy |
|---|---|
| Optimizer | Adam (learning rate : 0.001) |
| Batch Size | 16 |
| Epochs | 320 |
| Number of classes | 256 |
Table 2.
Parameters used in patch-based U-Net training.
| Loss Function | Sparse Categorical Crossentropy |
|---|---|
| Optimizer | Adam (learning rate : 0.001) |
| Batch Size | 16 |
| Epochs | 100 |
| Number of classes | 2 |
Table 3.
Parameters used in U-Net training.
| Loss Function | Sparse Categorical Crossentropy |
|---|---|
| Optimizer | Adam (learning rate : 0.001) |
| Batch Size | 16 |
| Epochs | 1500 |
| Number of classes | 255 |
Table 4.
Comparison of Equal Error Rate and Rank-1 accuracy of the generated gray-scale images by flattening the 3D point cloud and their enhanced fingerprint images for Dataset B using the proposed method.
Table 4.
Comparison of Equal Error Rate and Rank-1 accuracy of the generated gray-scale images by flattening the 3D point cloud and their enhanced fingerprint images for Dataset B using the proposed method.
| Experiments | EER | Rank-1 |
|---|---|---|
| accuracy | ||
| Generated gray-scale images from the flattened point cloud | 40.00% | 24.44% |
| Enhanced gray-scale images | 13.96% | 33.5% |
Table 5.
Comparison of Equal Error Rate and Rank-1 accuracy of the generated gray-scale images by flattening the 3D point cloud and their enhanced fingerprint images for Dataset C using the proposed method.
Table 5.
Comparison of Equal Error Rate and Rank-1 accuracy of the generated gray-scale images by flattening the 3D point cloud and their enhanced fingerprint images for Dataset C using the proposed method.
| Experiments | EER | Rank-1 |
|---|---|---|
| accuracy | ||
| Generated gray-scale images from the flattened point cloud | 41.97% | 20.5% |
| Enhanced gray-scale images | 12.49% | 33.5% |
Disclaimer/Publisher’s Note: The statements, opinions and data contained in all publications are solely those of the individual author(s) and contributor(s) and not of MDPI and/or the editor(s). MDPI and/or the editor(s) disclaim responsibility for any injury to people or property resulting from any ideas, methods, instructions or products referred to in the content. |
© 2025 by the authors. Licensee MDPI, Basel, Switzerland. This article is an open access article distributed under the terms and conditions of the Creative Commons Attribution (CC BY) license (http://creativecommons.org/licenses/by/4.0/).
Copyright: This open access article is published under a Creative Commons CC BY 4.0 license, which permit the free download, distribution, and reuse, provided that the author and preprint are cited in any reuse.


