1. Introduction
Explainability, defined as the ability to interpret model behavior in a human-understandable way [
1], is increasingly essential in AI applications such as Automated Fact Verification (AFV) systems. While recent advancements in AI architectures, such as transformer models [
2] and Retrieval-Augmented Generation (RAG) [
3], have significantly expanded AFV capabilities, they also pose new challenges in ensuring that system decisions remain transparent and interpretable to end-users and decision-makers.
Most AFV systems generally follow a three-stage pipeline architecture, similar to that used in the Fact Extraction and VERification (FEVER) shared task [
4]. This artitectural approach was later adopted by several subsequent researchers such as [
4,
5,
6,
7,8,9,10]. This architecture involves the composite tasks of collecting or retrieving relevant evidence to support or refute a claim, ranking these pieces of evidence by importance, and predicting the claim’s veracity, inter alia. However, as AFV systems incorporate more advanced architectures and methods, ensuring interpretability in their increasingly complex decision-making processes has become essential. This need is particularly critical in AFV systems, since online misinformation has become ubiquitous in recent times [11]. Furthermore, explainability is becoming increasingly important in critical domains such as finance, healthcare, and journalism, and is supported by a growing body of research in Explainable AI (XAI)[12,13,14,14]. This emphasis on explainability is also supported by government-led initiatives, such as the European Union’s General Data Protection Regulation (GDPR), which mandates explanations for algorithmic decisions, and the United States Department of Defense’s (DARPA) XAI program, which aims to make AI systems more interpretable and trustworthy, and highlight the need for greater transparency in AI systems [12,13,16,17].
However, despite notable advancements in XAI, AFV technologies and the availability of diverse fact verification datasets, the integration of XAI within AFV remains limited. Some studies have attempted to incorporate XAI into AFV systems, although these approaches exhibit certain limitations. For instance, transformer-based models for extractive and abstractive summarization [18,19], risk producing incomplete or misleading explanations. Logic-based models like LOREN [20] and ProoFVer [10] create transparent explanations through logic rules but are difficult to scale and apply in real-world contexts. Attention mechanisms [21,22,23] highlight important features, yet their reliability is questionable as attention scores do not consistently align with key decision-making features [11]. Counterfactual explanations [24,25] demonstrate how small input changes affect predictions, but interpreting them remains challenging in complex fact-checking scenarios. Some of these approaches have outperformed the state-of-the-art in claim veracity prediction [10], but they remain limited in terms of scope and effectiveness for explainability.
In addition to the limitations discussed, notable summative studies in this cross-domain of XAI-AFV, such as the comprehensive review on explainable AFV by [14] and the extensive survey on explainable automated fact-checking by [26], bring attention to several persistent gaps. Addressing these gaps would not only enhance explainability within AFV systems but also help mitigate the limitations identified in existing approaches. The following items summarize and discuss some pertinent aspects of explainability in the context of existing approaches.
Lack of Explanation-Focused Datasets: Existing fact verification datasets like FEVER [27] and MultiFC [28] are not designed to support explanation learning aligned with XAI standards. There is a need for datasets that facilitate training models not only to verify facts, but also to generate meaningful explanations, as previously noted by [29]. This gap in dataset availability limits the development of models capable of both verification and explainability.
Overemphasis on Local Explainability: Current explainable AFV systems focus predominantly on local explainability, explaining individual predictions, while neglecting global explainability, which is essential for understanding the system’s overall decision-making logic [26]. This local focus leaves AFV systems lacking a holistic view of their behavior, limiting transparency and accountability.
Ambiguity in Local and Global Explainability: There is a lack of consensus on how local and global explainability are defined and implemented in AFV systems. While local explainability focuses on individual prediction-level explanations, global explainability refers to understanding the model’s overall reasoning process [30]. Different researchers interpret and apply these concepts inconsistently [
1,31,32,33], leading to confusion and retarded progress in explainable AFV research.
Inconsistencies in Explainability Taxonomy: There are discrepancies in how explainability concepts are categorized across studies in AFV. For instance, some researchers distinguish between intrinsic and post-hoc explainability [22], while others conflate interpretability with explainability, restricting it to individual explanations [18]. This lack of standardization creates further confusion in the field, hindering cohesive advancements in explainable AFV.
In this research, we focus on addressing the first two critical gaps: the lack of explanation-focused datasets and the overemphasis on local explainability. To address these, we propose a comprehensive solution involving a novel explanation-focused dataset and a context-aware evidence retrieval and explanation generation methodology.
In the subsequent sections, after providing the necessary background in
Section 2, we describe the dataset in
Section 3 and the methodology in
Section 4. The dataset introduced is curated for XAI research in AFV. It pairs each claim with multiple annotated pieces of evidence within its thematic context (e.g., Climate change, COVID-19, Electric Vehicles). The dataset facilitates both local and global explainability by enabling deeper exploration of claim-evidence relationships and thematic patterns extending beyond individual data points, while also supporting explainability-focused studies. Meanwhile, our context-aware retrieval methodology enhances the AFV pipeline, particularly the retrieval component, by incorporating thematic embeddings generated from a subset of the fact verification dataset. This subset is identified through a statistical modeling approach and further refined through a semantic aggregation technique. By integrating broader contextual information with claim-specific embeddings, this methodology not only advances existing frameworks like RAG but also introduces a broader thematic context, resulting in more nuanced and context-sensitive explanations. The experimental framework of the methodology, including a case study and comparative analysis with RAG, is presented in
Section 5, while challenges, future research directions, and conclusions are discussed in
Section 6,
Section 7 and
Section 8, respectively.
While our work contributes to mitigating these issues, the remaining two challenges, ambiguity in explainability terminologies and inconsistencies in explainability taxonomy, are expected to be gradually refined as more research in the field emerges, leading to greater clarity and standardization.
2. Background
The evolution of AFV systems began with `knowledge-free’ approaches relying solely on linguistic features of claims for verification, without using external evidence [34]. This was followed by the integration of structured knowledge bases, like RDF triples, for fact verification, but faced challenges with scalability and handling nuanced information [35,36]. A major advancement in AFV systems came with the introduction of evidence retrieval methods, where claims were verified against retrieved textual sources, such as Wikipedia, as demonstrated in the FEVER dataset by [
4]. While Wikipedia offered broad accessibility, it also introduced challenges with comprehensiveness and potential biases, impacting the fidelity of resulting AFV models [37]. A further breakthrough was achieved with the development of advanced retrieval capabilities, exemplified by RAG, which dynamically integrate external knowledge during inference to enable more context-sensitive and informed veracity predictions [38]. Nonetheless, interpretability, accuracy, and fidelity remain essential paradigms in explainable AI, as emphasized by recent work on XAI [
1,13,31].
Maintaining these XAI principles has become increasingly challenging due to the evolving complexity of modern AFV systems, particularly with the use of pre-trained Foundation Models (FM) and Large Language Models (LLM) in different roles across the AFV pipeline. For instance, LLMs are used as encoders for embedding generation to capture semantic representations of claims and evidence, for natural language inference (NLI) in veracity prediction, and for natural language generation (NLG) in crafting coherent explanations. Additionally, incorporating RAG for dynamic evidence retrieval and in-context learning for veracity assessment based on retrieved evidence [38] has further increased the complexity of these systems. In particular, the use of LLMs, with their massive scale in terms of parameters and training data, presents unique challenges for explainability in downstream tasks like AFV. Moreover, these models require extensive computational resources for generating explanations. Consequently, established interpretability methods, including feature attribution methods such as gradient-based approaches [39] and SHAP values [40], as well as surrogate models like LIME [41], can become computationally impractical for explaining models with billions of parameters, limiting their feasibility for current AFV systems compared to traditional deep learning models.
In addition to the influence of the operational role of LLM integration we discussed, the training paradigm adopted for the employed LLM also necessitates diverse strategies for achieving XAI in AFV. Specifically, the approach to explainability varies significantly based on whether the model is fine-tuned or used directly through prompting. In the fine-tuning paradigm, models like BERT [42], and RoBERTa [43], which are pre-trained on large corpora, are subsequently fine-tuned on labeled datasets for specific tasks, such as AFV. In contrast, the prompting paradigm utilizes models without additional training, as seen with base models like GPT-3 [44] and Llama 3 [45], which respond based on pre-trained knowledge; or as with assistant models like GPT-4 by OpenAI [46], Claude by Anthropic [47] which undergo additional alignment through methods like instruction tuning and Reinforcement Learning from Human Feedback (RLHF) to perform user-specific tasks [30]. The prompting paradigm is further reinforced by the impressive zero-shot performance of LLMs in various language tasks [48], showcasing their capability to handle complex tasks without task-specific fine-tuning. These diverse methods of employing LLMs significantly affect how XAI research in modern AFV is approached. Fine-tuned models require tailored interpretability methods that account for task-specific adjustments, whereas prompting-based models rely on post-hoc explanations generated from the models’ pre-trained knowledge [30].
Furthermore, the intended scope of explainability, whether local or global, further influences the choice of XAI strategies devised for AFV. Therefore, effective XAI in AFV must consider the model’s operational role (e.g., encoder, NLI, NLG), the training paradigm employed (fine-tuning, few-shot, or prompting), and desired explainability scope (local or global), necessitating a holistic approach. However, as outlined in the introduction, current XAI methods in AFV primarily involve post-hoc explanations (i.e., methods applied after the model has been trained to explain its predictions), including transformer-based models (extractive and abstractive summarization to assist veracity prediction), logic-based models (using logic rules to create transparent explanations), attention mechanisms (highlighting important features), and counterfactual explanations (showing how small input changes affect predictions), each with limitations in scalability, reliability, and interpretability.
In this research, we advance post-hoc explanations by enhancing both the retrieval and generation components of RAG: incorporating thematic embeddings for context-aware evidence retrieval and leveraging zero-shot NLG with optimized LLM prompting for abstractive summarization.
Section 4 details our framework, addressing the roles, paradigms, and scope of XAI in AFV comprehensively for a balanced explainability.
3. Dataset
In this section, we introduce FactVer, a novel dataset developed to address key limitations in existing AFV datasets by supporting both fact verification and XAI research, with a focus on enhanced transparency and explainability. Aligned with recent research directions in explainable AFV, such as those proposed by [14], the dataset offers structured evidence relationships and human-generated explanations across multiple topics. By enabling deep exploration of claim-evidence relationships and thematic patterns, the dataset facilitates both local and global explainability, paving the way for advanced research in explainability-focused AFV systems.
3.1. Structure and Composition
The dataset is organized into the following thematic topics and structured around key components corresponding to its column headers, as outlined in
Table 1.
Climate Change: Claims and evidence related to global warming, environmental policies, and their socioeconomic impacts.
Covid-19: Claims and evidence concerning the pandemic, vaccines, treatments, and public health measures.
Electric Vehicles: Claims and evidence focused on electric vehicle technology, battery innovations, efficiency, and market trends.
The dataset was generated through a rigorous annotation process, ensuring consistency across themes while capturing diverse perspectives. The following sections provide detailed statistics about the dataset, describe the preparation process, and present example data entries to illustrate its structure and composition.
3.2. Dataset Description
The dataset includes 589 unique claims. As shown in
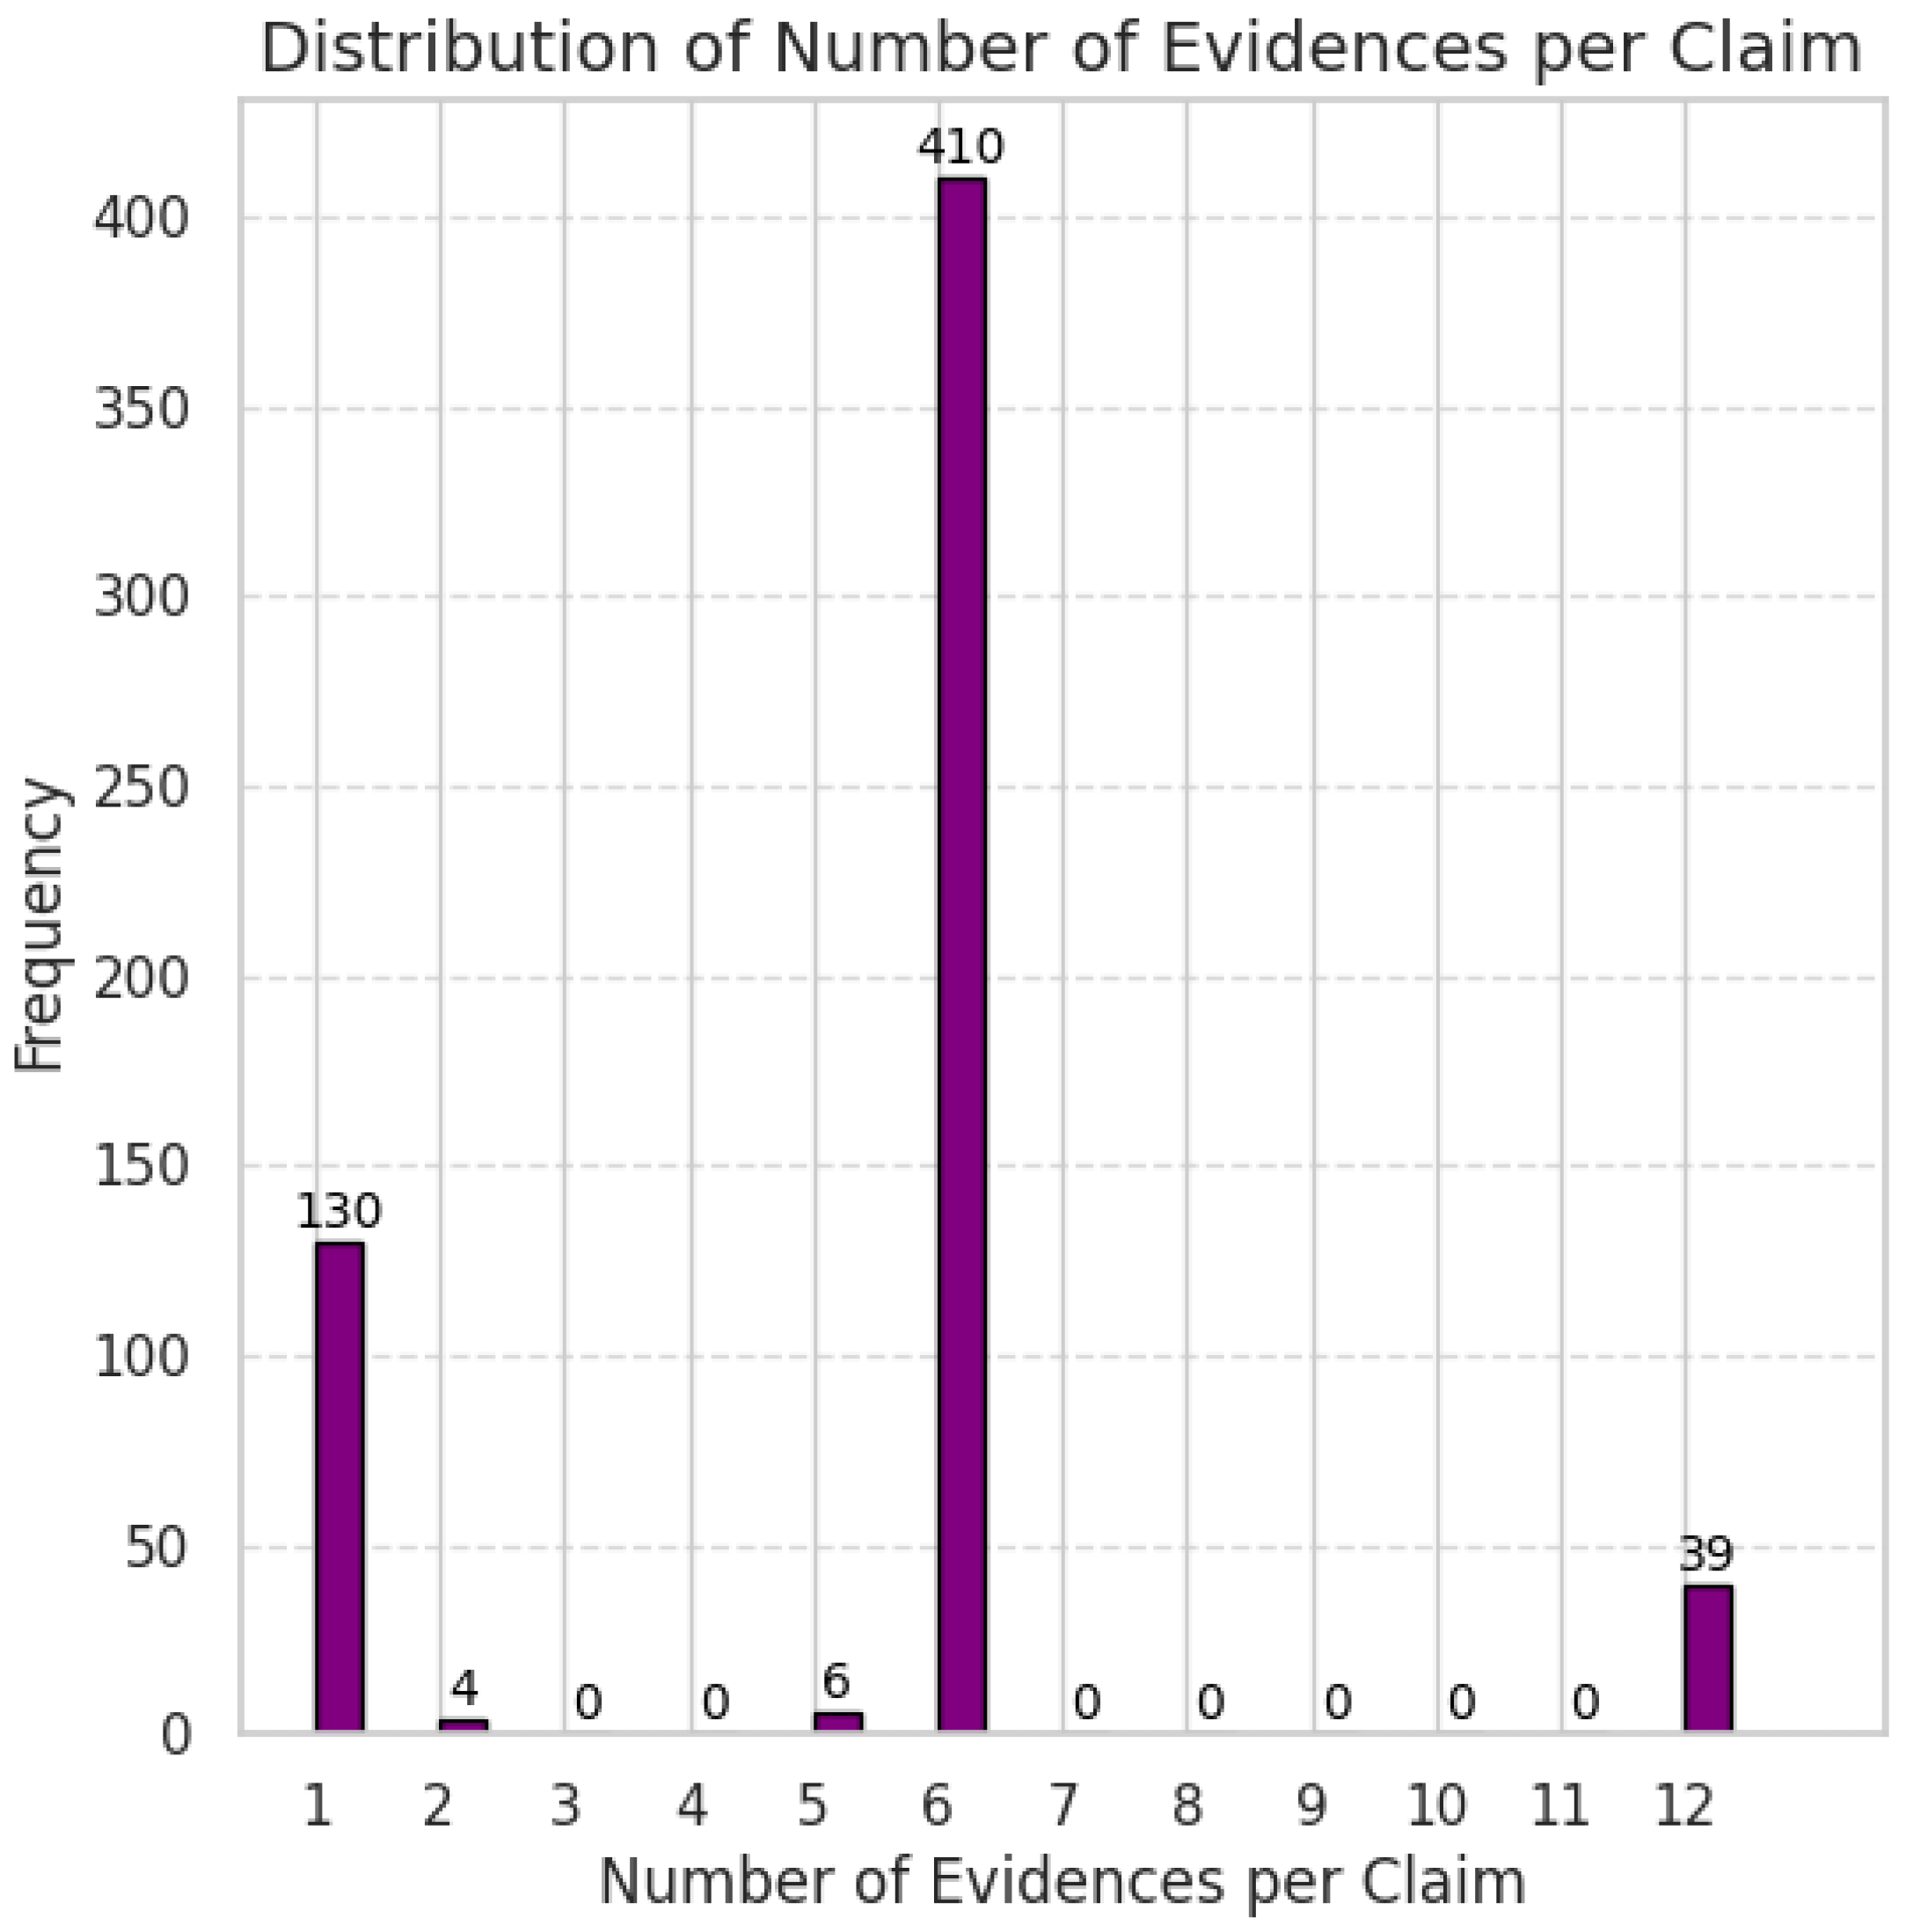
Figure 1, the majority of these claims are supported by 6 pieces of evidence (approximately 70%), while a smaller subset of claims has only 1 piece of evidence (about 22%). A minor portion of claims is associated with 12 pieces of evidence (around 7%). This range of evidence distribution provides flexibility in terms of the depth and complexity of explainability within the fact verification process.
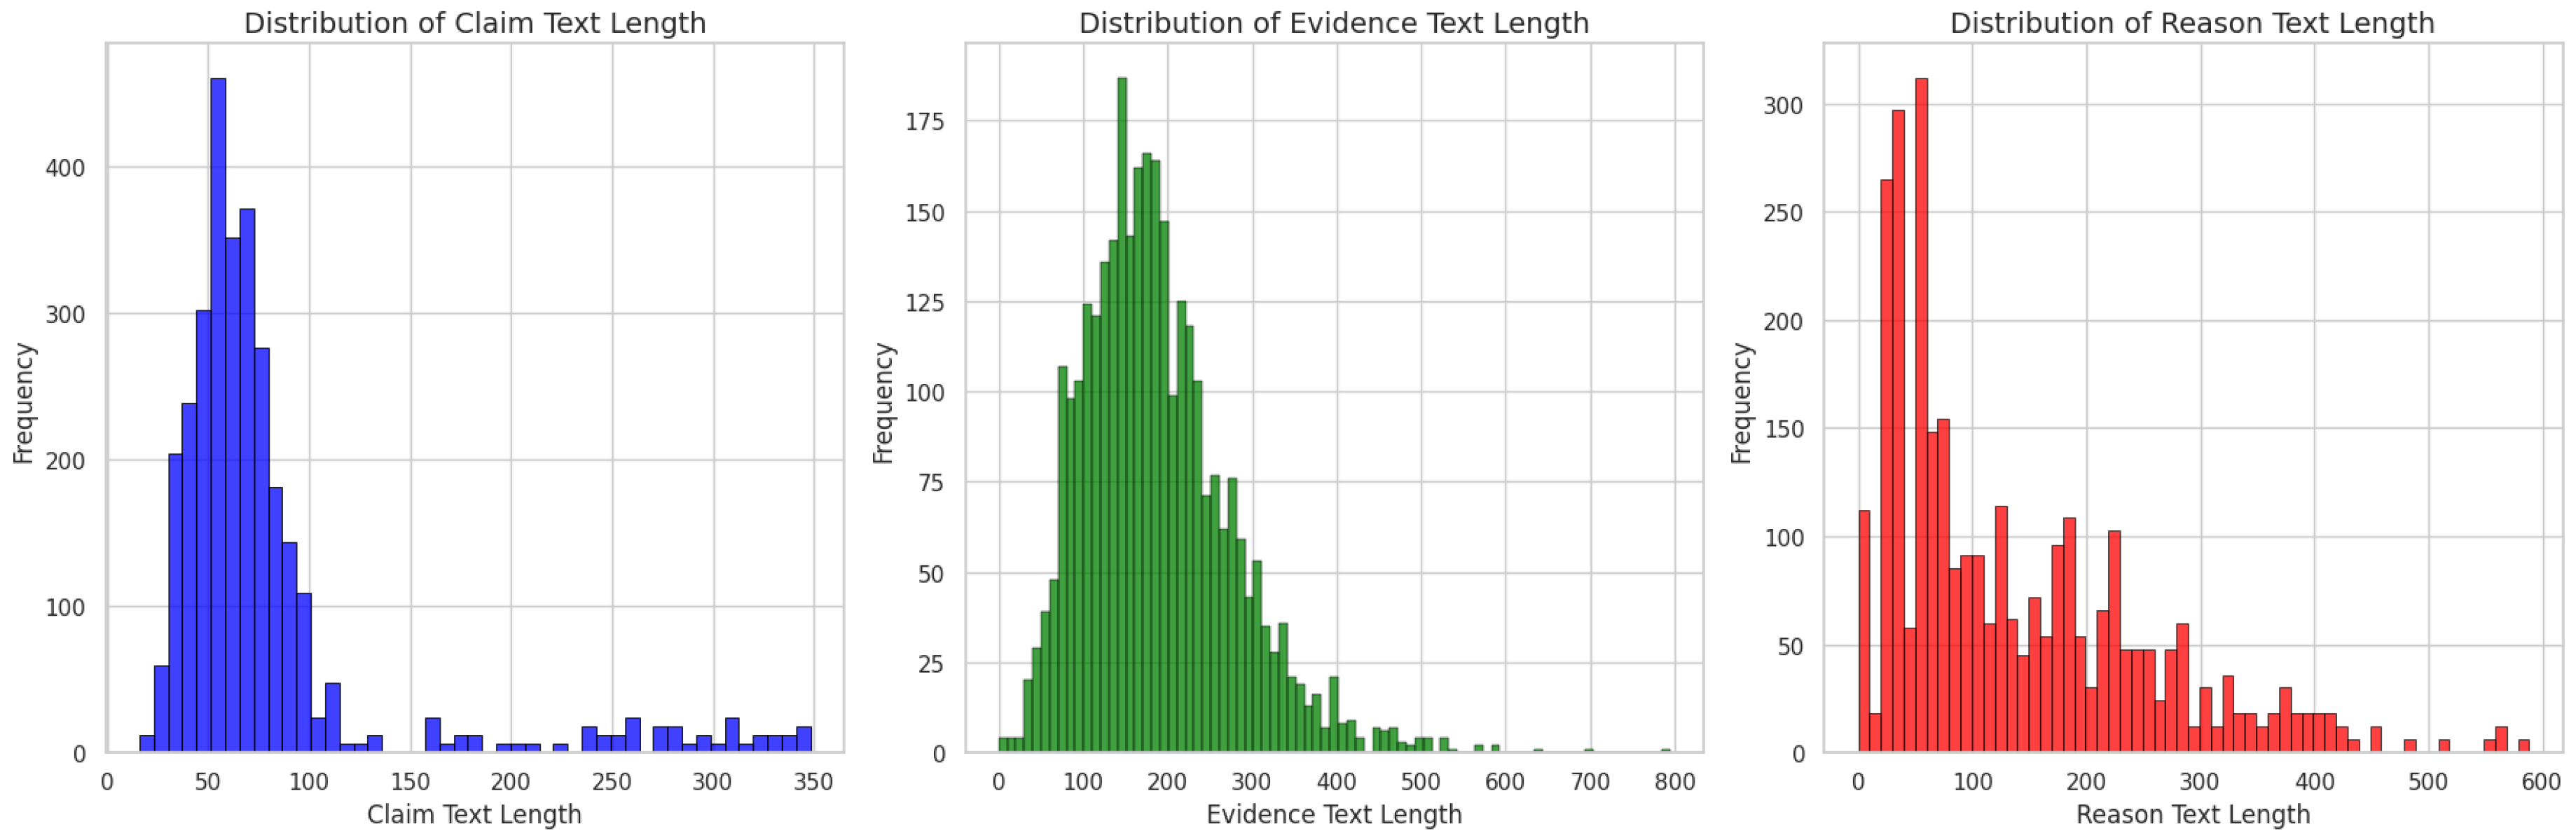
Furthermore,
Figure 2 illustrates the distribution of text length for
Claim_Text, Evidence_Text and Reason. The following key points can be observed:
Claim_Text Length: The majority of claims are concise, typically within the 40-60 word range. Longer claims exceeding 100 words are less common.
Evidence_Text Length: Evidence text length varies widely, with most evidence ranging from 150-250 words, though some extend up to 700 words, reflecting varying levels of detail required to support different claims.
Reason Length: Reasons are generally concise, with most falling within the 50-100 word range. While some explanations exceed 200 words, very few extend beyond 400 words.
This distribution highlights the diverse nature of the dataset, where claims tend to be concise, while the corresponding evidence texts and human-generated reasons offer varying levels of detail, potentially reflecting the differing complexity of the claims.
3.3. Preparation
The dataset was constructed from a large corpus of news articles, sourced from over 20,000 searches conducted via Google, Bing, and DuckDuckGo between October and December 2022 across the three themes/topics mentioned in
Section 3.1, collectively referred to as
FactVer_1.0. These articles were processed to extract key information, including titles, body content, and relevant metadata (e.g., publication date, article ID, and URL), resulting in the intermediate version named
FactVer_1.1.
Following this, three independent annotation teams worked with the processed dataset using a unified instructions document. Annotators followed step-by-step instructions in that document for creating a fact verification dataset for their assigned topics, generating claims based on the article content and identifying corresponding evidence spans. It is important to note that each annotation team worked on non-overlapping topics (as specified in the instructions), annotating separate subsets of the dataset, and inter-annotation agreement was hence not applicable. Each claim received a unique Claim ID, and evidence pieces were labeled with unique Evidence IDs (e.g., E1 to E6) for traceability. Claims were labeled as True (T), False (F), or Not Enough Info (N) based on the evidence provided. Annotators also included a Reason field, offering explanations for the assigned labels, which could either be derived directly from the evidence or be a novel, human-generated explanation.
This process resulted in three intermediate fact verification datasets, collectively referred to as
FactVer_1.2_X, where X represents the
Annotation_ID of each respective team. Further details about the annotation process, including the template provided to annotators and the instructions they followed, are available in
Appendix A. Although the annotation guidelines recommended supporting each claim with up to six pieces of evidence, the actual number of evidence pieces per claim in the consolidated fact verification dataset ranges from 1 to 12, as discussed in
Section 3.2 and represented in
Figure 1, reflecting the varied interpretations and approaches of the annotation teams.
Building on these intermediate datasets, their consolidation resulted in a unified dataset created through additional data cleaning, preprocessing, and traceability steps (details of which are also provided in
Appendix A). This consolidated dataset, named
FactVer_1.3, is designed to facilitate AFV and support XAI research in this domain.
3.4. Example Data Entries
To illustrate the dataset structure, we provide examples of data entries, using the first claim (Claims_Climate_B2.0_1) in the dataset as a representative example.
Claim_Topic_ID: Claims_Climate_B2.0_1
Claim_Text: New Zealand has a carbon trading system
Label: T
-
Evidence_Text: (The following list contains the six pieces of annotated evidence associated with this claim:)
- -
Evidence 1: A number of other countries have, however, also implemented a carbon trading system at a national or sub-national level, or have one in development, including Canada, China, Japan, New Zealand, South Korea, Switzerland, and the United States, according to the European Commission.
- -
Evidence 2: As of July, 46 countries are pricing emissions through carbon taxes or emissions trading schemes (ETS), according to the International Monetary Fund.
- -
Evidence 3: NZ’s agricultural emissions aren’t currently captured under the ETS (unlike other sources like industrial processes).
- -
Evidence 4: The number of emission units released for auction is designed to meet New Zealand’s international obligations.
- -
Evidence 5: With many New Zealand farms having been converted to forestry due to rising carbon prices in recent years, feedback last week closed on a proposal to change settings in the Emissions Trading Scheme, where permanent plantings of exotic forests, like pine forests, would be excluded from the scheme from next year.
- -
Evidence 6: China, South Korea, Canada, Japan, New Zealand, Switzerland and the US already have a number of national or regional systems, however the international carbon market is said to develop through a bottom-up approach, whereby the EU ETS will be linked with other international systems, with a common aim to reduce the amount of emissions.
Reason: New Zealand has an existing emissions trade scheme
Reason_Type: Abstractive
3.5. Summary
FactVer, designed to advance explainability-focused research, addresses the need for datasets that support both fact verification and explanation learning. Its structured evidence annotations and diverse thematic scope provide a valuable resource for improving fact-checking methods and advancing AI-driven research in both local and global explainability within AFV systems. The dataset is integral to our methodology, providing a foundation for developing and validating new approaches in AFV, as discussed in the following section.
To ensure reproducibility and foster further research, the dataset is publicly available on Hugging Face
1, and the associated code is available on GitHub
2.
4. Methodology
This section presents our Context-Aware `Retrieval Augmented Generation’ Framework (CARAG), an approach to enhance evidence retrieval and post-hoc explanation generation in AFV systems. Traditional retrieval methods often process each query in isolation, overlooking the broader (or non-local) context surrounding a claim. CARAG addresses this gap, leveraging the structured evidence and thematic insights from the FactVer dataset, ensuring that retrieval aligns with both claim-specific details and its broader thematic background, leading to more informed prompts for LLMs and, consequently, richer fact verification explanations, as elaborated in the following sections.
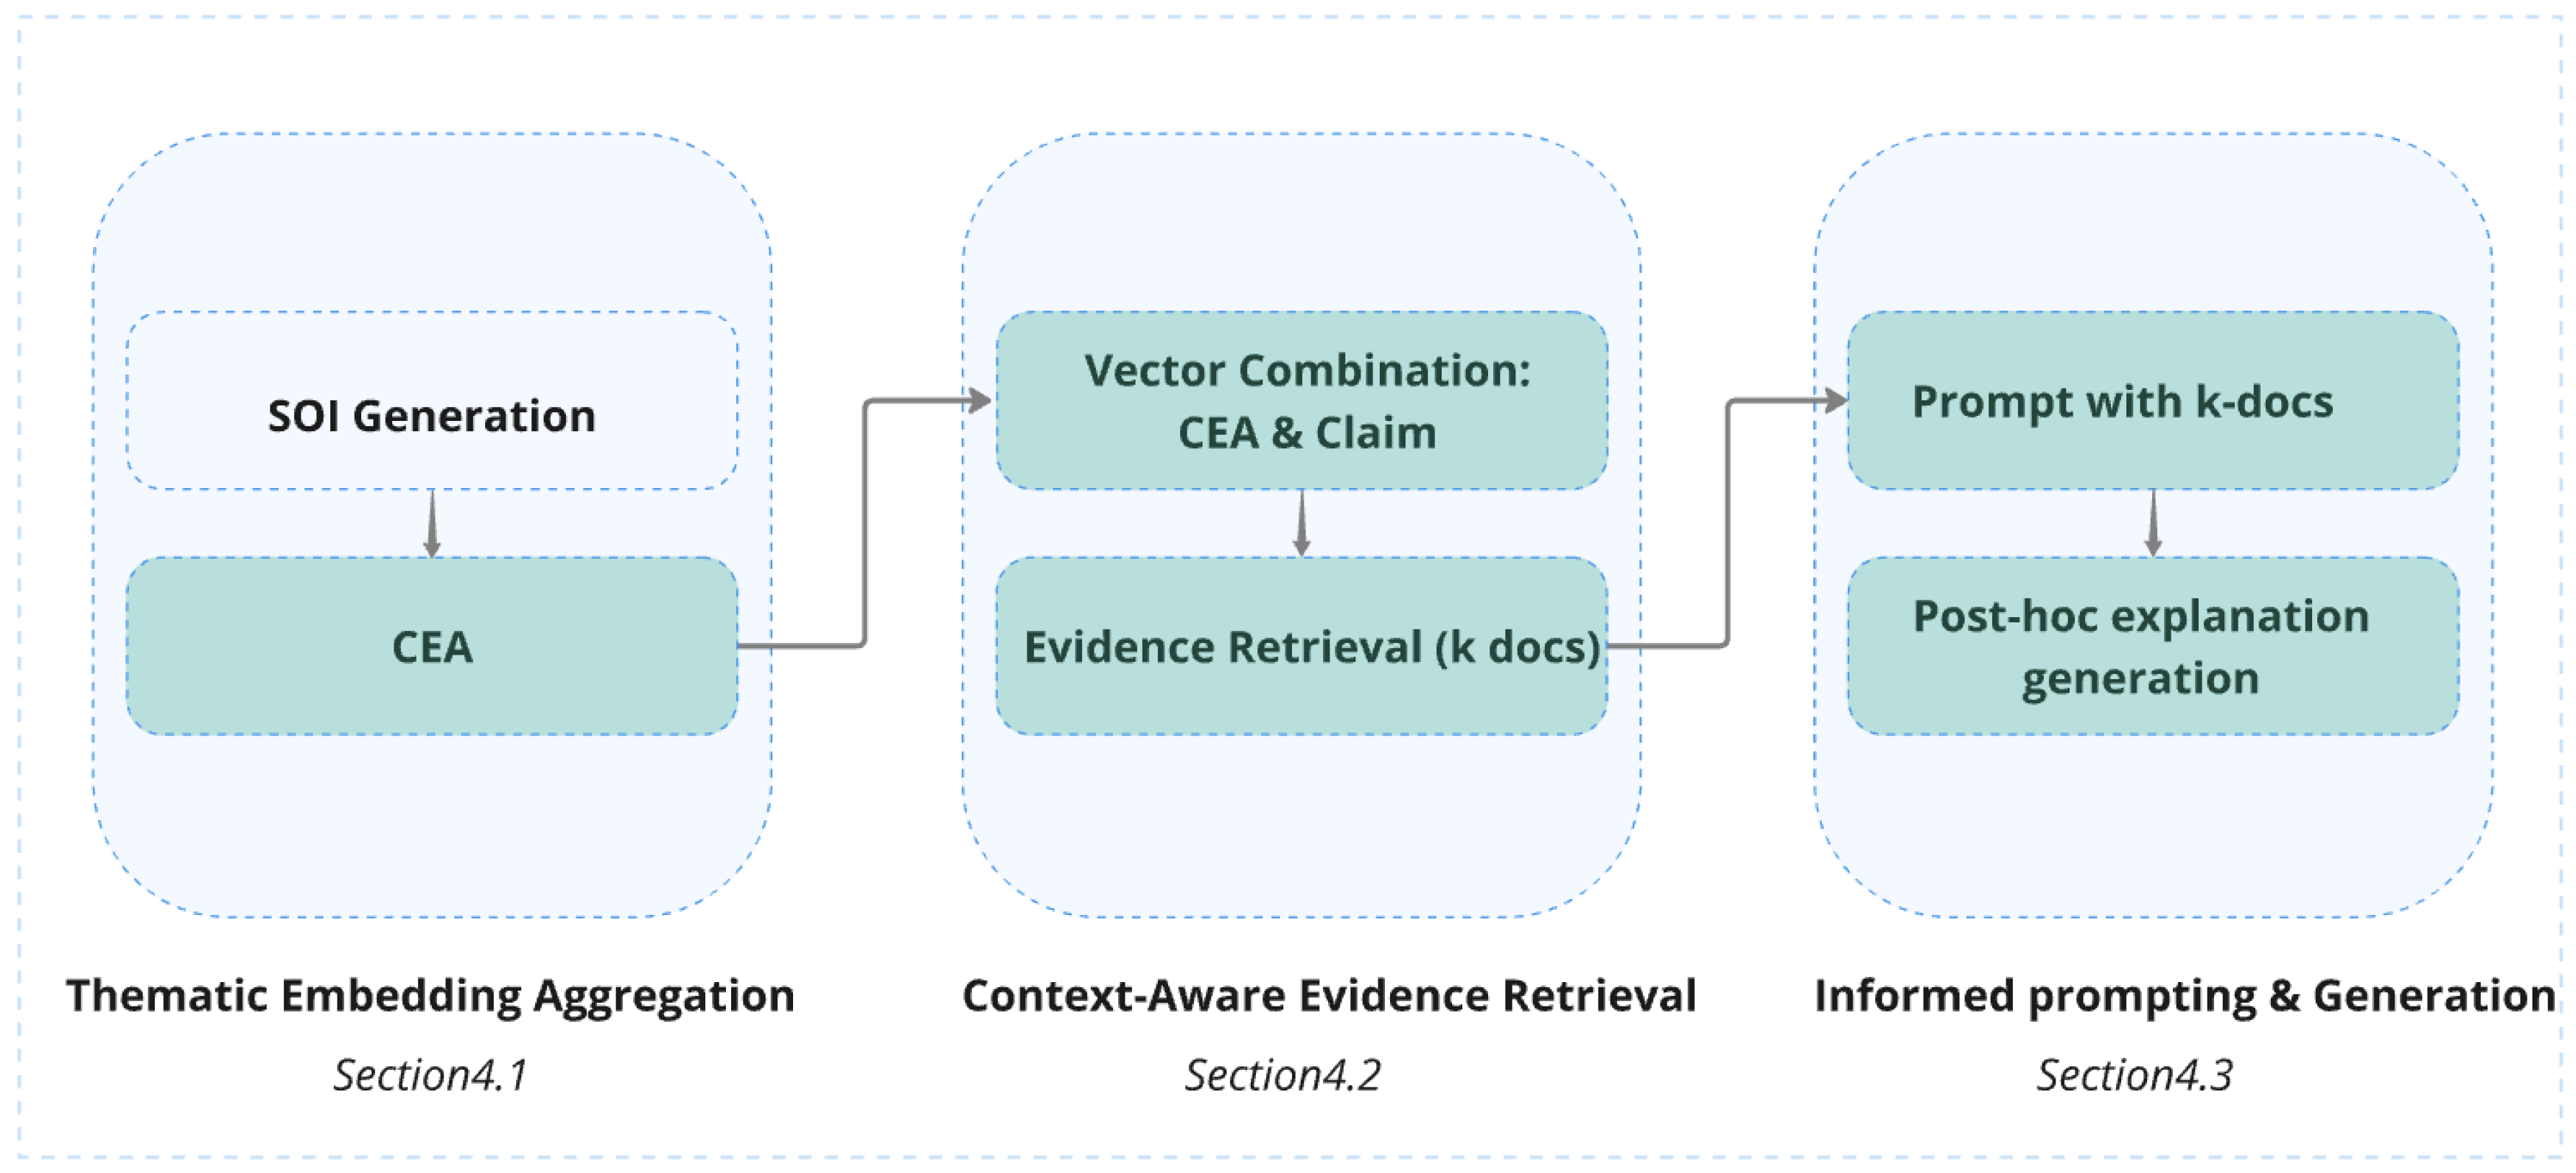
Figure 3 presents a visual overview of our methodology, summarizing the key components described in the subsequent sub-sections in methodology description. It simplifies the understanding of our otherwise intricate process by offering a step-by-step representation of how different phases, retrieval and generation, interact. Later in this section, a more detailed diagram showcases how CARAG is integrated into the complete AFV pipeline, demonstrating how it refines both evidence retrieval and explanation generation compared to standard methods.
4.1. Thematic Embedding Generation
The first step in our methodology is to generate thematic embeddings by leveraging the Subset of Interest (SOI), a concept introduced to find non-local context of a claim under investigation [49]. In that work, the SOI was utilized for cluster visualization, offering insights into both the claim’s annotated evidence and also its broader, non-local context. The SOI generation process starts by identifying the theme of the selected claim (e.g., climate change) from the fact verification dataset. The dataset is then filtered to include only claims and evidence relevant to the identified theme. A Gaussian Mixture Model with Expectation-Maximization (GMM-EM) [50,51] is then applied to this filtered subset to group semantically similar claims and evidence into distinct clusters based on their embeddings.
The cluster containing the selected claim is then identified, and all items within this cluster are extracted to form an initial set. This set includes: (i) the selected claim, (ii) its directly annotated evidence (if any in the same cluster), (iii) other claims within the identified cluster (hereafter referred to as related claims), and (iv) the annotated evidence of these related claims (if available within the same cluster, and here after referred to as thematic cluster evidence). Importantly, not all annotated evidence of the selected claim or related claim’s will necessarily be present in the identified cluster, as it is the result of an unsupervised clustering process.
Next, cosine similarity is calculated individually between the embedding of the selected claim and the embedding of each item in this initial set. Items that fail to meet a predefined threshold (
) are excluded, ensuring that only the most relevant claims and evidence remain. This refined subset becomes the SOI of the selected claim. The SOI is stored in a dictionary format, as shown in
Table 2, containing the claim details, its directly annotated evidence pieces, related claims, thematic cluster evidence, and cosine similarity scores quantifying the relevance of each evidence or claim to the selected claim. (The complete algorithm for SOI generation is provided in the
Appendix B for those interested in the technical details).
However, while the possibility of leveraging the SOI of a claim for evidence retrieval or inference mechanisms within the AFV pipeline was highlighted as a future direction in prior work [49], it was not implemented. In this research, we extend the utility of SOI by integrating it into the AFV pipeline for the first time, moving beyond its visualization purpose. This transformation evolves the SOI from a static visual representation into an active component of CARAG.
To implement this SOI integration into CARAG, selected elements from the SOI dictionary are extracted, specifically, the SOI[`annotated_evidences’], SOI[`related_claims’], and SOI[`thematic_cluster _evidences’]. Each item in these fields is then passed through a Sentence Transformer model (SBERT, specifically the all-mpnet-base-v2 variant), which converts the text into a numerical vector (embedding) that captures the semantic meaning and contextual relevance of the text. Next, as represented in Equation
1, a single unified thematic embedding is generated by calculating the element-wise average of embeddings corresponding to these specific elements within the SOI. This involves summing the element wise numerical components of the embeddings and dividing the result by the total number of embeddings. Embedding aggregation techniques, such as averaging, or graph-based methods, have been explored in various studies [52,53,54].
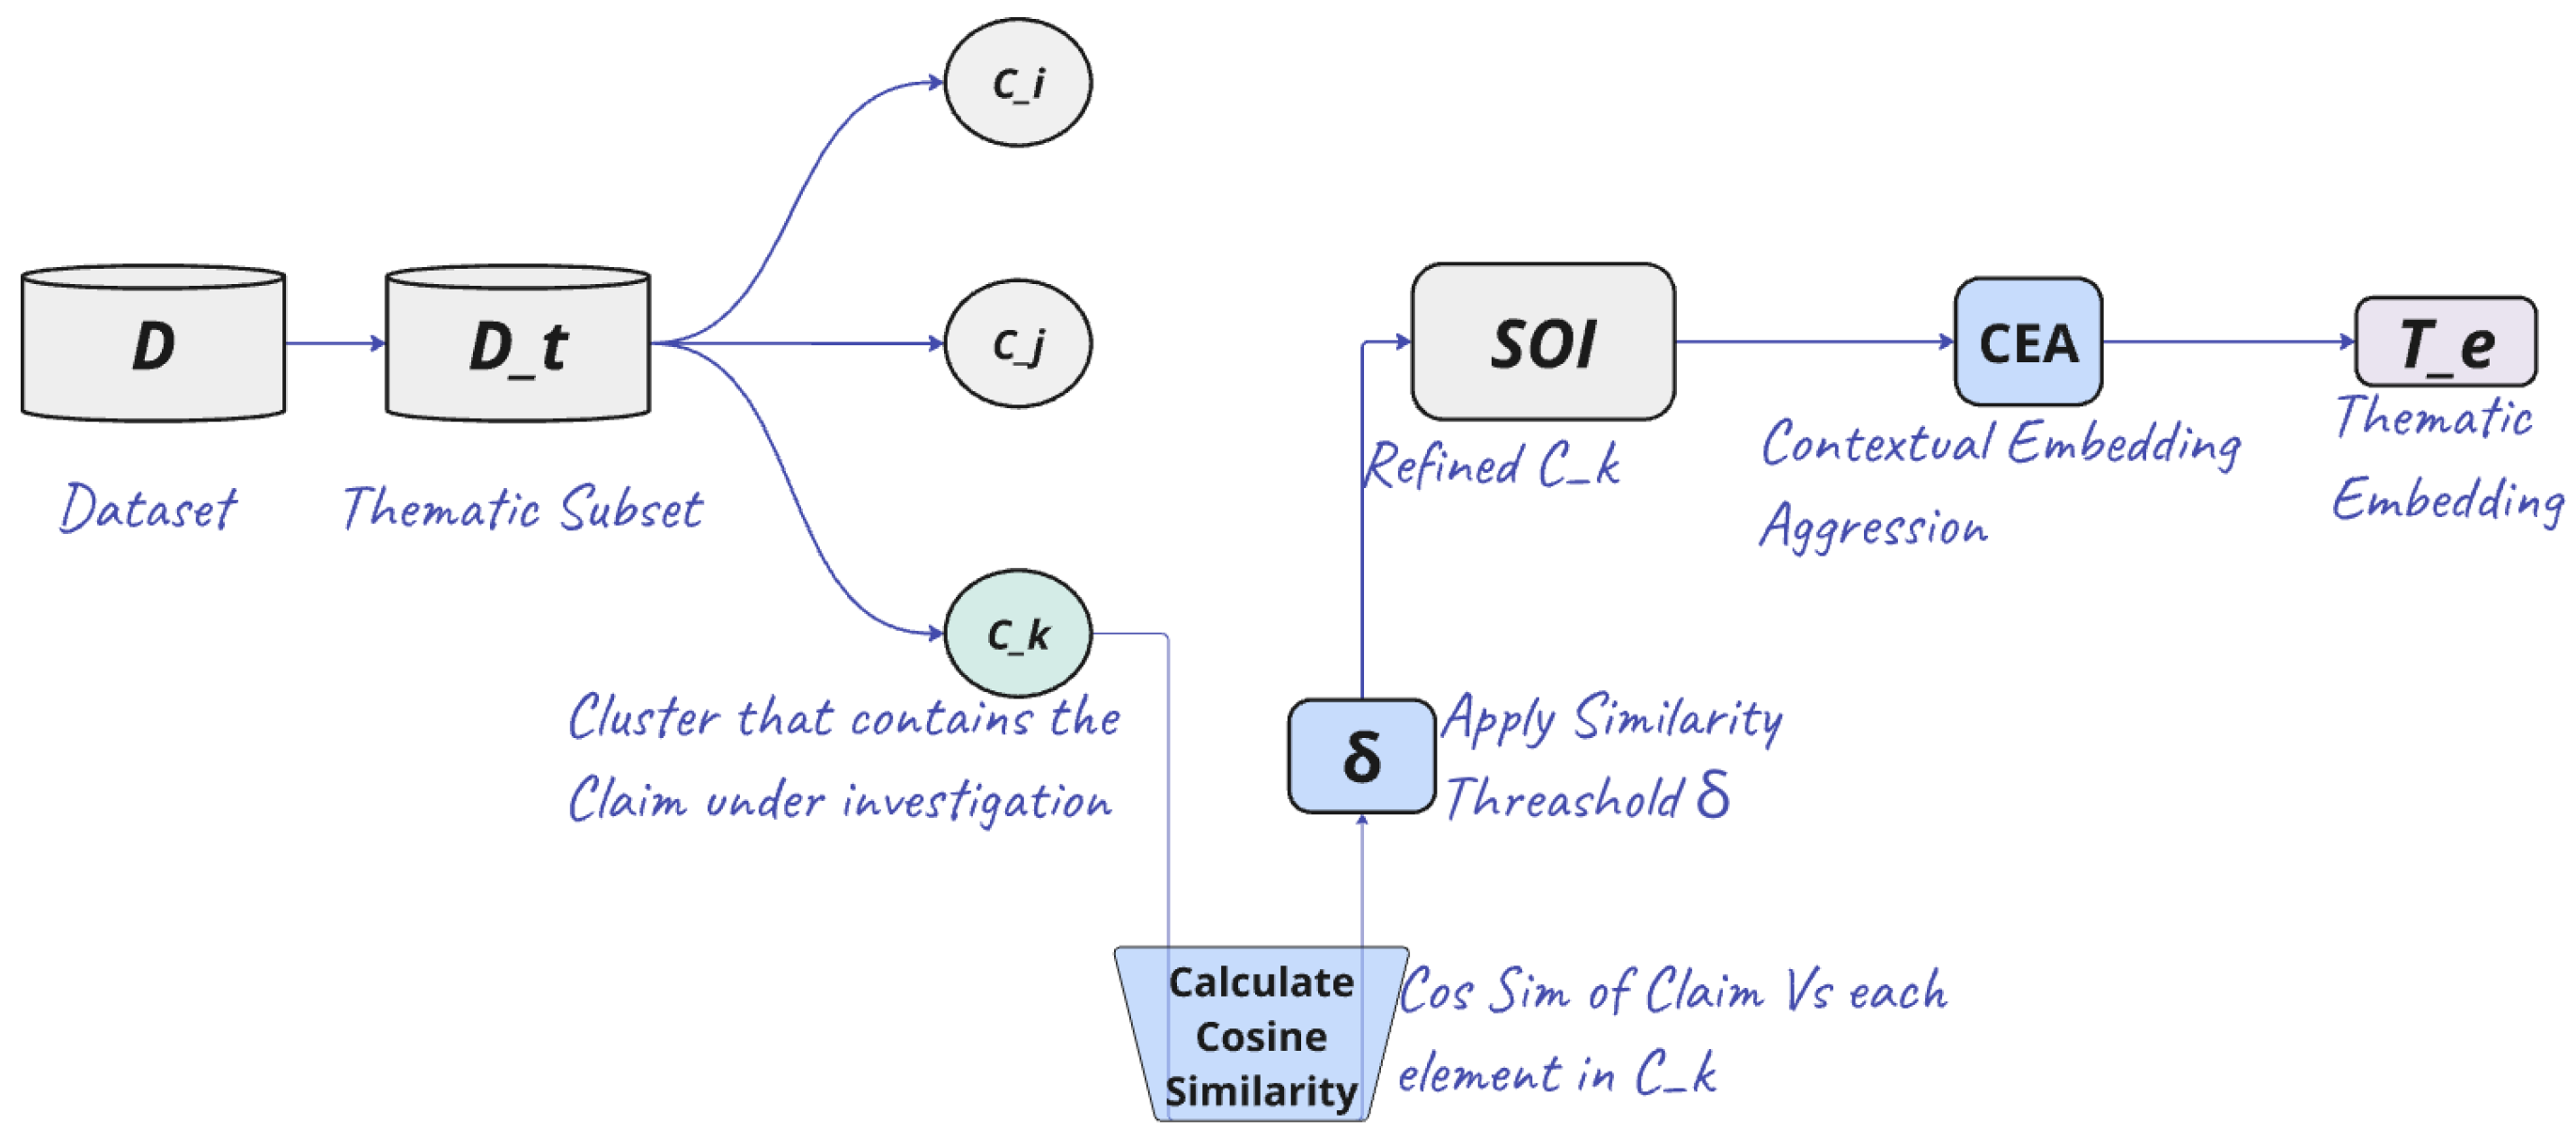
In our pipeline, we define this phase as Contextual Embedding Aggregation (CEA), and
Figure 4 illustrates the process of generating the thematic embedding (represented as (
T_e), starting from the dataset (
D). This aggregated thematic embedding, derived from the SOI and capturing both local and global contexts, serves as the foundation for the explainable AFV framework we propose in this study, particularly for the evidence retrieval process.
More importantly, while this thematic embedding encapsulates the broader context of the claim derived from the SOI dictionary, the claim itself is excluded from the CEA process. As represented in Equation
1, the claim embedding is deliberately omitted from this computation. This distinction ensures a clear separation between the claim-specific embedding and the contextual embedding, which are later combined during the retrieval process (detailed in
Section 4.2).
4.2. Context-Aware Evidence Retrieval
Building on the thematic embeddings generated through CEA, this stage of CARAG integrates them into the evidence retrieval process by combining the claim vectors with the thematic embedding, which together serve as the query for retrieving evidence from the (vectorized) fact verification database. These embeddings are merged using a weighted mechanism (Equation
2), where the parameter
controls the balance between claim-specific details and thematic context.
As established in
Section 4.1, the claim text is not included in the CEA process, ensuring that it remains distinct and is combined separately with the thematic embedding during this stage. This separation supports flexible weighting, allowing for varying influences of claim-specific and contextual details depending on the task, and can extend to other retrieval tasks requiring a balance between localized and contextual information. An
of 0.5 aims to achieve an equal balance of claim-specific details and broader contextual information in the retrieval query, thereby influencing the selection of evidence with contextual insights.
4.3. Smart Prompting for Explanation Generation
Following the context-aware evidence retrieval process, this stage introduces natural language generation into the framework, where an LLM is employed to generate concise fact-verification explanations. The retrieved evidence is incorporated into the LLM prompt alongside the claim text and specific instructions. By ensuring that the evidence is enriched with both specific and contextual insights, the prompt is crafted to reflect a more comprehensive perspective, integrating information that goes beyond the immediate claim. This results in more human-readable explanations that are both informative as well as contextually grounded, as we will further discuss in subsequent sections.
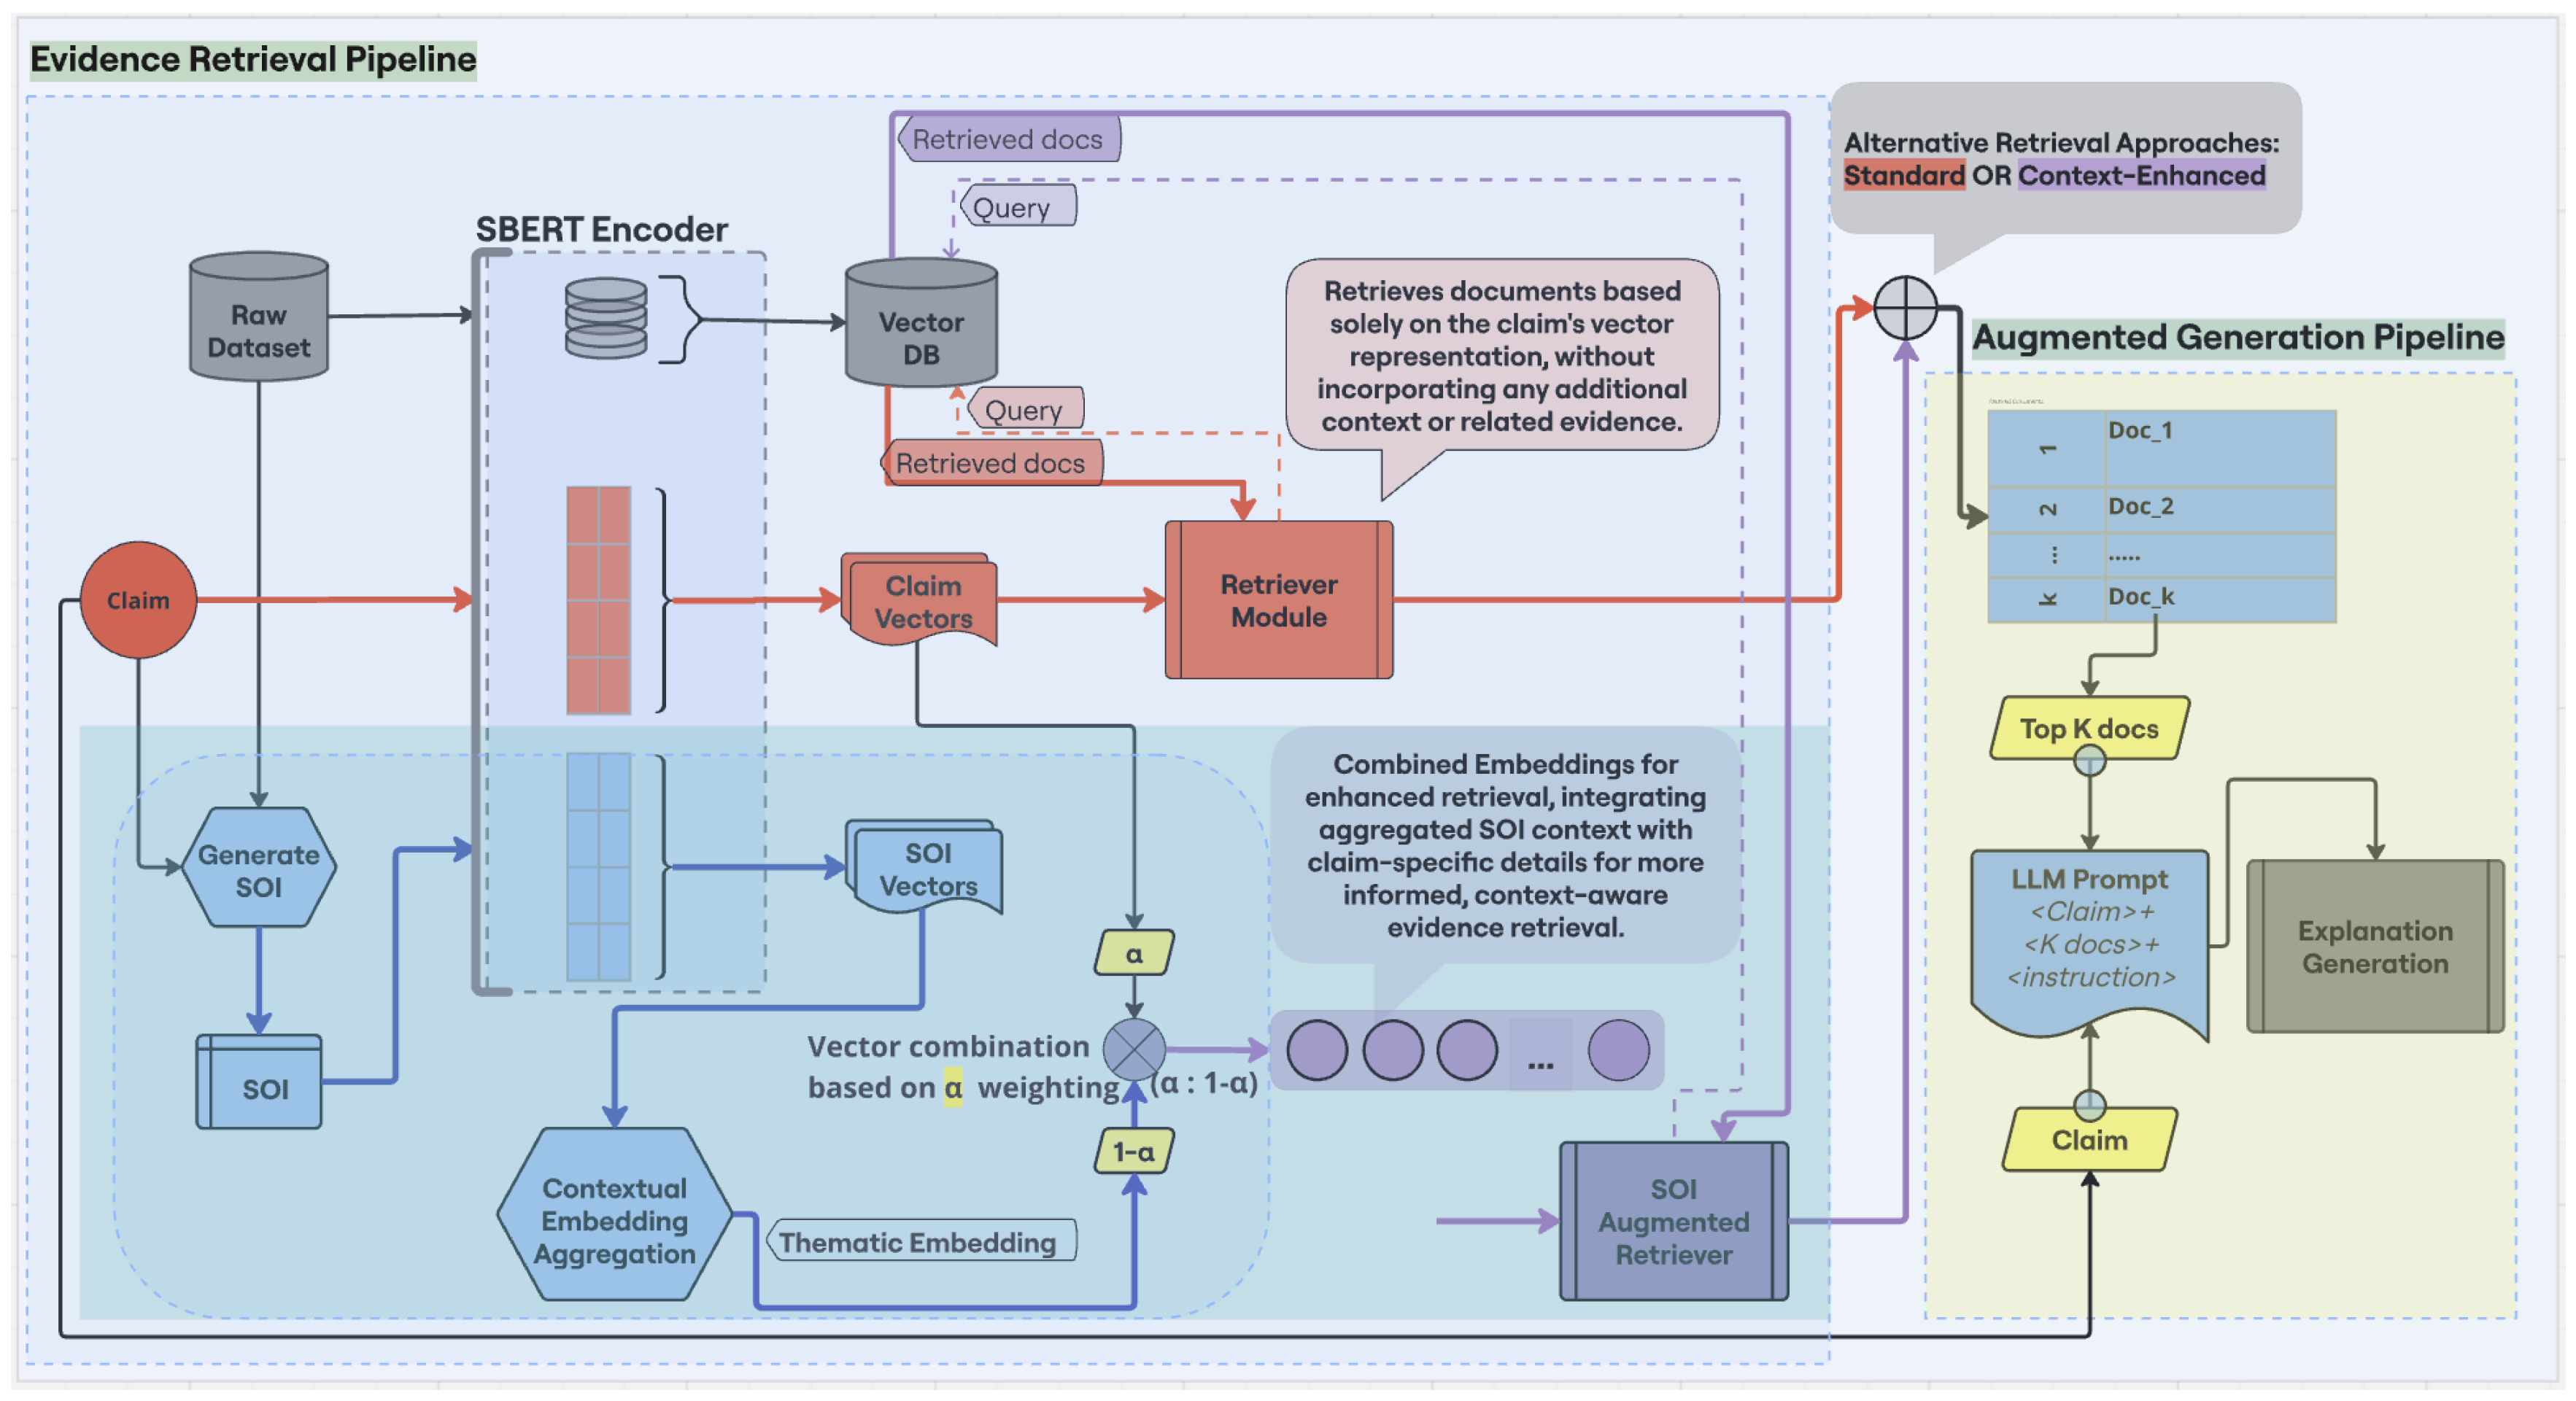
Figure 5 provides a visual comparison between the standard AFV pipeline and the CARAG framework, while also summarizing our methodology. The Standard Retrieval path (red arrows) follows a conventional approach, retrieving evidence solely based on the claim vector, without accounting for any contextual information. In contrast, the CARAG framework (light-blue-shaded area) generates the thematic embedding (blue arrows) as described in Equation (
1), and combines it with the claim vector using a weighted averaging process (Equation (
2)). This weighted approach produces a more refined final combined embedding used for querying (represented by the purple dots in
Figure 5), offering a more nuanced integration compared to simple vector concatenation. The retrieved documents are then passed to the Augmented Generation Pipeline (yellow-shaded area), where an LLM prompt is constructed by combining the claim, the top-k retrieved evidence, and specific instructions. The LLM (e.g., LLaMA) subsequently generates a concise explanation, assessing the claim’s veracity and offering a justification.
5. Experimental Framework & Results
This section describes the key elements employed in our experimental framework and outlines a case study comparison of explanation approaches (
Section 5.1) alongside a comparative analysis of RAG and CARAG methods (
Section 5.2). The experimental framework integrates custom Python modules for data management, clustering, embedding generation, and fact verification, leveraging purpose-built methods and pre-trained models for embedding and explanation generation.
For embedding generation, we selected the Sentence-BERT (SBERT) model [55], which enhances BERT by incorporating siamese and triplet network structures to produce semantically meaningful sentence vectors. Specifically, we employed the open-source all-mpnet-base-v2 variant of SBERT, fine-tuned on over 1 billion textual pairs. This model is relevant in our methodology, where cosine similarity supports context filtering and nuanced textual similarity [56]. Moreover, we chose to use the same SBERT encoder as employed in the SOI methodology [49] to ensure consistency and comparability. Exploring alternative embedding models to assess their impact on the pipeline’s performance remains an avenue for future work.
For evidence retrieval tasks, we integrated the FAISS (Facebook AI Similarity Search) library [57] into our pipeline. FAISS enables rapid similarity searches on large datasets, managing vectorized storage of our corpus to facilitate document retrieval. By indexing the all-mpnet-base-v2 embeddings generated from our dataset, FAISS scales evidence retrieval efficiently. This setup allows both RAG and CARAG to retrieve evidence directly from the indexed vectors, thereby supporting explanation generation and subsequent processes.
For fact verification and explanation generation, we employed the
Llama-2-7b-chat-hf variant of LLaMA from Meta [58], chosen for its balance of efficiency and performance and its compatibility with our computational resources. With 7 billion parameters, Llama-2 Chat is suited to our explainability tasks, offering competitive performance comparable to models like ChatGPT and PaLM [58]. Optimized for dialogue and trained with RLHF, the model supports our informed prompting methodology (
Section 4.3) to generate coherent, user-aligned explanations. Implemented using the
AutoTokenizer and
AutoModelForCausalLM classes from Hugging Face, the process follows a sequence-to-sequence (seq-to-seq) approach, where the input sequence combines the claim text, retrieved evidence, and an instructional prompt. The output sequence includes natural language reasoning, providing a verdict on the claim and a nuanced post-hoc explanation. Operating in zero-shot mode, the model leverages its pre-trained linguistic and contextual capabilities without task-specific fine-tuning. Example of this workflow is detailed in
Section 5.1. To ensure unbiased results, GPU memory is cleared before each generation run. Future work could explore newer versions, such as Llama 3 [45], on advanced hardware to assess potential improvements.
To visualize the thematic clusters and SOI of a claim, as shown in
Figure 6, we used the NetworkX Python package and Plotly’s graph objects. Additionally, for the comparative visual analysis of RAG and CARAG, we rely on scikit-learn and seaborn to apply PCA (Principal Component Analysis), t-SNE (t-distributed Stochastic Neighbor Embedding), and KDE (Kernel Density Estimation). These techniques helped us to simplify high-dimensional embeddings, preserve both local and global patterns, and generate thematic density contours, as detailed in
Section 5.2.
This architecture enables streamlined integration of the AFV pipeline, supporting both RAG and CARAG methods for a comprehensive analysis, as shown in
Figure 5 and empirically discussed in subsequent sections as we evaluate the framework using instances from our fact-verification dataset
FactVer, introduced in
Section 3.
5.1. Case Study Analysis of CARAG
In this section, we present a focused case study analysis to illustrate an end-to-end experimental evaluation of our framework. For this, we selected the claim, “The public is unconcerned about a climate emergency” (Claim 59) from FactVer. This claim serves as a representative example, allowing us to illustrate CARAG’s performance on a complex, real-world issue. Additionally, Claim 59 was chosen due to its nuanced nature; the human-generated (abstractive) explanation for this claim in FactVer is, “There is not enough evidence to suggest that people are concerned or unconcerned with the climate emergency.” This highlights the ambiguity and contextual depth required in handling such claims, making it an ideal test case for evaluating CARAG’s capabilities.
The case study description follows the exact procedural order of our methodology, with the sub sections below corresponding to
Section 4.1,
Section 4.2, and
Section 4.3, respectively, illustrating the practical application of our structured methodology for Claim 59.
5.1.1. Thematic Embedding Generation for Claim 59
To generate a thematic embedding for Claim 59 from
FactVer using CEA (
Section 4.1), we first needed to identify a focused subset of contextually relevant data that would form the basis of our analysis. This involved applying our SOI approach to determine the theme associated with Claim 59 (Climate), then filtering the corpus to retain only instances within this theme, ensuring alignment with the claim’s context. Within the Climate theme, we applied GMM-EM clustering, identifying three unique clusters: Cluster 0, Cluster 1, and Cluster 2. Claim 59 is positioned within Cluster 1, a dense network containing 85 nodes and 3,103 edges, indicating a rich interconnection of semantically related claims and evidence. By refining this cluster with a cosine similarity threshold of
, we narrowed it to 66 nodes and 87 edges, ultimately forming the SOI for Claim 59. This SOI dictionary for Claim 59 now includes all fields presented in
Table 2, forming a comprehensive basis for embedding generation.
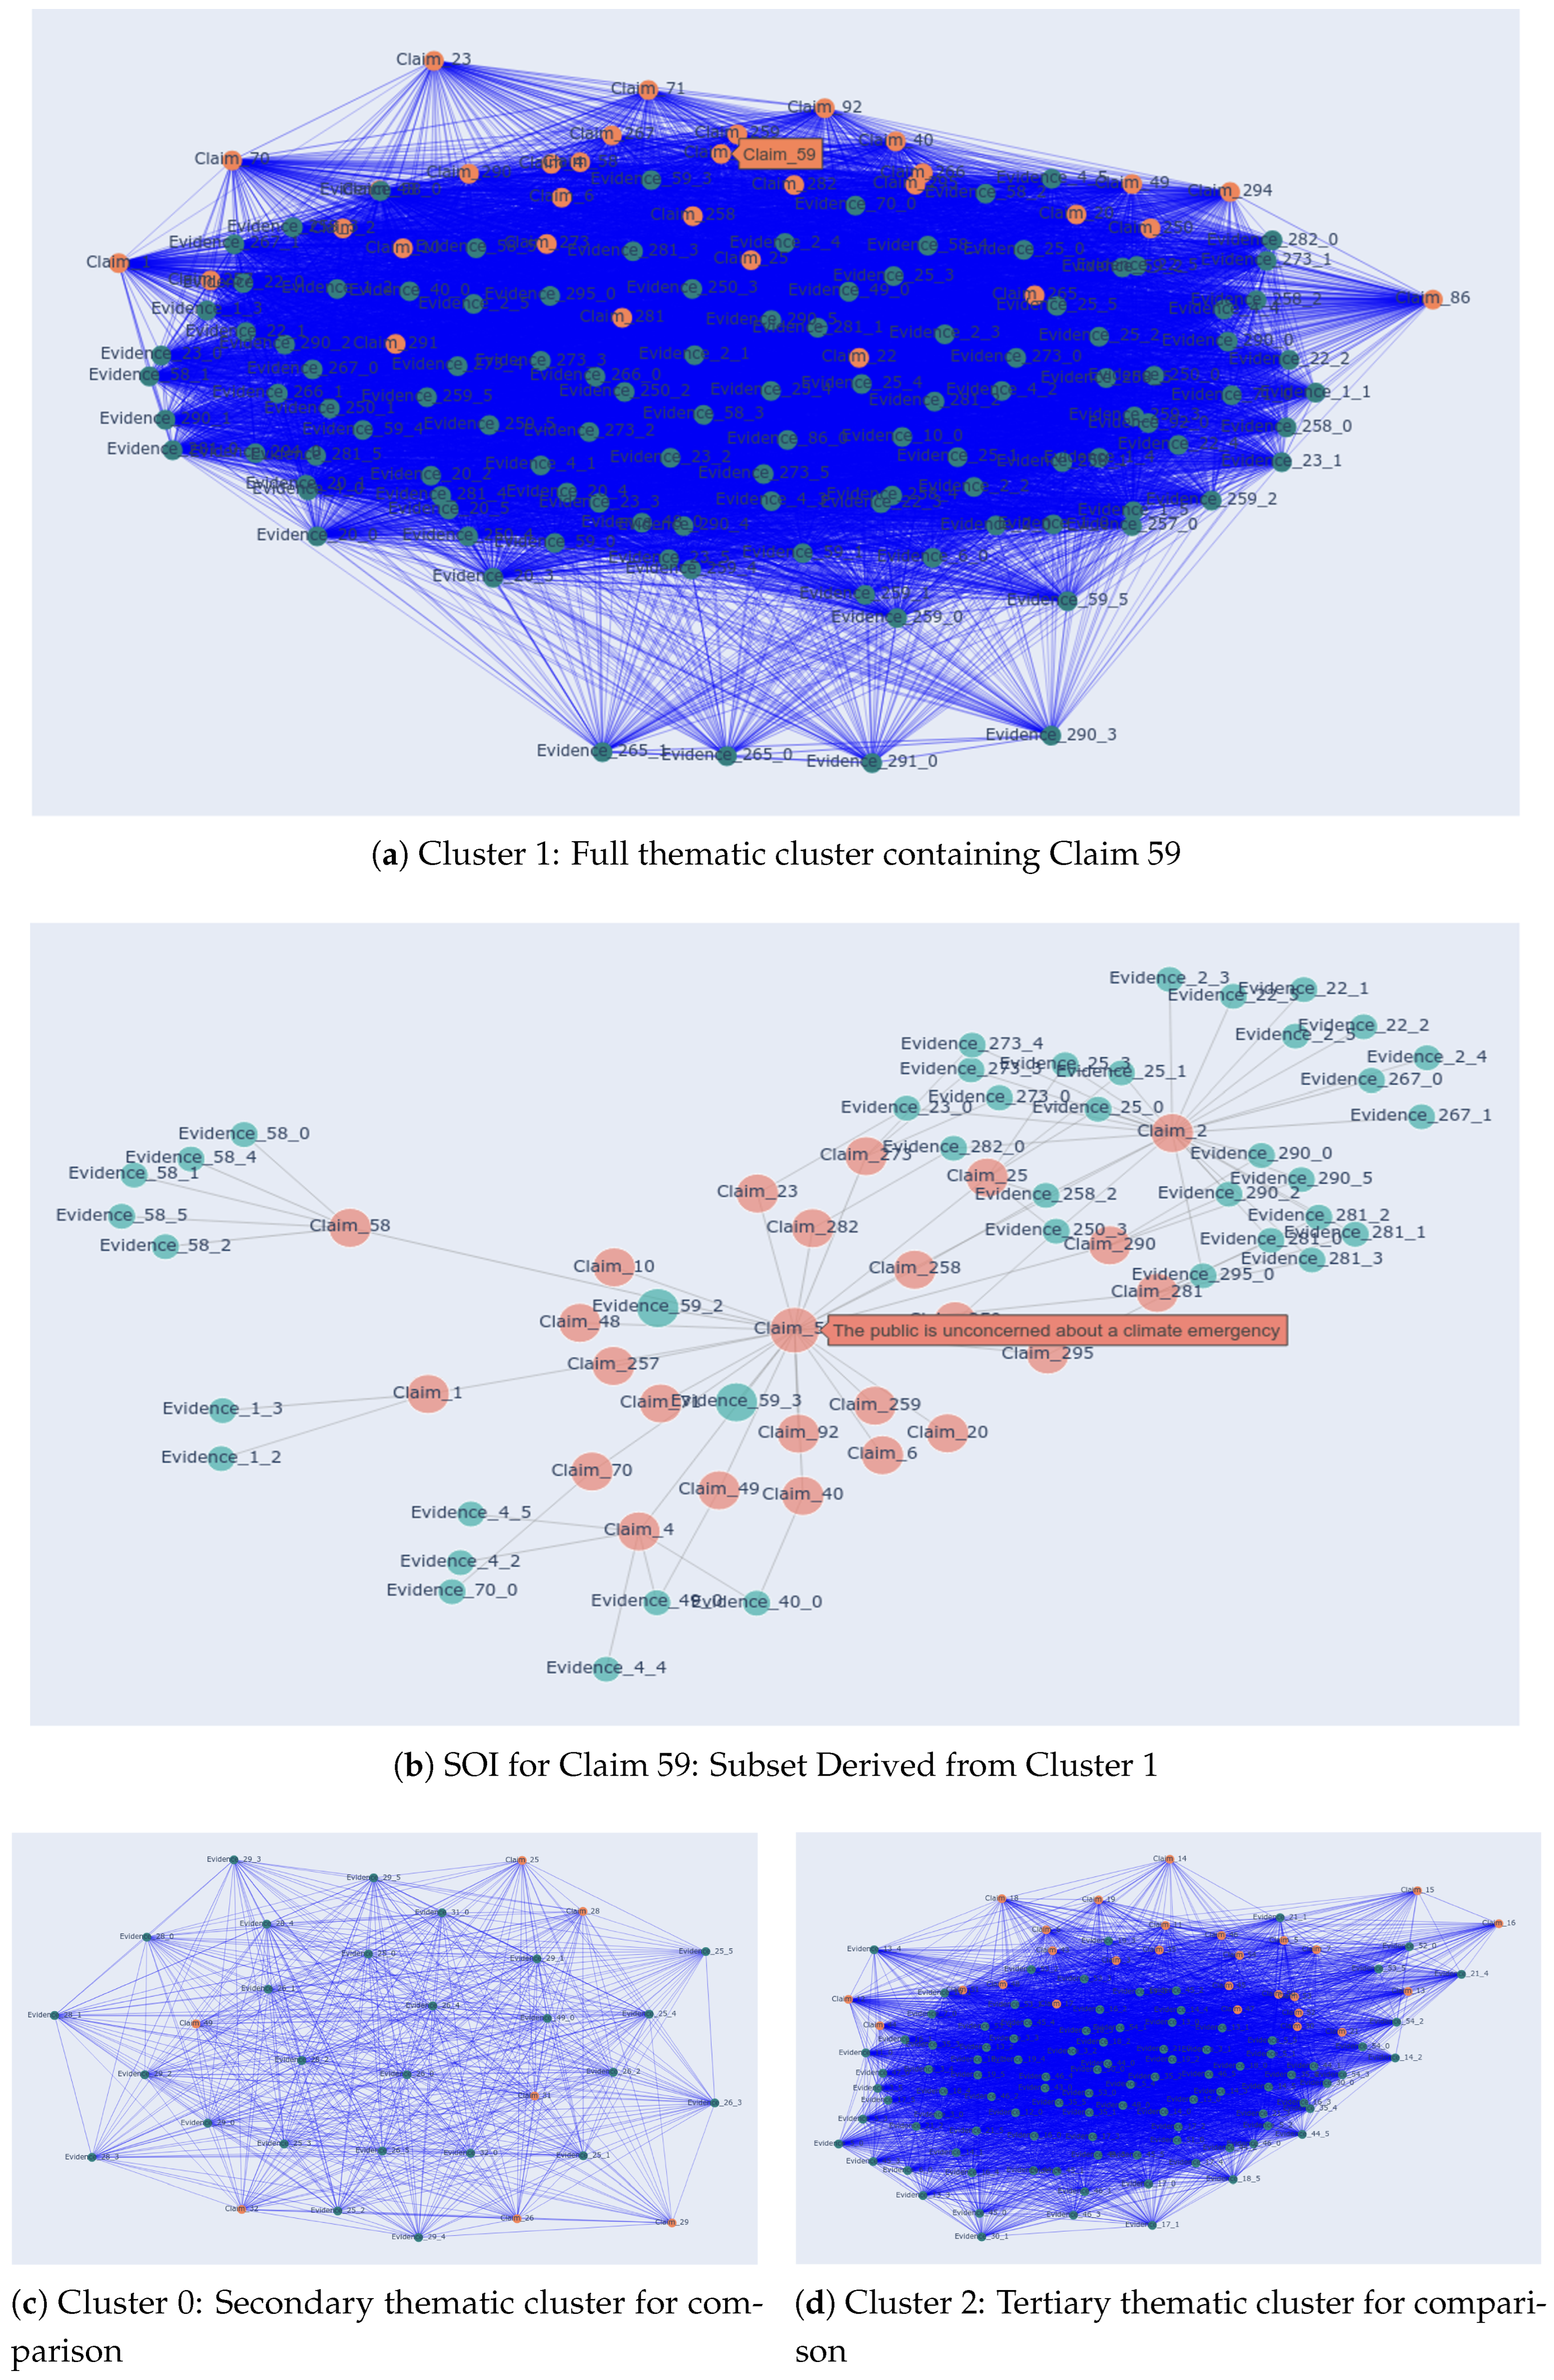
Figure 6 provides a visualization of the thematic clusters for Claim 59. Panels (a), (c), and (d) display the three distinct clusters identified through GMM-EM clustering, Cluster 1, Cluster 0, and Cluster 2 respectively, illustrating thematic separation within the Climate theme. Cluster 1, shown in panel (a), is of particular interest as it contains Claim 59 along with the most thematically relevant connections for our analysis. For this reason, we present Cluster 1 alongside its refined SOI, derived from this cluster, as bigger sub plots (panels a and b), allowing for a direct comparison between the full thematic cluster(Cluster 1) and its distilled subset(SOI). Compared to Cluster 1, Cluster 0 (panel c) is more sparsely connected, whereas Cluster 2 (panel d) is denser. This variation in density underscores the GMM-EM algorithm’s flexibility in clustering, as it naturally groups conceptually related data based on thematic relevance rather than enforcing uniform cluster sizes. This approach ensures that each cluster accurately reflects the underlying thematic nuances within the broader climate context.
In the SOI graph in panel (b), Claim 59 is positioned as the central node, surrounded by interconnected nodes representing the SOI components: larger teal nodes indicate annotated evidence directly related to the claim, smaller red nodes represent thematically related claims, and smaller teal nodes denote associated evidence linked to these related claims. Importantly, each component in the SOI is selectively included if relevant to Claim 59. For instance, while Evidence_59_2 and Evidence_59_3 are included, the remaining annotated evidence (from the total of six pieces for Claim 59 in the dataset) are excluded. Similarly, for the related Claim_1, only Evidence_1_2 and Evidence_1_3 are included, while the rest of its six associated evidence pieces are excluded. This selectivity highlights how this method prioritizes the most pertinent evidence and connections for Claim 59. This visualization underscores the rich thematic interconnections that the SOI provides, enhancing contextual understanding and facilitating more targeted evidence retrieval for the claim under investigation, as discussed in the subsequent text.
Following this preprocessing step of SOI identification, we introduced one of the core contributions of this work: constructing a thematic embedding for Claim 59 from the SOI, which serves as a key component of the query for evidence retrieval in the proposed CARAG framework. Specifically, we selected three key components from the SOI: annotated evidence, related claims, and thematic cluster evidence. Each of these components was then encoded using
all-mpnet-base-v2. The individual embeddings were then aggregated through averaging, as outlined in Equation
1, to create a unified thematic embedding via CEA that encapsulates the wider context of Claim 59 while intentionally excluding the claim itself.
This thematic embedding supports CARAG’s context-aware approach by integrating both local and global perspectives, ensuring the influence of direct and contextual insights from the underlying corpus to inform evidence retrieval. This foundation not only enhances subsequent claim verification and post hoc explanations beyond instance-level local explainability but also advances the capabilities of traditional RAG methods.
5.1.2. Context-Aware Evidence Retrieval for Claim 59
Using the thematic embedding generated for CARAG, we conducted evidence retrieval for Claim 59, incorporating it as part of the retrieval query. To enable a comparative evaluation, we implemented three different retrieval approaches: (1) retrieving only the annotated evidence from
FactVer as the ground truth evidence identified during dataset annotation; (2) applying the baseline RAG approach, which utilizes only the claim vector for evidence retrieval from the FAISS vectorized corpus (setting
in Equation
2, as detailed in
Section 4.2); and (3) using CARAG with a balanced combination of the claim vector and thematic embedding by setting
in Equation
2.
For each approach, we selected the top
evidence items, in alignment with our dataset distribution statistics (
Section 3.2), which indicate that the majority of claims are supported by six pieces of evidence.
Table 3 presents a side-by-side comparison of evidence retrieved by these three approaches for Claim 59.
A key observation from the evidence comparison in
Table 3 is the overlap between certain evidence items retrieved by RAG and CARAG (e.g., references to the car-making industry and Korean EV tax policies). This overlap underscores CARAG’s effectiveness in capturing a broad context similar to RAG while offering enhanced thematic alignment to the claim’s topic. CARAG further strengthens this retrieval by incorporating additional climate-specific evidence directly related to the selected claim, demonstrating its advantage in filtering relevant information from broader contextual data.
5.1.3. Smart Prompting for Explanation Generation for Claim 59
Finally, we independently incorporated the evidence retrieved by each approach, into the LLM prompt to conduct the comparative analysis of explanation generation. This informed prompting (
Section 4.3) supports evidence-based fact verification and explanation(post-hoc) generation, leveraging the previously introduced
Llama-2-7b-chat-hf model.
The LLM prompt for each approach (annotated evidence, RAG, and CARAG) for Claim 59 is formatted as follows:
Prompt:<Claim 59 (claim text)> +
<K docs> +
<specific instruction3>
<K docs> is the only variable here, which corresponds to the retrieved evidence of each approach. Specifically, for the annotated evidence approach,
<K docs> refers to the items in the ‘Annotated Evidence’ column of
Table 3; and for RAG and CARAG,
<K docs> refers to the items in the ‘ RAG Retrieved Evidence’ column and ‘CARAG Retrieved Evidence’ column of
Table 3 respectively.
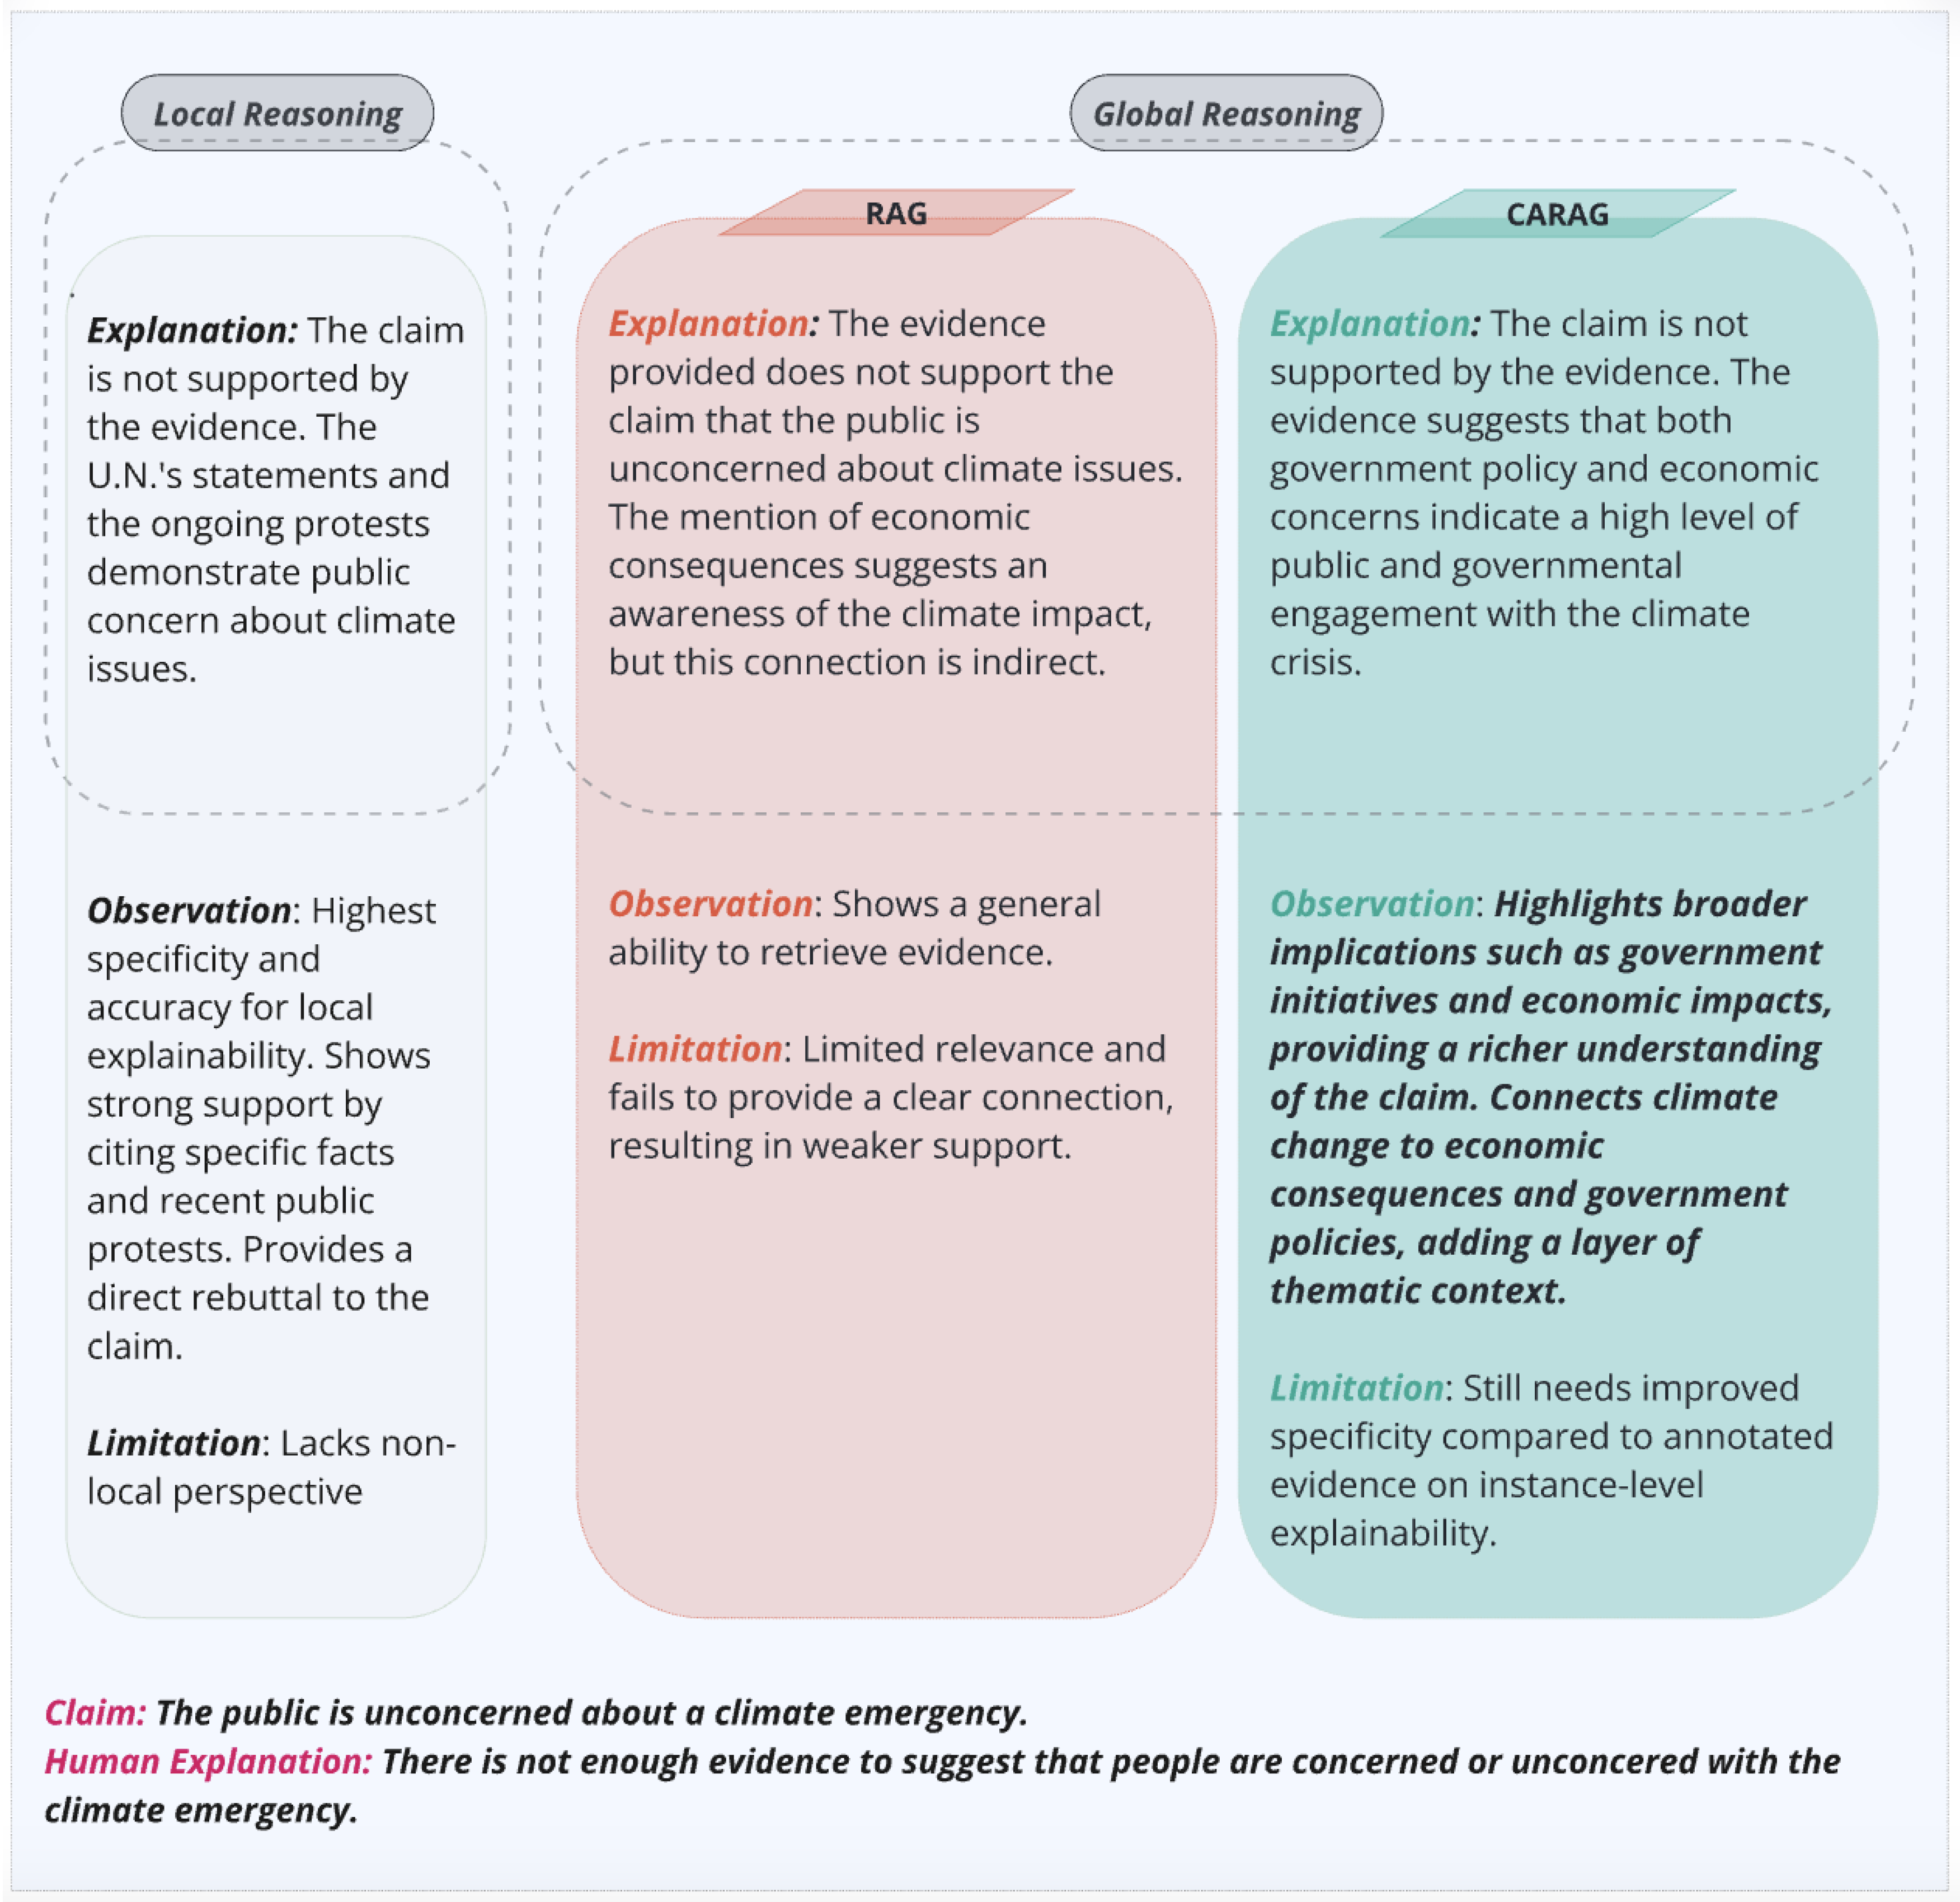
Figure 7 presents the generated explanations for each approach, aligned with the three types of prompts. For comprehensiveness, the figure also includes the claim text and its abstractive explanation, providing full context for the claim under investigation. Observations and limitations for each approach are highlighted, offering a thorough view of their respective strengths and constraints. Notably, all three explanations refute the claim, indicating it is not supported by the evidence.
The qualitative comparison in
Figure 7 further classifies the explanations into local and global reasoning. Explanations based on annotated evidence (left) provide a direct assessment without broader context and are thus categorized as local reasoning. In contrast, the RAG and CARAG explanations, which incorporate a broader set of evidence to provide thematic perspectives beyond the immediate claim, fall under global reasoning. This distinction implies that, despite agreement in claim veracity, each approach offers a unique level of thematic depth. For instance, the RAG-generated explanation addresses broader economic aspects but lacks a direct thematic connection to the climate emergency, resulting in a more surface-level narrative.
By comparison, CARAG integrates climate-specific details with broader economic and governmental insights, offering a more comprehensive reflection of public and policy perspectives on climate issues. CARAG’s approach leverages this global perspective effectively, balancing claim-specific elements with thematic coherence to enhance relevance and interpretability. This layered approach, connecting climate change to economic impacts and policy actions, demonstrates CARAG’s ability to generate trustworthy explanations for nuanced, high-stakes claims by integrating broader, non-local context. This deeper contextual alignment surpasses RAG’s capabilities, producing user-aligned explanations that encompass both thematic and factual nuances.
Through this case study, we underscore the dual benefits of CARAG: its proficiency in selecting contextually relevant evidence that deepens understanding and its capacity to translate this evidence into explanations that resonate with user expectations for interpretability and reliability. This analysis exemplifies how CARAG achieves balanced explainability by combining both local (claim-specific) and global (thematic) insights to provide a comprehensive and trustworthy explanation.
Moreover, CARAG leverages both textual and visual explanations, two widely recognized forms of XAI representation [59]. As illustrated in
Figure 6, Panel (b), visual explanations use graphical elements to clarify decision-making processes, while
Figure 7 highlights CARAG’s textual explanations, which offer natural language reasoning that provides intuitive insights into the model’s rationale. By aligning with these two forms of XAI, CARAG enhances both interpretability and transparency in fact verification, resulting in a comprehensive and insightful explainability mechanism.
In summary, CARAG’s approach demonstrates superiority over RAG by providing a multi-faceted view that resonates with both the thematic and factual elements of the claim. To further substantiate these findings, in-depth comparative evaluation results of global explainability, focusing on RAG and CARAG across multiple claims, are presented in the upcoming section.
5.2. Comparative Analysis of RAG and CARAG Approaches
To evaluate CARAG’s effectiveness in contrast to RAG, we focused on three critical aspects: contextual alignment, thematic relevance, and coverage, as key indicators of both local and global coherence. For this purpose, we conducted a comparative analysis across the three themes (COVID, Climate, and Electric Vehicles) in
FactVer. For each theme, we generated post-hoc explanations for 10 claims using annotated evidence and both the RAG and CARAG approaches with adjustments to
in Equation
2, as demonstrated in the case study. This resulted in a total of 30 explanations per approach, organized in a CSV file for structured analysis, totaling 90 explanations across all themes. Our approach assesses the thematic alignment, coherence, and robustness of CARAG-generated explanations, using metrics such as density contours generated through kernel density estimation (KDE) for each theme and alignment comparison to that of RAG. These metrics are visualized through scatter plots and density contours to reveal the thematic depth and distribution of explanations produced by both RAG and CARAG.
To facilitate an intuitive comparison of thematic clustering, we projected the embeddings of generated explanations into a 2D space using both PCA and t-SNE. The KDE-based density contours provide smooth, continuous representations of the thematic regions for each topic.
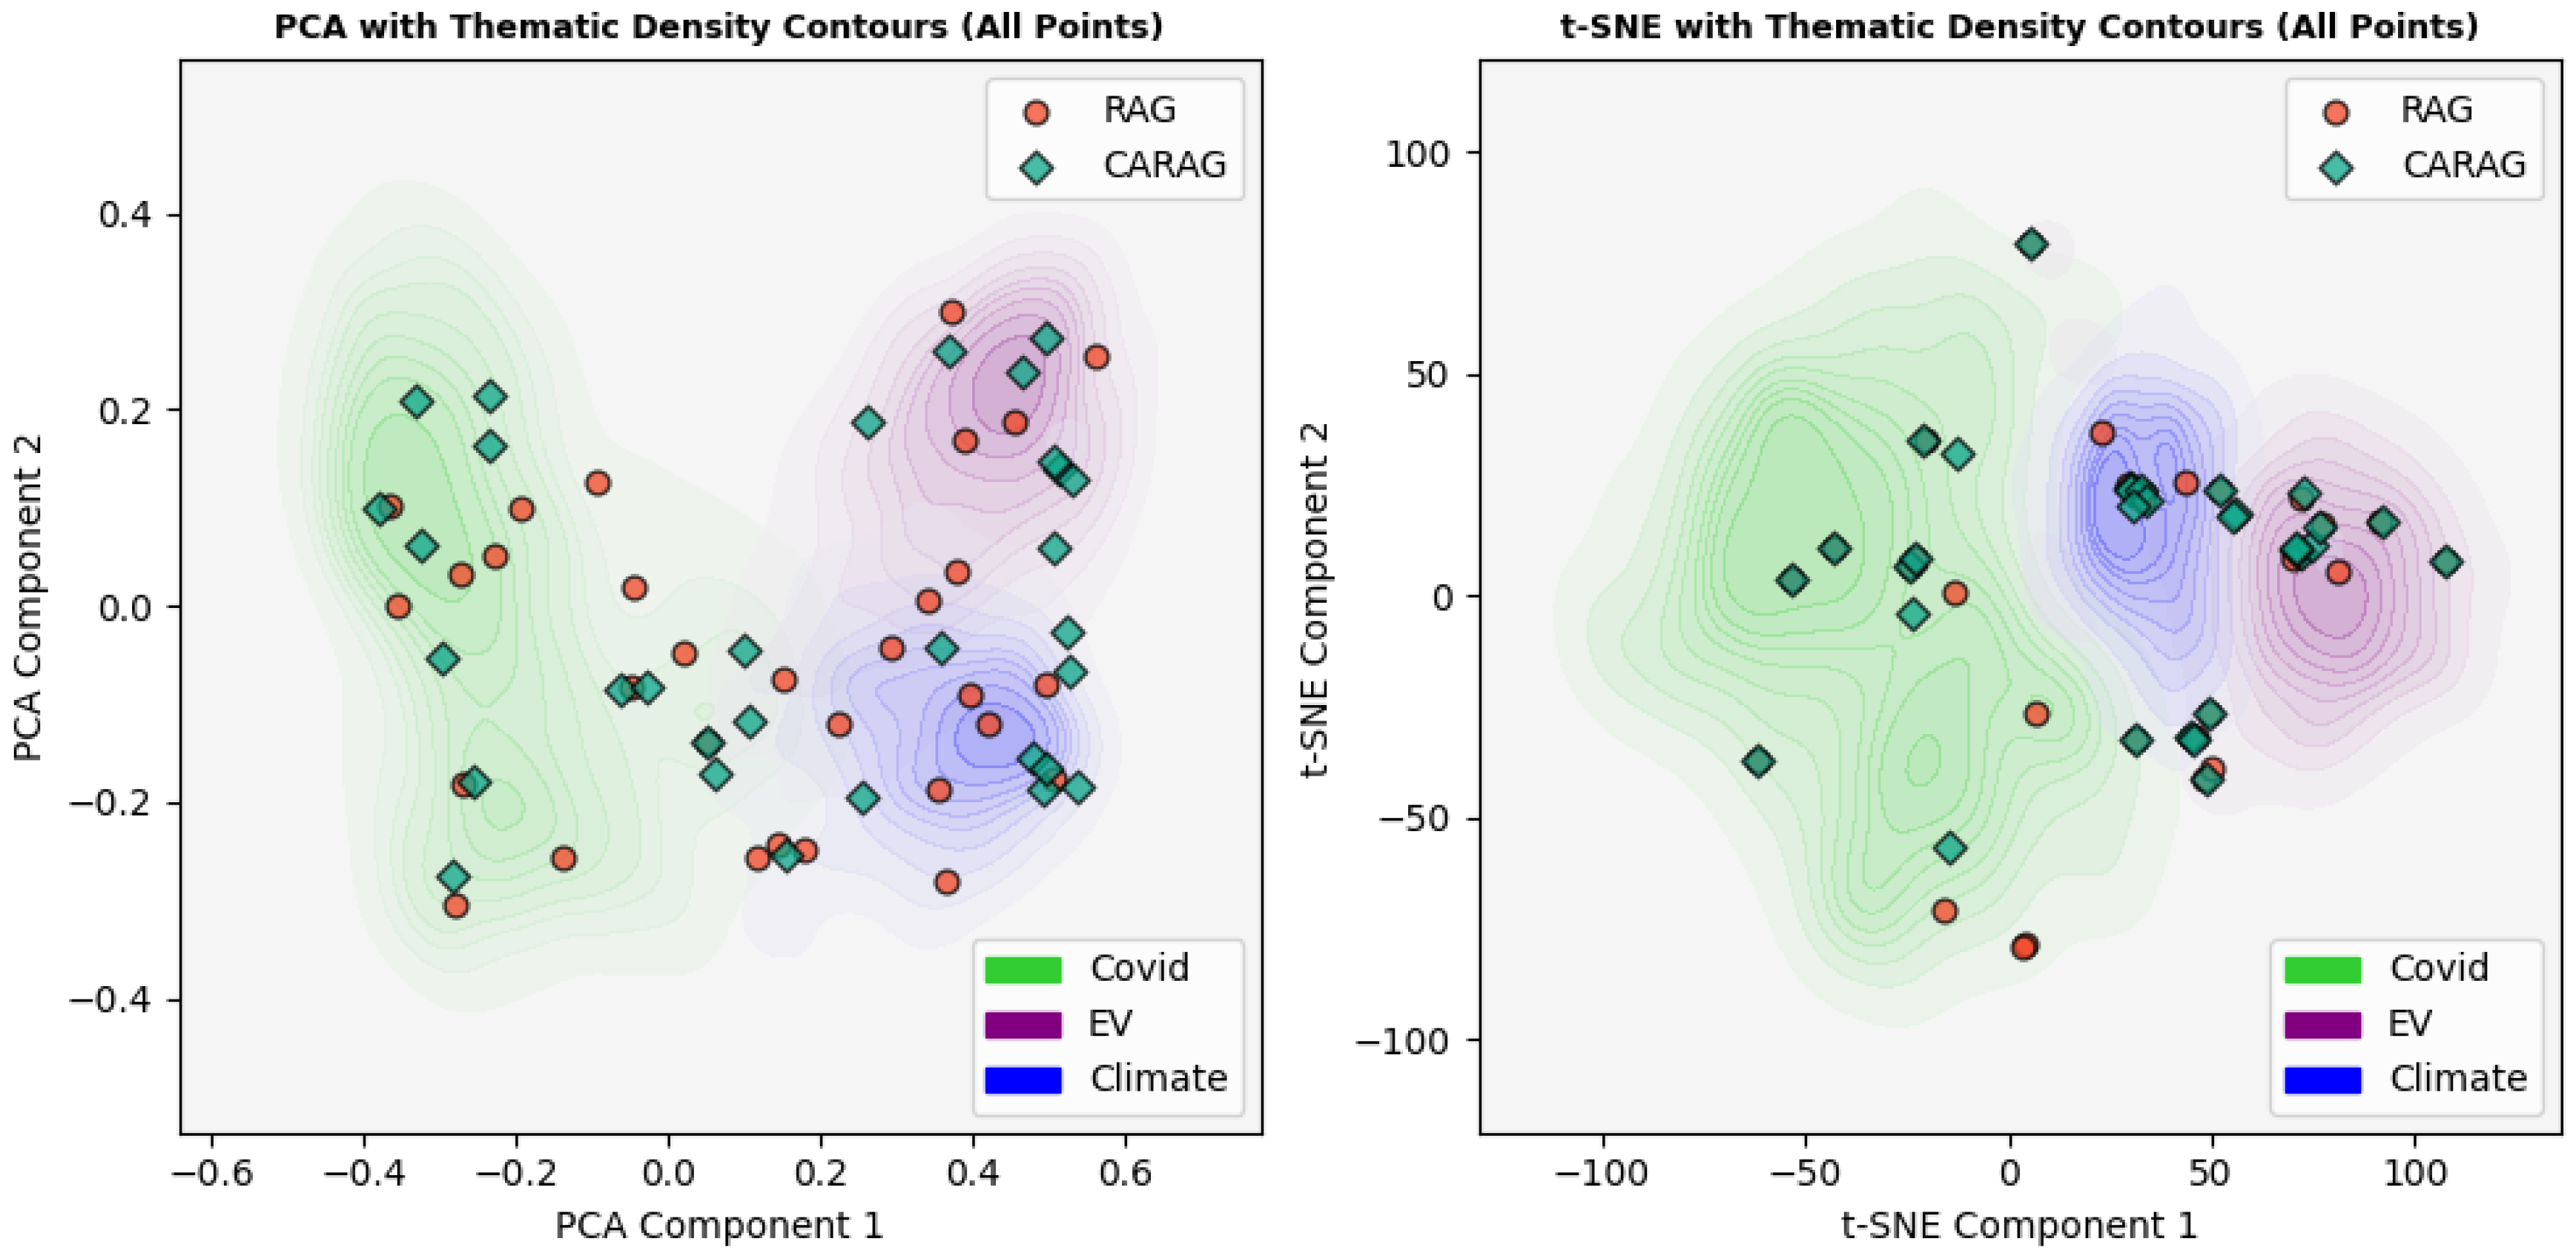
Figure 8 presents an overview of all 30 explanations, with each point representing a RAG (red circles) or CARAG (green diamonds) generated explanation, plotted over density contours that illustrate thematic boundaries. These contours are color-coded by theme: green for COVID, blue for Climate, and purple for Electric Vehicles. This visualization provides a holistic view of how explanations from RAG and CARAG distribute across thematic contexts, with PCA (left) and t-SNE (right) visualizations.
PCA reduces high-dimensional data to 2D while retaining the maximum variance, allowing us to observe broad distribution patterns, clusters, and outliers. This projection shows that RAG captures a generalized, global view, evident in its broader spread, but may lack theme-specific focus. t-SNE, conversely, better highlights local relationships and reveals tighter clusters around thematic boundaries, enhancing the interpretability of context-specific alignment. This view reveals that CARAG’s explanations are more centrally aligned within each thematic area, suggesting a stronger focus on theme-specific context, while RAG explanations appear more peripheral, reflecting a broader, less targeted alignment.
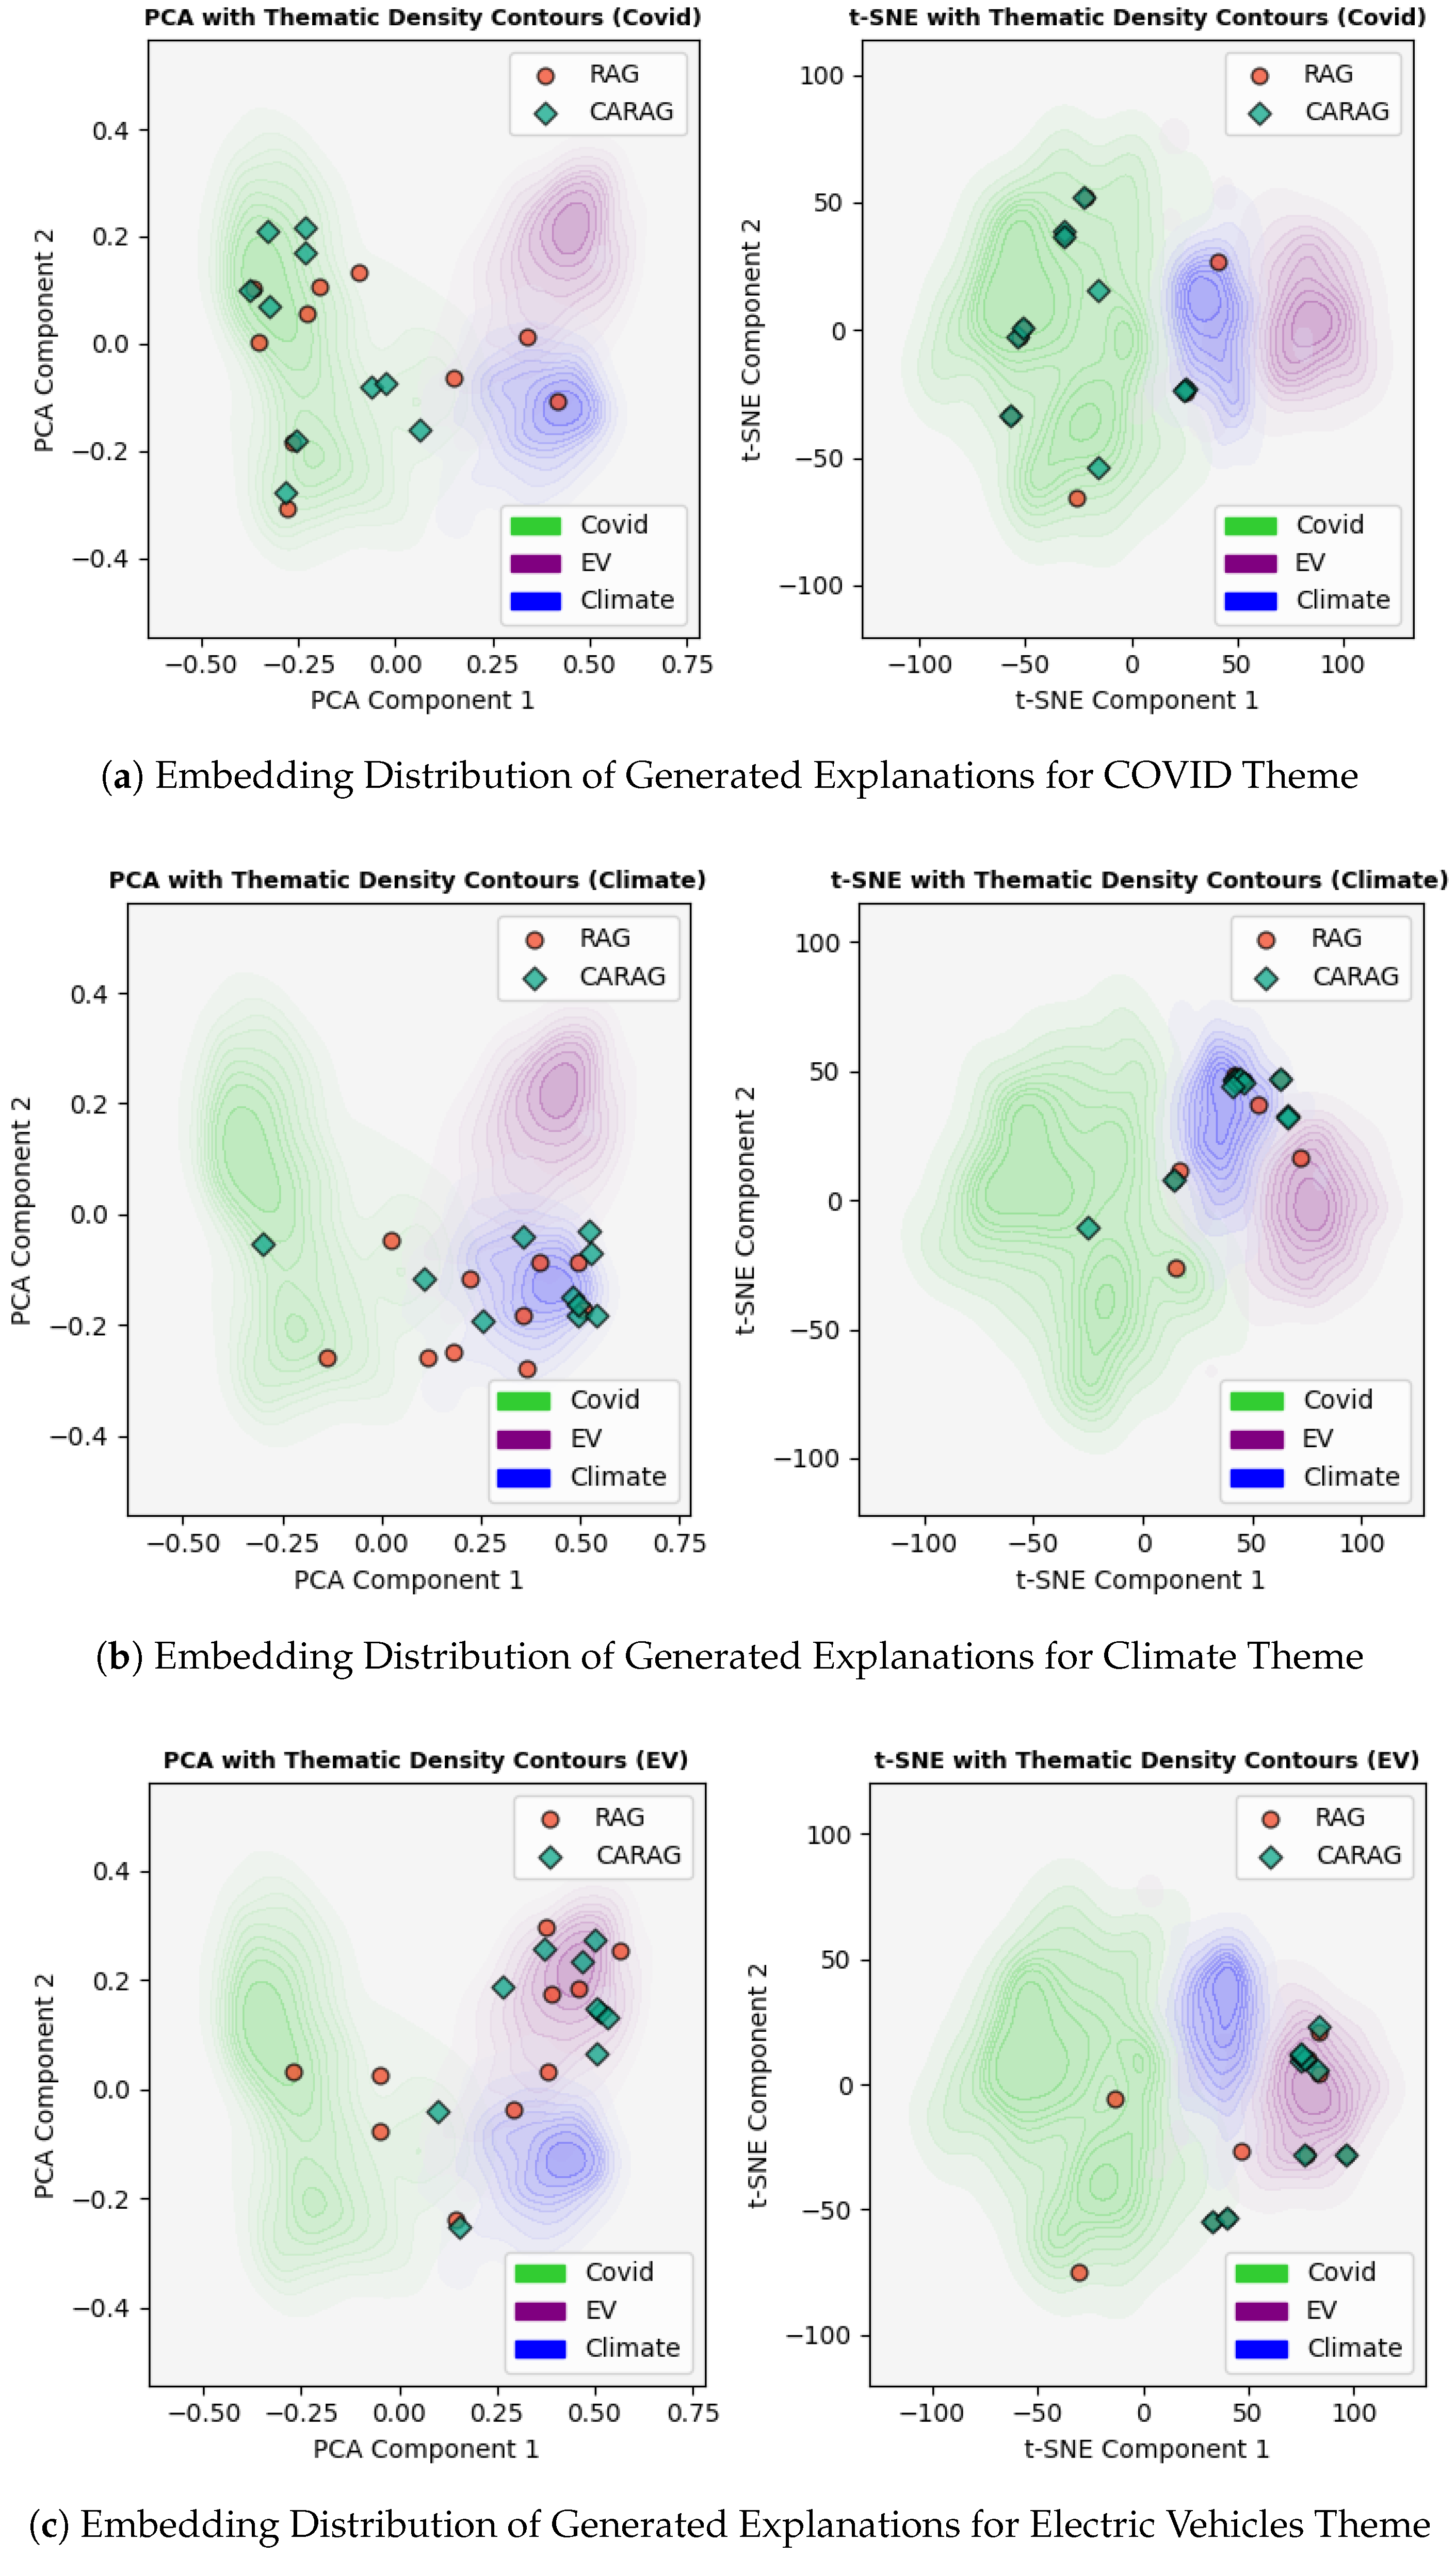
To provide more granular insights into each theme, we present separate plots for each themes in
Figure 9, showing the 10 explanation examples generated for each category, with contours for all themes included in each plot. This approach allows us to more clearly observe CARAG’s ability to generate explanations that align with their corresponding thematic contours in the KDE representation. For example, in the COVID theme plot (Panel (a) in
Figure 9), CARAG explanations cluster tightly within the green contour, indicating strong thematic alignment. Similarly, in the Climate (Panel (b)) and Electric Vehicles (Panel (c)) plots, CARAG explanations are concentrated within the blue and purple contours, respectively, underscoring CARAG’s capacity for contextually relevant retrieval. While some RAG points do align within their respective theme contours, the majority are positioned along the periphery, suggesting a more generalized retrieval approach rather than theme-specific targeting. This difference highlights CARAG’s superior ability to produce explanations with closer thematic alignment, enhancing context-specific relevance.
RAG’s distribution reveals a tendency to capture generalized information across themes, which aligns with its retrieval-augmented nature but may dilute thematic specificity. Conversely, CARAG’s thematic retrieval is more focused, producing explanations that closely align with each theme’s contours. By leveraging KDE-based density contours, CARAG explanations demonstrate tighter clustering within the intended thematic regions, underscoring its potential for theme-specific retrieval. This makes CARAG particularly suitable for tasks where contextual alignment is crucial, such as verifying claims in COVID-related topics, where thematic relevance enhances accuracy. The individual theme plots further illustrate this difference, showing that CARAG explanations are more concentrated within thematic contours, demonstrating enhanced thematic relevance compared to RAG.
The quantitative results in
Table 4 corroborate the visual patterns observed in
Figure 9, providing statistical evidence of CARAG’s superior alignment with thematic regions. These results are based on Euclidean distances between the embeddings of RAG and CARAG explanations and the thematic centroids in PCA and t-SNE spaces. As shown in
Table 4, for each theme, CARAG demonstrates consistently lower average distances to thematic centroids compared to RAG, particularly in t-SNE space, where the differences are more pronounced. Specifically, the differences (Diff(PCA) and Diff(t-SNE)) are calculated as
. Negative values in the difference columns indicate CARAG’s superior alignment (shorter distance to the center compared to RAG), highlighting its tighter clustering within thematic regions, and are color-coded in green. Positive values, color-coded in red, represent the rare instance where RAG outperformed CARAG, such as the Diff (PCA) for Climate. In contrast, likely due to its non-linear dimensionality reduction approach compared to PCA’s linear reduction (an investigation into this aspect is planned for future work), t-SNE consistently highlights CARAG’s tighter alignment. This numerical validation underscores CARAG’s ability to maintain thematic specificity, with smaller distance variations highlighting its tighter clustering within the intended thematic regions. The inclusion of overall averages (calculated as averages of per-theme averages) in
Table 5 provides a holistic view of CARAG’s thematic alignment advantage, further demonstrating its ability to produce explanations that are more closely aligned with thematic contours compared to RAG.
In summary, RAG offers broad-spectrum context suitable for general claims, while CARAG excels in generating thematically aligned, contextually precise explanations. This distinction highlights CARAG’s potential for theme-specific fact verification tasks, making it particularly effective in domains requiring context alignment, as demonstrated by its stronger alignment within each theme.
5.3. Limitations of Standard Analysis & Visualization Techniques in Explainable AI
Evaluating CARAG’s integration of local and global perspectives in post-hoc explanations requires more than standard metrics and visualizations, which often fall short of capturing nuanced thematic and contextual relevance. Metrics like precision, recall, F1, MRR, and MAP measure retrieval performance but do not assess thematic alignment, a critical element in our framework. Similarly, overall accuracy and F1 scores capture binary prediction accuracy without addressing the thematic coherence of explanations. Moreover,standard explainability metrics, such as fidelity, interpretability scores, and sufficiency, typically offer insights at the individual explanation level, lacking the layered depth needed for complex thematic datasets. For instance, when examining the CARAG explanation in
Figure 7, which emphasizes a rich thematic alignment by connecting climate change with economic impacts and government policies, it is clear that traditional metrics would not adequately capture this depth of thematic integration. Additionally, even similarity measures struggle here, as the CARAG-generated explanation provides context that aligns with thematic patterns beyond surface-level similarity, contrasting with the simpler human explanation in
Figure 7, which lacks this layered thematic framing.
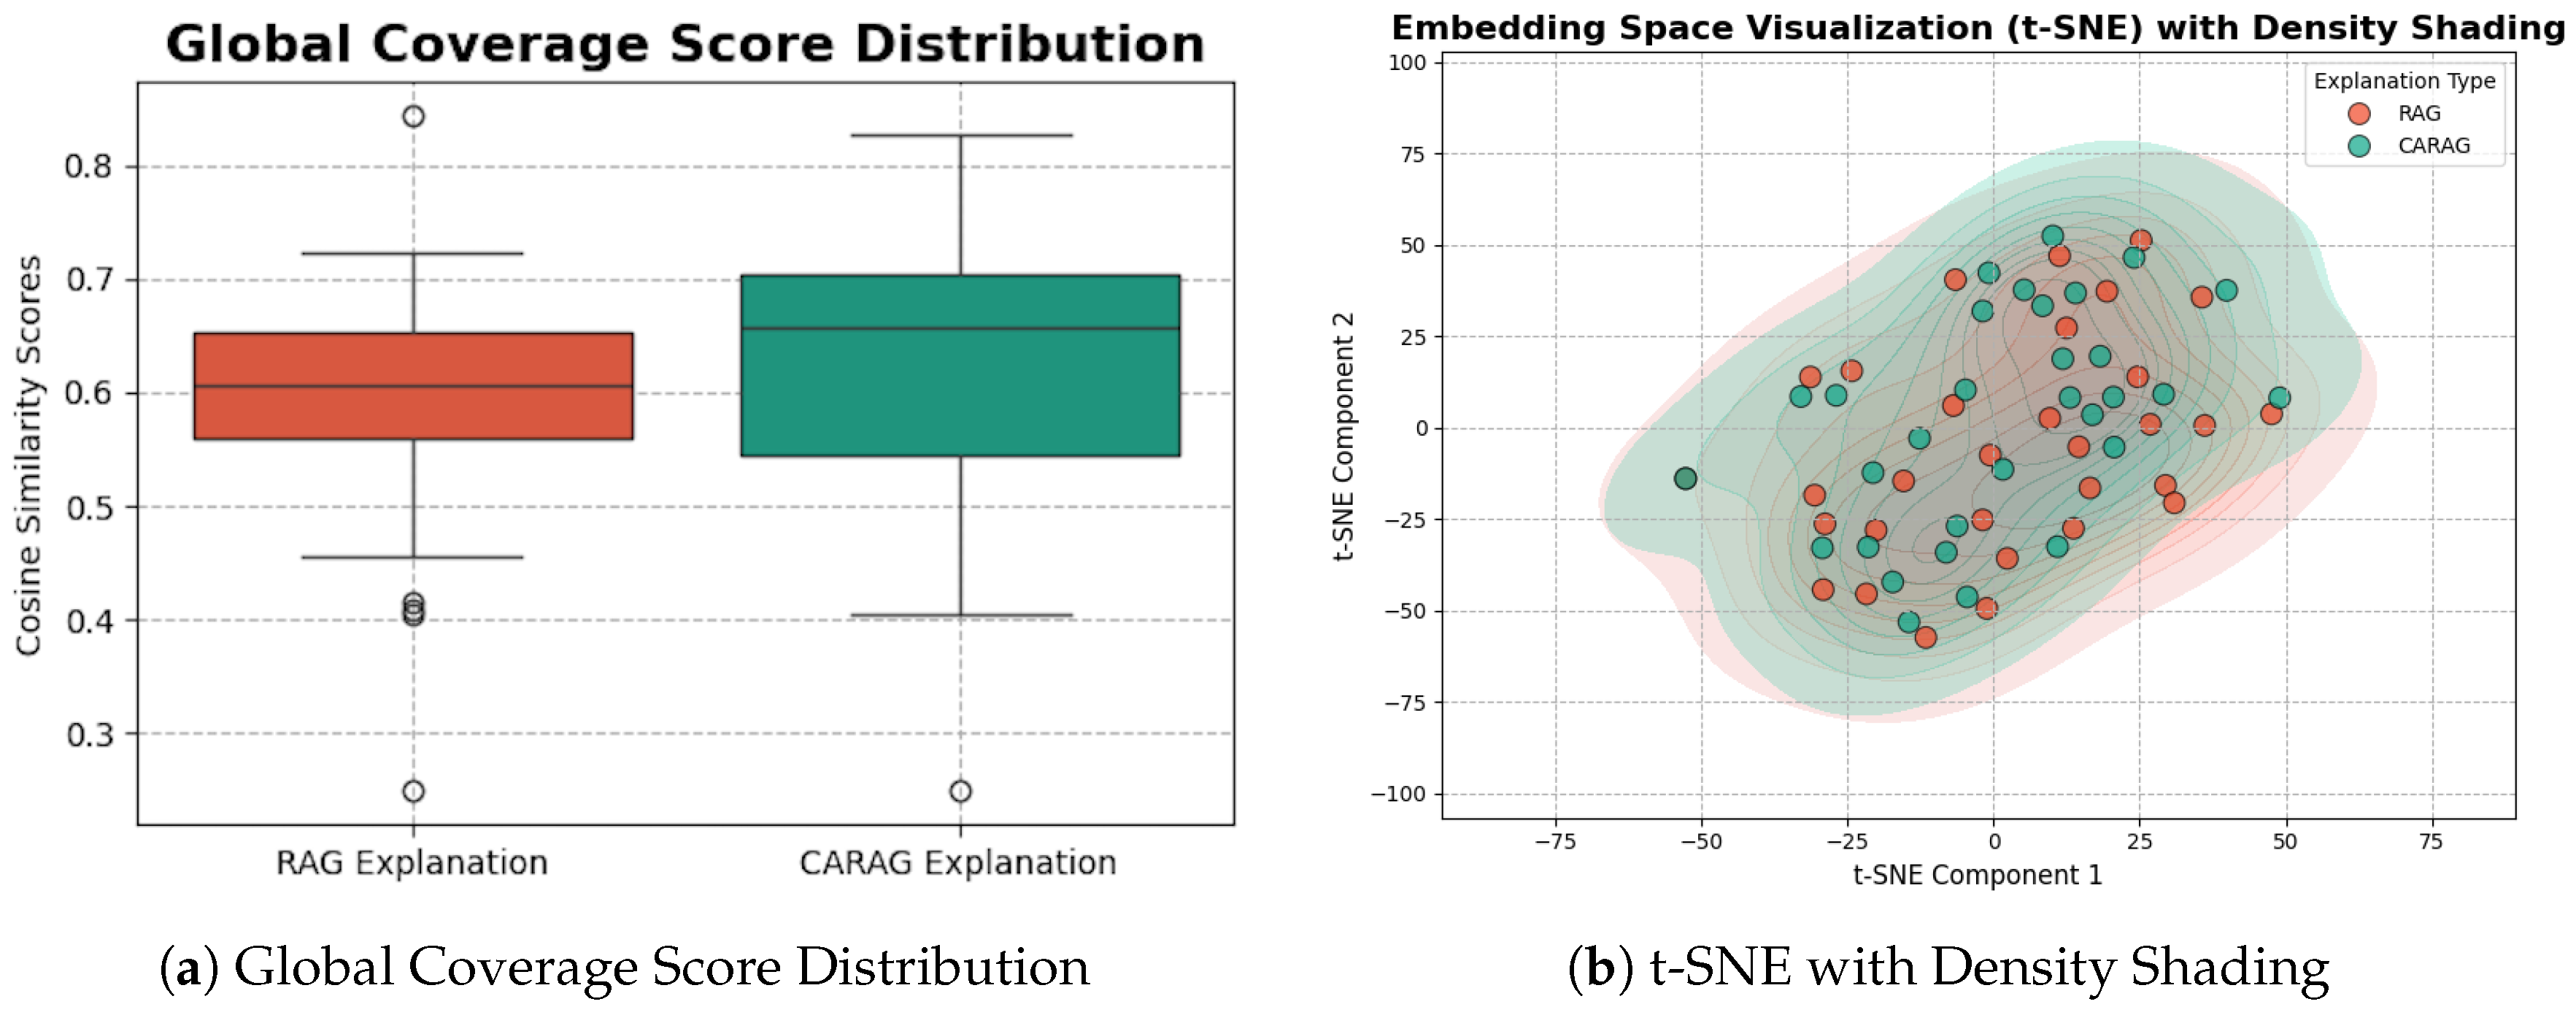
Standard visualization techniques, such as box plots, provide a limited view of CARAG’s thematic alignment by reducing it to a numeric similarity measure. For example,
Figure 10(a) shows a box plot of global coverage scores, where cosine similarity scores between CARAG’s explanations and dataset vectors are calculated to gauge relevance. Although useful for assessing general alignment, this approach treats thematic coherence as a basic numeric metric, failing to capture the contextual depth CARAG aims to provide. Similarly, a t-SNE visualization with Kernel Density Estimation, as shown in
Figure 10(b), highlights clustering within the embedding space without indicating clear thematic boundaries. Unlike our PCA and t-SNE approach in
Section 5.2, which incorporates distinct KDE representations to define thematic contours, this generic t-SNE with KDE does not offer indicators of thematic relevance, making it insufficient for evaluating CARAG’s context-aware framework.
In summary, these standard techniques lack the nuanced depth necessary to evaluate CARAG’s thematic alignment, highlighting the need for a tailored evaluation approach. For complex datasets where thematic contours are crucial, customized visualizations like our PCA and t-SNE contour-based method in
Section 5.2, offer a more suitable, though still approximate, approach for capturing the multi-dimensional thematic relevance and contextual alignment central to CARAG’s explainable AI goals. This underlines the importance of developing specialized evaluation measures for frameworks like CARAG, an area we aim to expand in future research.
6. Challenges and Limitations
In AFV, explainability can be approached from three primary perspectives, architectural, methodological, and data [14]. While CARAG primarily contributes to the methodological (CARAG) and data (FactVer) aspects, these improvements fall short of addressing broader model-level interpretability, as noted in studies like [30], which explore neuron activation patterns and component-specific functionalities. Approaches such as probing, neuron activation analysis, and mechanistic interpretation illuminate individual component functions, aiming to reveal latent structures within language models. CARAG, in contrast, emphasizes contextual alignment and transparency in retrieval logic and explanation generation over internal model insights, distinguishing it from these model-centric interpretability methods.
Thus, while CARAG enhances explainability within the AFV pipeline, expanding to include model-level analysis remains an area for potential growth. Integrating such insights could offer a comprehensive understanding of both retrieval rationale and the latent knowledge embedded within the model itself, aligning CARAG more closely with a holistic view of explainability in AFV.
Another limitation of CARAG at this stage is its reliance on the FactVer dataset for evaluation. While CARAG’s retrieval mechanism and prompting strategy are already data-agnostic, the SOI generation process still depends on thematic labels. To address this, we are working on enhancing the SOI generation and subsequent thematic embedding processes to function independently of pre-defined themes. These updates will enable CARAG to generalize across diverse datasets, with preliminary results to be presented in an upcoming publication.
7. Future Research Directions
Outlined below are the forthcoming steps aimed at further refining CARAG’s retrieval and explainability capabilities:
Label-Independent SOI Refinement: We aim to eliminate reliance on theme labels for SOI refinement, enabling CARAG to generate SOIs without predefined themes.
Comprehensive Ablation Study on Parameter Effects: We plan to perform an in-depth ablation study to assess CARAG’s component contributions by analyzing key parameters in SOI composition and retrieval vector generation. This analysis aims to determine how these parameters influence retrieval quality, thematic relevance, and interpretability.
Agreement-Based Performance Evaluation: Building on our analysis (
Section 5.2), we aim to explore CARAG’s alignment with human-annotated evidence using agreement metrics. Recognizing that standard evaluation methods may fall short in capturing thematic depth, we will experiment with tailored metrics to better assess CARAG’s nuanced thematic alignment, ensuring transparency and reliability.
Extending beyond our immediate plans, CARAG’s broader applications illustrate promising research directions for future exploration by the community. CARAG’s capacity for thematic clustering and contextual visualization enables it to serve high-stakes fields such as investigative, legal, and policy analysis. By revealing non-local patterns of intent, misinformation dissemination, and behavioral inconsistencies across posts, CARAG supports a nuanced approach to fact verification. Furthermore, in longitudinal analyses, CARAG’s macro-level perspective can be instrumental in identifying evolving misinformation trends, empowering agencies and policymakers with insights critical for developing long-term strategies to enhance public awareness and media literacy.
8. Conclusions
CARAG stands out as an explainable AI framework by integrating evidence-based claim verification with post-hoc explanation generation in a transparent and interpretable manner. Unlike traditional fact verification approaches, which focus narrowly on annotated evidence and often yield highly localized insights, or the highly global RAG, which retrieves evidence without explicitly revealing the rationale behind each retrieval choice, CARAG structures its retrieval query by combining the claim vector with the SOI vector. This enables context-aware evidence retrieval grounded in clear, interpretable logic.
CARAG’s transparency is further enhanced by its visual interpretability: the SOI graph provides a map of the components influencing the retrieval process and illustrates a network of thematically interconnected information centered around the claim, offering clear visual insight into the SOI components that enhance retrieval transparency. Notably, the absence of some annotated evidence within this network at times underscores the specificity and intentionality of our approach, distinguishing CARAG from conventional strategies.
Additionally, by handling retrieval and generation as distinct steps rather than as a single-stage process (as in standard RAG), CARAG offers deeper insight into why specific evidence is selected and how it contributes to optimized prompting for the generation pipeline. This modular approach’s flexibility is achieved through two hyperparameters that influence distinct stages: a threshold parameter, , for refining the SOI based on similarity, and an adjustable parameter, , for balancing the influence of the claim vector against thematic embeddings in the final vector combination.
Furthermore, CARAG is supported by FactVer, a novel, explanation-focused dataset specifically curated to enhance thematic alignment and transparency in AFV. FactVer provides both local and global perspectives by pairing claims with multiple annotated evidence entries in various thematic contexts, advancing research in explainability-focused AFV studies and laying a strong foundation for CARAG’s nuanced, context-aware approach.
Together, these elements make CARAG a promising advancement toward a more interpretable and contextually aware framework, bringing distinct layers of explainability to the AFV pipeline (as illustrated in
Figure 5). By enhancing both the methodological and data perspectives of XAI in AFV, CARAG and FactVer collectively reinforce transparency and reliability, addressing gaps left by traditional methods and setting a robust path for more explainable AFV systems.
Author Contributions
Conceptualization, Data Processing, M.V. and P.N.; methodology, M.V.; writing—original draft preparation, M.V.; writing—review and editing, P.N., W.Q.Y., H.A-C. and T.V; visualization, M.V.; supervision, P.N. and W.Q.Y. All authors have read and agreed to the published version of the manuscript.
Funding
This research received no external funding
Institutional Review Board Statement
Not applicable
Informed Consent Statement
Not applicable
Data Availability Statement
The dataset generated and used in this study [Hugging Face link removed for review purposes].
Acknowledgments
The authors greatly appreciate the contributions of the three annotation teams, who worked diligently. Their efforts were pivotal in creating the datasets that form the foundation of this research. In addition, the authors wish to thank the School of Engineering, Computer and Mathematical Sciences (ECMS) at Auckland University of Technology for providing access to GPU resources, which were instrumental in enabling the computational work for this research.
Conflicts of Interest
All authors have read and agreed to the published version of the manuscript. The authors have no conflicts of interest to declare that are relevant to the content of this article
Abbreviations
The following abbreviations are used in this manuscript:
| AI |
Artificial Intelligence |
| XAI |
Explainable Artificial Intelligence |
| AFV |
Automated Fact Verification |
| RAG |
Retrieval-Augmented Generation |
| GMM |
Gaussian Mixture Models |
| EM |
Expectation-Maximization |
| SOI |
Subset of Interest |
Appendix A. Template and Instructions for Annotation
Table A1.
Fields used by annotators for claim and evidence generation
Table A1.
Fields used by annotators for claim and evidence generation
| Field |
Description |
| Claim ID |
An integer ID allocated to each claim. |
| Evidence ID |
A unique ID for each evidence, ranging from E1 to E6, to ensure traceability between claims and their corresponding evidence. |
| Claim |
A span of text specifying the statement of fact or assertion to be verified. |
| Label |
A label indicating the veracity of the claim—True (T), False (F), or Not Enough Info (N). |
| Evidence |
The text span that supports, refutes, or remains neutral about the claim. |
| Article ID |
The identifier from the FactVer_1.1 dataset containing the evidence text span. |
| Reason |
A text description providing the rationale for the assigned label, which could be novel or derived from one of the evidence spans. |
Appendix A.1. Steps for Annotation
Obtain the Template: Obtain the Excel template file containing fields as specified in
Table A1.
Select Topic: Choose the allocated topic and filter the FactVer_1.1 dataset to only show articles on your chosen topic.
Generate Claims: Read an article from the filtered set and generate a claim in the Excel file. Copy and paste sentences that you think support the claim as evidence. Label the claim-evidence pair as either True (T), False (F), or Not Enough Info (N).
Record Article ID: Copy the article ID from the FactVer_1.1 dataset into your spreadsheet in the "Article ID" field.
Gather Additional Evidence: Read other or the same articles for further evidence to either support, refute, or be neutral about your claim.
Create Evidence Rows: Make 6 rows for each claim, each containing a different evidence span. If no additional evidence is found, fill up with neutral text to reach 6 rows per claim. Typically, a claim is expected to have multiple supporting evidence pieces and some neutral evidence. It is also possible for a claim to have some supporting and some refuting evidence.
Appendix A.2. Notes on Claim and Evidence Creation
Evidence-Based Labeling: Claims should be labeled according to the evidence in the dataset, without considering outside knowledge.
Consistent Labeling: Each claim must have a consistent label (T, F, or N) across all 6 rows. While the evidence set may contain text spans that contradict the claim, the label should reflect the overall judgment.
Expected Evidence Distribution: Typically, a claim should have about 3 supporting evidence pieces, with the remainder being a mix of neutral and refuting evidence if available.
Reason Field: Fill ’Reason’ field with text that explains the assigned label. This can be a novel explanation or drawn directly from the evidence.
Appendix A.3. Data Consolidation and Preprocessing Steps
Text Cleaning & Preprocessing: Extraneous characters and irrelevant columns were removed to ensure consistency. Temporary columns, such as the `Old Reason’ column left by different annotation teams, were dynamically updated or removed as needed.
Claim & Evidence ID Generation: Unique Claim_Topic_ID and Evidence_Topic_IDs were generated to maintain traceability between claims and their corresponding evidence, as detailed in
Table 1.
Annotation Tracking & Traceability: After cleaning the individual files from each annotation team, the Annotation_ID column was added to the dataset, with the same ID assigned to all instances curated by the respective team (B_2.0, C_2.1, C_2.2), enabling traceability back to the raw files.
Dataset Consolidation: The cleaned datasets were concatenated into a single DataFrame, and the index was reset to ensure consistency and avoid any indexing issues across the combined dataset.
Consistency in Labeling & Reason Propagation: Claims with the same Claim_Topic_ID were assigned the same propagated human-generated reasons to ensure consistency within each claim group, maintaining coherence across the related evidence pieces.
Validation & Reason Type Assignment: The dataset was validated by grouping entries by Claim_Topic_ID to verify that each claim was correctly linked with its evidence and explanation. The reasons were further categorized into Abstractive and Extractive, as described in
Table 1.
Appendix B. SOI Generation
Algorithm 1 provides the complete process for generating the SOI, covering data filtering, embedding generation, clustering, and the similarity-based selection of relevant evidence and claims.
|
Algorithm 1:SOI Generation with Thematic Clustering and Filtering |
-
Require:
Dataset D, Selected Claim ID , Similarity Threshold , Number of Clusters k
-
Ensure:
SOI (Subset of Interest) for the selected claim - 1:
Data Preparation - 2:
Load dataset D
- 3:
Filter dataset to obtain thematic subset based on the selected theme T
- 4:
for each claim in do
- 5:
Extract associated evidences
- 6:
end for - 7:
Embedding Generation - 8:
for each claim in do
- 9:
Generate embedding
- 10:
end for - 11:
for each evidence for each claim in do
- 12:
Generate embedding
- 13:
end for - 14:
Thematic Clustering - 15:
Aggregate all embeddings
- 16:
Apply Gaussian Mixture Model (GMM) with Expectation-Maximization (EM) to cluster the aggregated embeddings - 17:
- 18:
Obtain cluster labels L for each claim and evidence based on their embeddings - 19:
Cluster Filtering Based on Selected Claim - 20:
Determine the cluster that the selected claim belongs to - 21:
Extract all claims and evidences belonging to the selected cluster
- 22:
SOI Generation - 23:
Initialize empty SOI dictionary:
- 24:
Add claim to SOI - 25:
Add its annotated evidences to SOI - 26:
for each related claim in do
- 27:
if then
- 28:
Add to SOI - 29:
for each evidence associated with do
- 30:
if then
- 31:
Add to SOI - 32:
end if
- 33:
end for
- 34:
end if
- 35:
end for - 36:
Output: Return the comprehensive SOI for the selected claim, including all relevant evidences and related claims exceeding the similarity threshold. |
References
- Aranceta-Bartrina, Javier. 1999a. Title of the cited article. Journal Title 6: 100–10.
- Aranceta-Bartrina, Javier. 1999b. Title of the chapter. In Book Title, 2nd ed. Edited by Editor 1 and Editor 2. Publication place: Publisher, vol. 3, pp. 54–96.
- Baranwal, Ajay K., and Costea Munteanu. 1955. Book Title. Publication place: Publisher, pp. 154–96. First published 1921 (op-tional).
- Berry, Evan, and Amy M. Smith. 1999. Title of Thesis. Level of Thesis, Degree-Granting University, City, Country. Identifi-cation information (if available).
- Cojocaru, Ludmila, Dragos Constatin Sanda, and Eun Kyeong Yun. 1999. Title of Unpublished Work. Journal Title, phrase indicating stage of publication.
- Driver, John P., Steffen Rohrs, and Sean Meighoo. 2000. Title of Presentation. In Title of the Collected Work (if available). Paper presented at Name of the Conference, Location of Conference, Date of Conference.
- Harwood, John. 2008. Title of the cited article. Available online: URL (accessed on Day Month Year).
| 1 |
|
| 2 |
|
| 3 |
For example: You are a fact verification assistant. From the given Claim and its Evidence, determine if the claim is supported by the evidence and generate a concise explanation (two sentences max). |
Figure 1.
Distribution of the Number of Evidences Associated with each Claim Across All Themes. The figure illustrates that most claims are supported by six pieces of evidence(represented by the tallest bar), with smaller subsets having either one or twelve pieces of evidence, highlighting the variability in evidence distribution across the dataset.
Figure 2.
Distribution of Claim, Evidence, and Reason Text Length
Figure 2.
Distribution of Claim, Evidence, and Reason Text Length
Figure 3.
Overview of the methodology components
Figure 3.
Overview of the methodology components
Figure 4.
The figure illustrates the curation of the unified thematic embedding (
T_e) process from the fact verification dataset (
D). The Claim’s cluster (
C_k), identified from the thematic subset (
D_t), is refined using cosine similarity and a similarity threshold (
) to form the Subset of Interest (
SOI) for the claim. This SOI is then processed through Contextual Embedding Aggregation (CEA) using Equation
1 to generate the final thematic embedding.
Figure 5.
Overview of the CARAG Framework vs. Standard RAG. The Standard Retrieval path (red arrows) retrieves evidence solely based on the claim vector, without incorporating contextual information. In contrast, the CARAG pipeline (light blue-shaded area) introduces context-aware evidence retrieval, which includes the generation of SOI, followed by thematic embedding aggregation and its weighted combination with claim embeddings for evidence retrieval. Retrieved documents are then passed to the Augmented Generation Pipeline (yellow-shaded area), where an LLM generates explanations based on the claim, retrieved evidence, and an instructional prompt.
Figure 6.
Visualization of SOI and thematic clusters within the Climate theme. Panels (a), (c), and (d) depict the identified clusters (Clusters 1, 0, and 2, respectively). In Panel (a), Cluster 1 highlights Claim 59 for clarity, while Panel (b) shows the refined SOI for Claim 59 derived from Cluster 1.
Figure 7.
Comparison of generated explanations across retrieval approaches for Claim 59, showcasing the methodology’s application.
Figure 7.
Comparison of generated explanations across retrieval approaches for Claim 59, showcasing the methodology’s application.
Figure 8.
PCA (left) and t-SNE (right) visualizations of embedding distributions for RAG-generated explanations (red circles) and CARAG-generated explanations (green diamonds), shown with KDE-based thematic density contours in the background (green for COVID, blue for Climate, and purple for Electric Vehicles). These contours illustrate thematic boundaries, enabling a comparative evaluation.
Figure 9.
PCA (left) and t-SNE (right) visualizations of embedding distributions for RAG-generated explanations (red circles) and CARAG-generated explanations (green diamonds) for claims related to COVID, Climate, and Electric Vehicles, shown in Panels (a), (b), and (c), respectively. Each panel includes KDE-based thematic density contours in the background (green for COVID, blue for Climate, and purple for Electric Vehicles), highlighting each approach’s alignment with underlying thematic regions.
Figure 10.
Standard visualization techniques: (a) Global coverage score distribution using cosine similarity, which does not provide insights into thematic relevance, and (b) t-SNE with KDE shading, lacking explicit thematic boundaries for RAG (red) and CARAG (green) explanations.
Figure 10.
Standard visualization techniques: (a) Global coverage score distribution using cosine similarity, which does not provide insights into thematic relevance, and (b) t-SNE with KDE shading, lacking explicit thematic boundaries for RAG (red) and CARAG (green) explanations.
Table 1.
Key Components of FactVer
Table 1.
Key Components of FactVer
| Header |
Description |
| Claim_Topic_ID |
A unique identifier representing the claim, which also encodes information about the thematic topic it belongs to. For example, in the identifier Claims_Climate_B2.0_1, the middle segment (`Climate’) denotes the theme, while B2.0 refers to the annotation team responsible for curating the claim, facilitating efficient data processing. |
| Claim_Text |
The textual content of the claim, which needs to be verified for its truthfulness. |
| Evidence_Topic_ID |
A unique identifier for the evidence corresponding to each claim. The Evidence ID is constructed by consolidating the claim ID with the prefix `Evidence’ and appending a unique serial number. For example, in Evidence_Claims_Climate_B2.0_1_n, the ‘n’ uniquely distinguishes each piece of evidence associated with the claim. This structure efficiently organizes the multiple pieces of evidence for a given claim. |
| Evidence_Text |
The actual textual evidence supporting or refuting the claim. |
| Label |
The label indicating the veracity of the claim (T/F/N representing True/False/Not Enough Info respectively). |
| Reason |
An explanation that provides justification for the label assigned to the claim. |
| Reason_Type |
Classifies the nature of the explanation as either Abstractive for human-generated explanations that are crafted based on the evidence but not directly copied, or Extractive, copied directly from the supporting evidence. If no explanation is provided, it is marked as Nil. |
| Annotation_ID |
An identifier assigned to each entry, reflecting the annotation team responsible for curating the data. There are three types of IDs, B_2.0, C_2.1, C_2.2, corresponding to the three annotation teams involved, allowing for traceability back to the raw files from each team during data processing and analysis. |
| Article_Topic_ID |
A reference to the specific source or article from which the evidence is derived. This ensures the data can be linked back to the original source used by the teams during the annotation process. |
Table 2.
Key components of the SOI dictionary.
Table 2.
Key components of the SOI dictionary.
| Key |
Description |
| claim_id |
The unique identifier of the selected claim. |
| claim |
The text of the selected claim. |
| annotated_evidences |
The evidence pieces directly associated with the claim, including both the text and unique evidence IDs. |
| related_claims |
Other claims within the thematic cluster that are semantically related to the selected claim. |
| thematic_cluster_evidences |
Evidence from other claims within the thematic cluster that are thematically relevant to the selected claim, including both text and unique evidence IDs. |
| similarities |
The similarity scores between the selected claim and the associated evidence/related claims, calculated using cosine similarity. |
Table 3.
Comparison of Annotated Evidence, Retrieved Evidence through RAG and CARAG, for Claim 59.
Table 3.
Comparison of Annotated Evidence, Retrieved Evidence through RAG and CARAG, for Claim 59.
| Annotated Evidence |
RAG Retrieved Evidence |
CARAG Retrieved Evidence |
| 1. Government pledge to act on the climate emergency. |
|
|
| 2. U.N. notes 1.5 degrees Celsius as a crucial limit |
|
|
| 3. Todd’s opposition to increasing traffic during a climate emergency |
|
|
| 4. Declaration of a climate emergency in 2020. |
|
|
| 5. Groundswell NZ’s protest against He Waka Eke Noa. |
|
|
| 6. Chinese protests demanding action on climate change. |
|
|
| |
1. Failure will result in the country’s once-successful car-making industry being scrapped. |
|
| 2. Two-week journey which would have meant missing Wales’ first match. |
|
|
| 3. Shares fell as low as $6.50-apiece on Monday, down 97 percent from August 2021. |
|
|
| 4. BMW-branded cars, motorcycles, and Mini models sold since October 1 get the new warranty. |
|
|
| 5. Korean officials discussing several possible options to correct what they believe to be unfair policies that eliminated up to $7,500 of tax credits for EVs produced outside North America. |
|
|
| 6. White House statement about Biden’s health condition. |
1. Failure will result in the country’s once-successful car-making industry being scrapped. |
|
| 2. Greenhouse gas trading scheme forms part of the UK government’s ambition to achieve net-zero emissions by 2050. |
|
|
| 3. Short-notice public investigatory attention affecting businesses. |
|
|
| 4. Korean officials discussing options to correct unfair EV tax policies. |
|
|
| 5. Two-week journey potentially missing Wales’ first match. |
|
|
| 6. Reliance on imports from China, US, and Europe for the car industry. |
|
|
Table 4.
Quantitative comparison of RAG and CARAG embedding distributions across themes. Each sub-table shows distances to centroids in PCA and t-SNE spaces, with differences highlighted in the Diff (PCA) and Diff (t-SNE) columns. Per-theme averages are included as the last row in each sub-table.
Table 4.
Quantitative comparison of RAG and CARAG embedding distributions across themes. Each sub-table shows distances to centroids in PCA and t-SNE spaces, with differences highlighted in the Diff (PCA) and Diff (t-SNE) columns. Per-theme averages are included as the last row in each sub-table.
| Index |
RAG (PCA) |
CARAG (PCA) |
Diff (PCA) |
RAG (t-SNE) |
CARAG (t-SNE) |
Diff (t-SNE) |
| 0 |
0.1133 |
0.2263 |
0.1130 |
31.5851 |
31.5608 |
-0.0242 |
| 1 |
0.1423 |
0.2506 |
0.1083 |
31.4120 |
31.4665 |
0.0544 |
| 2 |
0.3000 |
0.2720 |
-0.0280 |
31.4419 |
31.4444 |
0.0025 |
| 3 |
0.1913 |
0.1995 |
0.0083 |
31.4158 |
31.4030 |
-0.0128 |
| 4 |
0.0645 |
0.1354 |
0.0709 |
31.5440 |
31.4492 |
-0.0948 |
| 5 |
0.1779 |
0.1736 |
-0.0043 |
31.4712 |
31.4843 |
0.0132 |
| 6 |
0.1809 |
0.1767 |
-0.0042 |
31.6878 |
31.5558 |
-0.1320 |
| 7 |
0.6405 |
0.1687 |
-0.4717 |
32.1598 |
31.6895 |
-0.4704 |
| 8 |
0.3688 |
0.1994 |
-0.1693 |
31.9011 |
31.7242 |
-0.1769 |
| 9 |
0.5524 |
0.3178 |
-0.2346 |
32.0992 |
31.8005 |
-0.2987 |
| Average |
0.2732 |
0.2120 |
-0.0612 |
31.6718 |
31.5578 |
-0.1140 |
| |
|
|
|
|
|
|
| Index |
RAG (PCA) |
CARAG (PCA) |
Diff (PCA) |
RAG (t-SNE) |
CARAG (t-SNE) |
Diff (t-SNE) |
| 0 |
0.0590 |
0.6626 |
0.6035 |
37.3316 |
37.8603 |
0.5287 |
| 1 |
0.2180 |
0.1234 |
-0.0946 |
37.5164 |
37.2024 |
-0.3139 |
| 2 |
0.0531 |
0.1442 |
0.0911 |
37.2505 |
37.2061 |
-0.0443 |
| 3 |
0.1518 |
0.2534 |
0.1016 |
37.3610 |
37.5232 |
0.1623 |
| 4 |
0.1551 |
0.1397 |
-0.0154 |
37.1891 |
37.1950 |
0.0060 |
| 5 |
0.1368 |
0.0855 |
-0.0512 |
37.4192 |
37.2654 |
-0.1538 |
| 6 |
0.2749 |
0.1878 |
-0.0871 |
37.5750 |
37.1636 |
-0.4115 |
| 7 |
0.3473 |
0.1930 |
-0.1543 |
37.5689 |
37.1082 |
-0.4607 |
| 8 |
0.1461 |
0.1789 |
0.0328 |
37.1552 |
37.1223 |
-0.0329 |
| 9 |
0.5143 |
0.1252 |
-0.3891 |
37.8044 |
37.4247 |
-0.3797 |
| Average |
0.2056 |
0.2094 |
0.0037 |
37.4171 |
37.3071 |
-0.1100 |
| |
|
|
|
|
|
|
| Index |
RAG (PCA) |
CARAG (PCA) |
Diff (PCA) |
RAG (t-SNE) |
CARAG (t-SNE) |
Diff (t-SNE) |
| 0 |
0.1989 |
0.1155 |
-0.0834 |
76.1226 |
76.1748 |
0.0522 |
| 1 |
0.6796 |
0.1405 |
-0.5391 |
76.9621 |
76.4237 |
-0.5385 |
| 2 |
0.4984 |
0.1093 |
-0.3891 |
76.7383 |
76.1809 |
-0.5574 |
| 3 |
0.1112 |
0.1338 |
0.0226 |
76.3114 |
76.1575 |
-0.1540 |
| 4 |
0.4627 |
0.4668 |
0.0041 |
76.5504 |
76.5409 |
-0.0095 |
| 5 |
0.0260 |
0.1643 |
0.1382 |
76.2979 |
76.1871 |
-0.1108 |
| 6 |
0.1565 |
0.1188 |
-0.0377 |
76.3120 |
76.3179 |
0.0059 |
| 7 |
0.2151 |
0.1403 |
-0.0748 |
76.3986 |
76.1808 |
-0.2178 |
| 8 |
0.4607 |
0.3522 |
-0.1085 |
76.7354 |
76.5901 |
-0.1453 |
| 9 |
0.0718 |
0.1159 |
0.0441 |
76.2318 |
76.2199 |
-0.0119 |
| Average |
0.2881 |
0.1858 |
-0.1023 |
76.4661 |
76.2973 |
-0.1687 |
Table 5.
Overall averages of RAG and CARAG embedding distributions (last row), computed as averages of per-theme averages in PCA and t-SNE spaces, with color-coded highlights for performance.
Table 5.
Overall averages of RAG and CARAG embedding distributions (last row), computed as averages of per-theme averages in PCA and t-SNE spaces, with color-coded highlights for performance.
| Theme |
RAG (PCA)Avg |
CARAG (PCA) Avg |
Diff (PCA) Avg |
RAG (t-SNE) Avg |
CARAG (t-SNE) Avg |
Diff (t-SNE) Avg |
| Covid |
0.2732 |
0.2120 |
-0.0612 |
31.6718 |
31.5578 |
-0.1140 |
| Climate |
0.2056 |
0.2094 |
0.0037 |
37.4171 |
37.3071 |
-0.1100 |
| Electric Vehicles |
0.2881 |
0.1858 |
-0.1023 |
76.4661 |
76.2973 |
-0.1687 |
| Overall Average |
0.2556 |
0.2024 |
-0.0532 |
48.5183 |
48.3874 |
-0.1309 |
|
Disclaimer/Publisher’s Note: The statements, opinions and data contained in all publications are solely those of the individual author(s) and contributor(s) and not of MDPI and/or the editor(s). MDPI and/or the editor(s) disclaim responsibility for any injury to people or property resulting from any ideas, methods, instructions or products referred to in the content. |
© 2025 by the authors. Licensee MDPI, Basel, Switzerland. This article is an open access article distributed under the terms and conditions of the Creative Commons Attribution (CC BY) license (http://creativecommons.org/licenses/by/4.0/).