Submitted:
07 January 2025
Posted:
07 January 2025
You are already at the latest version
Abstract
Infection with Porphyromonas gingivalis (Pg), which is a major periodontal pathogen, causes a large number of systemic diseases based on chronic inflammation such as diabetes, rheumatoid
arthritis and Alzheimer’s disease. However, it remains unclear how Pg can augment local systemic immune and inflammatory responses, because Pg and its virulence factor lipopolysaccharide (LPS) have low biological activities. There is a strong association between depression and elevated levels of
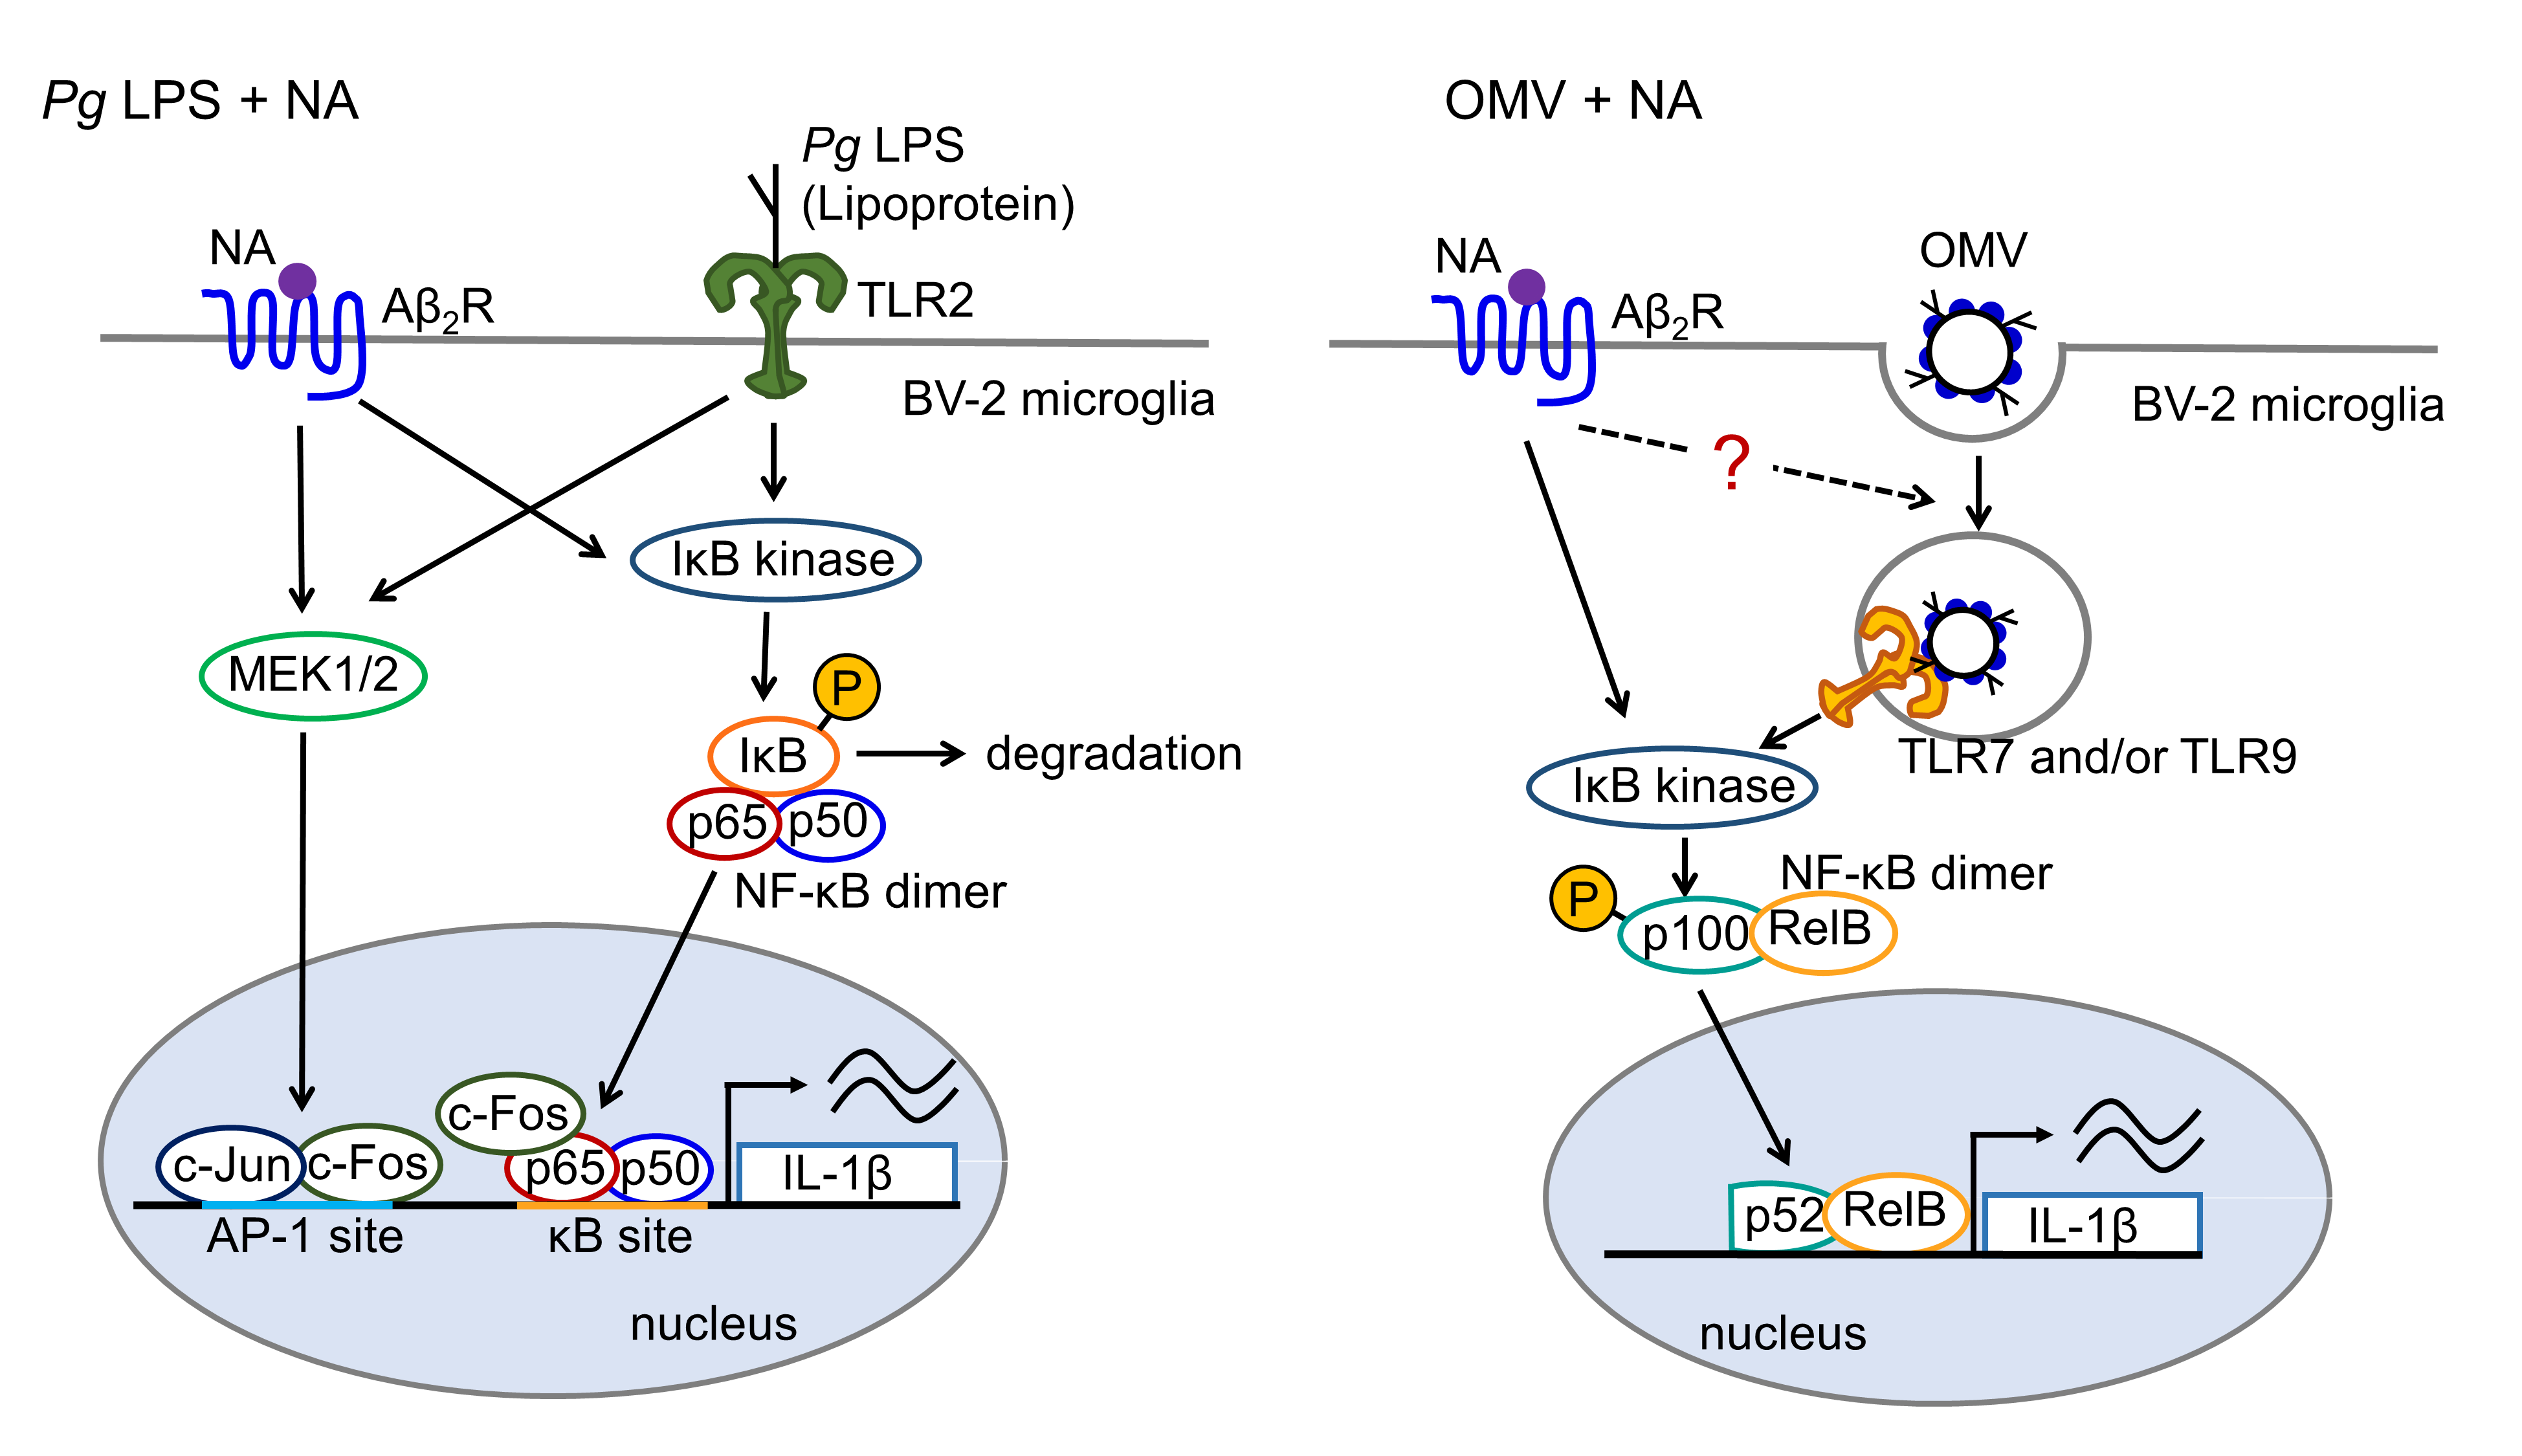
inflammation. Noradrenaline (NA) is a key neurotransmitter that modulates microglial activation during stress conditions. In this study, we have thus investigated the regulatory mechanisms of NA on the production of interleukin-1β (IL-1β) by microglia following stimulation with Pg virulence factors, LPS and outer membrane vesicles (OMVs). NA significantly enhanced the mRNA level, promoter activity, and protein level of IL-1β up to 20-fold in BV-2 microglia following treatment with Pg LPS and OMVs in a dose-dependent manner. Pharmacological studies have suggested that NA synergistically augments the responses induced by Pg LPS and OMVs through different mechanisms. AP-1 is activated by the β2 adrenergic receptor (Aβ2R)-mediated pathway. NF-κB, which is activated by the Pg LPS/Toll-like receptor 2-mediated pathway, is required for the synergistic effect of NA on the Pg LPS-induced IL-1β production by BV-2 microglia. Co-immunoprecipitation combined with western blotting and the structural models generated by AlphaFold2 suggested that cross-coupling of NF-κB p65 and AP-1 c-Fos transcription factors enhances the binding of NF-κB p65 to the IκB site, resulting in the synergistic augmentation of the IL-1 promoter activity. In contrast, OMVs phagocytosed by BV-2 microglia and then activated the TLR9/p52/RelB-mediated pathway. The Aβ2R/Epac-mediated pathway, which promotes phagosome maturation, may be responsible for the synergistic effect of NA on the OMV-induced production of IL-1β in BV-2 microglia.
Keywords:
activator protein 1
; BV2 microglia
; interleukin-1β
; lipopolysaccharide
; noradrenaline
; 22 nuclear factor-κB
; outer membrane vesicles
; Prophyromonas gingivalis
; synergistic augmentation
1. Introduction
Accumulating epidemiological evidence indicates that infection with Porphyromonas gingivalis (Pg), which is a major periodontal pathogen, cause a large number of systemic diseases, including atherosclerosis, hypertension, adverse pregnancy outcomes, inflammatory bowel disease, diabetes mellitus, non-alcoholic fatty liver disease, rheumatoid arthritis and Alzheimer’s disease (AD) [1]. Recently, it has been reported that approximately 40% of patients diagnosed with AD lack AD pathology including the cerebrospinal fluid levels of amyloid-β42 and phosphorylated tau [2]. Therefore, microglia-mediated neuroinflammation is considered a key driver of dementia associated with a variety of diseases including AD. Moreover, Pg can influence the development development of these periodontitis-related systemic disorders by affecting the adaptive immune response and inducing inflammation and innate immune responses [1]. In contrast, Pg is a relatively poor inducer of proinflammatory cytokines [3,4]. Pg lipopolysaccharide (LPS) stimulated an inflammatory response when injected into connective tissue but was minimally stimulatory when a systemic response was measured [5,6]. Furthermore, Pg LPS is a weaker Toll-like receptor (TLR) 2/4 agonist and NF-κB/STAT signaling activator in BV-2 microglia than in E. coli LPS [7]. The presence of fewer acyl chains and phosphate groups in Pg LPS-lipid A than E. coli-lipid A may be responsible for the weaker activating properties of Pg LPS. These low biological activities may allow Pg to evade innate host defense mechanisms without endotoxin tolerance, leading to chronic inflammation. However, the mechanisms by which Pg LPS can augment local systemic immune and inflammatory responses remains unclear.
There is a strong association between depression and elevated levels of inflammation. It has been reported that social stress enhances Pg LPS-induced inflammatory responses by CD11b-positive cells [8]. Chronic stress can significantly enhance the pathological progression of periodontitis through an adrenergic signaling-mediated inflammatory response [9]. Moreover, stress-induced microglial activation, anxiety-like behaviors and IL-1β production were inhibited by a pharmacological blockade of adrenergic receptors [10,11,12]. We previously reported that noradrenaline (NA) induces the production of IL-1β through the activation of β2 adrenergic receptors (Aβ2R)/exchange proteins directly activated by cAMP (Epac), which activates AP-1-mediated transcription [13]. Moreover, both NF-κB and AP-1 play important roles as transcription factors in the expression of IL-1β, which is a critical step in inflammation through the induction of other proinflammatory cytokines and chemokines [14,15].
Therefore, we hypothesized that NA may enhance neuroinflammation following systemic stimulation with Pg virulence factors, because enhanced NA release is a central response to stress. In the present study, we investigated the possible functional interaction between NA and Pg virulence factors in the production of IL-1β by BV-2 microglia. 61
2. Results
2.1. Synergistic Expression of IL-1β mRNA in BV-2 Microglia by NA and Pg Virulence Factors, Pg LPS and OMVs
We first examined the effects of NA on the Pg LPS-induced expression of IL-1β by quantitative reverse transcription polymerase chain reaction (qPCR). Pg LPS (10 μg/mL) and OMVs (150 μg of protein/mL) induced the expression of IL-1β mRNA as previously reported [16,17] (Figure 1B, C). BV-2 microglia were treated with a combination of NA and Pg virulence factors. The treatment of BV-2 microglia with a combination of NA (30-1000 nM) and Pg LPS resulted in a significant enhancement of the IL-1β mRNA expression by up to 9.0-fold relative to treatment with NA alone or Pg LPS alone in a concentration-dependent manner (Figure 1A, 1B). A combination of both NA and OMVs also led to an increase in the IL-1β mRNA expression of up to almost 12.6-fold relative to treatment with NA alone or OMVs alone in a concentration-dependent (Figure 1A, C). These observations suggest that NA exhibits a synergistic effect on the Pg virulence factor-induced IL-1β expression of mRNA expression in BV-2 microglia.
2.2. Synergistic Production of IL-1β in BV-2 Microglia Following Treatment with NA and Pg Virulence Factors, Pg LPS and OMVs
The synergistic effect of NA on the Pg virulence factor-induced IL-1β mRNA expression in BV-2 microglia may be caused by increased transcription or increased stability of IL-1β mRNA in BV-2 microglia by activation of certain transcription factors and/or kinases. To dissect the mechanism by which NA synergizes with Pg virulence factors to up-regulate the expression of IL-1β, the luciferase activities of NanoLuc probe-expressing cells (Nluc reporter BV-2 microglia) were measured after treatment with either NA alone or in combination with Pg virulence factors. NA (30-1000 nM) induced luciferase activity in a concentration-dependent manner, ranging from 4 to 20×103 relative light units (RLU) (Figure 1D). On the other hand, Pg LPS (10 μg/mL) and OMVs (150 μg of protein/mL) induced luciferase activities of 10-13×103 and 6-13×103 RLU, respectively. Treatment of Nluc reporter BV-2 microglia with a combination of both NA (30 - 1000 nM) and Pg LPS (10 μg/mL) resulted in the enhancement of Pg LPS-LPS-induced luciferase activities in a concentration-dependent manner, by up to 22.0-fold relative to Pg LPS alone (Figure 1E). On the other hand, NA at concentrations of 300 and 1000 nM significantly increased OMV-induced luciferase activities by 8.6- and 29.2-fold relative to OMVs alone, respectively (Figure 1F).
Next, we performed time-course studies of the synergistic production of IL-1β in BV-2 microglia following treatment with NA and Pg virulence factors. Pg LPS-induced luciferase activity peaked 1 h after application and returned to its basal level within 6 h (Figure 2A). The combined application of NA and Pg LPS also peaked at 1 h and returned to its basal level within 6 h (Figure 2B). OMVs alone or in combination with NA and Pg LPS also induced luciferase activity, which peaked at 30 min. After 1 h, the mean luciferase activity remained elevated to a similar level and then returned to the basal level within 6 h (Figure 2C, D). These results suggest that the synergistic production of IL-1β in BV-2 microglia following treatment with NA and Pg virulence factors is manifested at both transcriptional and translational levels.
2.3. Production of IL-1β by BV-2 Microglia Following Treatment with NA and Pg Virulence Factors, Pg LPS and OMVs
The mean levels of IL-1β produced by BV-2 microglia were measured following treatment with NA, Pg virulence factors, or their combination. We first determined the mean concentrations of IL-1β in the cell lysates of BV-2 microglia 1 h after treatment with NA, Pg LPS, OMVs, NA plus Pg LPS and NA plus OMVs by immunoassay. Treatment of BV-2 microglia with a combination ofboth NA and Pg LPS resulted in a significant enhancement of IL-1β up to almost 10-fold relative to treatment with NA or Pg LPS alone (Figure 3A). A combination of both NA and OMVs also led to the enhancement of IL-1β (almost 20-fold) relative to treatment with NA alone or OMVs alone (Figure 3B).
IL-1β was produced as a proform with an apparent molecular mass of 33 kDa and pro- IL-1β increased after treatment with NA (3 μM), Pg LPS (30 μg/mL), or their combined application in BV-2 microglia (Figure 3C). At 1 h after treatment, the 17 kDa mature form of IL-1β was visible in the cell lysates (Figure 3C). The amounts of both the 33-kDa precursor (proIL-1β) and 17-kDa mature IL-β were markedly increased in the cell lysates of BV-2 microglia after stimulation with NA plus Pg LPS relative to stimulation with either NA alone or Pg LPS alone (Figure 3C). Interestingly, the amounts of proIL-1β and an unconventional 20-kDa form of IL-1β were markedly increased in the cell lysates of BV-2 microglia after stimulation with NA plus OMVs compared to stimulation with either NA or OMVs alone (Figure 3D).
2.4. Effects of Inhibitors for NF-κB and AP-1 Signaling Pathways on the Production of IL-1β After Stimulation with NA+Pg LPS or NA+OMVs
NF-κB and AP-1 are key transcription factors that orchestrate the expression of several genes involved in inflammation. Although NF-κB and AP-1 transcription factors are regulated by different mechanisms, they appear to be activated simultaneously by a multitude of stimuli. To dissect possible roles of these signaling molecules in synergistic effect of NA and Pg virulence factors on the IL-1β production in BV-2 microglia, we examined the effects of various inhibitors for molecules that are involved in NF-κB and AP-1 signaling pathways.
Wedelolactone (30 μM), an IκB kinase (IKK) inhibitor, almost completely abolished the luciferase activity induced by NA (1 μM), Pg LPS (10 μg/mL), or their combined application (Figure 4A). An NF-κB activation inhibitor (NAI, 100 nM) also significantly suppressed NA plus Pg LPS-induced luciferase activities by approximately 80% (Figure 4B). The IκB kinase inhibitor wedelolactone also almost completely abolished luciferase activity induced by either NA or NA plus OMVs (150 μg of protein/mL), while wedelolactone failed to inhibit OMV- induced luciferase activity (Figure 4C). In contrast, NAI failed to inhibit the luciferase activity induced by either OMVs or NA plus OMVs (Figure 4D).
The MEK1/2 inhibitor, U0126 (15 μM), significantly suppressed NA plus Pg LPS-induced luciferase activity (Figure 5A). The AP-1 inhibitor SR11302 (10 μM) significantly suppressed NA+Pg LPS-induced luciferase activity by approximately 20% (Figure 5B). U0126 (15 μM) and SR11302 (10 μM) failed to suppress OMV- or NA plus OMV-induced luciferase activity (Figure 5C, D).
2.5. Effects of Inhibitors for Aβ2R/Epac- and TLR29/-p52/RelB-Mediated Pathways on the Production of IL-1β after Stimulation with NA or Pg LPS
We previously reported that NA induces the production of IL-1β by BV-2 microglia through a Aβ2R/Epac-mediated pathway [13]. Epac activates AP-1-mediated transcription. We examined the effects of a selective Aβ2R inhibitor ICI-118551, on the synergistic effect of NA and Pg virulence factors on the production of IL-1β in BV-2 microglia. ICI-118551 (0.1 μM) significantly suppressed the production of IL-1β in BV-2 microglia following stimulation with NA (1 μM) plus Pg LPS (10 μg/mL) or NA (1 μM) plus OMVs (150 μg of protein/mL) (Figure 6A, B).
When NA at concentration of 1 μM was used, ICI-118551 significantly inhibited the production of IL-1β in BV-2 microglia stimulated with NA plus Pg virulence factors. However, ICI-118551 failed to inhibit the NA-induced production of IL-1β (Figure 6A, B). The mean value decreased, however, the difference was not statistically significant. Furthermore, NAI significantly inhibited the production of IL-1β in BV-2 microglia stimulated with NA plus Pg LPS, but not with Pg LPS alone (Figure 4B). Similar results were obtained using U0126 and SR11302 (Figure 5A, B).
This discrepancy may be due to the different mean luciferase activities. NA (1 μM) alone or Pg LPS (10 μg/ml) alone induced the luciferase activity of up to 20×103 RLU, whereas the combined application induced luciferase activity of up to 300×103 RLU. Therefore, we stimulated BV-2 microglia with NA (3 μM) or Pg LPS (30 μg/mL). ICI-118551 significantly suppressed the production of IL-1β by BV-2 microglia following stimulation with NA (3 μM), but not by Pg LPS (30 μg/mL) (Figure 6C, D). In contrast, NAI, U0126, and SR11302 significantly suppressed the NA- or Pg LPS-induced production of IL-1β (Figure 6C, D).
The possible involvement of phagocytosis-related pathways in the production of IL-1β by BV-2 microglia following OMV treatment was further examined. The mean values of the relative luciferase activities of the IL-1β probe induced by NA, OMVs, and their combined application were significantly suppressed by either the TLR9 inhibitor E6446 or the p52 inhibitor SN52 (Figure 6E, F).
2.6. Possible Changes in Expression Levels and Protein Complex Formation of NF-κB p65 and AP-1 c-Fos in BV-2 Microglia Following Combined Treatment with NA and Pg LPS
We addressed whether the synergistic effect of NA and Pg virulence factors increaesd the expression levels of NF-κB and AP-1 in addition to their cooperation in the IL-1β promoter. The protein level of c-Fos in BV-2 microglia was markedly increased following treatment with NA and Pg LPS, whereas the protein level of p65 was unchanged (Figure 7A, B). These results suggest that the increased expression of c-Fos is responsible for the synergistic effects of NA and Pg LPS on the production of IL-1β in BV-2 microglia through increased AP-1 promoter activity. However, our pharmacological studies showed that the NA plus Pg LPS-induced production of IL-1β was more effectively suppressed by an NF-κB inhibitor (approximately 80%) than an AP-1 inhibitor (approximately 20%). Therefore, it is likely that increased c-Fos may physically bind to p65 rather than the AP-1 promoter site, because c-Jun and c-Fos are capable of physically interacting with p65, exhibiting potentiated biological activity [18,19,20,21,22,23]. Thus, we conducted co-immunoprecipitation combined with western blotting using anti-p65 and anti-c-Fos antibodies. Co-immunoprecipitation combined with western blotting showed that c-Fos was present in the protein complexes immunoprecipita ted using anti-p65 antibodies in BV-2 microglia stimulated with Pg LPS and NA (Figure 7C, D).
2.7. Prediction of c-Fos Binding to p65
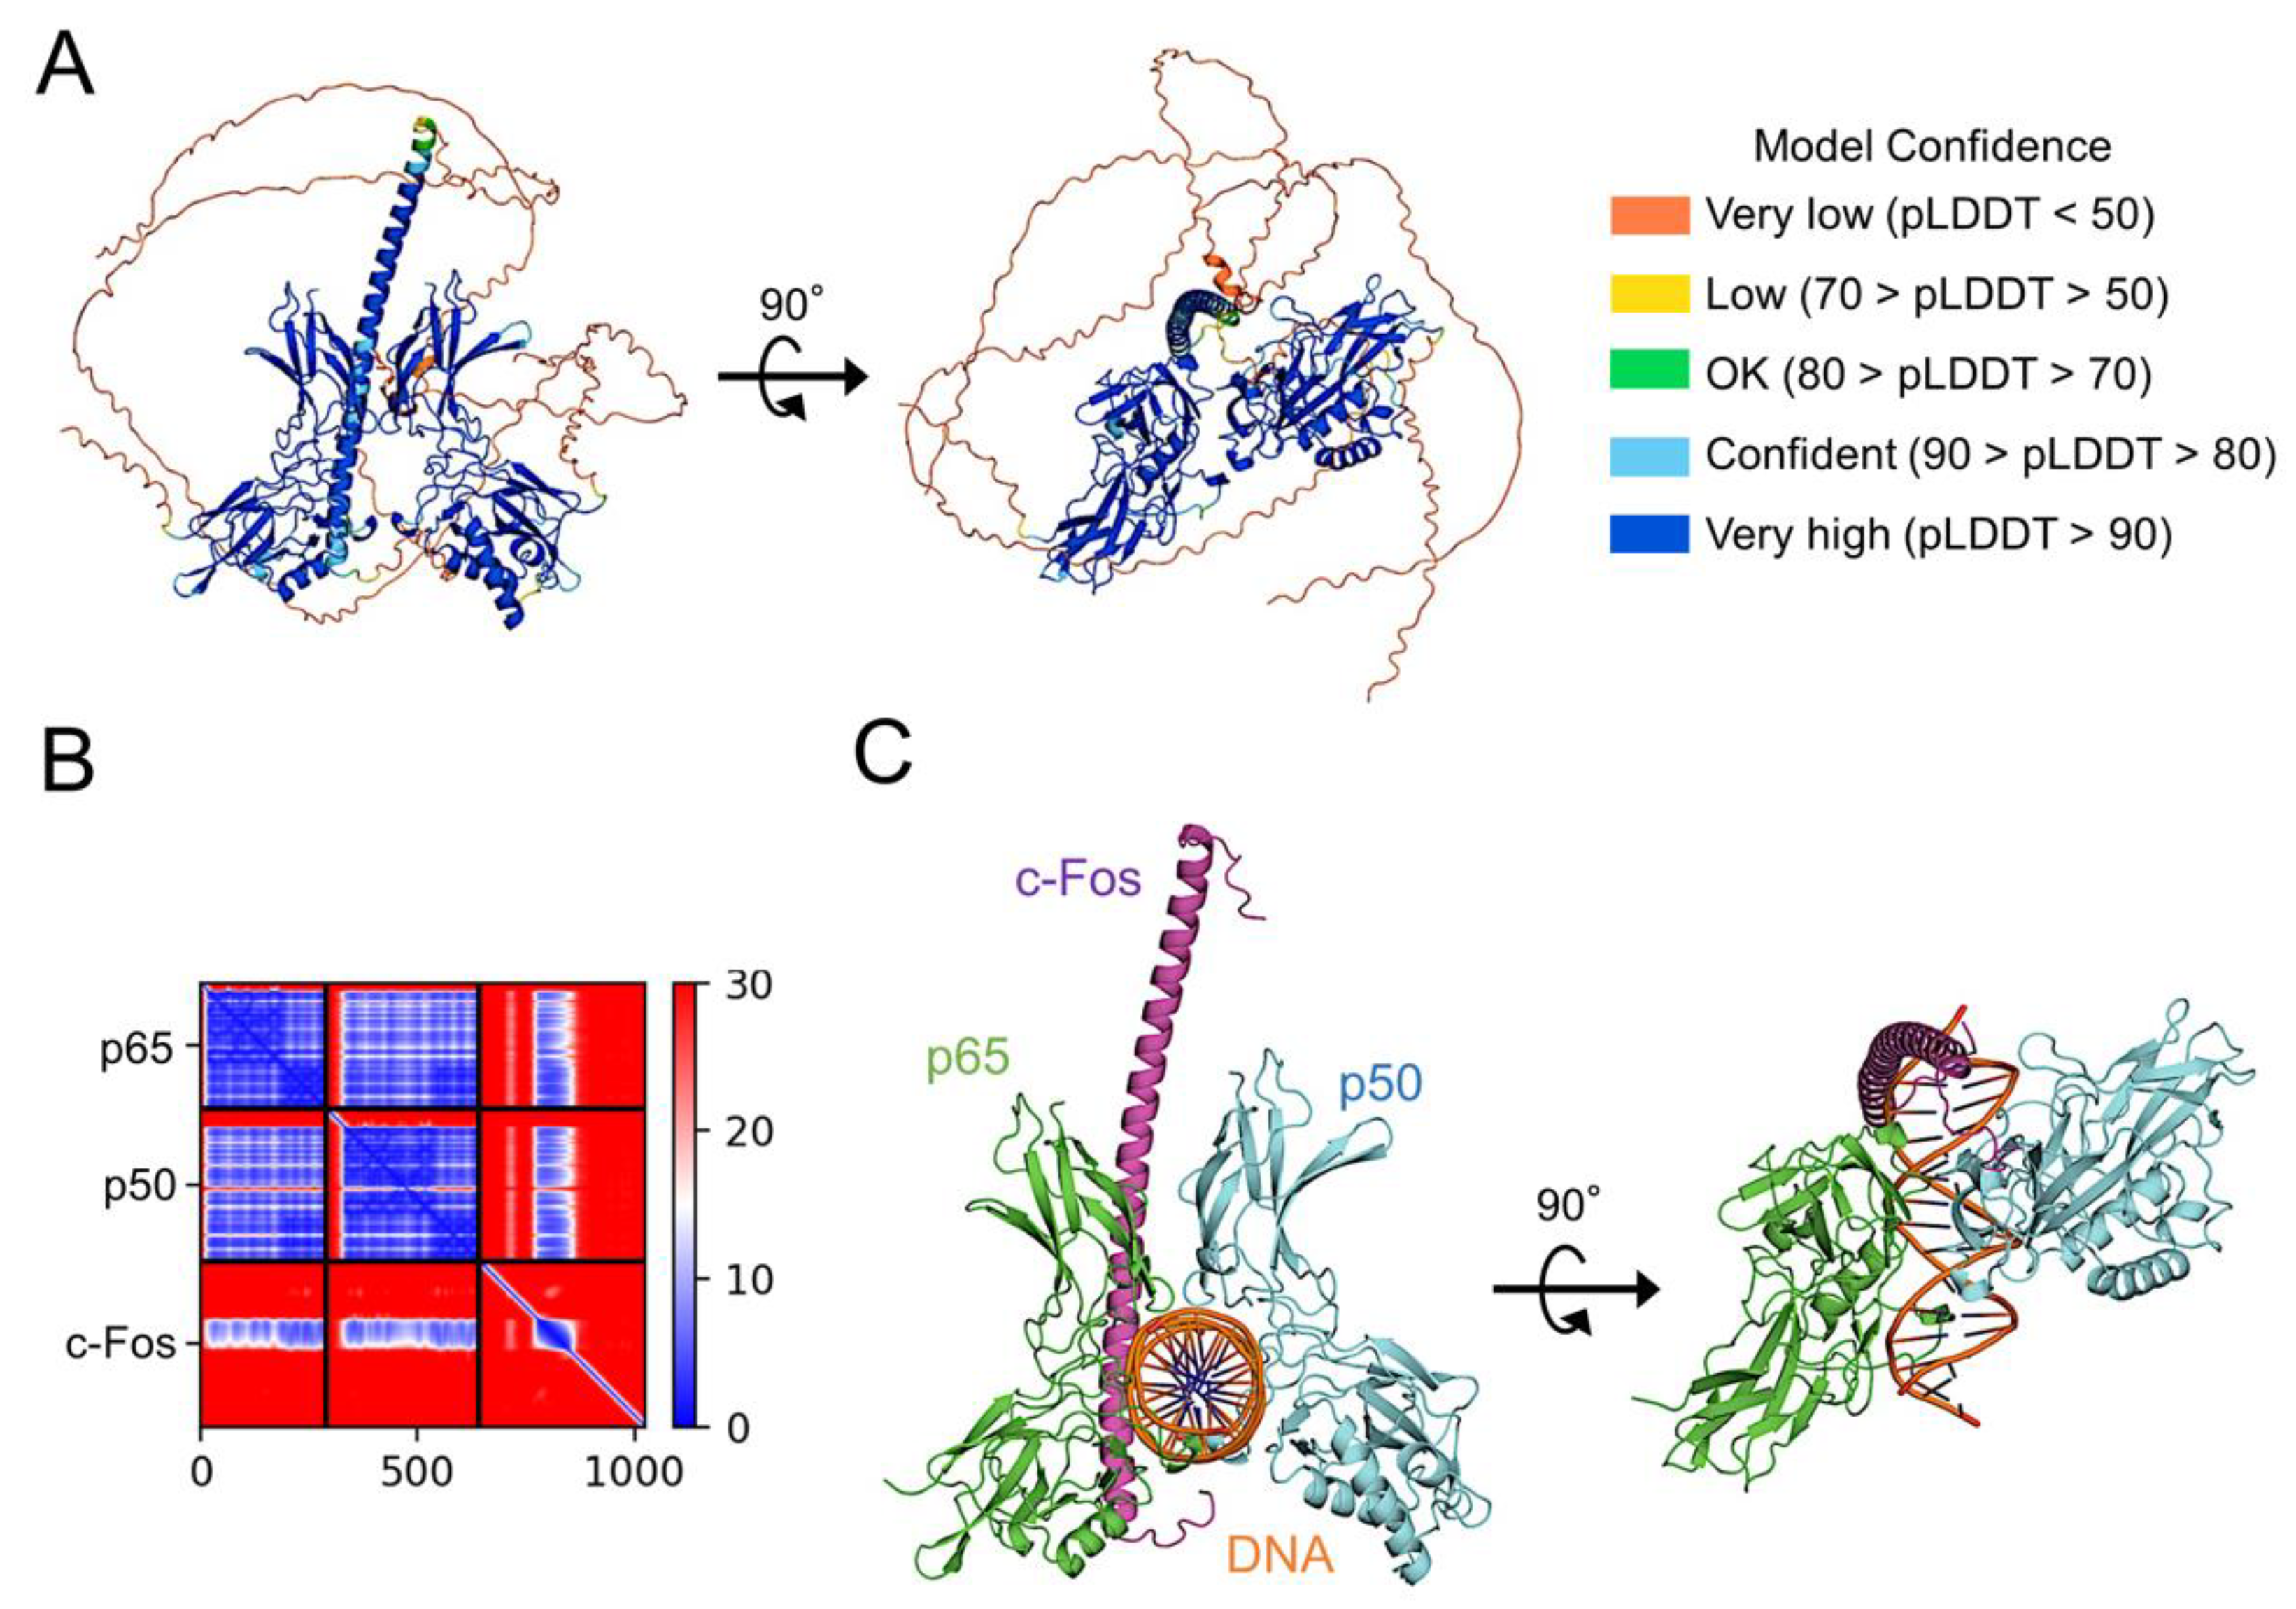
To examine whether c-Fos directly binds to p65, a high-quality model of p65:p50 heterodimer bound to c-Fos was generated using AlphaFold 2 (Figure 8A). In the model, c-Fos forms a complex with p65:p50 heterodimer via the interaction between the leucine-zipper domain of c-Fos and the dimerization domain of p65 with a high reliability (Figure 8A, B). When the structure of p65:p50 heterodimer bound to c-Fos was superimposed on that of p65:p50 heterodimer bound DNA, the leucine-zipper domain of c-Fos can be well inserted in a major groove of DNA (Figure 8C). Therefore, it is likely that a co-operative complex of NF-κB and AP-1 on DNA stabilizes the p65:DNA complex.
3. Discussion
In this study, NA augmented Pg virulence factor-induced IL-1β transcriptional activities up to 20-fold without affecting either peak or duration time. Considering that higher amounts of NA are released from nonsynaptic varicosities noradrenergic terminals, especially under stress conditions, Aβ2R on microglia surrounding noradrenergic terminals can be activated. To the best of our knowledge, this is the first report showing that NA synergizes with Pg virulence factors to up-regulate the expression of IL-1β in the microglia.
We recently reported that the delivery of gingipains into cerebral microvascular endothelial cells, probably through OMVs, may be responsible for blood-brain-barrier damage through intracellular degradation of tight junction proteins, ZO-1 and occludin [24]. Therefore, it is likely that circulating Pg virulence factors are augmented by NA in the brain parenchyma. Several studies have reported anti-inflammatory effects of NA, which is contrary to our findings [25,26]. The anti- and pro-inflammatory effects of NA are intriguing paradoxes. One aspect common to the above-mentioned studies has been suggested that experiments showing an anti-inflammatory effect of NA are mostly conducted in the combination with E. coli LPS treatment, which induces the translocation of NF-κB into the nucleus [27]. However, in the present study, we observed that NA augmented the Pg LPS-induced production of IL-1β. We previously reported that Pg LPS-induced luciferase activity in BV-2 microglia was almost completely suppressed by a specific TLR2 antagonist, C29, but not by a specific TLR4 agonist, TAK-242 [16,17]. These observations indicate that Pg LPS-induced luciferase activity in BV-2 microglia is mediated by lipoproteins via TLR2. Therefore, this discrepancy may be due to the difference in TLRs activated by Pg lipoproteins and E .coli LPS. Further studies are needed to fully understand the paradoxical effects of NA.
NF-κB and AP-1 play important roles as transcription factors in the expression of various genes induced by bacterial LPS, including Pg LPS. Therefore, using specific inhibitors of NF-κB or AP-1, we investigated the involvement of these transcription factors in the production of IL-1β following treatment with NA, Pg LPS, and their combination. NAI and SR11302 inhibited the mean levels of luciferase activity induced by NA alone or Pg LPS alone by approximately 30-40%. In contrast, NAI and SR11302 inhibited the mean levels of lucife rase activity induced by NA plus Pg LPS by approximately 80% and 20%, respectively. Therefore, it is considered that the increased promoter activity of the κB sites is responsible for the synergistic effect of NA and Pg LPS on the production of IL-1β in BV-2 microglia. A typical structure of NF-κB is the p50-p65 dimer (NF-κB1/RelA), because dimer formation is necessary for DNA binding. The N-terminal regions of the dimer are responsible for specific DNA contact. In contrast, the C-terminal regions are usually highly conserved, and are responsible for dimerization and nonspecific DNA phosphate contact. AP-1 transcription factors are dimers composed of members of the c-Fos and c-Jun protein families. AP-1 c-Fos can enhance the NF-κB target gene expression by binding to AP-1 sites. Moreover, the basic zipper domains of AP-1 c-Jun and c-Fos physically interacts with the Rel-homology domain of p65, forming a transcription complex with enhanced DNA binding and potentiated biological functions [18]. Considering that the inhibitory effect of SR11302, which blocks the binding of AP-1 to the promoter region, was lower than NAI, AP-1 may physically interacting with p65 to enhance its binding of p65 to the κB sites in the present study. In this study, we found that c-Fos directly binds to p65 by co-immunoprecipitation combined with western blotting following co-treatment with NA and Pg LPS. Furthermore, the structural models generated by AlphaFold 2 in this study suggest that the binding of c-Fos to the p65:p50 heterodimer induces a conformation change of DNA to form hydrogen bonds between c-Fos and DNA, which is likely to enhance the stabilization of the protein-DNA complex. Persistent NF-κB the protein-DNA complex. Persistent NF-κB activation is a hallmark of chronic Inflammatory diseases, including neurodegenerative diseases, cancer, and arthritis [28,29].
On the other hand, OMVs carry various virulence factors including LPS, gingipains (Arg-gingipain and Lys-gingipain), FimA, DNA and cell wall components, that could elicit various inflammatory and immune responses [30]. Pg LPS and gingipains are directly detected by TLR2 and protease-activated receptor 2 on the cell membrane, respectively [31]. In the present study, NAI and SR11302 showed no or moderate inhibitory effects on luciferase activity induced by OMVs alone and OMVs plus NA, suggesting that OMVs and OMVs plus NA activate transcriptional pathways other than either NF-κB p65 or AP-1. We have previously reported that OMVs are quickly phagocytosed by BV-2 microglia, and that the phagocytic/endocytic pathway is required for the production of IL-1β [17]. It was also noted that the amounts of proIL-1β and an unconventional 20-kDa form of IL-1β were markedly increased in the cell lysates of BV-2 microglia after stimulation with NA plus OMVs relative to stimulation with either NA or OMVs alone. It has been reported that LPS treatment produces the 20-kDa form of IL-1β intracellularly [32]. In contrast, leaked proIL-1β from LPS-primed microglia after ATP stimulation is processed into the 20-kDa form of IL-1β by cathepsin D [33,34]. It is suggested that the formation of the 20-kDa form of IL-1β prevents the generation of mature IL-1β and thus may limit inflammation, because the 20-kDa form of IL-1β is minimally active at IL-1R1 and is not further cleaved to highly active 17-kDa mature form [34].
RNA and DNA in bacterial OMVs are recognized by TLR7/TLR8 and TLR9 in phago-endosomes, respectively. We found that the TLR7/9 inhibitor E6446 significantly suppressed the luciferase activity induced by both OMVs alone and NA plus OMVs. Moreover, the p52 inhibitor SN52 significantly suppressed the luciferase activity induced by both OMVs alone and NA plus OMVs. OMVs are thought to induce inflammatory and immune responses through the activation of the TLR7/9-p52/RelB-mediated pathway after phagocytosis. However, the mechanisms for the NA plus OMV-induced synergistic effect remain unclear in this study. It is likely that Aβ2R/Epac-mediated pathway enhances trafficking of endosomes and/or phagosomes to promote their fusion, because Epac-Rap1 signaling was suggested to play an important role in the interaction between late endosomes and phagosomes [35]. The precise molecular mechanisms underlying the synergistic effects of the NA and OMV-induced production of IL-1β in BV-2 should be elucidated in future studies.
4. Materials and Methods
4.1. Reagents
NA, U0126,a MEK inhibitor, and NAI, an inhibitor of NF-κB p65 transcriptionally activity, were purchased from Sigma-Aldrich (St. Louis, MO, USA). Wedelolactone, an IκB kinase (IKK) inhibitor, was purchased from Tokyo Chemical Industry Co., Ltd (Tokyo, Japan). SR11302, an inhibitor of AP-1 c-Fos transcriptional activity, was purchased from MedChem Express (Monmouth Junction, NJ, USA). Standard Pg LPS, a TLR4/TLR2 agonist, was purchased from InvivoGen (San Diego, CA, USA).
4.2. Cell Culture
The BV-2 cells, a murine microglial cell line [36], and a well-accepted alternative to primary microglia [37,38], were used in this study. BV-2 microglia were cultured in Dulbecco’s modified Eagle’s medium (Thermo Fisher Scientific, Waltham, MA, USA) supplemented with 5% fetal bovine serum, penicillin, and streptomycin. To establish NanoLuc (Nluc) probe-expressing cells (Nluc reporter BV-2 microglia), we infected the cells with a lentiviral vector carrying the Nluc probe as described previously [13]. The Nluc luciferase protein is retained only when the proteolytic processing of IL-1β is successful, as it can be escape proteasome degradation.
4.3. Measurement of the Luciferase Activity (RLU)
Nluc reporter reporter BV-2 microglia were plated in 96-well white culture plates at a density of 5 104 cells per well. After overnight culture, drug treatments were performed, and luciferase activity following treatment with NA (1 or 3 µM), Pg LPS (10 or 30 µg/mL) or OMVs (150 µg of protein/mL) was measured using a luminometer (GloMax; Promega Corp., Madison, WS, USA) with a Nano-Glo® luciferase assay system (N1110; Promega Corp.) according to the manufacturer’s instructions. RLU induced by NA, Pg LPS or OMVs was then measured in sum of cells and culture media. Each treatment was repeated in triplicate on the same plate
4.4. Bacterial Culture and Isolation of OMVs
4.5. RT-qPCR
The mRNA levels of IL-1β expressed in BV-2 microglia were measured by RT-qPCR as previously described [16,39]. The primer pair sequences were as follows: IL-1β, 5’-CAACCAACAAGTGATATTCTCCAT-3’ and 5’-GATCCACACTCTCCAGCTGCA-3’; β-actin, 5’-GGCATTGTGATGGACTCCG-3’ and 5’-GCTGGAAGGTGGACAGTGA-3’. For data normalization, an internal control (β-actin) was used for cDNA input, and the relative units were calculated using a calibration curve method. Experiments were repeated three times, and the results are presented as the mean ± standard error.
4.6. Immunoassay for IL-1β
The concentrations of IL-1β in the cell lysates of BV-2 microglia were measured using a LumitTM IL-1β (Mouse) Immunoassay (Promega) 1 h after treatment with NA, Pg LPS, OMVs, NA plus Pg LPS, and NAplus OMVs, according to the manufacturer’s instructions. Luminescence generated, which was proportional to the amount of IL-1β, was measured using a multimode plate reader EnSight (Parkin-Elmer, Shelton, CT, USA).
4.7. Immunoblotting
BV-2 microglia were seeded in a 6 cm petri dish at a density of 3.3 106cells/dish for 1 day. After treatment with NA(3 µM), Pg LPS (30 µg/mL) or OMVs (150 µg protein/mL), and their combination, each specimen was electrophoresed using 15% SDS-polyacryl-amide gels, and then proteins on the SDS gels were electrophoretically transferred to nitrocellulose membranes, and immunoblotted as previously described [39]. The primary antibodies used were as followings: goat anti-IL-1β antibodies (1:1000; R&D systems, Minneapolis, MN, USA); rabbit anti-glyceraldehyde-3-phosphate dehydrogenase (GAPDH) antibodies (1:1000; Proteintech, Tokyo, Japan).
4.8. Co-Immunoprecipitation and Immunoblot Analysis
BV-2 microglia were seeded in a 10 cm petri dish at a density of 3.3 106cells/dish for overnight. After treatment with NA(3 µM), Pg LPS (30 µg/mL), and their combination, cells were collected and cell lysates (1 mg of protein/each) were performed immuno-precipitation using Pierce co-immunoprecipitation Kit (Thermo Fischer Scientific) according to manufacture’s instructions. The antibodies for immunoprecipitation were rabbit anti-NF-κB p65 antibodies (20 µL; ab2071297, Abcam, Tokyo, Japan). Immuno-precipitates were separated on a !0% SDS-PAGE gel, transferred to PVDF membrane, and immunoblotted. The primary antibodies for immunoblotting used were as follows: rabbit anti-c-Fos antibodies (1:1000; ab190289, Abcam); rabbit anti-NF-κB p65 anti-bodies (1:1000; Ab16502, Abcam).
4.9. AlphaFold Predictions
The AlphaFold models of the ternary complex consisting of the DNA binding domain and dimerization domain of p65 (aa 1–291), those of p50 (aa 1–352), and full length of c-Fos were predicted using the AlphaFold v2.0 algorithm on the Co-lab server (https://colab.research.google.com/github/sokrypton/ColabFold/blob/main/AlphaFold2. ipynb, accessed on November 20, 2023) [40]. Predictions were performed with default multiple sequence alignment generation using the MMSeqs2 server, with 48 recycles and templates (homologous structures). The best of the five predicted models (rank 1) computed by AlphaFold was considered in the present work. The Structure of the complex consisting of p65, p50, c-Fos, and DNA was generated based on the AlphaFold model of p65:p50 hetero-dimer bound to leucine-zipper domain of c-Fos and the structure of DNA-bound p65:p50 heterodimer (PDB code 2I9T).
4.10. Statistical Analyses
Data are presented as the mean ± standard error (SE). The results were analyzed by a one-way analysis of variance (ANOVA) with a post-hoc Tukey’s test using the GraphPad Prism8 (GraphPad Software, Inc., CA, USA) software package. P values of <0.05 were considered to indicate statistical significance.
Author Contributions
Conceptualization, H.N.; investigation, S.M. (Sakura Muramoto), S.S. (Sachi Shimizu), S.S. (Sumika Shirakawa), H.I., S.M. (Sayaka Miyamoto), M.J., U.T., C.M, E.I., K.O., and S.N.; analysis, S.M. (Sakura Muramoto), H.I., S.N., and H.N.; methodology and resources, Z.W., and H.T.-S.; writing—original draft preparation, H.N.; writing—review and editing, S.M. (Sakura Muramoto), S.S. (Sachi Shimizu), S.S. (Sumika Shirakawa), S.M. (Sayaka Miyamoto), M.J. H.I, O.K., S.N., and H.N.; and funding acquisition, H.N. All authors have read and agreed to the published version of the manuscript.
Funding
This research was funded by JSPS KAKENHI Grant Numbers JP21K06383 (H.N.).
Institutional Review Board Statement
Not applicable.
Informed Consent Statement
Not applicable.
Data Availability Statement
Not applicable.
Acknowledgments
The authors express their sincere thanks to Ms. Hana Yamaguchi and Mutsumi Ikemoto (Faculty of Pharmacy, Yasuda Women’s University, Hiroshima) for their technical assistance.
Conflicts of Interest
The authors declare no conflict of interest in association with the present study.
Abbreviations
AD: Alzheimer’s disease; ANOVA: one-way analysis of variance; AP-1: activator protein 1; IKK: IκB kinase; IL-1β: interleukin-1β; LPS: lipopolysaccharide; NA: noradrenaline; NAI: NF-κB activation inhibitor; NF-κB: nuclear factor-κB; OMVs: outer membrane vesicles; Pg: Porphyromonas gingivalis; qRT-PCR: quantitative real-time polymerase chain reaction; RLU: relative light units; SE: standard error; TLR: Toll-like receptor
References
- Li, C.; Yu, R.; Ding, Y. Association between Porphyromonas Gingivalis and systemic diseases: Focus on T cells-mediated adaptive immunity. Front. Cell. Infect. Microbiol. 2022, 12, 1026457. [Google Scholar] [CrossRef] [PubMed]
- Kasuga, K.; Tsukie, T.; Kikuchi, M.; Tokutake, T.; Washiyama, K.; Shimizu, S.; Yoshizawa, H.; Kuroha, Y.; Yajima, R.; Mori, H.; Arakawa, Y.; Onda, K.; Miyashita, A.; Onodera, O.; Iwatsubo, T.; Ikeuchi, T. Japanese Alzheimer’s Disease Neuroimaging Initiative. The clinical application of optimized AT(N) classification in Alzheimer's clinical syndrome (ACS) and non-ACS conditions. Neurobiol. Aging 2023, 127, 23–32. [Google Scholar] [CrossRef]
- Ogawa, T.; Uchida, H.; Amino, K. Immunobiological activities of chemically defined lipid A from lipopolysaccharides of Porphyrommonas gingivalis. Microbiology 1994, 140, 1209–1216. [Google Scholar] [CrossRef] [PubMed]
- Lamont, R.J.; Jenkinson, H.F. Life below the gum line: Pathogenic mechanisms of Porphyromonas gingivalis. Microbiol. Mol. Biol. Rev. 1998, 62, 1244–1263. [Google Scholar] [CrossRef] [PubMed]
- Gibson, F.C., 3rd.; Hong, C.; Chou, H.H.; Yumoto, H.; Chen, J.; Lien, E.; Wong, J.; Genco, C.A. Innate immune recognition of invasive bacteria accelerates atherosclerosis in apolipoprotein E-deficient mice. Circulation 2004, 109, 2801–2806. [Google Scholar] [CrossRef] [PubMed]
- Liu, R.; Desta, T.; Raptis, M.; Darveau, R.P.; Graves, D.T. P. gingivalis and E. coli lipopolysaccharides exhibit different systemic but similar local induction of inflammatory markers. J. Periodontol. 2008, 79, 1241–1247. [Google Scholar] [CrossRef]
- Qiu, C.; Yuan, Z.; He, Z.; Chen, H.; Liao, Y.; Li, S.; Zhou, W.; Song, Z. Lipopolysaccharide preparation derived from Porphyromonas gingivalis induces a weaker immuno-inflammatory response in BV-2 microglial cells than Escherichia coli by differentially activating TLR2/4-mediated NF-κB/STAT3 signaling pathways. Front. Cell. Infect. Microbiol. 2021, 11, 606986. [Google Scholar] [CrossRef]
- Bailey, M.T.; Kinsey, S.G.; Padgett, D.A.; Sheridan, J.F.; Leblebicioglu, B. Social stress enhances IL-1β and TNF-α production by Porphylomonas gongivalis lipopolysaccharide-stimulated CD11b+ cells. Physiol Behav. 2009, 98, 351–358. [Google Scholar] [CrossRef] [PubMed]
- Lu, H.; Xu, M.; Wang, F.; Liu, S.; Gu, J.; Lin, S. Chronic stress enhances progression of periodontitis via α1-adrenergic signaling: a potential target for periodontal disease therapy. Exp. Mol. Med. 2014, 46, e118. [Google Scholar] [CrossRef] [PubMed]
- Wohleb, E.S.; Hanke, M.L.; Corona, A.W.; Powell, N.D.; Stiner, L.M.; Bailey, M.T.; Nelson, R.J.; Godbout, J.P.; Sheridan, J.F. β-Adrenergic receptor antagonism prevents anxiety-like behavior and microglial reactivity induced by repeated social defeat. J. Neurosci. 2011, 31, 6277–6288. [Google Scholar] [CrossRef] [PubMed]
- Porterfield, V.M.; Gabella, K.M.; Simmons, M.A.; Johnson, J.D. Repeated stressor exposure regionally enhances β-adrenergic receptor-mediated brain IL-1β production. Brain Behav. Immun. 2012, 26, 1249–1255. [Google Scholar] [CrossRef]
- Blandino, P., Jr.; Barnum, C.J.; Deak, T. The involvement of norepinephrine and microglia in hypothalamic and splenic IL-1β responses to stress. J. Neuroimmunol. 2006, 173, 87–95. [Google Scholar] [CrossRef]
- Tozaki-Saitoh, H.; Sasaki, I.; Yamashita, T.; Hosoi, M.; Kato, T.A.; Tsuda, M. Involvement of exchange protein directly activated by cAMP and tumor progression locus 2 in IL-1β production in microglial cells following activation of β-adrenergic receptors. J. Pharmacol. Sci. 2020, 143, 133–140. [Google Scholar] [CrossRef] [PubMed]
- Kaneko, N.; Kurata, M.; Yamamoto, T.; Morikawa, S.; Matsumoto, J. The role of interleukin-1 in general pathology. Inflamm. Regen. 2019, 39, 12. [Google Scholar] [CrossRef]
- Lopez-Castejon, G.; Brough, D. Understanding the mechanism of IL-1β secretion. Cytokine Growth Factor Rev. 2011, 22, 189–195. [Google Scholar] [CrossRef] [PubMed]
- Inoue, E.; Minatozaki, S.; Katsuta, Y.; Nonaka, S.; Nakanishi, H. Human β-defensin 3 inhibits Porphorymonas gingivalis lipopolysaccharide-induced oxidative and inflammatory response of microglia by suppression of cathepsins B and L. Int. J. Mol. Sci. 2022, 23, 15099. [Google Scholar] [CrossRef] [PubMed]
- Inoue, E.; Minatozaki, S.; Shimizu, S.; Miyamoto, S.; Jo, M.; Ni, J.; Tozaki-Saitoh, H.; Oda, K.; Nonaka, S.; Nakanishi, H. Human β-defensin 3 inhibition of P. gingivalis LPS-induced IL-1β production by BV-2 microglia through suppression of cathepsins B and L. Cells 2024, 13, 283. [Google Scholar] [CrossRef] [PubMed]
- Stein, B.; Baldwin Jr., A.S.; Ballard, D.W.; Greene,, W.C.; Angel, P.; Herrlich, P. Cross-coupling of NF-κB p65 and Fos/Jun transcription factors produces poteantiated biological function. EMBO J. 1993, 12, 3879–3891. [Google Scholar] [CrossRef]
- Yang, X.; Chen, Y.; Gabuzda, D. ERK MAP kinase links cytokine signals to activation of latent HIV-1 infection by stimulating a cooperative interaction of AP-1 and NF-κB. J. Biol. Chem. 1999, 274, 27981–27988. [Google Scholar] [CrossRef] [PubMed]
- Fujioka, S.; Niu, J.; Schmidt, C.; Sclabas, G.M.; Peng, B.; Uwagawa, T.; Li, Z.; Evans, D.B.; Abbruzzese, J.L.; Paul, J.; Chiao, P.J. NF-κB and AP-1 connection: mechanism of NF-κB-dependent regulation of AP-1 activity. Mol. Cell. Biol. 2004, 24, 7806–7819. [Google Scholar] [CrossRef] [PubMed]
- Dhillon, N.K.; Peng, F.; Ransohoff, R.M.; Buch, S. PDGF synergistically enhances IFN-γ-induced expression of CXCL10 in blood-derived macrophages: implications for HIV dementia. J. Immunol. 2007, 179, 2722–2730. [Google Scholar] [CrossRef]
- Khalaf, H.; Jass, J.; Olsson, P.E. Differential cytokine regulation by NF-κB and AP-1 in Jurkat T-cells. BMC Immunol. 2010, 11, 26. [Google Scholar] [CrossRef] [PubMed]
- Hokello, J.; Lakhikumar Sharma, A.; Tyagi, M. AP-1 ad NF-κB synergize to transcriptionally activate latent HIV upon T-cell receptor activation. FEBS Lett. 2021, 595, 577–594. [Google Scholar] [CrossRef]
- Nonaka, S.; Kadowaki, T.; Nakanishi, H. Secreted gingipains from Porphylomonas gingivalis increase permeability in hymman cerebral microvascular endothelial cells through intracellular degradation of tight junction proteins. Neurochem. Int. 2022, 154, 105282. [Google Scholar] [CrossRef] [PubMed]
- Dello Russo, C.; Boullerne, A.I.; Gavrilyuk, V.; Feinstein, D.L. Inhibition of microglial inflammatory responses by norepinephrine: effects on nitric oxide and interleukin-1β production. J. Neuroinflammation 2004, 1, 9. [Google Scholar] [CrossRef] [PubMed]
- Ishii, Y.; Yamaizumi, A.; Kawakami, A.; Islam, A.; Choudhury, M.E.; Takahashi, H.; Yano, H.; Tanaka, J. Anti-inflammatory effects of noradrenaline on LPS-treated microglial cells: Suppression of NF-κB nuclear translocation and subsequent STAT1 phosphorylation. Neurochem. Int. 2015, 90, 56–66. [Google Scholar] [CrossRef] [PubMed]
- Sugama, S.; Kakinuma, Y. Noradrenaline as a key neurotransmitter in modulating microglial activation in stress response. Neurochem. Int. 2021, 143, 104943. [Google Scholar] [CrossRef] [PubMed]
- Lee, H.H.; Sanada, S.; An, S.M.; Ye, B.J.; Lee, J.H.; Seo, Y.-K.; Lee, C.; Lee-Kwon, W.; Küper, C.; Neuhofer, W.; Choi, S.Y.; Kwon, H.M. LPS-induced NF-κB enhanceosome requires TonEBP/NFAT5 without DNA binding. Sci. Rep. 2016, 6, 24921. [Google Scholar] [CrossRef]
- Liu, T.; Zhang, L.; Joo, D.; Sun, S.C. NF-κB signaling in inflammation. Signal Trasduct. Target. Ther. 2017, 2, 17023. [Google Scholar] [CrossRef] [PubMed]
- Zhang, Z.; Liu, D.; Liu, S.; Zhang, S.; Pan, Y. The role of Porphyromonas gingivalis outer membrane vesicles in periodontal disease and related systemic diseases. Front. Cell. Infect. Microbiol. 2021, 10, 585917. [Google Scholar] [CrossRef]
- Nakanishi, H.; Nonaka, S.; Wu, Z. Microglial cathepsin B and Porphyromonas gingivalis gingipains as potential therapeutic targets for sporadic Alzheimer’s disease. CNS Neurol. Disord. Drug Targets 2020, 19, 495–502. [Google Scholar] [CrossRef] [PubMed]
- Pelegrin, P.; Surprenant, A. Pannexin-1 couples to maitotoxin- and nigericin-induced interleukin-1β release through a dye uptake-independent pathway. J. Biol. Chem. 2007, 282, 2386–2394. [Google Scholar] [CrossRef] [PubMed]
- Takenouchi, T.; Iwamaru, Y.; Sugama, S.; Tsukimoto, M.; Fujita, M.; Sekigawa, A.; Sekiyama, K.; Sato, M.; Kojima, S.; Conti, B.; Hashimoto, M.; Kitani, H. The activation of P2X7 receptor induces cathepsin D-dependent production of a 20-kDa form of IL-1β under acidic extracellular pH in LPS-primed microglial cells. J. Neurochem. 2011, 117, 712–723. [Google Scholar] [CrossRef] [PubMed]
- Edye, M.E.; Brough, D.; Allan, S.M. Acid-dependent Interleukin-1 (IL-1) cleavage limits available pro-IL-1β for caspase-1 cleavage. J. Biol. Chem. 2015, 290, 25374–25381. [Google Scholar] [CrossRef]
- Pizon, V.; Desjardins, M.; Bucci, C.; Parton, R.G.; Zerial, M. Association of Rap1a and Rap1b proteins with late endocytic/phagocytic compartments and Rap2a with the Golgi complex. J. Cell Sci. 1994, 107, 1661–1670. [Google Scholar] [CrossRef] [PubMed]
- Blasi, E.; Barluzzi, R.; Bocchini, V.; Mazzolla, R.; Bistoni, F. Immortalization of murine microglial cells by a v-raf/v-myc carrying retrovirus. J. Neuroimmunol. 1990, 27, 229–237. [Google Scholar] [CrossRef]
- Henn, A.; Lund, S.; Hedtjärn, M.; Schrattenholz, A.; Pörzgen, P.; Leist, M. The suitability of BV2 cells as alternative model system for primary microglia cultures or for animal experiments examining brain inflammation. ALTEX 2009, 26, 83–94. [Google Scholar] [CrossRef]
- Timmerman, R.; Burm, S.M.; Bajramovic, J.J. An overview of in vitro methods to study microglia. Front. Cell. Neurosci. 2018, 12, 242. [Google Scholar] [CrossRef] [PubMed]
- Ni, J.; Wu, Z.; Peters, C.; Yamammoto, K.; Qing, H.; Nakanishi, H. The critical role of proteolytic relay through cathepsins B and E in the phenotypic change of microglia/macrophage. J. Neurosci. 2015, 35, 12488–12501. [Google Scholar] [CrossRef]
- Mirdita, M.; Schütze, K.; Moriwaki, Y.; Heo, L.; Ovchinnikov, S.; Steinegger, M. ColabFold: Making protein folding accessible to all. Nat. Methods 2022, 19, 679–682. [Google Scholar] [CrossRef] [PubMed]
- DeLano, W.L. The PyMOL Molecular Graphics System, version; DeLano Scientifics: San Carlos, CA, USA, 2002. [Google Scholar]
Figure 1.
Synergistic effects of NA on the Pg virulence factor-induced the expression of IL-1β by BV-2 microglia. (A-C) The mean relative level of IL-1β mRNA following treatment with NA, NA +Pg LPS and NA+OMVs for 1 h. (A) The mean relative level of IL-1β mRNA induced by NA with various concentrations (30-1000 nM). (B, C) The mean relative level of IL-1β mRNA induced by Pg LPS (10 μg/mL) (B) or OMVs (150 μg of protein/mL) (C) in the absence or presence of NA (30-1000 nM). D-F. The mean relative luciferase activity of the IL-1β probe following treatment with NA, NA+Pg LPS and NA+OMVs for 1h. (D) The mean relative luciferase activity of the IL-1β probe induced by NA with various concentrations (30-1000 nM). (E, F) The mean relative luciferase activity of the IL-1β probe induced by Pg LPS (10 μg/mL) (E) or OMVs (150 μg of protein/mL) (F) in the absence or presence of NA (30-1000 nM). Data relative to the values are presented as the mean ± SE of 3 independent experiments.
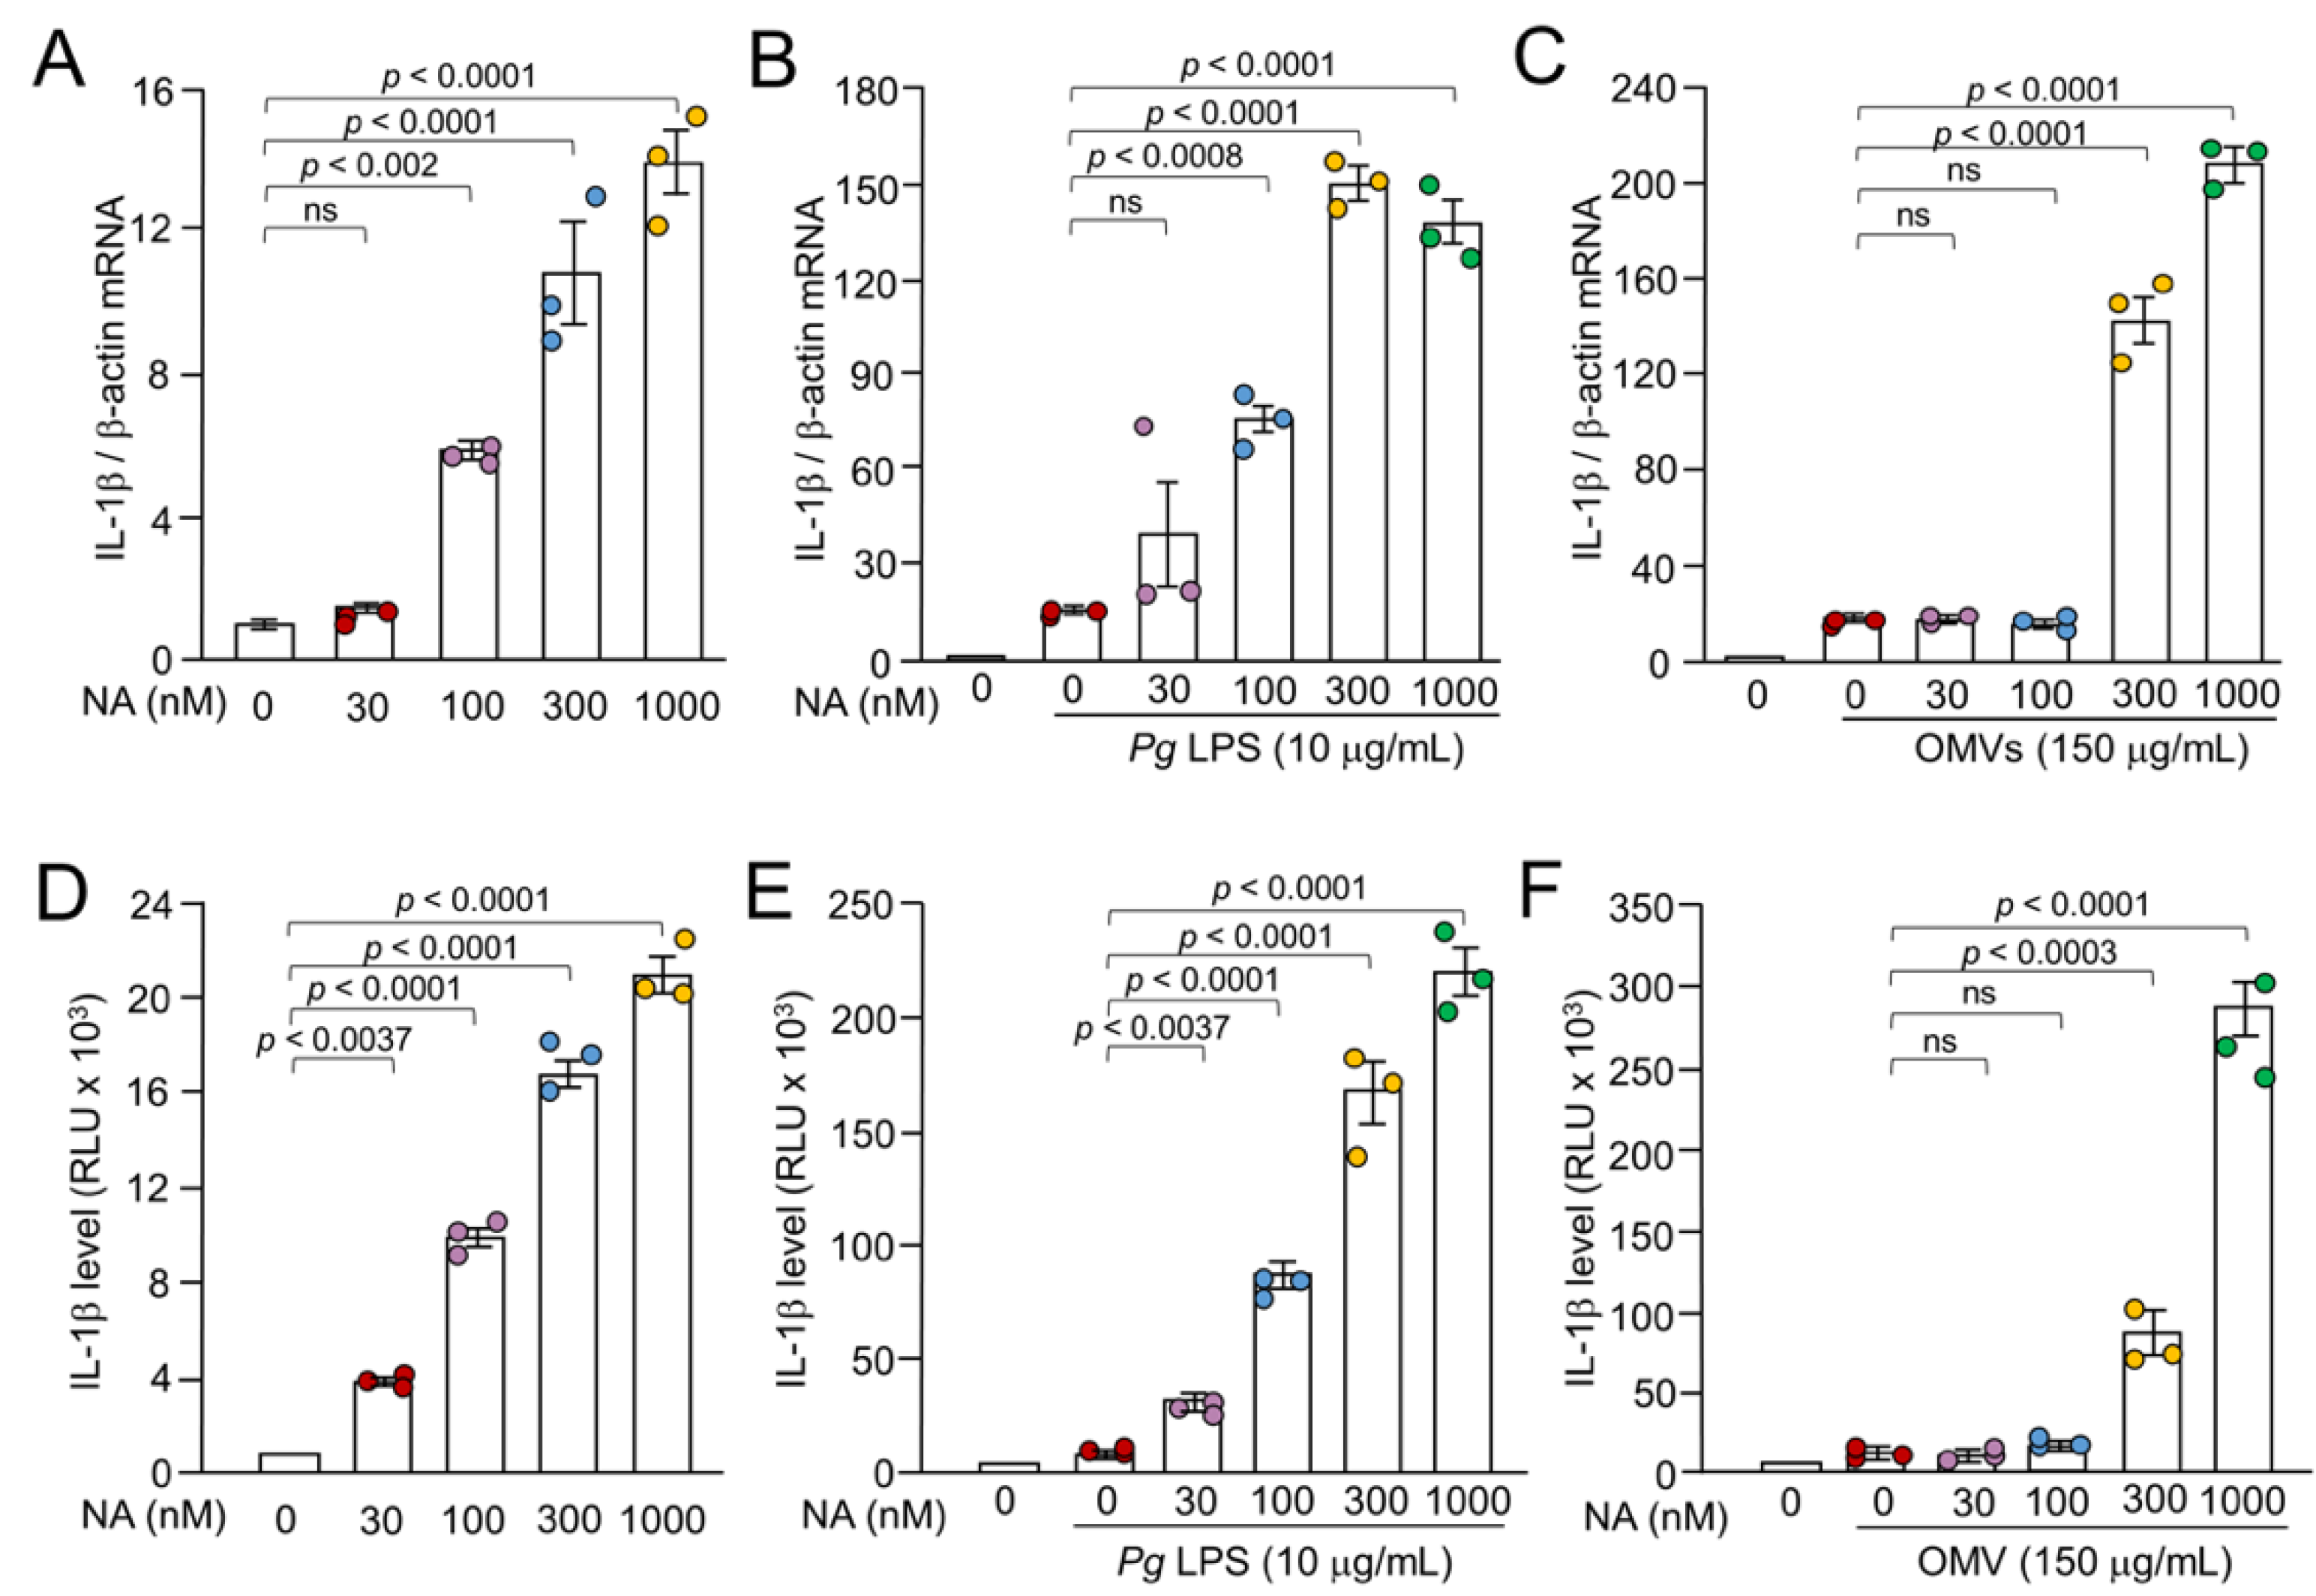
Figure 2.
Time course of the mean relative luciferase activity of the IL-1β probe induced by Pg LPS, OMVs and their combination with NA. (A, B) The mean relative luciferase activity of the IL-1β probe induced by either Pg LPS alone (10 μg/mL) (A)or combination with NA (1 μM) (B). (C, D) The mean relative luciferase activity of the IL-1β probe induced by either OMVs alone (150 μg of protein/mL) (C) or combination with NA (1 μM) (D). Data relative to the values are presented as the mean ± SE of 3 independent experiments.
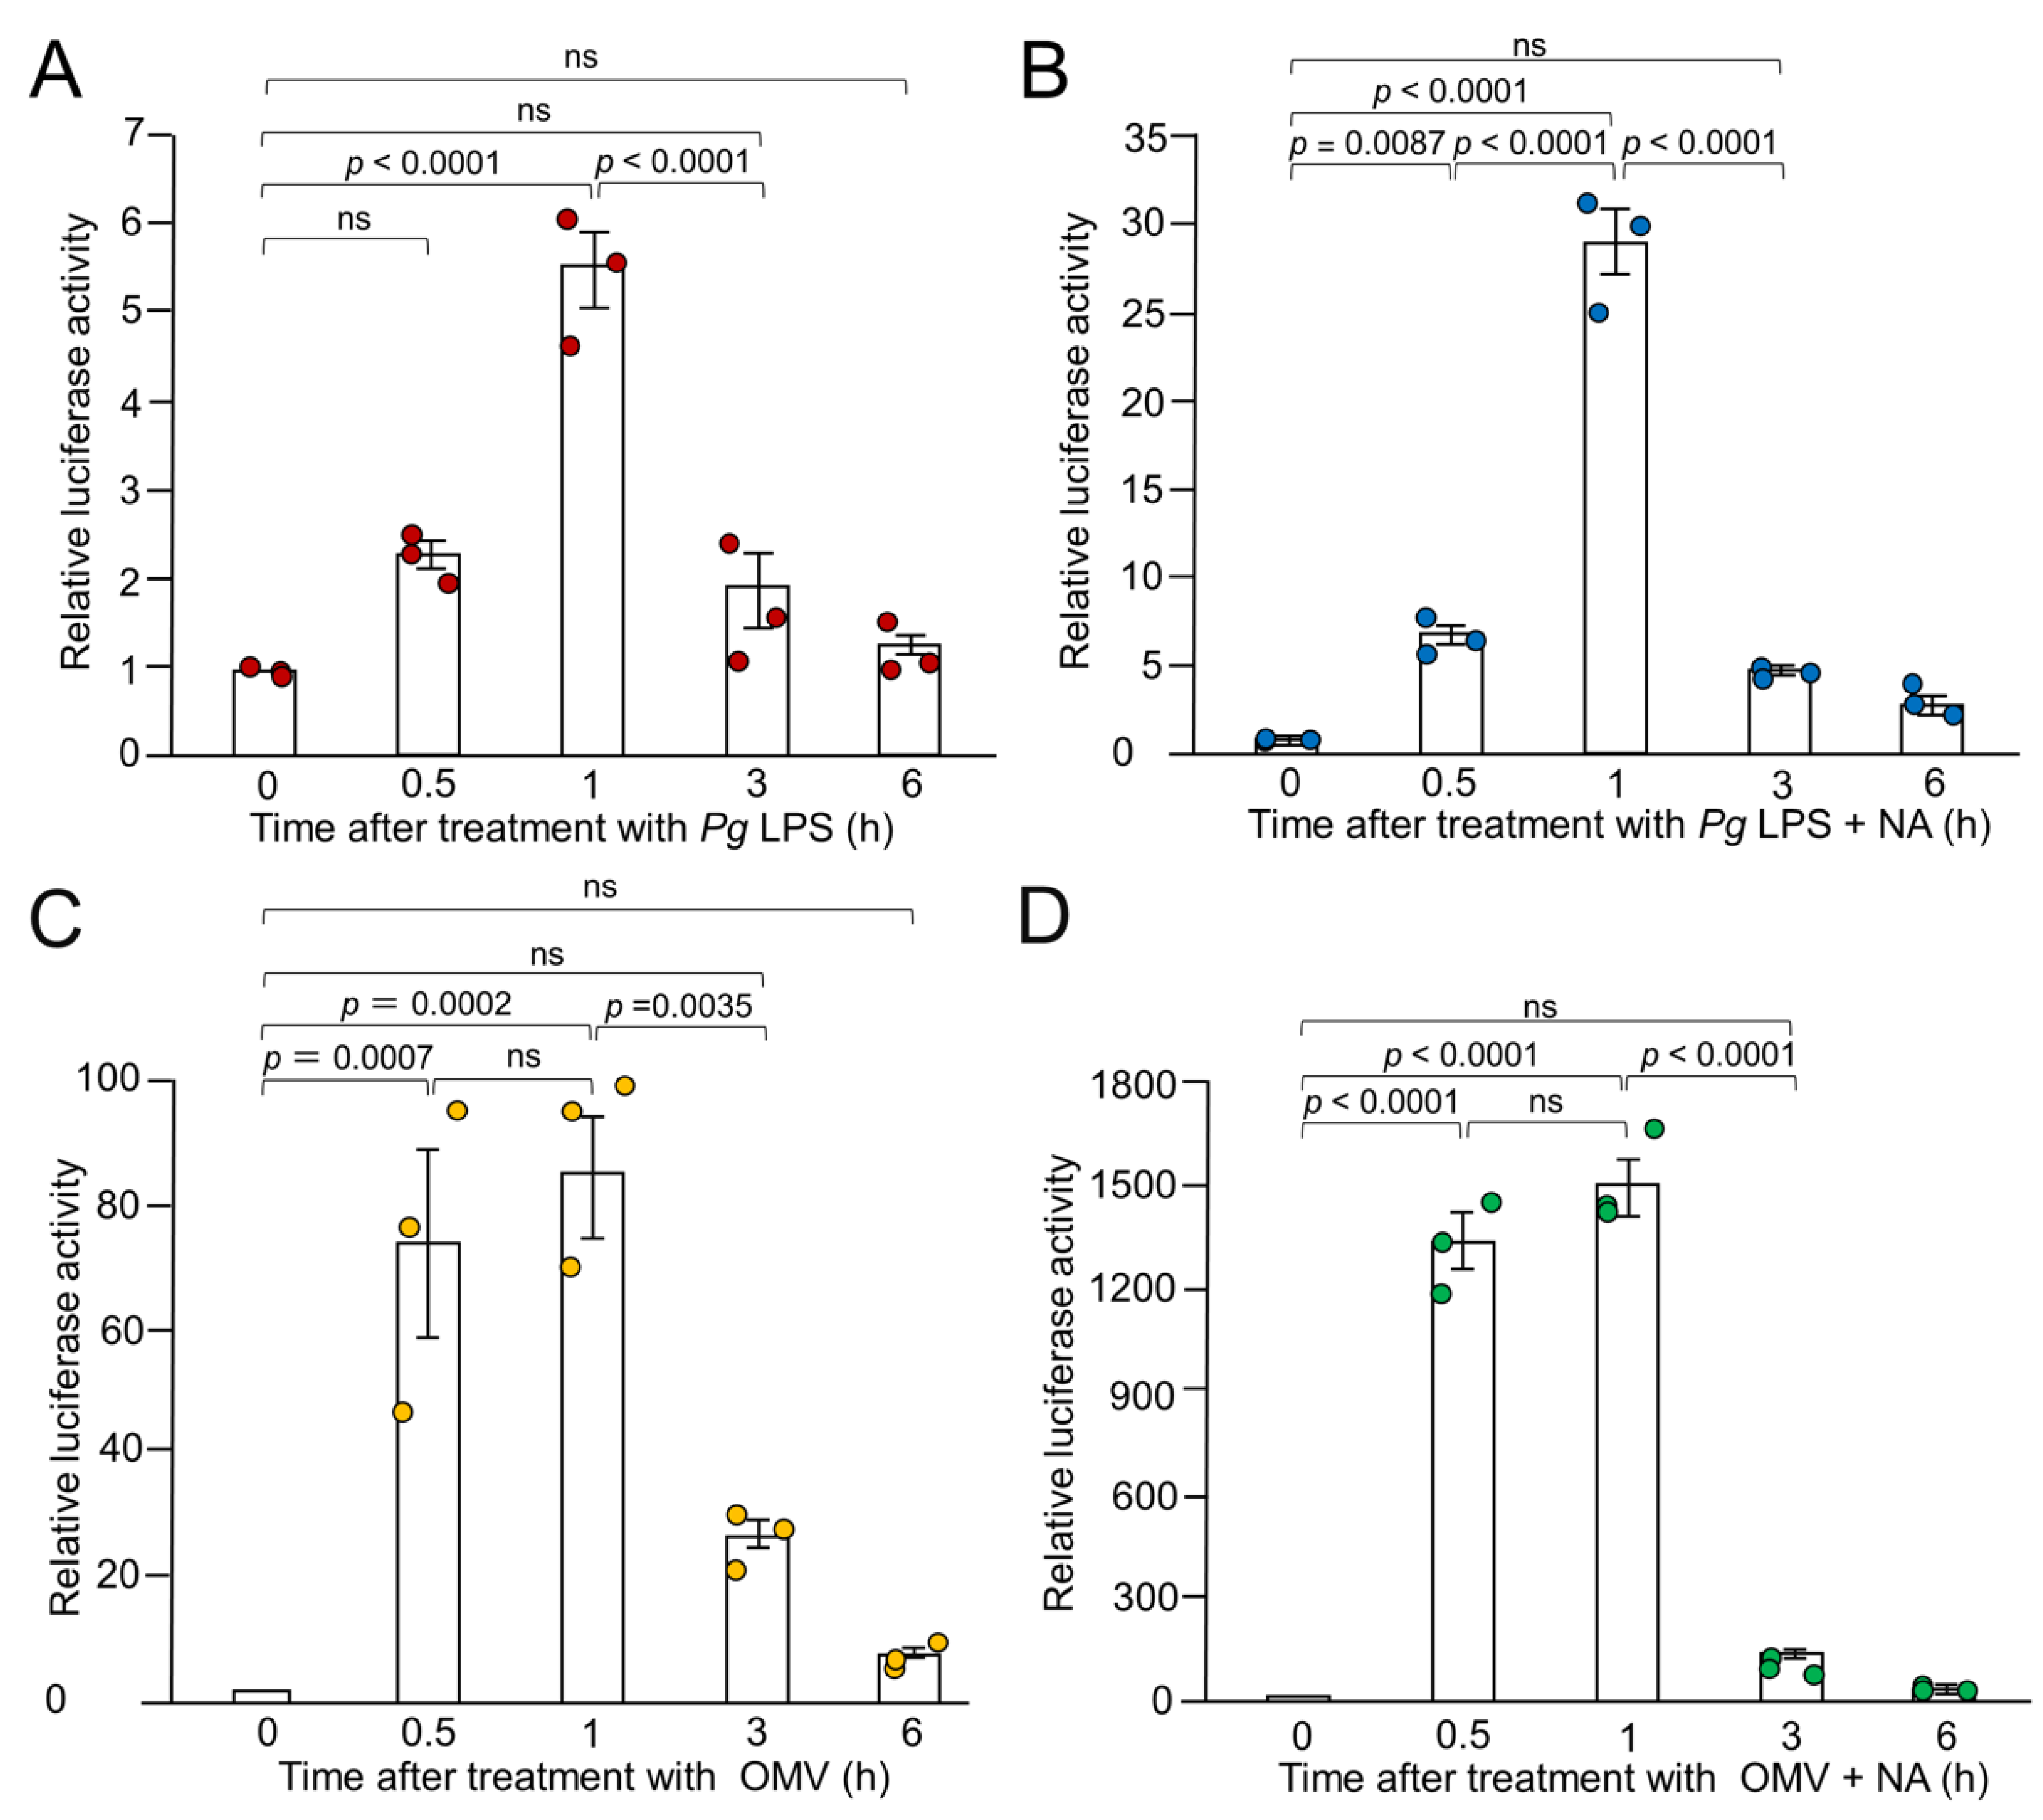
Figure 3.
Production of IL-1β by BV-2 microglia following treatment with NA, Pg virulence factors and their combination. (A) The mean concentration IL-1β in the cell lysates of BV-2 microglia following treatment with NA (1 μM), Pg LPS (10 μg/mL) and their combined application. (B) The mean concentration of IL-1β in the cell lysates of BV-2 microglia following treatment with NA (1 μM), OMVs (150 μg of protein/mL) and their combined application. Data are presented as the mean ± SE of 3 independent experiments. (C) Cell lysates from BV-2 microglia following treatment with NA (3 μM), Pg LPS (30 μg/mL) or their combined application for 1h were subjected to immunoblotting of IL-1β. (D) Cell lysates from BV-2 microglia following treatment with NA (3 μM), OMVs (150 μg of protein/mL) or their combined application for 1h were subjected to immunoblotting of IL-1β. Immunoblotting of GAPDH was used as a loading control.
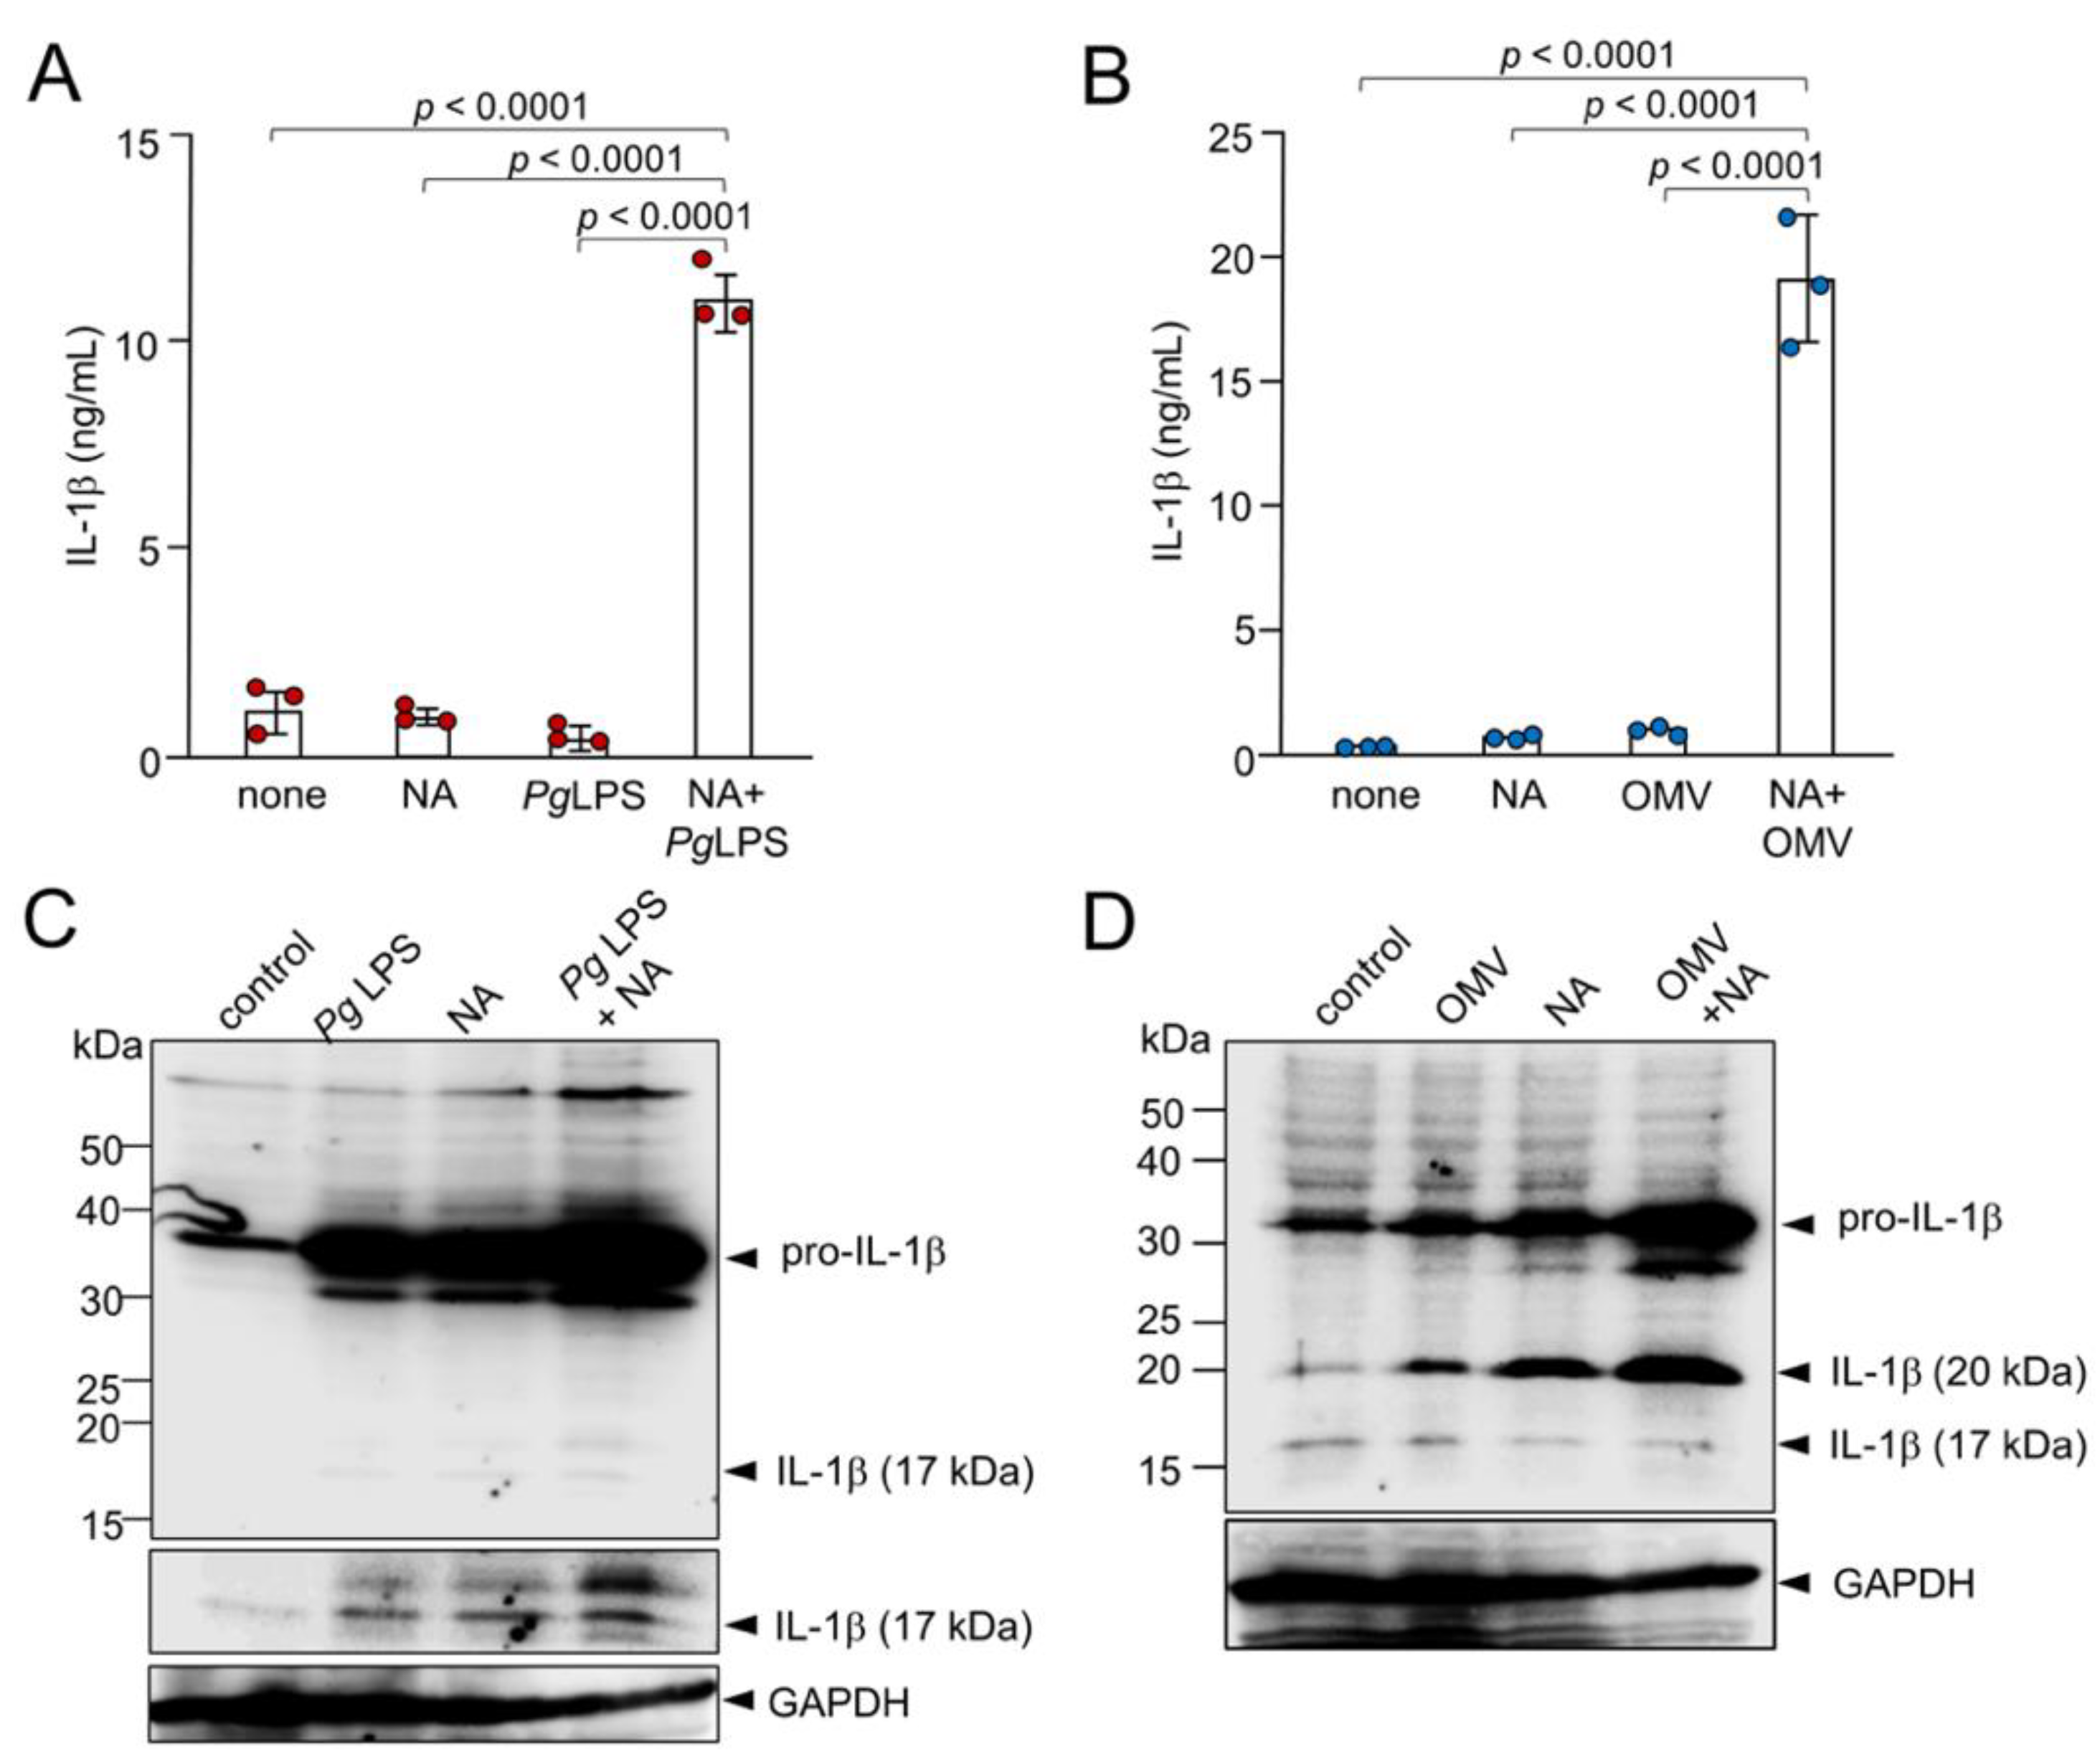
Figure 4.
Effects of NF-κB signaling pathway inhibitors on the production of IL-1β by BV-2 microglia following treatment with NA, Pg virulence factors and their combination. (A, B) The mean relative luciferase activity of the IL-1β probe induced by NA (1 μM), Pg LPS (10μg/mL) and their combined application in the absence or presence of wedelolactone (30 μM) (A) or NAI (100 nM) (B). (C, D) The mean relative luciferase activity of the IL-1β probe induced by NA (1 μM), OMVs (150 μg/mL) and their combined application in the absence or presence of wedelolactone (30μM) (C) or NAI (100 nM) (D). Data relative to the values are presented as the mean ± SE of 3 independent experiments.
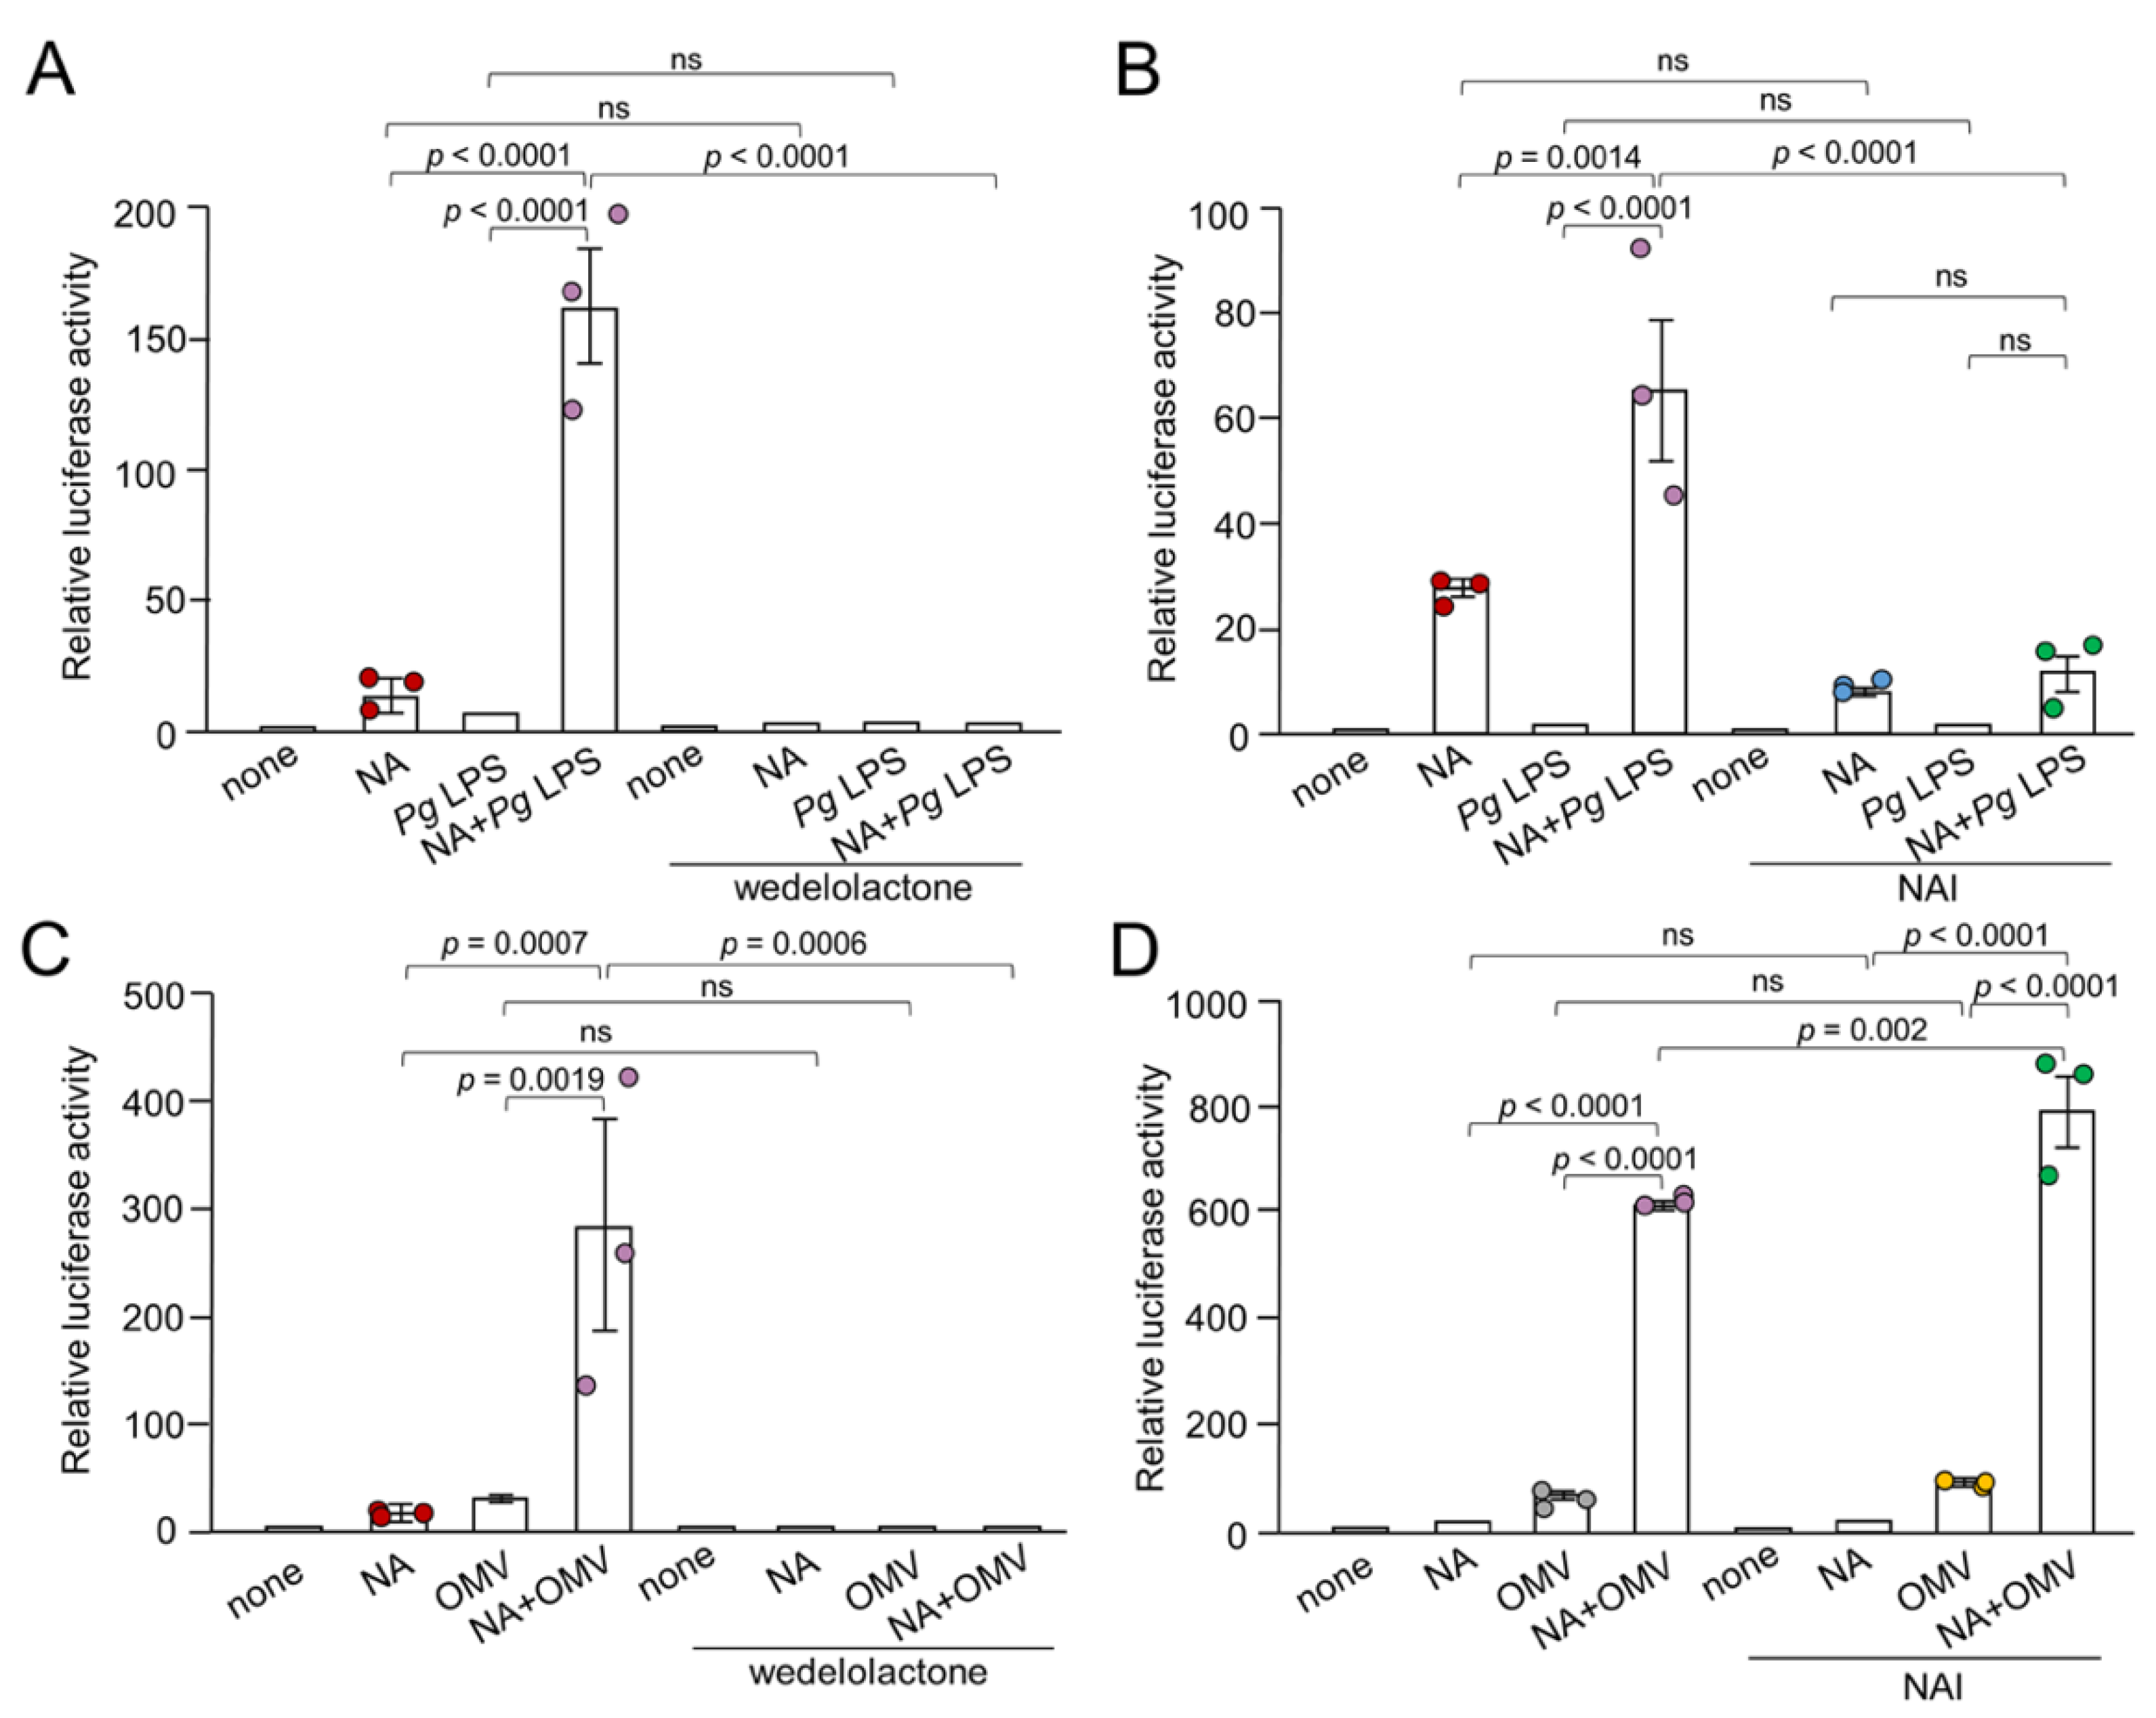
Figure 5.
Effects of AP-1 signaling pathway inhibitors on the production of IL-1β by BV-2 microglia following treatment with NA, Pg virulence factors and their combination. (A, B) The mean relative luciferase activity of the IL-1β probe induced by NA (1 μM), Pg LPS (10 μg/mL) and their combined application in the absence or presence of U0126 (15 μM) (A) or SR11302 (10 μM) (B). (C, D) The mean relative luciferase activity of the IL-1β probe induced by NA (1 μM), OMVs (150 μg of protein/mL) and their combined application in the absence or presence of U0126 (15 μM) (C) or SR11302 (10 μM) (D). Data relative to the values are presented as the mean ± SE of 3 independent experiments.
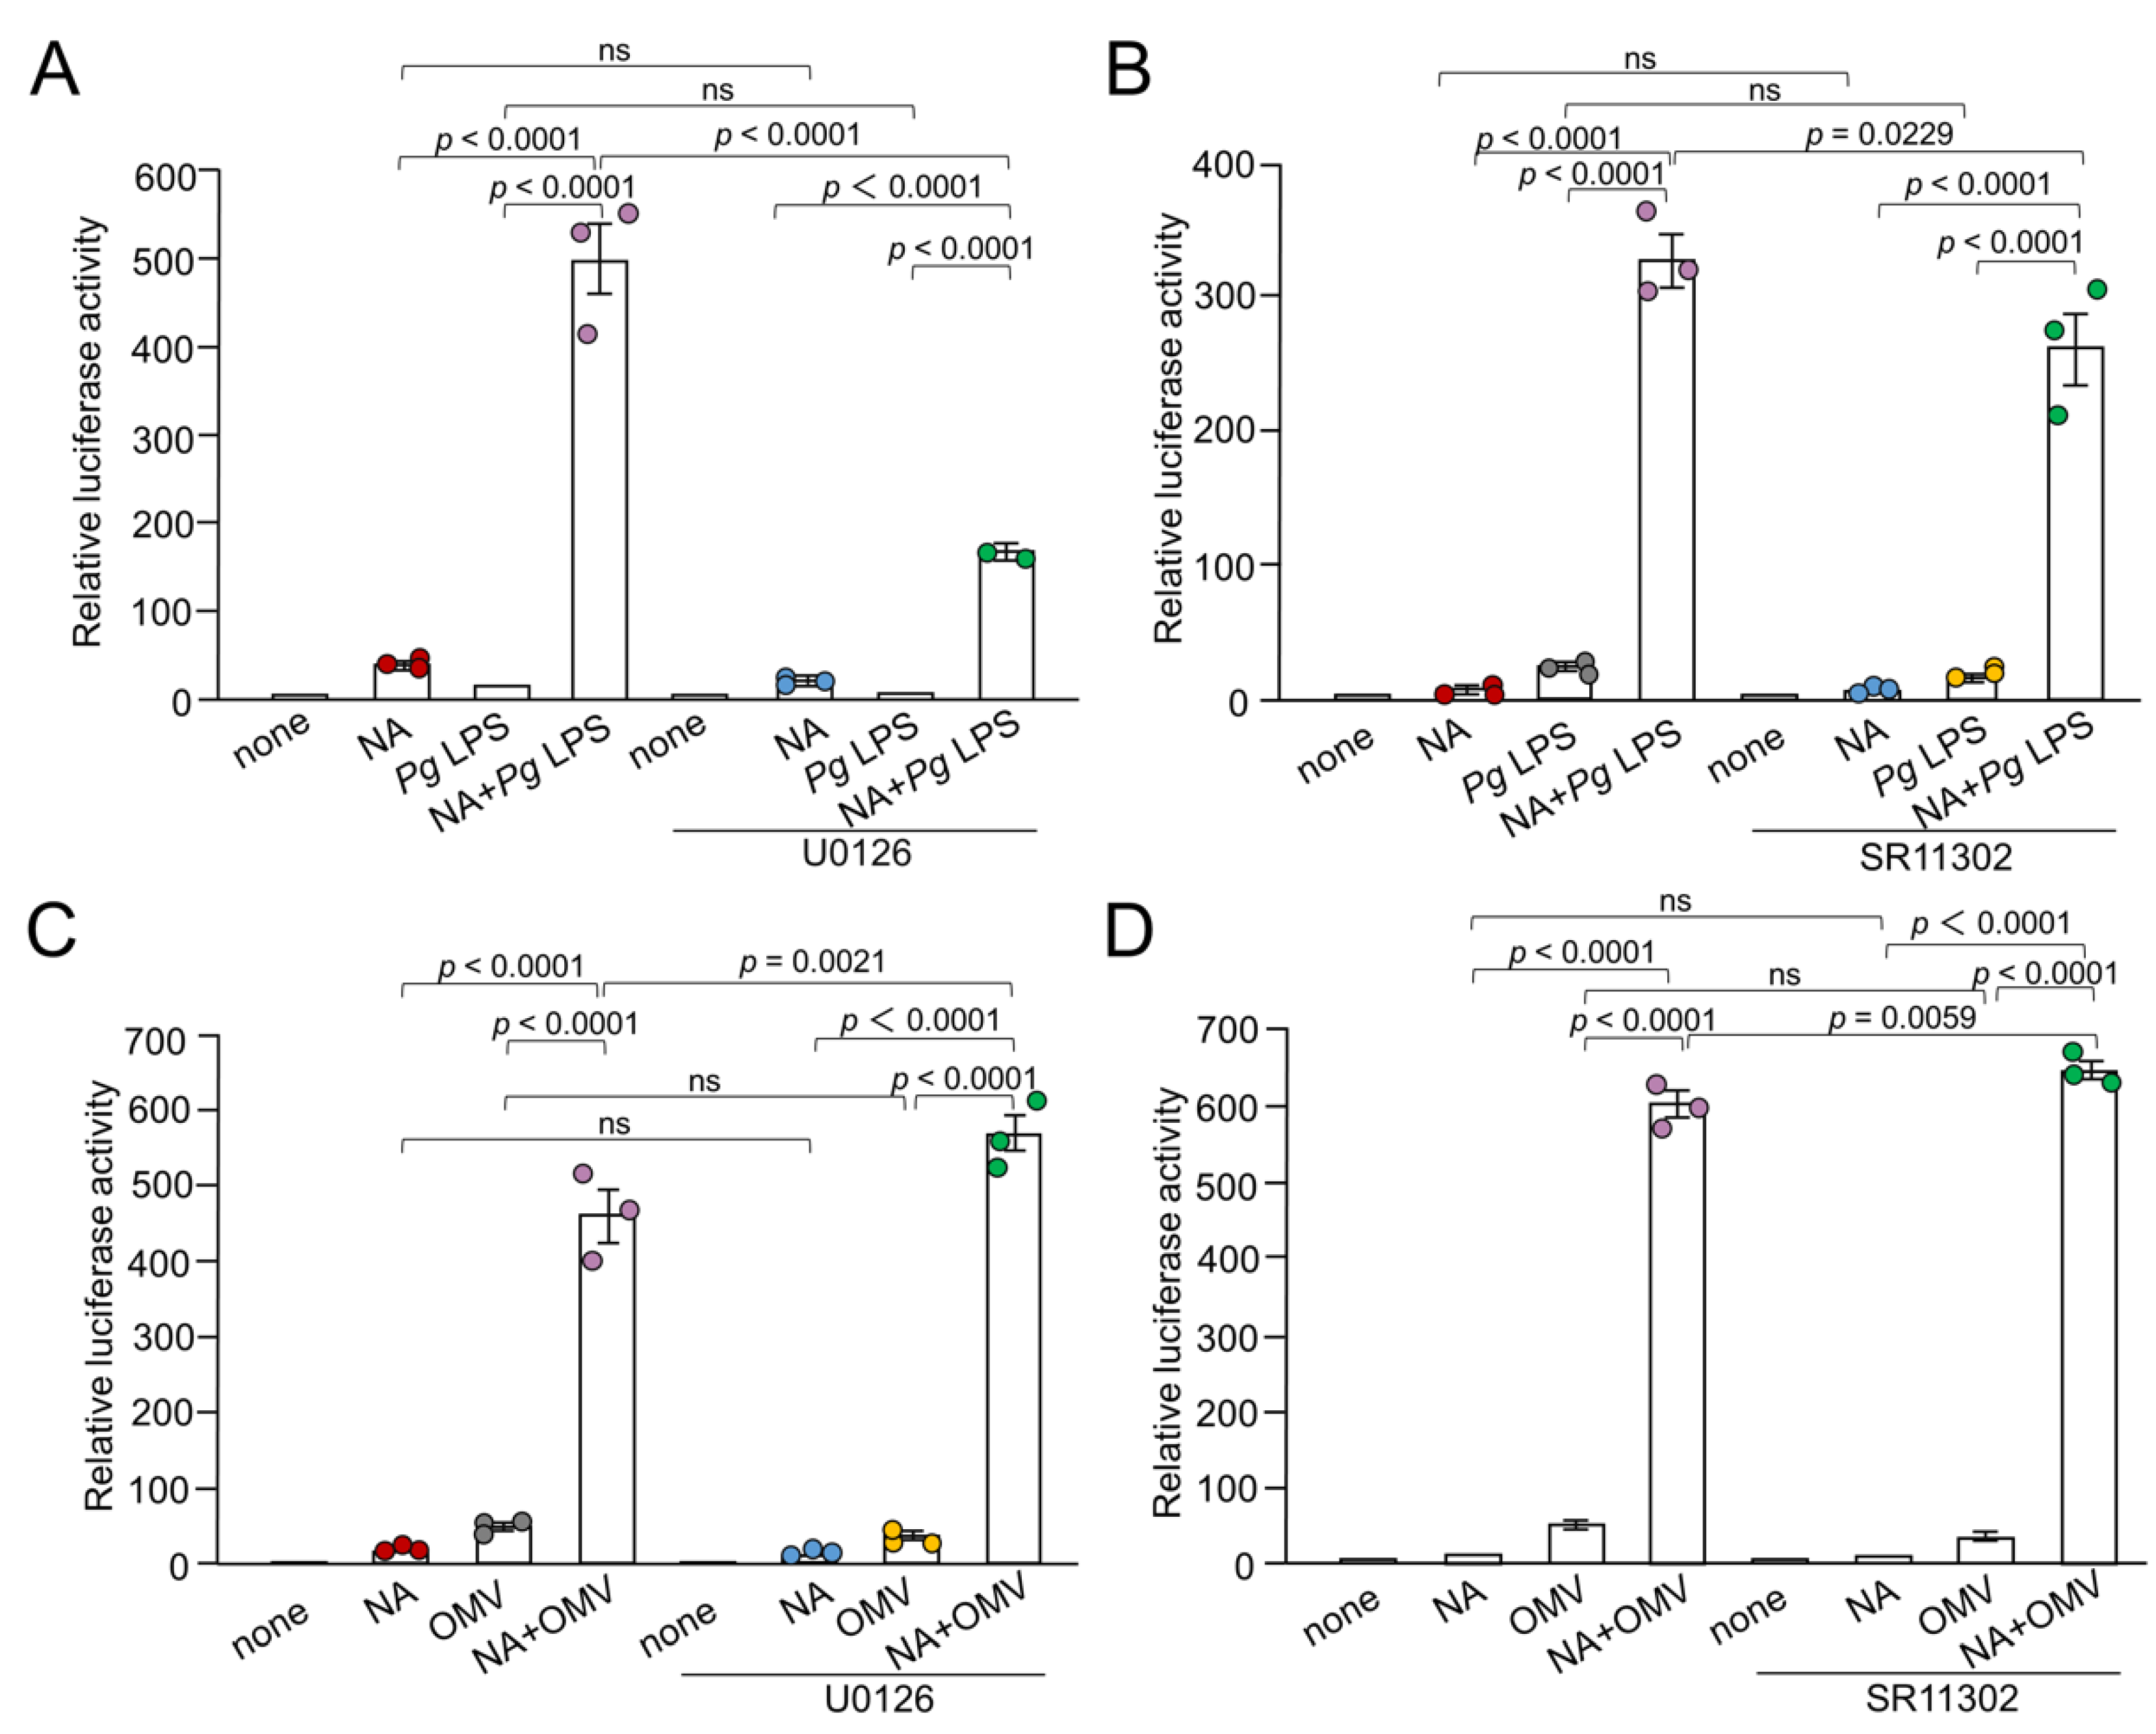
Figure 6.
Involvement of Aβ2R in the synergistic effect of NA and Pg virulence factors in the production of IL-1β by BV-2 microglia and effects of signaling inhibitors on the production of IL-1β induced by NA or Pg LPS alone. (A, B) Effects of ICI on the production of IL-1β by BV-2 microglia following stimulation of NA (1 μM) plus Pg LPS (10 μg/mL) or NA (1 μM) plus OMVs (150 μg/mL). (C, D) Effects of β2 ICI-118551 (0.1 μM), NAI (100 nM), U0126 (15 μM) and SR11302 (10 μM) on the production of IL-1β by BV-2 microglia following treatment with NA (3 μM) or Pg LPS (30 μg/mL). (E, F) Possible involvement of phagocytosis-related pathways on the production of IL-1β by BV-2 microglia following treatment with NA (1 μM) plus OMVs (150 μg/mL) was examined using the TLR9 inhibitor, E6446 (10 μM) (E) or the p52 inhibitor, SN52 (40 μg/mL) (F). Data relative to the values are presented as the mean ± SE of 3 independent experiments.
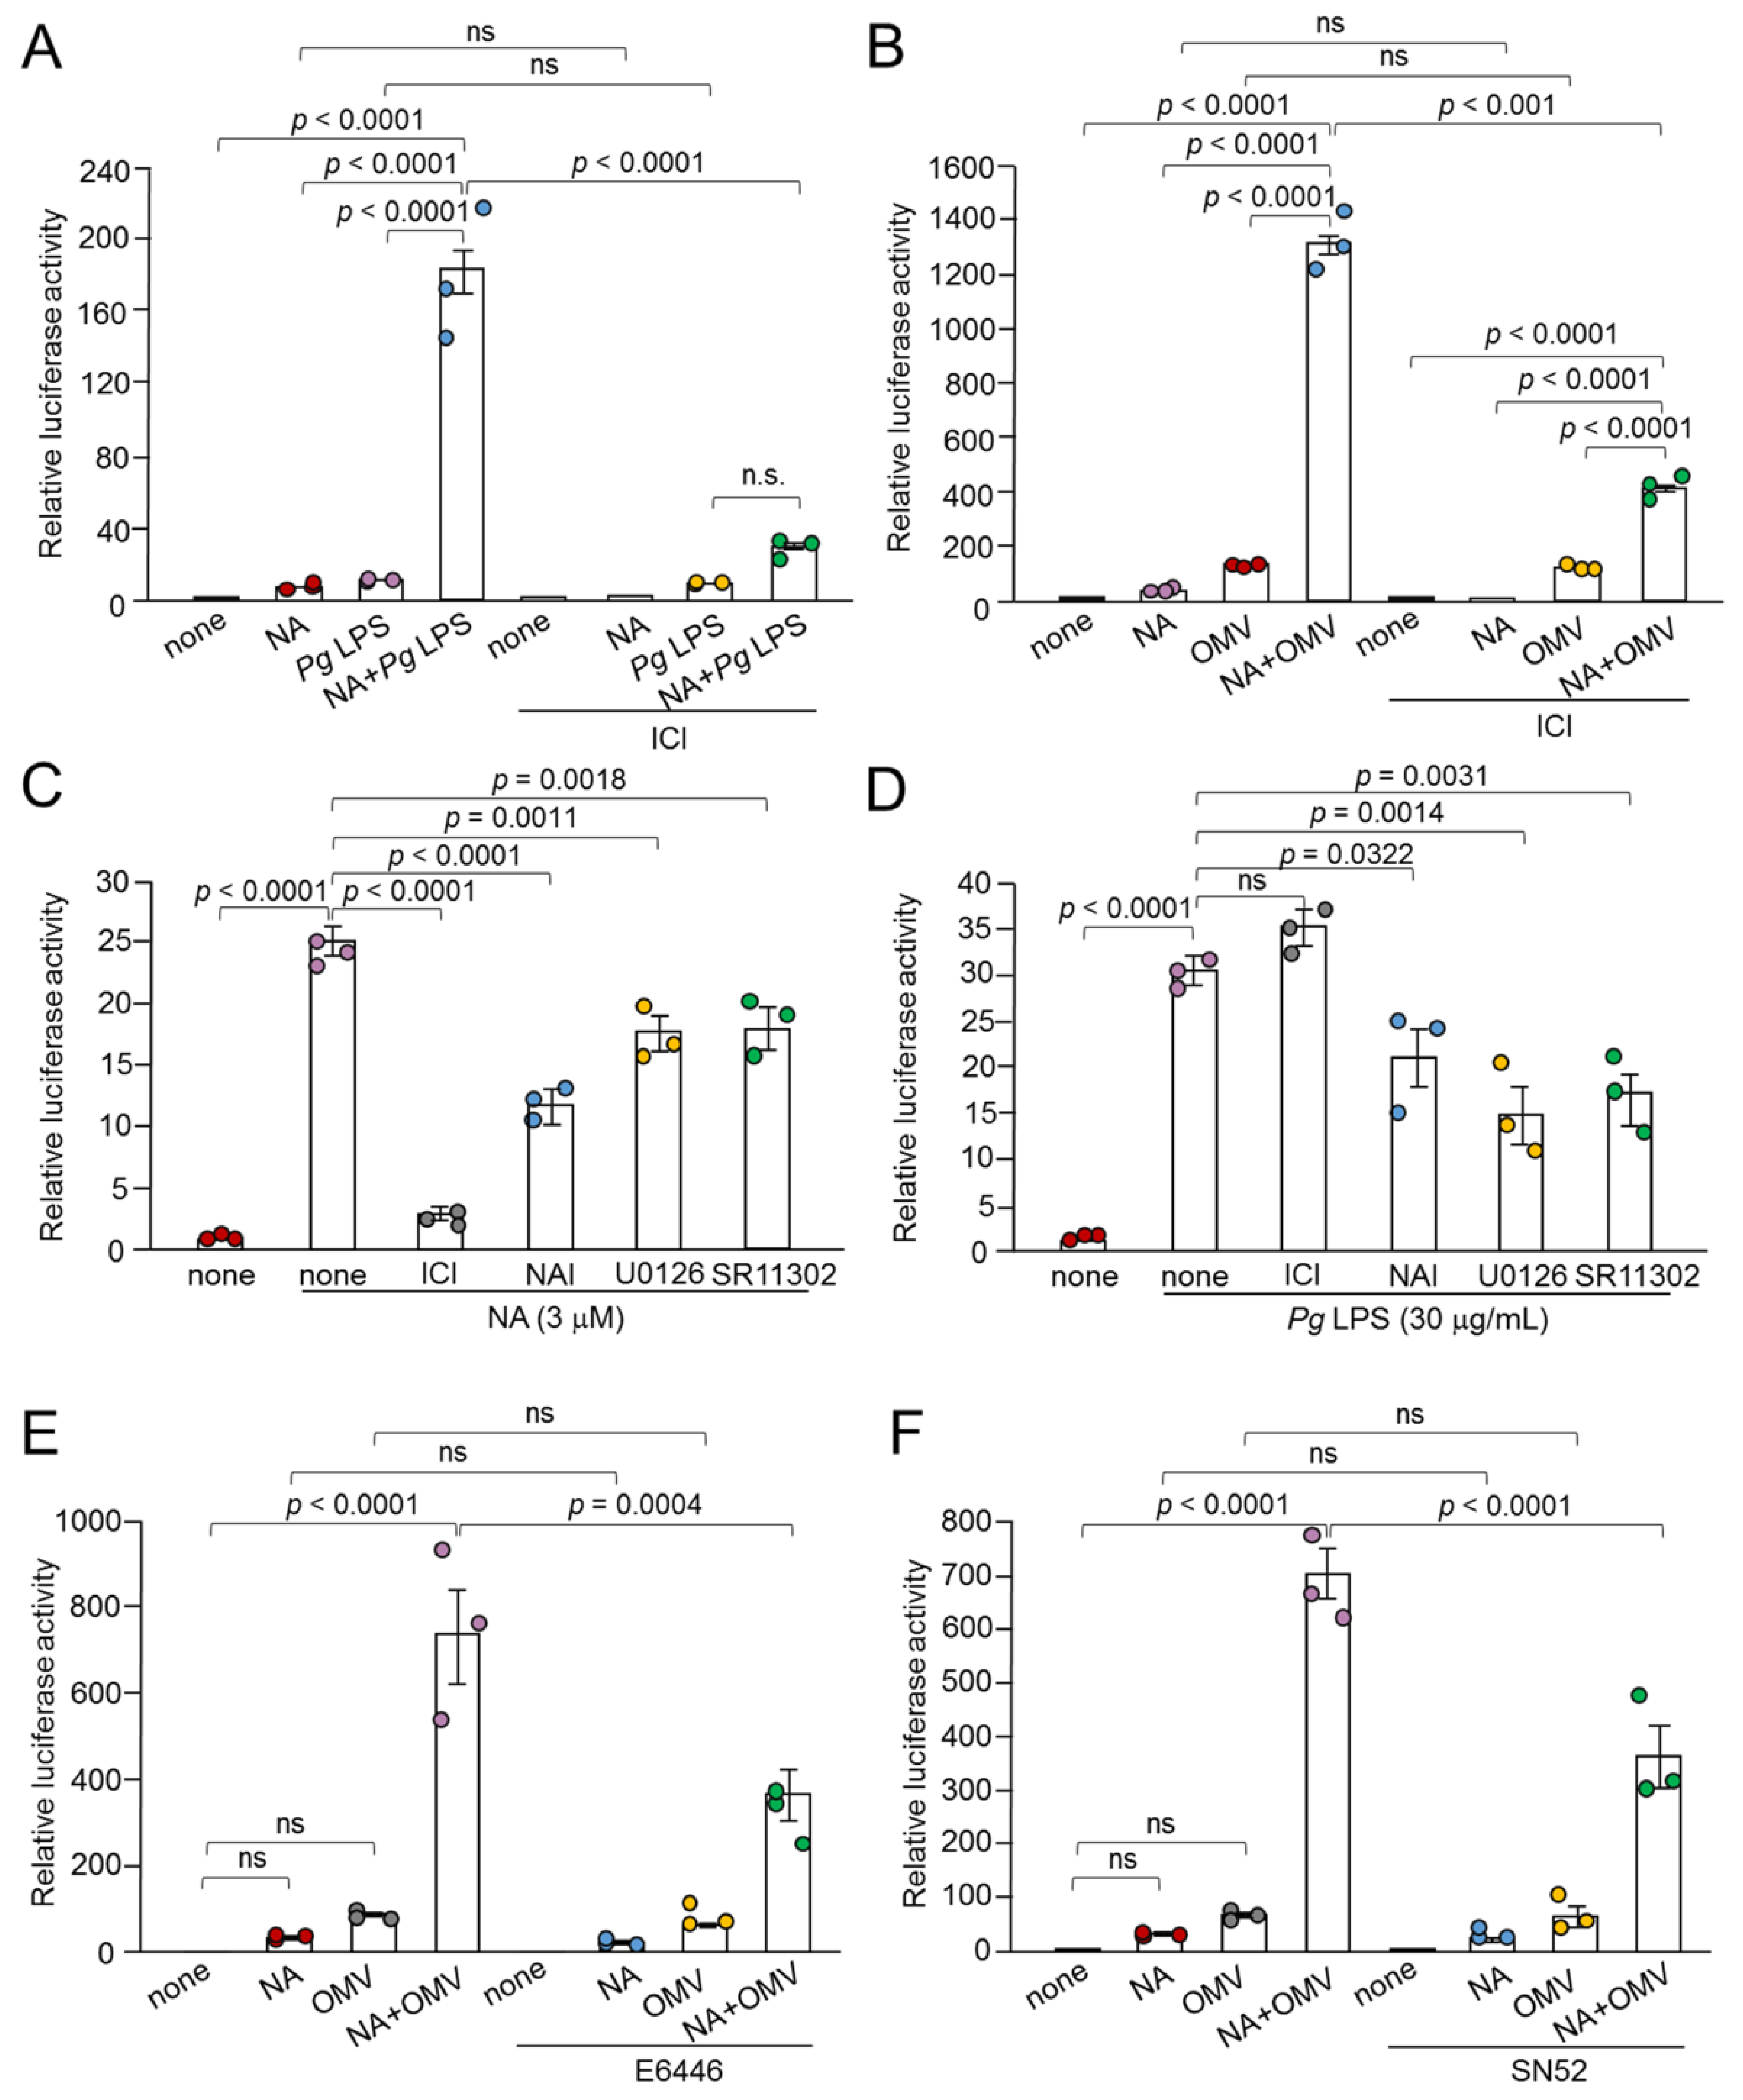
Figure 7.
Possible changes in expression levels and protein complex formation of p65 and c-Fos in BV-2 microglia following combined treatment with NA and Pg LPS. (A, B) Western blotting to analyze the protein levels of p65 (A) and c-Fos (B) in BV-2 microglia following treatment with NA and Pg LPS. (C, D) Co-immunoprecipitation combined with western blotting to analyze the interaction between p65 and c-Fos in BV-2 microglia following treatment with NA and Pg LPS. Co-immunoprecipitated samples using normal or anti-p65 IgG were subsequently subjected to western blotting using anti-p65 IgG (C) or anti-c-Fos IgG (D).
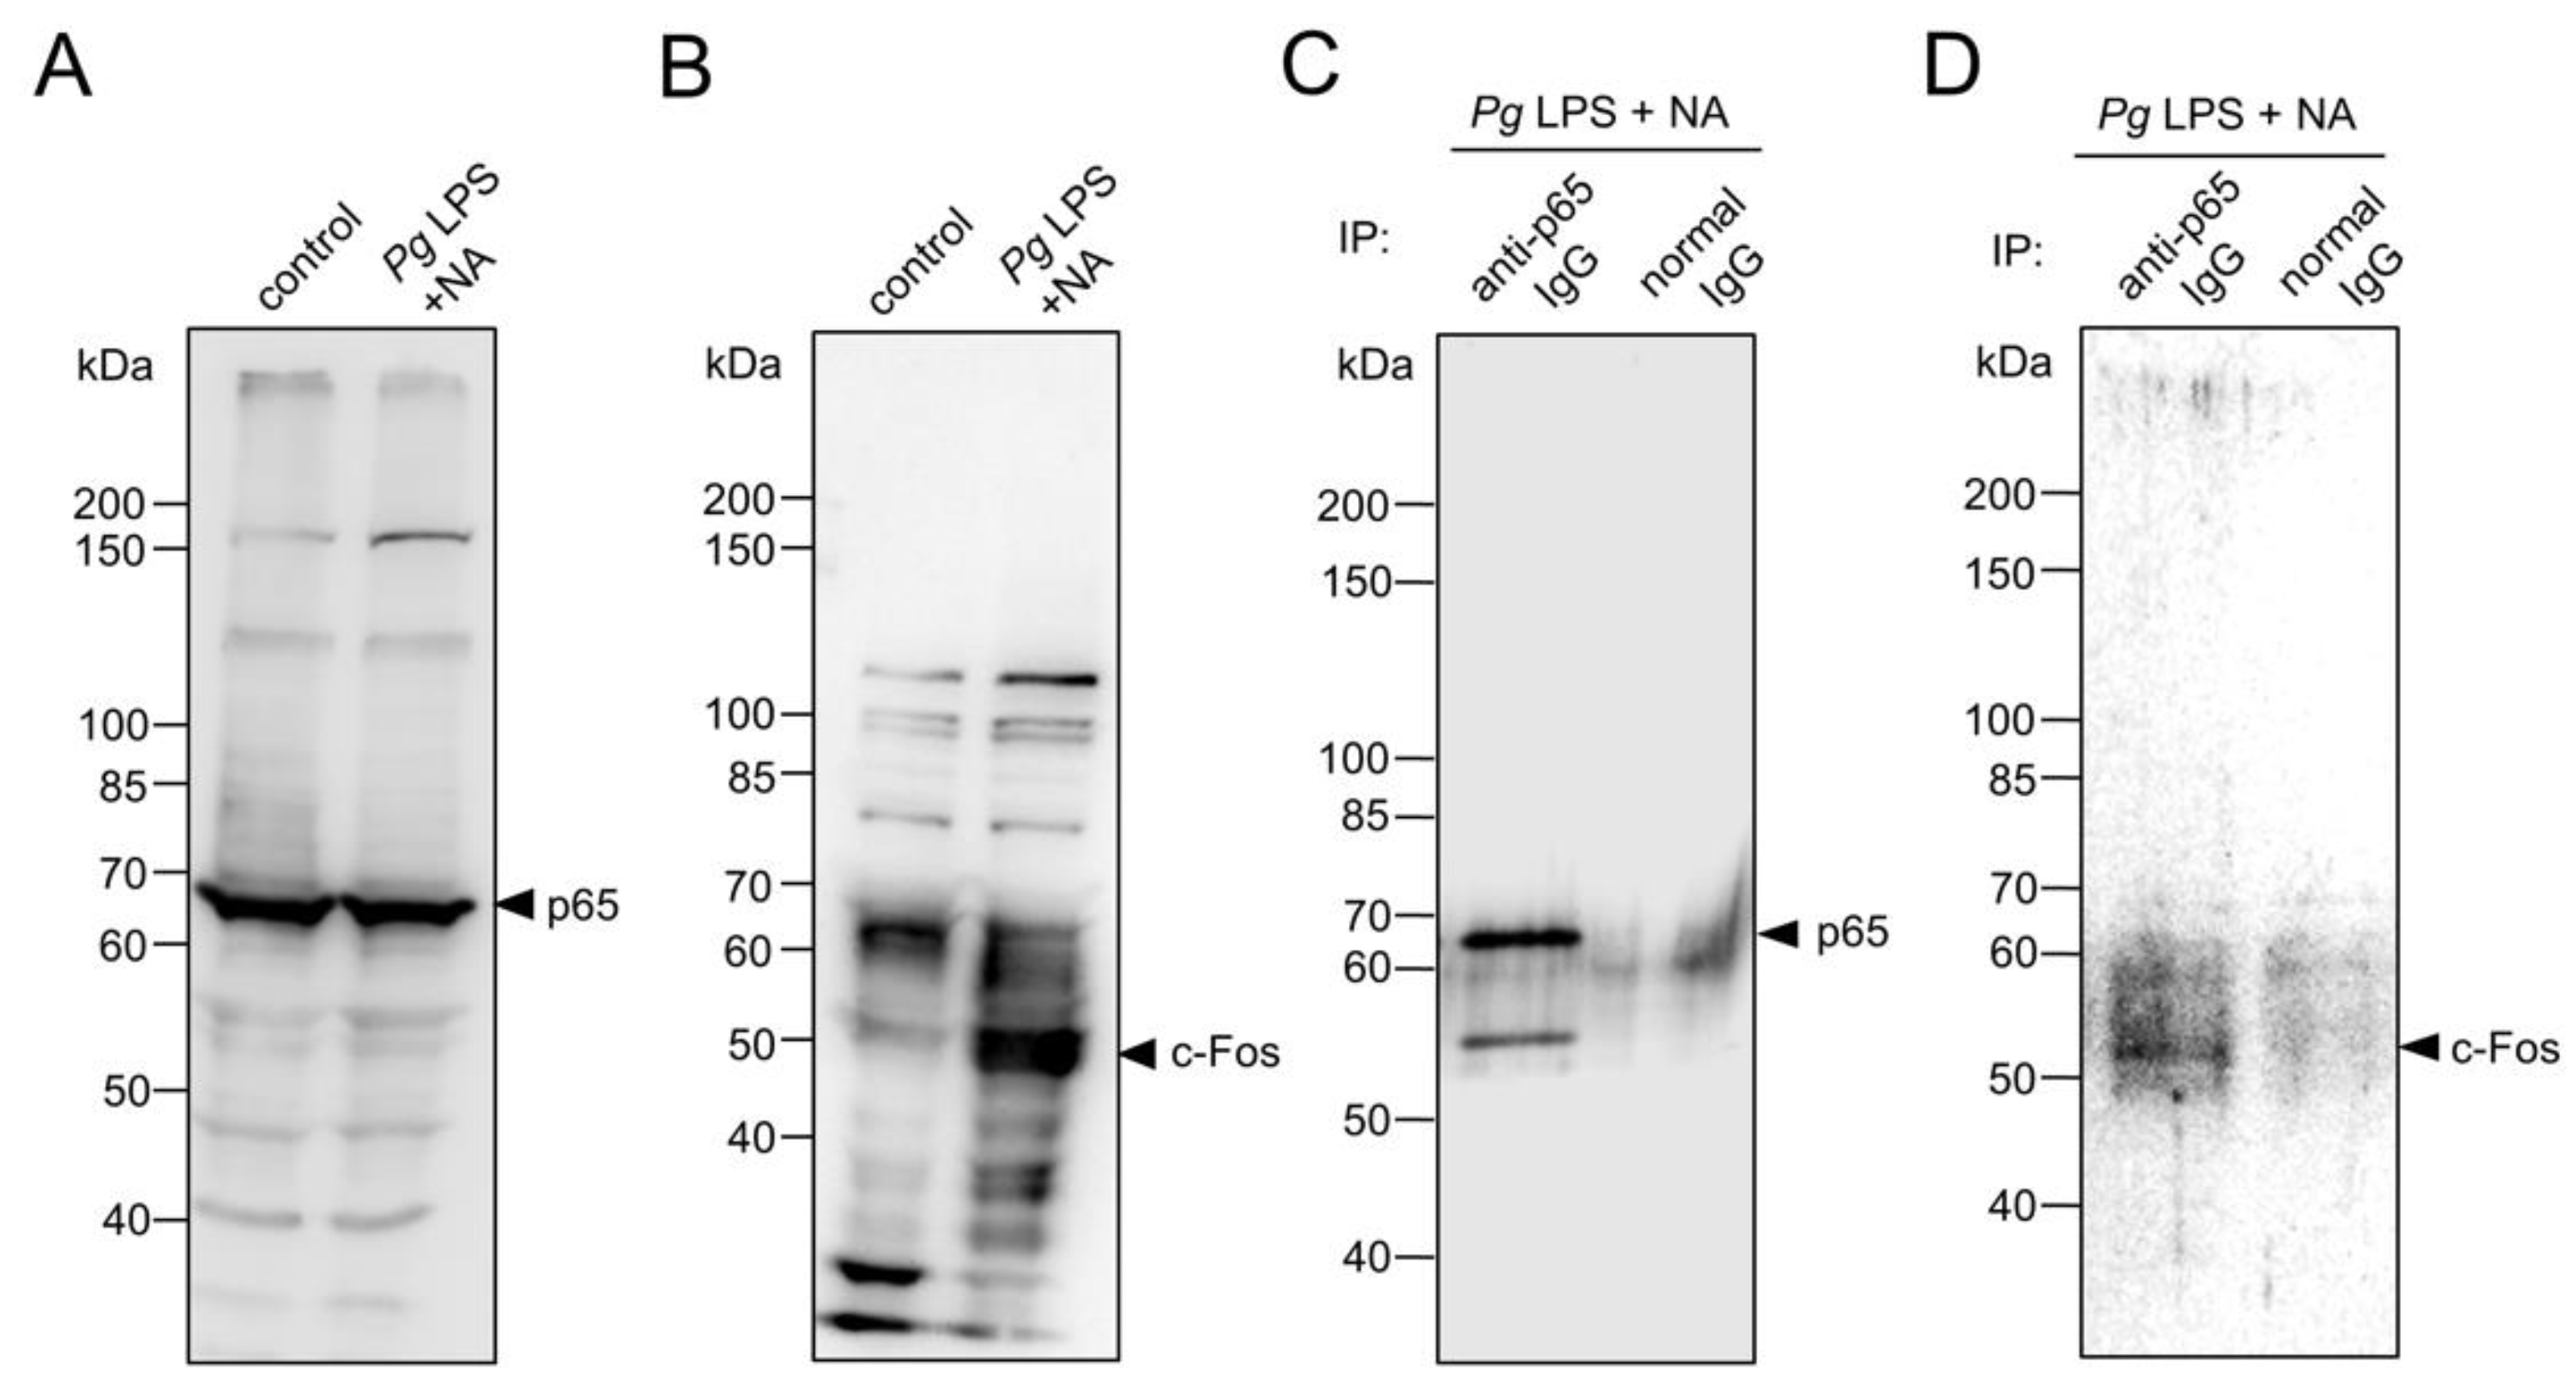
Figure 8.
Prediction of c-Fos binding to NF-κB p65:p50 heterodimer. (A) The structural model of c-Fos-bound NF-κB p65:p50 heterodimer generated using AlphaFold2, presented as a ribbon colored in their pLDDT score. c-Fos binds to the molecular surface of p65. The figure to the right shows the complex structure vertically rotated by 90° from the figure to the left. (B) PAE plots of the c-Fos and p65:p50 complex model. (C) The structural model of the p65:p50:c-Fos complex forms a composite surface for DNA recognition. For the model construction, DNA bound to the p65:50 heterodimer (PDB code 2I9T) was bound to the AlphaFold2 model of the p65:p50:c-Fos complex. The long disordered regions in the N-terminus and C-terminus of c-Fos were removed from the figure to facilitate visualization. The NF-κB of p65 and p50 are in green and light blue, respectively. c-Fos is in purple. The two DNA strands are in orange. The figure to the right shows the complex structure vertically rotated by 90° from the figure to the left. The figures were drawn using PyMOL [41].
Disclaimer/Publisher’s Note: The statements, opinions and data contained in all publications are solely those of the individual author(s) and contributor(s) and not of MDPI and/or the editor(s). MDPI and/or the editor(s) disclaim responsibility for any injury to people or property resulting from any ideas, methods, instructions or products referred to in the content. |
© 2025 by the authors. Licensee MDPI, Basel, Switzerland. This article is an open access article distributed under the terms and conditions of the Creative Commons Attribution (CC BY) license (http://creativecommons.org/licenses/by/4.0/).
Copyright: This open access article is published under a Creative Commons CC BY 4.0 license, which permit the free download, distribution, and reuse, provided that the author and preprint are cited in any reuse.


