Submitted:
03 January 2025
Posted:
06 January 2025
You are already at the latest version
Abstract
Do the intensive demonstrations result in consistent technology adoption and yield enhancement? While extension methods show significant immediate effects of an intervention, their impact may fade over time. In a government-led natural experiment in Pakistan, a long-lasting adoption of certified seeds, fertilizers and pesticides/herbicides in post-treatment years were observed by employing difference-indifferences with fixed effect method on a panel data. The intervention increased the technology adoption in terms of certified seeds by 34%, fertilizers by 15 kg/ha, and pesticides/herbicides by 0.22 l/ha among adopters for four years. Similarly, the wheat yield increased by 0.41 tons per hectare and profit by 12% among the treatment group compared to the control group. In view of these findings, the study suggests continuing this supervised method of extension to other crops in Pakistan.
Keywords:
on-farm demonstrations
; certified seeds
; technology adoption
; FE-DID
; long-lasting effect
1. Introduction
Enhancing the crop yields has been extensively debated to improve income, livelihood and poverty alleviation among small farmers of developing countries [1,2,3]. In this regard, the long-standing policies of subsidizing farm inputs have been considered ineffective in improving farm productivity [4]; and agricultural development [5]. It is also assented that economic policies should discourage subsidized inputs whose overuse damage the environment [6], distort the agricultural economy and not surely increase the output to the scale [7]. Due to the ineffectiveness of agricultural subsidies, the attention has been diverted to smart subsidies [8] with impact-based farm experimental designs [9]. The farm based experimental outcomes made the researchers agree that farmers require supervisory guidance instead of subsidized inputs in their fields to adopt modern technologies and increase yields [9,10]. In this regard, the role of governments has been considered crucial in increasing yields of small farmers through agricultural extension services [11].
The extension services in the agriculture field are meant to educate, support and provide resources to farmers and publicize solutions for the challenges they face. The Extension Agents (EAs) promote technology adoption using certified seeds, fertilizers, pesticides, row planting, and farm machinery to increase per unit yield [12]. The mode of guidance includes field farm schools, curriculum-based material, farm gatherings, and on-farm demonstrations [13] . Existing literature has discussed different extension methods to increase technology adoption, farm productivity and profitability. For example, farmers field schools increased agricultural productivity and reduced poverty [13,14,15,16]. In addition, the extension trainings to adopt certified seeds [16] and to follow row planting [17] caused a significant increase in wheat yield in Ethiopia. Similarly, video-based extensions services with role model motivator showed enhanced technology adoption in India [18]. Many studies found out that technology adoption through field experiments and extension programs helped improve the agricultural output, livelihood and income of small farmers [19,20,21].
Such extension methods and the varying outcomes they produce reflect the diverse agricultural contexts across regions. In Asia, for example, significant progress has been witnessed in increasing farmers' incomes and well-being through technological advancement. However, the pace of mechanization has been slower in South Asia compared to Southeast Asia. A study [22] by Otsuka and Fan argues that the majority of farmers in South Asia operate small farms, which limits their capacity to adopt technology and hinders intensive mechanized farming. Furthermore, many small farmers in the region are unable to afford new technologies. A few researchers in a study [23] highlights the inadequacy of agricultural extension programs in South Asia, which fail to provide farmers with the knowledge needed for sustainable and efficient farming practices.
The limitations of extension programs are not confined to South Asia; similar challenges also exist in other regions, such as Africa. Literature [24] highlighted the effectiveness of extension programs in Africa but criticized their limited coverage. Additionally, a study [25] pointed out the inefficiencies of these programs, emphasizing that while applying experimental outcomes obtained from a research field, the real-world conditions are often overlooked by extension agents (EAs). As a result, these research outcomes do not always produce the desired results when implemented by farmers.
The discussion above reveals two key problems: (i) the limited coverage of field experiments or government programs, and (ii) inefficiencies in extension methods. In the context of impact assessment of experimental studies, only immediate post-treatment effects have been observed in the literature. To address these issues, this study evaluates long-lasting impact of large-scale publicly funded program in Pakistan that utilized a least-researched extension method – on-farm demonstrations – conducted by EAs. The on-farm demonstrations involve supervised methods of technical advice and the application of results from the experiment station to the farms in a monitored environment.
On-farm demonstrations aim to increase farmers' practical exposure to new technologies, such as farm inputs and machinery.[26,27] in Ethiopia, as well as [28] in Tanzania, investigated the impact of demonstration trainings on crops’ yield and technology adoption. Their studies discovered a significant increase in technological adoption and, consequently, higher farm yields during the treatment year. However, these studies did not examine the long-lasting effects of the interventions. It has also been argued that extension services for technology adoption often fail to show long lasting treatment effect and income improvements among small farmers over time [29].
1.1. Conceptual Framework
Agriculture is the primary sector of the economy where farmers prefer traditional methods of farming based on their indigenous knowledge. However, according to the conceptual ideologies of Schultz (1964), it is asserted that traditional factors of production alone cannot increase output, until the technological inputs are applied [30]. Farmers are considered the best profit maximizers by choosing a set of inputs for higher outputs; however, they need technical transformation in their farming methods for higher returns [30]. In the same way, it is also argued that merely increasing the fertilizer quantities, supplying certified seeds, and providing subsidies do not necessarily boost agricultural production, rather their unchecked excessive use harm the environment [8]and disequilibrates the agricultural economy [7]. Understanding these facts, many economists have shifted their focus to field experiments[19]. Various field experiments indicated that the proper application of farm inputs, coupled with supervisory approach encourage behavioral changes in farming decisions to adopt technology. If timely supply of inputs is ensured, the supervisory experiments significantly increase both production and farmers’ return [10,19]. In this context, empirical literature highlights the importance of demonstrating farming practices under careful supervision and guidance to achieve better outcomes. Building on this, the current study postulates the following hypothesis:
- Hypothesis 1: The on-farm demonstration will increase the technology adoption (certified seeds, fertilizers, pesticides and herbicides and mechanized farming), yield and profit during the treatment year.
- Hypothesis 2: There will be long lasting treatment effect, observed through technological adoption of inputs, increased yield and profitability.
In this study, technology refers to the use of machinery, certified seeds, fertilizers, pesticides and herbicides. It is hypothesized that small farmers will be motivated to adopt new technologies if the adoption led to higher yields, reduced costs, and increased profits [31,32]. In the subsequent post-treatment years, farmers' choice of input type and quantity will indicate whether farmers have maintained the practices they adopted during the treatment period
2. Materials and Methods
2.1. Experiment Design – Wheat Productivity Enhancement Program (WPEP)
In Pakistan, the small farmers were barely benefitted through extension services due to the biased designs and approach of programs towards large farmers [33]. It resulted in low technology adoption and wheat yield among the small farmers. Hence, to promote technology adoption, enhance wheat yield and profits of small farmers, a wheat productivity enhancement program was implemented in Punjab, Pakistan in 2019. The target to enhance wheat yield was set up to 0.69 (t/ha) by the government. The program also revamped the extension services delivery in the shape of on-farm demonstrations. The demonstrations included the following:
The presence of EAs was mandatory at each step of application of inputs until harvesting. Overall, the growth of crop was closely monitored until harvesting i.e., end of April.
2.1. Study Site
We selected Faisalabad purposively1 as a study site due to being (i) the second largest district in wheat production in Punjab, (ii) canal-irrigated, (iii) less prone to weather changes.
The total area of Faisalabad district is 5856 square kilometers. The treatment area spread between longitude 73° and 72° East, and latitude 30° and 31.9° north. The location of each treated farm was recorded by the Extension Department during treatment whereas the control group was recorded by the survey team during data collection, shown in Figure 2. The shortest distance between the two closest points (of control and treatment) was 2 kilometers. There was almost less chance of spillover effect during the treatment due to anonymity of the treatment as well as the unfamiliarity of farmers with each other.
2.1. Randomization of farms
The program was advertised by the Extension and Adaptive Research Department, Punjab in the newspapers and on the official website to participate in the program. There was a pre-decided eligibility criteria i.e. (i) land ownership from 2 – 5 hectares, (ii) demonstration land near to bricked road, (iii) land irrigated by canal, (iv) farmers registered with the agriculture extension department. This intervention complied with all assumptions of randomization from eligible population to treatment assignment and data collection as described by [34]. Hence, its external validity was ensured at an initial level when people applied for the program.
After scrutiny of applications, 253 small farmers met the criteria to participate in the program, which validated the internal validity. The agriculture department conducted an electronic lottery through which 123 farmers were assigned to treatment group and the rest 130 were considered as control group. The randomly selected farmers were informed on their mobile through text messages. These on-farm demonstrations imparted on the randomly selected farms are a first trial of its kind in Pakistan.
2.1. Data
This study has used both primary and secondary data sources. The primary data for the control group was collected by the authors and survey team hired from Pakistan Bureau of Statistics (PBS) based on recall method2. In addition to the baseline, the three years’ observational secondary data for the treatment group was acquired from the Extension and Adaptive Research Department3 and for the remaining one year was collected by the survey team. The departmental data included a list of participants with their village’s addresses, age, land size, seed type, input quantities, sowing and harvesting dates and yield of all demonstrated farms. Further, the revenue and profit were computed for both groups considering the costs of inputs4. In doing so, we tried to avoid respondents’ bias in self-reporting the cost and quantities’ data to maximum extent by matching them with the wholesale rates of the nearest markets [35].
2.1. Balance Check of baseline data
Table 2 demonstrates the balance checks of the household characteristics, farm inputs, yield and other financial variables at the baseline between the treatment and control groups using the t-test:
Differences of all demographic characteristics such as age, education, family size, family’s education, farm size, farming asset (tractor), type of irrigation and distance from road of both groups are statistically insignificant before treatment. The insignificant differences between covariates, quantities and costs of farm inputs ensure similar distribution of all characteristics in population which eliminates the potential influence of confounding variables on the results.
Another important concern that natural experiments face is attrition which we have not found in this study. The farmers of both groups have been living in the same place for generations and the extension department does have their residential and farm addresses. Further, the department assured us that there was barely any chance of spillover effect as the people belonging to both groups spread across the district because they were randomly chosen with lottery and live in different villages.
2.1. Estimation Model
In view of our panel data collection and implementation of randomization to maximum extent, we used Fixed Effects with Differences-in-Differences (FE-DiD) model to examine long lasting effect of treatment. We expect that FE-DiD would potentially reduce unobserved heterogeneity in the sample [36] by using the following equation:
Where is the dependent variable i.e. yield, technology inputs and profit, are the fixed time-invariant characteristics of farmers (capacity or individual characteristics), is the time-specific fixed effects (unobserved time-specific factors, weather etc.) for each year t, is the treatment effect and is the treatment status of each farmer, are the covariates (age, education, family size etc.), and is the error term. [37] has argued that the literature supported using the DiD wherever one pre-treatment data is available.
3. Results
Table 3 presents the FE-DID estimation results of the treatment on technology inputs i.e. certified seeds, fertilizers, pesticides/herbicides, and machinery usage. Column-1 presents the immediate treatment effect and column 2 presents the average of 2020-23. All treated farmers used certified seeds in the first treatment year reflecting an increase of 61% from the baseline whereas the average usage was found to be increased by 34% during 2020-23. Similarly, the quantities of fertilizer and pesticides/herbicides increased by 14.7 kg/ha and 0.22 l/ha respectively in the treatment group in 2020. The treatment effect remained consistent and significant during 2020-23 on both inputs. However, the usage of machinery in terms of cost was significant in 2020 at 5% and later was found to be insignificant, depicting an equal use of machinery by both groups.
Table 4 presents the FE-DID estimation results of the treatment on wheat-yield, cost of production and profit with ‘year’ and ‘households’ fixed effects for each variable in each year. For the year 2020 in column 1, the treatment effect is statistically significant at 1% for yield, cost of production and profit. The treatment effect for all variables remained consistent during the next four years as shown in column 2. The treatment has caused to increase the yield by 0.37 t/ha among treated farmers making it 4.99 t/ha in 2020. Similarly, the average yield for four years was estimated at 5.09 t/ha among the treated farmers i.e., 0.41 t/ha higher than the control group.
During the treatment year, the higher use of inputs caused the increase the cost of production as well as generated higher revenues due to increased yield. The consistently higher yields and revenues coupled with the declining cost of production for four years kept the profits higher among treatment group.
Figure 2 presents the treatment effect over the four years on yield. In figure 2, we tested the treatment effect at 95% significance level and found positive and significant changes in coefficients for all subsequent years. The year-on-year treatment effect was highest at 0.15 t/ha from 2022 to 2023. On average, it depicts a long-lasting post treatment effect over the period of four years.
4. Discussion
From the above findings, we observed that the on-farm demonstrations have been effective in technology adoption, enhancing yield and earning profits among the treatment group. In the context of demonstration extension methods, our results are in line with the relevant studies [26,27,28]. The significant factors in making the demonstration method successful include the timely delivery of inputs, accessibility to information via extension agents [26], communicative EAs, targeting the non-model farmers [27] and demonstrating the multiple technologies to farmers [28]. In this regard, at first the EAs of our experimental study ensured the prior availability of all farm inputs before demonstration to be carried at each step such as at certified seeds at sowing time, time management for combined application of fertilizers with irrigation, pesticides application after observing the crop health and so on. Secondly, this program involved a random group of farmers across the district of approx. 6000 square kilometers, which was larger than the areas of earlier studies. Thirdly, the convincing role of EAs led the farmers to use only recommended types of inputs which delivered compelling results in yield enhancement, increased technology adoption and profitability. In contrast, despite the EAs trained prior to the demonstration experiment by [27],it could not increase the crop’s yield significantly but did the multiple technologies adoption. This contrasting fact signified the field expertise of EAs and the novelty of program design in delivering impactful results. Further elaboration of each section is given below:
4.1. Technology Adoption
Depending upon the experimental designs [38]combined with advanced extension services, resulting in a higher technology adoption [39,40] . In our study, the certified seeds adoption was mandatory on demonstration plots. The EAs verified the authenticity of the certified seeds before demonstrating their application in the field. For that reason, both factors, being inseparable, played a significant role in 100% adoption of certified seeds in 2020. The adoption during 2020-23 was found to be 84% which showed encouraging and long-lasting treatment effect in view of better result demonstrability. A slight decline in the use of certified seeds on average during 2020-23 can be attributed to the regulatory policy (Ministry of National Food Security and Research, 2021) announced to discourage the use of informal/conventional seeds. It created excess demand and caused a shortage of certified seeds. In this regard, it is inferred that the certified seeds adoption requires more attention in the country as also highlighted by [41] . This study has found that the adoption of certified seeds remained 34% higher in treatment group compared with the control group in overall four years’ effect, indicating a promising trend in technology adoption through on-farm demonstration.
The use of fertilizers and pesticides/herbicides remained higher and consistent in all years among the treated group showing a long-lasting treatment effect. According to the Food and Agriculture Organization (FAO), the recommended quantity of fertilizer for wheat in irrigated areas of Pakistan is 195 – 330 kg/ha. As earlier discussed in a time series analysis [41] that the current fertilizer off-take in the country was encouraging in positively contributing to the wheat crop which was lower previously. In this study the average fertilizer usage by the treatment group is 260 kg/ha which is aligned with the FAO recommendations. The difference between the quantities of fertilizers used by both groups is not very wide, however the impact is significant for the treatment group. It reflected the efficiency and effectiveness of demonstrations imparted by the EAs in terms of suitable timings, quantities and methods to apply fertilizers. The fertilizer use at baseline was 240 kg/ha which kept on increasing over the years. Though the upper bound of fertilizer offtake is still within the recommended range yet it is advisable that EAs must educate the small farmers about the harmful effects of excess fertilizer for soil fertility, biodiversity, water and air quality [42].
Moreover, a study [43] in Pakistan recommended 1.2 l/ha of pesticides for the wheat crop whereas in terms of efficiency 1.0 l/ha of herbicides was recommended [44] for wheat crops. Hence, the combined quantity of pesticides and herbicides (sprays) used by the treated farmers is within the recommended dosage. The difference between the quantity used by the treated farmers is 0.22 l/ha slightly higher than the control group. The significant impact of sprays was obtained due to the close monitoring of the crops and the right timing of the application of sprays by the EAs among treated farmers. Hence, the same quantity of the sprays used by the small farmers over the four years showed a significant and long-lasting treatment effect.
Regarding machinery usage, it is asserted that mechanized farming has been significantly increased in Pakistan since 2014 [45]. The use of harvesters and threshers has become very common since the last decade that majority of farmers used them as replacement for labor. Our study has witnessed that the treatment effect for machinery usage was significant in the first treatment year at 5% significance level due to the use of few extra machines but later the difference became insignificant between both groups. The literature acknowledged the wide use of farm machinery in Punjab in the context of higher net incomes [46], time efficient and less grain-loss [47], and increased productivity [48]. In this context, our study also depicts the positive outlook of technology adoption in Pakistan.
4.1. Yield Enhancement
Proper land preparation, pertinent choice of certified seeds, in-time application of fertilizers, chemicals and sprays and holistic farming practices ensure a higher yield of crops and income [49]. The small farmers though are experienced and have indigenous knowledge of farming, but they need proper guidance in right selection of type and quantities of inputs in this dynamic market system [10]. Understanding the fact, the full package of farming instructions through demonstrations and guidance by the EAs has significantly increased the yield of treated farmers up to 4.99 t/ha in 2020 and 5.09 t/ha during 2020-23. On the other hand, the per year change in yield during 2021 and 2022 was not significantly different than the control group due to shortage of certified seeds in 2022 as depicted in figure 2 (event study). Although, it kept up pace in 2023, yet the follow up of the treatment is always advised for a steady and consistent treatment effect [50].
Regarding the yield in 2023, it was asserted by that Faisalabad district recorded an average yield of 5.4 t/ha in 2023 [51] which is higher than the national average of 3.5 t/ha for the same year. It used remote sensing technology which has become an essential tool in monitoring and recording crop production, offering reliable and accurate data for agricultural management [52]. It evidences that our results are not different from [51]. However, our study reinforces the role of human based monitoring through EAs. Their interaction proved to be more impactful by demonstrating practices, minimizing farmers’ apprehension for technology adoption, and offering guidance as required by the small farmers, which helped in achieving higher yields.
4.1. Profitability and Cost of Production
In developing countries, small farmers are more likely to invest in new agricultural technologies, anticipating better yield, income and profit [53]. Sometimes they bear extra cost to get better and stable yield [54]as we also observed in our study. The treatment group recorded higher profits resulting from higher yields though incurred higher cost of production due to technology adoption as compared with the control group in all years. It shows a consistent treatment effect. It is pertinent to note that none of the demonstration-related studies examined the income or profit of the small farmers. The significance of our study lies in the fact that we computed the profitability of small farmers as the financial values better measure the worth of a produce and what small farmers eyeing for. The selling price of the produce in a competitive market determined the net benefit, which depicted the improved or deteriorated well-being of the farmers. In our study, the treated farmers remained profitable in all years, which reflected their improved well-being.
In view of the above, we accept our null hypothesis that:
- Hypothesis 1: The on-farm demonstration has encouraged the technology adoption (certified seeds, fertilizers, pesticides/herbicides and mechanized farming), increased the yield and profit in the first post-treatment year.
- Hypothesis 2: The long-lasting treatment effect in technology adoption was observed in certified seeds, fertilizers, and pesticides/herbicides but not in machinery usage. The wheat yield and profit also showed a long-lasting treatment effect.
Precisely, this study contributes to the literature by displaying a cogent program design which targeted random small farmers and engaged them by demonstrating the appropriate farming practices at each step. The on-farm demonstrations encouraged the adoption of certified seeds, fertilizers, pesticides/ herbicides and farm machinery. Besides, this experimental study estimated the long-lasting treatment effect for four years which has been overlooked in the literature. Ultimately, the success of this intervention emphasizes the significance of involving a wider range of small farmers in the natural experiment and the ability of well-supported EAs to drive meaningful agricultural improvements.
5. Conclusions
Existing literature primarily focuses on the short-term effects of on-farm demonstrations on yield and technology adoption, without addressing income or profitability impacts for small farmers. This study fills that gap by analyzing a public program taking on-farm demonstrations as treatment by assessing both immediate and long-lasting effects on small farmers of Faisalabad. This study is the first to assess the causal impact of a public agricultural intervention in Pakistan, using a Fixed Effects Difference-in-Differences (FE-DID) estimation approach. The results show that on-farm demonstrations had a significant and long-lasting impact on three key outcomes: technology adoption, wheat yields, and farmer profits. Notably, treated farmers consistently displayed higher technology use compared to the control group, resulting in increased wheat yields and long-term profitability.
These findings make several contributions to existing literature. First, they provide robust evidence of the effectiveness of on-farm demonstrations in improving agricultural outcomes, an area of study with limited empirical research, particularly in the context of developing countries. Second, they highlight the potential of scaling up such interventions to other crops in Pakistan and similar regions worldwide, addressing the broader challenge of enhancing agricultural productivity in resource-constrained settings. Based on the results, we recommend conducting a province-wide causal impact assessment of this program, encompassing all districts in Punjab. Such an analysis would account for demographic variations and heterogeneous resource constraints, providing insights into differential impacts across districts. This evidence could inform more targeted and effective agricultural policies. Secondly, while conducting extension programs, the farmers should be educated about the minimum and maximum use of seeds, fertilizers and pesticides/ herbicides for better output, environmental preservation and cost effectiveness. Thirdly, the supply of certified seeds and fertilizers should also be ensured at the input-application time. A comprehensive package of demonstrations of expertise and input supplies will generate impactful outcomes of the extension program.
Author Contributions
Conceptualization, N.H. and K.L.M.; methodology, N.H. and K.L.M.; software, N.H. and K.L.M.; validation, N.H. and K.L.M.; formal analysis, N.H. and K.L.M.; investigation, N.H. and K.L.M.; resources, K.L.M..; data curation, N.H.; writing—original draft preparation, N.H. and K.L.M.; writing—review and editing, N.H. and K.L.M.; visualization, N.H. and K.L.M.; supervision, K.L.M.; project administration, N.H. and K.L.M.; funding acquisition, K.L.M. All authors have read and agreed to the published version of the manuscript.
Data Availability Statement
The project document is available with the authors that can be made available upon reasonable request after approval from Ministry of Planning, Development and Special Initiatives, Government of Pakistan.
Acknowledgments
We acknowledge the support extended by the Agriculture Officer (Mr. Muhammad Awais), Faisalabad Agriculture Extension Department in supplying baseline data of the treated and control groups’ farmers.
Conflicts of Interest
The authors declare no conflict of interest.
Abbreviations
The following abbreviations are used in this manuscript:
| PBS | Pakistan Bureau of Statistics |
| WPEP | Wheat Productivity Enhancement Project |
| 1 | The treatment data was compiled by the Extension officers. The project document
is available with the authors that can be made available upon reasonable
request after approval from Ministry of Planning, Development and Special
Initiatives, Government of Pakistan. |
| 2 | Note: This natural study relies on recall data (particularly for control group) which has been a common practice in development economic research [55,56]. Though [57,58] emphasized that recall data for more than ten years must not be used for research or descriptive analysis. The face-to-face surveys with different options/prompts increase the precision in data collection. In addition, [21] has used recall data for two years in a similar study. Keeping in view these considerations, our survey team has effectively collected data from the control group for all variables. |
| 3 | The data maintenance for two
post-treatment years was the official requirement whereas for the later years
was recorded on the request of the researcher. |
| 4 | The revenue is the total
amount received by the farmers after selling their produce. Profit is obtained
by subtracting the total cost of production from revenue. The total cost of
production includes all imputed and paid out costs (for inputs and machinery). |
References
- M. A. Altieri. Small farms as a planetary ecological asset : five key reasons why we should support the revitalisation of small farms in the Global South. Third World Network, 2008. [Google Scholar]
- R. Heltberg. Rural Market Imperfections and the Farm Size-Productivity Relationship: Evidence from Pakistan. 1998. [Google Scholar]
- S. Wiggins, J. Kirsten, and L. Llambí. The Future of Small Farms. World Dev 2010, 38, 1341–1348. [Google Scholar] [CrossRef]
- Dorward. RETHINKING AGRICULTURAL INPUT SUBSIDY PROGRAMMES IN A CHANGING WORLD Paper prepared for the Trade and Markets Division, Food and Agriculture Organization of the United Nations. 2009. [Google Scholar]
- P. Timmer. Food Security and Economic Growth: An Asian Perspective. 2004. Available online: http://ssrn.com/abstract=1112795.
- World Development Report 2008 (Overview) : Agriculture for Development; The World Bank, 2007.
- K. Anderson, G. Rausser, and J. Swinnen. Political Economy of Public Policies: Insights from Distortions to Agricultural and Food Markets. Journal of Economic Literature 2013, 51, 423–477. [Google Scholar] [CrossRef]
- M. Morris, V. A. Kelly, R. J. Kopicki, and D. Byerlee. Fertilizer Use in African Agriculture Lessons Learned and Good Practice Guidelines. 2007. [Google Scholar]
- D. J. Hemming et al. Agricultural input subsidies for improving productivity, farm income, consumer welfare and wider growth in low- and lower-middle-income countries: a systematic review. Campbell Systematic Reviews 2018, 14, 1–153. [Google Scholar] [CrossRef]
- E. Duflo, M. Kremer, and J. Robinson. Nudging farmers to use fertilizer: Theory and experimental evidence from Kenya. American Economic Review 2011, 101, 2350–2390. [Google Scholar] [CrossRef]
- P. B. R. Hazell. Is there a future for small farms? Agricultural Economics 2005, 93–101. [Google Scholar] [CrossRef]
- K. E. Davis, S. C. Babu, and C. Ragasa. Agricultural extension: Global status and performance in selected countries: Synopsis. 2020. [Google Scholar] [CrossRef]
- G. Feder, A. Willett, and W. Zijp. Agricultural Extension-Generic Challenges and Some Ingredients for Solutions.
- X. Irz, L. Lin, C. Thirtle, and S. Wiggins. Agricultural productivity growth and poverty alleviation. Development Policy Review 2001, 19, 449–466. [Google Scholar] [CrossRef]
- D. Pan and N. Zhang. The Role of Agricultural Training on Fertilizer Use Knowledge: A Randomized Controlled Experiment. Ecological Economics 2018, 148, 77–91. [Google Scholar] [CrossRef]
- K. M. Wonde, A. S. Tsehay, and S. E. Lemma. Training at farmers training centers and its impact on crop productivity and households’ income in Ethiopia: A propensity score matching (PSM) analysis. Heliyon 2022, 8. [Google Scholar] [CrossRef]
- D. G. Gelu and G. G. Gebre. Impact of adopting wheat row planting on yield among smallholder farmers in Dawuro Zone, Southwestern Ethiopia. Environ Dev Sustain 2023, 25, 13149–13169. [Google Scholar] [CrossRef]
- T. Baul, D. Karlan, K. Toyama, and K. Vasilaky. Improving smallholder agriculture via video-based group extension. J Dev Econ 2024, 169. [Google Scholar] [CrossRef]
- E. Duflo, M. Kremer, and J. Robinson. How high are rates of return to fertilizer? Evidence from field experiments in Kenya. American Economic Review 2008, 482–488. [Google Scholar] [CrossRef]
- M. K. Maredia, B. Shankar, T. G. Kelley, and J. R. Stevenson. Impact assessment of agricultural research, institutional innovation, and technology adoption: Introduction to the special section. Food Policy 2014, 44, 214–217. [Google Scholar] [CrossRef]
- Y. Nakano, T. W. Tsusaka, T. Aida, and V. O. Pede. Is farmer-to-farmer extension effective? The impact of training on technology adoption and rice farming productivity in Tanzania. World Dev 2018, 105, 336–351. [Google Scholar] [CrossRef]
- Agricultural Development New Perspectives in a Changing World Edited by Keijiro Otsuka and Shenggen Fan.
- S. Chandra Babu and P. K. Joshi. Public Food Policy and Global Development series. Available online: http://www.store.elsevier.com.
- O. Eric, A. A. Prince, A. Naa, and A. Elfreda. EFFECTS OF EDUCATION ON THE AGRICULTURAL PRODUCTIVITY OF FARMERS IN THE OFFINSO MUNICIPALITY. 2014. Available online: http://www.journalijdr.com.
- S. Wesley, M. Faminow, and A. Development Bank. Background Paper: Research and Development and Extension Services in Agriculture and Food Security ASIAN DEVELOPMENT BANK. vol. 425. 2014. Available online: https://ssrn.com/abstract=2558920Electroniccopyavailableat:https://ssrn.com/abstract=2558920www.adb.orgElectroniccopyavailableat:https://ssrn.com/abstract=2558920Electroniccopyavailableat:https://ssrn.com/abstract=2558920.
- From Agricultural Experiment Station to Farm: The Impact of the Promotion of a New Technology on Farmers’ Yields in Ethiopia. 2020.
- Yitayew, A. Abdulai, Y. A. Yigezu, T. T. Deneke, and G. T. Kassie. Impact of agricultural extension services on the adoption of improved wheat variety in Ethiopia: A cluster randomized controlled trial. World Dev 2021, 146. [Google Scholar] [CrossRef]
- G. Mgendi, S. Mao, and F. Qiao. Does agricultural training and demonstration matter in technology adoption? The empirical evidence from small rice farmers in Tanzania. Technol Soc 2022, 70. [Google Scholar] [CrossRef]
- R. Stewart, L. Langer, N. Rebelo, D. Silva, and E. Muchiri. Systematic Review Summary 6 Effects of training, innovation and new technology on African smallholder farmers’ economic outcomes and food security. 2016. [Google Scholar]
- T. W. Schultz. Changing Relevance of Agricultural Economics. Journal of Farm Economics 1964, 46, 1004. [Google Scholar] [CrossRef]
- E. Jakku and P. J. Thorburn. A conceptual framework for guiding the participatory development of agricultural decision support systems. Agric Syst 2010, 103, 675–682. [Google Scholar] [CrossRef]
- “Li et al 2020”.
- M. Abbas, T. E. Lodhi, K. Mahmood Aujla, and S. Saadullah. Agricultural Extension Programs in Punjab, Pakistan. 2009. [Google Scholar]
- E. Duflo, R. Glennerster, and M. Kremer. Using Randomization in Development Economics Research: A Toolkit. 2006. [Google Scholar]
- Dillon and E. Mensah. Respondent biases in agricultural household surveys. J Dev Econ 2024, 166. [Google Scholar] [CrossRef]
- J. D. Angrist and J.-S. Pischke. Mostly Harmless Econometrics: An Empiricist’s Companion. 2008. [Google Scholar]
- P. J. Ferraro and J. J. Miranda. Panel data designs and estimators as substitutes for randomized controlled trials in the evaluation of public programs. J Assoc Environ Resour Econ 2017, 4, 281–317. [Google Scholar] [CrossRef]
- J. Bonan et al. Social interaction and technology adoption: Experimental evidence from improved cookstoves in Mali. World Dev 2021, 144. [Google Scholar] [CrossRef]
- Abdulai, W. E. Huffman, and C. F. Curtiss. The diffusion of new agricultural technologies: The case of crossbred-cow technology in Tanzania. Am J Agric Econ 2005, 87, 645–659. [Google Scholar] [CrossRef]
- Ragasa and J. Mazunda. The impact of agricultural extension services in the context of a heavily subsidized input system: The case of Malawi. World Dev 2018, 105, 25–47. [Google Scholar] [CrossRef]
- Rehman, A. A. Chandio, I. Hussain, and L. Jingdong. Fertilizer consumption, water availability and credit distribution: Major factors affecting agricultural productivity in Pakistan. Journal of the Saudi Society of Agricultural Sciences 2019, 18, 269–274. [Google Scholar] [CrossRef]
- S. H. Chien, L. I. Prochnow, and H. Cantarella. Chapter 8 Recent Developments of Fertilizer Production and Use to Improve Nutrient Efficiency and Minimize Environmental Impacts; Academic Press Inc., 2009. [Google Scholar] [CrossRef]
- M. Yahya, N. A. Saeed, S. Nadeem, M. Hamed, and S. Shokat. Role of wheat varieties and insecticide applications against aphids for better wheat crop harvest. Pak J Zool 2017, 49, 2217–2225. [Google Scholar] [CrossRef]
- S. Fahad et al. Comparative Efficacy of Different Herbicides for Weed Management and Yield Attributes in Wheat. Am J Plant Sci 2013, 4, 1241–1245. [Google Scholar] [CrossRef]
- T. Ur Rehman, M. Usman Khan, M. Tayyab, M. W. Akram, and M. Faheem. Current status and overview of farm mechanization in Pakistan-A review. 2016. Available online: http://www.cigrjournal.org.
- M. T. Latif, M. Asghar, A. Research, F. Sher, and M. Hussain. Azarian Journal of Agriculture Economics of different harvesting techniques of wheat in rice-wheat cropping pattern of Punjab, Pakistan. 2018. Available online: www.azarianjournals.ir.
- M. A. Choudhary. Design improvement of indigenous beater wheat thresher in Pakistan. 2013. Available online: http://www.pakjas.com.pk.
- Ali, E. Pakistan, and M. Hussain. Role of Agricultural Services Providers (ASPs) in enhancing the productivity of crops in District Faisalabad. 2017. [Google Scholar] [CrossRef]
- A. Chandio and J. Yuansheng. Determinants of Adoption of Improved Rice Varieties in Northern Sindh, Pakistan. Rice Sci 2018, 25, 103–110. [Google Scholar] [CrossRef]
- Augsburg, A. Bancalari, Z. Durrani, M. Vaidyanathan, and Z. White. When nature calls back: Sustaining behavioral change in rural Pakistan. J Dev Econ 2022, 158. [Google Scholar] [CrossRef]
- M. Adnan, S. Politecnico, D. Torino, M. Safdar, and S. Maqbool. WHEAT PRODUCTION IN FAISALABAD DURING RABI-2023; A REMOTE SENSING BASED INVESTIGATION OF THE FACTORS CONTRIBUTING TO HIGHER YIELDS. 2024. [Google Scholar] [CrossRef]
- P. Karmakar, S. W. Teng, M. Murshed, S. Pang, Y. Li, and H. Lin. Crop monitoring by multimodal remote sensing: A review; Elsevier B.V., 2024. [Google Scholar] [CrossRef]
- D. Foster and M. R. Rosenzweig. Microeconomics of technology adoption. Annu Rev Econom 2010, 2, 395–424. [Google Scholar] [CrossRef]
- S. Asrat, M. Yesuf, F. Carlsson, and E. Wale. Farmers’ preferences for crop variety traits: Lessons for on-farm conservation and technology adoption. Ecological Economics 2010, 69, 2394–2401. [Google Scholar] [CrossRef]
- Erenstein, U. Farooq, R. K. Malik, and M. Sharif. On-farm impacts of zero tillage wheat in South Asia’s rice-wheat systems. Field Crops Res 2008, 105, 240–252. [Google Scholar] [CrossRef]
- Muller and M. Zeller. Land use dynamics in the central highlands of Vietnam: a spatial model combining village survey data with satellite imagery interpretation. Agricultural Economics 2002, 27, 333–354. [Google Scholar] [CrossRef]
- P. D. Lunn. The sports and exercise life-course: A survival analysis of recall data from Ireland. Soc Sci Med 2010, 70, 711–719. [Google Scholar] [CrossRef]
- A. Powers, W. J. Goudy, and P. M. Keith. Congruence Between Panel and Recall Data in Longitudinal Research. Congruence Between Panel and Recall Data in Longitudinal Research. Available online: https://academic.oup.com/poq/article/42/3/380/1846546.
Figure 1.
Figure 1. The study site – Faisalabad Map
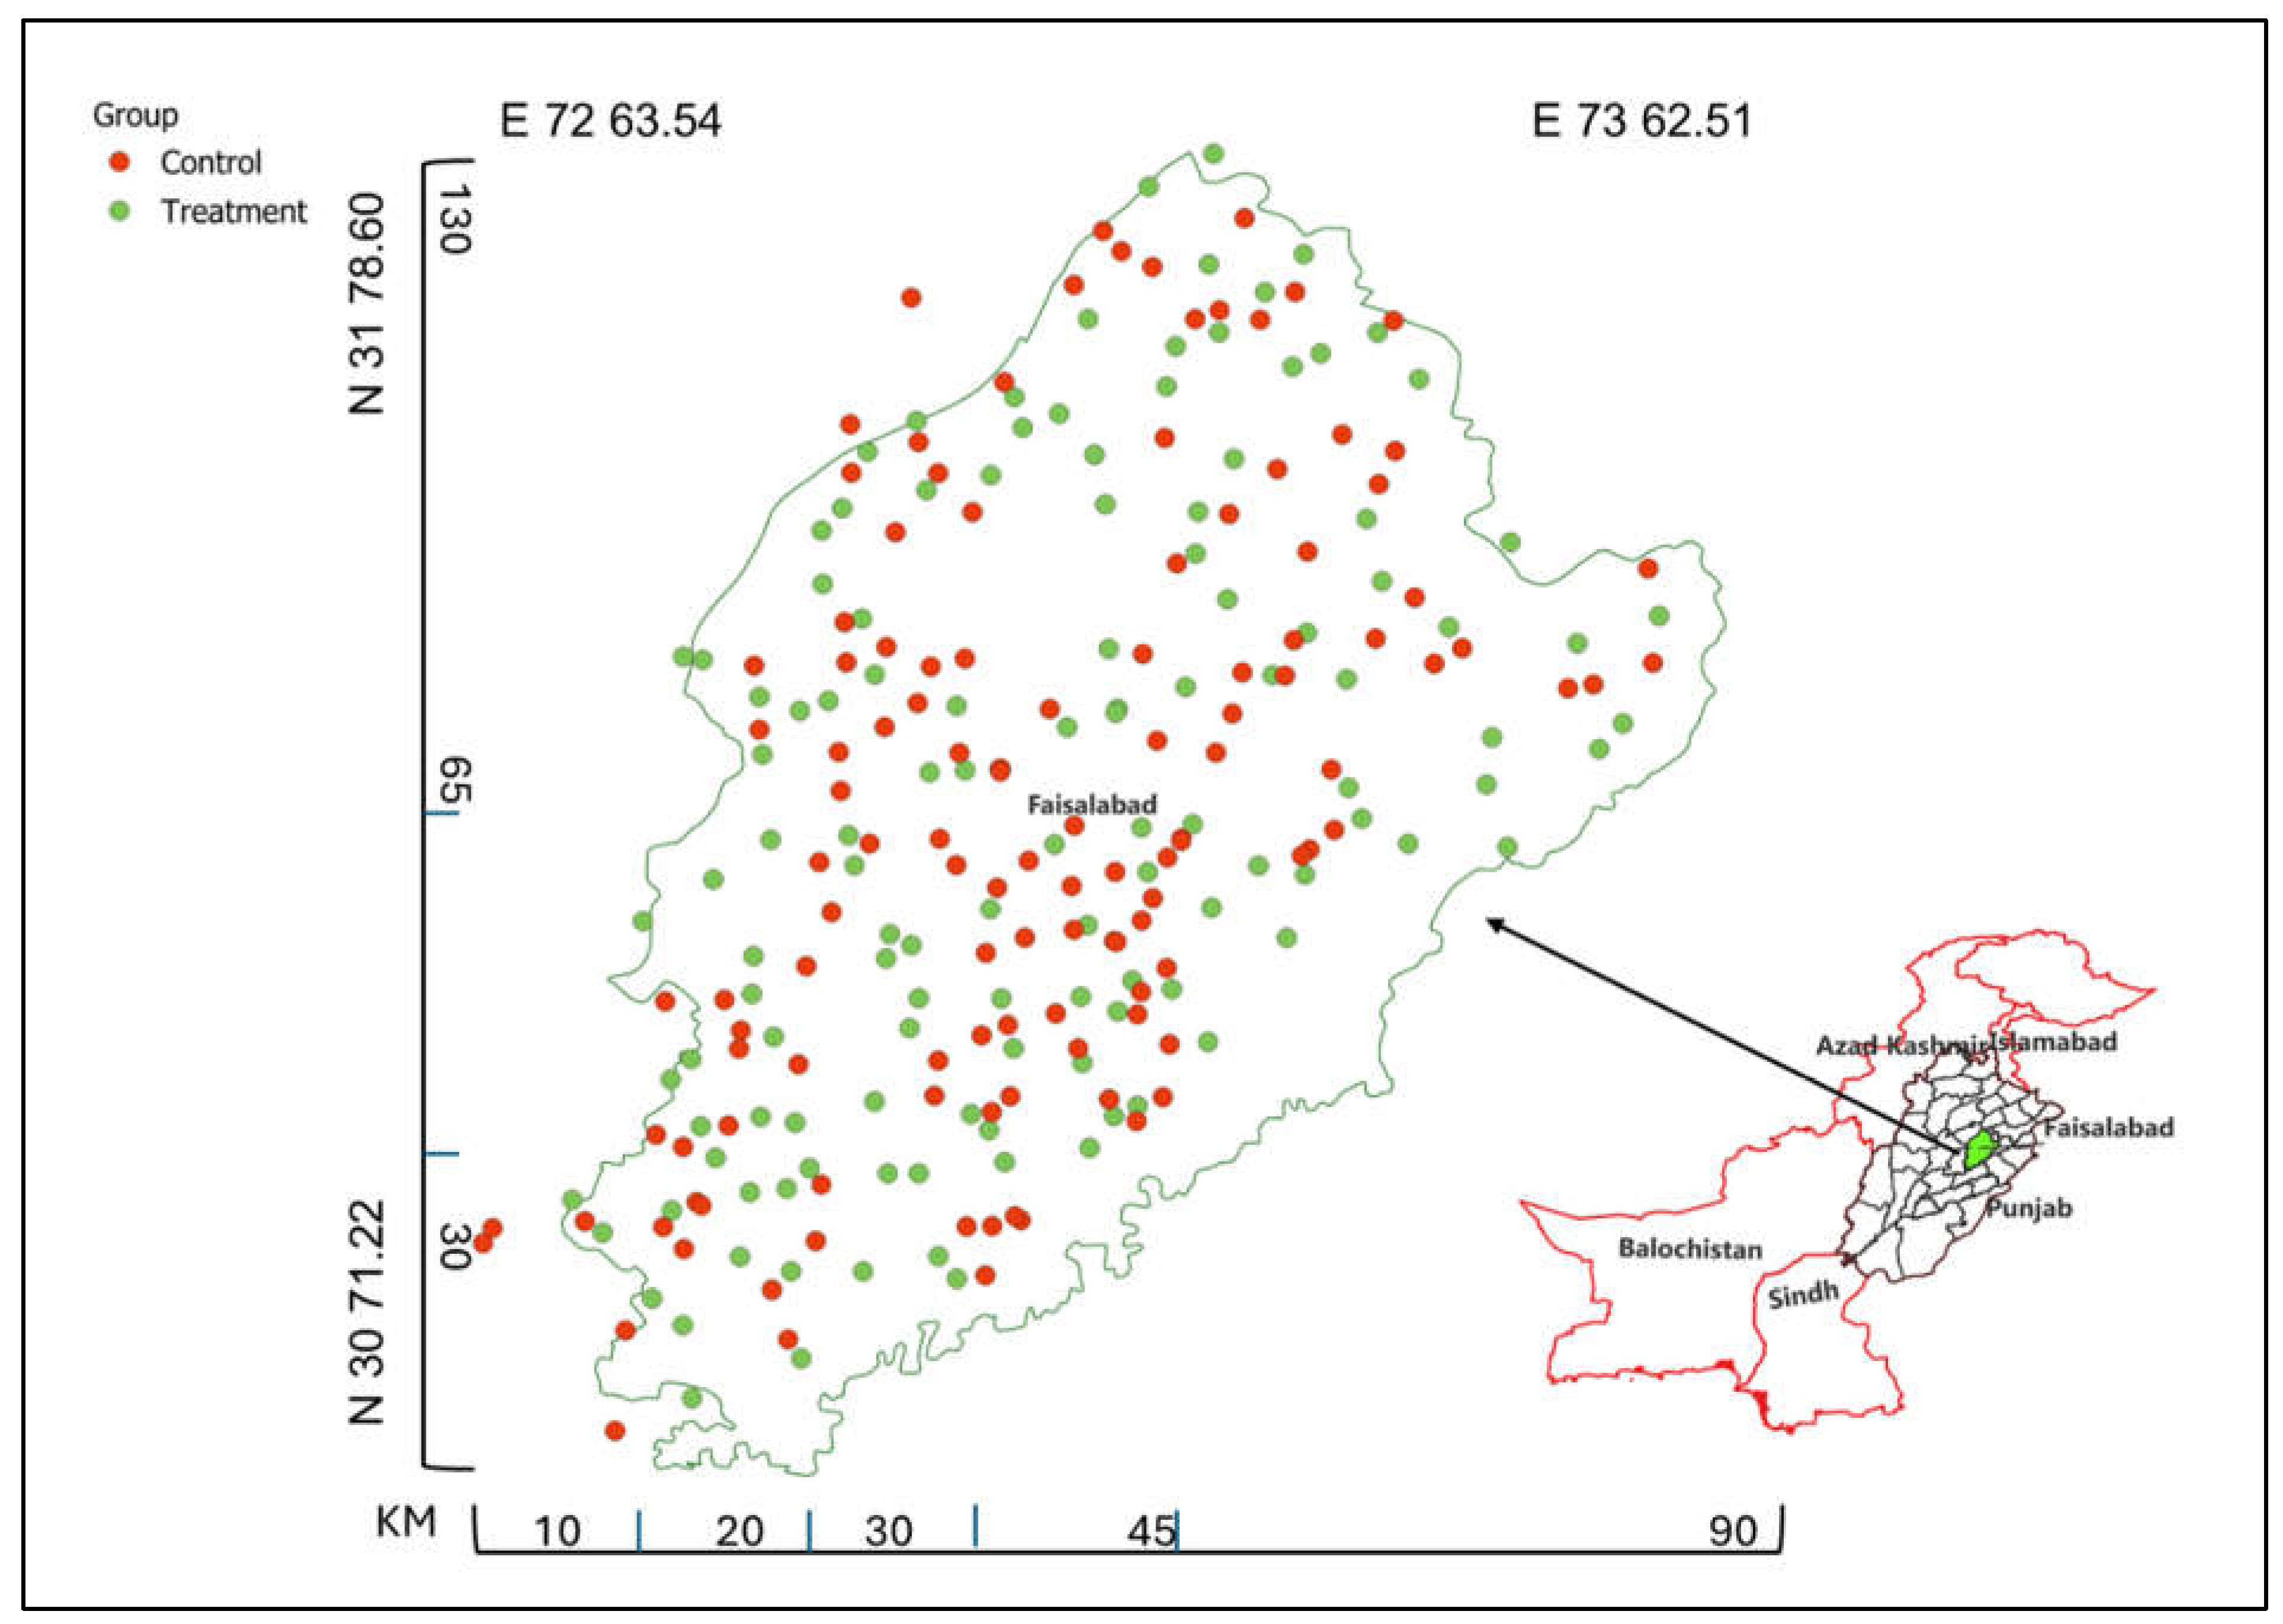
Figure 2.
Event Study of Yield – four years’ treatment effect.
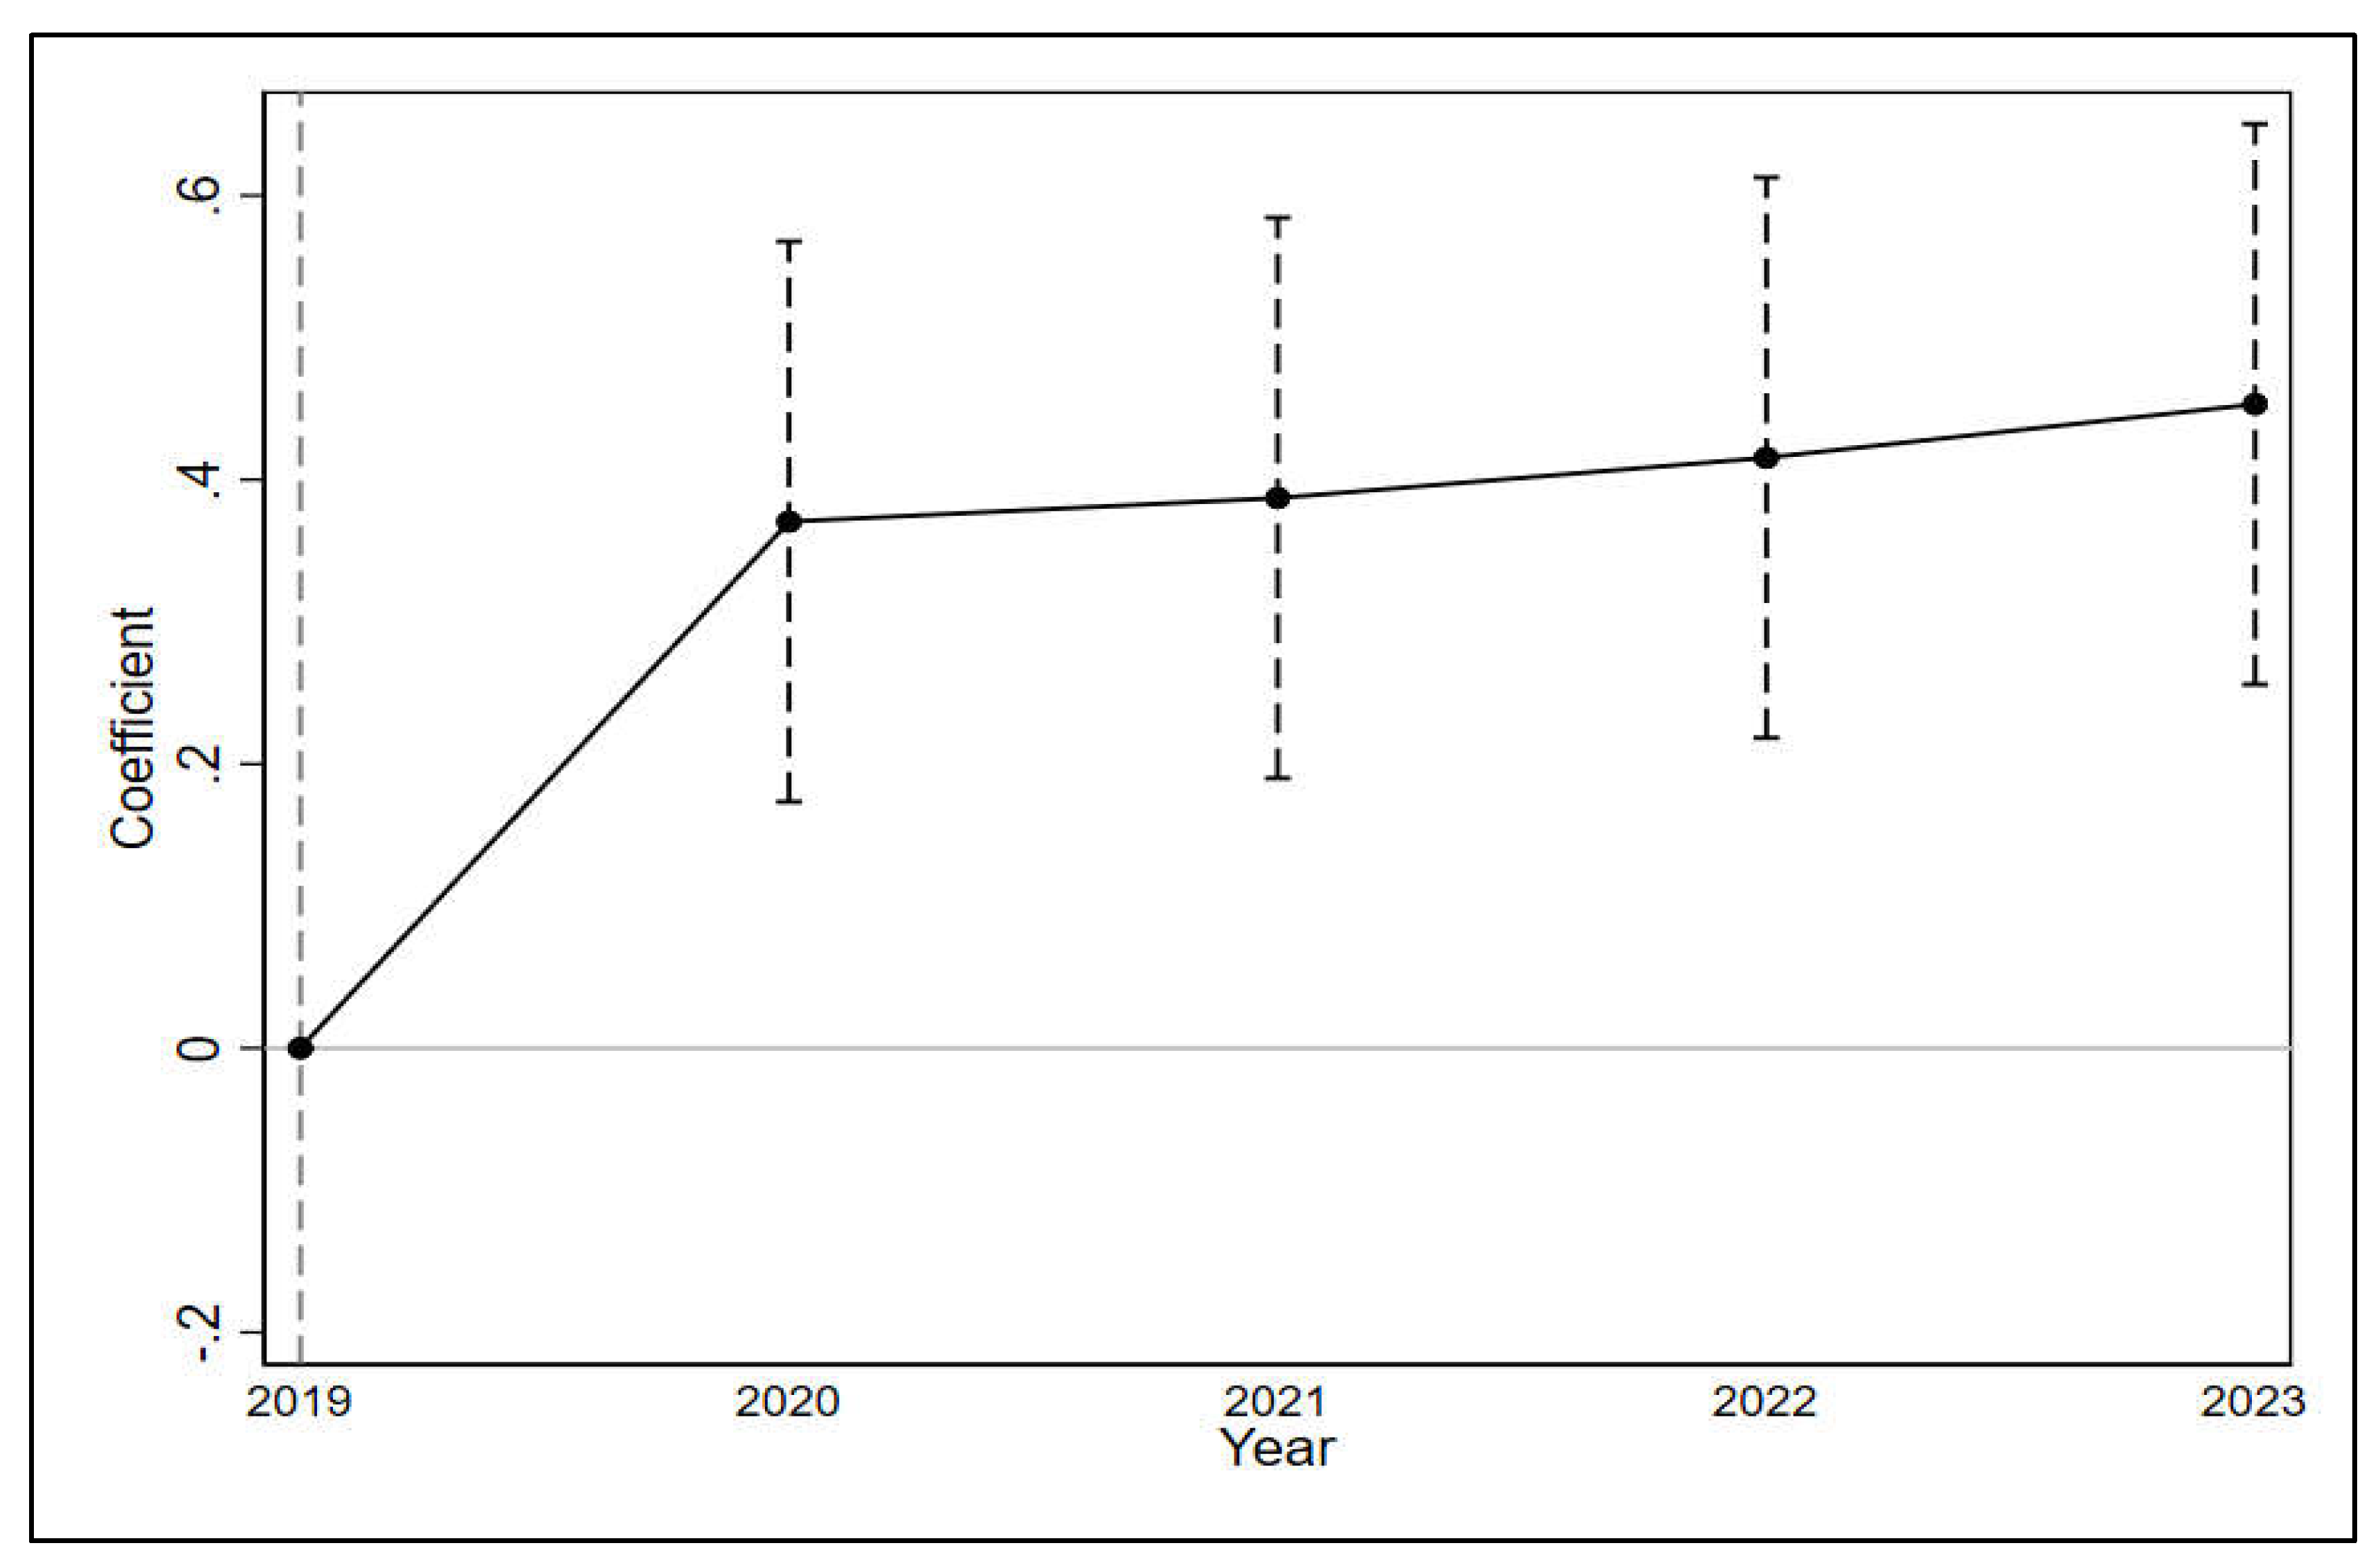

Table 1.
Brief Contents of on-farm demonstrations.
| S.No. | Type of Input | Demonstrations and Instructions |
|---|---|---|
| 1. | Application of certified seeds | Supervised purchase/selection of certified seeds from a designated supplier nominated by the government Demonstrated seed sowing on a pre-decided date depending upon the seed brand and nature of soil 100 – 125 kg/ha Sowing from 15th October to 30th November Row planting, average row spacing 25 – 30 cm |
| 2. | Application of fertilizers | Supervised application of fertilizer to each farm according to the need of land. The quantities according to land type are as follows: Fertile: DAP 155 kg/ha, urea 185 kg/ha, potash 61 kg/ha Medium fertile: DAP 185 kg/ha, urea 216 kg/ha, potash 61 kg/ha Less fertile: DAP 247 kg/ha, urea 247 kg/ha, potash 61 kg/ha The recommended time for application of fertilizers: DAP and potash at the sowing time Urea and nitrogen at the 1st and 2nd irrigation time |
| 3. | Application of Pesticides & herbicides | Crop is checked by the Extension Agent (EA), if required; quantity is recommended by the EA 1 l/ha on average |
| 4. | Use of machinery | Supervised seed drills, such as guidance on zero tillage drill, dry sowing drill, use of wheat bed planter, slasher, mechanical sowing Guided use of thresher and harvester |
Table 2.
The balance check before treatment
| Variables | Mean | Difference | t-stats. | |
|---|---|---|---|---|
| Treated (N=123) | Control (N=130) | T-C | ||
| Household Characteristics | ||||
| Age (No. of Years) | 47.334 | 47.485 | -0.151 (1.064) |
-0.15 |
| Family size (No.) | 5.675 | 5.508 | 0.167 (0.226) |
0.75 |
| Farmers’ Education (years of schooling) | 7.87 | 7.692 | 0.177 (0.387) |
0.45 |
| Family Education (Years of schooling) | 12.268 | 12.207 | 0.06 (0.231) |
0.25 |
| Land size (Hectare) | 4.41 | 4.35 | 0.05 (0.094) |
0.60 |
| Distance of farm from road (km) | 1.877 | 1.808 | 0.071 (0.097) |
0.75 |
| Type of Irrigation (Canal=1, Tubewell & Canal=2) | 1.805 | 1.777 | 0.028 (0.052) |
0.55 |
| Own a Tractor (if yes=1) | 0.553 | 0.577 | -0.024 (.062) |
-0.4 |
| Labor (No. per hectare) | 1.065 | 1.062 | 0.003 (0.03) |
0.1 |
| Use of Website/ FB (If yes=1) | 0.708 | 0.684 | 0.022 (0.058) |
0.4 |
| Quantity of Yield & Farm inputs | ||||
| Yield (t/ha) | 4.61 | 4.59 | 0.02 (0.07) |
0.35 |
| Use of certified seeds (if yes=1) | 0.39 | 0.45 | -0.05 (0.062) |
-0.9 |
| Fertilizers (Kg/ha) | 240.87 | 239.97 | 0.90 (5.04) |
0.2 |
| Pesticides/herbicides (l/ha) | 2.27 | 2.318 | -0.04 (.059) |
-0.7 |
| Seed quantity (Kg/ha) | 120.38 | 119.22 | 1.16 (2.002) |
0.6 |
| Cost of inputs | ||||
| Seeds cost (Rs. /ha) | 6655.9 | 7072.7 | -416.80 (388.8) |
-1.05 |
| Pesticide/herbicide cost (Rs. /ha) | 2047.28 | 2076.70 | -29.412 (53.12) |
-0.55 |
| Machinery cost (Rs. /ha) | 27300.5 | 26552.5 | 748.02 (696.2) |
1.05 |
| Fertilizers cost (Rs. /ha) | 14108.118 | 13953.600 | 154.51 (314.32) |
0.5 |
| Cost of Prod. (Rs. /ha) | 57021.8 | 56914.5 | 107.3 (602.9) |
0.2 |
| Revenue (Rs. /ha ) | 149925 | 149188.0 | 736.98 (2251) |
0.35 |
| Profit (Rs. /ha) | 92903.12 | 92273.50 | 629.62 (1880.6) |
0.35 |
| No. of observations | 123 | 130 | - | - |
Note: Statistically significant at * p < 0.05, *** p < 0.01 in a t-test for continuous variables, or in a chi-square test for dummy variables while comparing treatment and control groups. Standard errors are in parenthesis.
Table 3.
Impact of treatment on Technology Adoption (FE-DID)
| Certified Seeds (%) |
Fertilizers (kg/ha) |
Pesticides/Herb (l/ha) |
Machinery (Rs./ha) |
|||||
|---|---|---|---|---|---|---|---|---|
| 2020 (1) |
2020-23 (2) |
2020 (1) |
2020-23 (2) |
2020 (1) |
2020-23 (2) |
2020 (1) |
2020-23 (2) |
|
| D- training | 0.61*** | 0.34*** | 14.7*** | 15.2*** | 0.22*** | 0.22*** | 1913.7** | 762.5 |
| (0.088) | (0.069) | (2.39) | (2.32) | (0.051) | (0.048) | (1107.6) | (795.2) | |
| Constant | 0.42*** | 0.51*** | 241.4*** | 245.4*** | 2.31*** | 2.35*** | 30497.7*** | 45503.9*** |
| (0.021) | (0.027) | (0.58) | (0.90) | (0.012) | (0.019) | (269.2) | (309.3) | |
| Individual FE | YES | YES | YES | YES | YES | YES | YES | YES |
| Year FE | YES | YES | YES | YES | YES | YES | YES | YES |
| N | 506 | 1265 | 506 | 1265 | 506 | 1265 | 506 | 1265 |
| R-Sqd. | 0.49 | 0.28 | 0.94 | 0.86 | 0.79 | 0.70 | 0.73 | 0.90 |
Note: The variable 'D-training' is a treatment dummy that takes the value of 1 if an individual has received the D-training. Against each outcome variable, column 1 presents the effect of treatment for 2020 and column 2 for four years 2020-2023 using the fixed effects difference-in-differences specification. In the regression model, year and individual fixed effects have been used. Standard errors, shown in parentheses, are clustered at the individual level. p-values testing a zero-treatment effect are shown as: ** p < 0.05 and *** p < 0.001
Table 4.
Impact of treatment on yield, cost of production and profit (FE-DID).
| Yield (t/ha) | CoP (Rs. /ha) | Profit (Rs. /ha) | ||||
|---|---|---|---|---|---|---|
| 2020 (1) |
2020-23 (2) |
2020 (1) |
2020-23 (2) |
2020 (1) |
2020-23 (2) |
|
| D-training | 0.37*** | 0.41*** | 8698.7*** | 6193.9*** | 4325.4*** | 18743.4*** |
| (0.017) | (0.019) | (805.0) | (771.8) | (820.7) | (1750.7) | |
| Constant | 4.62*** | 4.68*** | 62642.9*** | 98700.3*** | 93319.7*** | 149940.5*** |
| (0.0042) | (0.0075) | (195.7) | (300.2) | (199.5) | (680.9) | |
| Individual FE | YES | YES | YES | YES | YES | YES |
| Year FE | YES | YES | YES | YES | YES | YES |
| N | 506 | 1265 | 506 | 1265 | 506 | 1265 |
| R-Squared | 0.99 | 0.98 | 0.90 | 0.98 | 0.96 | 0.97 |
Note: The variable 'D-training' is a treatment dummy that takes the value of 1 if an individual has received the D-training. Against each outcome variable, column 1 presents the effect of treatment for 2020 and column 2 for four years 2020-2023 using the difference-in-differences specification. In the regression model, year and individual fixed effects have been used. Standard errors, shown in parentheses, are clustered at the individual level. p-values testing a zero-treatment effect are shown as: ** p < 0.05 and *** p < 0.001.
Disclaimer/Publisher’s Note: The statements, opinions and data contained in all publications are solely those of the individual author(s) and contributor(s) and not of MDPI and/or the editor(s). MDPI and/or the editor(s) disclaim responsibility for any injury to people or property resulting from any ideas, methods, instructions or products referred to in the content. |
© 2025 by the authors. Licensee MDPI, Basel, Switzerland. This article is an open access article distributed under the terms and conditions of the Creative Commons Attribution (CC BY) license (http://creativecommons.org/licenses/by/4.0/).
Copyright: This open access article is published under a Creative Commons CC BY 4.0 license, which permit the free download, distribution, and reuse, provided that the author and preprint are cited in any reuse.


