Submitted:
02 January 2025
Posted:
08 January 2025
You are already at the latest version
Abstract
The phenomenon of health information fog on social media has become increasingly prevalent, posing significant challenges to users’ health literacy, decision-making, and the sustainable development of social media information ecosystems. This study aims to develop a robust and effective scale to measure users’ perception of health information fog and to uncover its underlying mechanisms. Grounded in information ecology theory, the initial scale was developed through a literature review, semi-structured interviews, and grounded theory. A pilot survey involving 155 respondents was conducted, followed by a formal survey with 561 participants. Exploratory and confirmatory factor analyses were employed to validate and refine the scale, resulting in a final version comprising 46 items across eight dimensions: health information overload, low-quality information, unclear information sources, group blind following, cognitive conflict, anxiety, group polarization, and urgent demand for health information. A normative model was further constructed to categorize users into five levels of perception intensity: low, relatively low, moderate, relatively high, and high. This study provides targeted intervention strategies for stakeholders and offers a scientific foundation for optimizing information dissemination while promoting the sustainable development of social media ecosystems.
Keywords:
social media
; health information fog
; scale development
; norm construction
; information ecosystem
; sustainable development
1. Introduction
The Health Information Fog refers to the informational environment in which, amidst the era of digital information explosion, the public encounters misleading content that impedes their ability to acquire, comprehend, and apply health-related information, ultimately leading to flawed health behavior decisions. With the increasing health awareness among the Chinese public and the rapid advancements in social media technology and healthcare digitalization, an ever-growing number of users are turning to social media platforms for health-related information [1]. However, the exponential growth of health information on these platforms, while facilitating information dissemination, has also resulted in the widespread dissemination of misleading health information due to the low entry barriers, rapid diffusion, and extensive reach. This phenomenon exacerbates the perception of health information fog, posing severe threats to the health and sustainable development of social media ecosystems.
Perceptions of health information fog can lead to negative emotions and flawed decision-making behaviors. For instance, Stimpson et al. [2] observed that social media users frequently encounter large volumes of false or misleading health information, causing skepticism about the credibility of such information and triggering anxiety. Similarly, Neely et al. [3] found that during the COVID-19 pandemic, the proliferation of mixed truthful and false information on social media intensified public perceptions of health information fog, increasing psychological stress and the likelihood of making erroneous decisions.
Despite the growing reliance on social media as a key channel for accessing health-related information, research on health information fog reveals that scales to measure perceptions of this phenomenon remain underdeveloped and insufficiently validated. The lack of such a measurement tool makes it difficult for researchers to accurately assess users’ perception intensity and, consequently, to effectively identify and mitigate the effects of health information fog. This gap not only limits the depth of research in this area but also hinders policymakers and platform managers from developing scientifically informed strategies to address the issue.
The development of a rigorous and reliable scale to measure social media users’ perceptions of health information fog is therefore an urgent academic need with significant practical implications. This study aims to develop and validate a health information fog perception scale for social media users. Additionally, it seeks to construct normative models to categorize users based on their perception intensity, thereby providing actionable insights for targeted interventions and contributing to the optimization of information dissemination and the sustainable development of social media ecosystems.
2. Literature Review
2.1. Related Concepts
Reed G. et al. [4] examined concepts similar to health information fog and defined it as a unique phenomenon in information dissemination that impairs decision-makers’ ability to make accurate judgments. They identified five stages in the formation of information fog: "Action Planning→Truth Obfuscation→Proxy Dissemination→ Channel Pollution→Decision Misguidance." Ireton C. et al. [5] described information fog as a deliberate strategy to exploit audience vulnerabilities by spreading false information and broadening dissemination channels, which carries severe risks. Peng Zhihui [6], analyzing the concept of disinformation in the Chinese context from the perspectives of "information" and "information activities," defined information fog as misleading information.
In recent years, the impact of information fog has extended into the field of health and medicine [7], drawing increasing attention to health information fog in social media environments. Gisondi M. A. et al. [8], using the COVID-19 pandemic as a research context, examined the influence of social media on public vaccine intentions and analyzed the formation mechanisms of health information fog. Pian W. et al. [9], using a mixed-methods approach, demonstrated that the formation of health information fog is primarily attributed to the widespread use of social media and insufficient health literacy among users. Additionally, the rapid publication of unverified or unreliable scientific findings, information overload, distrust in government, differing ideologies, and the public’s demand for health information were closely linked to the emergence of health information fog. Grimes D. R. [10] pointed out that individuals motivated by emotional and political factors propagate misleading information, exacerbating the issue. Hotez P. J. [11] highlighted the significant threat posed by the spread of health information fog through his study on vaccine refusal in the United States during the COVID-19 pandemic, which resulted in numerous preventable deaths. Hofstra L. et al. [12] demonstrated that physicians promoting health information on social media not only narrowed the gap between healthcare systems and the public but also enhanced public trust in medical systems and improved health awareness.
The concept of social media users’ health information fog perception refers to users’ cognitive and behavioral responses when exposed to misleading health information on social media platforms. It involves users’ ability to process and interpret complex and dynamic health information environments. The sources of health information on social media include professional medical institutions, health influencers, and ordinary users, with varying degrees of credibility and accuracy, further intensifying users’ perception of health information fog [13]. In such contexts, users may exhibit overconfidence, believing they can discern credible health information but often falling prey to cognitive biases, making them more susceptible to misinformation [14]. Exposure to health information fog environments can also trigger negative emotional responses, such as anxiety, fear, and uncertainty [15], which further influence users’ health decisions and behaviors.
The perception of health information fog not only affects individuals’ psychological and behavioral outcomes but also poses challenges to the development and implementation of public health policies. Understanding this concept is crucial for designing effective educational and intervention strategies to enhance the public’ s ability to discern credible health information. It also helps mitigate the spread of misleading health information on social media platforms, ensuring the authenticity and reliability of public health information and fostering more informed health decisions.
2.2. Related Research
A review of the existing literature reveals that research on health information fog perception (HIFP) primarily focuses on the following aspects:
Impact of Information Overload:Information overload is a key factor contributing to information fog. When the volume of information exceeds an individual's cognitive processing capacity, it results in cognitive overload, intensifying the perception of information fog. In the health domain, the complexity and specialization of health information exacerbate this effect [16]. Existing measurement tools for information overload include the Cancer Information Overload Scale adapted by Fernandez et al. [17] for pandemic contexts, which evaluated nurses’ and midwives’ perceptions of information overload. Similarly, Eraslan and Ilhan [18] explored the interplay between cancer information overload, death anxiety, and health anxiety, highlighting emotional and cognitive aspects of overload. Kiss et al. [19] developed the Sports Nutrition Information Overload Scale, emphasizing the utility of context-specific tools for mitigating negative effects.
Impact of Health Information Quality:The inconsistent quality of health information on social media increases users’ cognitive burden and stress. Bermes [20] argued that low-quality health information adversely affects users’ information processing. Karimah et al. [21] developed a scale for evaluating information quality in Type 2 diabetes management, while Kayode et al. [22] proposed the Clinical Information Quality Framework (CLIQ) to assess digital health information quality across multiple dimensions.
Impact of Source Credibility:The credibility of information sources significantly influences users’ perceptions of health information fog. Hwang and Oh [24] proposed a credibility evaluation framework for health-related YouTube content, including factors like source, content, creator, and interactivity. Chang et al. [25] explored strategies employed by older adults in China to assess the credibility of health information, identifying criteria such as source reputation and content consistency.
Impact of Cognitive Conflict:Cognitive conflict arises when individuals are exposed to contradictory health information, leading to negative emotions and increased perceptions of health information fog. Xiaofei Li et al. [28] measured cognitive conflict using processing fluency and meta-memory beliefs, demonstrating its regulatory role in information processing.
Impact of Health Information Needs:Users’ varying levels of health information needs directly affect their perceptions of information fog. Urgent health information needs, coupled with insufficient or contradictory information, amplify perceptions of information fog [29].
Role of Social Media Platforms in Health Information Dissemination:While social media facilitates health information dissemination, it also introduces credibility challenges, contributing to information fog [30]. Research by Hwang et al. [31] highlights how emotional responses and information adequacy indirectly affect health information fog perception.
In summary, while existing studies address factors like information overload, information quality, source credibility, cognitive conflict, health information needs, and social media’ s role in information dissemination, there remains a lack of systematic exploration of the dimensions and measurement tools for health information fog perception in social media contexts. This study aims to develop and validate a comprehensive scale for measuring social media users’ perceptions of health information fog, combining qualitative and quantitative methods. By providing a reliable measurement tool, this research seeks to facilitate deeper empirical studies and contribute to effective health communication strategies.
3. Initial Scale Construction
3.1. Information Ecology Theory
The Information Ecology Theory, initially proposed by information scientists Thomas H. Davenport and Larry Prusak, describes the various factors within an information environment and their interrelationships. This theory primarily investigates the relationships among the factors involved in information activities and the mechanisms underlying ecological development. It highlights the organic connections and harmonious coexistence among information agents, information, and the information environment within an information ecosystem. By providing a comprehensive framework for understanding the flow and impact of information in complex systems, the theory also establishes a foundation for the sustainable and healthy development of information systems.
An information ecosystem is an artificial system composed of information, information agents, and the information environment, possessing a certain degree of self-regulation. The information environment includes not only all natural environments associated with human information activities but also social environments.
The perception of health information fog by social media users is a dynamic and complex process, closely tied to health information on social media, social media users, the social media environment, and the organic relationships among these elements. This study aims to explore the perception of health information fog by social media users and its manifestation within specific environments. Therefore, adopting the Information Ecology Theory to analyze the structural dimensions of social media users' perception of health information fog is a feasible and appropriate approach.
3.2. Data Sources and Data Collection
The study of social media users' awareness of health information fog is still in its infancy, and no specialized scale for measuring this concept currently exists. Therefore, this paper adopts literature review and semi-structured interview methods to preliminarily design a scale for assessing Chinese social media users' understanding of health information fog: data sources are primarily comprised of literature review and semi-structured interviews.
Literature Sources:Literature was retrieved from the Web of Science database using the keywords “Disinformation,” “Information fog,” “Misinformation,” and “Fake News” to identify relevant articles from core journals. To ensure the selected studies are at the forefront of research, only papers published in the past five years were included, and irrelevant studies were excluded. Ultimately, 59 English-language articles were identified.
Semi-Structured Interview Sources: Based on the 2023 China Social Media Platform Guide report by KAWO [34], and to obtain more authentic and diverse social media user data while mitigating the effects of temporal, geographical, and platform differences on findings, this study selected users from social media platforms with the highest monthly active user counts and growth rates: WeChat Video Accounts, Douyin, and Kuaishou. First, the keyword “debunking rumors” was used to identify the accounts with the highest number of followers, published content, and user engagement across these three platforms. The search results revealed the following accounts: “Internet Joint Rumor-Refuting Platform” and “Scientific Debunking” on WeChat Video Accounts; “China Internet Joint Rumor-Refuting Platform” and “Scientific Debunking” on Kuaishou; and “Toutiao Debunking,” “Douyin Debunking,” and “Scientific Debunking” on Douyin. Each of these accounts has millions of followers, a large volume of content, and high user activity. Next, the health-related videos with the highest user interaction from each account were identified. Finally, the top ten comments with the most likes under each video were selected to form the sample pool for this study.
After obtaining the interview transcripts, the text data was processed through tokenization, stop-word removal, and other text-cleaning techniques to produce relatively clean and structured data [35].
The semi-structured interviews were conducted between February and May 2024, with 35 respondents ultimately selected through theoretical sampling. The investigation was carried out in three rounds:
In the first round, user samples from the WeChat Video Accounts platform were selected as respondents for open sampling. These users were privately messaged with invitations to participate in the interviews, along with a red packet incentive. A total of 10 respondents accepted the invitation and participated in the semi-structured interviews via Tencent Meeting or WeChat, with an average interview duration of approximately 30 minutes. Preliminary data obtained in this round were used to guide the standards for relational and variation sampling in the next round.
The second round involved inviting user samples from the Douyin platform to participate in the interviews. Similarly, respondents were incentivized with red packets, resulting in the collection of 16 sets of data in this round.
In the final round, user samples from the Kuaishou platform were invited to participate in the interviews, yielding 9 interview transcripts.
Basic information about the respondents is shown in Table 1. The respondents represented different ages, genders, educational backgrounds, occupations, and the three major social media platforms, providing this study with a sample that is reasonably representative.
3.3. Definition of Concepts and Determination of Dimensions
After organizing the data, qualitative analysis software NVivo 12 was employed to perform open coding on the literature and interview materials from the first sampling round, which included 10 participants. This step involved line-by-line coding to derive initial concepts and categories based on the three dimensions of the information ecology framework: (1) information factors, (2) information subject factors, and (3) information environment factors.
Next, axial coding was conducted on the interview materials from the second sampling round, comprising 16 participants. This phase aimed to explore classifications and intrinsic relationships within the data. Based on the analysis of the interview texts, initial concepts were redefined or eliminated as needed, and newly emerging codes were integrated with predefined themes. This process yielded 20 primary indicators and 31 secondary indicators.
Finally, the coding of interview materials from the third sampling round, involving 9 participants, identified no new concepts or categories. Thus, the theoretical framework was considered to have reached saturation. The results of the axial coding are summarized in Table 2.
Based on the results of axial coding, a storyline centered on the core category of 'Social Media Users' Perception of Health Information Fog' has been developed. This storyline illustrates its structural dimensions, as shown in Figure 1. The dimensions and their specific meanings are provided in Table 3.
3.4. Data Sources and Data Collection
This study employed the expert consultation method to develop an initial item pool for assessing social media users' perception of health information fog. Seven experts specializing in health information behavior were selected and briefed on the research topic, objectives, and the definitions of the structural dimensions in the initial scale. They then assessed the relevance and alignment of the dimensions with the items, as well as the accuracy and clarity of the items. The finalized conceptual framework, items, and reference sources are presented in Table 4.
4. Scale Validation
4.1. Preliminary Research and Scale Revision
The survey scale for assessing social media users' perception of health information ambiguity was designed using a 5-point Likert scale. Each item on the scale includes the following response options: "Strongly Disagree," "Disagree," "Neutral," "Agree," and "Strongly Agree," corresponding to ordinal scores from 1 to 5. The preliminary survey was distributed through popular social media platforms, including WeChat, Weibo, and TikTok (Douyin), with an incentive of a 3 RMB WeChat red envelope offered for each completed and valid questionnaire to encourage participation.
The validity of the responses was determined based on the following criteria:
1.The respondent is a social media user;
2.The respondent engages with health-related information on social media;
3.The questionnaire completion time exceeds 60 seconds.
In total, 232 responses were collected during the preliminary survey, of which 155 were deemed valid, resulting in a validity rate of 66.8%.
In this study, SPSS 29 statistical analysis software was used to conduct a reliability test on the initial scale. The refinement of the scale items was carried out according to the following criteria:
1.Items with a corrected item-total correlation (CITC) that were not significant (p < 0.05) or had a value below 0.50 were removed;
2.Items were deleted if their removal resulted in a Cronbach’s alpha (CA) for the corresponding dimension that was not lower than the overall reliability coefficient.
The results of the reliability test for the initial scale are shown in Table 5. As indicated in Table 5, the CITC values for items IQ7, IQ8, SA1, AN3, AN8, GP7, GP8, and IN2 were less than 0.50. Additionally, the removal of these items resulted in an increase in the CA values for their respective dimensions, leading to their elimination. After the purification process based on these steps, the CA values for all dimensions exceeded 0.70, indicating good internal consistency of the items.
This pre-test used exploratory factor analysis (EFA) to assess the internal structural validity of the scale and the rationality of the item design. The specific steps are as follows:
1.The pre-survey questionnaire underwent KMO (Kaiser-Meyer-Olkin) testing and Bartlett's test of sphericity to determine whether the data were suitable for exploratory factor analysis. The KMO value is an indicator of the degree of correlation between variables; the closer the value is to 1, the more appropriate it is for proceeding with EFA. Afterward, the factor loadings of the observed items were compared with the expected structure of the scale, and items that did not align with expectations were removed. The main rules include: the factor loading of an item should not be less than 0.4, and items should not have cross-loadings or load on multiple factors. Based on these rules, the final official survey questionnaire was determined. The KMO value for this study’s pre-test data was 0.878, and the significance of Bartlett's test of sphericity was also satisfactory (sig = 0.000), indicating that the variables in the questionnaire met the prerequisites for factor analysis.
2.After removing the inadequate items, principal component analysis (PCA) was used to perform the exploratory factor analysis on the remaining items, and the results are shown in Table 6. As indicated in Table 6, eight factors with eigenvalues greater than 1 were obtained, and the factor loadings for each item were greater than 0.6. The remaining items were retained, suggesting that the extracted common factors explained the measured variables well.
4.2. Formal Survey and Scale Validation
During the formal survey phase, the refined scale for assessing social media users' perception of health information ambiguity was used for data collection and measurement. The research team distributed the questionnaire links across various social media platforms, offering monetary incentives in the form of digital red envelopes as rewards. The survey lasted for 11 days. After excluding responses with a completion time of less than 2 minutes or those where the same option was selected consecutively across multiple items, a total of 561 valid responses were collected. The distribution of the sample's demographic characteristics is shown in Table 7.
The overall Cronbach's alpha (CA) value of the formal survey questionnaire was 0.954, and the KMO value was 0.958, indicating good reliability and validity, making it suitable for factor analysis. Therefore, this study further evaluated the rationality of the scale structure through exploratory factor analysis (EFA) and confirmatory factor analysis (CFA). Since EFA and CFA require separate data sources, the entire sample was randomly divided into two approximately equal subsamples using SPSS. Subsample 1 (N = 280) was used for EFA to confirm the factor structure of the scale. Subsample 2 (N = 281) was used for CFA to examine the relationships between the observed variables and the latent variables.
4.2.1. Exploratory Factor Analysis
Exploratory factor analysis (EFA) was conducted on Sample 1, with a KMO value of 0.937 and a significance value for Bartlett's test of sphericity of < 0.001. These results indicate that Sample 1 is suitable for factor analysis. Using the maximum variance rotation method, factors with eigenvalues greater than 1 were extracted. The results of the exploratory factor analysis are presented in Table 8.
As shown in Table 8, 46 items were grouped into 8 common factors, with a cumulative variance explanation rate of 68.35% after rotation, which exceeds the standard threshold of 40%. Additionally, the absolute values of factor loading coefficients for all items in the rotated component matrix were greater than 0.4. These findings demonstrate that the 8 extracted common factors effectively explain the measured variables.
4.2.2. Confirmatory Factor Analysis
1. Validity Testing:
The AVE (Average Variance Extracted) and CR (Composite Reliability) are commonly used to evaluate convergent validity. Generally, an AVE greater than 0.5 and a CR greater than 0.7 indicate high convergent validity. As shown in Table 9, the AVE values for all eight factors identified in the previous analysis are above 0.5, and the CR values exceed 0.7. This indicates that the scale demonstrates good convergent validity.
All The square root of the AVE (Average Variance Extracted) can be used to assess discriminant validity. In Table 10, the diagonal values represent the square root of the AVE, while the off-diagonal values are the correlation coefficients. The square root of the AVE indicates the convergent validity of a factor, while the correlation coefficients represent the relationships between factors. If the square root of the AVE for a given factor is greater than the absolute value of its correlation coefficients with other factors, and this condition holds true for all factors, it demonstrates good discriminant validity of the scale.
As shown in Table 10, the square root of the AVE for each factor is greater than the absolute value of its correlation coefficients with other factors. This indicates that the scale has good discriminant validity.
2. Parameter Testing:
Based on the results of the exploratory factor analysis, a first-order structural equation model was developed using AMOS 28.0 software. The model includes 8 latent variables, 46 observed variables, and 46 residual variables. Using the maximum likelihood estimation method, the model was analyzed. As shown in Figure 2, all factor loadings are greater than 0.5, demonstrating that each latent variable in the model has a strong explanatory power for its corresponding observed variables.
Additionally, the unstandardized factor loadings (Unstd) and the standard errors (S.E.) of the estimated parameters are all positive, with critical ratios (C.R.) greater than 2.85, indicating that the parameter estimates have reached a significance level of 0.01. Furthermore, when the significance level (P-value) is less than 0.001, it is denoted by "***". As shown in Table 11, all items in this scale achieve a significance level of 0.001, demonstrating that the scale items effectively reflect their respective dimensions.
3. Model Fit Testing
The model fit of the confirmatory factor analysis (CFA) was evaluated using common indices, including the Chi-square to degrees of freedom ratio (CMIN/DF), the root mean square error of approximation (RMSEA), and the comparative fit index (CFI), incremental fit index (IFI), and Tucker-Lewis index (TLI). Generally, a CMIN/DF value below 3 is considered ideal, an RMSEA value below 0.08 is acceptable, and CFI, IFI, and TLI values should exceed 0.9.For the CFA model in this study, the specific fit results are as follows: CMIN/DF = 1.043, RMSEA = 0.012, and CFI, IFI, and TLI values are 0.995, 0.995, and 0.995, respectively. All fit indices meet the evaluation criteria (see Table 12), indicating that the model demonstrates an excellent level of fit.
4.2.3. Categorization of Social Media Users' Perception of Health Information Ambiguity
A norm refers to a statistical benchmark derived from the standardized measurement of a specific population, used to describe the typical performance level of that group. It provides a reference framework for comparing an individual's test score with the baseline level of the group. Percentile norms, which mitigate the limitations of data distribution and outliers, offer a robust and intuitive method for data interpretation and analysis in this study.Based on the scores from the scale measuring social media users' perception of health information ambiguity, this study uses 5% percentile intervals to establish a benchmark for accurately positioning the intensity level of such perceptions among social media users. The higher an individual's position on the percentile norm, the stronger their perception of health information ambiguity on social media. Specific results are presented in Table 13.
Based on the percentile norms, P10, P30, P70, and P90 were selected as grade cut-off points to classify social media users' health information ambiguity perception scores into five levels, ranked from low to high as follows:
- Low: Less than P10
- Relatively Low: ≥P10 and ≤P30
- Average: >P30 and ≤P70
- Relatively High: >P70 and ≤P90
- High: Greater than P90
5. Conclusion and Prospect
This study utilized the grounded theory research method to analyze data obtained from a literature review and semi-structured interviews, designing a health information ambiguity perception scale for social media users comprising eight indicators. Based on the analysis of 155 pre-test samples, problematic items were removed. Subsequently, the scale was refined and validated using formal survey data from 561 respondents. The final scale includes eight indicators: “health information overload”, “low health information quality”, “ambiguous information sources”, “group conformity”, “cognitive conflict”, “anxiety”, “polarized group environments”, and “urgent health information need”.The revised scale demonstrated good reliability and validity, with a Cronbach’s alpha (CA) value of 0.954. Both discriminant validity and convergent validity tests were passed, indicating that the scale is reliable and can be used as a measurement tool. This addresses the gap in research, where no standard scale for measuring social media users' health information ambiguity perception has been established.Additionally, based on the finalized scale, this study constructed a normative framework for social media users' health information ambiguity perception. The perception intensity was classified into five levels: “low perception intensity”, “relatively low perception intensity”, “average perception intensity”, “relatively high perception intensity”, and “high perception intensity”, with corresponding score intervals across different dimensions. This classification provides personalized intervention strategies for social media users with varying levels of health information ambiguity perception and serves as a valuable reference for relevant authorities to create a healthier information ecosystem.
The scale developed in this study has the following theoretical and practical significance:
Theoretical significance:First, it deepens the application of information ecology theory in the field of health information research, enriching the theory's content while addressing the gap in the development of a scale for measuring social media users' perception of health information ambiguity;Second, it facilitates a deeper exploration of the mechanisms by which social media users' perception of health information ambiguity affects their health decisions and behaviors, revealing how such perceptions influence users' ability to acquire, comprehend, evaluate, and apply health information;Finally, this study spans multiple disciplines, including information science, psychology, communication studies, and public health, thereby advancing interdisciplinary research and fostering integration. It provides a new entry point for collaborative research across disciplines.
Practical significance:First, it helps public health institutions, medical organizations, and health information disseminators understand the intensity of users' perception of health information ambiguity, enabling the optimization of information dissemination strategies and improving the effectiveness of health communication;Second, through scale assessment, it identifies the difficulties and challenges users face in acquiring and processing health information, allowing for targeted health literacy education. Social media platforms can also use the evaluation results of the scale to improve health information recommendation algorithms and presentation methods, thereby reducing users' perception of information ambiguity and enhancing their user experience;Additionally, the scale aids users in self-assessing their actual state in acquiring and processing health information, enabling them to make better-informed health decisions. The application of the scale can also provide data support and decision-making references for governments and related agencies in formulating health information dissemination and management policies, promoting standardized management of health information on social media.
Future Research Directions,This study, based on a specific point in time and using a cross-sectional survey approach, reflects only the static characteristics at the time of the survey, making it unable to capture dynamic changes. Future research can employ longitudinal surveys with this scale to explore the dynamic evolution of social media users' perception of health information ambiguity. Additionally, while this study primarily proposed health information ambiguity perception indicators through qualitative research, future studies could focus on identifying quantitative indicators based on user characteristics to develop a more comprehensive evaluation system. Furthermore, research should delve into the stratified governance of health information ambiguity perception by considering the characteristics of different populations. Special attention could be given to formulating targeted intervention strategies for health information ambiguity perception across various social media platforms and user groups.
Author Contributions
Qi An: Conceptualization, Methodology, Formal analysis, Data curation, Investigation, Writing – original draft, Writing – review & editing, Visualization, Xinhua Bi:Visualization,writing—review and editing,Funding acquisition, Jiage Wu:Supervision,project administration
Funding
This research was funded by the National Natural Science Foundation of China, grant number 71501081, for the project titled "Research on User Participation Motivation and Network Interaction Mechanism in Mobile Social Networks—Based on the Moderating Role of User Perception."
Informed Consent Statement
All participants provided informed consent prior to partici- pating in the study, and they were able to withdraw from the survey at any time without giving a reason. All procedures performed in the study involving human participants were in accordance with the ethical standards of the institutional and/or national research committee and with the 1964 Helsinki Declaration and its later amendments or comparable ethical standards. This article does not contain any studies performed by any of the authors involving animals. According to Article 32 of the document [2023] No. 4, jointly issued by the National Health Commission, Ministry of Education, Ministry of Science and Technology, and the National Administration of Traditional Chinese Medicine of the People’s Republic of China, an ethical review is exempted. Please refer to the website https://www.gov.cn/zhengce/zhengceku/2023-02/28/content_5743658.htm
Data Availability Statement
Data will be made available on request.
Conflicts of Interest
The authors declare no conflicts of interest.
References
- Powell, J.; Pring, T. The impact of social media influencers on health outcomes: Systematic review. Social Science & Medicine 2024, 340, 116472. [Google Scholar] [CrossRef]
- Stimpson, J.P.; Ortega, A.N. Social media users’ perceptions about health mis- and disinformation on social media. Health Affairs Scholar 2023, 1, qxad050. [Google Scholar] [CrossRef] [PubMed]
- Neely, S.R.; Eldredge, C.E.; Sanders, R. Health Information Seeking Behaviors on Social Media During the COVID-19 Pandemic Among American Social Networking Site Users: Survey Study. Journal of Medical Internet Research 2021, 23. [Google Scholar] [CrossRef] [PubMed]
- Reed, G.; Hendlin, Y.; Desikan, A.; et al. The disinformation playbook: how industry manipulates the science-policy process—and how to restore scientific integrity. Journal of Public Health Policy 2021, 42, 622. [Google Scholar] [CrossRef] [PubMed]
- Ireton, C.; Posetti, J. Journalism, Fake News & Disinformation: Handbook for Journalism Education and Training. UNESCO Publishing: Paris, France, 2018.
- Zhihui, P. On the Integration, Transformation, and Reinterpretation of the Concept of Disinformation in the Chinese Context. Information Theory and Practice 2022, 45, 1–10. [Google Scholar] [CrossRef]
- Aïmeur, E.; Amri, S.; Brassard, G. Fake news, disinformation and misinformation in social media: a review. Social Network Analysis and Mining 2023, 13, 1–36. [Google Scholar] [CrossRef]
- Gisondi, M.A.; Barber, R.; Faust, J.S.; et al. A Deadly Infodemic: Social Media and the Power of COVID-19 Misinformation. J. Med. Internet Res. 2022, 24, e35552. [Google Scholar] [CrossRef]
- Pian, W.; Chi, J.; Ma, F. The causes, impacts and countermeasures of COVID-19 “Infodemic”: A systematic review using narrative synthesis. Inf. Process. Manag. 2021, 58, 102713. [Google Scholar] [CrossRef]
- Grimes, D.R. Health disinformation & social media: The crucial role of information hygiene in mitigating conspiracy theory and infodemics. EMBO Rep. 2020, 21, e51819. [Google Scholar] [CrossRef]
- Hotez, P.J. Health Disinformation—Gaining Strength, Becoming Infinite. JAMA Intern. Med. 2024, 184, 96–97. [Google Scholar] [CrossRef]
- Hofstra, L.; Gommers, D. How can doctors counter health misinformation on social media? BMJ 2023, 382, p1932. [Google Scholar] [CrossRef] [PubMed]
- Marar, S.D.; Al-Madaney, M.M.; Almousawi, F.H. Health information on social media.Perceptions, attitudes, and practices of patients and their companions. Saudi Med. J. 2019, 40, 1294–1298. [Google Scholar] [CrossRef] [PubMed]
- Martínez-Costa, M.-P.; López-Pan, F.; Buslón, N.; et al. Nobody-fools-me perception: Influence of Age and Education on Overconfidence About Spotting Disinformation. Journal. Pract. 2023, 17, 2084–2102. [Google Scholar] [CrossRef]
- Liu, P.L.; Huang, L.V. Digital Disinformation About COVID-19 and the Third-Person Effect: Examining the Channel Differences and Negative Emotional Outcomes. Cyberpsychol. Behav. Soc. Netw. 2020, 23, 889–895. [Google Scholar] [CrossRef]
- Bala, R.; Srivastava, A.; Ningthoujam, G.D.; Potsangbam, T.; Oinam, A.; Anal, C.L. An Observational Study in Manipur State, India on Preventive Behavior Influenced by Social Media During the COVID-19 Pandemic Mediated by Cyberchondria and Information Overload. J. Prev. Med. Public Health . 2021, 54, 22–30. [Google Scholar] [CrossRef]
- Fernandez, R.; Green, H.; Hobbs, C.; Loveday, C.; Almasi, E.; Middleton, R.; Halcomb, E.J.; Moxham, L. Adaption of the Cancer Information Overload Scale for pandemics and assessment of infodemic levels among nurses and midwives. Int. J. Nurs. Pract. 2022, 29, e13055. [Google Scholar] [CrossRef]
- Jensen, J.D.; Carcioppolo, N.; King, A.J.; Bernat, J.K.; Davis, L.A.; Yale, R.; Smith, J. The cancer information overload (CIO) scale: Establishing predictive and discriminant validity. Patient Educ. Couns. 2014, 94, 90–96. [Google Scholar] [CrossRef]
- Kiss, A.; Soós, S.; Tompa, O.; Révész, L.; Tóth, L.P.; Szabó, A. Measuring Athletes’ Perception of the Sport Nutrition Information Environment: The Adaptation and Validation of the Diet Information Overload Scale among Elite Athletes. Nutrients 2021, 13, 2781. [Google Scholar] [CrossRef]
- Wang, Y.; Xu, J.; Xie, T. Social Media Overload and Anxiety Among University Students During the COVID-19 Omicron Wave Lockdown: A Cross-Sectional Study in Shanghai, China,2022. Int.J. Public Health. 2023, 67, 1605363. [Google Scholar] [CrossRef]
- Karimah, R.N.; Kusnanto, H.; Lazuardi, L. Development of the information quality scale for health information supply chain type 2 diabetes mellitus management using exploratory factor analysis. Journal of Public Health Research 2023, 12, 22799036231170843. [Google Scholar] [CrossRef]
- Fadahunsi, K.P.; Wark, P.; Mastellos, N.; et al. Assessment of Clinical Information Quality in Digital Health Technologies: International eDelphi Study. Journal of Medical Internet Research 2022, 24, e41889. [Google Scholar] [CrossRef] [PubMed]
- Stimpson, J.P.; Ortega, A.N. Social media users’ perceptions about health mis- and disinformation on social media. Health Affairs Scholar 2023, 1, qxad050. [Google Scholar] [CrossRef] [PubMed]
- Hwang, B.; Oh, S. College Students’ Perceived Credibility of Health Information on YouTube. Proceedings of the Association for Information Science and Technology 2023, 60, 60–69. [Google Scholar] [CrossRef]
- Chang, L.; Li, W.; Xin, X.; et al. Strategies for Assessing Health Information Credibility Among Older Social Media Users in China: A Qualitative Study. Health Communication 2023, 39, 2767–2778. [Google Scholar] [CrossRef]
- Nagler, R.H.; Vogel, R.; Gollust, S.E.; Yzer, M.C.; Rothman, A.J. Effects of Prior Exposure to Conflicting Health Information on Responses to Subsequent Unrelated Health Messages: Results from a Population-Based Longitudinal Experiment. Annals of Behavioral Medicine 2021, 56, 498–511. [Google Scholar] [CrossRef]
- Sui, Y.; Zhang, B. Determinants of the Perceived Credibility of Rebuttals Concerning Health Misinformation. International Journal of Environmental Research and Public Health 2021, 18, 1345. [Google Scholar] [CrossRef]
- Li, A.; Chen, G.; Yang, C. How cognitive conflict affects judgments of learning: Evaluating the contributions of processing fluency and metamemory beliefs. Memory & Cognition 2021, 49, 912–922. [Google Scholar]
- Rivas, D.R.Z.; Jaldin, M.L.L.; Canaviri, B.N.; et al. Social media exposure, risk perception, preventive behaviors and attitudes during the COVID-19 epidemic in La Paz, Bolivia: A cross-sectional study. PLOS ONE, 2021, 16, e0245859. [Google Scholar] [CrossRef]
- Yu, M.; Li, Z.; Yu, Z.; He, L.; Zhou, J. Communication related health crisis on social media: a case of COVID-19 outbreak. Current Issues in Tourism 2021, 24, 2699–2705. [Google Scholar] [CrossRef]
- Zhang, H. (Thomas); Tham, J.S.; Waheed, M. The Effects of Receiving and Expressing Health Information on Social Media during the COVID-19 Infodemic: An Online Survey among Malaysians. International Journal of Environmental Research and Public Health 2022, 19, 7991. [Google Scholar] [CrossRef]
- Schrage, M. Information Ecology: Mastering the Information and Knowledge Environment. Harvard Business Review 1997, 75, 185–189. [Google Scholar]
- Usinowicz, J.; O’Connor, M.I. The fitness value of ecological information in a variable world. Ecology Letters 2023, 26, 621–639. [Google Scholar] [CrossRef] [PubMed]
- KAWO. 2023 China Social Media Platform Guide. Social Media Report, 2023. Available online: https://www.sgpjbg.com/baogao/122692.html.
- Rajesh, M.A.; Hiwarkar, D.T. Exploring Preprocessing Techniques for Natural Language Text: A Comprehensive Study Using Python Code. International Journal of Engineering Technology and Management Sciences, 2023, 5, 1–10. [Google Scholar]
- Chen, Y.-C.; Shang, R.-A.; Kao, C.-Y. The effects of information overload on consumers’ subjective state towards buying decision in the internet shopping environment. Electronic Commerce Research and Applications 2009, 8, 48–58. [Google Scholar] [CrossRef]
- Pallavi, P.; Bakhla, A.; Kisku, R.R.; et al. Excessive and Unreliable Health Information and Its Predictability for Anxiety: A Cross-Sectional Observational Study. Cureus 2022, 14, e27149. [Google Scholar] [CrossRef]
- Shi, W. Health Information Seeking versus Avoiding: How Do College Students Respond to Stress-related Information? American Journal of Health Behavior 2019, 43, 437–448. [Google Scholar] [CrossRef]
- Zhang, S.; Zhao, L.; Lu, Y.; et al. Do you get tired of socializing? An empirical explanation of discontinuous usage behaviour in social network services. Information & Management 2016, 53, 904–914. [Google Scholar] [CrossRef]
- Cao, Y.; Li, J.; Qin, N.; et al. Examining the Effect of Overload on the MHealth Application Resistance Behavior of Elderly Users: An SOR Perspective. International Journal of Environmental Research and Public Health 2020, 17, 6658. [Google Scholar] [CrossRef]
- Afful-Dadzie, E.; Afful-Dadzie, A.; Egala, S.B. Social media in health communication: A literature review of information quality. Health Information Management Journal 2021, 52, 3–17. [Google Scholar] [CrossRef]
- Adebesin, F.; Smuts, H.; Mawela, T.; et al. The Role of Social Media in Health Misinformation and Disinformation During the COVID-19 Pandemic: Bibliometric Analysis. JMIR Infodemiology 2023, 3, e48620. [Google Scholar] [CrossRef]
- Zhang, Y.; Sun, Y.; Xie, B. Quality of health information for consumers on the web: A systematic review of indicators, criteria, tools, and evaluation results. Journal of the Association for Information Science and Technology 2015, 66, 2071–2084. [Google Scholar] [CrossRef]
- Bhattacherjee, A.; Sanford, C. Influence Processes for Information Technology Acceptance: An Elaboration Likelihood Model. MIS Quarterly 2006, 30, 805–825. [Google Scholar] [CrossRef]
- Sui, Y.; Zhang, B. Determinants of the Perceived Credibility of Rebuttals Concerning Health Misinformation. International Journal of Environmental Research and Public Health 2021, 18, 1345. [Google Scholar] [CrossRef] [PubMed]
- Laugesen, J.; Hassanein, K.; Yuan, Y. The Impact of Internet Health Information on Patient Compliance: A Research Model and an Empirical Study. Journal of Medical Internet Research 2015, 17, e143. [Google Scholar] [CrossRef]
- Zu, X.; Chen, M.; Guan, X. How Should the Medical Community Respond to the Low Quality of Medical Information on Social Media? European Urology Open Science 2021, 24, 9–10. [Google Scholar] [CrossRef]
- Dalmer, N. Questioning reliability assessments of health information on social media. Journal of the Medical Library Association 2017, 105, 61–68. [Google Scholar] [CrossRef]
- Wu, P.C.S.; Wang, Y. The influences of electronic word-of-mouth message appeal and message source credibility on brand attitude. Asia Pacific Journal of Marketing and Logistics 2011, 23, 448–472. [Google Scholar] [CrossRef]
- Chaoguang, H.; Feicheng, M.; Yifei, Q.; et al. Exploring the determinants of health knowledge adoption in social media: An intention-behavior-gap perspective. Information Development 2018, 34, 346–363. [Google Scholar] [CrossRef]
- Lee, Y.-I.; Jin, Y. Crisis Information Seeking and Sharing (CISS): Scale Development for Measuring Publics’ Communicative Behavior in Social-Mediated Public Health Crises. Journal of International Crisis and Risk Communication Research 2019, 2, 13–38. [Google Scholar] [CrossRef]
- Alasmari, H.; Zavalina, O.L. Using Two Theories in Exploration of the Health Information Diffusion on Social Media During a Global Health Crisis. Journal of 2023, 5, 2250095. [Google Scholar] [CrossRef]
- Chou, C.-H.; Wang, Y.-S.; Tang, T.-I. Exploring the determinants of knowledge adoption in virtual communities: A social influence perspective. International Journal of Information Management, 2015, 35, 364–376. [Google Scholar] [CrossRef]
- Ma, L.; Yang, B.; Wang, X.; et al. On the dimensionality of intragroup conflict: An exploratory study of conflict and its relationship with group innovation performance. International Journal of Conflict Management 2017, 28, 538–562. [Google Scholar] [CrossRef]
- Nagler, R.H.; Vogel, R.I.; Gollust, S.E.; et al. Public perceptions of conflicting information surrounding COVID-19: Results from a nationally representative survey of U.S. adults. PLOS ONE 2020, 15, e0240776. [Google Scholar] [CrossRef] [PubMed]
- Tocalli-Beller, A. Cognitive Conflict, Disagreement and Repetition in Collaborative Groups: Affective and Social Dimensions from an Insider’s Perspective. Canadian Modern Language Review 2003, 60, 143–172. [Google Scholar] [CrossRef]
- Pilowsky, I. Dimensions of Hypochondriasis. The British Journal of Psychiatry 1967, 113, 89–93. [Google Scholar] [CrossRef]
- Salkovskis, P.; Rimes, K.; Warwick, H.; Clark, D.M. The Health Anxiety Inventory: Development and Validation of Scales for the Measurement of Health Anxiety and Hypochondriasis. Psychological Medicine 2002, 32, 843–853. [Google Scholar] [CrossRef]
- Nahai, F. The Stress Factor of Social Media. Aesthetic Surgery Journal 2018, 38, 689–691. [Google Scholar] [CrossRef]
Figure 1.
The structural dimensions of health disinformation perception among social media users.
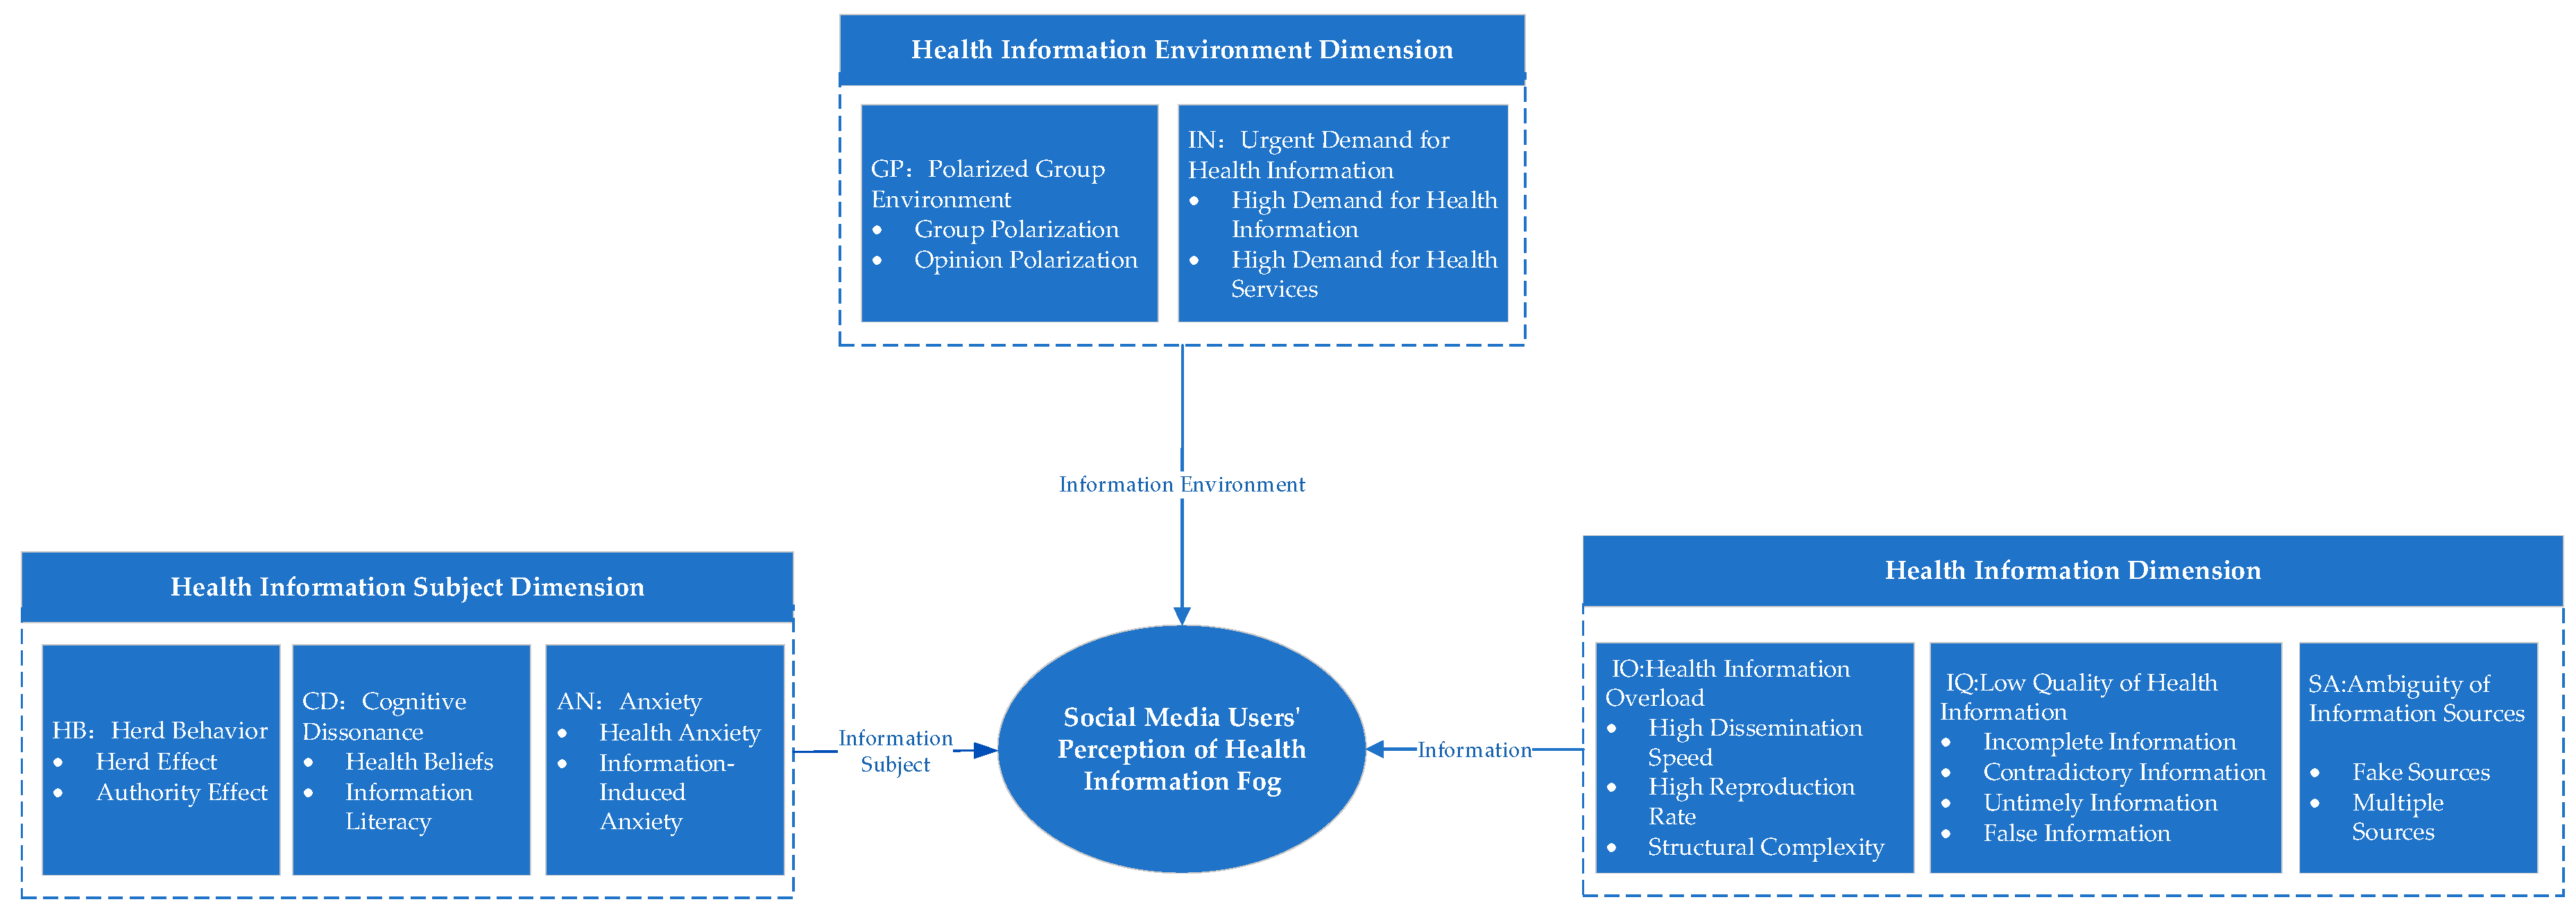
Figure 2.
CFA Model and Factor Loadings.
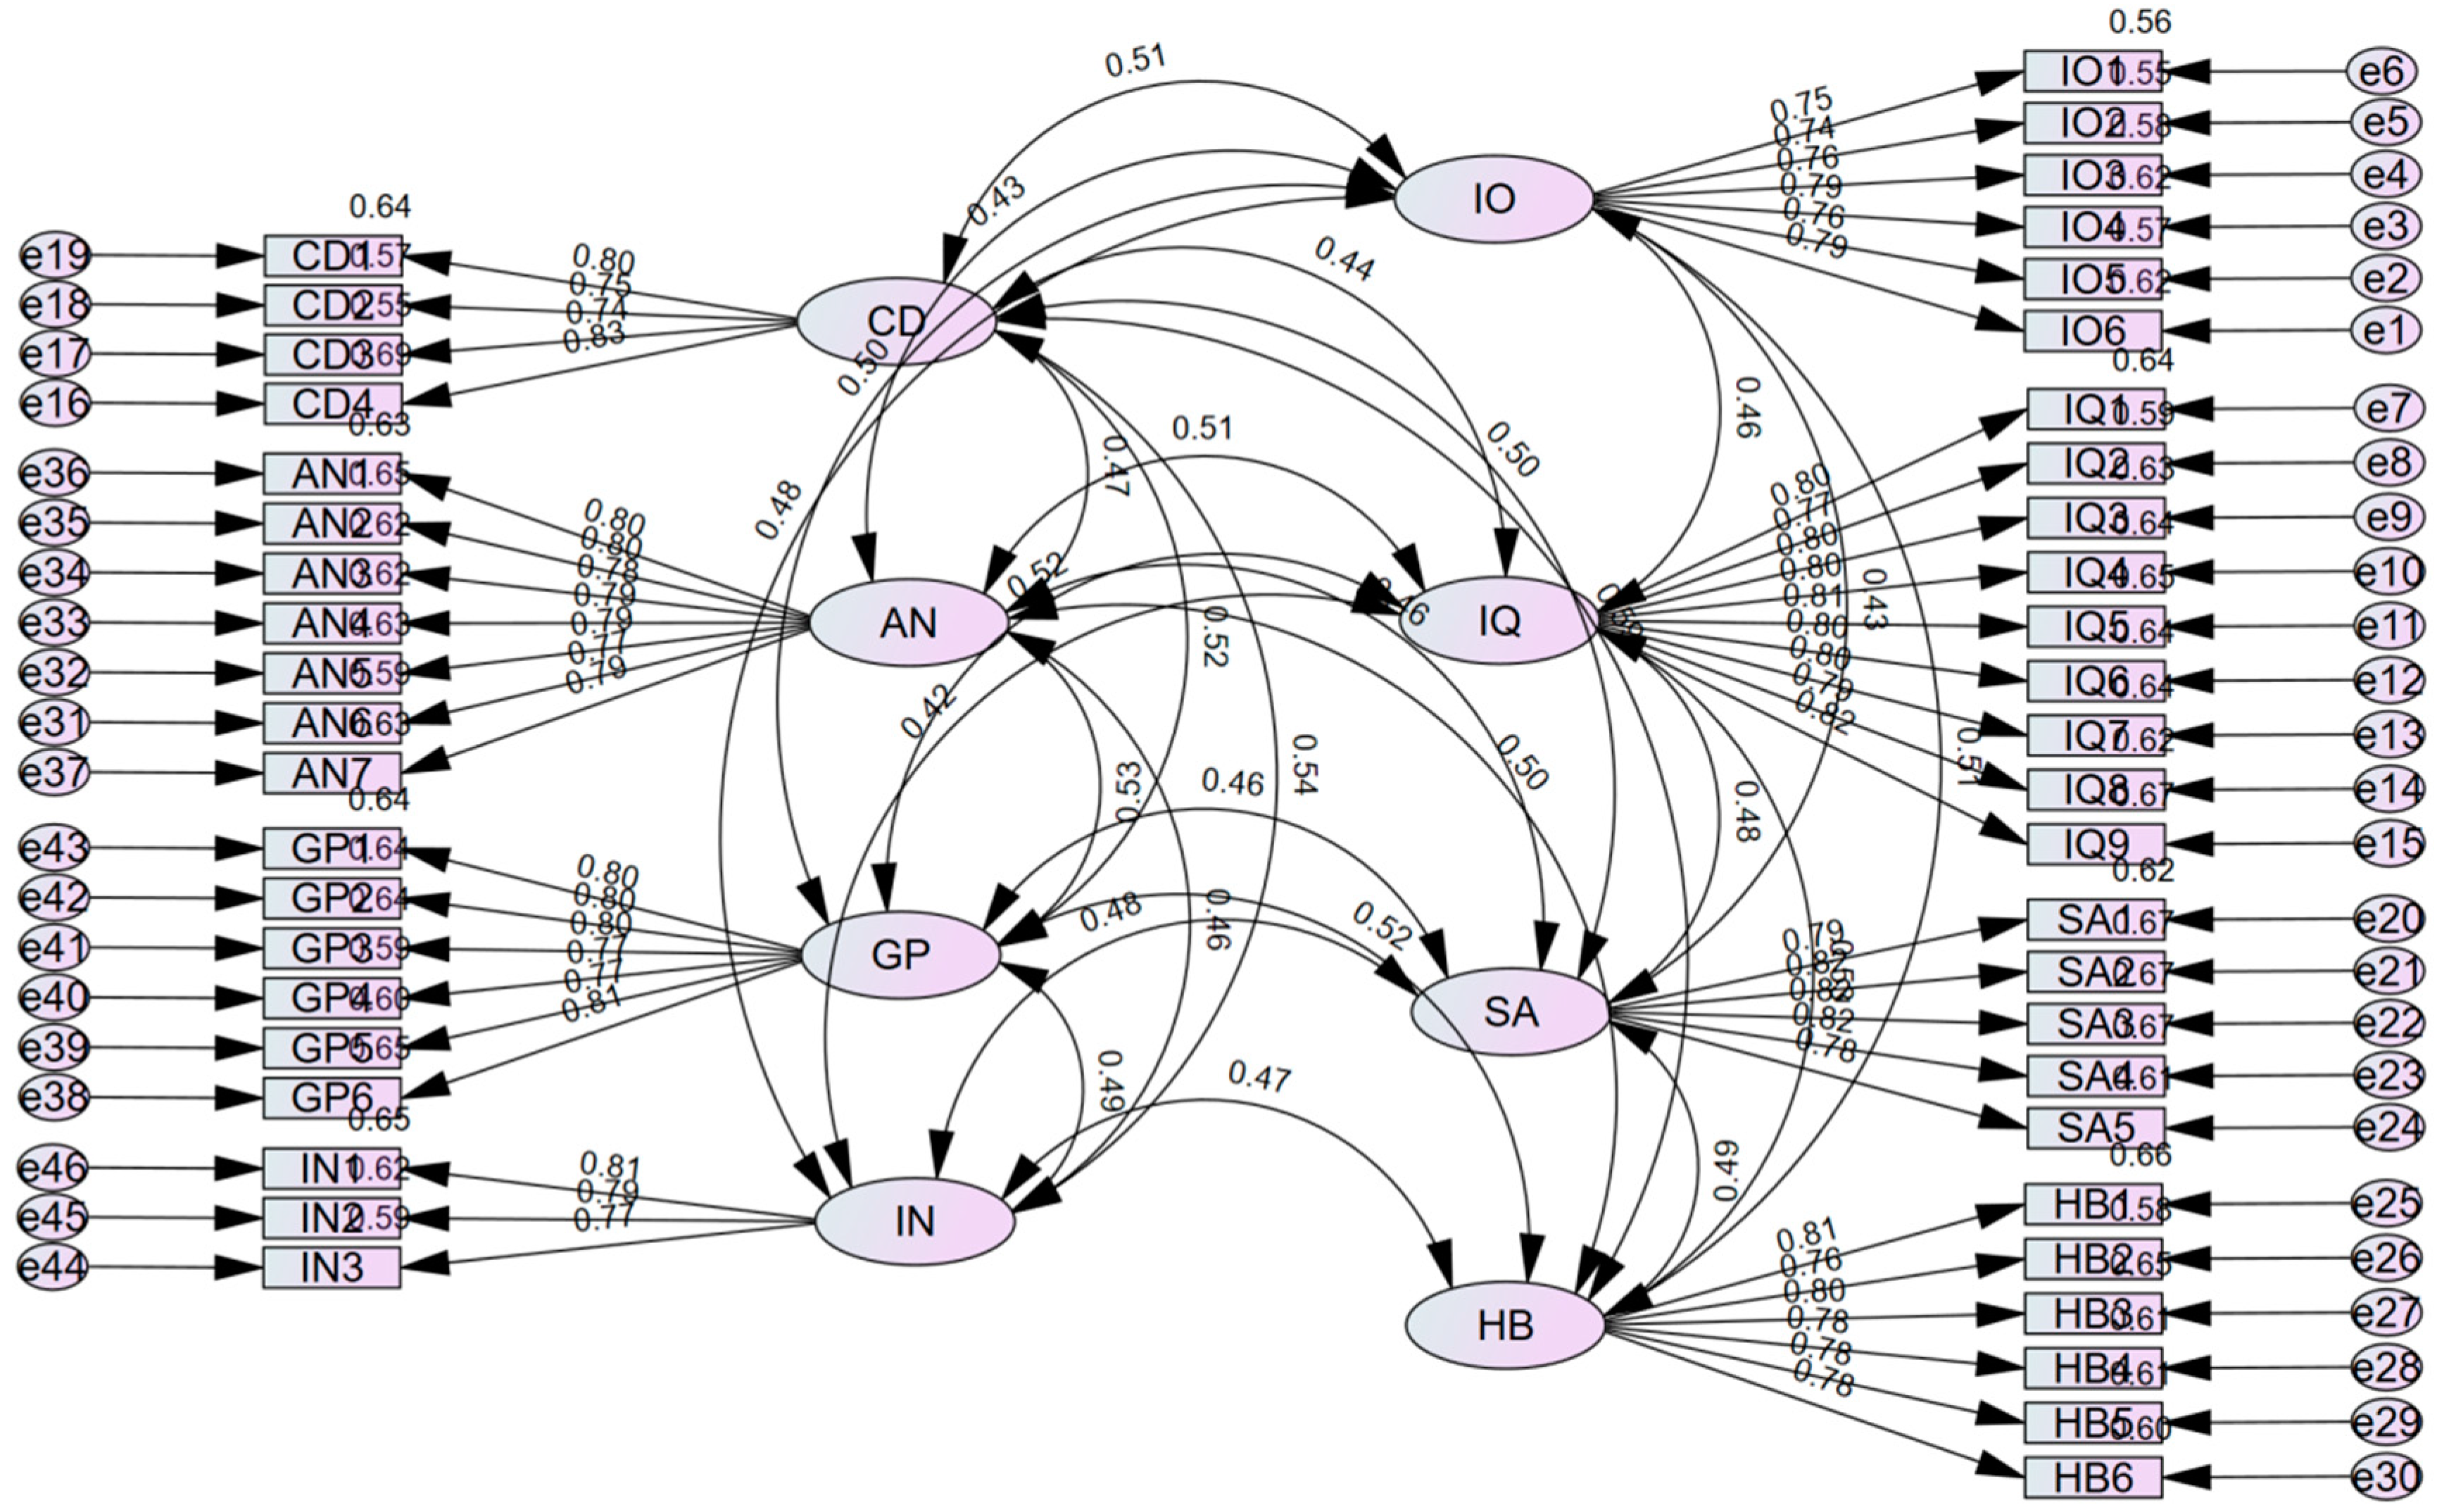

Table 1.
Participant characteristics.
| Attribute | Category | Number of Respondents | Attribute | Category | Number of Respondents |
|---|---|---|---|---|---|
| Gender | Male | 16 | Occupation | Retired | 8 |
| Female | 19 | Student | 12 | ||
| Age | 18-25 years old | 5 | Corporate Employee | 12 | |
| 26-35 years old | 8 | Other | 3 | ||
| 36-45 years old | 11 | Registration Time | < 0.5 years | 2 | |
| >46 | 11 | 0.5-1 year | 4 | ||
| Education | Associate Degree or Below | 18 | 1-3 years | 16 | |
| Bachelor's | 10 | 3-5 years | 10 | ||
| Master's and Above | 7 | > 5 years | 3 | ||
| Social Media Source | WeChat Video Accounts | 10 | Health Info Browsing Frequency | Rarely (Seasonally) | 2 |
| Douyin | 16 | Occasionally (Monthly) | 5 | ||
| Kuaishou | 9 | Often (Weekly) | 15 | ||
| Always (Daily) | 13 |
Table 2.
Main Axis Coding Results.
| Information Ecology Factor |
Main Theme |
Initial Category |
Typical Evidence Citation |
|---|---|---|---|
|
Information |
Health Information Overload | Information spreads rapidly, reproduction is fast, and hierarchical structure is complex | "On social media platforms, I find that health information spreads very quickly. Everyone is forwarding and commenting, and within minutes, there are hundreds of responses." |
| Low Quality of Health Information | Information lacks timeliness, updates are relatively slow, and accuracy is questionable. Some information is incomplete, and outdated information continues to circulate | "I often see some health information, but it’s hard to judge whether it’s real. Sometimes, I feel the information lacks integrity; some outdated information is still being spread." | |
| Ambiguity of Information Sources | Claims of authority from experts or institutions are false, and sources are difficult to identify | "Many people online claim to be authoritative experts posting health information, but later I realized they were not credible. Sometimes, it’s hard to identify where the forwarded information originates." | |
|
Information Subjects |
Blind Conformity Among Health Information Disseminators | Herd effect, authority effect | "I see everyone forwarding certain health information, and I think it must be correct, so I forward it as well. Some people forward information because they believe it comes from an authoritative source." |
| Cognitive Dissonance Among Health Information Consumers | Information literacy, deeply ingrained health concepts, and uncertain information environments reduce individuals' cognitive capacity | "Sometimes, I find myself opposing or doubting health information that conflicts with my original views, resulting in skepticism or even rejection of new health information. Facing a large amount of health information, I feel confused and unsure of what to trust." | |
| Anxiety Among Health Information Consumers | Psychological health level, health anxiety, information-induced anxiety | "During the pandemic, I paid close attention to health information, but sometimes I felt anxious because of conflicting or fake information, which affected my mood. Misinformation often causes anxiety among users." | |
|
Information Environment |
Polarized Group Environments | Polarization of groups, polarization of opinions | "In our social circles, people tend to share and forward health information aligned with their views, rarely seeing different voices. The structural setup of social media circles can lead to the spread of one-sided information, forming polarized groups and opinions." |
| Urgent Demand for Health Information | Demand for Health Information and Health Services | "When health problems arise, I first search online to check what symptoms might indicate. I hope to find authoritative information and professional services to address my concerns, and many people around me do the same." |
Table 3.
Structural dimensions and their meanings.
| Dimension/Concept | Meaning |
|---|---|
| Health Information Overload | Social media facilitates the rapid spread of emotions, opinions, or behaviors, resulting in users perceiving an overload of health information due to its low reproduction cost and complex structure. |
| Low Quality of Health Information | Online health information is often incomplete, contradictory, or outdated. It lacks timeliness, infrequent updates, and reliability, leading to users perceiving a low quality of health information. |
| Ambiguity of Information Sources | Fake or duplicate sources of health information make it difficult for users to identify the authenticity of the sources, resulting in perceived ambiguity in the origins of health information. |
| Herd Behavior Among Spreaders | Social media users may succumb to psychological and social pressures, such as peer pressure, exposure pressure, and authority influence, leading to biased or irrational behaviors. |
| Cognitive Dissonance Among Consumers | Audience members' preconceived health beliefs conflict with new health information, forming rigid impressions and resulting in misalignment between initial views and alternative perspectives. |
| Anxiety Among Consumers | The impact of health conditions on audiences' physical and mental health triggers anxiety and stress, with the overwhelming amount of health information on social media exacerbating this emotional state. |
| Polarized Group Environment | In highly cohesive social media groups, individuals are repeatedly exposed to similar health information, rarely encountering differing viewpoints, leading to group polarization and extreme opinion dynamics. |
| Urgent Demand for Health Information | The environment is shaped by the strong demand for health information and services, as users require higher-quality information or assistance to meet their health needs. |
Table 4.
Scale Measurement Items and Sources.
| Dimension/Concept | Item | Reference Source |
|---|---|---|
| Health Information Overload (IO) | 1 It is difficult to fully understand the excessive health information on social media. | Y. Chen et al. [36] |
| 2 Excessive health information on social media makes it difficult for me to notice important information. | P. Pallavi et al. [37] | |
| 3 It is burdensome to fully comprehend the excessive health information on social media. | J. Jensen et al. [18] | |
| 4 Excessive health information on social media makes me feel tense. | W. Shi [38] | |
| 5 Only a small portion of the excessive health information on social media is what I need. | S. Zhang et al. [39] | |
| 6 While browsing health information on social media, I often get distracted by the abundance of information. | Y. Cao et al. [40] | |
| Low-Quality Health Information (IQ) | 1 Health information on social media is often incomplete. | E. Afful-Dadzie et al. [41] |
| 2 Health information on social media is often inconsistent. | ||
| 3 Health information on social media often lacks authenticity. | F. Adebesin et al. [42] | |
| 4 Health information on social media is often not updated in a timely manner. | Y. Zhang et al. [43] | |
| 5 Most of the health information on social media is of little value. | A. Bhattacheriee et al. [44] | |
| 6 Most of the health information on social media is meaningless. | Y. Sui [45] | |
| 7 Most of the health information on social media does not meet my needs. | J. Laugesen et al. [46] | |
| 8 Health information seen on social media is often about similar topics and categories. | ||
| 9 Health information on social media is often difficult to understand. | ||
| 10 I feel that most of the health information on social media is unprofessional. | X. Zu et al. [47] | |
| 11 I feel that most of the health information on social media is not objective. | ||
| Ambiguous Information Sources (SA) | 1 Many health information sources on social media appear to be fabricated. | Interview |
| 2 Health information sources on social media are diverse and complex, making it difficult to distinguish between true and false. | ||
| 3 Many health information sources on social media are unreliable. | N. Dalmer [48] | |
| 4 Health information sources on social media are generally untrustworthy. | ||
| 5 Most health information publishers on social media are not experts in this field. | P. Wu et al. [49] | |
| 6 Most health information publishers on social media are not qualified to comment on related topics. | C. Huo et al. [50] | |
| Herd Behavior (HB) | 1 I tend to share widely endorsed health information. | Y-I Lee et al. [51] |
| 2 The mainstream opinions on social media often influence my behavior in sharing health information. | ||
| 3 I tend to share health information that has been widely reposted. | ||
| 4 I tend to share health information published by well-known health experts on social media. | A. Hanan et al. [52] | |
| 5 I tend to share health information from authoritative organizations. | ||
| 6 I tend to share recommendations from influential users on social media. | ||
| Cognitive Conflict (CD) | 1 The health information I see on social media differs from my prior knowledge. | C. Chou et al. [53] |
| 2 The health information I see on social media conflicts with my prior knowledge. | L. Ma et al. [54] | |
| 3 The health information I see on social media is inconsistent with my prior knowledge. | R. Nagler et al. [55] | |
| 4 When I share the health information I see on social media with my family, they mostly disagree. | T. Agustina et al. [56] | |
| Anxiety (AN) | 1 Many times, I still feel confused after searching for health information on social media. | L. Pilowsky [57] |
| 2 I feel frustrated after searching for health information on social media. | ||
| 3 I feel scared after searching for health information on social media. | ||
| 4 Seeing health information related to me on social media makes me feel stressed and tense. | Interview | |
| 5 Ambiguous health information makes me feel uneasy. | P. Salkovskis [58] | |
| 6 I am annoyed by behaviors such as advertisements, requests for likes, and follows on social media. | F. Nahai et al. [59] | |
| 7 I am often forced to receive health information on social media involuntarily. | ||
| 8 I worry that personal health information on social media platforms may be leaked. | ||
| 9 I am easily influenced and disturbed by health information on social media. | ||
| Polarized Environment (GP) | 1 Social media platforms often recommend similar health information to me. | Interview |
| 2 When different opinions about health information exist on social media, I tend to trust bloggers whose views align with mine. | ||
| 3 When different opinions about health information exist on social media, I prefer the content published by bloggers I follow. | ||
| 4 When different opinions about health information exist on social media, I am more likely to repost the content from bloggers I follow to support their views. | ||
| 5 Interacting with bloggers I follow on social media deepens my impression of the health information they post. | ||
| 6 Interacting with bloggers I follow on social media makes me believe that the information they post is correct. | ||
| 7 On social media platforms, I only care about the health information posted by the bloggers I follow and ignore information from others. | ||
| 8 Browsing only health information posted by bloggers I follow on social media reduces the psychological burden of excessive online information. | ||
| Health Information Urgency (IN) | 1 The sharing and dissemination of health information on social media is extensive. | Interview |
| 2 Health information posted on social media often sparks widespread discussion. | ||
| 3 The demand for searching health information on social media is increasing. | ||
| 4 Many people first consider searching for answers on social media when facing health concerns. |
Table 5.
Results of the Reliability Test for the Initial Scale.
| Variable | Symbol | CITC Value | Cronbach's Alpha After Item Deletion | Overall Alpha |
|---|---|---|---|---|
| IO | IO1 | 0.721 | 0.881 | 0.899 |
| IO2 | 0.75 | 0.877 | ||
| IO3 | 0.729 | 0.88 | ||
| IO4 | 0.704 | 0.884 | ||
| IO5 | 0.669 | 0.889 | ||
| IO6 | 0.778 | 0.873 | ||
| IQ | IQ1 | 0.754 | 0.882 | 0.898 |
| IQ2 | 0.749 | 0.882 | ||
| IQ3 | 0.715 | 0.884 | ||
| IQ4 | 0.688 | 0.885 | ||
| IQ5 | 0.719 | 0.884 | ||
| IQ6 | 0.732 | 0.883 | ||
| IQ7 | 0.283 | 0.91 | ||
| IQ8 | 0.3 | 0.908 | ||
| IQ9 | 0.71 | 0.884 | ||
| IQ10 | 0.678 | 0.886 | ||
| IQ11 | 0.691 | 0.885 | ||
| SA | SA1 | 0.408 | 0.879 | 0.857 |
| SA2 | 0.609 | 0.839 | ||
| SA3 | 0.763 | 0.811 | ||
| SA4 | 0.714 | 0.821 | ||
| SA5 | 0.695 | 0.824 | ||
| SA6 | 0.726 | 0.819 | ||
| HB | HB1 | 0.689 | 0.84 | 0.866 |
| HB2 | 0.637 | 0.848 | ||
| HB3 | 0.668 | 0.842 | ||
| HB4 | 0.684 | 0.839 | ||
| HB5 | 0.655 | 0.845 | ||
| HB6 | 0.646 | 0.847 | ||
| CD | CD1 | 0.723 | 0.803 | 0.854 |
| CD2 | 0.698 | 0.813 | ||
| CD3 | 0.685 | 0.819 | ||
| CD4 | 0.676 | 0.822 | ||
| AN | AN1 | 0.703 | 0.871 | 0.888 |
| AN2 | 0.742 | 0.869 | ||
| AN3 | 0.376 | 0.898 | ||
| AN4 | 0.679 | 0.873 | ||
| AN5 | 0.711 | 0.871 | ||
| AN6 | 0.736 | 0.869 | ||
| AN7 | 0.712 | 0.87 | ||
| AN8 | 0.441 | 0.894 | ||
| AN9 | 0.751 | 0.867 | ||
| GP | GP1 | 0.58 | 0.805 | 0.829 |
| GP2 | 0.7 | 0.791 | ||
| GP3 | 0.619 | 0.8 | ||
| GP4 | 0.573 | 0.806 | ||
| GP5 | 0.596 | 0.803 | ||
| GP6 | 0.594 | 0.804 | ||
| GP7 | 0.395 | 0.834 | ||
| GP8 | 0.437 | 0.825 | ||
| IN | IN1 | 0.568 | 0.714 | 0.765 |
| IN2 | 0.488 | 0.783 | ||
| IN3 | 0.607 | 0.688 | ||
| IN4 | 0.668 | 0.659 |
Table 6.
Results of the Exploratory Factor Analysis (N=155).
| Item | Factor Loading | |||||||
|---|---|---|---|---|---|---|---|---|
| 1 | 2 | 3 | 4 | 5 | 6 | 7 | 8 | |
| IO1 | 0.781 | 0.224 | -0.022 | -0.116 | -0.085 | -0.195 | -0.073 | 0.019 |
| IO2 | 0.745 | 0.273 | -0.142 | -0.056 | -0.128 | -0.075 | -0.091 | -0.171 |
| IO2 | 0.634 | 0.332 | -0.101 | -0.155 | -0.104 | -0.239 | -0.107 | -0.094 |
| IO3 | 0.707 | 0.281 | -0.042 | -0.156 | -0.005 | -0.146 | -0.189 | -0.162 |
| IO3 | 0.571 | 0.416 | -0.22 | -0.134 | -0.138 | -0.08 | -0.143 | 0.028 |
| IO4 | 0.727 | 0.269 | -0.084 | -0.141 | -0.192 | -0.202 | -0.089 | -0.148 |
| IQ1 | 0.175 | 0.747 | -0.111 | -0.138 | -0.064 | -0.1 | -0.104 | -0.193 |
| IQ2 | 0.344 | 0.754 | 0.002 | -0.033 | 0.086 | -0.086 | -0.126 | -0.067 |
| IQ3 | 0.126 | 0.75 | -0.196 | -0.06 | -0.012 | -0.055 | -0.033 | -0.196 |
| IQ4 | 0.285 | 0.704 | -0.019 | 0.021 | 0.007 | -0.093 | -0.109 | -0.101 |
| IQ5 | 0.171 | 0.732 | -0.135 | -0.163 | 0.003 | -0.098 | -0.189 | -0.017 |
| IQ6 | 0.133 | 0.76 | -0.146 | -0.151 | -0.128 | -0.139 | -0.095 | -0.012 |
| IQ9 | 0.177 | 0.714 | -0.141 | -0.073 | -0.101 | -0.098 | -0.144 | -0.074 |
| IQ10 | 0.115 | 0.731 | -0.086 | -0.068 | -0.115 | -0.198 | -0.046 | -0.046 |
| IQ11 | 0.061 | 0.754 | -0.115 | -0.11 | -0.126 | -0.146 | -0.014 | -0.018 |
| SA2 | -0.199 | -0.105 | 0.698 | 0.07 | 0.081 | 0.154 | 0.044 | -0.071 |
| SA3 | -0.094 | -0.214 | 0.782 | 0.132 | 0.145 | 0.198 | 0.053 | 0.074 |
| SA4 | -0.067 | -0.164 | 0.72 | 0.112 | 0.171 | 0.255 | 0.148 | 0.054 |
| SA5 | 0.05 | -0.163 | 0.79 | 0.002 | 0.058 | 0.135 | 0.184 | 0.07 |
| SA6 | -0.109 | -0.143 | 0.783 | 0.157 | 0.14 | 0.097 | 0.094 | 0.034 |
| HB1 | -0.213 | -0.166 | -0.02 | 0.743 | 0.091 | 0.171 | 0.119 | 0.022 |
| HB2 | 0.005 | -0.059 | 0.224 | 0.677 | 0.035 | 0.222 | 0.195 | 0.052 |
| HB3 | -0.03 | -0.209 | 0.114 | 0.652 | 0.148 | 0.105 | 0.308 | 0.115 |
| HB4 | -0.163 | -0.141 | -0.023 | 0.753 | 0.137 | 0.122 | 0.164 | -0.01 |
| HB5 | -0.042 | -0.075 | 0.146 | 0.722 | 0.12 | 0.14 | 0.019 | 0.204 |
| HB6 | -0.153 | -0.041 | 0.1 | 0.719 | 0.077 | 0.042 | 0.114 | 0.173 |
| CD1 | -0.13 | -0.104 | 0.214 | 0.154 | 0.763 | 0.029 | 0.115 | 0.044 |
| CD2 | -0.142 | -0.105 | 0.091 | 0.136 | 0.783 | 0.079 | 0.164 | 0.044 |
| CD3 | -0.035 | -0.013 | 0.163 | 0.222 | 0.777 | 0.049 | -0.021 | 0.186 |
| CD4 | -0.105 | -0.098 | 0.061 | 0.01 | 0.823 | 0.081 | 0.061 | -0.021 |
| AN1 | -0.181 | -0.192 | 0.089 | 0.111 | -0.005 | 0.767 | 0.023 | 0.08 |
| AN2 | -0.139 | -0.164 | 0.184 | 0.202 | 0.092 | 0.698 | 0.215 | 0.108 |
| AN4 | -0.11 | -0.123 | 0.023 | 0.109 | 0.032 | 0.765 | 0.148 | 0.126 |
| AN5 | -0.068 | -0.199 | 0.119 | 0.092 | 0.166 | 0.709 | 0.204 | 0.13 |
| AN6 | -0.177 | -0.094 | 0.171 | 0.054 | 0.013 | 0.739 | 0.151 | 0.136 |
| AN7 | -0.156 | -0.11 | 0.112 | 0.153 | 0.051 | 0.727 | 0.142 | -0.068 |
| AN8 | 0.01 | -0.048 | 0.264 | 0.102 | 0.016 | 0.536 | -0.14 | 0.032 |
| GP1 | -0.057 | -0.072 | 0.118 | 0.107 | 0.28 | 0.15 | 0.662 | -0.002 |
| GP2 | -0.104 | -0.154 | 0.019 | 0.123 | 0.058 | 0.094 | 0.754 | 0.064 |
| GP3 | -0.149 | -0.065 | 0.111 | 0.124 | 0.103 | 0.04 | 0.688 | 0.066 |
| GP4 | -0.128 | -0.206 | 0.161 | 0.179 | -0.078 | 0.111 | 0.668 | 0.101 |
| GP5 | -0.047 | -0.12 | 0.071 | 0.188 | 0.008 | 0.178 | 0.666 | -0.063 |
| IN1 | -0.202 | -0.184 | 0.055 | 0.095 | 0.06 | 0.156 | 0.059 | 0.73 |
| IN3 | -0.026 | -0.165 | 0.018 | 0.225 | 0.132 | 0.112 | 0.001 | 0.795 |
| IN4 | -0.12 | -0.118 | 0.033 | 0.119 | 0.026 | 0.123 | 0.076 | 0.78 |
Table 7.
Descriptive Statistics of the Sample(N=561).
| Attribute | Category | Number of Respondents(N=561) | Percentage(%) |
|---|---|---|---|
| Gender | Male | 287 | 51.2 |
| Female | 274 | 48.8 | |
| Age | <20years old | 69 | 12.3 |
| 20—29years old | 144 | 25.7 | |
| 30—39years old | 204 | 36.4 | |
| 40—49years old | 117 | 20.9 | |
| ≥50years old | 27 | 4.8 | |
| Education | Junior high school or below | 15 | 2.7 |
| High school | 39 | 7.0 | |
| Vocational college | 183 | 32.6 | |
| Bachelor's degree or above | 324 | 57.8 | |
| Social Media Usage Frequency |
Frequently, almost every day | 179 | 31.9 |
| Occasionally, 1–3 times per week | 205 | 36.5 | |
| Sometimes, 1–3 times per month | 183 | 32.6 | |
| Rarely, 1–3 times in the past three months | 39 | 7.0 | |
| Never, no usage in the past three months | 23 | 4.1 | |
| Self-Reported Health Status |
Very good | 165 | 29.4 |
| Good | 191 | 34.1 | |
| Average | 96 | 17.1 | |
| Poor | 78 | 13.9 | |
| Very poor | 31 | 5.5 |
Table 8.
Rotated Component Matrix of the Formal Questionnaire.
| Item | Factor Loading | |||||||
|---|---|---|---|---|---|---|---|---|
| 1 | 2 | 3 | 4 | 5 | 6 | 7 | 8 | |
| IO1 | 0.737 | 0.210 | 0.086 | 0.048 | 0.167 | 0.089 | 0.193 | 0.051 |
| IO2 | 0.773 | 0.156 | 0.108 | 0.124 | 0.038 | 0.135 | 0.080 | 0.091 |
| IO3 | 0.772 | 0.122 | 0.087 | 0.065 | 0.084 | 0.142 | 0.120 | 0.009 |
| IO4 | 0.769 | 0.134 | 0.135 | 0.073 | 0.058 | 0.174 | 0.107 | 0.064 |
| IO5 | 0.746 | 0.137 | 0.130 | 0.072 | 0.064 | 0.137 | 0.128 | 0.057 |
| IO6 | 0.728 | 0.062 | 0.056 | 0.106 | 0.185 | 0.208 | 0.126 | 0.143 |
| IQ1 | 0.158 | 0.674 | 0.184 | 0.111 | 0.123 | 0.228 | 0.110 | 0.115 |
| IQ2 | 0.163 | 0.729 | 0.139 | 0.012 | 0.116 | 0.108 | 0.098 | 0.152 |
| IQ3 | 0.189 | 0.740 | 0.106 | 0.117 | 0.036 | 0.143 | 0.158 | 0.079 |
| IQ4 | 0.205 | 0.754 | 0.143 | 0.106 | 0.070 | 0.036 | 0.120 | 0.049 |
| IQ5 | 0.034 | 0.726 | 0.163 | 0.180 | 0.036 | 0.185 | 0.209 | 0.108 |
| IQ6 | 0.126 | 0.741 | 0.078 | 0.062 | 0.160 | 0.083 | 0.155 | 0.085 |
| IQ7 | 0.107 | 0.751 | 0.143 | 0.118 | 0.114 | 0.237 | 0.064 | 0.043 |
| IQ8 | -0.039 | 0.749 | 0.045 | 0.163 | 0.020 | 0.176 | 0.137 | 0.022 |
| IQ9 | 0.103 | 0.792 | 0.064 | 0.104 | 0.135 | 0.111 | 0.085 | 0.099 |
| SA1 | 0.093 | 0.126 | 0.732 | 0.118 | -0.007 | 0.197 | 0.141 | 0.069 |
| SA2 | 0.087 | 0.151 | 0.749 | 0.200 | 0.193 | 0.013 | 0.066 | 0.039 |
| SA3 | 0.115 | 0.226 | 0.769 | 0.135 | 0.091 | 0.079 | 0.084 | 0.063 |
| SA4 | 0.099 | 0.140 | 0.752 | 0.117 | 0.174 | 0.038 | 0.148 | 0.099 |
| SA5 | 0.212 | 0.171 | 0.761 | 0.156 | 0.112 | 0.159 | 0.093 | -0.010 |
| HB1 | 0.062 | 0.124 | 0.107 | 0.792 | 0.041 | 0.048 | 0.083 | 0.123 |
| HB2 | 0.038 | 0.113 | 0.168 | 0.752 | 0.127 | 0.162 | 0.146 | 0.091 |
| HB3 | 0.174 | 0.114 | 0.096 | 0.778 | 0.162 | 0.037 | 0.130 | 0.148 |
| HB4 | 0.081 | 0.131 | 0.084 | 0.769 | 0.136 | 0.095 | 0.073 | 0.029 |
| HB5 | -0.008 | 0.122 | 0.139 | 0.759 | 0.018 | 0.125 | 0.033 | 0.051 |
| HB6 | 0.163 | 0.142 | 0.127 | 0.770 | 0.050 | 0.097 | 0.199 | 0.063 |
| CD1 | 0.122 | 0.187 | 0.252 | 0.097 | 0.727 | 0.243 | 0.146 | 0.113 |
| CD2 | 0.120 | 0.120 | 0.098 | 0.154 | 0.757 | 0.210 | 0.171 | 0.108 |
| CD3 | 0.158 | 0.204 | 0.172 | 0.163 | 0.737 | 0.210 | 0.175 | 0.137 |
| CD4 | 0.220 | 0.190 | 0.127 | 0.153 | 0.703 | 0.145 | 0.170 | 0.038 |
| AN1 | 0.156 | 0.172 | 0.108 | 0.112 | 0.042 | 0.763 | 0.168 | 0.093 |
| AN2 | 0.194 | 0.124 | 0.067 | 0.134 | 0.152 | 0.734 | 0.118 | 0.065 |
| AN3 | 0.059 | 0.215 | 0.085 | 0.074 | 0.139 | 0.760 | 0.098 | 0.161 |
| AN4 | 0.148 | 0.162 | -0.010 | 0.088 | 0.101 | 0.785 | 0.114 | 0.059 |
| AN5 | 0.133 | 0.175 | 0.091 | 0.129 | 0.137 | 0.732 | 0.036 | 0.079 |
| AN6 | 0.138 | 0.132 | 0.147 | 0.049 | 0.058 | 0.768 | 0.185 | -0.017 |
| AN7 | 0.144 | 0.145 | 0.071 | 0.050 | 0.179 | 0.693 | 0.205 | 0.174 |
| GP1 | 0.119 | 0.145 | 0.069 | 0.113 | 0.055 | 0.169 | 0.779 | 0.098 |
| GP2 | 0.124 | 0.192 | 0.132 | 0.106 | 0.112 | 0.182 | 0.769 | 0.052 |
| GP3 | 0.166 | 0.167 | 0.088 | 0.122 | 0.138 | 0.147 | 0.744 | 0.065 |
| GP4 | 0.150 | 0.067 | 0.145 | 0.113 | 0.089 | 0.082 | 0.788 | 0.094 |
| GP5 | 0.135 | 0.223 | 0.086 | 0.078 | 0.050 | 0.164 | 0.790 | 0.026 |
| GP6 | 0.081 | 0.168 | 0.058 | 0.143 | 0.204 | 0.113 | 0.755 | 0.079 |
| IN1 | 0.058 | 0.227 | 0.068 | 0.180 | 0.082 | 0.137 | 0.151 | 0.757 |
| IN2 | 0.155 | 0.119 | 0.087 | 0.252 | 0.124 | 0.191 | 0.097 | 0.745 |
| IN3 | 0.158 | 0.214 | 0.092 | 0.067 | 0.128 | 0.173 | 0.113 | 0.783 |
Table 9.
Results of AVE and CR Indicators.
| Item | Average Variance Extracted AVE Value | Composite Reliability CR Value |
|---|---|---|
| IO | 0.584 | 0.894 |
| IQ | 0.634 | 0.940 |
| SA | 0.647 | 0.902 |
| HB | 0.619 | 0.907 |
| CD | 0.613 | 0.863 |
| AN | 0.623 | 0.920 |
| GP | 0.626 | 0.909 |
| IN | 0.624 | 0.833 |
Table 10.
Discriminant Validity: Pearson Correlation and Square Root of AVE.
| IO | IQ | SA | HB | CD | AN | GP | IN | |
|---|---|---|---|---|---|---|---|---|
| IO | 0.764 | |||||||
| IQ | 0.418 | 0.796 | ||||||
| SA | 0.392 | 0.446 | 0.804 | |||||
| HB | 0.461 | 0.485 | 0.444 | 0.787 | ||||
| CD | 0.458 | 0.402 | 0.441 | 0.525 | 0.783 | |||
| AN | 0.395 | 0.473 | 0.418 | 0.455 | 0.420 | 0.789 | ||
| GP | 0.451 | 0.485 | 0.417 | 0.475 | 0.461 | 0.483 | 0.791 | |
| IN | 0.416 | 0.377 | 0.416 | 0.408 | 0.454 | 0.405 | 0.426 | 0.790 |
| Note: The diagonal values represent the square root of the AVE. | ||||||||
Table 11.
Estimation of Factor Loadings between Observed Variables and Their Corresponding Latent Variables.
Table 11.
Estimation of Factor Loadings between Observed Variables and Their Corresponding Latent Variables.
| Unstd | S.E. | C.R. | P | |||
|---|---|---|---|---|---|---|
| IO6 | <--- | IO | 1 | |||
| IO5 | <--- | IO | 0.923 | 0.069 | 13.34 | *** |
| IO4 | <--- | IO | 1.005 | 0.072 | 14.008 | *** |
| IO3 | <--- | IO | 0.963 | 0.071 | 13.489 | *** |
| IO2 | <--- | IO | 0.873 | 0.067 | 13.013 | *** |
| IO1 | <--- | IO | 0.918 | 0.07 | 13.105 | *** |
| IQ1 | <--- | IQ | 1 | |||
| IQ2 | <--- | IQ | 0.932 | 0.065 | 14.331 | *** |
| IQ3 | <--- | IQ | 0.981 | 0.065 | 15.122 | *** |
| IQ4 | <--- | IQ | 0.985 | 0.065 | 15.175 | *** |
| IQ5 | <--- | IQ | 1.017 | 0.066 | 15.381 | *** |
| IQ6 | <--- | IQ | 0.997 | 0.066 | 15.149 | *** |
| IQ7 | <--- | IQ | 0.992 | 0.065 | 15.198 | *** |
| IQ8 | <--- | IQ | 0.965 | 0.065 | 14.841 | *** |
| IQ9 | <--- | IQ | 1.027 | 0.066 | 15.633 | *** |
| CD4 | <--- | CD | 1 | |||
| CD3 | <--- | CD | 0.924 | 0.069 | 13.422 | *** |
| CD2 | <--- | CD | 0.928 | 0.068 | 13.618 | *** |
| CD1 | <--- | CD | 1.017 | 0.069 | 14.686 | *** |
| SA1 | <--- | SA | 1 | |||
| SA2 | <--- | SA | 1.034 | 0.07 | 14.762 | *** |
| SA3 | <--- | SA | 1.028 | 0.07 | 14.759 | *** |
| SA4 | <--- | SA | 1.01 | 0.068 | 14.832 | *** |
| SA5 | <--- | SA | 0.976 | 0.07 | 13.899 | *** |
| HB1 | <--- | HB | 1 | |||
| HB2 | <--- | HB | 0.965 | 0.068 | 14.153 | *** |
| HB3 | <--- | HB | 1.01 | 0.067 | 15.117 | *** |
| HB4 | <--- | HB | 0.972 | 0.067 | 14.597 | *** |
| HB5 | <--- | HB | 0.955 | 0.066 | 14.528 | *** |
| HB6 | <--- | HB | 0.978 | 0.068 | 14.466 | *** |
| AN6 | <--- | AN | 1 | |||
| AN5 | <--- | AN | 1.002 | 0.072 | 14.002 | *** |
| AN4 | <--- | AN | 0.966 | 0.07 | 13.889 | *** |
| AN3 | <--- | AN | 1.018 | 0.073 | 13.853 | *** |
| AN2 | <--- | AN | 1.02 | 0.072 | 14.25 | *** |
| AN1 | <--- | AN | 1.009 | 0.072 | 14.097 | *** |
| AN7 | <--- | AN | 1.004 | 0.072 | 14.011 | *** |
| GP6 | <--- | GP | 1 | |||
| GP5 | <--- | GP | 0.922 | 0.064 | 14.3 | *** |
| GP4 | <--- | GP | 0.938 | 0.066 | 14.132 | *** |
| GP3 | <--- | GP | 0.975 | 0.065 | 14.904 | *** |
| GP2 | <--- | GP | 0.966 | 0.064 | 15.032 | *** |
| GP1 | <--- | GP | 1.031 | 0.069 | 14.924 | *** |
| IN3 | <--- | IN | 0.944 | 0.074 | 12.717 | *** |
| IN2 | <--- | IN | 0.923 | 0.071 | 12.958 | *** |
| IN1 | <--- | IN | 1 |
Table 12.
Model Fit Criteria and Measured Values.
| Fit Index | CMIN/DF | RMSEA | CFI | IFI | TLI | PGFI | PCFI |
|---|---|---|---|---|---|---|---|
| Research Result | 1.043 | 0.012 | 0.995 | 0.995 | 0.995 | 0.776 | 0.924 |
| Evaluation Criterion | <3.00 | <0.08 | >0.90 | >0.90 | >0.90 | >0.50 | >0.50 |
| Meets Criterion | Y | Y | Y | Y | Y | Y | Y |
Table 13.
Percentile Norms for the Intensity of Health Disinformation Perception on Social Media.
| Percentile | IO | IQ | SA | HB | CD | AN | GP | IN | Total Perception Intensity Score |
|---|---|---|---|---|---|---|---|---|---|
| 5 | 11.00 | 16.00 | 9.00 | 11.00 | 7.00 | 13.00 | 11.00 | 5.00 | 115.00 |
| 10 | 12.00 | 19.00 | 10.00 | 12.00 | 8.00 | 14.00 | 11.00 | 6.00 | 120.20 |
| 15 | 13.00 | 20.00 | 11.00 | 13.00 | 8.30 | 16.00 | 13.00 | 6.00 | 124.30 |
| 20 | 14.40 | 21.00 | 12.00 | 14.00 | 9.00 | 17.00 | 14.00 | 7.00 | 127.00 |
| 25 | 16.00 | 23.00 | 13.00 | 15.00 | 10.00 | 18.00 | 15.00 | 8.00 | 130.00 |
| 30 | 17.00 | 25.00 | 14.00 | 16.00 | 10.00 | 19.00 | 16.00 | 8.00 | 132.00 |
| 35 | 18.00 | 26.00 | 15.00 | 17.00 | 11.00 | 20.00 | 17.00 | 9.00 | 134.00 |
| 40 | 18.00 | 27.00 | 16.00 | 18.00 | 12.00 | 21.00 | 18.00 | 9.00 | 136.00 |
| 45 | 19.00 | 28.00 | 16.00 | 19.00 | 12.00 | 22.00 | 19.00 | 10.00 | 139.00 |
| 50 | 20.00 | 29.00 | 17.00 | 20.00 | 13.00 | 23.00 | 20.00 | 10.00 | 142.00 |
| 55 | 21.00 | 31.00 | 18.00 | 21.00 | 14.00 | 24.00 | 20.00 | 11.00 | 145.00 |
| 60 | 22.00 | 32.00 | 18.00 | 22.00 | 14.00 | 26.00 | 21.20 | 11.00 | 148.00 |
| 65 | 23.00 | 34.00 | 19.00 | 22.30 | 15.00 | 27.00 | 23.00 | 11.00 | 156.00 |
| 70 | 23.40 | 35.00 | 20.00 | 23.00 | 16.00 | 28.00 | 24.00 | 12.00 | 175.40 |
| 75 | 24.00 | 36.00 | 20.00 | 25.00 | 17.00 | 29.00 | 24.00 | 12.00 | 183.00 |
| 80 | 25.60 | 38.00 | 21.00 | 25.60 | 17.00 | 30.00 | 26.00 | 13.00 | 187.00 |
| 85 | 27.00 | 40.00 | 23.00 | 27.00 | 18.00 | 32.00 | 27.00 | 13.00 | 192.00 |
| 90 | 28.00 | 43.00 | 24.00 | 28.00 | 19.00 | 33.00 | 29.00 | 15.00 | 198.00 |
| 95 | 30.00 | 44.00 | 25.00 | 30.00 | 20.00 | 35.00 | 30.00 | 15.00 | 211.90 |
Table 14.
Cutoff Norms for the Intensity of Health Disinformation Perception on Social Media.
| Level | Classification Standard | IO | IQ | SA | HB | CD | AN | GP | IN | Total Perception Intensity Score |
|---|---|---|---|---|---|---|---|---|---|---|
| Low | <P10 | <12.00 | <19.00 | <10.00 | <12.00 | <8.00 | <14.00 | <11.00 | <6.00 | <120.20 |
| Relatively Low | Relatively Low | Relatively Low | Relatively Low | Relatively Low | Relatively Low | Relatively Low | Relatively Low | Relatively Low | Relatively Low | Relatively Low |
| Average | P30—P70 | 17.00- 23.40 |
25.00- 35.00 |
14.00- 20.00 |
16.00- 23.00 |
10.00- 16.00 |
19.00- 28.00 |
16.00- 24.00 |
8.00- 12.00 |
132.00- 175.40 |
| Relatively High | P70—P90 | 23.40- 28.00 |
35.00- 43.00 |
20.00- 24.00 |
23.00- 28.00 |
16.00- 19.00 |
28.00- 33.00 |
24.00- 29.00 |
12.00- 15.00 |
175.40- 198.00 |
| High | >P90 | >28.00 | >43.00 | >24.00 | >28.00 | >19.00 | >33.00 | >29.00 | >15.00 | >198.00 |
Disclaimer/Publisher’s Note: The statements, opinions and data contained in all publications are solely those of the individual author(s) and contributor(s) and not of MDPI and/or the editor(s). MDPI and/or the editor(s) disclaim responsibility for any injury to people or property resulting from any ideas, methods, instructions or products referred to in the content. |
© 2025 by the authors. Licensee MDPI, Basel, Switzerland. This article is an open access article distributed under the terms and conditions of the Creative Commons Attribution (CC BY) license (https://creativecommons.org/licenses/by/4.0/).
Copyright: This open access article is published under a Creative Commons CC BY 4.0 license, which permit the free download, distribution, and reuse, provided that the author and preprint are cited in any reuse.


