Preprint
Article

This version is not peer-reviewed.

Computer-Aided/Internet of Medical Things (CAD/IoMT)-Powered Detection of Brain Tumor

Submitted:

04 January 2025

Posted:

06 January 2025

You are already at the latest version

Abstract

Background/Objectives: Brain tumor continue to cause concern globally due to increasing number of cases and mortality. As the first line of action, accurate and early screening of brain tumor is critical for proper treatment and extending the life span of patients. Currently, medical expert relies heavily on the use of magnetic resonance imaging (MRI) for the detection of brain tumor. However, one of the limitation of MRI revolves around manual interpretation, which is time consuming and can be prone to errors especially when dealing with large number of cases. Thus, in order to address this issue, we proposed the development of CAD/IoMT-powered platform that enables real-time and fast detection of brain tumor. Methods: We proposed a framework known as I-BRAIN-DETECT, which is a CAD-based system, integrated with IoMT for fast and real-time detection of brain tumors and no tumor from MRIs. The overall methodology revolves around the use of 2 publicly accessible datasets, image pre-processing, feature extraction and classification using untrained customized CNN and 5 pre-trained CNNs which include ResNet-18, ResNet-50, DenseNet121, MobileNetV2 and EfficientNetB0. Results: Performance evaluation and comparative between implemented models has shown that pre-trained ResNet18 achieve the best result with 98.83% accuracy, 98.33 % recall, 99.33% precision, 99.33% specificity, 98.83% F1-score and 99.92 AUC for binary classification, while MobileNetV2 achieved the best result with 92.93% accuracy, 92.93 % recall, 93.37% precision, 97.67% specificity, 92.79% F1-score and 100 AUC for multiclass-classification. Conclusions: The developed platform can now be access by both patients and medical experts for real-time screening of brain tumor.

Keywords: 
;  ;  ;  ;  

1. Introduction

The brain is regarded as the most complex and vital organ responsible for carrying out vital functions which include both autonomous and voluntary activities. Thus malfunctioning of the brain as a result of disease, injury or accident can lead to impairment. Among some of the most severe diseases affecting the brain is the brain tumor [1]. Brain tumor is considered as one of the deadliest and fatal disease due to its location. Brain tumor can be describe as the abnormal growth of brain cells which can cause severe impairment of the brain function and even death. The general symptoms of brain tumor includes headaches, dizziness, nausea, poor vision and hearing, seizures etc. Both primary and secondary central nervous system (CNS) tumors exert a significant burden on global healthcare sector, accounting for over 250,000 cases annually. Over 80,000 cases of malignant and non-malignant CNS tumors were reported in US alone in 2022 [2]. According to Cancer statistics, brain tumor is ranked as 10th leading cause of mortality globally [3].
Brain cancer can be divided into benign or brain tumor and malignant or brain cancer. Benign tumors can be described as the type that does not spread to other tissues or organs while malignant cancer are the ones that can spread to other tissues and organs [4]. Moreover, brain cancer can be divided based on histology and molecular features from low to higher grades, which include grade I, II, III and IV. This classification is later updated by the WHO based on molecular pathogenesis into glioma (adult and pediatric), meningioma, glioneuronal tumors, and neuronal tumors [5,6,7].
Early, robust and precise detection of brain tumor is crucial for proper treatment and increase the chance of long-term survival [8]. Over the years, medical experts have developed several conventional techniques for assessment of patients suspected with brain tumor. The assessment start with physical examination followed by neuroimaging, biopsy, pathological examination and molecular analysis of extracted tissues. Some of the neuroimaging techniques includes Magnetic Resonance Imaging (MRI), Computed Tomography (CT), Magnetoencephalography (MEG), and Positron Emission Tomography (PET) [9]. Among these techniques, MRI is the most common techniques employed by medical expert due to its ability to discriminate between structure and tissue based on contrast levels. Despite the reliance of MRI approach due to noninvasive nature, 3D imagine technique and it ability to effectively detect anomaly in soft tissues, however, the technique is hindered by several drawbacks [9,10]. One of the major limitations of MRI revolves around manual interpretation, which is tedious and prone to error [9].
In order to counter some of the limitations of MRI, scientists refocus their attention toward AI [9]. The field of AI and its subsidiaries, which include ML, DL, and computer vision, has witnessed exponential growth in the last decades. This growth can be attributed to the development of deep learning (DL) algorithms such as Artificial Neural Networks (ANNs) and Convolutional Neural Networks (CNNs) as well as the increase in generation of data, which serve as the fuel driven the engine of the models. AI-based techniques are currently employed in various field ranging from automobile, communication, healthcare, agriculture, banking and finance, marketing etc. [11]. The integration of AI-driven techniques in healthcare is transforming the sector through improving diagnostic precision and accuracy, precision medicine, personalized medicine, development of drugs etc. [12,13]. AI-powered models have been implemented for the detection of several diseases ranging from microbial diseases such as COVID-19 [14], monkeypox [15] tuberculosis [16], H. pylori [17], to different types of cancer such as skin cancer [18], breast cancer [19], colorectal cancer [20] etc.
Advances in computer science, software and internet has given rise to Internet of things (IoT) which provide gateway to the development of Internet of Medical Things (IoMT) or Internet of Healthcare things (IoHT). IoMT is powered by smart technologies which include IoT, smart wearable device, AI and Computer-aided Detection (CAD) [21]. The development of CAD-IoMT framework enable patients to upload medical data remotely and obtain result in real-time, as well as sharing of medical data with healthcare practitioners. Several CAD-IoMT platform have sufficed during the height of COVID-19 pandemic [22].

1.1. Literature Survey

AI has shown great promise as transformative tool in the field of neuro-oncology, demonstrating high efficiency in CAD, prediction and classification of brain tumor [23]. Several studies have reported the deployment of CAD-based technique for the detection or classification of brain tumors. For example, Sekhar et al. [21] reported the development of CAD-based platform for the accurate classification of brain tumors into 3 classes which include glioma, meningioma and pituitary. The study acquired the CE-MRI Figshare (comprises of 3064 brain MRI images) and Harvard medical repository datasets (comprises of 96 MRI images).The datasets are trained and tested using pre-trained GoogleNet ensemble with different ML classifiers such as KNN, SVM and SoftMax. Evaluation of the performance of the ensemble framework has shown that GoogleNet-SVM achieve the best results with 97.35% average F1 score, 97.29% average precision, 97.23% average recall and 98.76% average specificity. Moreover, the performance of the framework using the Harvard Dataset resulted in 100% accuracy for both GoogleNet ensemble with KNN and SVM.
The study proposed by Khaliki and Başarlan [23] reported the development of 3-layer CNN and it implementation along 4 pre-trained CNN models which include VGG16, VGG19, EfficientNetB4 and Inception-v3 for 4-way classification of brain tumors (glioma, meningioma pituitary) and no tumor from MRIs. In order to achieve accurate detection, the study acquired dataset, which comprises of 2870 MRIs from four classes (glioma, meningioma, pituitary and no tumor). Comparative analysis of the performance of the models has shown that VGG16 achieved the optimum performance with 98% accuracy, 98% recall, 98% precision, 97% F1-score and 99% AUC.
The 3-way classification of brain tumor into (meningioma, glioma and pituitary) using AI-driven technique is proposed by Biswas et al. [24]. The study is designed based on several steps. The first step include curation of Figshare dataset which comprises of 563 MRIs (246 glioma, 243 pituitary and 74 meningioma). The next step revolves around image pre-processing via techniques such as resizing, enhancement and sharpening. The third step is characterized by clustering using K-means clustering and the use 2D Discrete Wavelet Transform (DWT) for feature extraction. The fourth step involve classification of brain tumors using ANN. Assessment of the model resulted in 95.4% accuracy, 94.58% sensitivity and 97.83% specificity.
The study proposed by Amin et al. [25] reported the implementation of inception model for the automatic detection and 4-way classification of brain tumors (pituitary, meningioma glioma and no tumor) from MRIs. The study acquired several dataset which include multiclass dataset from Kaggle repository which contains 3264 images from 4 classes, Cancer Genome Atlas (TCGA) which comprises of 101 cases, local dataset which comprises 800 cases from 2 classes and the 2020-BRATS which contain 40,145 slices acquired from 259 patients. The features are first extracted using inceptionV3 followed by classification using SoftMax, which is further supplied to the quantum variational classifier (QVR) for classification. Furthermore, Seg-network is used to segment the infected region in order to evaluate the severity of infection. Evaluation of the proposed hybrid approach has shown that optimum results is achieved using the 2020-BRAT with 99.7% accuracy.
Rasool et al. [26] proposed the quaternary classification of MRIs into Pituitary, Meningioma Glioma and No Tumor using hybrid framework. The study is designed according to two experiments. The first experiment revolves around extraction of features using Google Net and classification using SVM. While, second experiment revolves around the implementation of fine-tuned GoogleNet embedded with SoftMax classifier. In order to train and validate the model, the study acquired 3460 T1-weighted contrast-enhanced MRI images (1426 glioma, 930 pituitary, 708 meningioma and 396 no tumor images). The performance evaluation and comparison between GoogleNet-SVM and GoogleNet-SoftMax, has shown that GoogleNet-SVM achieved the best result with 98.1% accuracy, in comparison with GoogleNet-SoftMax with 93.1% accuracy. The proposed frameworks is validated using 2 datasets which include MRI brain images dataset and Whole Brain Atlas site. The result indicated that GoogleNet-SVM achieved 94.12% accuracy, in while GoogleNet-SoftMax 90.6% accuracy.
Abdusalomov et al. [27] proposed the implementation of fine-tuned pre-trained You Only Look Once version 7 (YOLOv7) model for the detection of brain tumors (gliomas, meningioma, and pituitary) using large-scale collection of MRI dataset. In order to enhance the feature extraction capabilities and sensitivity of the proposed approach, Convolutional Block Attention Module (CBAM) attention mechanism and Spatial Pyramid Pooling Fast+ (SPPF+) layer are incorporated. In order to train and validate the model, the study acquired 10,288 MRIs distributed into 4 classes which include gliomas (2548), meningioma (2582), pituitary (2658) and no tumor (2500). The acquired images undergo pre-processing using enhancement techniques that applied different filters to the original images. Moreover, data augmentation was also conducted in order to maximize the performance of the models on training set. Performance evaluation of the proposed approach resulted in 99.5% accuracy.
Sinha and Kumar [28] proposed the use of multimodal framework, which combines the power of image pre-processing, multilayer perceptron and multilevel thresholding for the accurate detection of brain tumor from MR images. The study utilized 1747 images which comprises of 4 classes (glioma, meningioma, pituitary and no tumor). The acquired images undergo image pre-processing via resizing and normalization. Furthermore, transformation was carried out via flipping, scaling and rotation in order to enhance robustness of the dataset. Evaluation of the multimodal approach integrated with SVM classifier resulted in 92% accuracy. Moreover, the model is deployed into user friendly smartphone app (MediScan) to enable real-time screening.
Saeedi et al. [29] reported the development 2D CNN and a convolutional auto-encoder network and implementation of 6 ML algorithms for the multiclass classifications of brain tumors (glioma, meningioma, pituitary) and no tumor. The ML algorithm employed include Multilayer perceptron (MP), Nearest Neighbor (NN), SVM, Logical Regression (LR), Stochastic Gradient Descent (SGD) and RF. The study acquired a dataset which comprises of 3264 T1-weighted contrast-enhanced MRI scans. The acquired images undergo pre-processing via resizing and augmentation via rotation and flipping which resulted in 9792 images. Evaluation and comparison between the proposed 2D CNN and proposed autoencoder network has shown that 2D CNN achieved the best result with 93.44% testing accuracy, average recall of 95.75%, average precision of 94.75 and F1 measure of 95.00%. While among ML algorithms, KNN achieved the best result with 86% accuracy.
The study conducted by Aleid et al. [30] proposed an automatic segmentation techniques for early stage detection of brain tumor from MRIs. The study acquired 2 publicly accessible dataset which include BraTs 2017 and 2021 in which 40 set of images were selected. The selected images undergo several pre-processing which include formatting, resampling, skull-stripping and conversation from 3D to 2D images prior to threshold-based segmentation. The overall average performance of the proposed approach resulted in an accuracy of 99.5%, average precision of 97.5% and average dice score of 87%.
The study proposed by Aamir et al. [32] also conducted binary classification using two dataset and multi classification of brain tumors and no tumor using optimized CNN. The study employed three dataset. Dataset 1 comprises of 7023 images of four classes (glioma, meningioma, pituitary, and no tumor). Several data pre-processing steps were conducted which include resolution and intensity adjustment, z-score normalization and rescaling. Dataset 2 contains 239 images while dataset 3 contains 1500 images. For binary classification, the model achieved 93.0% accuracy in dataset 2 and 96.0% accuracy on dataset 3. While for multi classification, the model achieved 97.18% accuracy.
The study proposed by Zubair Rahman et al. [32] leverage the capabilities of DL-based techniques via the implementation of EfficientNetB2 architecture for the detection of brain tumor from MR images. The study tested the efficiency of the proposed architecture using three set of datasets, which include BD-Brain-Tumor (19,967 images of tumor and no tumor), Brain-tumor-detection 2020 (3,060 of tumor and no tumor) and Brain-MRI-images-for-brain-tumor-detection (253 of tumor and no tumor). In order to enhance the images, the study incorporated several image pre-processing techniques which includes image cropping, equalization, and the implementation of homomorphic filters, Evaluation of the proposed DL model has shown that an optimum accuracy is achieved using the BD-BrainTumor dataset (multiclass)with 99.83% accuracy. Moreover, the model also achieved 99.75% and 99.2% accuracies for binary classifications.
Sawant et al. [33] proposed the implementation of Le-Net (5-layer CNN) for the binary classification of brain tumor and no tumor. The study curated dataset from different sources, which include the TCGA and BraTs. The study was able to sourced 1800 MRI scans, which are categorized into 900 tumors and 900 non-tumors. To enlarge the volume of the training set, data augmentation techniques were implemented which include rotation and horizontal flipping. Assessment of the proposed framework resulted in 98.6% validation accuracy. Alsubai et al [34] report the combination of CNN and LSTM (long-short term memory) for the binary classification of brain tumor and no tumor. The study acquired a dataset from Kaggle, which contains 253 MRIs in which 155 are tumors and 98 non-tumors. The images were further enhance via several pre-processing steps, which includes noise reduction and resizing followed by feature extraction. Assessment of the model’s performance resulted in an accuracy of 99.1%, precision of 98.8%, recall of 98.9% and F1-measure of 99.0%.
The study proposed by Gupta et al. [35] reported the development of 8-layer CNN and implementation of pre-trained VGG-16 for the binary classification of MRI images into tumor and no tumor. The study curated dataset which comprises of 253 MRIs (155 tumors and 98 no tumors). The pre-processing techniques employed revolved around the use of an open-source software computer vision- (CV-) based Canny edge detection technique which is used to extract the brain area. In order to maximize the volume of training set, data augmentation approach was employed via rotation, flipping and intensity. Performance evaluation of the models and comparative assessment has shown that the customized CNN edge over VGG-16 with 100% in comparison with 96% accuracy respectively. The summary of literature survey is presented in Table 1.

1.2. Limitation of Existing Studies and Contributions

Despite the fact there are plethora of studies that reported the implementation of DL-models for binary and multiclass classifications, however, majority of these studies have several limitations. One of the most common limitation is the use of single dataset, which reduce generalizability of the models. Secondly, numerous studies reported the use of single model, which may not serve as the best architecture that can efficiently learn underlying patterns, and features of brain tumors. Thirdly, majority of studies only considered transfer learning based on pre-trained models.
Thus, in this study, we proposed a CAD/IoMT-based platform known as I-BRAIN-DETECT for the binary classification of MRIs into tumor and no tumor and quaternary classification of MRIs into glioma, meningioma, pituitary and no tumor. The main contribution of this study are enumerated below:
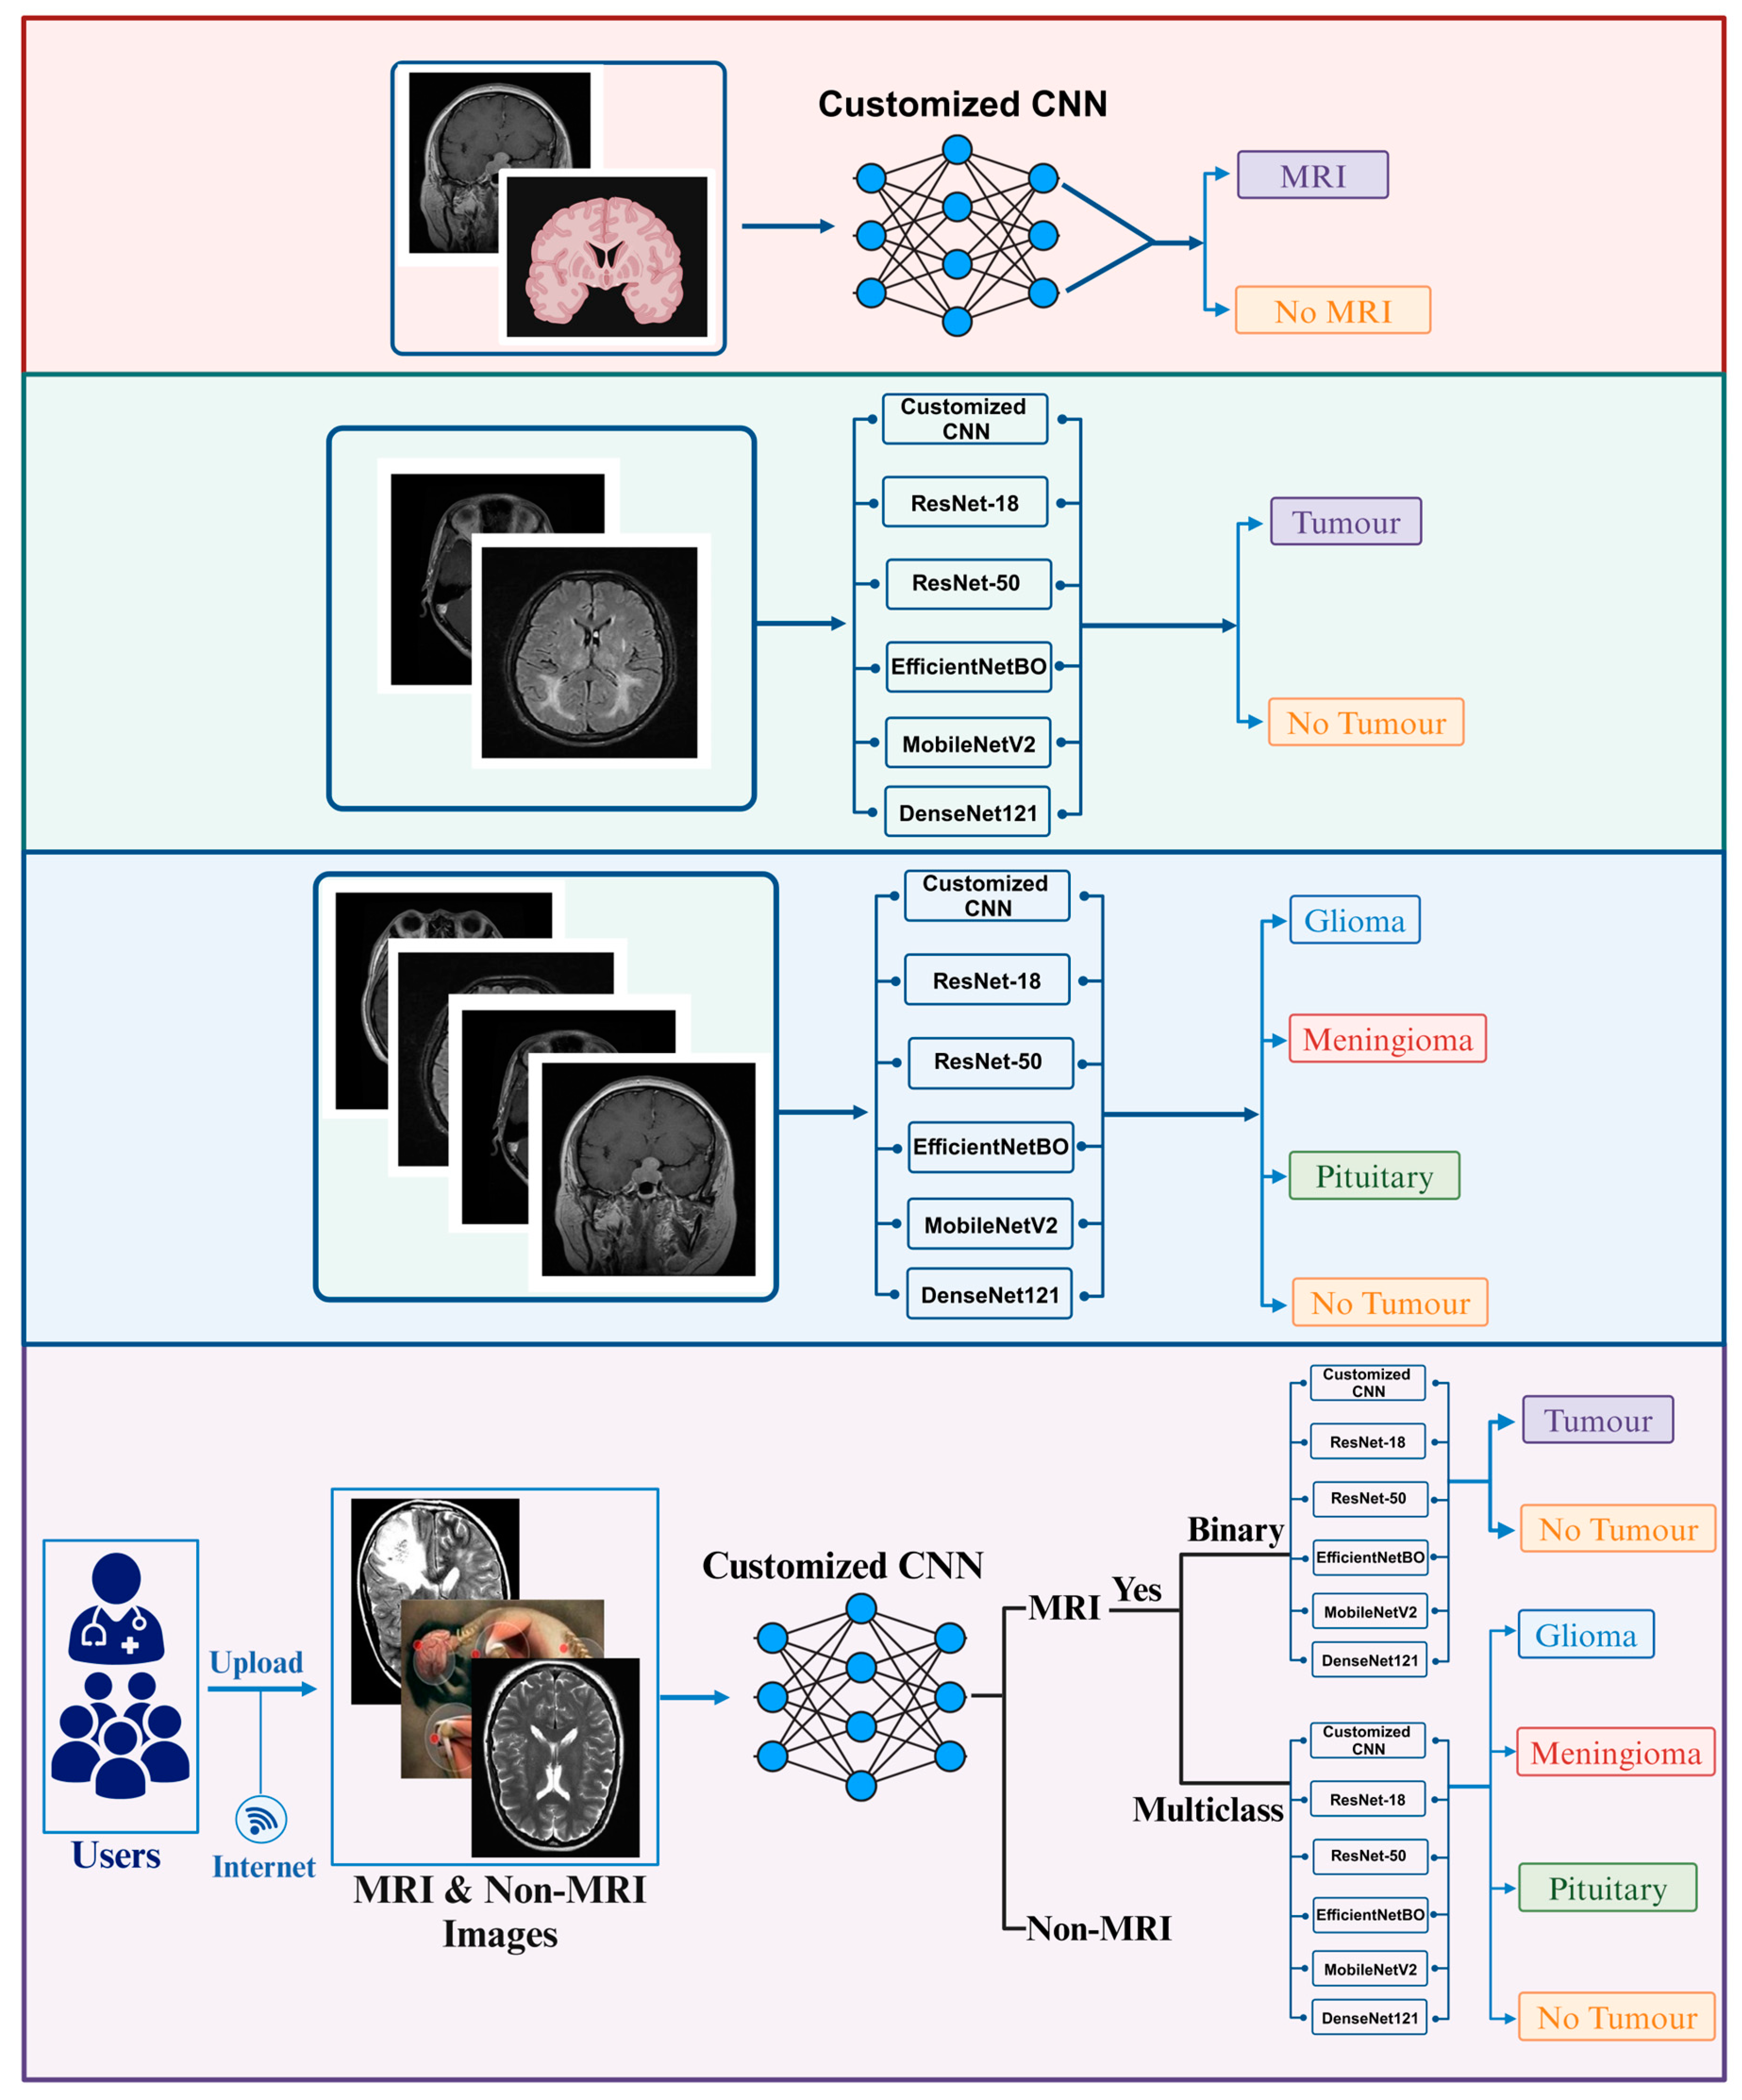
  • Binary classification of MRIs into tumor and no tumor.
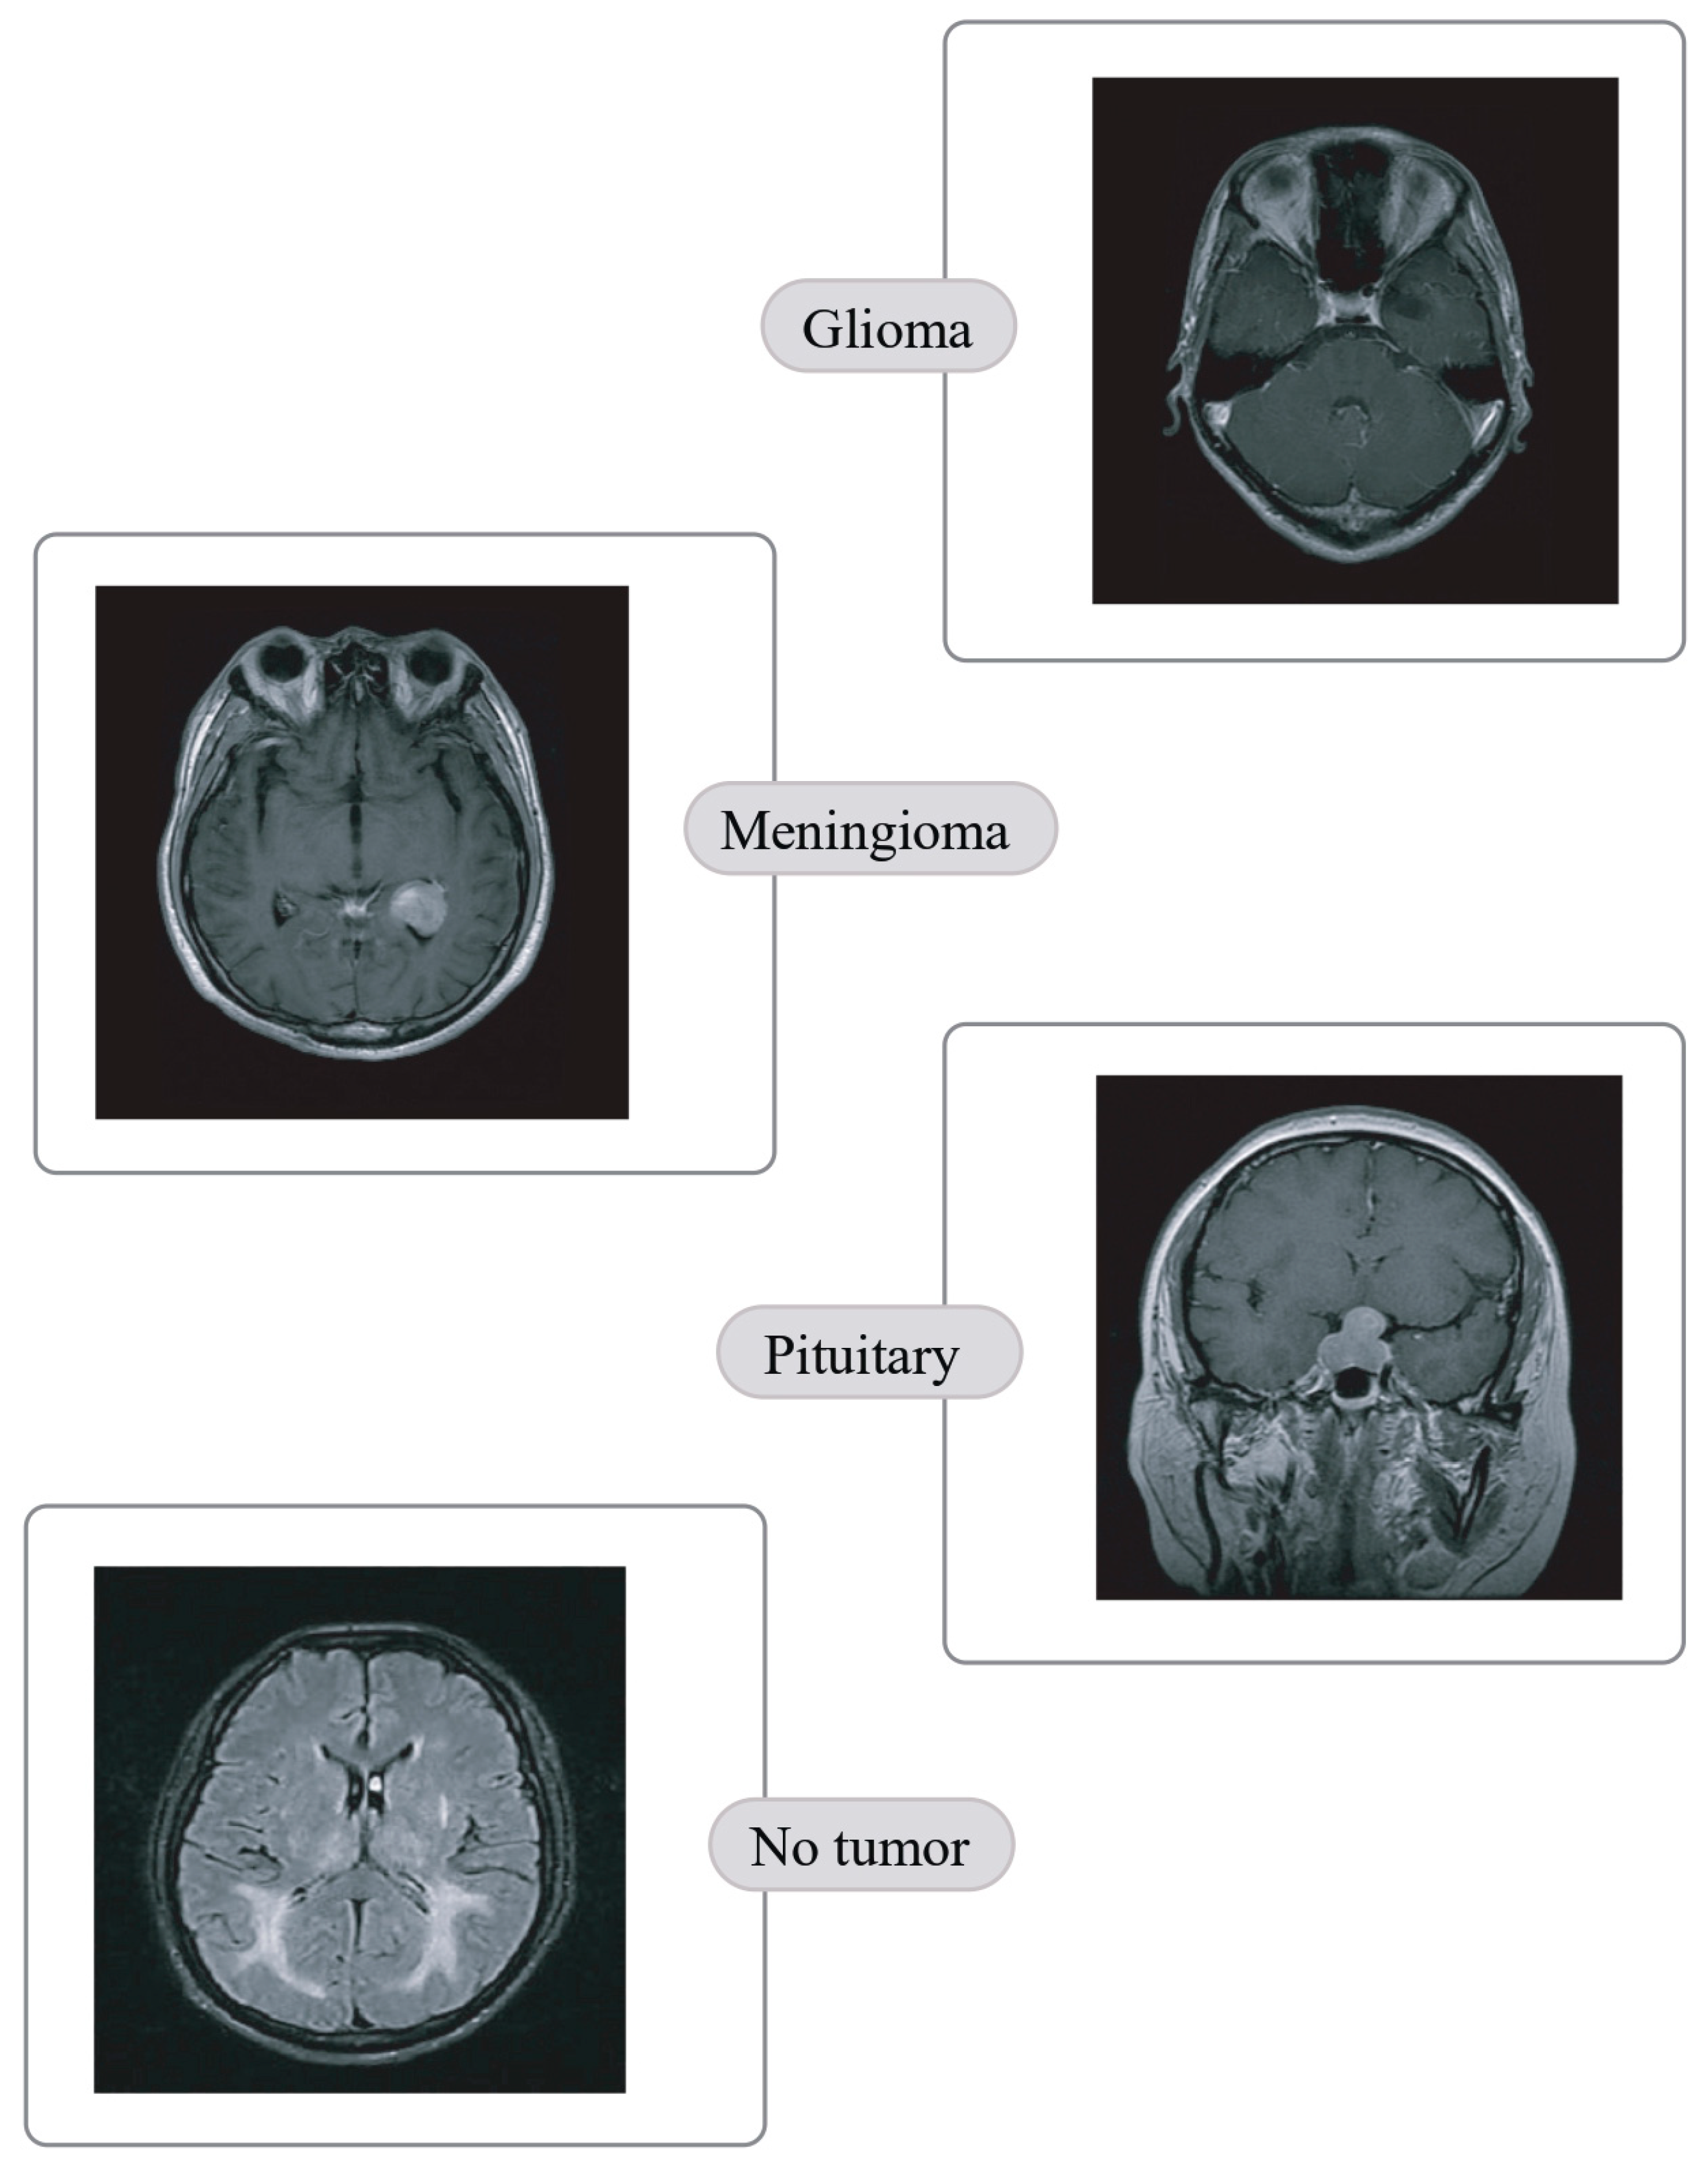
  • Quaternary classification of MRIs into glioma, meningioma, pituitary and no tumor.
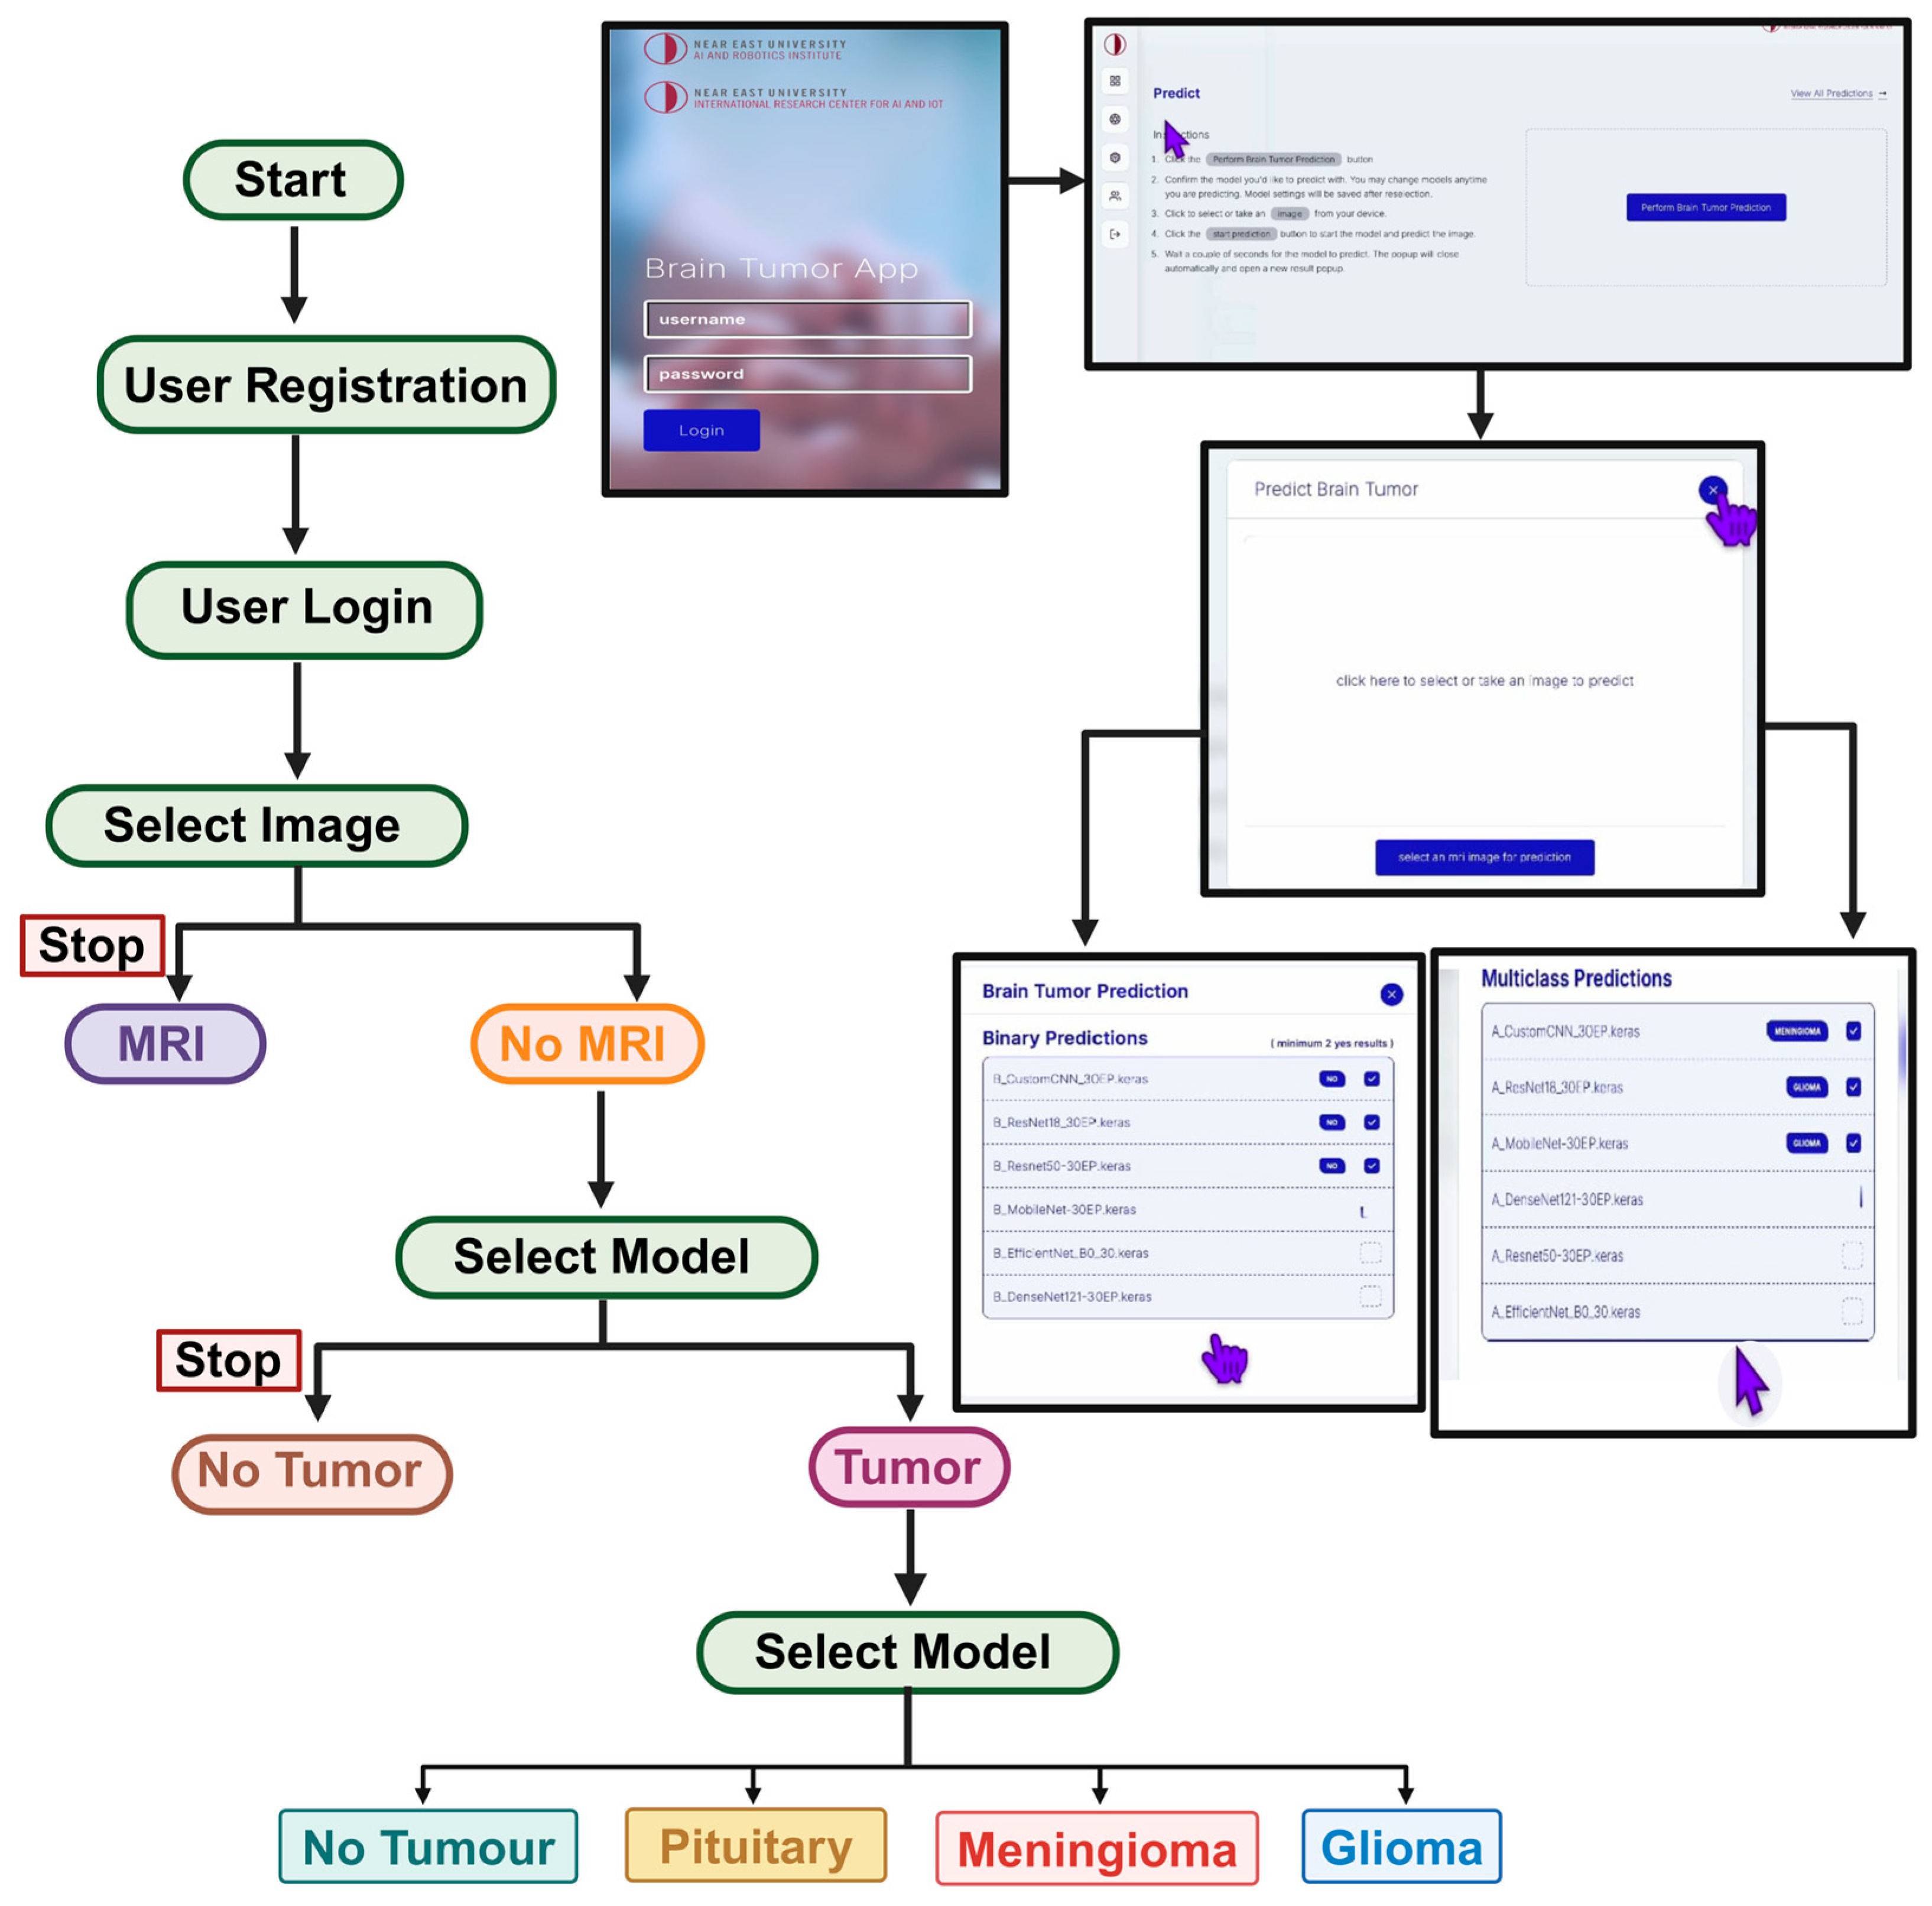
  • Development of CAD/IoMT-based platform for real-time detection and classification of brain tumors and no tumor.
  • Performance evaluation of proposed framework and comparison with state of art results.
The remaining part of this work is structured as follows: Section covers the research methodology, which include data collection, data pre-processing, development and implementation of customized model and 5 pre-trained models and development of website. Section 3 present the research findings based on evaluation metrics represented using tables and graphs, discussion, deployment of framework and comparison with previous study. Section presents the overall conclusion of the research.

2. Materials and Methods

In this study, we proposed the implementation of customized untrained CNN models and 5 pre-trained models which include DenseNet121, EffcientNetB0, ResNet-18, ResNet-50 and MobileNetV2 for the 2-way and 4-way classification of brain tumors. In order to achieve this aim, we curated two datasets, which include Brain Tumor Detection MRI (BTD-MRI), and Brain MRI Scans for Brain Tumor Classification (BMS-BTC). The performance of the models are evaluated based on accuracy, recall, precision, F1 score and AUC. The overall experimental set up is illustrated in Figure 1.

2.1. Data Collection

In order to train our models to accurately discriminate between binary classes of tumor vs no tumor and quaternary classes such as pituitary, meningioma, glioma and no tumor we curated 2 datasets from Kaggle repository.

2.1.1. Brain Tumor Detection MRI (BTD-MRI)

BTD-MRI comprises of 3060 total MRIs in which 1500 are tumors and 1500 are no tumors and 60 images for testing arrange in three sub folders. However, we only use 3000 images. The dataset is accessible through this website: https://www.kaggle.com/datasets/abhranta/brain-tumor-detection-mri. The summary of the dataset based on number of images and composition are presented in Table 2. The samples of each classes is presented in Figure 2.

2.1.2. Brain MRI Scans for Brain Tumor Classification (BMS-BTC)

BMS-BTC dataset comprises of 1311 brain tumor MRI scans belonging to four classes which include pituitary (300 images), meningioma (306 images), glioma (300 images) and no tumor (405 images). The dataset is accessible through this website: https://www.kaggle.com/datasets/shreyag1103/brain-mri-scans-for-brain-tumor-classification. The summary of the dataset based on number of images and composition are presented in Table 3.
Figure 3. Samples of BMS-BTC dataset.
Preprints 145221 g003

2.2. Data Pre-Processing and Augmentation
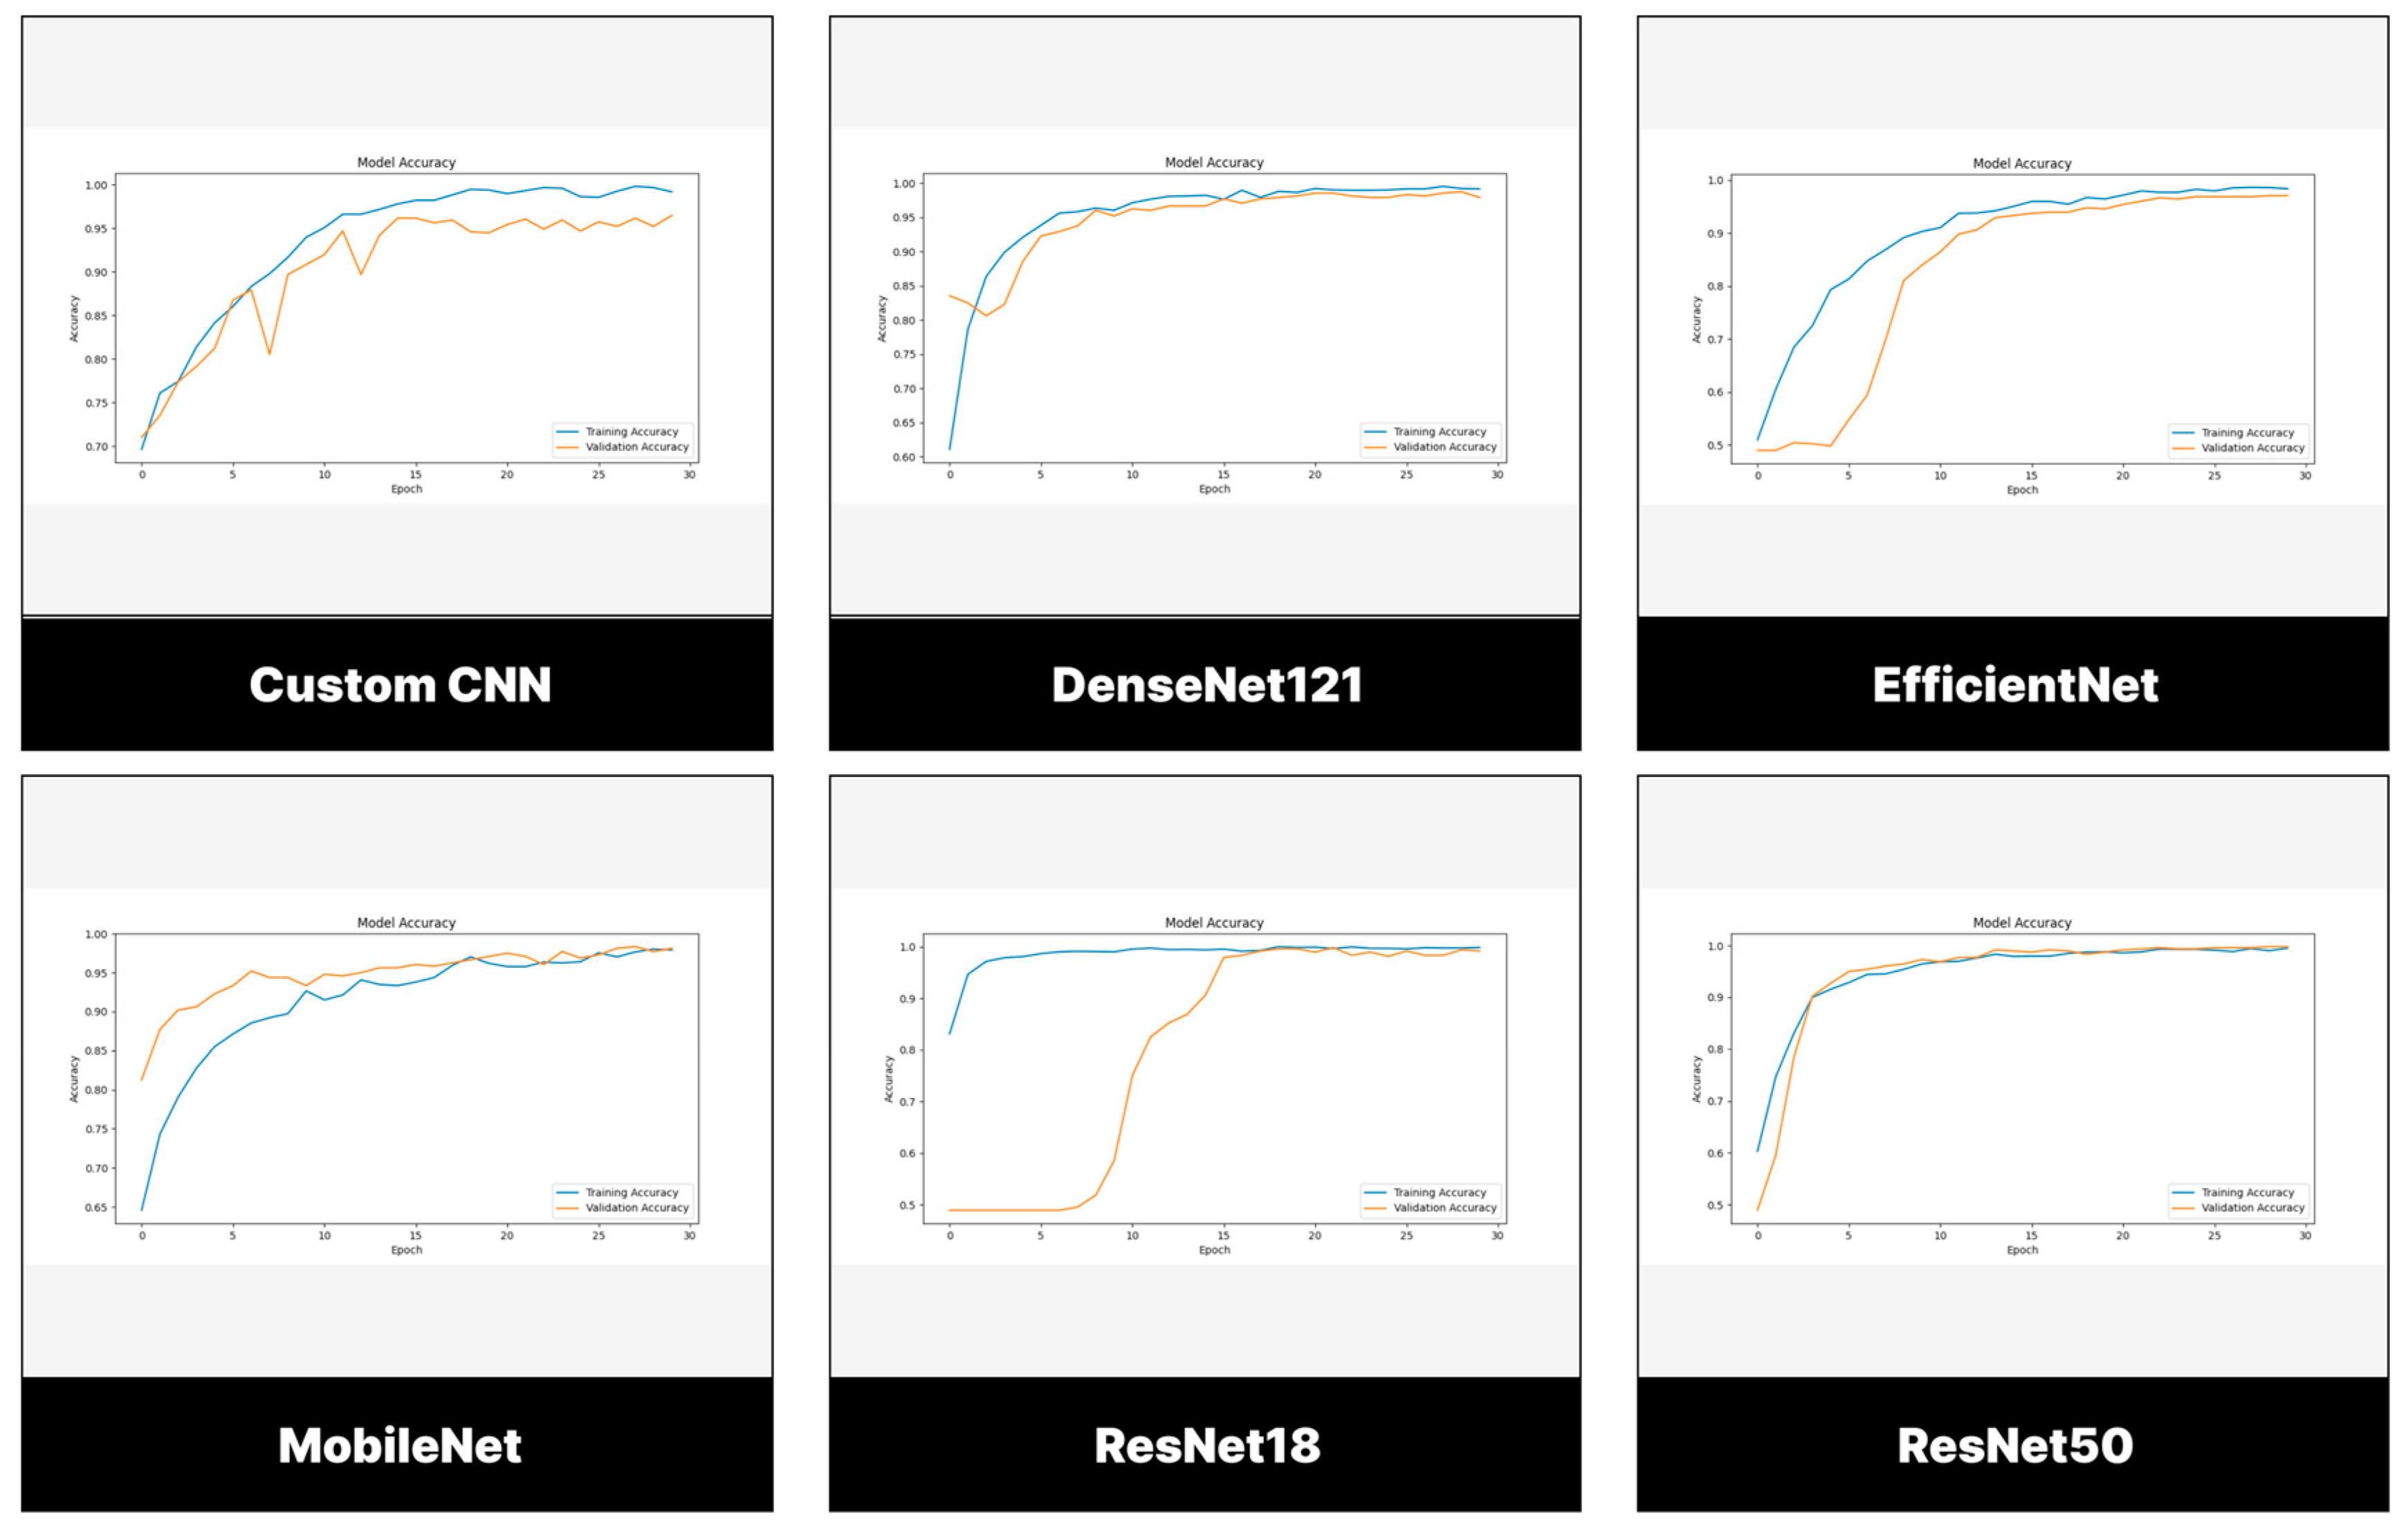
The dataset used for the binary classification comprises of 3000 images. The images acquired are already pre-split between the training and testing set. We kept this ratio of 600 images in the test set and 2400 in the training set. From the training set, using flow generators in TensorFlow, we set aside 40% of the images for validation, which resulted into 1440 for testing, and 960 for validation. In order to pre-process the images, firstly, all images are resized to 224 x 224 as the input feature size for all the models to ensure uniformity and compatibility for all models during when training and when prediction. To stabilize the training and make the process smoother and faster, all image pixel values were normalized from 0 - 255 units to between 0 - 1 reducing the variance between the data. In addition, specific data augmentation techniques were used to enhance the diversity of the dataset, which include random rotations set to 0.2, horizontal and or vertical flips and zooming in and out. These pre-processing techniques helped the models to generalize and perform well on the unseen set as well as some random test images online. The total augmentation increased the total training images by approximately 3 times its original value as we applied three augmentation techniques, increasing it from 1440 to approximately 4320.
The dataset for the multiclass classification went through similar processes of splitting and data augmentation. The dataset acquired comprises of 1314 images, pre-split between 198 for testing and 1112 for training. From the training set, we used a flow generator to get a split of the validation. We did not have many data for this set so we reduced the split from 40 to 20%. This gave us new values for training with 889 images and 223 for validation. We applied random rotations at 0.2. Horizontal and vertical flips for every image and random zooming at 0.2. We also applied brightness adjustments to account for different light. We applied more aggressive augmentation on this dataset due to limited number of images. This resulted in an increase in the training set 4 times its value from 889 to 3556.

2.3. Customized CNN

The Custom CNN model is designed to have very few layers and capture as much data as possible in order to be able to perform prediction, but not too much that it would make training and prediction slow. The main aim is to have a very lightweight model that could fit tight software constraints, such as a quick scan in order to be able to discriminate between MRI and non-MRI. This prediction is fast and only take about 300ms. There are three versions of the Custom CNN model, but they all stem from this first one with slight variations, including more dropout layers and regularization. The Custom CNN model that powers the MRI scan for MRI and non-MRI images is a 5-layer CNN. However, the model does not include dropout, pooling or flattening layers, as they do not add parameters to the model for training. The first layer takes in our input of 224 x 224 and connects to the second layer with half its dimensions of 112 x 112. The next layer halves again with only 56 x 56 inputs, then again with the next at 28 x 28, until flatten and result in an output of 2 values ‘MRI’ and ‘non-MRI’.
For the second Custom CNN model, which powers the prediction for the binary classifications, it is designed with six layers. It starts with 224 x 224, halving the same to 112 x 112, then 56 x 56 to 14 x 14 inputs. The next step involve flatten of all the layers, prior to connect them to an output-dense layer with two output values, ‘yes’ and ‘no’. For the last Custom CNN model that powers the prediction of the multiclass classifications, it is designed with five layers, similar to the first CNN model, but with the dropout and regularization of the second model. It starts at 224 x 224, halves itself to 112 x 112, then 56 x 56 and stops at 28 x 28. The layers are flattened and passed through a dense output node with four values, which include ‘glioma’, ‘meningioma’, ‘no tumor’ and ‘pituitary’. The detailed layers of the 3 custom CNNs are presented in supplementary file.

2.4. Pre-Trained CNNs

2.4.1. EfficientNet

EfficientNet is one of the most sought out CNN model since its introduction in 2019 by researchers working in Google. The network is employ by scientists to solve task related to object detection and classification, image segmentation and language processing. The architecture was designed to address the limitations of previous models such as low performance and low computational efficiency. The model addressed these issues through systematically scaling dimensions (compound scaling) which include depth, width and resolution in an efficient manner. In terms of architecture, the model is made of Mobile Inverted Bottleneck (MBConv) layers, which integrates both depth-wise separable convolutions and inverted residual blocks. In order to enhance the performance of the model, the architecture employ Squeeze-and-Excitation (SE) optimization. There are several variants of EfficientNet, which include EfficientNet-B0, B1, B2, B3, B4, B5, B6 and B7.

2.4.2. DenseNet

Dense Convolutional Network is a DL architecture that is used for general purpose image detection and classification, image analysis, feature extraction etc. The architecture was introduced in 2017 by Haung and colleagues. The network is designed to solve problems related to vanishing gradient through the introduction of connectivity pattern within the architecture. Unlike conventional CNNs, where each layer is connected only to subsequent layers, DenseNet is designed based on direct connections between all layers within a block. In terms of the architecture, the network is made of several dense blocks, where each block comprises of multiple convolutional layer, batch normalization and ReLu (non-linear function). There are several variants of DenseNet, which includes DenseNet 121, DenseNet 169, DenseNet 201 and DenseNet 264.

2.4.3. MobileNet

In order to design an efficient CNN embedded in mobile phones, team of researchers in Google developed MobileNet. The model is designed to solve several task related to image classification and object detection. Some of the advantages of the models include simplicity, low computation complexity and highly efficiency. One of the basic distinction of MobileNet compare to previous architectures revolves around the introduction of Depth-wise and Point-wise convolutions. Moreover, the architecture is designed to incorporate inverted residuals with linear bottleneck (1x1 Convolution) and linear bottlenecks between layers which main function is to ensure that the manifold of the input data is not overly compressed. Over the years, variants were introduced which includes MobileNet V1, MobileNetV2 and MobileNetV3.

2.4.4. ResNet

In order to address the issue of vanishing gradient, Kaiming He and colleagues who are scientists working at Microsoft developed ResNet in 2015 by introducing residual/ identity mapping (block). The main idea behind residual block is to skip convolutional operations that exists between 2 ReLu activation functions. This process enable the model to learn the residual function instead of directly learning the underlying mapping which can result in more effective learning and increase in performance. The network has several versions based on number layers which include ResNet-18, ResNet-34, ResNet-50, ResNet-101 and ultra-deep ResNet-152. For example ResNet-5 comprises of several operations which include residual connections, convolution layers, batch normalization, ReLu activation, pooling layers. The rest of the architecture include flattening, global average pooling, fully connected layer and the use of SoftMax as the model classifier.

2.5. Training Parameters

Due to limited number of image dataset, data augmentation was conducted to enlarge the training dataset. The custom CNN was first trained with augmented data to evaluate its performance on discriminating between MRI and non-MRIs. However, we needed deeper models that could extract more features and make predictions that are more meaningful. Rather than relying on fresh models, we utilized transfer learning. Apart from the Custom CNN model, every other model was loaded with weights from ImageNet and then tuned to the new data by training them with different epoch counts, adding more regularization and lowering the learning rate. For the study, we ended training for 15 epochs.
Considering the fact that the standard input size for majority of pre-trained models is 224 x 224. However, training models with this size would take hours if not days to train fully. Our approach was to write the code, test it on a base M2 Apple laptop and then fully train them on a server. The server was a powerhouse A40 GPU with 45 GB GPU memory able to output 29.9 Teraflops of power along with 64GB RAM and 128 CPU cores.
The server had Jupyter Notebook installed at its core, enabling us to utilize its full power over the webUI instead of using a native operating system GUI that would eat up GPU use. All models were trained, tuned and refined on the server. The models along with the metric values and graphs were then zipped and downloaded back to the main computer. This approach helped models train smoothly without consuming too much time. Even though the server was fast, most models were trained and had their hyperparameters tuned a couple of times before getting their optimum high accuracy. With fast server resources, transfer learning and flow image generators. Models were able to quickly train and learn underlying features and patterns from the training sets. After training, the models were tested using the reserve set to evaluate their performances

3. Results

The integration of AI into medical diagnosis is critical due to the exponential growth of medical data generated from diverse medical devices, the increase workload face by medical practitioners, the likelihood of miss diagnosis etc. The implementation of DL model in in medical imaging continue to transform the field into a more efficient, precise, reliable, affordable and time-saving procedure. The increase in the volume of medical data such as textual data generated from digital devices, audio signals and biomedical imaging such as MRIs, X-rays, Ultrasound, CT scans, SPECT, PET or hybrids serve as fuel for training DL-based models. These wide ranges of images are use as input to trained DL-based tools for accurate classification of diseases and contribute significantly to reducing errors and high workload faced by healthcare expert. By conforming to this technique, we developed three customized CNN models from scratch and implemented five pre-trained models for binary and multi-class classification of brain tumor and no tumor. We first implemented Custom CNN to discriminate between MRI and non-MRI images, which resulted in 99.62% accuracy. The second step include training and testing of the models using 2 dataset in which the models are trained using 80% of the dataset based on 30 epochs and testing using 20% based on accuracy, sensitivity, specificity, precision, recall, and AUC or ROC curve, F1-score. The training graph of the models on binary classes and multi-classes are shown in Figure 4 and Figure 5 respectively.

3.1. Evaluation Measures

To evaluate the proposed frameworks, the following metrics are used which include accuracy, sensitivity, specificity, precision, recall, AUC or ROC curve, F1-score.
A c c u r a c y = T P + T N F P + F N
P r e c i s i o n = T P T P + F P
R e c a l l = T P T P + F N
S p e c i f i c i t y = T N T N + F P
F 1 = P r e c i s o n   X   R e c a l l P r e c i s o n + R e c a l l   O R   2 T P ( 2 T P + F P + F N )

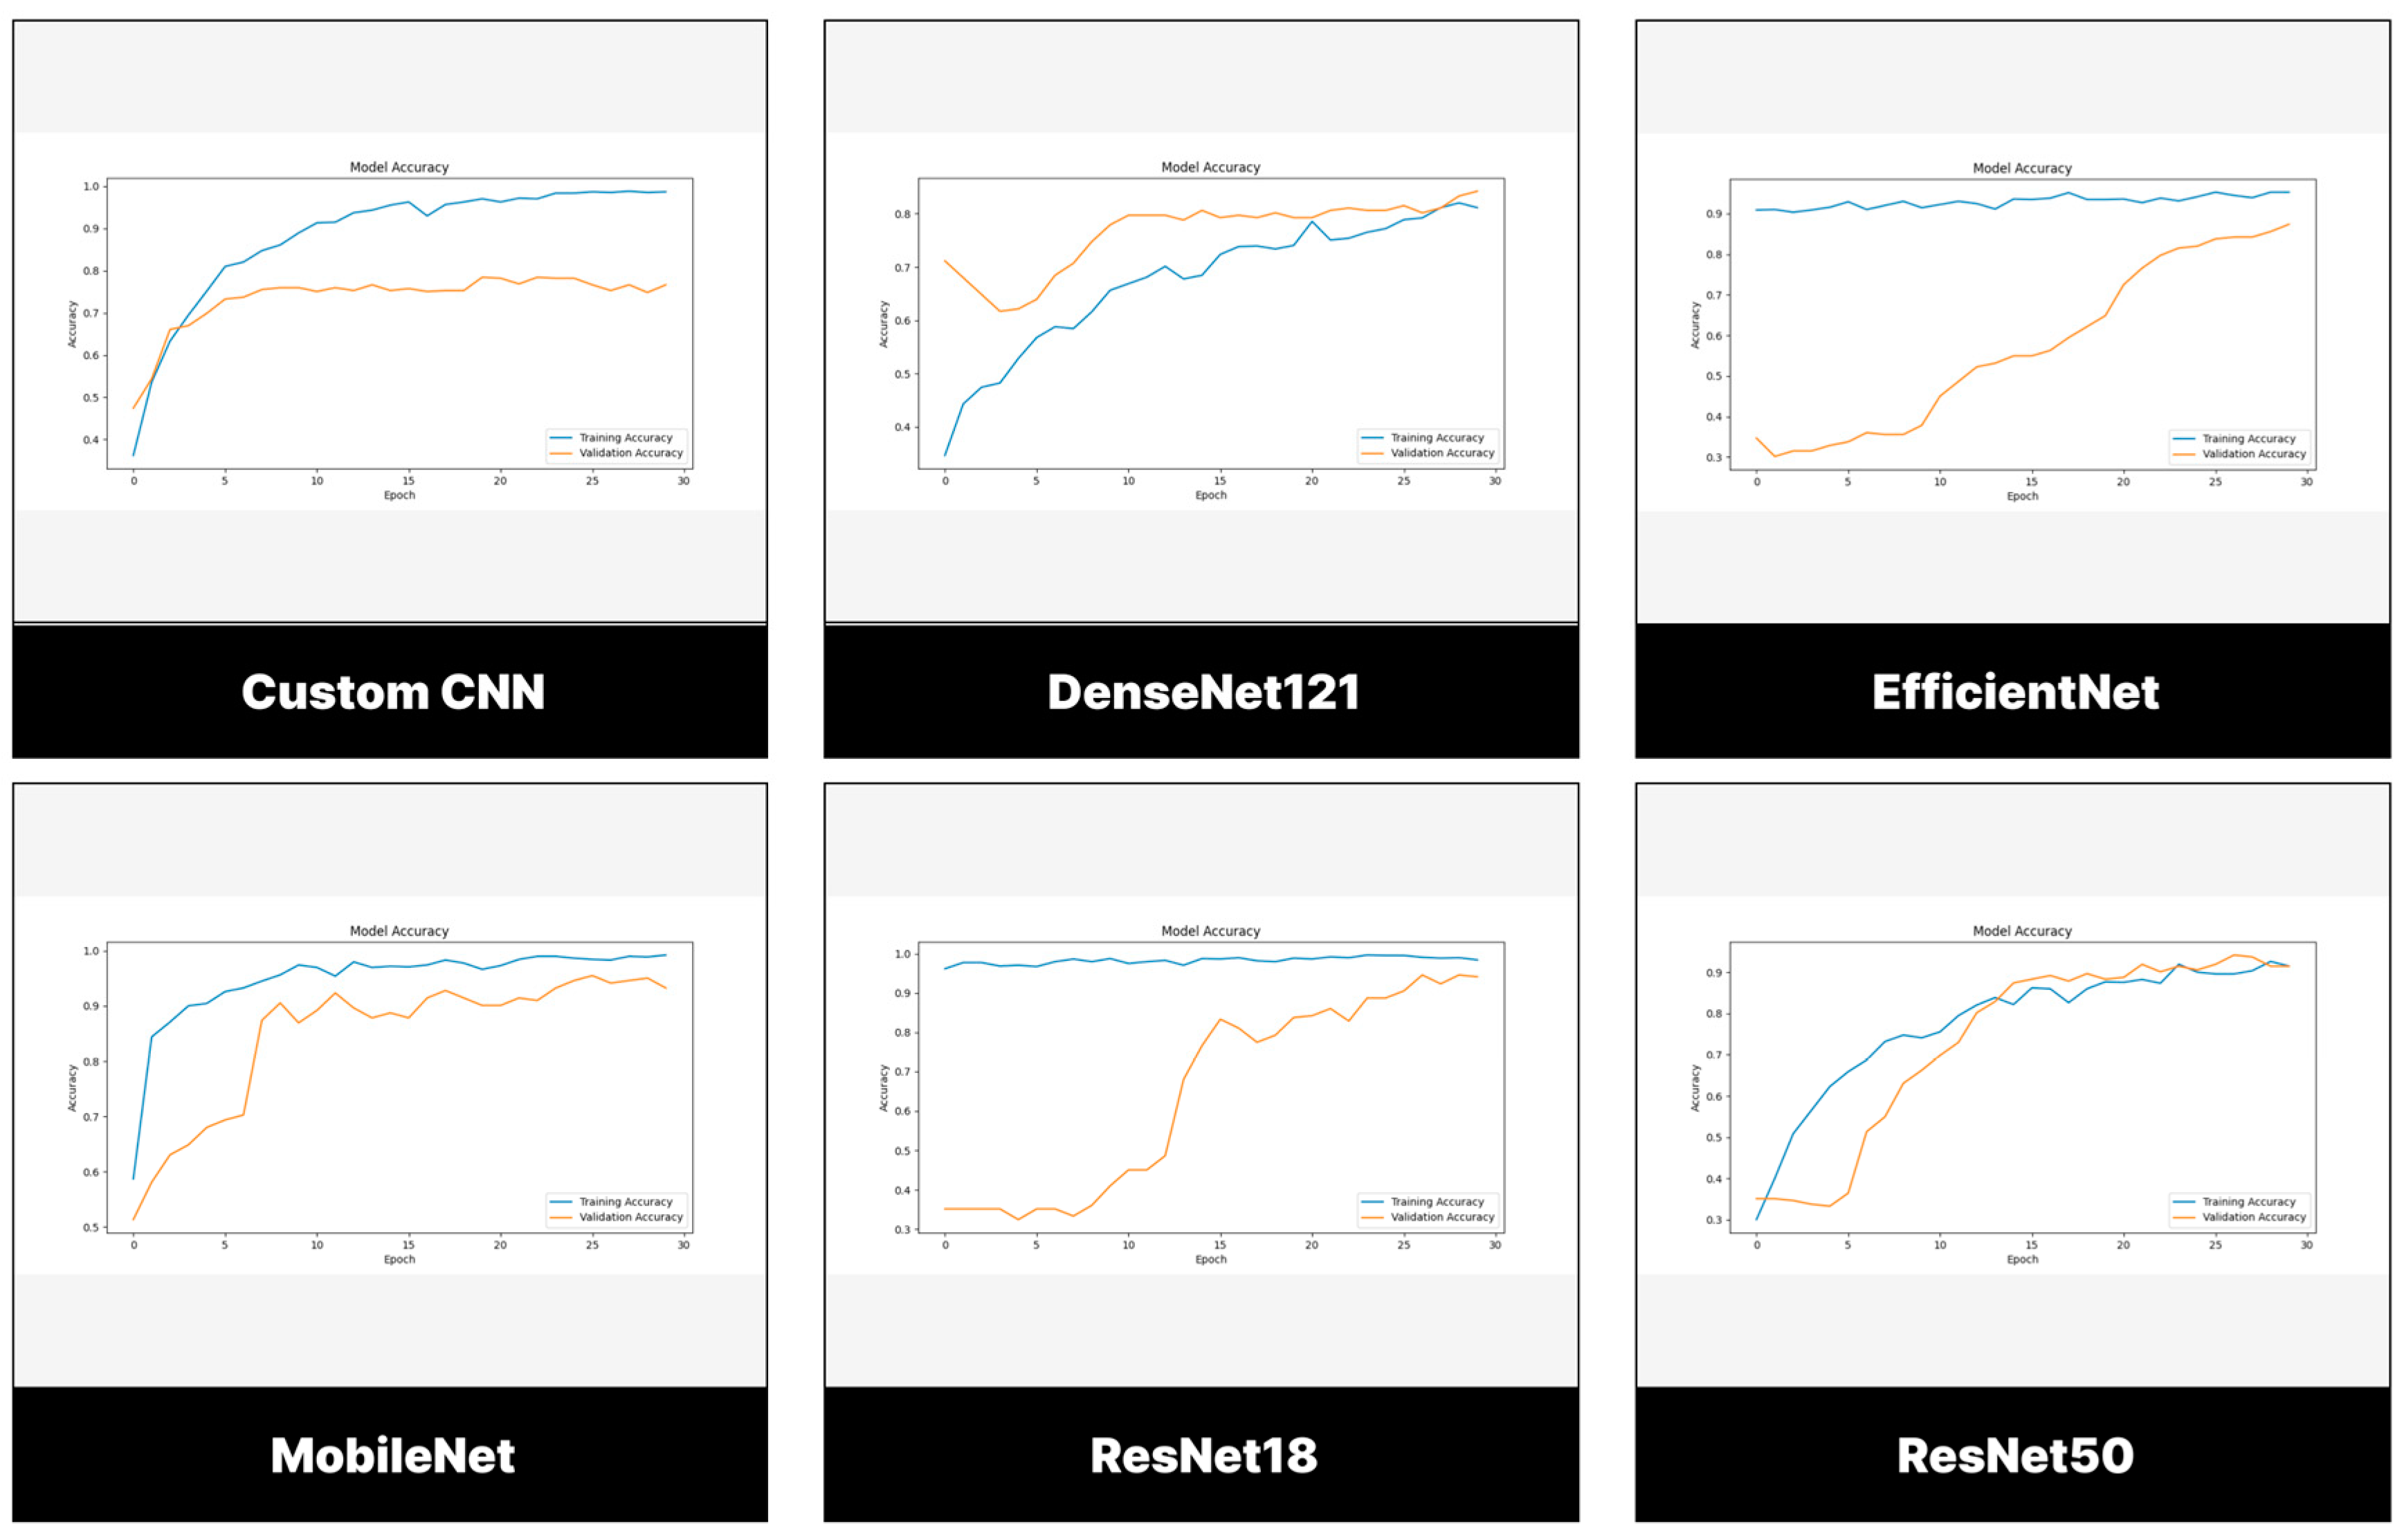
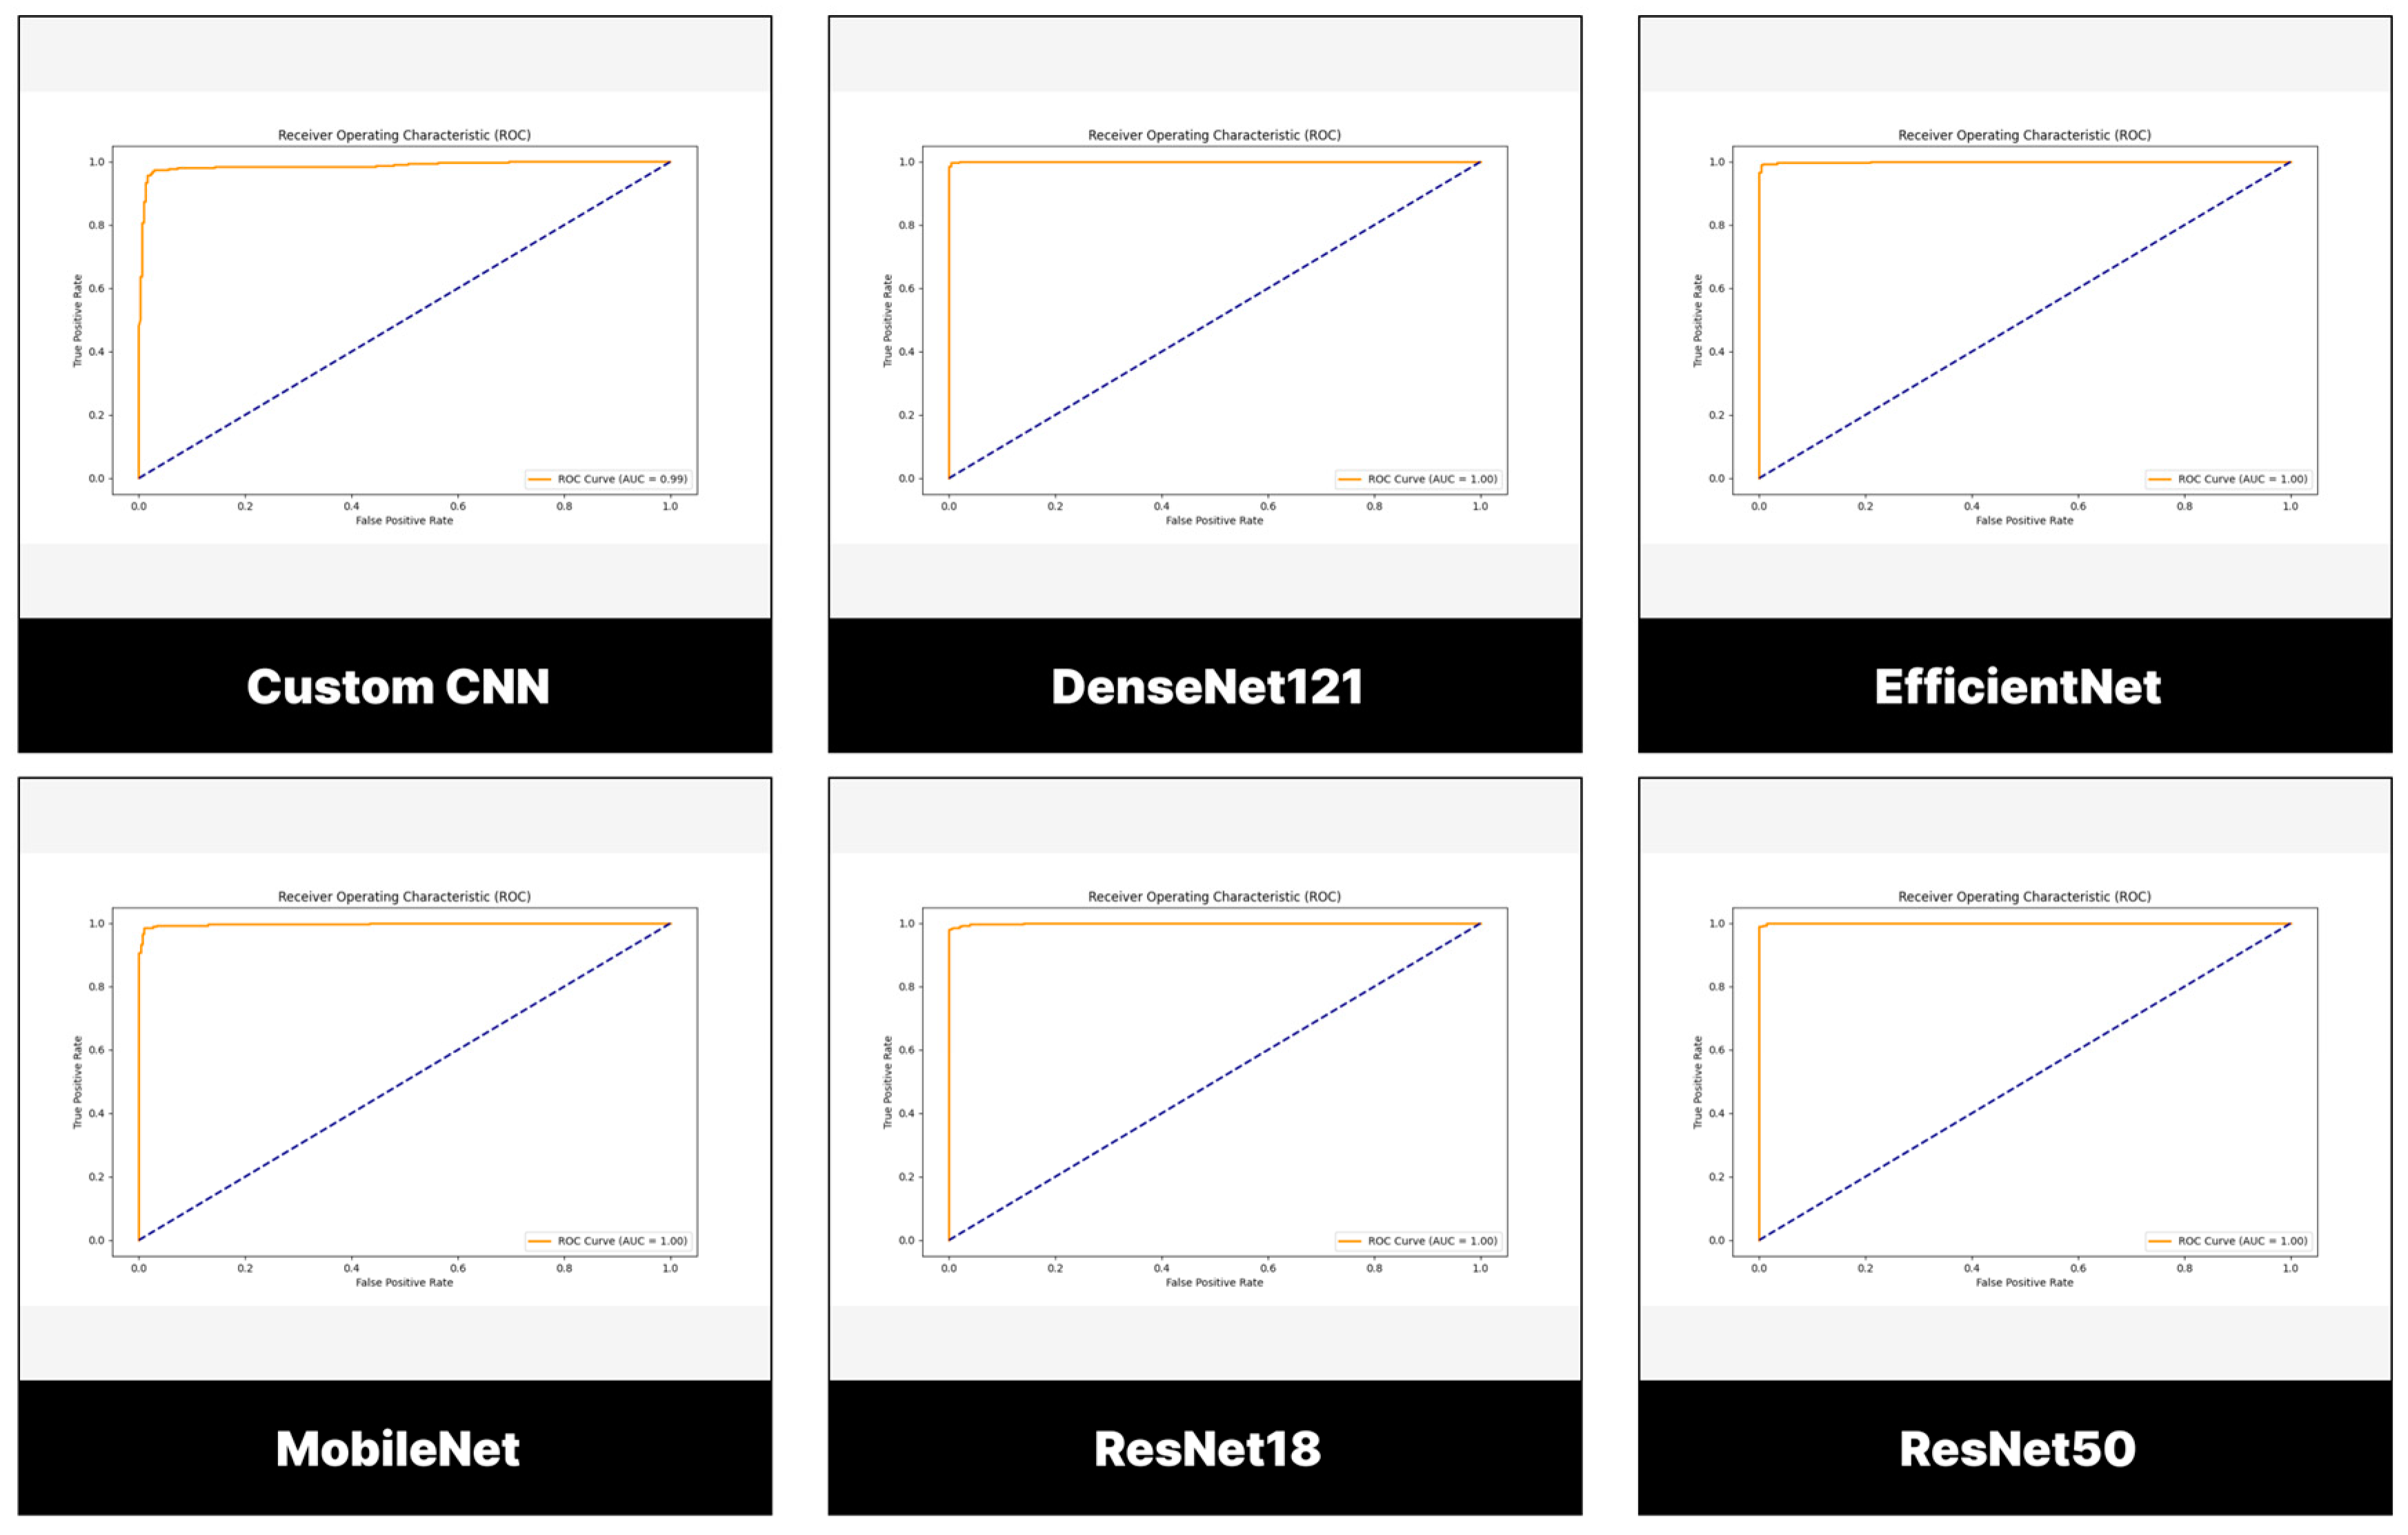
3.2. Performance Evaluation of Models Trained and Tested Using BTD-MRI Dataset

3.2.1. Testing Set

Binary classification is crucial for understanding if suspected patients is suffering from brain tumor or not. However, if the patient tested positive, a subsequent analysis is required to establish the subtype of tumor. Both untrained and pre-trained models are trained and tested using BTD-MRI dataset. The result achieved is stated as follows: The performance evaluation customized CNN developed from scratch resulted in 97.17% accuracy, 97.32% precision, 97.00% recall, 97.33% specificity, and 97.16% F1-Score and 99.00% AUC. Testing the performance of pre-trained ResNet-50 indicated that the model achieved 87.37% accuracy, 99.00% precision, 99.33% recall, 99.00% specificity, 99.17% F1-Score and 100.00% AUC. While pre-trained ResNet-18 on the other hand achieved 98.83% accuracy, 99.33% precision, 98.33% recall, 99.33% specificity, 98.83% F1-Score and 100.00% AUC.
Notwithstanding, testing MobileNetV2 using reserve dataset has shown that the model achieved 98.00% accuracy, 97.06% precision, 99.00% recall, 97.00% specificity, 98.02% F1-Score and 99.74.% AUC. The performance evaluation of pre-trained EfficientNet achieved 98.17% accuracy, 96.76% precision, 99.67% recall, 96.67% specificity, 98.18% F1-Score and 99.91% AUC. Lastly, performance evaluation of pre-trained DenseNet121 indicated that the DL architecture achieved 98.00% accuracy, 96.15% precision, 100.00% recall, 96.00% specificity, 98.18% F1-Score and 99.99% AUC as summarized in Table 4. The ROC/AUC curve of the models are presented in Figure 6.

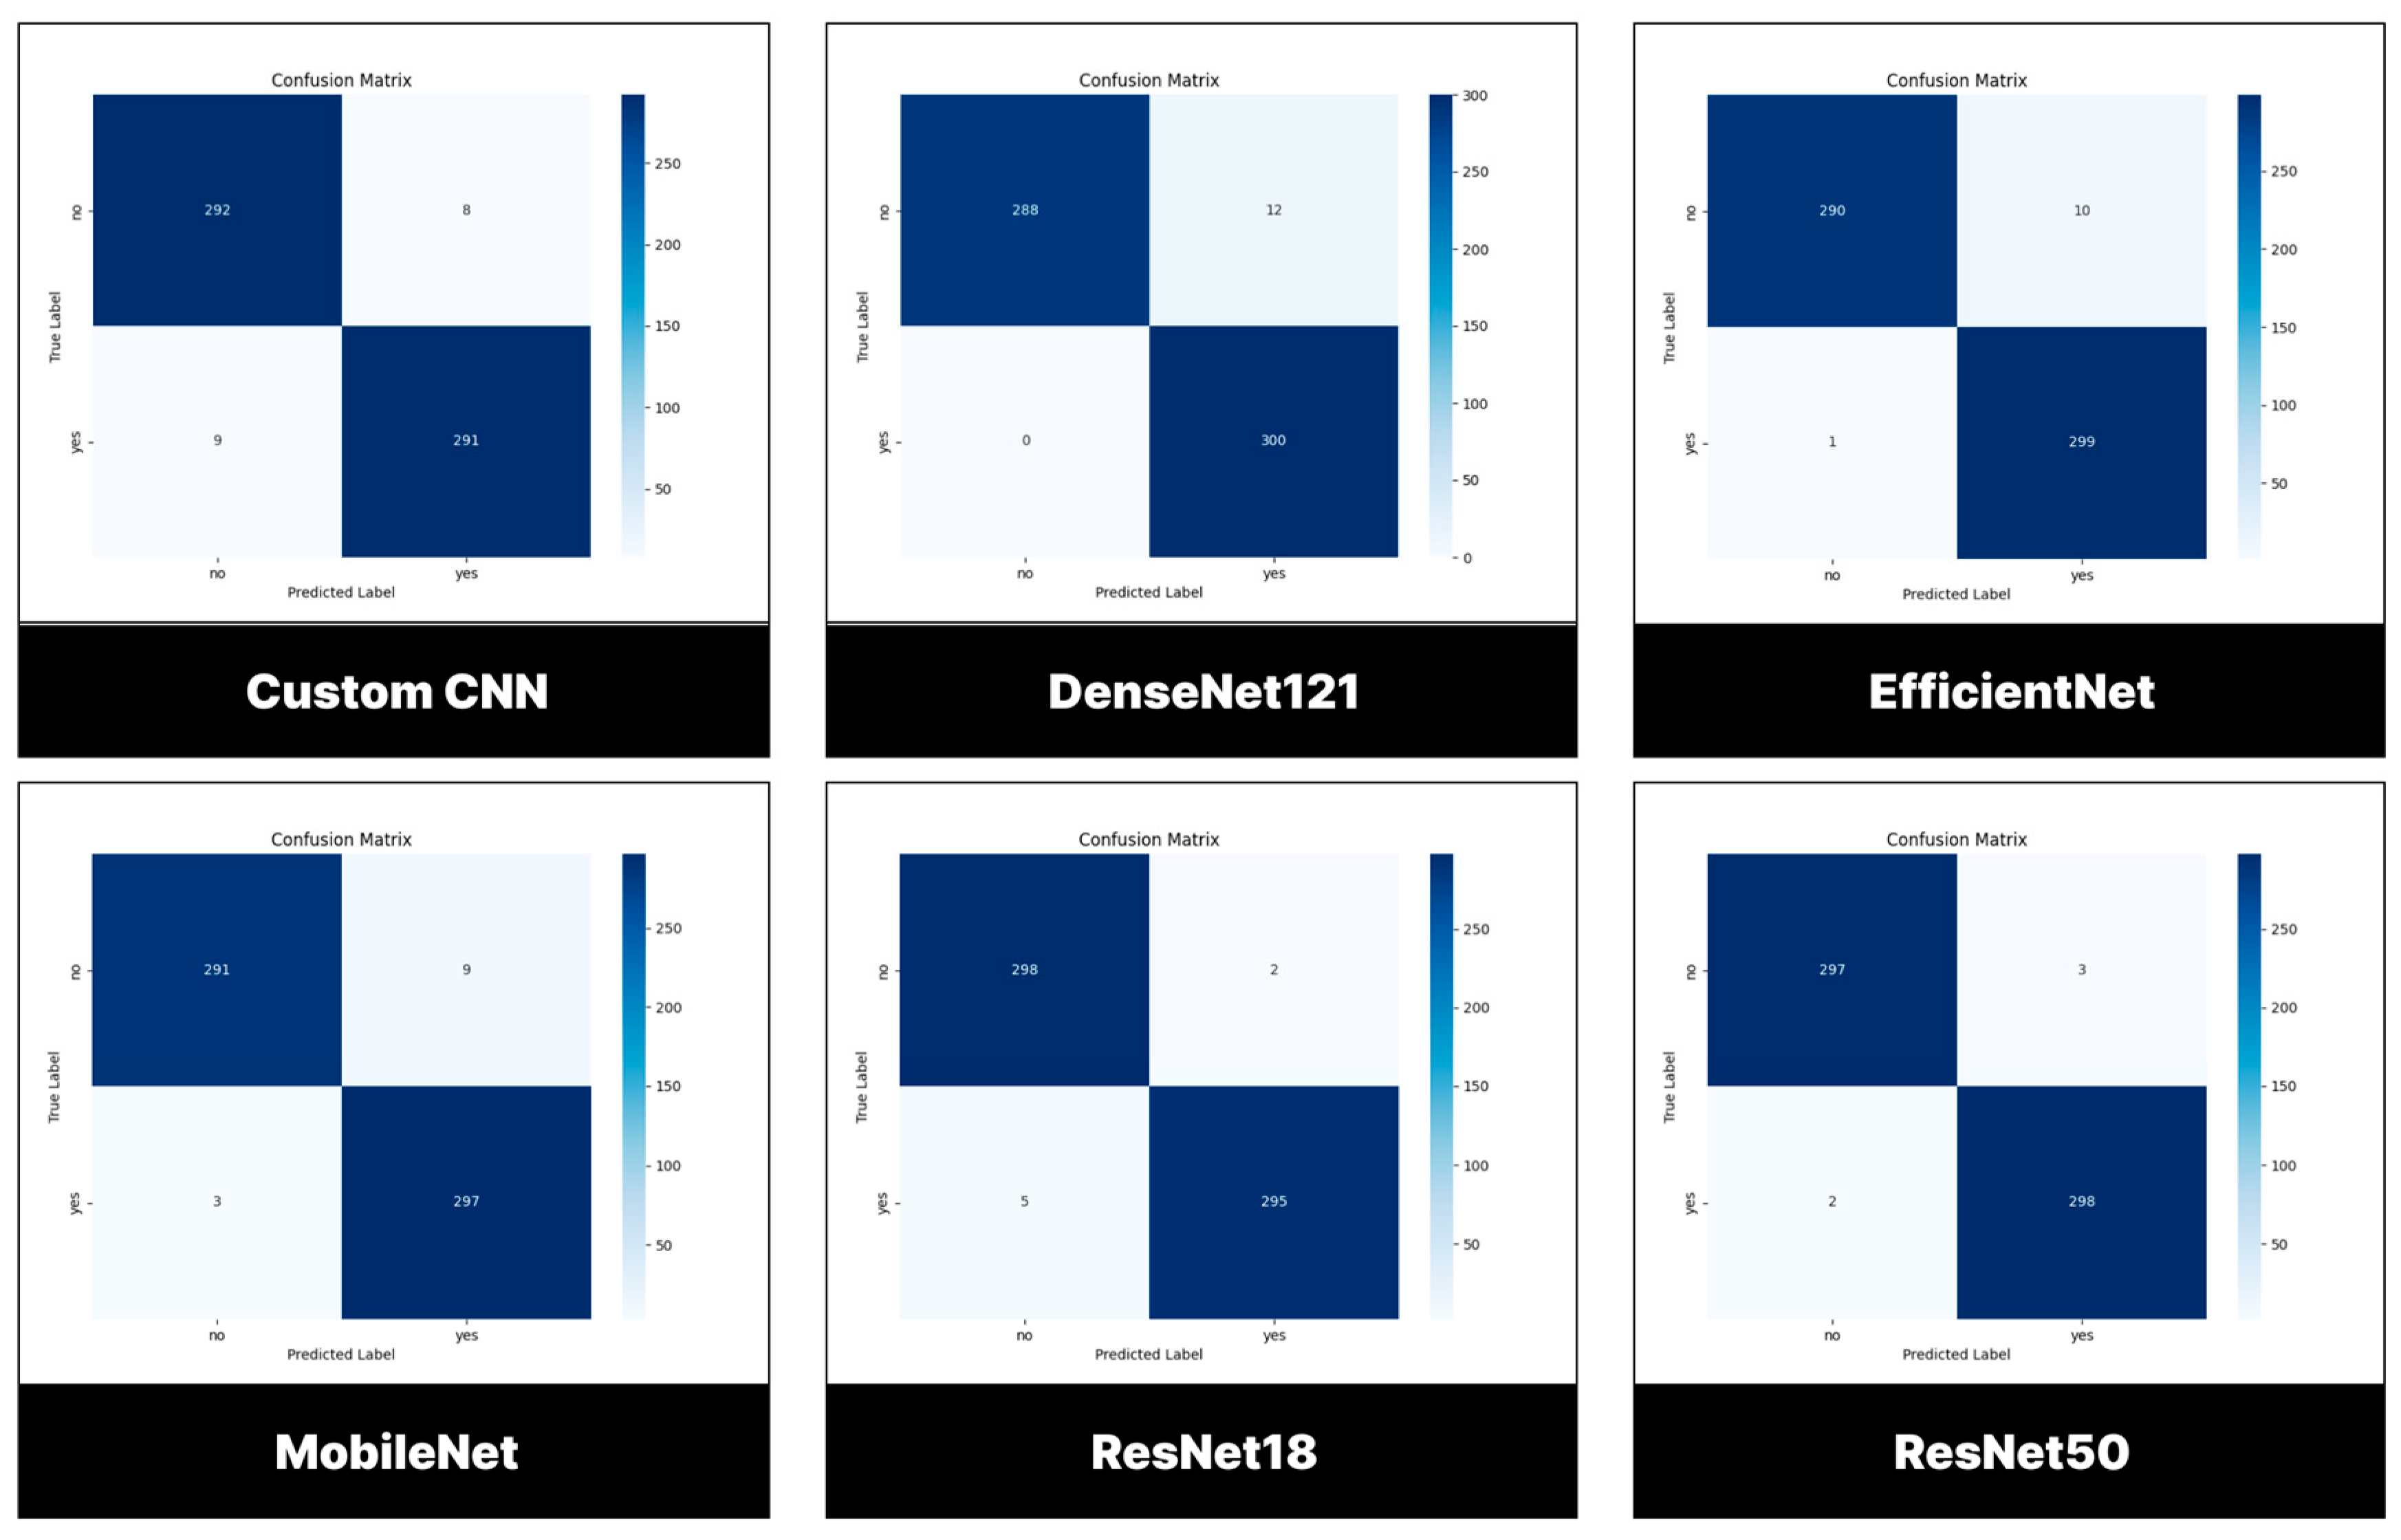
3.2.2. Confusion Matrix

For binary classification, the models were evaluated using 600 images (300 for each group, Custom CNN was able to accurately classified 291 tumor cases (291/300) and 292 no tumor cases (292/300), DenseNet121 was able to accurately classified 300 tumor cases (300/300) and 288 no tumor cases (288/300). EfficientNet was able to accurately classified 299 tumor cases (299/300) and 290 no tumor cases (290/300), MobileNetV2 was able to accurately classified 297 tumor cases (297/300) and 291 no tumor cases (291/300). ResNet50 was able to accurately classified 298 tumor cases (298/300) and 297 no tumor cases (297/300). ResNet18 was able to accurately classified 295 tumor cases (295/300) and 298 no tumor cases (298/300) as summarized in Figure 7.

3.3. Performance Evaluation of Models Trained and Tested Using BMS-BTC Dataset

3.3.1. Testing Set

Considering the fact that there are several subtypes of brain tumor, training models to discriminate between these subtypes are crucial for proper treatment. Thus, in this study both untrained and pre-trained models are trained and tested using BMS-BTC dataset. The result achieved is stated as follows: The performance evaluation customized CNN developed from scratch resulted in 76.26% accuracy, 77.14% precision, 77.27% recall, 92.38% specificity, 77.10% F1-Score and 92.75% AUC. Testing the performance of pre-trained ResNet-50 indicated that the model achieved 87.37% accuracy, 87.64% precision, 87.37% recall, 95.76% specificity, 86.87% F1-Score and 99.25% AUC. While pre-trained ResNet-18 on the other hand achieved 92.42% accuracy, 92.84% precision, 92.42% recall, 97.48% specificity, 92.37% F1-Score and 99.50% AUC.
Consequently, testing MobileNetV2 using reserve dataset has shown that the model achieved 99.23% accuracy, 93.37% precision, 92.93% recall, 97.67% specificity, 92.79% F1-Score and 100.00% AUC. The performance evaluation of pre-trained EfficientNet achieved 87.88% accuracy, 88.33% precision, 87.88% recall, 96.02% specificity, 87.61% F1-Score and 98.75% AUC. Lastly, performance evaluation of pre-trained DenseNet121 indicated that the DL architecture achieved 92.93% accuracy, 83.88% precision, 83.84% recall, 94.68% specificity, 83.41% F1-Score and 97.25% AUC as summarized in Table 5. The ROC/AUC curve of the models are presented in Figure 8.

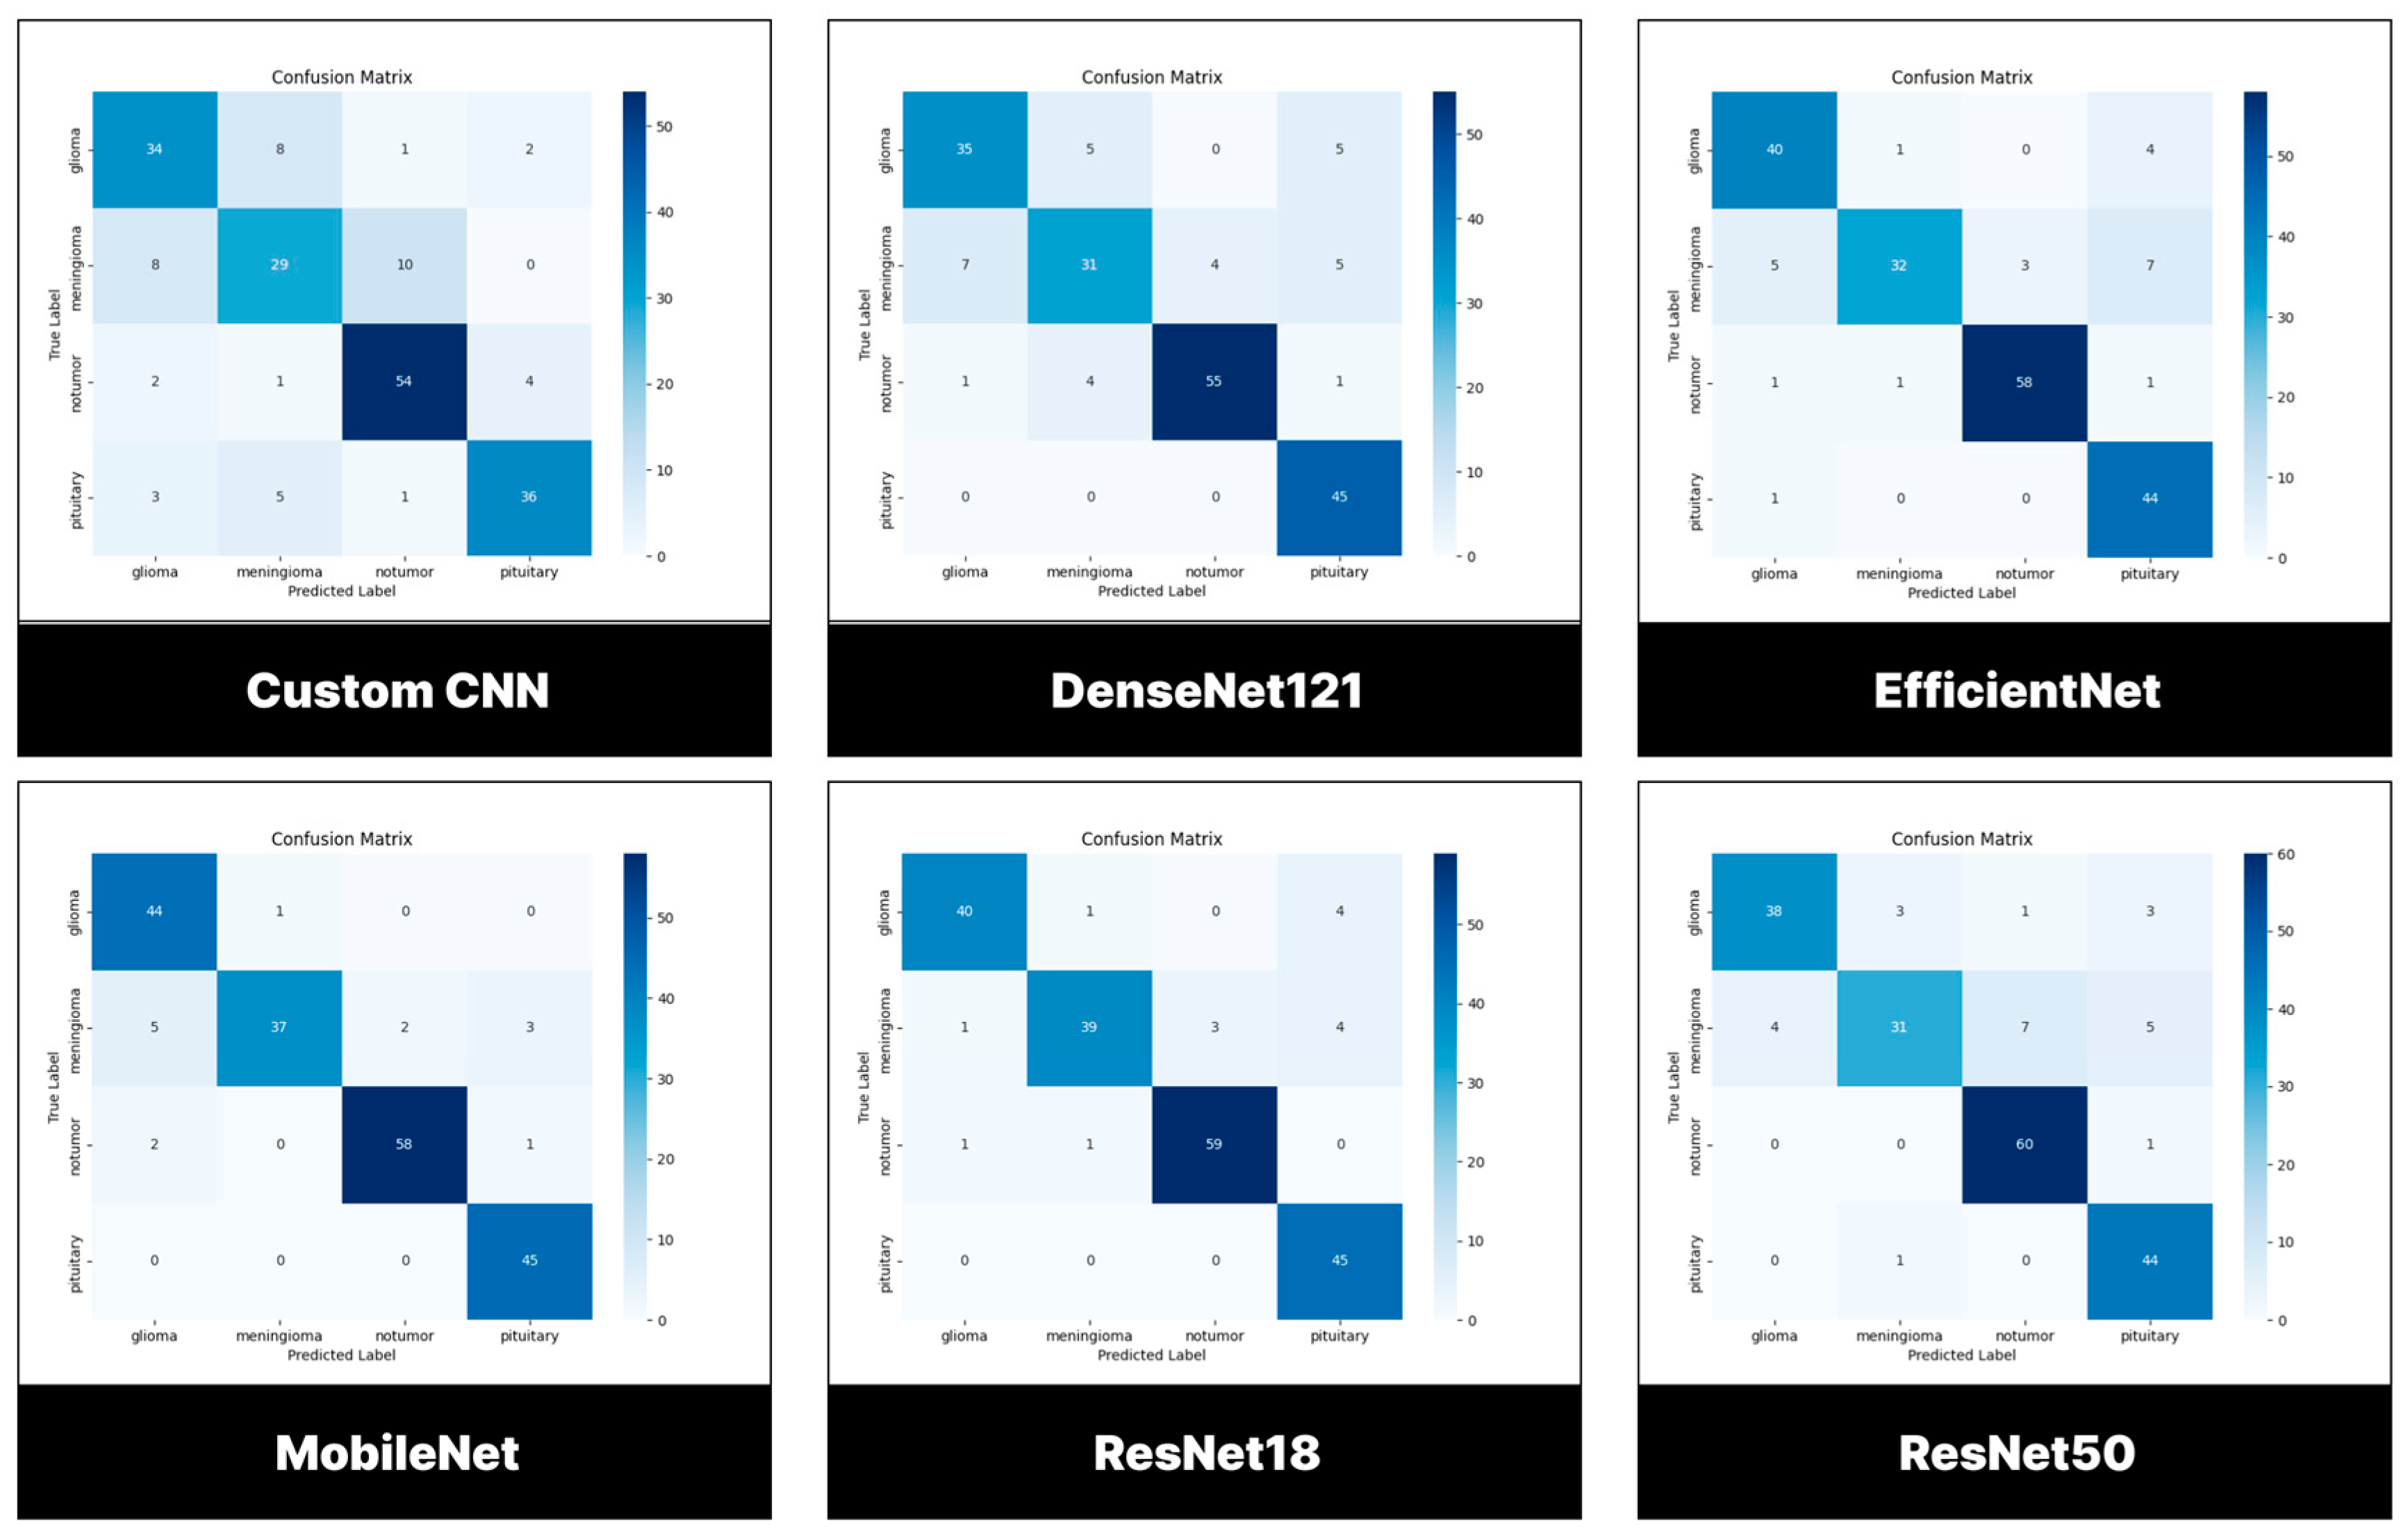
3.3.2. Confusion Matrix

For multi-class classification, the models were evaluated using 198 images for the 4 classifications. Glioma (45), Meningioma (47), No tumor (61), Pituitary (45). Custom CNN was able to accurately classify 34 Glioma cases (34/45) with 11 misclassifications, 29 Meningioma cases (29/47) with 18 misclassifications, 54 No tumor cases (54/61) with 7 misclassifications and 36 Pituitary cases (36/45) with 9 misclassifications. DenseNet121 was able to accurately classify 35 Glioma cases (35/45) with 10 misclassifications, 31 Meningioma cases (31/47) with 16 misclassifications, 55 No tumor cases (55/61) with 6 misclassifications and 45 Pituitary cases (45/45) with 0 misclassification.
EfficientNet was able to accurately classify 40 Glioma cases (40/45) with 5 misclassifications, 32 Meningioma cases (32/47) with 15 misclassifications, 58 No tumor cases (58/61) with 3 misclassifications and 44 Pituitary cases (44/45) with 1 misclassification. MobileNetV2 was able to accurately classify 44 Glioma cases (44/45) with 1 misclassification, 37 Meningioma cases (37/47) with 10 misclassifications, 58 No tumor cases (58/61) with 3 misclassifications and 45 Pituitary cases (45/45) with 0 misclassifications.
ResNet50 was able to accurately classify 38 Glioma cases (38/45) with 7 misclassifications, 31 Meningioma cases (31/47) with 16 misclassifications, 60 No tumor cases (60/61) with 1 misclassification and 44 Pituitary cases (44/45) with 1 misclassification. ResNet18 was able to accurately classify 40 Glioma cases (40/45) with 5 misclassifications, 39 Meningioma cases (39/47) with 8 misclassifications, 59 No tumor cases (59/61) with 32misclassifications and 45 Pituitary cases (45/45) with 0 misclassifications as summarized in Figure 9.

3.4. Deployment of Model

The proposed AI/IoT-enabled framework is an integrated system, which is deployed online (http://braintumorapp.aiiot.center). The system allow easy access and classification of MRI into one of the binary classes (MRI vs non-MRI, tumor vs no tumor) and 4 classes. The detection process revolves around 4 main steps which include log in, uploading of image, selection of diagnosis and detection. The first step allows users to log in using username and password. The second step involves uploading of MRI using through a viable internet where the image can undergo pre-processing through resizing in order to fit the network input size. The next step involves selection of diagnosis (i.e., brain tumor) and subsequently classification in a matter of seconds. The whole process (from upload to classification) can be achieved in less than a minute. The step-by-step process is illustrated in Figure 10 and in a video submitted as a supplementary file.

4. Discussion

The advancement in medical technologies is facilitated by the integration of cutting-edge technologies, which include AI, big biomedical data, cloud computing, IoT etc. These technologies have shown to aid clinicians in conducting accurate and precise diagnosis, treatment, analysis of electronic health records (EHRs) etc. One of the clinical field that is benefiting from these technologies revolves around computer-vision based application of biomedical imaging. AI-driven framework have been developed for the CAD of several diseases using wide range of biomedical images which include CT, MRI, ultrasound, X-ray etc. Integration of CAD into clinical diagnosis have shown to improve accuracy, reduce errors, and relieve workload and time-saving. Moreover, the integration of IoT into CAD enables real-time screening of infection, sharing of biomedical data, monitoring and surveillance of diseases. Thus, in this study, we proposed a framework that employ AI and IoT to augment the capabilities of neuro-oncologists/radiation-oncologists and accessible to patients for real-time and fast screening of brain cancer from MRI.
By leveraging the power of DL models, we developed CAD using both untrained and pre-trained CNNs integrated with IoMT for the development of fast and real-time platform for the binary classification and quaternary classification of brain tumor and no tumor. The result achieved as shown in Table 4 indicated that ResNet18 outperformed all the models achieving higher score in terms of accuracy, precision, specificity, F1-score. Other models that also achieve significance result include ResNet50, DenseNet121 and MobileNetV2. Moreover, ResNet-18 also perform very well in terms of discriminating between brain tumor and no tumor resulting in 98.83% accuracy (accurately classifying 593/600 images while misclassifying 7 images) only trailing behind ResNet-50 with 99.16% accuracy (accurately classifying 595/600 images) as shown in Figure 7. Comparison between untrained custom CNN and pre-trained models has shown that the gap between these models are very narrow. Custom CNN outperformed ResNet-50 in terms of accuracy. Therefore, despite the limitation of custom CNN, it achieved moderate results for the binary classification of brain tumor and no tumor.
Subsequently, the comparison of the models trained for quaternary classification has shown that MobileNetV2 achieved the best result across all the metrics as shown in Table 5. ResNet18, DenseNet121 and EfficientNet also perform very well with high scores across all metrics. Moreover, evaluation of the model using 198 has shown that it correctly classify 184/198 (92.92% accuracy) while misclassifying 14 as shown in Figure 9. Customized model on the other hand, achieved significantly lower scores in terms of accuracy, precision, recall and F1-score with only significance result in terms of average specificity and AUC. Unlike in binary classification where the model perform decently, the increase in number of classes has shown to contribute to the lower performance.

4.1. Comparison with Related Work

Our models are trained to classify both binary and quaternary classes using BTD-MRI dataset (with 3060 total MRIs) and BMS-BTC dataset (with 1311 total MRIs) respectively. In order to conduct realistic evaluation with existing studies, we focus on some criteria, which include the number of dataset, the number of classes, data augmentation of training sets, pre-processing steps, hybrid or ensemble learning and cross validation.

4.1.1. Binary Classification

The study proposed by Aamir et al [31] recorded lower accuracy using two separate dataset with less number of images. The study proposed by Zubair Rahman et al. [32] achieved slightly higher accuracy of 99.83% compared with ResNet18 with 98.83% despite training and testing using similar dataset. The study conducted by Sawant et al. [33] recorded slightly lower accuracy than ResNet18. The study initially curated 1800 images, which is subsequently enlarged using data augmentation techniques. While the study reported by Alsubai [34] achieved almost similar result with our best performing model despite using significantly less number of images. The high result achieved can be attributed to the combination of CNN and LSTM and the intensive data pre-processing techniques adopted. Lastly, the study reported by Gupta et al. [35] achieved optimum accuracy using VGG-19. The study initially curated 253 images, which is subsequently magnified using data augmentation techniques. The summary for comparison with related work for binary classification is shown in Table 6.

4.1.2. Multiclass Classification

The study proposed by Sekhar et al. [21] achieved high score in terms of average sensitivity, specificity, F1-score, precision and recall by using GoogleNet-SVM for ternary classification. The high performance achieved may be attributed to the deployment of hybrid models and less number of classes. The study conducted by Biswas et al. [24] also achieved slightly high score in terms of accuracy and sensitivity using less number of image dataset compared with our best performing model. The study conducted extensive experiment that require several steps such as pre-processing, clustering, feature extraction and classification using ANN. Moreover, the study proposed by Amin et al. [25] achieved significantly high score using 40,145 slices. Despite the fact that the study conducted quaternary classification similar with our study, however, the study relies on several techniques such as feature extraction using InceptionV3, the use of 2 classifiers and segmentation approach.
The study proposed by Rasool [26] also reported the 4-way classification of MRIs, which resulted in excellent result using ensemble DL and ML framework. The framework achieved almost similar result using GoogleNet-SoftMax with MobileNetV2, despite using larger dataset. Moreover, the study reported achieving 98.1% accuracy using GoogleNet-SVM. Abdusalomov et al. [27] achieved nearly perfect score in terms of accuracy using pre-trained YOLOv7. The high accuracy achieved may be attributed to the use of larger dataset (10,288 MRIs), data augmentation, and several image pre-processing techniques. Sinha and Kumar [28] on the other hand achieved almost similar result in terms of accuracy with MobileNetV2 despite using larger dataset, normalization and data augmentation.
Saeedi et al. [29] also achieved slightly higher accuracy using 2D CNN compared with MobileNetV2 despite training using larger dataset and conducting data augmentation which maximize the training set to approximately 10, 000. The study proposed by Khaliki and Başarlan [23] achieved higher score for the 4-way classification of brain tumors and no tumor by using VGG16. However, the model was trained and validated using dataset doubled the size use to trained and validated MobileNetV2. Lastly, the study reported by Aamir [31] achieved higher accuracy by using optimized CNN. The result achieved may be linked with the use of large volume of dataset (7023) and several data processing. The summary for comparison with related work for multiclass classification is shown in Table 7.

4.2. Limitation and Future Outlook

DL model requires large volume of training dataset in order to achieve optimum performance. Despite the fact that the use of pre-trained models have shown to achieve higher performance in comparison with untrained models, training pre-trained models with substantial amount of dataset can lead to high performance. One of the limitations of our study include the use of small dataset, which comprises of 3000 for binary classes and 1311 for multi classes. Another limitation include the use of single models designed using SoftMax as classifier.
Due to likelihood if miss classification, our future work will attempt to improve the binary classification by merging the 3 tumors (glioma, meningioma and pituitary) of the BMS-BTC dataset into tumor while the no tumor will be merge with the no tumor class of the BTD-MRI dataset. Secondly, we can improve the performance of the models by acquiring more dataset such as the CE-MRI Figshare, 2020-BRATS, BD-Brain-Tumor etc. Moreover, we will implemented more data augmentation techniques such as flipping, rotation, mirroring, scaling, cropping etc. in order to maximize the training set. Notwithstanding, the overall classification efficacy can be improve by exploring ML classifiers such as SVM, KNN, RF, DT etc.

5. Conclusions

Medical practitioners use several techniques to assess patient harboring brain tumor. Among these techniques, neuroimaging based MRI approach remain the most popular and sought out technique for screening of patients suspected with brain tumor. However, despite reliance on this approach, it is prone to errors as a result of manual interpretation, which may lead to patient morbidity and mortality.
Thus, in this study, we proposed the implementation of a single untrained customized models and 5 pre-trained models which include ResNet-18, RestNet-50, EfficientNet-B0, MobileNetV2 and DenseNet121 for the binary (tumor vs non-tumor) and quaternary detection of brain tumor (Pituitary, Meningioma Glioma and No Tumor). Evaluation and comparative analysis between the models showed promising results while accurately discriminating between tumor and no tumor as well as subclasses of brain tumors. Among the implemented models, ResNet18 has shown remarkable result in with of accuracy of 98.83%, recall of 98.33 %, precision of 99.33%, specificity of 99.33%, F1-score of 98.83% and AUC score of 99.92 for binary classification. While MobileNetV2 achieved the best result with an accuracy of 92.93%, recall of 92.93%, precision of 93.37%, specificity of 97.67%, F1-score of 92.79% and AUC score of 100.00% for multiclass-classification.
The model is uploaded into the IoT healthcare website to enable real-time detection of brain tumors. Despite the excellent result achieved, we acknowledged that further investigation and testing other single models, hybrid models, and ensemble models are essential for improving performance. Moreover acquiring other dataset are crucial for inclusiveness and diversification. By development of CAD/IoMT-based platform, we aim to provide easy-access, fast and reliable avenue screening of brain tumor to both patients and medical practitioners.

Supplementary Materials

The following supporting information can be downloaded at the website of this paper posted on Preprints.org. Video S1: IBRAIN-DETECT.

Author Contributions

Methodology, Data collection and Data analysis, M.K.B. and A.U.I.; original draft preparation, A.U.I. and P.C.P.; review and editing, F.A..; supervision P.C.P. and F.A. All authors have read and agreed to the published version of the manuscript.

Funding

This research received no external funding.

Institutional Review Board Statement

Not applicable.

Informed Consent Statement

Not applicable.

Data Availability Statement

Conflicts of Interest

The authors declare no conflicts of interest..

References

  1. Bockaert, J.; Marin, P. mTOR in brain physiology and pathologies. Physiol Rev 2015, 95(4), pp.1157-1187. [CrossRef]
  2. Khaliki, M.Z.; Başarslan, M.S. Brain tumor detection from images and comparison with transfer learning methods and 3-layer CNN. Sci Rep 2024, 14(1), p.2664. [CrossRef]
  3. Cancer.Net. Brain Tumour: Statistics. Available online: https://www.cancer.net/cancer-types/brain-tumor/statistics (accessed on December 13, 2024).
  4. National Institute of Cancer. Tumor. Available online: https://www.cancer.gov/publications/dictionaries/cancer-terms/def/tumor (accessed on September 11, 2024).
  5. Louis, D.N.; Perry, A.; Wesseling, P.; Brat, D.J.; Cree, I.A.; Figarella-Branger, D.; Hawkins, C.; Ng, H.K.; Pfister, S.M.; Reifenberger, G; Soffietti, R. The 2021 WHO classification of tumors of the central nervous system: a summary. Neuro-oncol 2021, 23(8), pp.1231-1251. [CrossRef]
  6. Berger, T.R.; Wen, P.Y.; Lang-Orsini, M.; Chukwueke, U.N. World Health Organization 2021 classification of central nervous system tumors and implications for therapy for adult-type gliomas: a review. JAMA Oncol 2022, 8(10), pp.1493-1501.
  7. Smith, H.L.; Wadhwani, N.; Horbinski, C. Major features of the 2021 WHO classification of CNS tumors. Neurotherapeutics 2022, 19(6), pp.1691-1704. [CrossRef]
  8. Fitzgerald, R.C.; Antoniou, A.C.; Fruk, L.; Rosenfeld, N. The future of early cancer detection. Nat Med 2022, 28(4), pp.666-677. [CrossRef]
  9. Nadeem, M.W.; Ghamdi, M.A.; Hussain, M.; Khan, M.A.; Khan, K.M.; Almotiri, S.H.; Butt, S.A. Brain tumor analysis empowered with deep learning: A review, taxonomy, and future challenges. Brain Sci 2020, 10(2), p.118. [CrossRef]
  10. Chahal, P.K.; Pandey, S.; Goel, S. A survey on brain tumor detection techniques for MR images. Multimedia Tools Appl 2020, 79(29), pp.21771-21814. [CrossRef]
  11. Jan, Z.; Ahamed, F.; Mayer, W.; Patel, N.; Grossmann, G.; Stumptner, M.; Kuusk, A. Artificial intelligence for industry 4.0: Systematic review of applications, challenges, and opportunities. Expert Sys Appl 2023, 216, p.119456.
  12. Kaul, V.; Enslin, S.; Gross, S.A. History of artificial intelligence in medicine. Gastrointestinal endoscopy 2020, 92(4), pp.807-812. [CrossRef]
  13. Briganti, G.; Le Moine, O. Artificial intelligence in medicine: today and tomorrow. Front Med 2020, 7, p.509744. [CrossRef]
  14. Ibrahim, A.U.; Ozsoz, M.; Serte, S.; Al-Turjman, F.; Yakoi, P.S. Pneumonia classification using deep learning from chest X-ray images during COVID-19. Cognit Comput 2024, 16(4), pp.1589-1601. [CrossRef]
  15. Uzun Ozsahin, D.; Mustapha, M.T.; Uzun, B.; Duwa, B.; Ozsahin, I. Computer-aided detection and classification of monkeypox and chickenpox lesion in human subjects using deep learning framework. Diagn 2023, 13(2), p.292. [CrossRef]
  16. Umar Ibrahim, A.; Al-Turjman, F.; Ozsoz, M.; Serte, S. Computer aided detection of tuberculosis using two classifiers. Biomed Eng/Biomedizinische Technik 2022, 67(6), pp.513-524. [CrossRef]
  17. Ibrahim, A.U.; Dirilenoğlu, F.; Hacisalihoğlu, U.P.; Ilhan, A.; Mirzaei, O. Classification of H. pylori Infection from Histopathological Images Using Deep Learning. J Imaging Info Med 2024, pp.1-10. [CrossRef]
  18. Jinnai, S.; Yamazaki, N.; Hirano, Y.; Sugawara, Y.; Ohe, Y.; Hamamoto, R. The development of a skin cancer classification system for pigmented skin lesions using deep learning. Biomol 2020, 10(8), p.1123. [CrossRef]
  19. Mustapha, M.T.; Ozsahin, D.U.; Ozsahin, I.; Uzun, B. Breast cancer screening based on supervised learning and multi-criteria decision-making. Diagn 2022, 12(6), p.1326. [CrossRef]
  20. Bychkov, D.; Linder, N.; Turkki, R.; Nordling, S.; Kovanen, P.E.; Verrill, C.; Walliander, M.; Lundin, M.; Haglund, C.; Lundin, J. Deep learning based tissue analysis predicts outcome in colorectal cancer. Sci Rep 2018, 8(1), p.3395. [CrossRef]
  21. Sekhar, A.; Biswas, S.; Hazra, R.; Sunaniya, A.K.; Mukherjee, A; Yang, L. Brain tumor classification using fine-tuned GoogLeNet features and machine learning algorithms: IoMT enabled CAD system. IEEE J. Biomed Health Info 2021, 26(3), pp.983-991. [CrossRef]
  22. Irkham, I.; Ibrahim, A.U.; Nwekwo, C.W.; Al-Turjman, F.; Hartati, Y.W. Current technologies for detection of COVID-19: Biosensors, artificial intelligence and internet of medical things (IOMT). Sens 2022, 23(1), p.426. [CrossRef]
  23. Khaliki, M.Z.; Başarslan, M.S. Brain tumor detection from images and comparison with transfer learning methods and 3-layer CNN. Sci Rep 2024, 14(1), p.2664. [CrossRef]
  24. Biswas, A.; Islam, M.S. Brain tumor types classification using K-means clustering and ANN approach. In 2021 2nd International Conference on Robotics, Electrical and Signal Processing Techniques (ICREST), Dhaka, Bangladesh , (5-7 Jan. 2021).
  25. Amin, J.; Anjum, M.A.; Sharif, M.; Jabeen, S.; Kadry, S.; Moreno Ger, P. A new model for brain tumor detection using ensemble transfer learning and quantum variational classifier. Comput Intel Neurosci 2022, 1, p.3236305. [CrossRef]
  26. Rasool, M.; Ismail, N.A.; Boulila, W.; Ammar, A.; Samma, H.; Yafooz, W.M.; Emara, A.H.M. A hybrid deep learning model for brain tumour classification. Entropy 2022, 24(6), p.799. [CrossRef]
  27. Abdusalomov, A.B.; Mukhiddinov, M.; Whangbo, T.K. Brain tumor detection based on deep learning approaches and magnetic resonance imaging. Cancers 2023, 15(16), p.4172. [CrossRef]
  28. Sinha, A.; Kumar, T. Enhancing Medical Diagnostics: Integrating AI for precise Brain Tumour Detection. Procedia Comput Sci 2024, 235, pp.456-467. [CrossRef]
  29. Saeedi, S.; Rezayi, S.; Keshavarz, H.; Niakan Kalhori, S. MRI-based brain tumor detection using convolutional deep learning methods and chosen machine learning techniques. BMC Med Info Decis Making 2023, 23(1), p.16. [CrossRef]
  30. Aleid, A.; Alhussaini, K.; Alanazi, R.; Altwaimi, M.; Altwijri, O.; Saad, A.S. Artificial intelligence approach for early detection of brain tumors using MRI images. Appl Sci 2023, 13(6), p.3808. [CrossRef]
  31. Aamir, M.; Namoun, A.; Munir, S.; Aljohani, N.; Alanazi, M.H.; Alsahafi, Y.; Alotibi, F. Brain Tumor Detection and Classification Using an Optimized Convolutional Neural Network. Diagn 2024, 14(16), p.1714. [CrossRef]
  32. Zubair Rahman, A.M.J.; Gupta, M.; Aarathi, S.; Mahesh, T.R.; Vinoth Kumar, V.; Yogesh Kumaran, S.; Guluwadi, S. Advanced AI-driven approach for enhanced brain tumor detection from MRI images utilizing EfficientNetB2 with equalization and homomorphic filtering. BMC Med Info Decis Making 2024, 24(1), p.113. [CrossRef]
  33. Sawant, A.; Bhandari, M.; Yadav, R.; Yele, R.; Bendale, M.S. Brain cancer detection from mri: A machine learning approach (tensorflow). Brain 2018, 5(04), pp.2089-2094.
  34. Alsubai, S.; Khan, H.U.; Alqahtani, A.; Sha, M.; Abbas, S.; Mohammad, U.G. Ensemble deep learning for brain tumor detection. Front Comput Neurosci 2022, 16, p.1005617. [CrossRef]
  35. Gupta, M.; Sharma, S.K.; Sampada, G.C. Classification of Brain Tumor Images Using CNN. Comput Intel Neurosci 2023, (1), p.2002855. [CrossRef]
Figure 1. Experimental Set up.
Preprints 145221 g001
Figure 2. Samples of BTD-MRI dataset. . Left: Benign. Right: Malignant.
Preprints 145221 g002
Figure 4. Training graphs of models for binary classification.
Preprints 145221 g004
Figure 5. Training graphs of models for multi-class classification.
Preprints 145221 g005
Figure 6. ROC/AUC graph of models trained and tested using BTD-MRI Dataset.
Preprints 145221 g006
Figure 7. Confusion matrix of models trained and tested using BTD-MRI Dataset.
Preprints 145221 g007
Figure 8. ROC/AUC graph of models trained and tested using BMS-BTC Dataset.
Preprints 145221 g008
Figure 9. Confusion matrix of models trained and tested using BMS-BTC Dataset.
Preprints 145221 g009
Figure 10. Deployment of CAD/IoMT framework.
Preprints 145221 g010
Table 1. Summary of Literature survey.
Ref Model No of MRIs/Slices Accuracy
                        Multiclass
[21] GoogleNet-SVM 3064 100.00%
[23] VGG16 2870 98.00%
[24] ANN 563 97.83%
[25] inceptionV3+QVR 40,145 99.70%
[26] GoogleNet-SVM 3460 94.12%
[27] YOLOv7 10,288 99.50%
[28] multimodal approach + SVM 1747 92.00%
[29] 2D CNN 3264 93.44%
[30] Threshold-based segmentation 40 97.55%
[31] optimized CNN 7023 97.18%
                        Binary
[31] optimized CNN 1500 97.18%
[32] EfficientNetB2 3060 99.75%
[33] Le-Net 1800 98.6
[34] CNN-LSTM 253 99.1%
[35] VGG-16 253 100.00%
Table 2. Description of BTD-MRI dataset.
Classes Number of images %
Tumor 1500 50.00
No tumor 1500 50.00
Table 3. Description of BMS-BTC dataset.
Classes Number of images %
Pituitary 300 22.88
Meningioma 306 23.34
Glioma 300 22.88
No tumor 405 30.89
Table 4. Performance evaluation of models trained and tested using BTD-MRI Dataset.
Model/ Performance Metrics (%) Accuracy Recall Precision Specificity F1-Score AUC
Customized CNN 97.17 97.00 97.32 97.33 97.16 98.62
ResNet-18 98.83 98.33 99.33 99.33 98.83 99.92
ResNet-50 87.37 99.33 99.00 99.00 99.17 99.99
MobileNetV2 98.00 99.00 97.06 97.00 98.02 99.74
DenseNet121 98.00 100.00 96.15 96.00 98.04 99.99
EfficientNetB0 98.17 99.67 96.76 96.67 98.18 99.91
Table 5. Performance evaluation of models trained and tested using BMS-BTC Dataset.
Model/ Performance Metrics (%) Accuracy Recall Precision Av. Specificity F1-Score AUC
Customized CNN 76.26 77.27 77.14 92.38 77.10 92.75
ResNet-18 92.42 92.42 92.84 97.48 92.37 99.50
ResNet-50 87.37 87.37 87.64 95.76 86.87 99.25
MobileNetV2 92.93 92.93 93.37 97.67 92.79 100.00
DenseNet121 92.93 83.84 83.88 94.68 83.41 97.25
EfficientNetB0 87.88 87.88 88.33 96.02 87.61 98.75
Table 6. Comparison with related work for binary classification.
Ref Model No of MRIs/Slices Accuracy
[31] optimized CNN 1500 97.18%
[32] EfficientNet 3060 99.75%
[33] Le-Net 1800 98.60%
[34] CNN-LSTM 253 99.10%
[35] VGG-16 253 100.00%
This study ResNet18 3000 98.83%
Table 7. Comparison with related work for multiclass classification.
Ref Model No of MRIs/Slices Classes Accuracy
[21] GoogleNet-SVM 3064 3 100.00%
[23] VGG16 2870 4 98.00%
[24] ANN 563 3 97.83%
[25] inceptionV3+QVR 40,145 4 99.70%
[26] GoogleNet-SVM 3460 4 94.12%
[27] YOLOv7 10,288 4 99.50%
[28] multimodal approach + SVM 1747 4 92.00%
[29] 2D CNN 3264 4 93.44%
[31] optimized CNN 7023 4 97.18%
This study MobileNetV2 1311 4 92.93%
Disclaimer/Publisher’s Note: The statements, opinions and data contained in all publications are solely those of the individual author(s) and contributor(s) and not of MDPI and/or the editor(s). MDPI and/or the editor(s) disclaim responsibility for any injury to people or property resulting from any ideas, methods, instructions or products referred to in the content.
Copyright: This open access article is published under a Creative Commons CC BY 4.0 license, which permit the free download, distribution, and reuse, provided that the author and preprint are cited in any reuse.
Prerpints.org logo

Preprints.org is a free preprint server supported by MDPI in Basel, Switzerland.

Subscribe

Disclaimer

Terms of Use

Privacy Policy

Privacy Settings

© 2026 MDPI (Basel, Switzerland) unless otherwise stated