Submitted:
02 January 2025
Posted:
06 January 2025
You are already at the latest version
Abstract
In order to provide better geographic information services on time, a detection technique on the variation of remote sensing image has been investigated in this paper. Based on multiscale feature multiplex, a consistent regularization method together with a semi-supervised strategy has been proposed, which can solve the problems of unclear change edges and the issue of missing detection of very small targets. By constructing a learning training model of detection network, the performances have been enhanced with limited labeled data and effectively handle change detection tasks in complex scenes. The network consists of two parts. One part is the supervised multiscale feature fusion and multiplex, which enhances feature expression capabilities using channel and spatial attention mechanisms. We extract variation features through complex multiscale feature fusion and reuse strategies to alleviate unclear change edges and the omission of very small targets. The other part is the consistency regularization method for semi-supervised learning model, which adopts an alternating training among models. The prediction differences have been minimized, then updated model parameters. This constructed model of detection network has been verified at different labeling ratios on the datasets such as Wuhan university, China, building change detection and google earth imagery Guangzhou, China, change detection, etc. The experimental results show that this proposed technique demonstrates the best overall performance in complex situations with small dataset labeling ratios among existing detection methods.
Keywords:
image change detection
; multiscale feature fusion
; consistent regularization
; semi-supervised learning network
1. Introduction
The changed image detection is an important technology which refers to those remote sensing images in same geographical area captured at different time points in this approach. Identifying changes in the surface or landscape through these variations, which can be used as a basis for real-time updates to provide better geographic information services. Recent years, this technology has been used in urban planning [1,2], environmental monitoring [3], crop growth observation [4,5], and disaster weather forecast [6,7], etc. Generally, from used methods on the image change detection above, they are mainly divided into three types. (i) supervised, (ii) unsupervised and (iii) semi-supervised methods.
It was found that supervised methods perform well when trained with a large amount of labeled data. Li et al, proposed a multi-scale feature fusion Siamese network [8]. By introducing a multiscale fusion mechanism into the Siamese network, it can effectively use features of different scale images to enhance detection. Additionally, Yu et al, proposed an image change detection method that greatly improves the detection accuracy of image changes by using multi-level feature cross-fusion and three dimensional (3D) convolutional neural networks [9]. These methods can identify areas of change in images. However, the acquisition of labeled data is costly, especially in high-resolution remote sensing images, where manual annotation is complex and time-consuming.
Relatively, the unsupervised methods do not rely on labeled data for model training. Fang et al, proposed the Siamese nested fully convolutional network for change detection, which achieves high-resolution remote sensing images in setting through a densely connected Siamese network structure [10]. Subsequently, Jiang et al, developed an unsupervised remote sensing image processing framework by integrating the image generation capabilities of deep convolutional generative adversarial networks with the temporal analysis advantages of waveform neural network [11]. Although these unsupervised methods reduce the dependence on labeled data, the models struggle to capture complex change patterns and are prone to noise interference due to the lack of supervisory signals, leading to lower detection accuracy and difficulty in meeting the needs of high-precision applications.
The semi-supervised methods, combining advantages of both above, enhance the model's detection capabilities by utilizing the potential information of unlabeled data when labeled data is insufficient. Shuai et al, constructed a superpixel-based multiscale Siamese graph attention network [12], which demonstrates a potential for superiority. Thereafter, Wang et al, set up a method based on existing vector polygons. They use latest imagery improving detection accuracy [13]. In recent years, many semi-supervised methods based on consistent regularization have been proposed to facilitate learning from unlabeled data using teacher-student models or generative adversarial networks. For example, Jiang et al proposed a sample expansion interpolation method based on consistency regularization to enhance the generalization ability of remote sensing change detection models by augmenting the influence of unlabeled data [14]. Although these methods solve the data scarcity problem in change detection to some extent and improve the detection accuracy, the problems of blurred change edges and missed detection of very small targets are still one of the main challenges in current research.
To address these issues, Yang et al, constructed a multi-scale concatenated graph attention network and demonstrated the potential of using different feature scales for change detection in a semi-supervised environment [15]. Lv et al, on the other hand, constructed a multi-scale attention network with feature bootstrapping and demonstrated the potential of using different feature scales for land-cover change detection in remote sensing images [16].
Due to the varying size of change regions, blurred edges, and the scarcity of labeled data in remote sensing images, existing methods struggle to effectively address these challenges simultaneously. This paper aims to improve change detection accuracy by combining semi-supervised methods with multi-scale feature fusion, alleviating the issues of blurred change edges and small target misdetection in situations with limited labeled data. Therefore, this paper proposes a semi-supervised remote sensing image change detection network based on consistent regularization for multi-scale feature fusion and reuse. The network mainly includes two parts: the supervised change module and the teacher-student consistency regularization module for semi-supervised learning. The main contributions of this paper are as follows.
(1) The semi-supervised image change detection network is addressed, which includes a supervised change detection module and a teacher-student consistency regularization module for semi-supervised learning. In the supervised part, the effective fusion and reuse of multi-scale features enhance the recognition ability of change areas, especially in the detection of small targets and edge details. Meanwhile, in the semi-supervised part, consistency regularization is used to strengthen feature learning on unlabeled data, mainly by reducing the prediction differences between different perturbed versions of the same unlabeled sample to enhance the robustness of the model.
(2) In the supervised phase change detection module, a brand-new multi-scale feature fusion global context module (GCM) and feature fusion and reuse module (FFM) have been added to alleviate the problems of unclear change edge detection and the omission of very small target detection. The GCM enhances the detection capability for very small targets by integrating features from different levels; and the FFM improves the localization accuracy of edge change areas and reduces the issue of unclear change edge detection by fusing, refining, and reusing features from different levels.
(3) Extensive experiments were conducted on some typical datasets, such as the large-scale earth observation image dataset for building change detection (LEVIR-CD), the Wuhan University, China, building change detection dataset (WHU-CD), and the Google earth imagery Guangzhou, China, change detection dataset (GoogleGZ-CD). We use three label ratios of 5%, 10%, and 20% to verify our model. The proposed model demonstrates significant performance improvements in both training and inference, highlighting the effectiveness and advantages of the method.
The rest content is structed as follows. First, we elaborate on the principle of semi-supervised image change detection and the detection network model, constructed in the Section 2. We not only introduce the multi-scale feature fusion and reuse network in the supervised phase, but also deeply discuss the teacher-student consistency regularization method used for semi-supervised learning. It enhances the model's detection performance and generalization ability under limited labeled data through consistency regularization. It also strengthens the recognition ability of changed areas, especially for small targets and edge details, through effective fusion and reuse of multiscale features. In the Section 3, we verify the effectiveness of the principles and technical solutions, and conducted extensive experiments. The section includes performance evaluation on the three public datasets LEVIR-CD, WHU-CD, and GoogleGZ-CD, and compares several advanced semi-supervised change detection models. In addition, we also conducted detailed ablation experiments to analyze the role of each module. Finally, in last section, we summarize the research results and propose prospects for future researches.
2. Methodology
The semi-supervised remote sensing image change detection network based on consistent regularization for multi-scale feature fusion and multiplexing proposed in this paper consists of two main components, a change detection network with a supervised phase of multi-scale feature fusion and multiplexing, named MFM-CDNet, and a semi-supervised learning consistency regularization method based on the teacher-student model used to update the parameters. Its structure will be discussed in Section 2.1. The semi-supervised consistency regularization works by generating pseudo-labels for unlabeled data using the teacher model and incorporating consistency loss and regularity terms when training the student model to ensure that the model's predictions of the data and its perturbed versions remain consistent, thereby forcing the model to learn a more generalized representation of the features and iteratively updating the model parameters as performance improves. Initial parameters are first generated using supervised learning in labelled data using MFM-CDNet. Then, for unlabeled data, the teacher-student model is iteratively trained for semi-supervised learning. The main idea is to use the teacher model to generate pseudo-labels of the student model to guide the student model to learn the features of the unlabeled data, thus achieving semi-supervised learning. The quality of the pseudo-labels plays a key role in the performance of the final model, named SCMFM-CDNet. The overall architecture of proposed model is shown in Figure 1.
2.1. MFM-CDNet Structure
In order to analyze the proposed network, the MFM-CDNet is required to be introduced first. As shown in Figure 2, it consists of an encoder and a decoder parts. The former uses the VGG-16 network as the backbone, employing 5 VGG-16 with batch normalization (VGG16_BN) blocks, which correspond to the operations of VGG16_BN at layers 0-5, 5-12, 12-22, 22-32, and 32-42. Features are extracted at different stages to achieve feature fusion from coarse to fine. In the decoder part, the feature enhancement module (FEM), global context module (GCM), and feature fusion and reuse module (FFM) are used in combination.
(1) Feature Enhancement Module
This module primarily guides the attention by sequentially passing the feature maps through a channel attention module and a spatial attention module, enabling the model to accurately locate important areas in the image and significantly reduce computational complexity.
The channel attention module can highlight the most important feature channels in the image, enabling the model to obtain more refined and distinctive feature representations, and reducing the computational load on unimportant features. The channel attention mechanism mainly addresses the question of ‘what the network should focus on’. The spatial attention module allows the network to focus on key areas within the image, primarily addressing the question of ‘where the network should concentrate’.
(2) Global Context Module
The model is to integrate multi-scale contextual information of images to enhance the expressive power of features. In this way, the model can not only capture local details but also integrate features from different levels, which can improve the detection ability of extremely small targets.
It consists of four parts. The first part is a 2D convolutional unit, while the second to fourth parts each contain four 2D convolutional units. Each 2D convolutional unit is composed of a convolutional layer and a batch normalization layer, but they have different kernel sizes and dilation factors. The outputs of these four units are horizontally concatenated, and then placed together with the output of the feature map obtained di-rectly through the 2D convolution operation into the Rectified Linear Unit (ReLU) activation function, ultimately resulting in a feature-enhanced map that contains multi-scale contextual information. The detailed architecture of the GCM module is shown in Figure 3.
(3) Feature Fusion and Multiplexing Module
The module primarily fuses, refines, and reuses features. Its main function is to integrate and optimize feature information from different levels. Through a series of operations, it enhances the model's ability to recognize positive samples, improves the localization ac-curacy of edge change areas, and reduces the occurrence of missed detections. This mod-ule mainly correlates the features with the attention maps processed by the FFM, which primarily refines the decoding of features from three stages to enhance the accuracy of change information. The detailed operation involves bilinear upsampling of the input feature X1, multiplying the upsampled feature with another layer of features X2, bilinearly upsampling the input feature X2 and multiplying the upsampled feature with another layer of features X3, bilinearly upsampling the input feature X1 twice and multiplying the upsampled feature with another layer of features X3, horizontally concatenating the re-sults of the three operations, and then passing them through two 3x2D two-dimensional convolutional modules to produce the final decoded value of FFM. This results in an aggregated and refined feature map with higher spatial resolution and stronger feature ex-pression capabilities. The detailed architecture of the FFM is shown in Figure 4.
2.2. Teacher-Student Module
In the semi-supervised learning task, for unlabeled data, this paper employs the mean teacher method to learn features. The main idea is to switch between the roles of the student model and the teacher model. When using the backbone network as the teacher model, it primarily generates pseudo-labels for the student model. When using the back-bone network as the student model, it learns from the pseudo-labels generated by the teacher model. The parameters of the teacher module are obtained by taking a weighted average of the parameters from previously iterated training of the student model. The target labels for the unlabeled data come from the predictions of the teacher model, i.e., the pseudo-labels. Since the pseudo-labels generated by the teacher model can serve as prior information in later training, they guide the student model in learning the features of a large amount of unlabeled data, thereby achieving the effect of semi-supervised learning.
The parameters of the teacher model are updated through EMA of the parameters from the student model, with the policy as follows.
where, represents the parameters of the teacher model at the current step, represents the parameters of the teacher model at the previous step, θs represents the parameters of the student model, and α is a smoothing factor set to 0.9, which controls the smoothness of the changes in the teacher model's parameters.
2.3. Loss Function
Change detection tasks are considered a special type of binary classification problem. In this paper, a binary cross-entropy loss function is used in conjunction with the Sigmoid function and binary cross-entropy loss (BCELoss). The supervised loss function expressed by
where α(X) is a Sigmoid function that maps x to the interval (0, 1). In the semi-supervised part, the input is the result of supervised training, and the semi-supervised loss function is as follows.
where β represents the difference in coefficients between the two loss functions, and in this case, β is used with a value of 0.2, at which point the impact of this coefficient on model accuracy is minimal.
2.4. Training Process
The training process of the model is shown in Table 1.
The model first utilizes the MFM-CDNet in the supervised phase to conduct supervised learning on labeled data to generate initial parameters. For unlabeled data, the parameters generated by the teacher model are used as pseudo-labels for training. The parameters of the student model are then averaged with those of the teacher model to obtain new teacher model parameters, with a weighting coefficient of 0.9 for the student model parameters and teacher model parameters. This process is iterated repeatedly to obtain the final model parameters.
3. Experiments
To validate the effectiveness of the proposed method, we must run on three public datasets, LEVIR-CD, WHU-CD, and GoogleGZ-CD through extensive experiments, which mainly include dataset introduction, experimental setup, comparison methods, experimental results and analysis, and ablation experiments.
3.1. Dataset Introduction
The LEVIR-CD dataset is provided by Beihang University, China, and is a building change detection dataset with largescale and very high resolution. It consists of 637 pairs of high-resolution image blocks, with a spatial resolution of 0.5 meters and an image size of 1024×1024 pixels. The dataset focuses on building-related changes, including various types of structures such as villas, high-rise apartments, small garages, and large ware-houses.
The WHU-CD dataset is provided by Wuhan University, China, and is a high-resolution re-mote sensing image dataset for building change detection. The dataset includes a large image pair sized at 32507×15345 pixels with a spatial resolution of 0.2 meters. It reflects significant reconstruction activities in the area following an earthquake, with change in-formation primarily focused on buildings. The images are typically cropped into non-overlapping blocks of 256×256 pixels.
The GoogleGZ-CD dataset is provided by Wuhan University and is a largescale high-resolution multispectral satellite image dataset specifically for change detection tasks. The dataset contains 20 pairs of seasonal high-resolution images covering the sub-urban areas of Guangzhou, China, with an acquisition time span from 2006 to 2019. The image resolution is 0.55 meters, and the size varies from 1006×1168 pixels to 4936×5224 pixels. It covers various types of changes, including water bodies, roads, farmland, bare land, forests, buildings, and ships, with buildings being the main changes. The image pairs are cropped into non-overlapping blocks of 256×256 pixels.
The detailed number of samples in the training set, validation set, and test set of the three datasets is shown in Table 2.
3.2. Experimental Setup
The model is implemented on PyTorch, an open-source deep learning framework widely used for building and training neural networks. It is trained and tested on an NVIDIA RTX 4090 GPU. For optimization, we use the AdamW optimizer (Adaptive Moment Estimation with Weight Decay), which combines the benefits of Adam and weight decay to regularize the model and prevent overfitting. The optimizer minimizes the loss function with a weight decay coefficient of 0.0025 and a learning rate of 5e-4. Due to the limitations of GPU resources and through extensive experimental validation, this paper sets the batch size to 16 and the number of training epochs to 180 to ensure that the model can converge. In the semi-supervised experiment, the dataset is constructed through random sampling. Specifically, 5%, 10%, and 20% of the training data are randomly selected as labeled data, and the rest of the data is processed as unlabeled data.
Experimental comparison methods selected Currently advanced semi-supervised detection models include AdvNet, SemiCD, RCL, TCNet.
To clearly investigate the performance of proposed SCMFM-CDNet, this experiment uses three evaluation metrics: Precision (P), Recall (R), and F1 score. The formulas are shown as fol-lows.
In these metrics, TP stands for true positives, FP stands for false positives, and FN stands for false negatives.
3.3. Experimental Results and Analysis
For the proposed model, 5%, 10%, and 20% of the training data were randomly selected as labeled data, with the remaining data treated as unlabeled. Comparative experiments on the detection performance of different methods were conducted on the LEVIR-CD, WHU-CD, and GoogleGZ-CD datasets.
The quantitative accuracy results of different methods at different annotation ratios on the LEVIR-CD dataset are shown in Table 3.
The proposed network, SCMFM-CDNet has shown significant superiority on the LEVIR-CD dataset. Among the three label ratios, our network ranks first in recall and F1 score, indicating the network's superior comprehensive performance. Although the accuracy of proposed network is slightly lower than the UniMatch-DeepLabv3+ method, the recall rate R of the proposed network under the three label ratios is much higher than that of UniMatch-DeepLabv3+ and other methods. This means that the proportion of actual change areas that the network in this paper can detect is far higher than other methods, demonstrating the good performance of the network proposed in this paper. In general, ours have shown significant superiority in improving the accuracy and efficiency of change detection through its innovative semi-supervised strategy.
The quantitative accuracy results of different methods at different annotation ratios on the WHU-CD dataset are shown in Table 4.
The quantitative accuracy results of various methods on the WHU-CD dataset indi-cate that the SCMFM-CDNet network proposed in this paper ranks first in recall and F1 score at label ratios of 5% and 10%. Additionally, at a 10% label ratio, the SCMFM-CDNet network's accuracy also ranks first, demonstrating the network's superior comprehensive performance. At a 20% label ratio, the SCMFM-CDNet network's recall rate is second, low-er than the UniMatch-DeepLabv3+ method, but still better than other methods. The main reason for this is that the WHU-CD dataset has relatively fewer positive samples (changed areas) and more negative samples (unchanged areas), with the changed areas being more distinct and less complex. The high performance of UniMatch-DeepLabv3+ in semantic segmentation allows it to detect changed areas with high accuracy. However, on the more complex LEVIR-CD and GoogleGZ-CD datasets, the performance of our method is signif-icantly higher than that of UniMatch-DeepLabv3+. Particularly on the complex Goog-leGZ-CD dataset, it can be seen that UniMatch-DeepLabv3+ is inferior to the SCMFM-CDNet network proposed in this paper in terms of generalization ability.
The quantitative accuracy results of different methods at different annotation ratios on the GoogleGZ-CD dataset are shown in Table 5. Compared to some other datasets, the GoogleGZ-CD dataset has a smaller scale. From a semi-supervised perspective, with only 5% labeled data, SCMFM-CDNet achieved an F1 score of 81.44%, which is higher than other semi-supervised change detection methods. This demonstrates its strong perfor-mance under conditions of limited labeled data, aligning with the original intention of semi-supervised learning to train using a small set of labeled data.
Figure 5 and Figure 6 respectively represent the qualitative evaluation results of different comparison methods on various datasets with labeling rates of 5% and 10%. To make the visualization more intui-tive, we use white to express the TP (true positives), black to represent the TN (true negatives), red to illustrate the FP (false positives), and light blue to depict the FN (false negatives). Black indicates unchanged areas, while white indicates changed areas. Red represents areas where the model incorrectly identifies unchanged areas as changed, i.e., false alarms. Light blue represents areas where the model fails to detect actual changes, i.e., missed detections. By observing the visualization, the following conclusions can be drawn: Our proposed model stands out in reducing the number of false negatives (light blue areas), with significantly smaller areas of light blue indicating that the model detects change areas more completely. Although there is a certain amount of false positives, the overall performance of the model is obviously higher. In general, SCMFM-CDNet has significantly improved the model's detection capabilities through the design of improved modules and semi-supervised learning strategies. To save space, the result on 20% labeling rate were neglected.
3.4. Ablation Experiments
The ablation experiments mainly validate the impact of modules and strategies such as the global context module, feature fusion and reuse module, teacher model, and exponential moving average update on the overall performance of the model. This paper selects 5% and 10% label ratios in the GoogleGZ-CD dataset for validation. The quantita-tive accuracy results of ablation experiments at different annotation ratios on the Goog-leGZ-CD dataset are shown in Table 6.
From the table, it can be observed that the performance improves significantly when both the Global Context Module (GCM) and the Feature Fusion and Reuse Module (FFM) are included. Additionally, the teacher model and Exponential Moving Average (EMA) update further enhance the performance, demonstrating their importance in improving the model's overall accuracy and robustness.
4. Conclusions
This paper addresses the high cost and difficulty of annotating dual-phase remote sensing images, as well as the unclear detection of change edges and the tendency to miss very small targets, by proposing a semi-supervised remote sensing image change detection network based on consistency regularization for multi-scale feature fusion and reuse. The network includes a supervised multi-scale feature fusion and reuse change detection network and a teacher-student consistency regularization model for semi-supervised learning. Specifically, the supervised change detection part introduces a global context module and a feature fusion and reuse module to enhance the detection capability for very small targets and edge change areas; meanwhile, a consistency regularization method is designed to utilize unlabeled data through alternating training of teacher-student models, thereby improving the model's generalization performance under limited labeled data. Extensive experimental validation on the three public datasets LEVIR-CD, WHU-CD, and GoogleGZ-CD shows that the proposed model, SCMFM-CDNet demonstrates significantly better performance than other semi-supervised change detection methods in both network training and inference, especially in maintaining high detection accuracy with limited labeled data. The main advantages of the model lie in improving the detection accuracy of complex scenes and minor changes, and enhancing the model's generalization capability. However, the method also has some shortcomings, such as high computational resource requirements and its performance dependence on high-quality pseudo-labels. Future work will focus on optimizing the feature extraction to reduce computational costs, researching more robust consistency regularization strategies to improve the quality of pseudo-labels, and exploring the possibilities of more application scenarios.
Author Contributions
Conceptualization, Y.J.Q and Z.Z.J.; methodology, Y.J.Q and Z.Z.J.; validation, S.H.Y., Y.M.S. and J.Z.; formal analysis, Z.Z.J.; investigation, Z.Z.J.; resources, Y.J.Q.; data curation, J.H.C. and Y.M.S.; writing—original draft preparation, Y.J.Q. and Z.Z.J.; writing—review and editing, H.X.Z. and X.L.; visualization, Z.Z.J.; supervision, H.X.Z. and X.L; project administration, Y.J.Q. All authors have read and agreed to the published version of the manuscript.
Funding
This work is supported by the Hebei Province Central Guiding Local Science and Technology Development Fund Project (Grant No. 236Z4901G) and the Science and Technology Innovation Program of Hebei, China (Grant No. SJMYF2022X18). Additionally, this research was also funded by a project from the North China Institute of Aerospace Engineering (Grant No. YKY-2023-39).
Institutional Review Board Statement
Not applicable
Informed Consent Statement
Not applicable
Acknowledgments
The authors would like to thank the Assistant Editor of this article and anonymous reviewers for their valuable suggestions and comments.
Conflicts of Interest
The authors declare no conflict of interest.
References
- Zou, J.; Liu, S.; Ouyang, L.; Ruan, J.; Tang, S. Carbon-Aware Demand Response for Residential Smart Buildings. Electronics 2024, 13, 4941. [Google Scholar] [CrossRef]
- Chen, W.; Wang, X.; Wu, M. Intelligent Parking Service System Design Based on Digital Twin for Old Residential Areas. Electronics 2024, 13, 4597. [Google Scholar] [CrossRef]
- Sarris, A.L.; Vryzas, N.; Vrysis, L.; Dimoulas, C. Investigation of Data Augmentation Techniques in Environmental Sound Recognition. Electronics 2024, 13, 4719. [Google Scholar] [CrossRef]
- Wu, X.; Chen, W.; Yang, K.; Zhao, X.; Wang, Y.; Chen, W. Research on Irrigation Grade Discrimination Method Based on Semantic Segmentation. Electronics 2024, 13, 4629. [Google Scholar] [CrossRef]
- Hu, K.; Li, H.; Fu, X.; Zhou, S. Customized Weighted Ensemble of Modified Transfer Learning Models for the Detection of Sugarcane Leaf Diseases. Electronics 2024, 13, 4715. [Google Scholar] [CrossRef]
- Liu, M.; Liu, J.; Hu, H. A novel deep learning network model for extracting lake water bodies from remote sensing images. Appl. Sci. 2024, 14, 1344. [Google Scholar] [CrossRef]
- Affandi, E.; Ng, T. F.; Pereira, J. J.; Ahmad, F.; Banks, V. J. Revalidation technique on landslide susceptibility modelling: an approach to local level disaster risk management in kuala lumpur, malaysia. Appl. Sci. 2023, 13, 768. [Google Scholar] [CrossRef]
- Zhai, C.; Wang, L.; Yuan, J. New fusion network with dual-branch encoder and triple-branch decoder for remote sensing image change detection. Appl. Sci. 2023, 13, 6167. [Google Scholar] [CrossRef]
- Yu, S.; Tao, C.; Zhang, G.; Xuan, Y.; Wang, X. Remote sensing image change detection based on deep learning: multi-level feature cross-fusion with 3D-convolutional neural networks. Appl. Sci. 2024, 14, 6269. [Google Scholar] [CrossRef]
- Fang, S.; Li, K.; Shao, J.; Li, H.; Zhou, Z.; Zhao, Z.; Yang, J.; Wang, C. SNUNet-CD: A densely connected Siamese network for change detection of VHR images. IEEE Geoscience and Remote Sensing Letters. 2022, 19, 1–5. [Google Scholar] [CrossRef]
- Jiang, Z.; Gao, X.; Shi, L.; Li, N.; Zou, L. Detection of ocean internal waves based on modified deep convolutional generative adversarial network and wavenet in moderate resolution imaging spectroradiometer images. Appl. Sci. 2023, 13, 11235. [Google Scholar] [CrossRef]
- Shuai, W.; Jiang, F.; Zheng, H.; Li, J. MSGATN: A superpixel-based multi-scale Siamese graph attention network for change detection in remote sensing images. Appl. Sci. 2022, 12, 5158. [Google Scholar] [CrossRef]
- Wang S, Zhu Y, Zheng N, Liu W, Zhang H, Zhao X, Liu Y. Change Detection Based on Existing Vector Polygons and Up-to-Date Images Using an Attention-Based Multi-Scale ConvTransformer Network. Remote Sens. 2024, 16, 1736.
- Jiang, Z.; Chen, H.; Tang, Y. Sample Inflation Interpolation for Consistency Regularization in Remote Sensing Change Detection. Mathematics 2024, 12, 3577. [Google Scholar] [CrossRef]
- Yang M, Zhou Y, Feng Y, Huo S. Edge-Guided Hierarchical Network for Building Change Detection in Remote Sensing Images. Appl. Sci. 2024, 14, 5415.
- Lv, Z.; Zhong, P.; Wang, W.; You, Z.; Falco, N. Multiscale Attention Network Guided with Change Gradient Image for Land Cover Change Detection Using Remote Sensing Images. IEEE Geosci. Remote Sens. Lett. 2023, 20, 1–5. [Google Scholar] [CrossRef]
- Hung, W. C.; Tsai, Y. H.; Liou, Y. T.; Lin, Y. Y.; Yang, M. H. Adversarial Learning for Semi-Supervised Semantic Segmentation. arXiv 2018, arXiv:1802.07934. [Google Scholar]
- Bandara, W. G. C.; Patel, V. M. Revisiting Consistency Regularization for Semi-Supervised Change Detection in Remote Sensing Images. arXiv 2022, arXiv:2204.08454. [Google Scholar]
- Wang, J.; Li, T.; Chen, S.; Tang, J.; Luo, B.; Wilson, R. C. Reliable contrastive learning for semi-supervised change detection in remote sensing images. IEEE Transactions on Geoscience and Remote Sensing. 2022, 60, 1–13. [Google Scholar] [CrossRef]
- Shu, Q.; Pan, J.; Zhang, Z.; Wang, M. MTCNet: Multitask consistency network with single temporal supervision for semi-supervised building change detection. Int. J. Appl. Earth Obs. Geoinformation. 2022, 115, 103110. [Google Scholar] [CrossRef]
- Yang, L.; Qi, L.; Feng, L.; Zhang, W.; Shi, Y. Revisiting Weak-to-Strong Consistency in Semi-Supervised Semantic Segmentation. In Proceedings of the IEEE/CVF Conference on Computer Vision and Pattern Recognition, 18–22 June 2023; pp. 7236–7246. [Google Scholar]
Figure 1.
Overall architecture of proposed model, SCMFM-CDNet modified on the basis of the MFM-CDnet, using semi-supervised method.
Figure 1.
Overall architecture of proposed model, SCMFM-CDNet modified on the basis of the MFM-CDnet, using semi-supervised method.
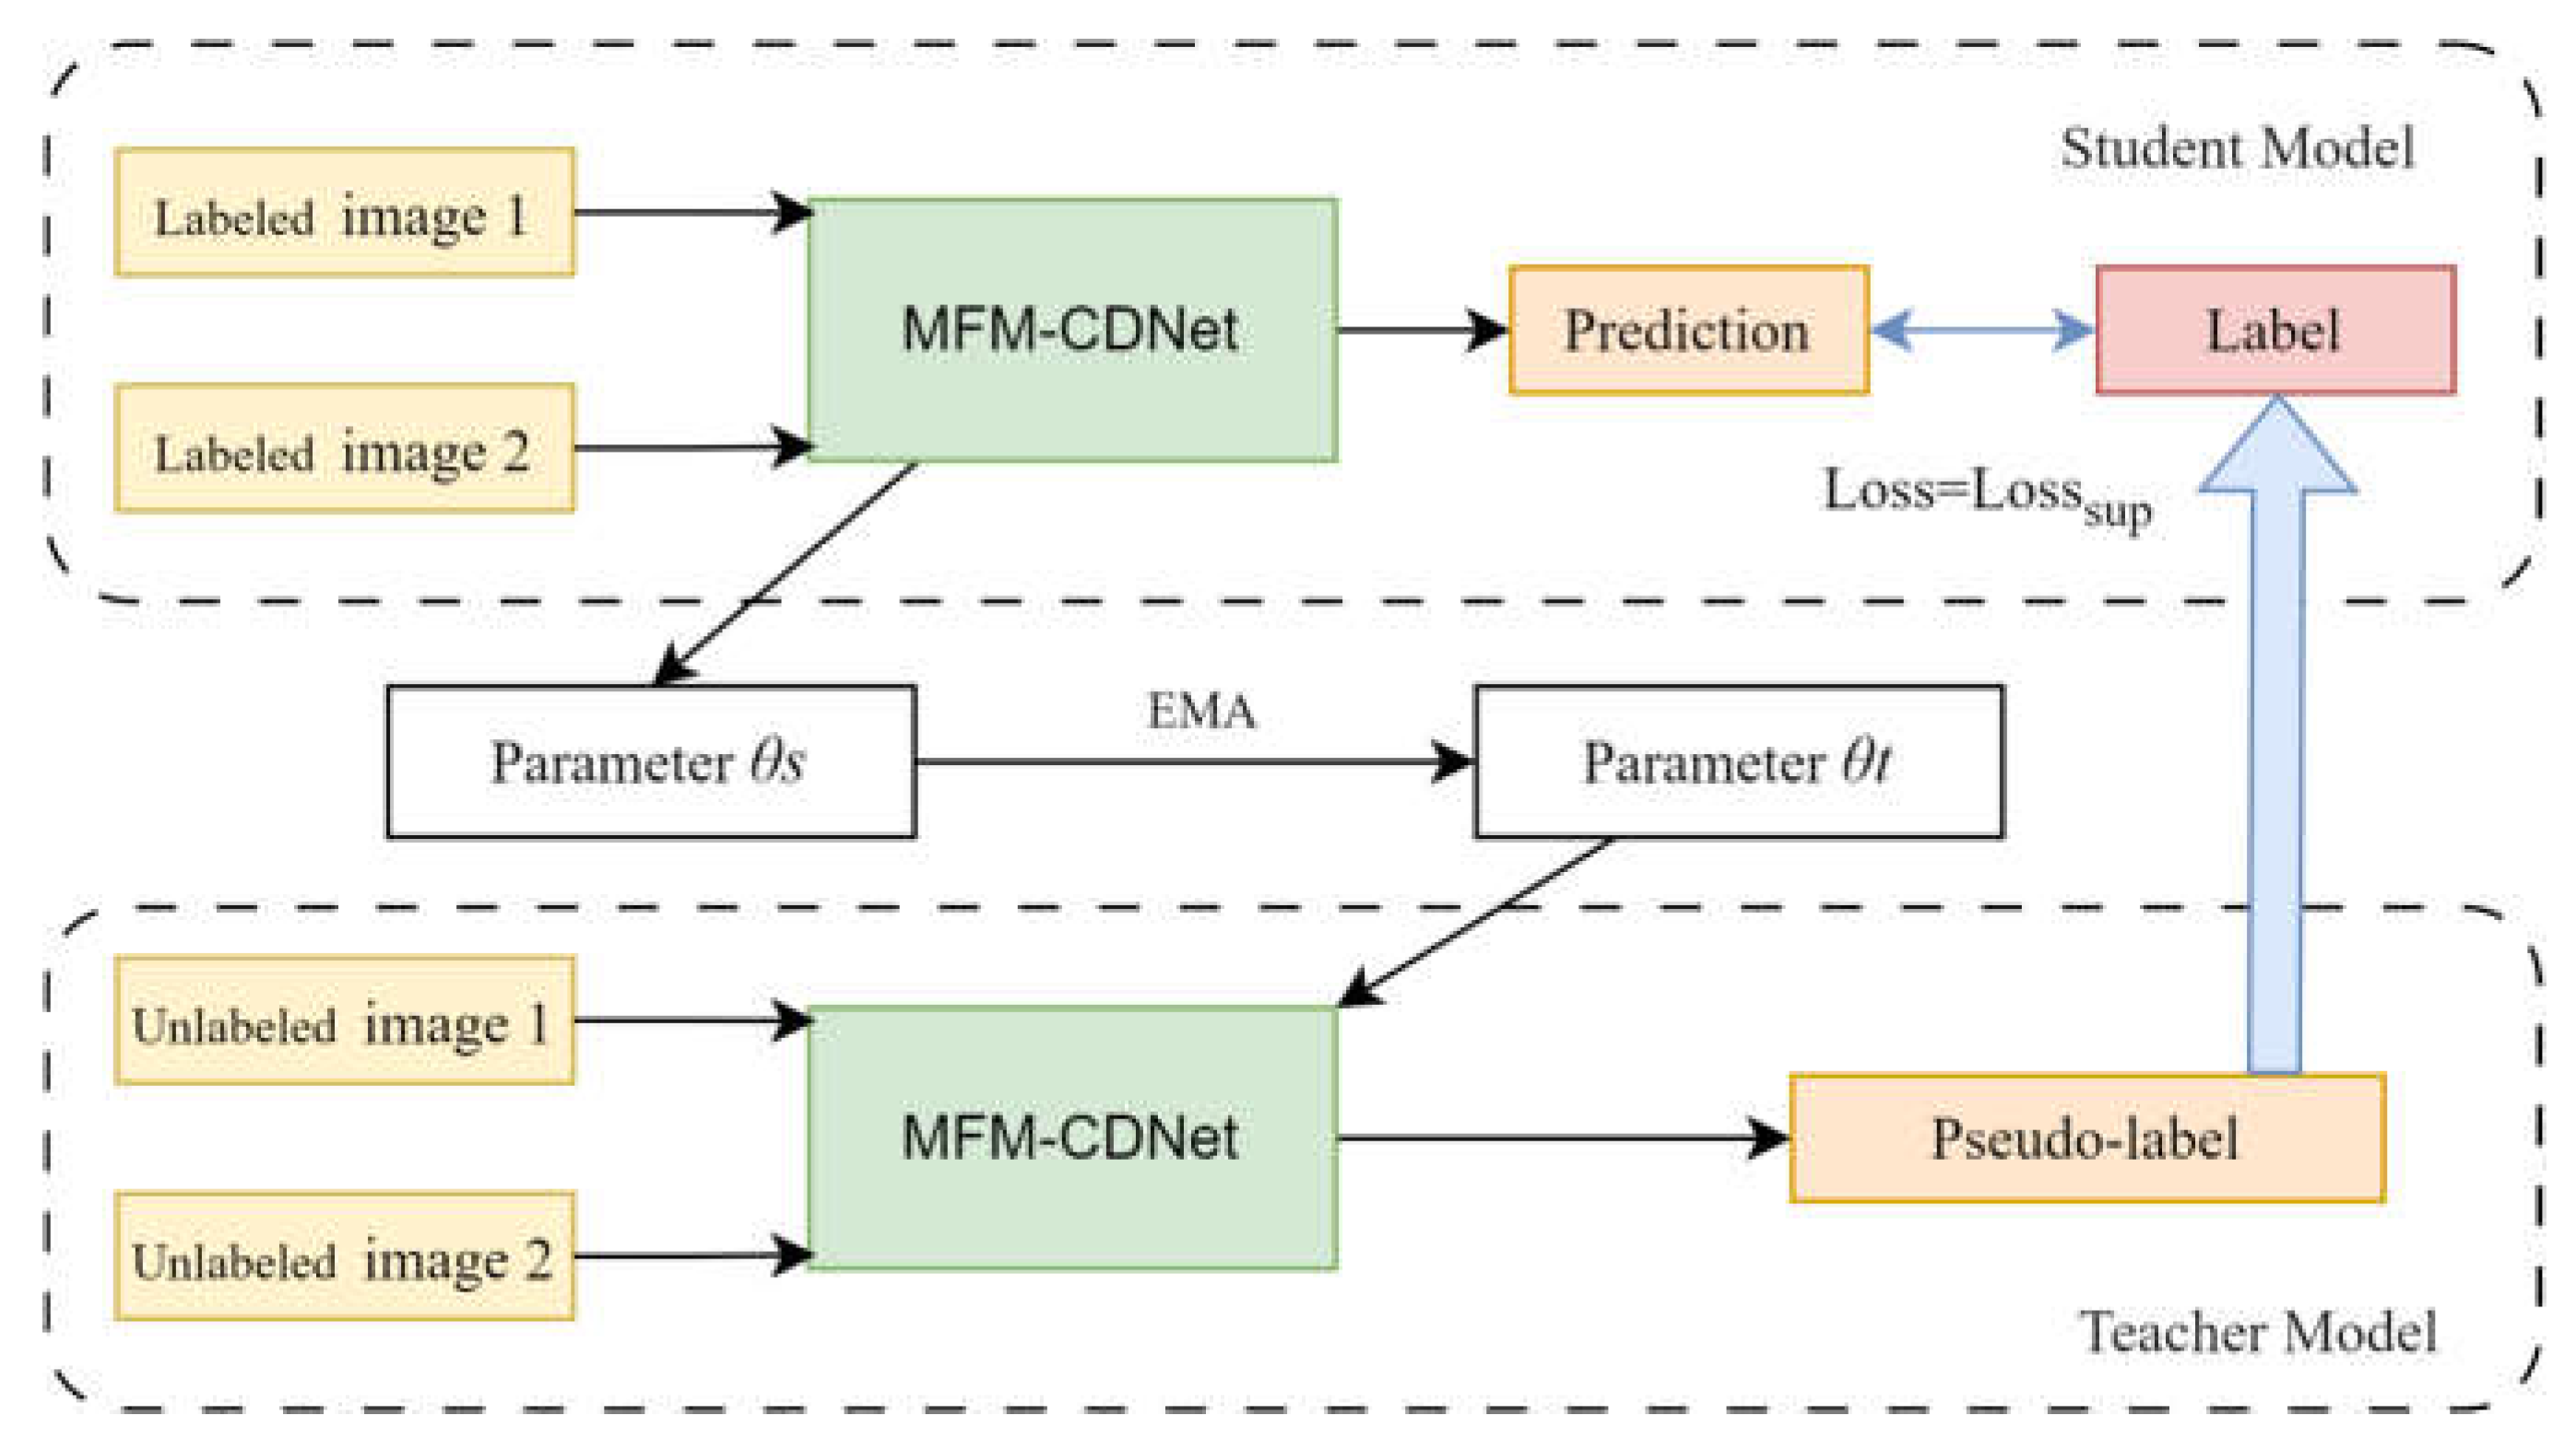
Figure 2.
Overall architecture of the MFM-CDNet model, Image1 and Image2 representing two photographs of the same area taken at different times.
Figure 2.
Overall architecture of the MFM-CDNet model, Image1 and Image2 representing two photographs of the same area taken at different times.
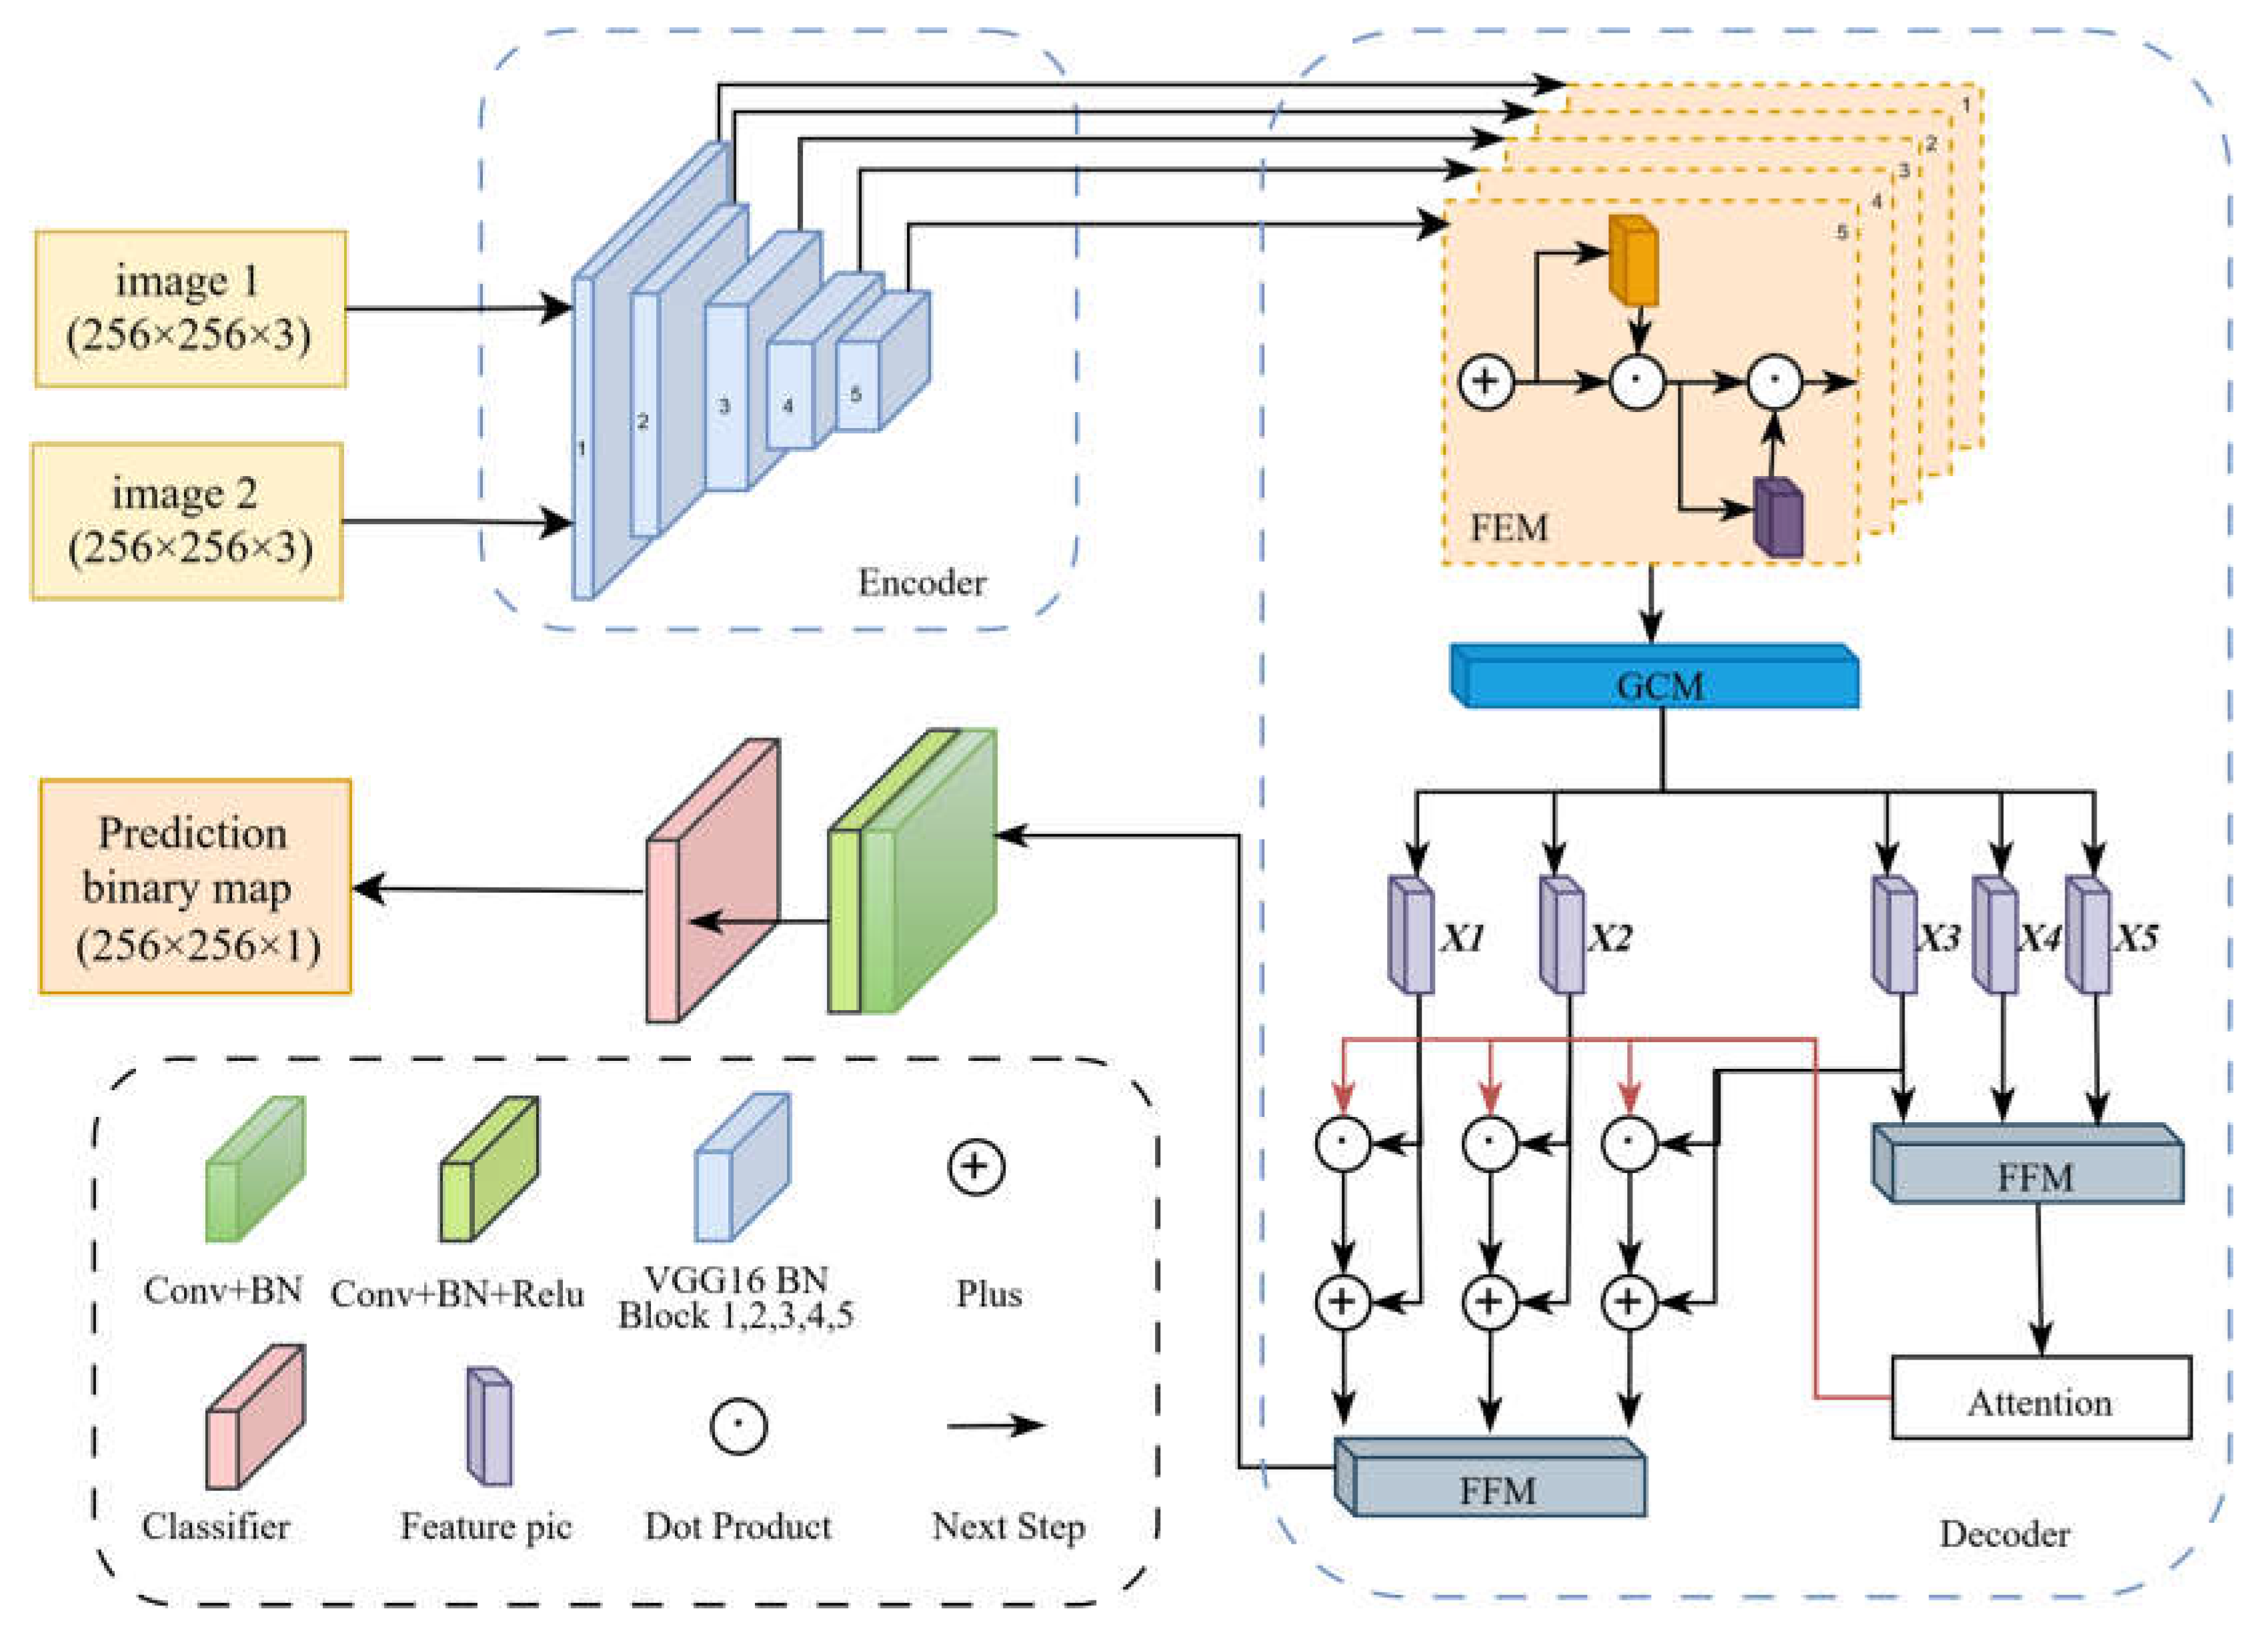
Figure 3.
Architecture of the GCM module, integrate multi-scale contextual information of images.
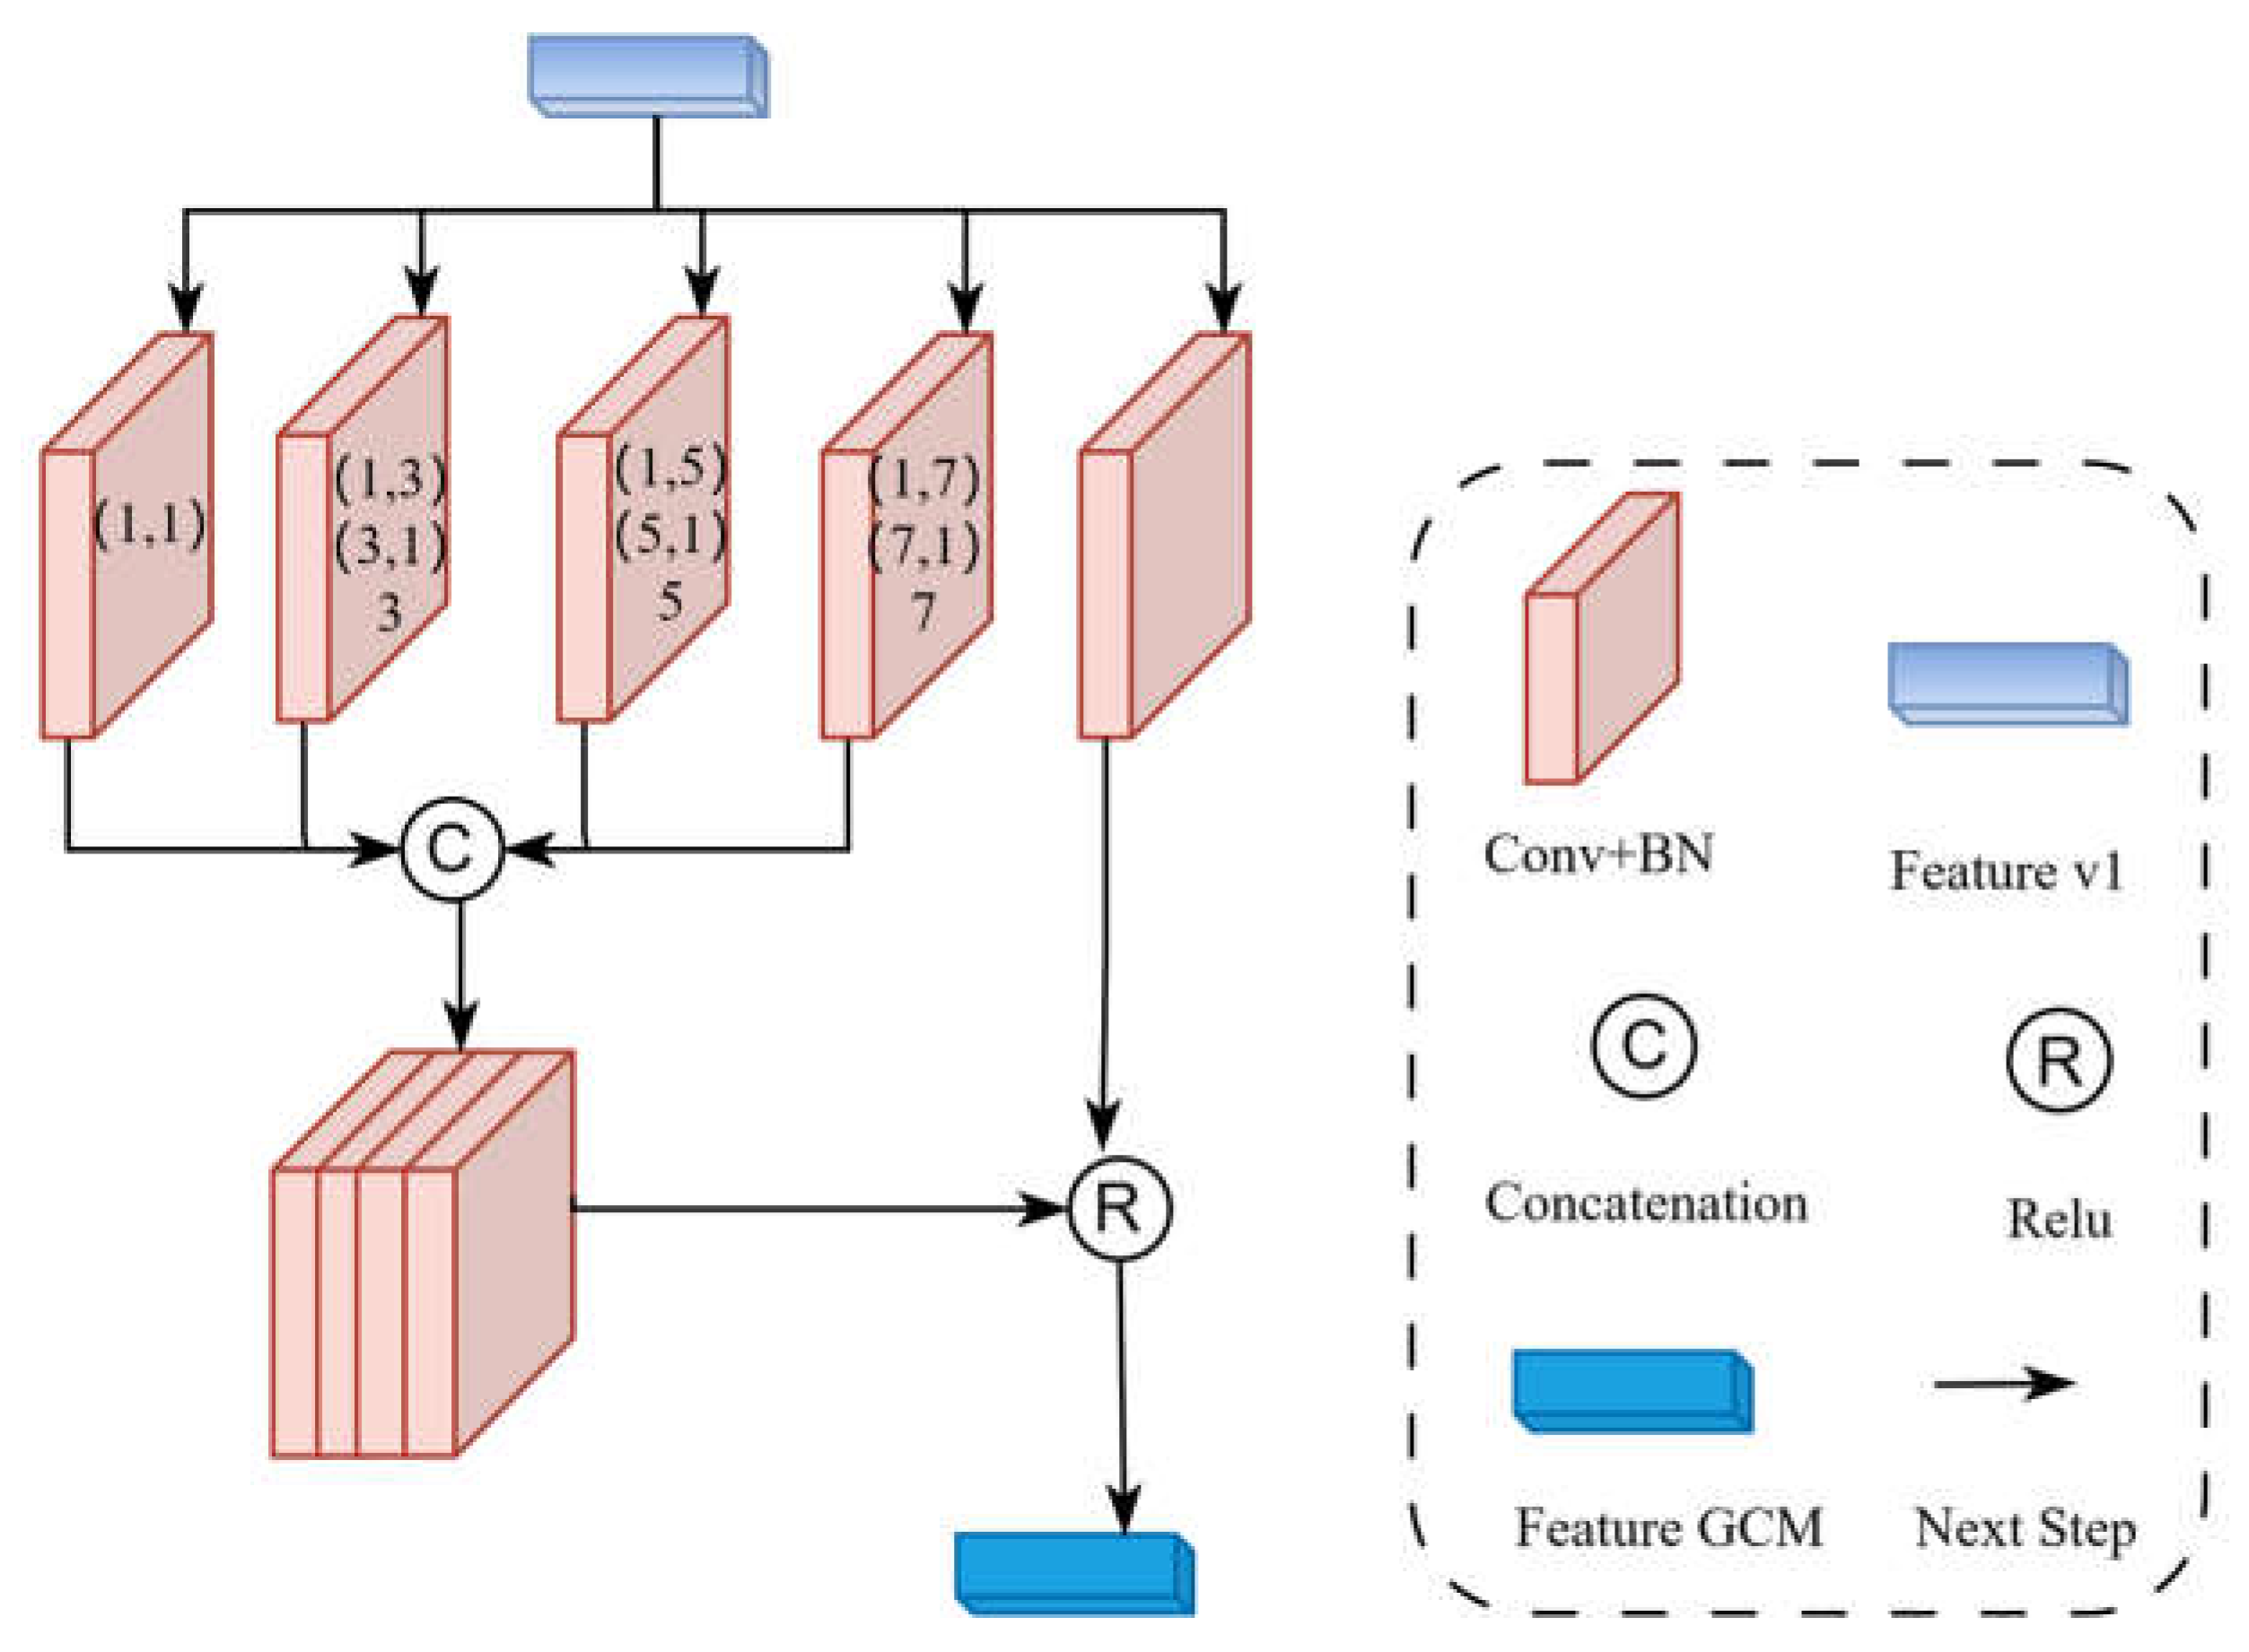
Figure 4.
Architecture of the FFM module, integrated and optimized feature information from different levels.
Figure 4.
Architecture of the FFM module, integrated and optimized feature information from different levels.
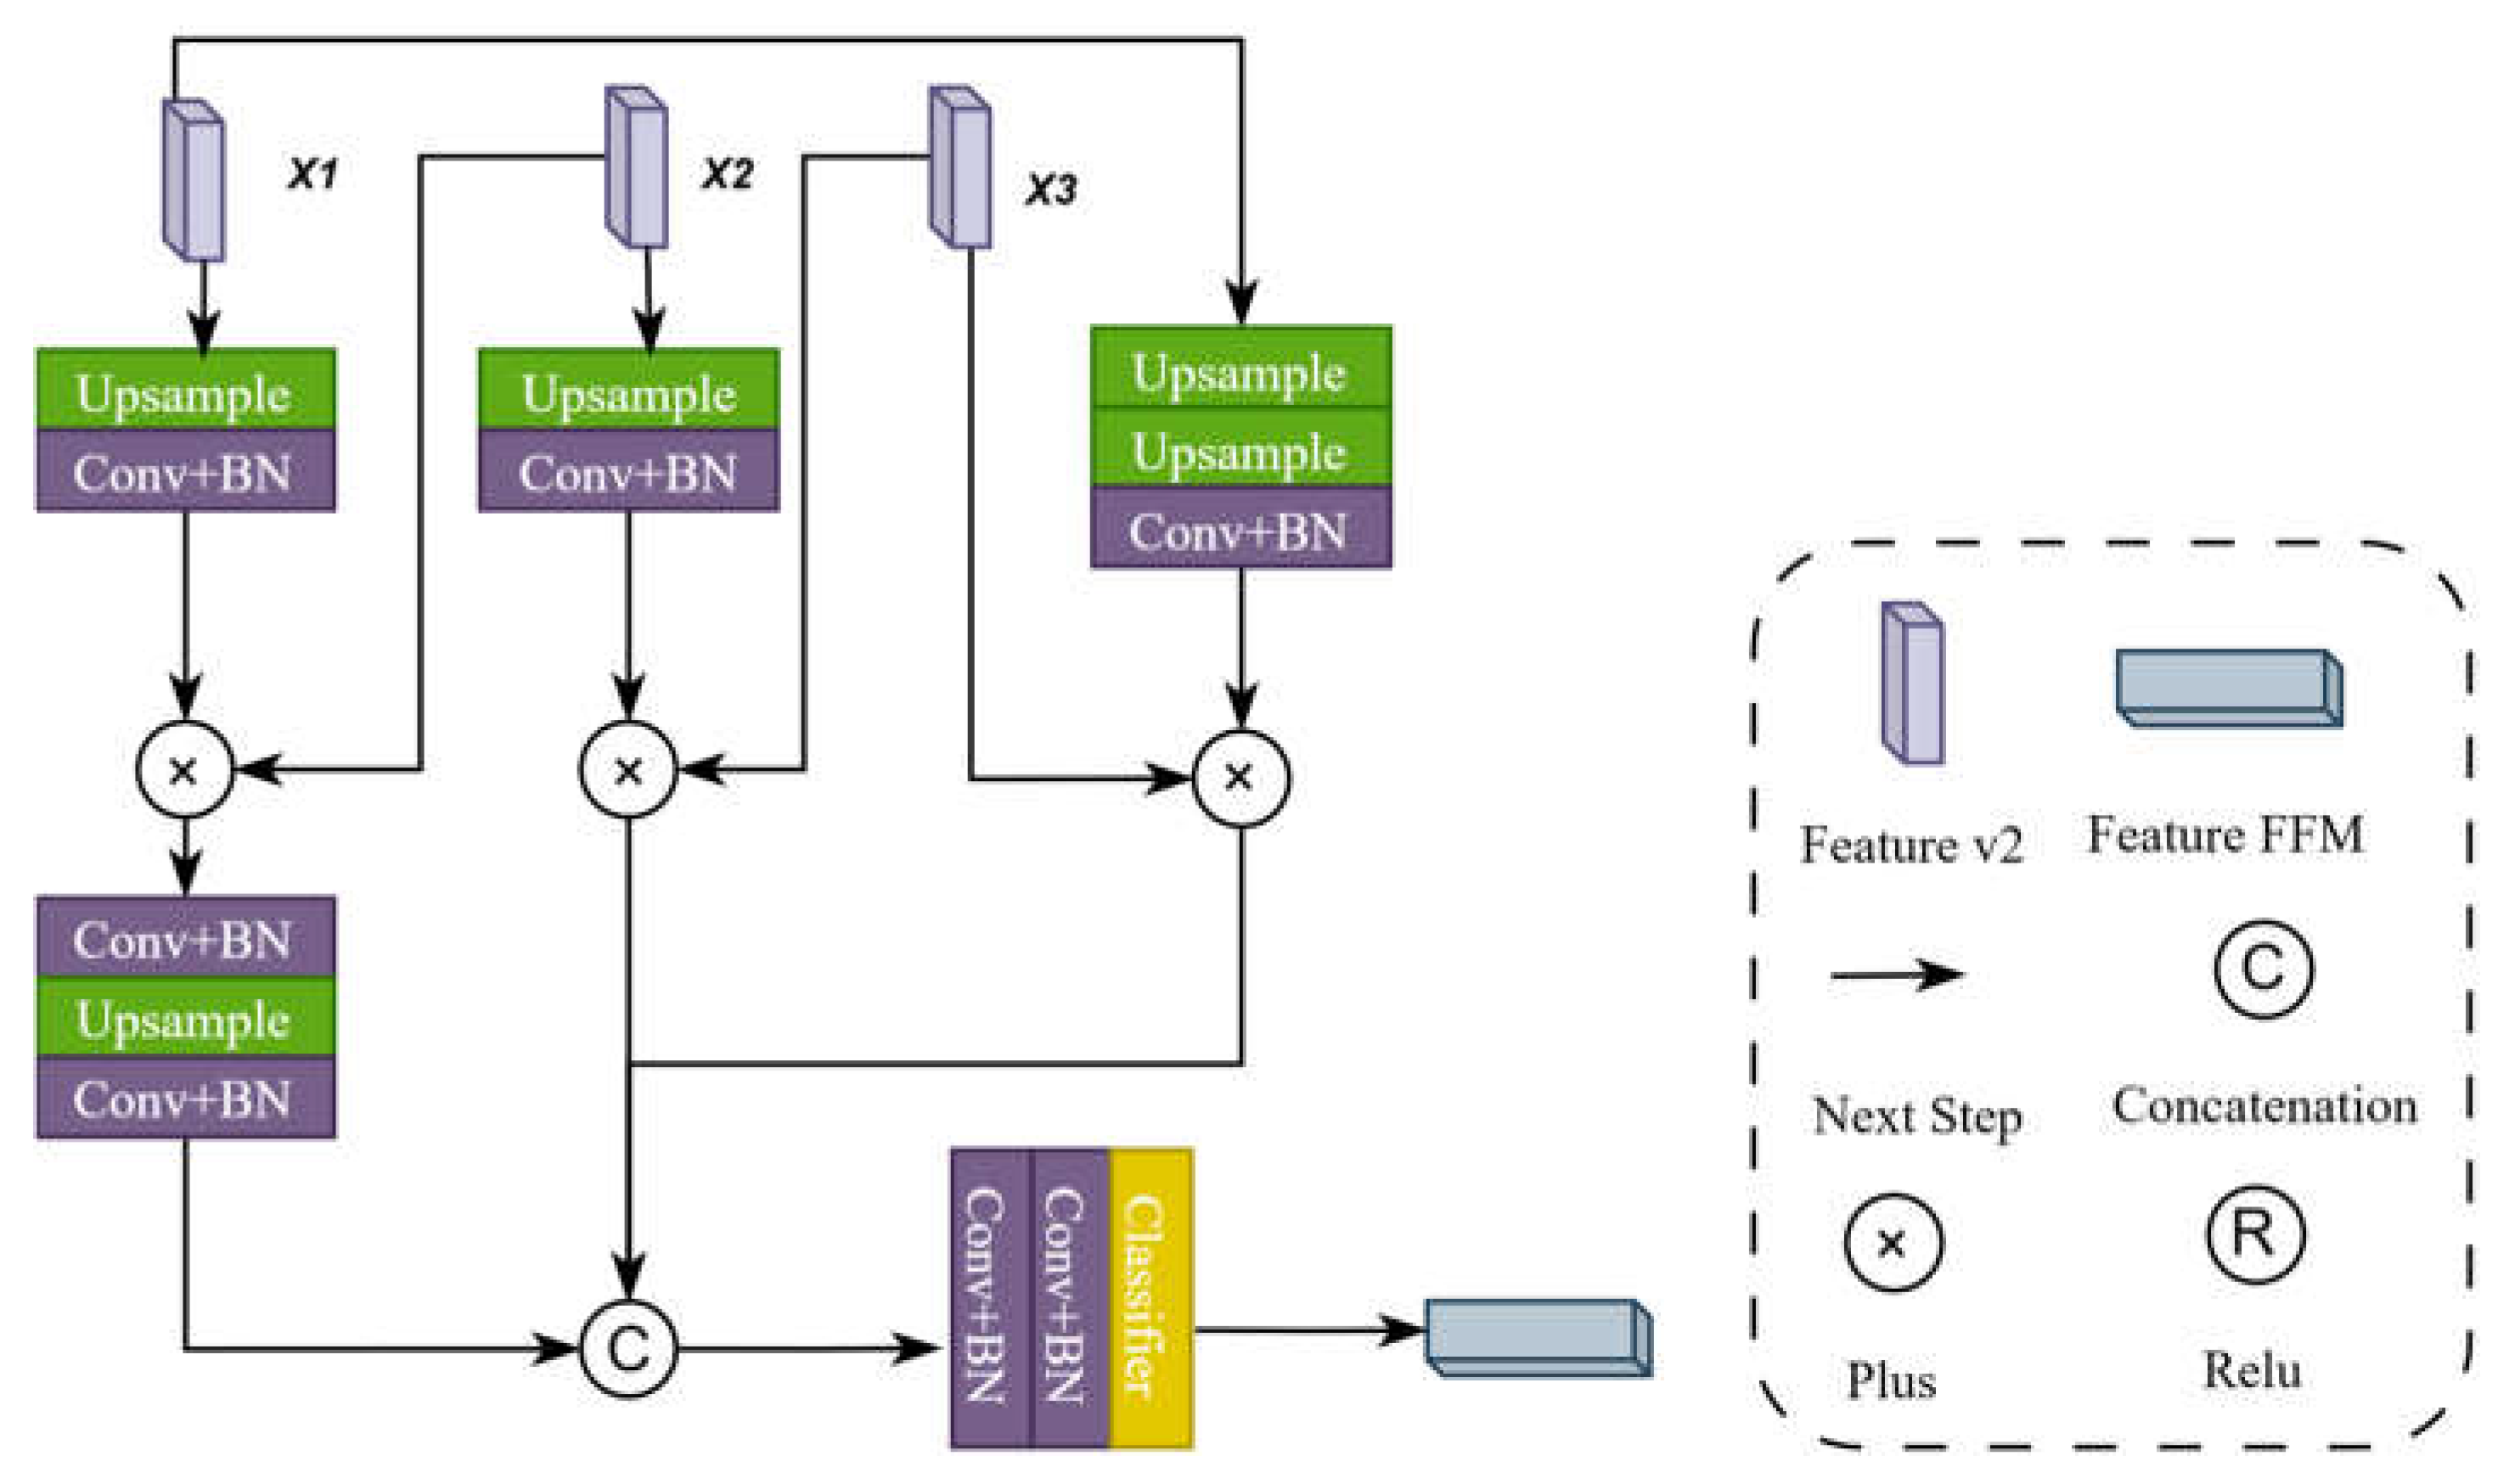
Figure 5.
Qualitative evaluation results at a labeling rate of 5%, performance is better for ourselves.
Figure 5.
Qualitative evaluation results at a labeling rate of 5%, performance is better for ourselves.
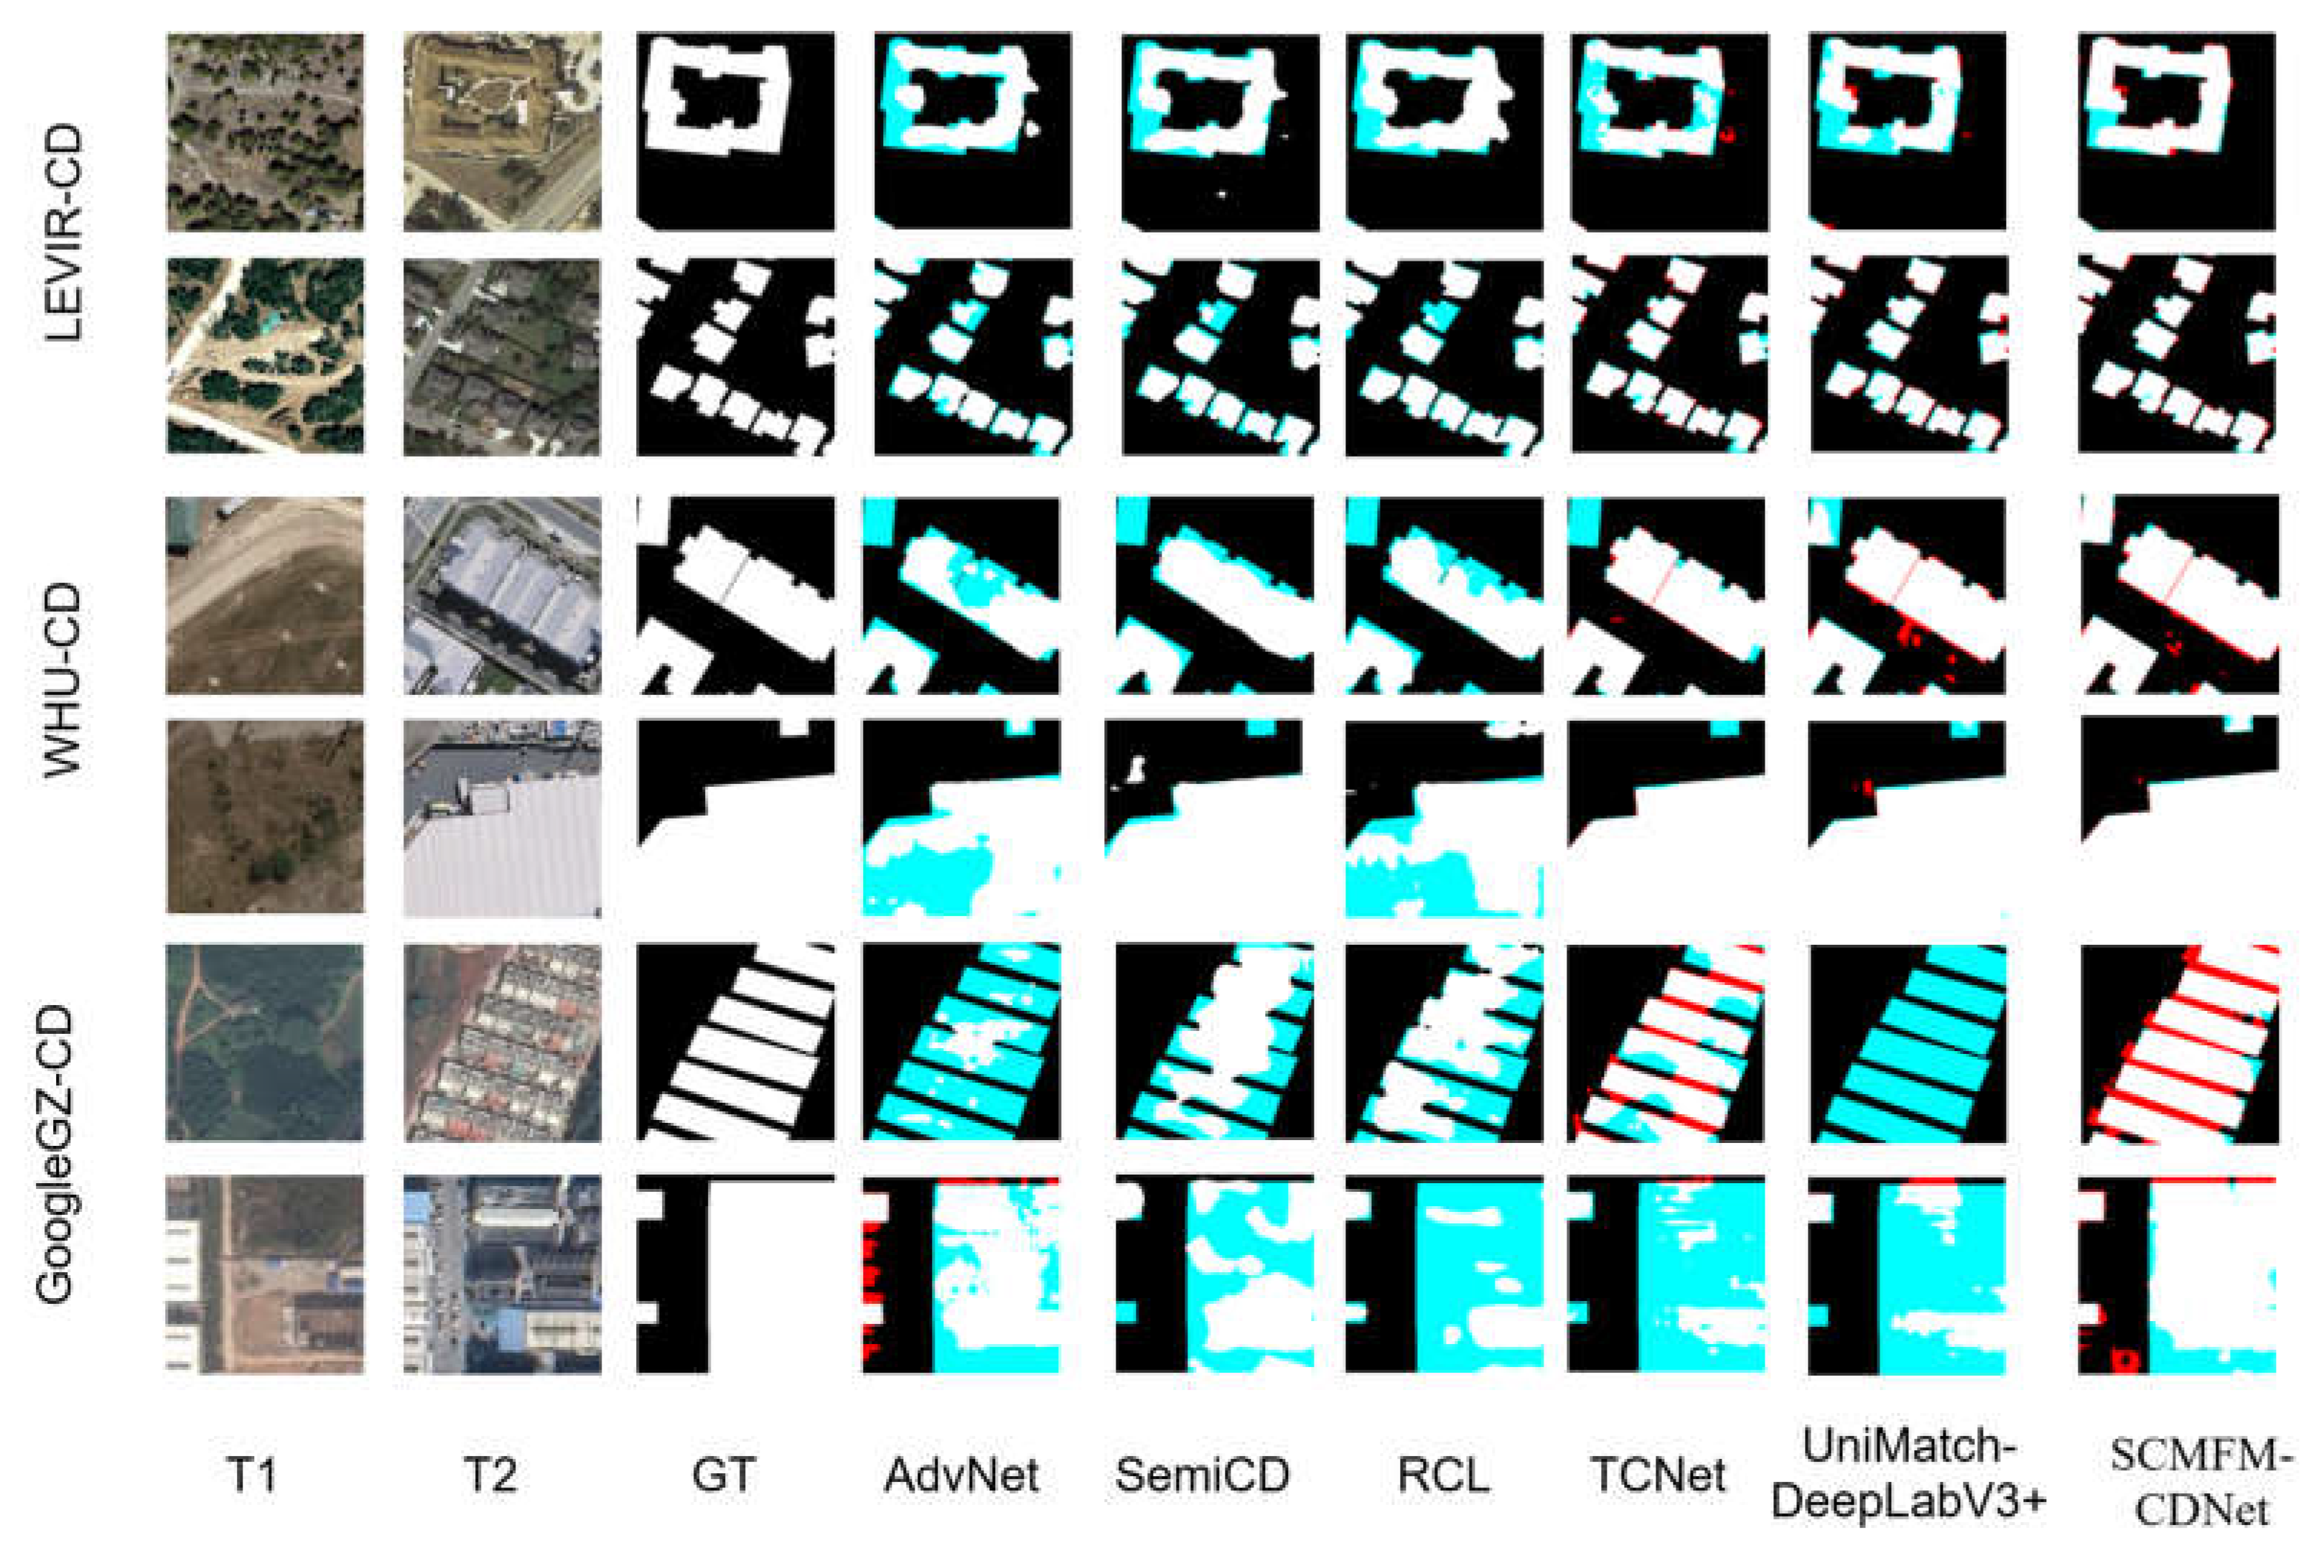
Figure 6.
Qualitative evaluation results at a labeling rate of 10%, performance is better for ourselves.
Figure 6.
Qualitative evaluation results at a labeling rate of 10%, performance is better for ourselves.
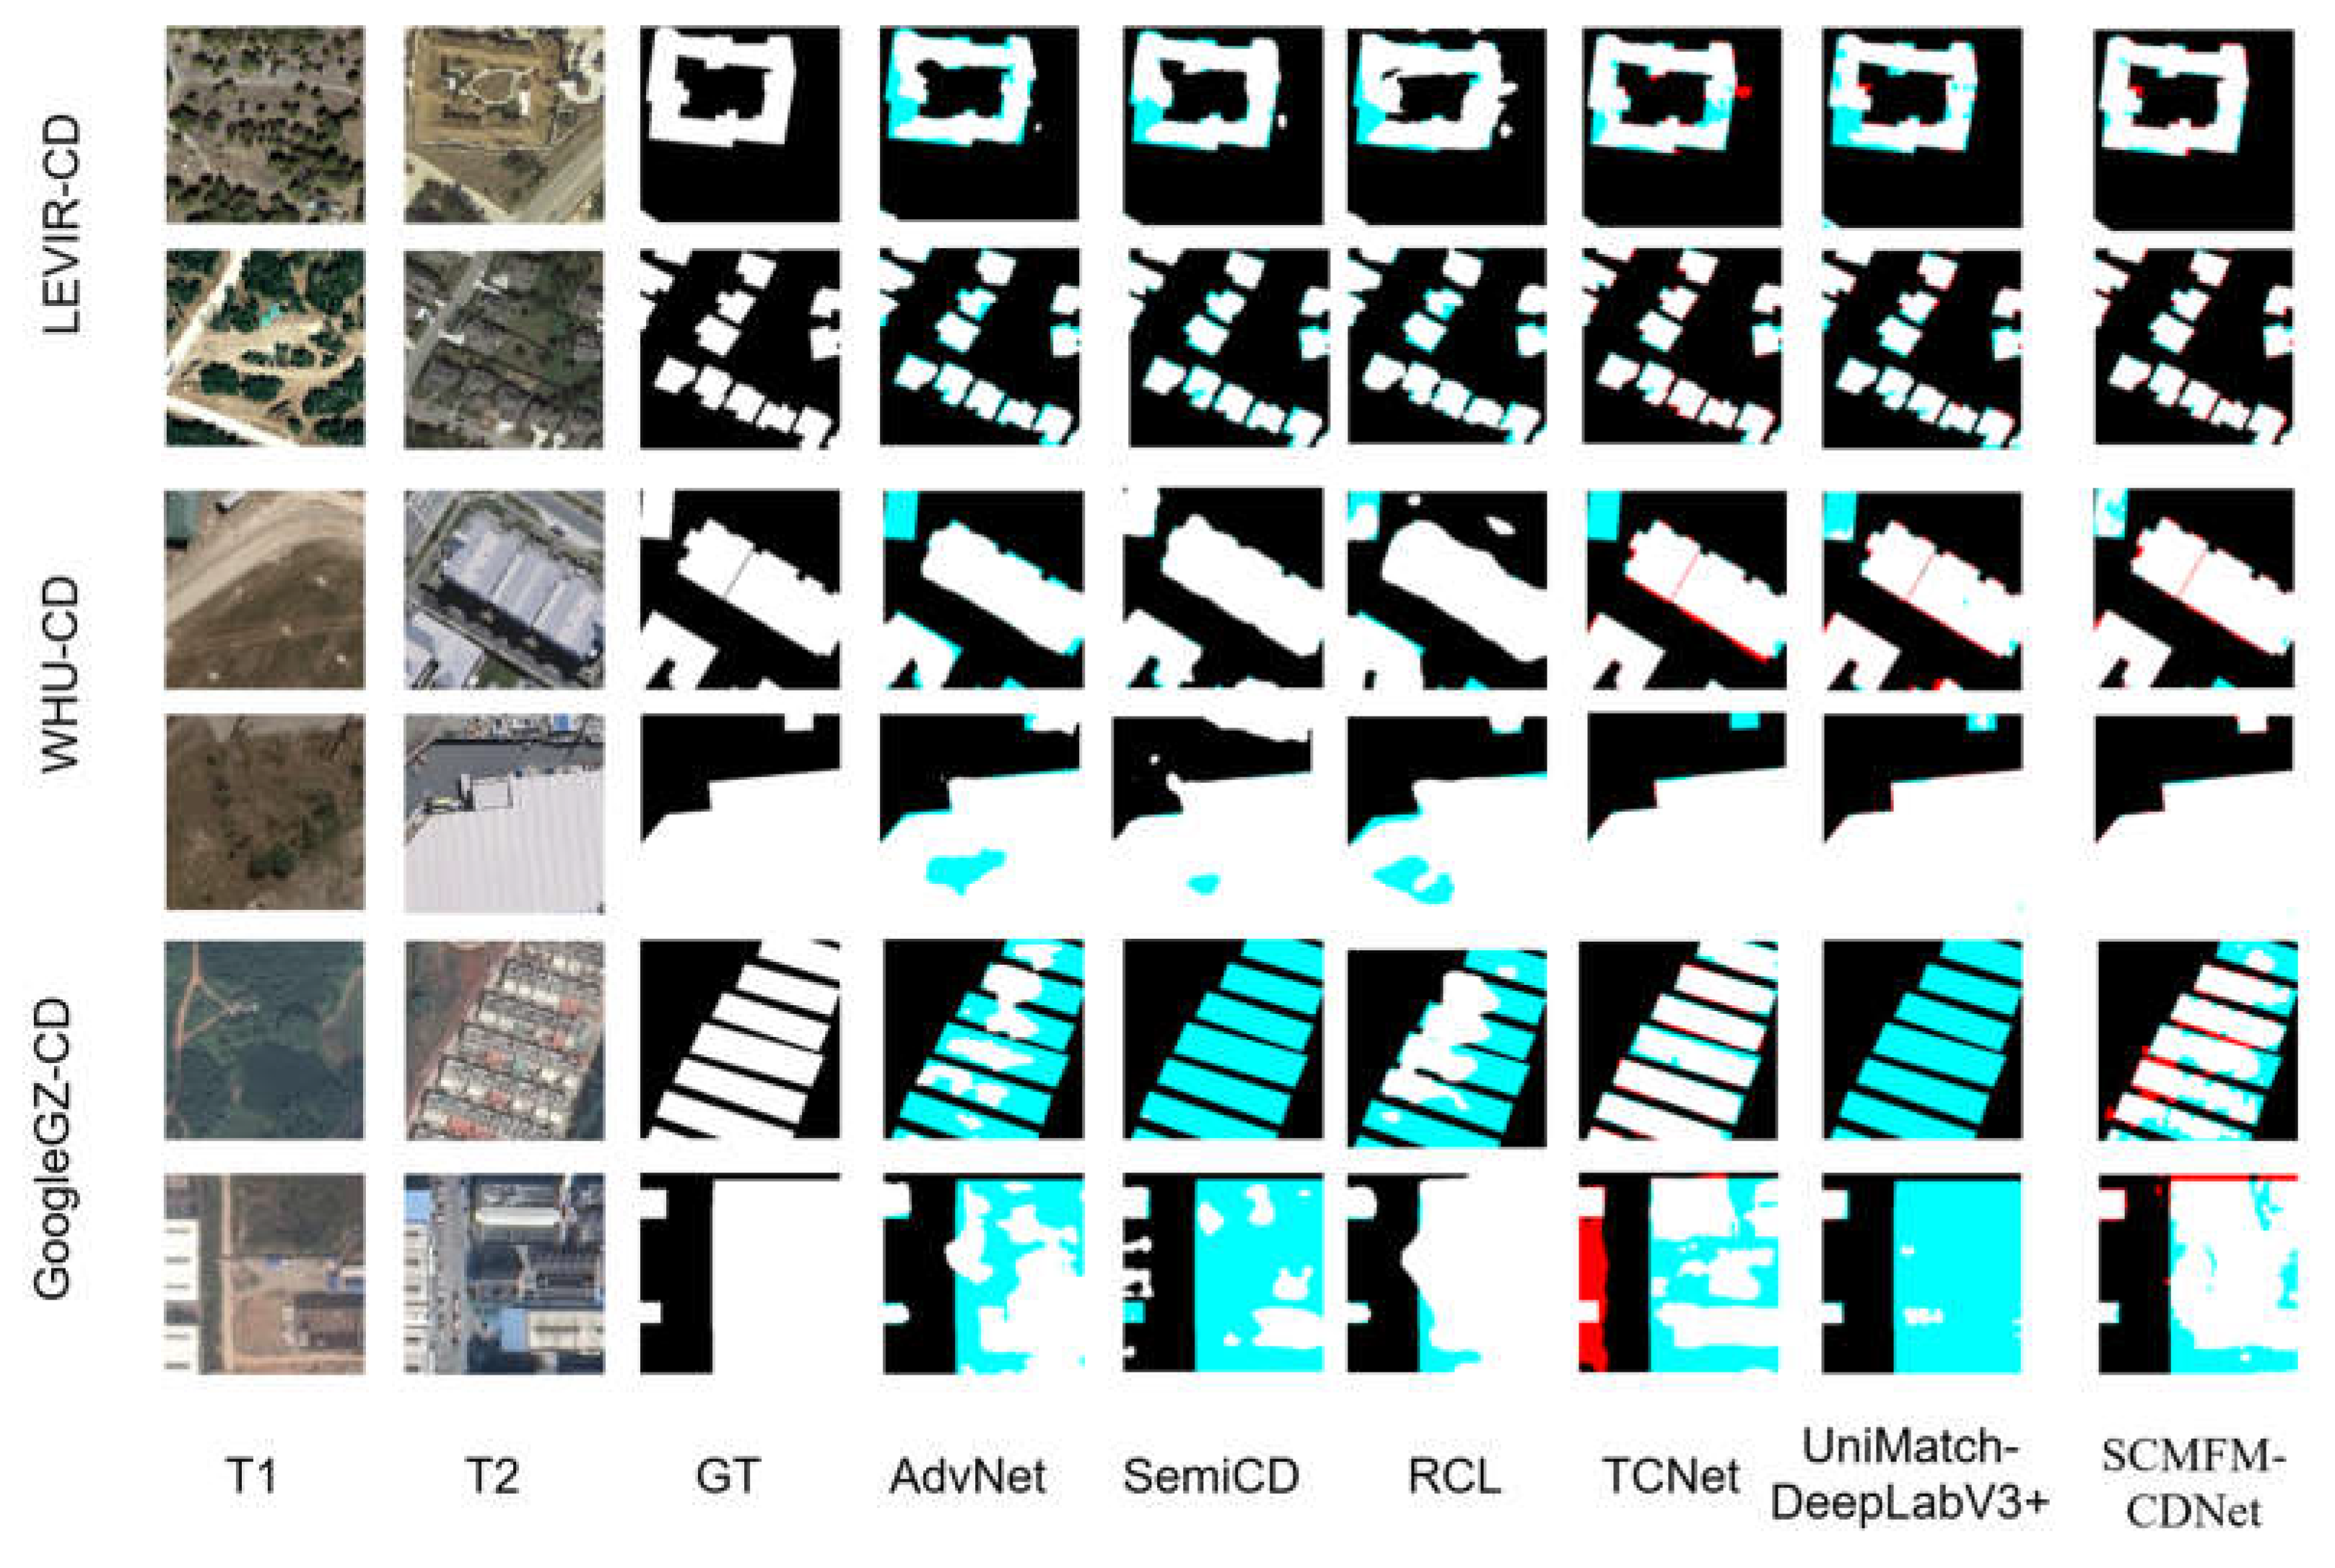

Table 1.
Pseudo Code for Model Training.
| Algorithm SCMFM-CDNet |
| Input: |
| Labelled image , Unlabelled image , |
| Hyperparameters :lr , B, T, α |
| Initialise: MFM-CDNet model parameters θ, teacher model parameters θt |
| Output: |
| Trained SCMFM-CDNet model with parameters θ |
| 1: procedure Semi-Supervised Training θ, α |
| 2: for each=1 to Tsup do |
| 3: Shuffle |
| 4: for batch B in do |
| 5: Forward pass:Compute predictions Pl using and θ |
| 6: Compute Losssup by (Eq.(2)-(3)) |
| 7: Backward pass: Update θ using Losssup and lr |
| 8: end for |
| 9: end for |
| 10: for each=Tsup to T do |
| 11: for batch B in do |
| 12: Forward pass:Compute predictions Pu using and θ |
| 13: Compute using Pu and θt |
| 14: Backward pass: Update θ using Losssup and lr |
| 15: end for |
| 16: Update θt by (Eq.(1)) |
| 17: end for |
| 18: end procedure |
| 19: return θ |
Table 2.
Detailed Information of Datasets.
| Datasets | Training Set Samples | Validation Set Samples | Test Set Samples |
|---|---|---|---|
| LEVIR-CD | 7120 pairs | 1024 pairs | 2048 pairs |
| WHU-CD | 6096 pairs | 1184 pairs | 1910 pairs |
| GoogleGZ-CD | 804 pairs | 330 pairs | 330 pairs |
Table 3.
Quantitative Accuracy Results of Different Annotation Ratios on the LEVIR-CD Dataset.
| References | Method | Labelled Ration | ||||||||
|---|---|---|---|---|---|---|---|---|---|---|
| 5% | 10% | 20% | ||||||||
| P | R | F1 | P | R | F1 | P | R | F1 | ||
| [17] | AdvNet | 89.19 | 74.99 | 81.48 | 90.98 | 80.41 | 85.37 | 91.34 | 82.37 | 86.62 |
| [18] | SemiCD | 56.34 | 39.86 | 46.68 | 91.85 | 82.19 | 86.75 | 91.30 | 84.07 | 87.53 |
| [19] | RCL | 82.26 | 77.87 | 80.01 | 85.79 | 81.86 | 83.78 | 86.60 | 85.87 | 85.14 |
| [20] | TCNet | 91.95 | 77.91 | 84.35 | 91.80 | 86.57 | 89.11 | 92.21 | 87.80 | 89.95 |
| [21] | UniMatch-DeepLabv3+ | 94.08 | 81.08 | 87.10 | 94.51 | 82.42 | 88.05 | 94.62 | 83.05 | 88.46 |
| This work | 90.51 | 86.87 | 88.62 | 91.98 | 89.62 | 90.78 | 92.09 | 89.22 | 90.63 | |
Table 4.
Quantitative Accuracy Results of Different Annotation Ratios on the WHU-CD Dataset.
| References | Method | Labelled Ration | ||||||||
|---|---|---|---|---|---|---|---|---|---|---|
| 5% | 10% | 20% | ||||||||
| P | R | F1 | P | R | F1 | P | R | F1 | ||
| [15] | AdvNet | 78.76 | 64.80 | 71.10 | 79.97 | 76.06 | 77.96 | 78.40 | 86.44 | 82.22 |
| [16] | SemiCD | 86.22 | 72.49 | 78.76 | 82.51 | 80.49 | 81.49 | 89.88 | 87.63 | 88.74 |
| [17] | RCL | 74.63 | 68.73 | 85.36 | 78.24 | 77.15 | 77.69 | 80.52 | 86.95 | 83.61 |
| [18] | TCNet | 87.05 | 83.73 | 85.36 | 90.33 | 82.03 | 85.98 | 94.56 | 83.91 | 88.92 |
| [19] | UniMatch-DeepLabv3+ | 92.56 | 84.51 | 88.35 | 89.29 | 87.88 | 88.58 | 86.27 | 92.47 | 89.26 |
| This work | 90.95 | 85.98 | 88.40 | 91.58 | 88.81 | 90.17 | 91.83 | 89.86 | 90.83 | |
Table 5.
Quantitative Accuracy Results of Different Annotation Ratios on the GoogleGZ-CD Dataset.
| References | Method | Labelled Ration | ||||||||
|---|---|---|---|---|---|---|---|---|---|---|
| 5% | 10% | 20% | ||||||||
| P | R | F1 | P | R | F1 | P | R | F1 | ||
| [15] | AdvNet | 67.64 | 52.86 | 59.34 | 76.87 | 61.18 | 68.14 | 85.54 | 59.09 | 69.90 |
| [16] | SemiCD | 70.33 | 52.99 | 60.44 | 75.45 | 62.09 | 68.12 | 88.25 | 60.45 | 71.75 |
| [17] | RCL | 74.90 | 68.27 | 71.43 | 76.78 | 78.25 | 77.51 | 78.82 | 80.07 | 79.44 |
| [18] | TCNet | 78.97 | 70.95 | 74.75 | 75.79 | 81.79 | 78.68 | 85.46 | 79.62 | 82.43 |
| [19] | UniMatch-DeepLabv3+ | 61.68 | 45.60 | 52.50 | 81.79 | 52.47 | 63.93 | 79.19 | 59.55 | 67.97 |
| This work | 81.86 | 81.02 | 81.44 | 81.02 | 83.75 | 82.36 | 82.64 | 88.36 | 85.40 | |
Table 6.
Quantitative Accuracy Results of Ablation Experiments at Different Annotation Ratios in the GoogleGZ-CD Dataset.
Table 6.
Quantitative Accuracy Results of Ablation Experiments at Different Annotation Ratios in the GoogleGZ-CD Dataset.
| Method | Labelled Ration | |||||
|---|---|---|---|---|---|---|
| 5% | 10% | |||||
| P | R | F1 | P | R | F1 | |
| w/o GCM | 70.28 | 75.31 | 72.71 | 74.22 | 76.04 | 75.12 |
| w/o FFM | 80.35 | 80.03 | 80.19 | 79.45 | 81.35 | 80.39 |
| w/o teacher model | 72.41 | 70.91 | 71.70 | 72.85 | 76.21 | 74.44 |
| w/o EMA | 78.06 | 79.07 | 78.52 | 79.91 | 77.26 | 78.54 |
| This Work | 81.86 | 81.02 | 81.44 | 81.02 | 83.75 | 82.36 |
Disclaimer/Publisher’s Note: The statements, opinions and data contained in all publications are solely those of the individual author(s) and contributor(s) and not of MDPI and/or the editor(s). MDPI and/or the editor(s) disclaim responsibility for any injury to people or property resulting from any ideas, methods, instructions or products referred to in the content. |
© 2025 by the authors. Licensee MDPI, Basel, Switzerland. This article is an open access article distributed under the terms and conditions of the Creative Commons Attribution (CC BY) license (http://creativecommons.org/licenses/by/4.0/).
Copyright: This open access article is published under a Creative Commons CC BY 4.0 license, which permit the free download, distribution, and reuse, provided that the author and preprint are cited in any reuse.


