
Submitted:
02 January 2025
Posted:
04 January 2025
You are already at the latest version
Abstract
A key objective of contemporary agriculture is to restore biodiversity, preserve ecosystem health, reduce the effects of climate change, and produce safe and healthy foods. Maintaining high soil fertility while reducing greenhouse gas emissions requires a precise assessment of how fertilization and crop rotation affect the carbon and nitrogen cycles in agroecosystems. In the context of a long-term fertilizer experiment on Luvic Chernozem, a monitoring of chemical and microbiological soil properties and CO2 emission was carried out. The fertilization treatments that have been continuously applied for 64 years under four-crop (wheat, barley, corn, and beans) rotation are N, P, K, NP, NK, PK, NPK, and 0. The highest organic carbon content was observed in the treatments NPK (1.42%) and NP (1.43%), and the lowest in the control (1.05%). The constant application of nitrogen as single fertilizer led to lower SOC values (1.22%). On average, CO2 emissions were the most intensive in NP (66.34 kg ha-1 day-1), NPK (67.82 kg ha-1 day-1) and PK (60.16 kg ha-1 day-1) treatments. The nitrogen fertilizer application most significantly alters soil properties including pH, EC, and SOC, which alters the environment for soil microbial development and influences the number and composition of soil microbial communities.
Keywords:
long-term fertilizer experiment
; fertilization
; soil organic carbon
; soil microbiota
; CO2 emissions
1. Introduction
The primary agricultural technique that significantly increases crop yields is mineral fertilization. The biological, chemical, and physical processes of the soil are also impacted by altering the nutrient regime and the environment for plant growth [1,2,3,4,5]. To obtain information on the types and amounts of fertilizers to increase agricultural yields and plant nutrition, numerous long-term fertilizer experiments were set up [6]. These studies offer a chance to look into how long-term application of mineral fertilizers and their combinations affect the soil characteristics. Mineral fertilization effects on soil quality must be investigated over an extended period of time to understand how it impacts soil parameters that are slowly shifting. Additionally, they allow to develop the theoretical framework for the sustainable crop yields and the preservation of a healthy soil environment [7].
The cycles of water, carbon and biogenic elements are the basis of life. Agriculture manipulates and interferes with parts of these cycles. The link between the carbon cycle and climate change is now well established. Land use is responsible for about a third of the increase in atmospheric carbon dioxide over the past 150 years, mainly due to the loss of soil organic matter [8]. The main goals of modern sustainable agriculture are mitigating climate change, avoiding long-term environmental damage and meeting the growing need for food [9]. Fertilization is the most effective management practice for ensuring global agricultural production since the discovery of the role of nutrients in crop growth and development. However, excessive or irrational mineral fertilization can lead to a decrease in soil fertility and an increase in nutrient loss [10]. This leads to many interrelated negative effects on the environment and human health, such as increased greenhouse gas emissions, pollution of surface and groundwater, and food [11]. Nitrogen is a key element for plant growth and yield formation and is a limiting factor in the productivity of ecosystems [12]. Nitrogen fertilization strongly affects biomass production, microbial activity, decomposition of accumulated biomass and hence the dynamics of soil organic matter [13]. The effect of nitrogen addition, through mineral fertilization, leads to higher yields, a higher amount of plant residues and a higher intensity of their decomposition, which leads to the release of CO2 [14]. Cumulative CO2 fluxes also increase with higher nitrogen rates [15] and with long-term application of combined NP and NPK [16]. Thus, the impact of fertilization practices on soil C and N cycling in agroecosystems needs to be accurately assessed to achieve the goals of maintaining high soil fertility and, in the meantime, mitigating greenhouse gas emissions [17].
In the current climate change context, another key goal of agriculture is optimizing fertilization management in terms of greenhouse gas emission reduction, improvement of soil carbon sequestration and to ensure food security, it is essential to understand how fertilizing strategies impact the dynamics of soil organic carbon (SOC) [16]. A growing number of researchers suggest that agricultural soils have significant potential to mitigate climate change by carbon sequestration [18,19,20,21]. Agricultural lands have the potential to sequester approximately 5500–6000 Mg CO2-eq. yr−1 to 2030 [22]. The accumulation of soil organic matter and the release of greenhouse gas emissions in arable land can be managed by various agricultural practices [23,24], including applied fertilization [15]. Long-term field experiments provide an opportunity to study the processes in the soil that occur during the application of mineral fertilizers in relation with the solution of these global problems.
Ecosystem functions are result of the interactions between plants, soil and microorganisms, and any change in soil properties influences the microbial structure, which in turn influence ecological processes [25]. Fertilization rates and crop rotations can affect soil pH, nutrients and organic matter through their effects on microbial processes [26]. Fertilization can indirectly affect soil microorganisms by changing soil properties or directly through applied nutrients [27]. Soil microbiota plays an essential role in the cycling of soil carbon, nitrogen, phosphorus and sulphur and is important component in maintaining soil quality and fertility [28,29]. Changes in soil microbial communities also affect the productivity and functioning of agroecosystems.
The 64-year fertilization experiment under four crop rotation in the Institute of Agriculture and Seed Science (IASS) “Obraztsov Chiflik” Rousse is one of the few long-term field experiment in Bulgaria which has been still maintained till now. On this experiment, we performed monitoring to determine the interaction between soil microbiota, mineral fertilization, and soil chemical properties.
2. Materials and Methods
2.1. Site Description
A long-term fertilization experiment was carried out in the experimental field of IASS Оbraztsov Chiflik, region Ruse, (43.807, 26.041). The area is located in the Danube plain (Figure 1) and bare the traits of a moderate continental climate.
The soil type is Luvic Chernozem (IUSS Working Group WRB, 2022) with low organic carbon content and moderately acidic soil reaction (pH in H2O 5,5– 6.0) in the 0-40 cm layer. The texture is classified as Silty Clay Loam (SiCL) with 30% clay content (Table 1).
2.2. Experiment Design
The experiment was established in its current format in 1958. It is located on area of 1 ha. The size of the trial plots is 100 m2, and the harvest plots - 60 m2. The applied methods of fertilization had been carried out the same places for 64 years on four agricultural crops - wheat (variety "Danube"), beans (variety "Obratzov chiflik 12"), barley (variety "Agate") and maize (hybrid “Ruse 464”) (Figure 2). In the rotation, wheat replaces beans, maize replaces wheat, beans - barley, barley- maize.
Seven treatments have been tested with individual (single) and combined application of the three macroelements N, P, K. Nitrogen rates for wheat and maize were N - 150 kg ha-1; for beans N - 50 kg ha-1 and for barley N - 100 kg ha-1. Phosphorus -120 kg ha-1 and potassium – 70 kg ha-1 were applied for all crops. For comparison, the unfertilized control N0P0K0 is maintained. Phosphorus and potassium fertilizers are applied once, before the main tillage, and nitrogen fertilizers - once after the sprouting of the crops, as an early spring feeding.
2.3. Chemical and Microbiological Analyses
Soil samples for chemical and microbiological analyses were taken once in two periods - May and October, in 2023, from all treatments and two replicates of the experiment, for all crops, at depth 0-20 cm.
The ammonium and nitrate nitrogen were determined according to Kjeldal and acetate-lactate method for the determination of available phosphorus and potassium forms was used. The microbial biomass carbon (Cmic) measurements were determined by the substrate-induced respiration method (SIR). Total organic carbon content (SOC,%) was determined by wet digestion by the modified Tjurin's method [dichromate digestion at 125º C, 45 min] [30]. The soil pH and electrical conductivity (EC) of the samples were measured in water suspension 1:2.5 by a combined pH-EC meter. Ammonium and nitrate nitrogen were determined according to the method of Kjeldal. The acetate-lactate method was used for determination of the plant-available forms of phosphorus and potassium by simultaneous extraction. The potassium was determined directly by a flame photometer. The phosphorus was determined by a spectrophotometer after a colour reaction (according to Murphy – Riley, 1962).
The substrate-induced respiration method (SIR) was used for measuring the microbial biomass (Cmic) according to the Anderson-Domsch method [31]. The number of microorganisms was determined by the plate counts technique on selective agar media. Ammonifying bacteria were cultivated on Nutrient broth agar, actinomycetes – on starch-ammonium agar medium, microscopic fungi – on Czapek’s agar medium, nitrifying bacteria on Winogradski medium, nitrogen fixing bacteria on Ashby medium [32].
Thre greenhouse gas emissions were measured during the crop growing seasons in the three year period 2021-2023. CO2 fluxes were measured on site using infrared gas analysers - the calibrated tester "ALMEMO" with a CO2 sensor. Plastic chambers were used to collect the emissions.
The air CO2 concentrations were measured at a height of 1 m above the plots. After placing the chambers, they were closed and an incubation period of 30 min was maintained, after which the accumulated CO2 in the closed chambers was measured. Then the leakage of the respective gas (kg ha - 1 day - 1) was calculated, according to [33]:
where: E (CO2) - CO2 release from the soil (kg ha-1 h); then it can be converted to a day. M-molar mass of CO2 (kg mol -1); P-air pressure (Pa); V-chamber volume (m3); C1 - initial concentration of CO2 (µmol mol-1); C2-concentration of CO2 after incubation time (µmol mol-1); R-gas constant (J mol -1 K-1); T-air temperature (K); A-chamber surface area (m2); t2-t1-incubation period.
Е (CO2) = (M × P × V × (c2 - c1)) / (R × T × A × (t2 - t1))
2.4. Statistical Analyses
Descriptive statistical analyses, ANOVA, correlation, principal component and regression analysis of the obtained data were carried out using STATGRAPHICS Plus.
3. Results
3.1. Soil Chemical Properties and Organic Matter Content
According to the applied treatments, all of the soil chemical indicators showed statistically significant differences (Table 2). The cultivated crop also affected some of the parameters, including pH, EC, available forms of phosphorus, and mineral N. Because two of the crops in the rotation were winter cereals, one was a spring cereal (maize), and the other was a spring leguminous crop (beans), the agricultural technologies differed greatly. This was reflected in the nitrogen fertilizer dosages, fertilization schedules, and crop growth stages, where nutrient uptake varies.
As anticipated, the long-term nitrogen single fertilization increased EC and decreased pH. On average across all plots, the electrical conductivity was the highest in all variations with nitrogen fertilization (N, NPK, NK). In the zero variations, it was the lowest. Since the pH was greater in the K, P, and zero treatments, the variants with nitrogen fertilizers application showed the greatest pH drop. In general, a decrease in pH was observed in variants N, NP (5.44), NK (5.30), NPK (5.42). The average pH of the zero treatment was 5.82.
On average, soil organic carbon was most significantly increased by the NP and NPK treatments. Variants NK (1.25%), PK (1.18%), and N (1.22%) exhibited lower soil organic matter as a result of long-term, consistent mineral fertilization. The highest increase in soil organic carbon was result of fertilization with both nitrogen and phosphorus - in the NPK treatment, this was 1.42%, and in NP, it was 1.43%. The zero treatment had the lowest average organic carbon content (1.05%) (Table 2). Microbial biomass carbon was stimulated most strongly by single and combined nitrogen and potassium fertilization. The microbial biomass carbon increased in the variants (NK, K, N).
A principal component analysis (PCA) was performed to establish the main relationships between the available forms of macroelements, physicochemical properties, organic carbon and Cmic (Table 3). The model describes 69.71% of the variability of the data. Component 1 reflects 42% of the variation in the indicators. On the vector of principal component 1 (PC1) increases the values of mineral nitrogen, which leads to higher EC and a lower pH and a very slight increase in SOC. The enhanced SOC was the strongest in the second component (PC2), and the available forms of phosphorus and potassium also arose with PC2. pH decreased in all three components. Cmic was growing in the first component. In the diagram (Figure 3), the parameters considered to be positively correlated with each other when they are at an acute angle, when their vectors form a right angle, they are not correlated, and when they are at an obtuse angle they are negatively correlated. From the PCA figure (Figure 3), a positive relationship can be established between mineral nitrogen and soil organic matter, as well as with microbial biomass carbon.
Available forms of phosphorus and potassium according to PCA have a stronger impact on SOC content, while mineral nitrogen has a stronger positive relationship with microbial carbon. However, organic matter was improved most strongly in plots with combined nitrogen and phosphorus fertilization (Table 2), but nitrogen effect in treatments N, with separate nitrogen fertilization was low.
3.2. Effects of Mineral Fertilization on Soil CO2 Emissions
The most intensive CO2 emissions were recorded in the NP and NPK variants (Figure 4). Also in these treatments, the highest accumulation of organic carbon was established (Table 2). Combined nitrogen and phosphorus fertilization, stimulated organic matter accumulation, which also stimulates soil respiration. Correlation coefficient between SOC and CO2 flows were positive and significant (p<0.05) in bean, barley and wheat plots. Soil CO2 fluxes were the most intensive in wheat plots (66.38 kg ha-1day-1) and lowest in beans plots (33.22 kg ha-1day-1). Despite the low amount of SOC, recorded in the zero variants, CO2 emissions in the absence of fertilization were not the most strongly reduced. CO2 fluxes in N, P, K treatments were lower compared to the zero control.
A principal component analysis (PCA) was also conducted (Figure 5). The PCA was applied to determine the relationship between agrochemical indicators, soil organic matter and greenhouse gas emissions. The model describes 85.86% of the variability of original data. The data were loaded into two principal components (PC1 and PC2), which explain most of the variations between the indicators by variants of fertilization. A positive relationship was found between the content of available forms of phosphorus and potassium, mineral nitrogen, soil organic carbon and CO2 emissions. The relation between mineral nitrogen and CO2 was lower than impact of phosphorus and potassium. Cmic showed negative relation with all parameters in these analyses. There was negative correlation between Cmic and CO2 in wheat (r=-0.44, p=0.09) and maize (r=-0.64, p=0.007). In beans and barley these coefficients were also negative (r= - 0.12; r= - 0.61), but not significant.

Table 4.
Variable loadings of the first three components of principal components analysis. CO2 emissions (кg ha-1day-1), mineral N (N-NO3, N-NH4) (mg kg-1), P- available P2O5 (mg 100g-1), K- available K2O (mg 100g-1), Cmic (mg kg-1).
Table 4.
Variable loadings of the first three components of principal components analysis. CO2 emissions (кg ha-1day-1), mineral N (N-NO3, N-NH4) (mg kg-1), P- available P2O5 (mg 100g-1), K- available K2O (mg 100g-1), Cmic (mg kg-1).
| Component 1 | Component 2 | Component 3 | ||
|---|---|---|---|---|
| Eigenvalue | 2.47 | 1.46 | 1.22 | |
| Percent of variance | 41.18 | 24.36 | 20.35 | |
| N | -0.220 | 0.450 | 0.655 | |
| P | -0.545 | -0.065 | -0.334 | |
| K | -0.173 | 0.498 | -0.629 | |
| CO2 | -0.544 | -0.064 | 0.012 | |
| Cmic | 0.230 | 0.729 | -0.039 | |
| SOC | -0.524 | 0.101 | 0.250 | |
3.3. Effects of Long-Term Mineral Fertilization on Soil Microbiota.
Microorganisms are highly sensitive and their number strongly depends on many factors and the variations in their quantity are very strong. Of all the factors studied, the season has the strongest influence on the number of the studied groups of microorganisms, followed by the growing crop. The influence of the treatments is statistically significant when combining all factors.
In general, microscopic fungi and actinomycetes correlated in number (r=+0.34, p=0.006), while nitrogen cycle bacteria correlated positively with each other. The increased number of microscopic fungi was observed in treatments with high EC and low pH (N, NP, NK, NPK), but there was not established positive correlation between N and number of fungi. The number of bacteria utilizing mineral nitrogen was highest in variants with arising amounts of nitrifying and nitrogen-fixing bacteria in NP, NK, NPK treatments (Table 5). The numbers of nitrogen-fixing and nitrifying bacteria were also high in the N treatments, which was not expected, but can be explained by improved soil quality and conditions due to the enhanced amount of organic matter. The number of these three groups of microorganisms, nitrogen-fixing (r=+0.53, p=0.03), nitrifying (r=+0.51, p=0.04) and assimilating mineral nitrogen (r=+0.14), had a positive correlation with the available phosphorus forms in beans plots and negative correlation with phosphorus in all cereal’s plots. These three groups of microorganisms had positive correlation with nitrogen in all crops, most strongly in barley (NFIX, r=+0.51, p=0.03; NITR, r=+0.62, p=0.04, NUTIL, r=+0.53, p=+0.05). Nitrogen had a suppressive effect only in maize and wheat in the N variant, while in beans and barley no such effect was observed, maybe due to the lower doses of nitrogen applied.
The ratio of bacteria under different fertilization types shows that in the zero control, ammonifying and mineral nitrogen-utilizing bacteria predominated. The trend was similar for the N and PK variants (Figure 6). This indicated enhanced mineralization and a much lower amount of nitrogen-fixing and nitrifying bacteria. The largest share of NFIX and NUTIL were recorded in the K, NPK treatments.
PCA had been performed on mineral nitrogen content, available forms of P2O5, K2O, main groups soil microorganisms to establish the connections between nutrients content and soil microbiota. The model describes 68.04% of the variability of the data (Table 6). The data were loaded into three principal components (PC1, PC2 and PC3), that explain most of the variations between variables. On PC1 and PC2, the population of ammonifying, nitrifying, nitrogen-fixing and mineral nitrogen-utilizing bacteria increased, with the first component showing a slight increase in nitrogen, and the second component showing an increase in phosphorus and potassium.
The model describes positive relation between nitrogen and nitrifying, nitrogen fixing, ammonifying and nitrogen utilizing bacteria (Figure 7). A positive effect of K was established on NFIX and NUTIL. Both actinomycetes and fungi were affected by available phosphorus and potassium.
A PCA was performed on CO2 emissions and numbers of main groups of microorganisms (Table 7, Figure 8). The model describes 72.20% of data. CO2 increases on two vectors (PC1 and PC2), with the second component increasing CO2 emissions and all groups of microorganisms. The model shows a stronger relationship of actinomycetes and microscopic fungi with CO2 emissions and a weaker relationship with NUTIL, NFIX, AMM, NITR.
4. Discussion
There are different views on the impact of mineral nitrogen fertilizers on organic carbon sequestration [34]. Some have suggested that nitrogen fertilizers reduce SOC stocks because they accelerate the mineralization of organic matter [35,36], and other reports suggest that nitrogen fertilizers increase SOC stocks [26,37]. In this study, long-term application of mineral nitrogen as a single fertilizer resulted in much lower SOC levels than single phosphorus fertilizer and combined fertilization. SOC stocks were highest with combined NP and NPK fertilization.
A detailed analyses of 84 permanent fertilizer experiments, showed that soils, fertilized with NPK, N, P, and K, have increased SOC with 10, 5, 5, and 2%, respectively, and these changes depended on cropping system, duration of experiment, geographic region, and degree of fertilization [38].
It was found that while phosphorus had no significant impact on net primary productivity, nitrogen boosted it by 10.16%. Fertilization with both N and P also enhanced net photosynthetic production by 21.97%. As a result, the soils containing plant leftovers had a larger carbon input. According to the findings the simultaneous addition of N and P stimulates carbon sequestration capacity of N-limited soils [39].
The structure, composition and activity of soil microflora are very sensitive indicators of changes in soil conditions. Soil microorganisms are directly related to greenhouse gas emissions and the formation and stabilization of soil organic matter [40,41,42]. Soil microbial community diversity and distribution responses to fertilization have been widely reported [43,44]. It was established that the most significant effect on bacterial communities had pH and available phosphorus content, while on fungal diversity the strongest impact had mineral nitrogen, pH, SOC mineral nitrogen [44]. The increased number of microscopic fungi was observed in treatments with high EC and low pH (N, NP, NK, NPK), but there was not established positive correlation between N and number of fungi. In our study Cmic had a positive correlation with the amount of actinomycetes, fungi and different groups of bacteria, depending on the crop. In research of [45], long-term N fertilization declined Cmic and dehydrogenase activity, while combined NP, NPK fertilization increased these parameters. In current research microbial biomass carbon was stimulated most strongly by single and combined nitrogen and potassium fertilization (N, K, NK).
Higher nitrogen application rates resulted with higher GHG emissions [15,46,47], and cumulative CO2 fluxes under long-term NP and NPK treatments were higher than under zero and NK fertilization [16,38]. The CO2 emissions in our experiment were higher in the NP and NPK treatments, in contrast to the control and the K, N, and P fertilization treatments. Increased biomass accumulation and increase of C sequestration resulted by combined N and P fertilization intensify microbiological activities and CO2 emissions.
5. Conclusions
The strongest influence on the formation of soil organic matter is the content of mineral nitrogen, but in combination with phosphorus (NP) and with phosphorus and potassium (NPK). Combined nitrogen and phosphorus fertilization lead to an increase in soil carbon sequestration by 37% compared to the unfertilized control and by 17% compared to single nitrogen fertilization and 8% compared to single phosphorus fertilization on Luvic Chernozem. The nitrogen fertilizer application most significantly alters soil properties including pH, EC, and SOC, which alters the environment for soil microbial development and influences the number and composition of soil microbial communities. The enhancement of total organic carbon leads to a higher intensity of soil respiration and more intense CO2 emissions in NP and NPK treatments.
Author Contributions
Conceptualization, G.Kuncheva, G. Ginchev, J. Perfanova, H. Valchovski; methodology, G. Kuncheva, M. Kercheva, J Perfanova, G. Ginchev; software, G. Kuncheva.; formal analysis, G. Ginchev, J. Perfanova, L. Tribis ; resources, G. Ginchev.; writing—review and editing, G.Kuncheva, M. Kercheva, H. Valchovski, L. Tribis; funding acquisition, G. Kuncheva.
Funding
The authors acknowledge funding of research activities received from the National Science Fund under grant agreement № КП-06-Н76/2 2023 (project “Integration of satellite derived and ground-based data for soil water balance components and crop cover into models for assessment of agroecological risks and agricultural practices for their mitigation”).
Conflicts of Interest
The authors declare no conflicts of interest. The funders had no role in the design of the study; in the collection, analyses, or interpretation of data; in the writing of the manuscript; or in the decision to publish the results.
References
- Francioli D.; Schulz E.; Lentendu G.; Wubet T.; Buscot F.; Reitz T. Mineral vs. organic amendments: Microbial community structure, activity and abundance of agriculturally relevant microbes are driven by long-term fertilization strategies. Front. Microbiol 2016, 7:1446. [CrossRef]
- Hu, X. J.; Liu, J. J.; Wei D.; Zhu, P.; Cui X.; Zhou B. K.; Chen, X; Jin, J.; Liu, V.; Wang, G. Effects of over 30-year of different fertilization regimes on fungal community compositions in the black soils of northeast China. Agric. Ecosyst. Environ. 2017, 248 113–122. [CrossRef]
- Banerjee, S.; Walder, F.; Büchi, L.; Meyer, M.; Held, A.Y.; Gattinger, A.; Keller, T.; Charles, R.; van der Heijden, M.G.A. Agricultural intensification reduces microbial network complexity and the abundance of keystone taxa in roots. ISME J. 2019, 13, 1722–1736. [CrossRef]
- Šimanský, V.; Juriga, M.; Jonczak, J.; Uzarowicz, L.; Stapień, W. How relationships between soil organic matter parameters and soil structure characteristics are affected by the long-term fertilization of a sandy soil. Geoderma 2019, 342, pp. 75-84.
- Ullah, S.; Ai, C.; Ding, W.; Jiang, R.; Zhao, S.; Zhang, J.; Zhou, W.; Hou, Y.; He, P., The response of soil fungal diversity and community composition to long-term fertilization, Applied Soil Ecology, 2019, Volume 140, Pages 35-41, ISSN 0929-1393. [CrossRef]
- Luo, P.; Han, X.; Wang, Y.; Han, M.; Shi, H.; Liu, N.; Bai, H. Influence of long-term fertilization on soil microbial biomass, dehydrogenase activity, and bacterial and fungal community structure in a brown soil of northeast China. Ann Microbiol. 2015. 65, pp.533–542 . [CrossRef]
- Šimanský, V.; Jonczak, J.; Horváthová, J.; Igaz, D.; Aydın, E.; Kováčik, P. Does long-term application of mineral fertilizers improve physical properties and nutrient regime of sandy soils? Soil and Tillage Research, 2022, Volume 215, 105224, ISSN 0167-1987. [CrossRef]
- UNEP, United nations environmental programme, Annual evaluation report, 2007 https://www.unep.org/resources/synthesis-reports/unep-annual-evaluation-report-2007.
- Nasser, H.A.; Mahmoud, M.; Tolba, M.M. Radwan, A.R.; Gabr, N.M.; ElShamy, A.A.; Yehya, M.S.; Ziemke, A; Hashem, M.Y. Pros and cons of using green biotechnology to solve food insecurity and achieve sustainable development goals. Euro-Mediterr J Environ Integr. 2021, 29 . [CrossRef]
- Patrick, M.; Tenywa, J.S. ; Ebanyat, P. ; Tenywa, M.M.; Mubiru, D.N.; Basamba, T.A.; Leip, A. Soil organic carbon thresholds and nitrogen management in tropical agroecosystems: concepts and prospects J. Sust. Dev., 2013, 6 , pp. 31-43.
- Galloway, J.N.; Townsend, A.R.;Erisman, J.W.; Bekunda, M.; Cai, Z; Freney, J.R.; Martinelli, L.A.; Seitzinger, S.P.; Sutton, M.A., Transformation of the nitrogen cycle: recent trends, questions and potential solutions. Science. 2008, 320, 889-892.
- Wang, X.; Song, L. Advances in the Study of NO3 – Immobilization by Mic robes in Agricultural Soils. Nitrogen 2024, 5, 927–940. [CrossRef]
- Braos, L.B.; Carlos, R.S.; Bettiol, A.C.T.; Bergamasco, M.A.M.; Terçariol, M.C.; Ferreira, M.E.; da Cruz, M.C.P. Soil Carbon and Nitrogen Forms and Their Relationship with Nitrogen Availability Affected by Cover Crop Species and Nitrogen Fertilizer Doses. Nitrogen 2023, 4, 85–101. [CrossRef]
- Jesmin, T.; Mitchell, D.T.; Mulvaney, R.L. Short-Term Effect of Nitrogen Fertilization on Carbon Mineralization during Corn Residue Decomposition in Soil. Nitrogen 2021, 2, 444–460. [CrossRef]
- Saeed, Q.; Zhang, A.; Mustafa, A.; Sun,B.; Zhang,S.; Yang, X. Effect of long-term fertilization on greenhouse gas emissions and carbon footprints in northwest China: A field scale investigation using wheat-maize-fallow rotation cycles, Journal of Cleaner Production, 2022 Volume 332, 130075, ISSN 0959-6526. [CrossRef]
- Zhai, L.; Liu, H.; Zhang, J.; Huang, J.; Wang, B. Long-Term Application of Organic Manure and Mineral Fertilizer on N2O and CO2 Emissions in a Red Soil from Cultivated Maize-Wheat Rotation in China, Agricultural Sciences in China, 2011, Volume 10, Issue 11, pp. 1748-1757, ISSN 1671-2927. [CrossRef]
- Zhang, X.Q.; C. Pu, X. Zhao, J.F. Xue, R. Zhang, Z.J. Nie, F. Chen, R. Lal, H.L. Zhang Tillage effects on carbon footprint and ecosystem services of climate regulation in a winter wheat–summer maize cropping system of the North China Plain Ecol. Indicat., 67 (2016), pp. 821-829.
- Paustian, K.; Larson, E.; Kent, J.; Marx, E.; Swan, A. Soil C sequestration as a biological negative emission strategy Front. Clim., 2019, 1, 10.3389/fclim.2019.00008.
- Bradford, M.A. C; Carey, J.; Atwood, L. ; Bossio, D. ; Fenichel, E.P. ; Gennet, S.; Fargione, J. ; Fisher, J.R.B.; Fuller, E. ; Kane, D.A. ; Lehmann, J.; Oldfield, E.E.; Ordway, E.M.; Rudek, J.; Sanderman, J.; Wood, S.A. Soil carbon science for policy and practice, Nat. Sustain. 2019, 2, 1070–1072. [CrossRef]
- Çakmakçı, R.; Salık, M.A.; Çakmakçı, S. Assessment and Principles of Environmentally Sustainable Food and Agriculture Systems. Agriculture 2023, 13, 1073. [CrossRef]
- Mattila,V.; Dwivedi, P.; Gauri, P.; Ahbab, Md. Blockchain for Environmentally Sustainable Economies: Case Study of 5irechain. International Journal of Social Sciences and Management Review. 2022, 5, 50-62. [CrossRef]
- Smith, P.; Soussana, J.F.; Angers, D.; Schipper, L.; Chenu, C.; Rasse, DP.; Batjes, N.H.; van Egmond, F.; McNeill, S.; Kuhnert, M.; Arias-Navarro, C.; Olesen, J.E.; Chirinda, Ngonidzashe; Fornara, D.; Wollenberg, E.; Álvaro-Fuentes, J.; Sanz-Cobena, A. & Klumpp, K. How to measure, report and verify soil carbon change to realise the potential of soil carbon sequestration for atmospheric greenhouse gas removal. Global Change Biology. 2019, 1-23 p.
- Druckman, A.; Jackson, T. The carbon footprint of UK households 1990–2004: A socio-economically disaggregated, quasi-multi-regional input–output model, Ecological Economics, 2009, Volume 68, Issue 7, Pages 2066-2077, ISSN 0921-8009. [CrossRef]
- Cheng, K.; Pan, G.; Smith, P.; Luo, T.; Li, L.; Zheng, J.; Zhang, X.; Han, X.; Yan, M. Carbon footprint of China's crop production—An estimation using agro-statistics data over 1993–2007, Agriculture, Ecosystems & Environment, 2011, Volume 142, Issues 3–4, Pages 231-237, ISSN 0167-8809. [CrossRef]
- Suleiman, A.K.A.; Manoeli, L.; Boldo, J.T.; Pereira, M.G.; Roesch, L.F.W. Shifts in soil bacterial community after eight years of land-use change. Syst. Appl. Microbiol. 2013, 36, 137–144.
- Mahal, N.K.; Osterholz,W.R.; Miguez, F.E.; Poffenbarger, H.J.; Sawyer, J.E.; Olk, D.C.; Archontoulis, S.V., Castellano, M.J.: Nitrogen Fertilizer Suppresses Mineralization of Soil Organic Matter in Maize Agroecosystems. Front. Ecol. Evol. 2019, 7:59. [CrossRef]
- Pan, H.; Chen, M. M.; Feng, H. J.; Wei, M.; Song, F. P.; Lou, Y. H.; Cui, X.; Wang, H.; Zhuge, Y. Organic and inorganic fertilizers respectively drive bacterial and fungal community compositions in a fluvo-aquic soil in northern China. Soil Till. Res. 2020, 198:104540. [CrossRef]
- Wei, X.; Xie, B.; Wan, C.; Song, R.; Zhong, W.; Xin, S.; Song, K. Enhancing Soil Health and Plant Growth through Microbial Fertilizers: Mechanisms, Benefits, and Sustainable Agricultural Practices. Agronomy 2024, 14, 609. [CrossRef]
- Zhang, Y.; Li, P.; Liu, X. J.; Xiao, L.; Shi, P.; Zhao, B. H. Effects of farmland conversion on the stoichiometry of carbon, nitrogen, and phosphorus in soil aggregates on the Loess Plateau of China. Geoderma. 2019, 351 188–196. [CrossRef]
- Filcheva, E.; Tsadilas, C. Influence of cliniptilolite and compost on soil properties. Commun. Soil Sci Plan. 2002, 33 (3-4), 595-607. [CrossRef]
- Hoper, H. Substrate-induced respiration. Chapter 6.3 in Bloem, J.; Hopkins D.W.; Benedetti, A. (Eds.), Microbiological Methods for Assessing Soil Quality. Cabi Publishing, 2008, First Edition, https://www.cabi.org/bookshop/book/9780851990989/.
- Grudeva, V.; Moncheva, P.; Nedeva, S.; Gocheva, B.; Antonova-Nedeva, S.; Naumova, S. Handbook of microbiology. University edition SU “St. Kl. Ohridski”, 2007, (Bg).
- Bilandžija, D.; Zgorelec, Ž.; Kisić, I. Influence of Tillage Practices and Crop Type on Soil CO2 Emissions. Sustainability 2016, 8, 90. [CrossRef]
- Robertson, G. P.; Bruulsema, T. W.; Gehl, R. J.;Kanter, D.; Mauzerall, D. L.; Rotz, C. A. Nitrogen–climate interactions in US agriculture.Biogeochemistry. 2013, 114, 41–70. [CrossRef]
- Mulvaney, R. L.; Khan, S. A.; Ellsworth, T. R.: Synthetic nitrogen fertilizers deplete soil nitrogen: a global dilemma for sustainable cereal production. J. Environ. Qual. 2009, 38, 2295–2314. [CrossRef]
- Russell, A. E.; Cambardella, C. A.; Laird, D. A.; Jaynes, D. B.; Meek, D. W. Nitrogen fertilizer effects on soil carbon balances in Midwestern US agricultural systems. Ecol. Appl. 2009. 19, 1102–1113. [CrossRef]
- Poffenbarger, H. J.; Barker, D. W.; Helmers, M. J.; Miguez, F. E.;Olk, D. C.; Sawyer, J. E.Maximum soil organic carbon storage in Midwest US cropping systems when crops are optimally nitrogen-fertilized. PLoS ONE. 2017, 12:e0172293. [CrossRef]
- Zhao, H.; Sun, B.; Lu, F.; Wang, X.; Zhuang, T.; Zhang, G.; Ouyang, X. Roles of nitrogen, phosphorus, and potassium fertilizers in carbon sequestration in a Chinese agricultural ecosystem. Climatic Change. 2017, 142, 587–596 . [CrossRef]
- Zeng, W.; Wang, W. Combination of nitrogen and phosphorus fertilization enhance ecosystem carbon sequestration in a nitrogen-limited temperate plantation of Northern China, Forest Ecology and Management, 2015, Volume 341, Pages 59-66, ISSN 0378-1127. [CrossRef]
- Li, J., Shen, F. Y., Liu, Y., Yang, Y. C., Wang, J., Purahong, W., et al. (2022). Contrasting altitudinal patterns and co-occurrence networks of soil bacterial and fungal communities along soil depths in the cold-temperate montane forests of China. Catena 209:105844. [CrossRef]
- Liang, C.; Kästner, M.; Rainer Georg, J. Microbial necromass on the rise: the growing focus on its role in soil organic matter development. Soil Biol. Biochem. 2020, 150:108000. [CrossRef]
- Qiu, L.; Zhang, Q.; Zhu, H.; Reich, .B.; Banerjee, S.; van der Heijden, M.G.A.; Sadowsky, M.J.; Ishii, S.; Jia, X.; Shao, M.; Liu, B.; Jiao, H.; Li, H.; Wei, X. Erosion reduces soil microbial diversity, network complexity and multifunctionality, The ISME Journal, 2021, Volume 15, Issue 8, Pages 2474–2489. [CrossRef]
- Zhou, J.; Jiang, X.; Zhou, B.; Zhao, B. S.; Ma, M. C.; Guan, D. W.; Li, J.; Chen, S.; Cao, F.; Shen, D.; Qin, J. Thirty-four years of nitrogen fertilization decreases fungal diversity and alters fungal community composition in black soil in northeast China. Soil Biol. Biochem. 2016, 95, 135–143. [CrossRef]
- Zhang, S.; Li, X.; Chen, K.; Shi, J.; Wang, Y.; Luo, P.; Yang, J.; Wang, Y.; Han, X. Long-term fertilization altered microbial community structure in an aeolian sandy soil in northeast China. Front. Microbiol. 2022 13:979759. [CrossRef]
- Luo, P.; Han, X.; Wang, Y.; Han, M.; Shi, H.; Liu, N.; Bai, H. Influence of long-term fertilization on soil microbial biomass, dehydrogenase activity, and bacterial and fungal community structure in a brown soil of northeast China. Ann Microbiol. 2015, 65, pp. 533–542 . [CrossRef]
- Xiang, Y.; Cheng, M.; Wen, Y.; Darboux, F. Soil Organic Carbon Sequestration under Long-Term Chemical and Manure Fertilization in a Cinnamon Soil, Northern China. Sustainability, 2022, 14, 5109. https:// doi.org/10.3390/su14095109.
- Hu, X.K.; Su, F.; Ju, X.T.; Gao, B.; Oenema, O.; Christie, P.; Huang, B.X.; Jiang, R.F.; Zhang, F.S. Greenhouse gas emissions from a wheat–maize double cropping system with different nitrogen fertilization regimes, Environmental Pollution, 2013, Volume 176 , Pages 198-207,ISSN 0269-7491.
Figure 1.
Location of the site.
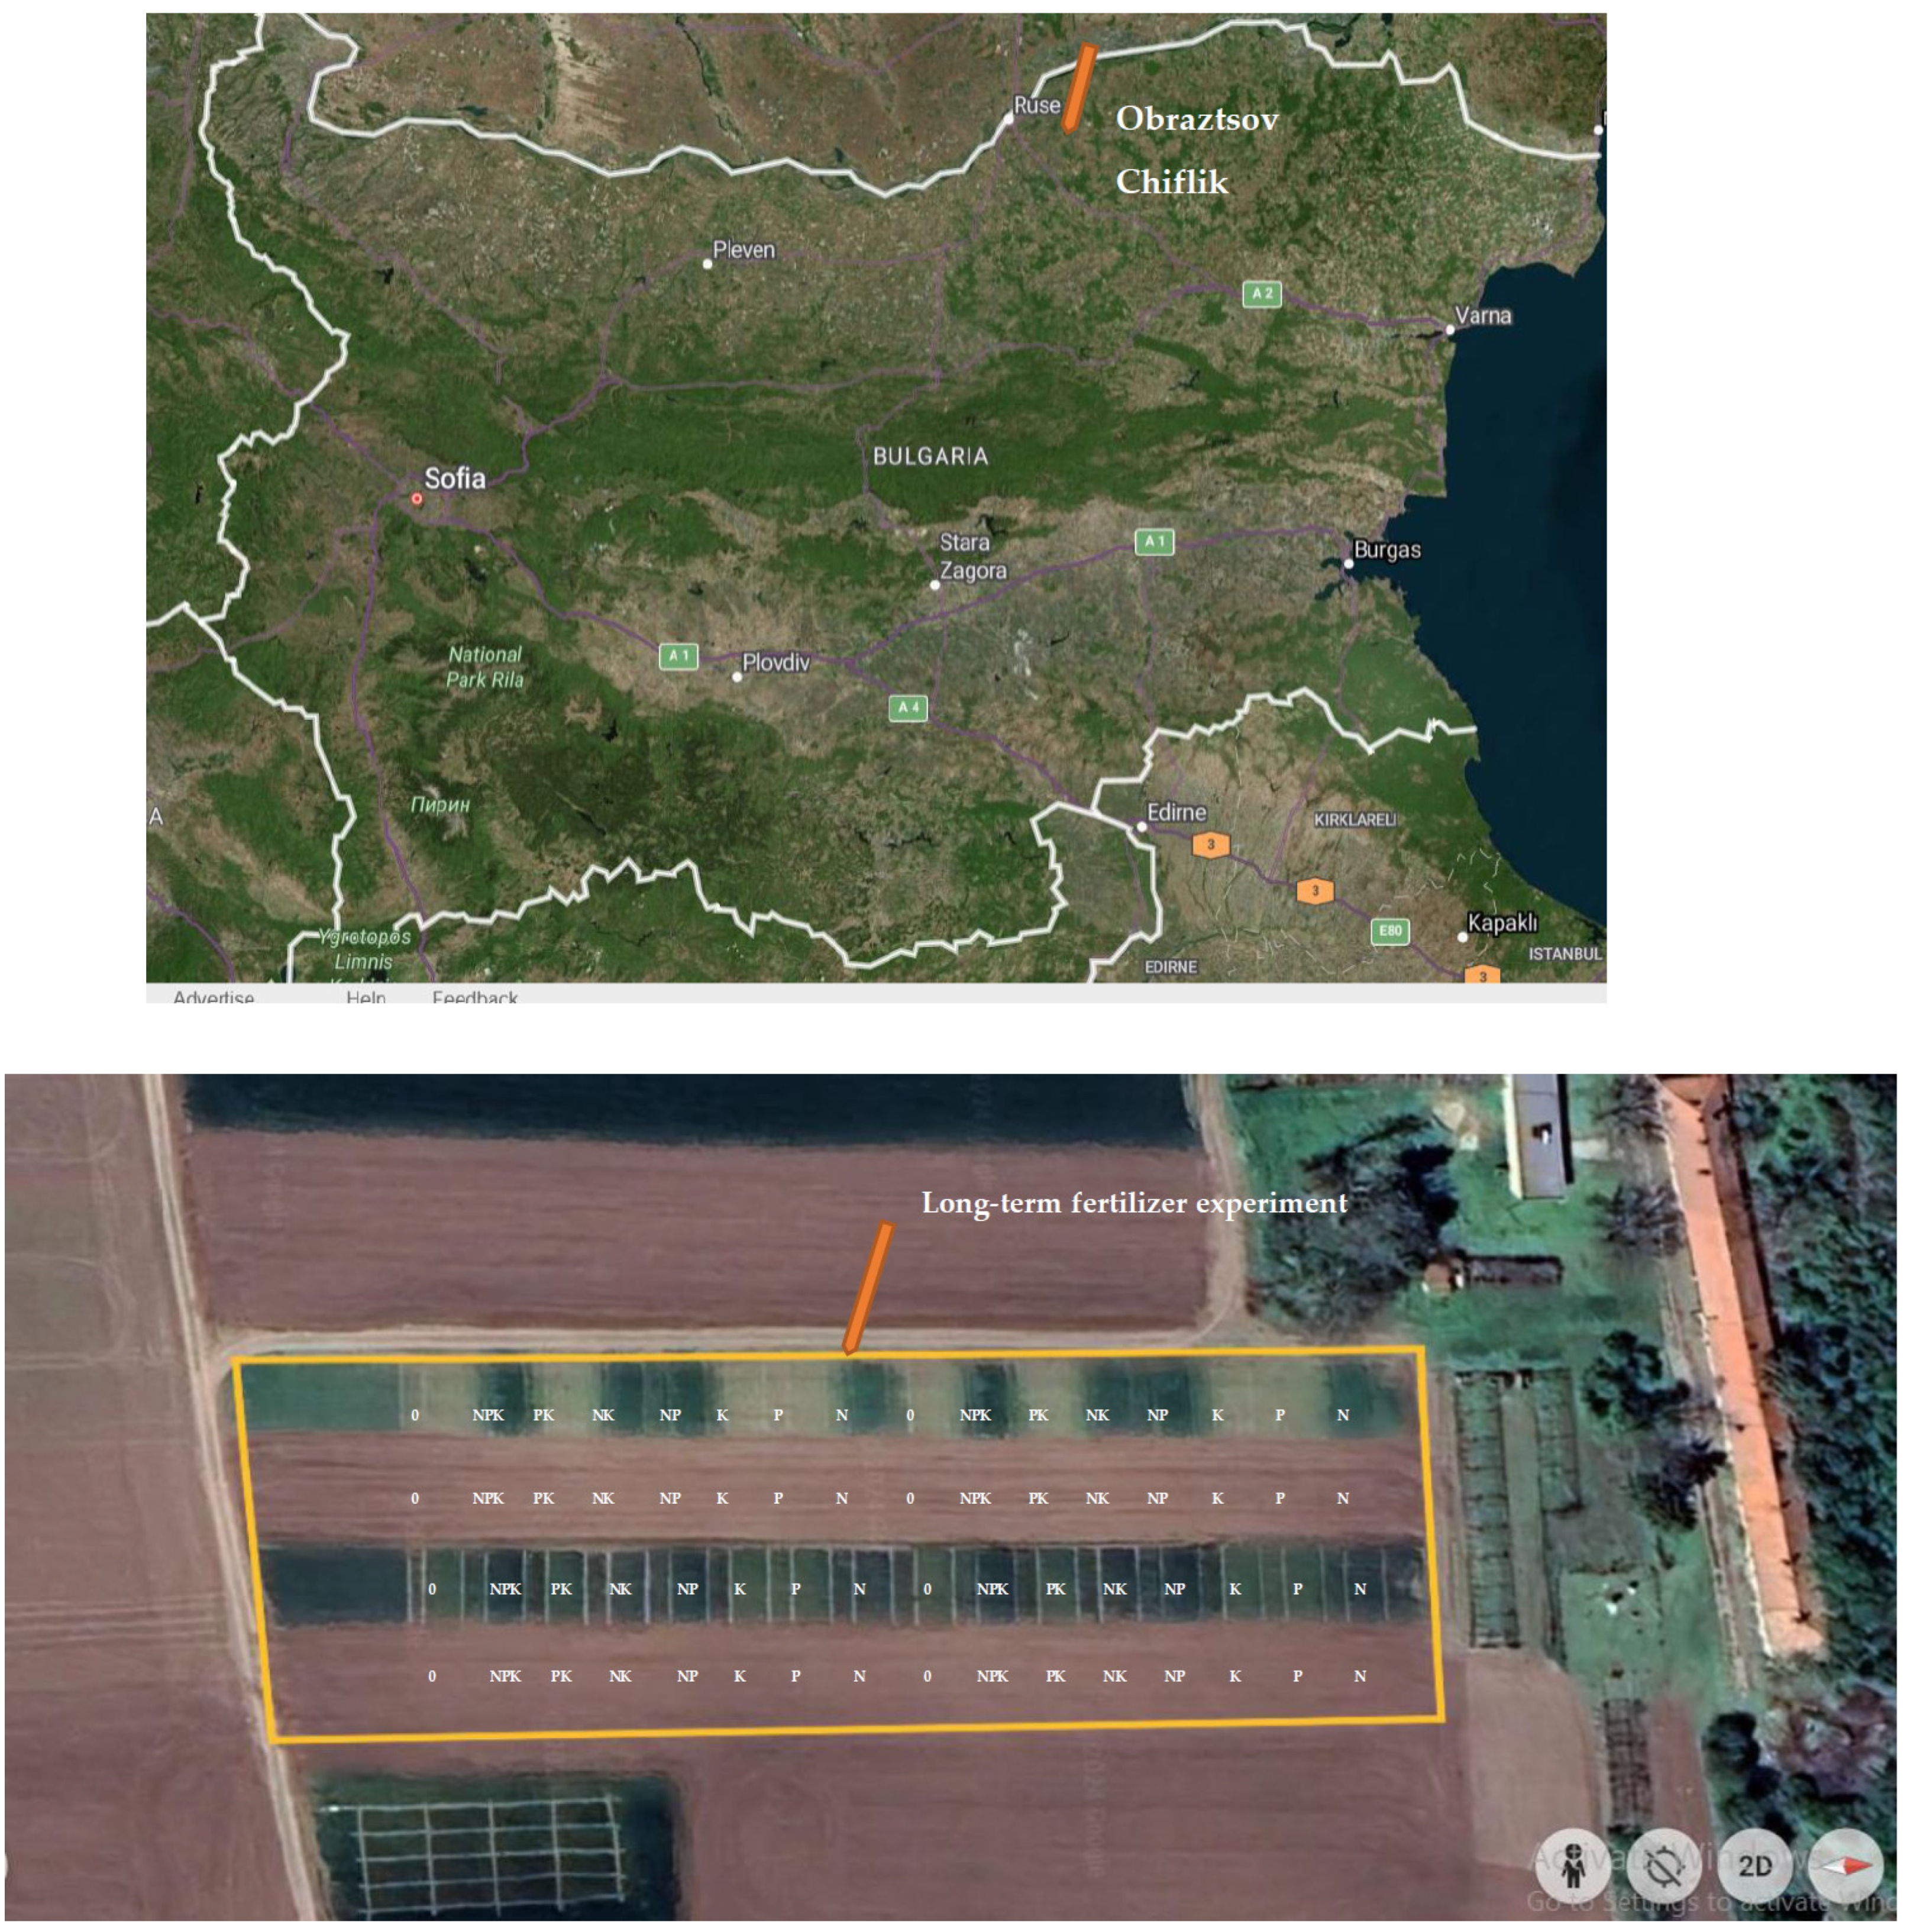
Figure 2.
Experimental design 2021-2022.
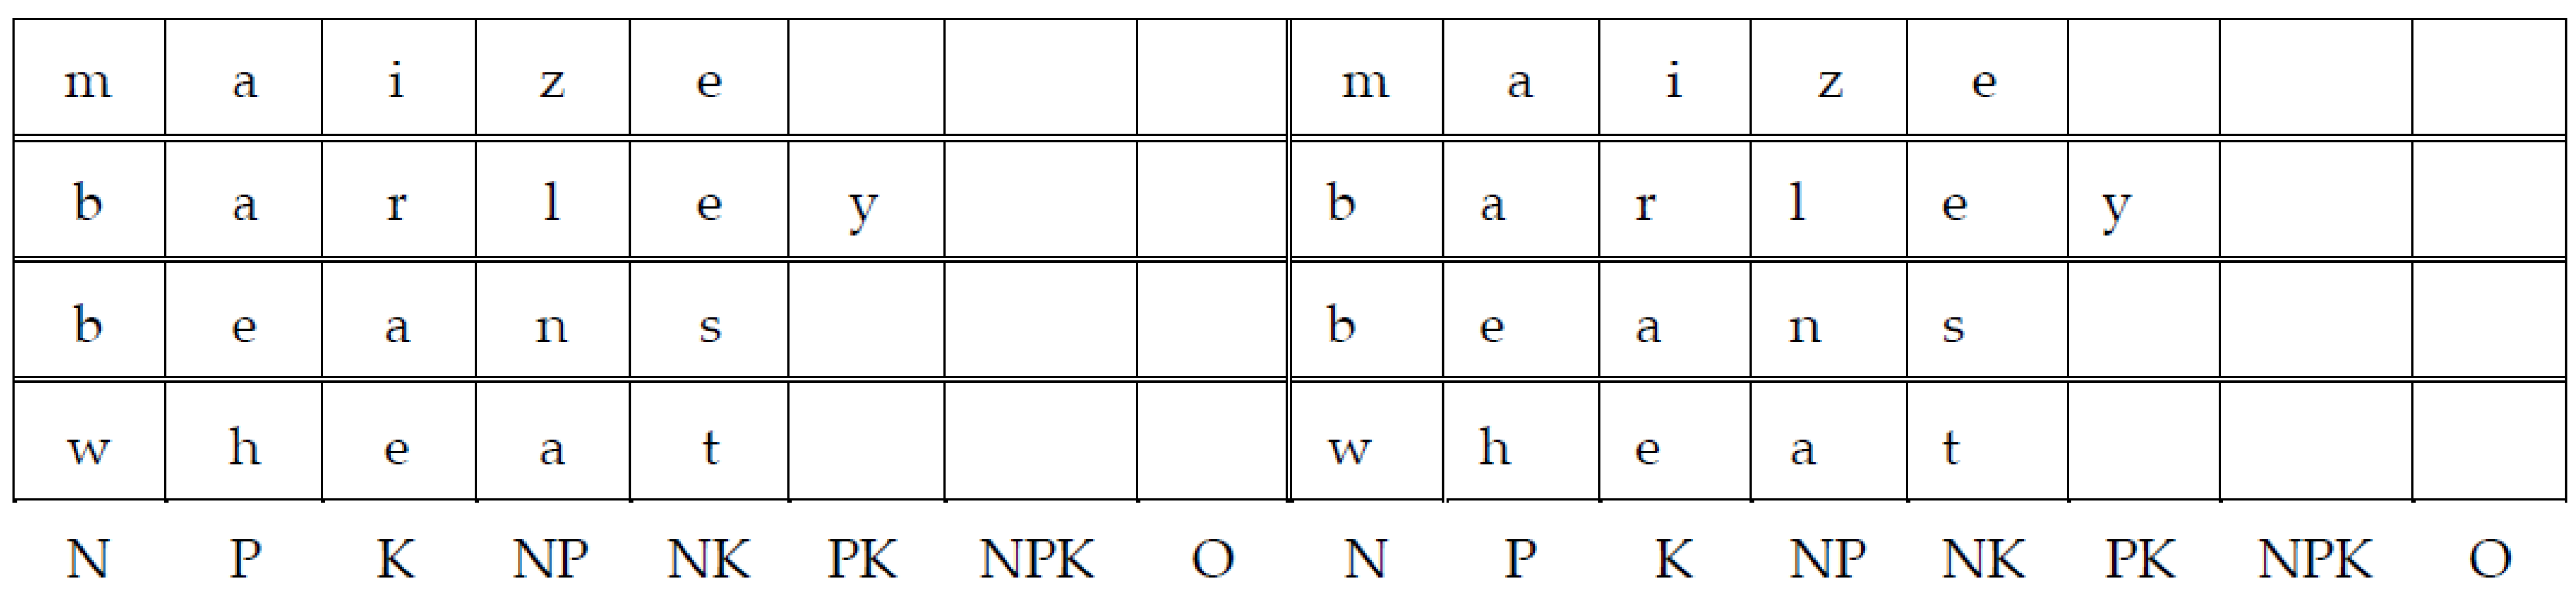
Figure 3.
Biplot of the first two components in the analysis carried out on a dataset including: soil mineral N (N-NO3, N-NH4) (mg kg-1), P- available P2O5 (mg 100g-1), K- available K2O (mg 100g-1), EC (µS cm-1), pH, SOC (%), Cmic (mg kg-1). .
Figure 3.
Biplot of the first two components in the analysis carried out on a dataset including: soil mineral N (N-NO3, N-NH4) (mg kg-1), P- available P2O5 (mg 100g-1), K- available K2O (mg 100g-1), EC (µS cm-1), pH, SOC (%), Cmic (mg kg-1). .
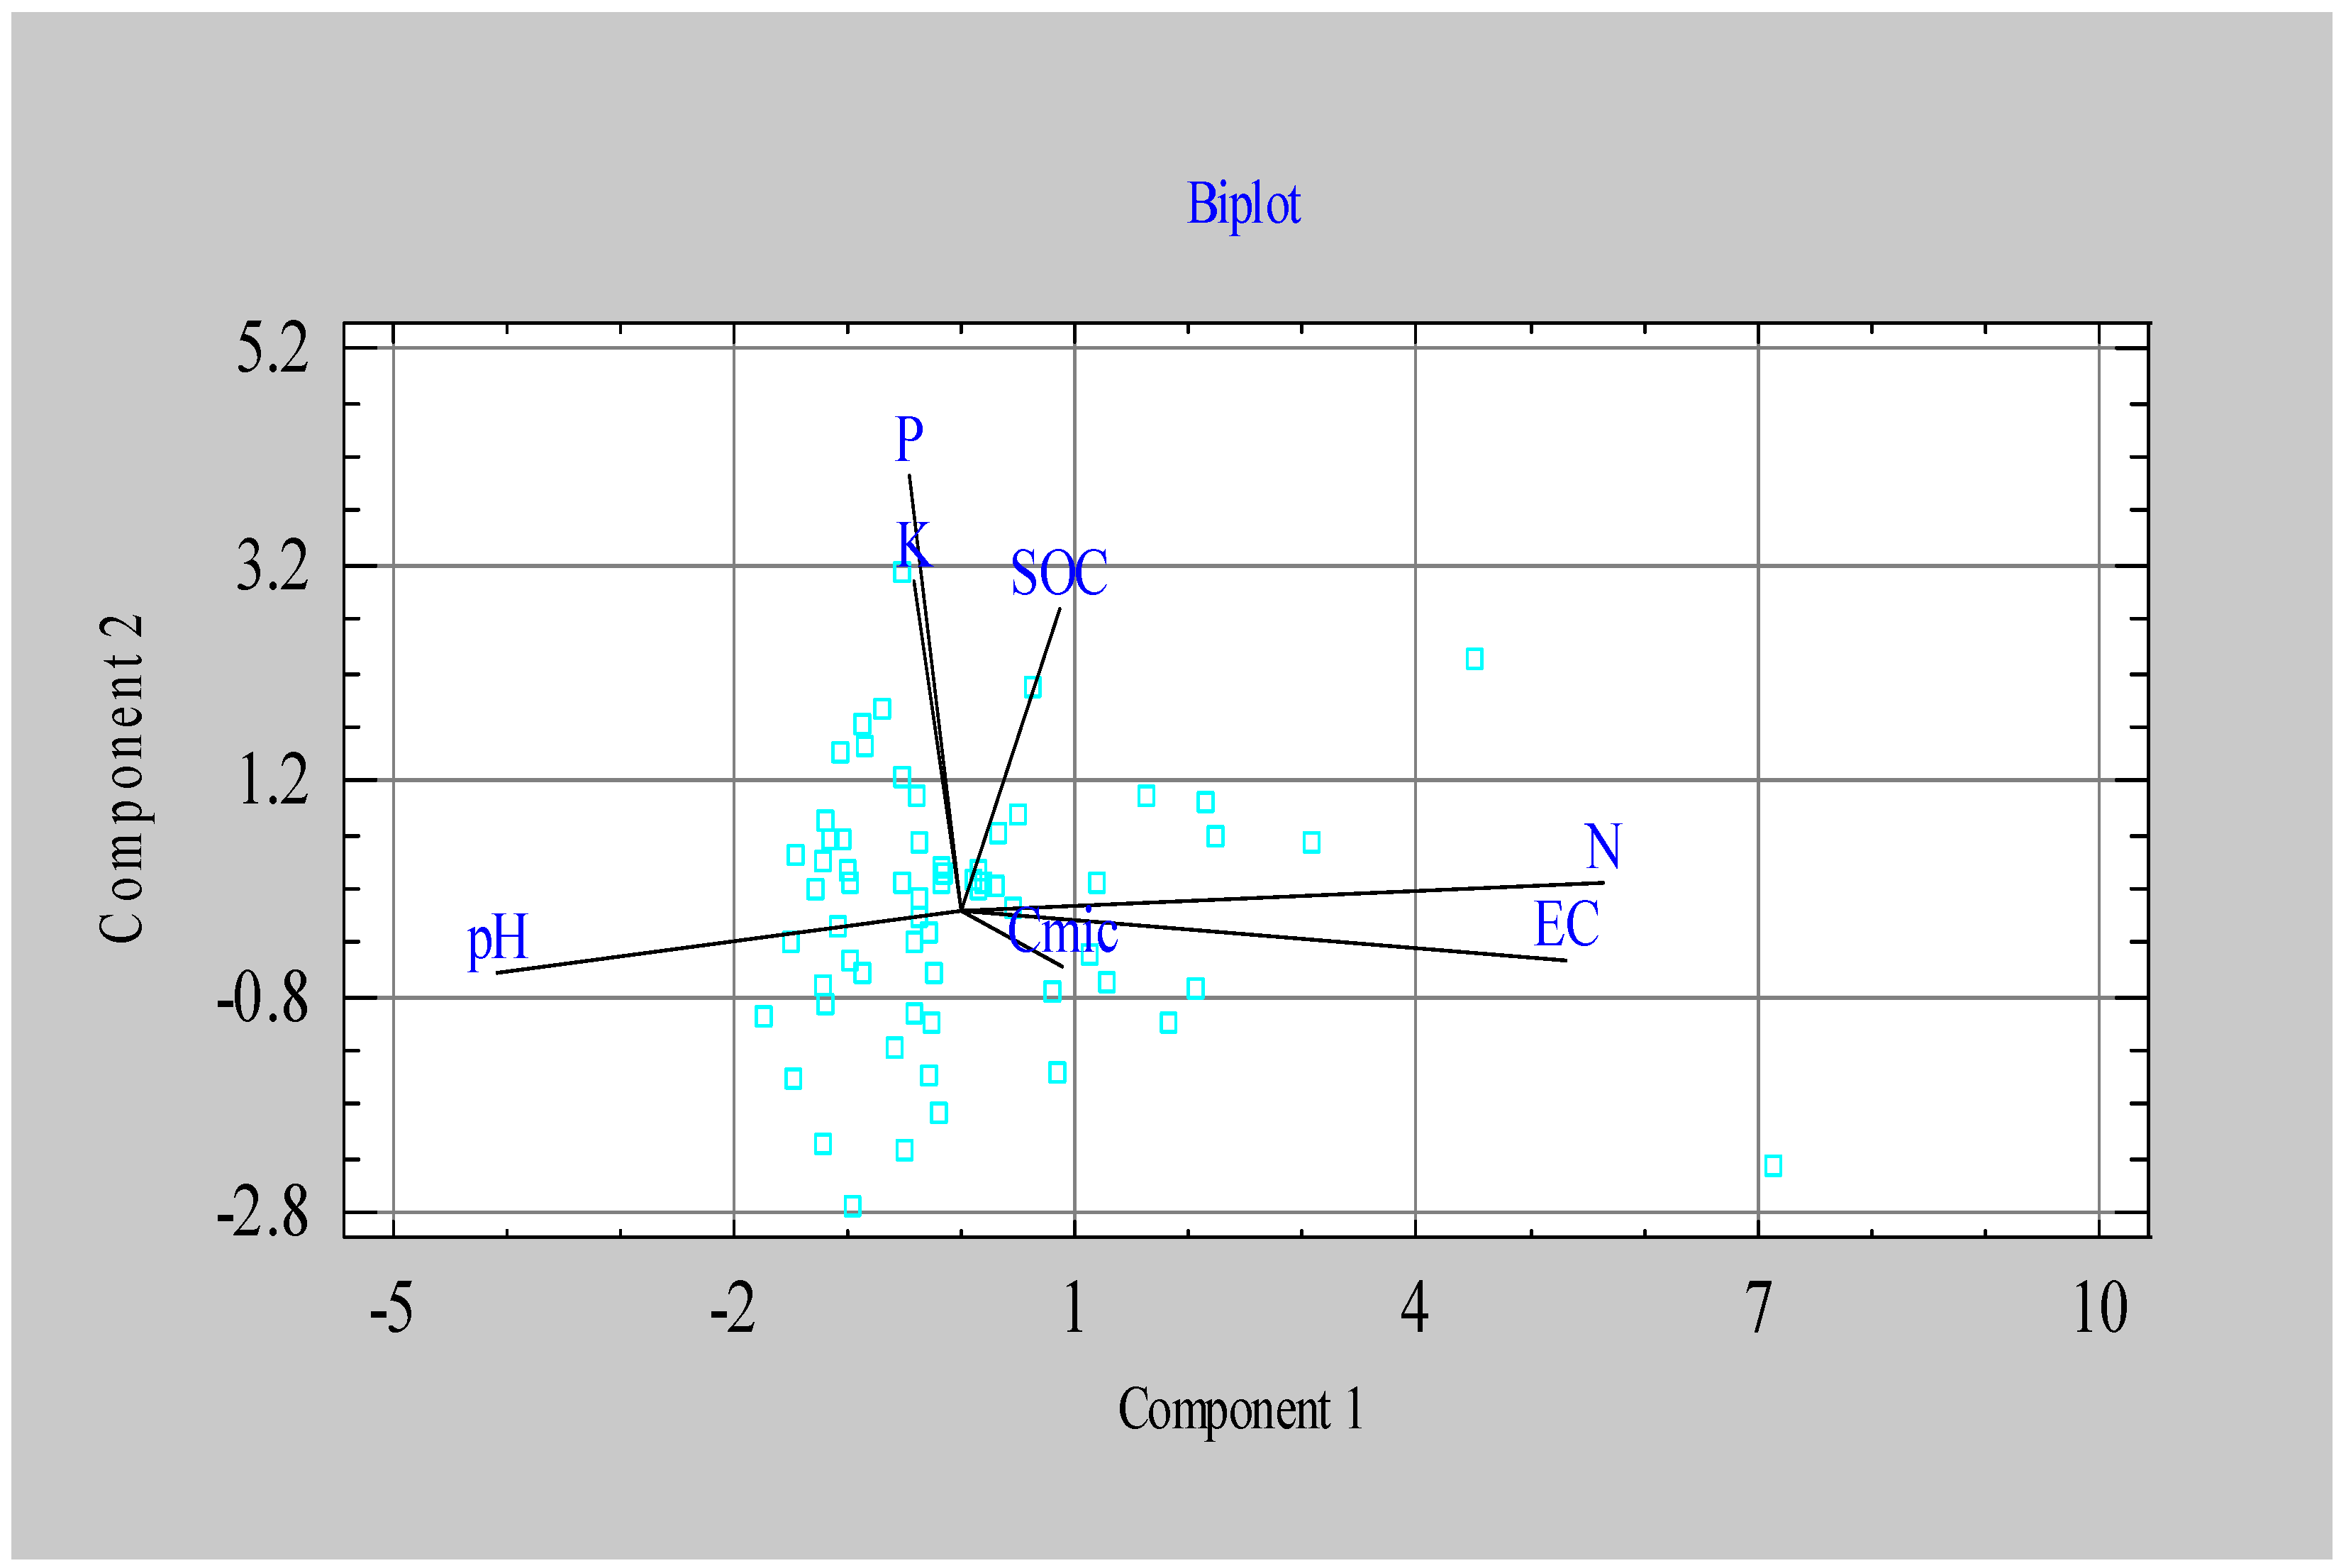
Figure 4.
Soil CO2 emissions, kg ha-1day-1. Vertical bars denote standard deviation. ANOVA: p=0.0578.
Figure 4.
Soil CO2 emissions, kg ha-1day-1. Vertical bars denote standard deviation. ANOVA: p=0.0578.
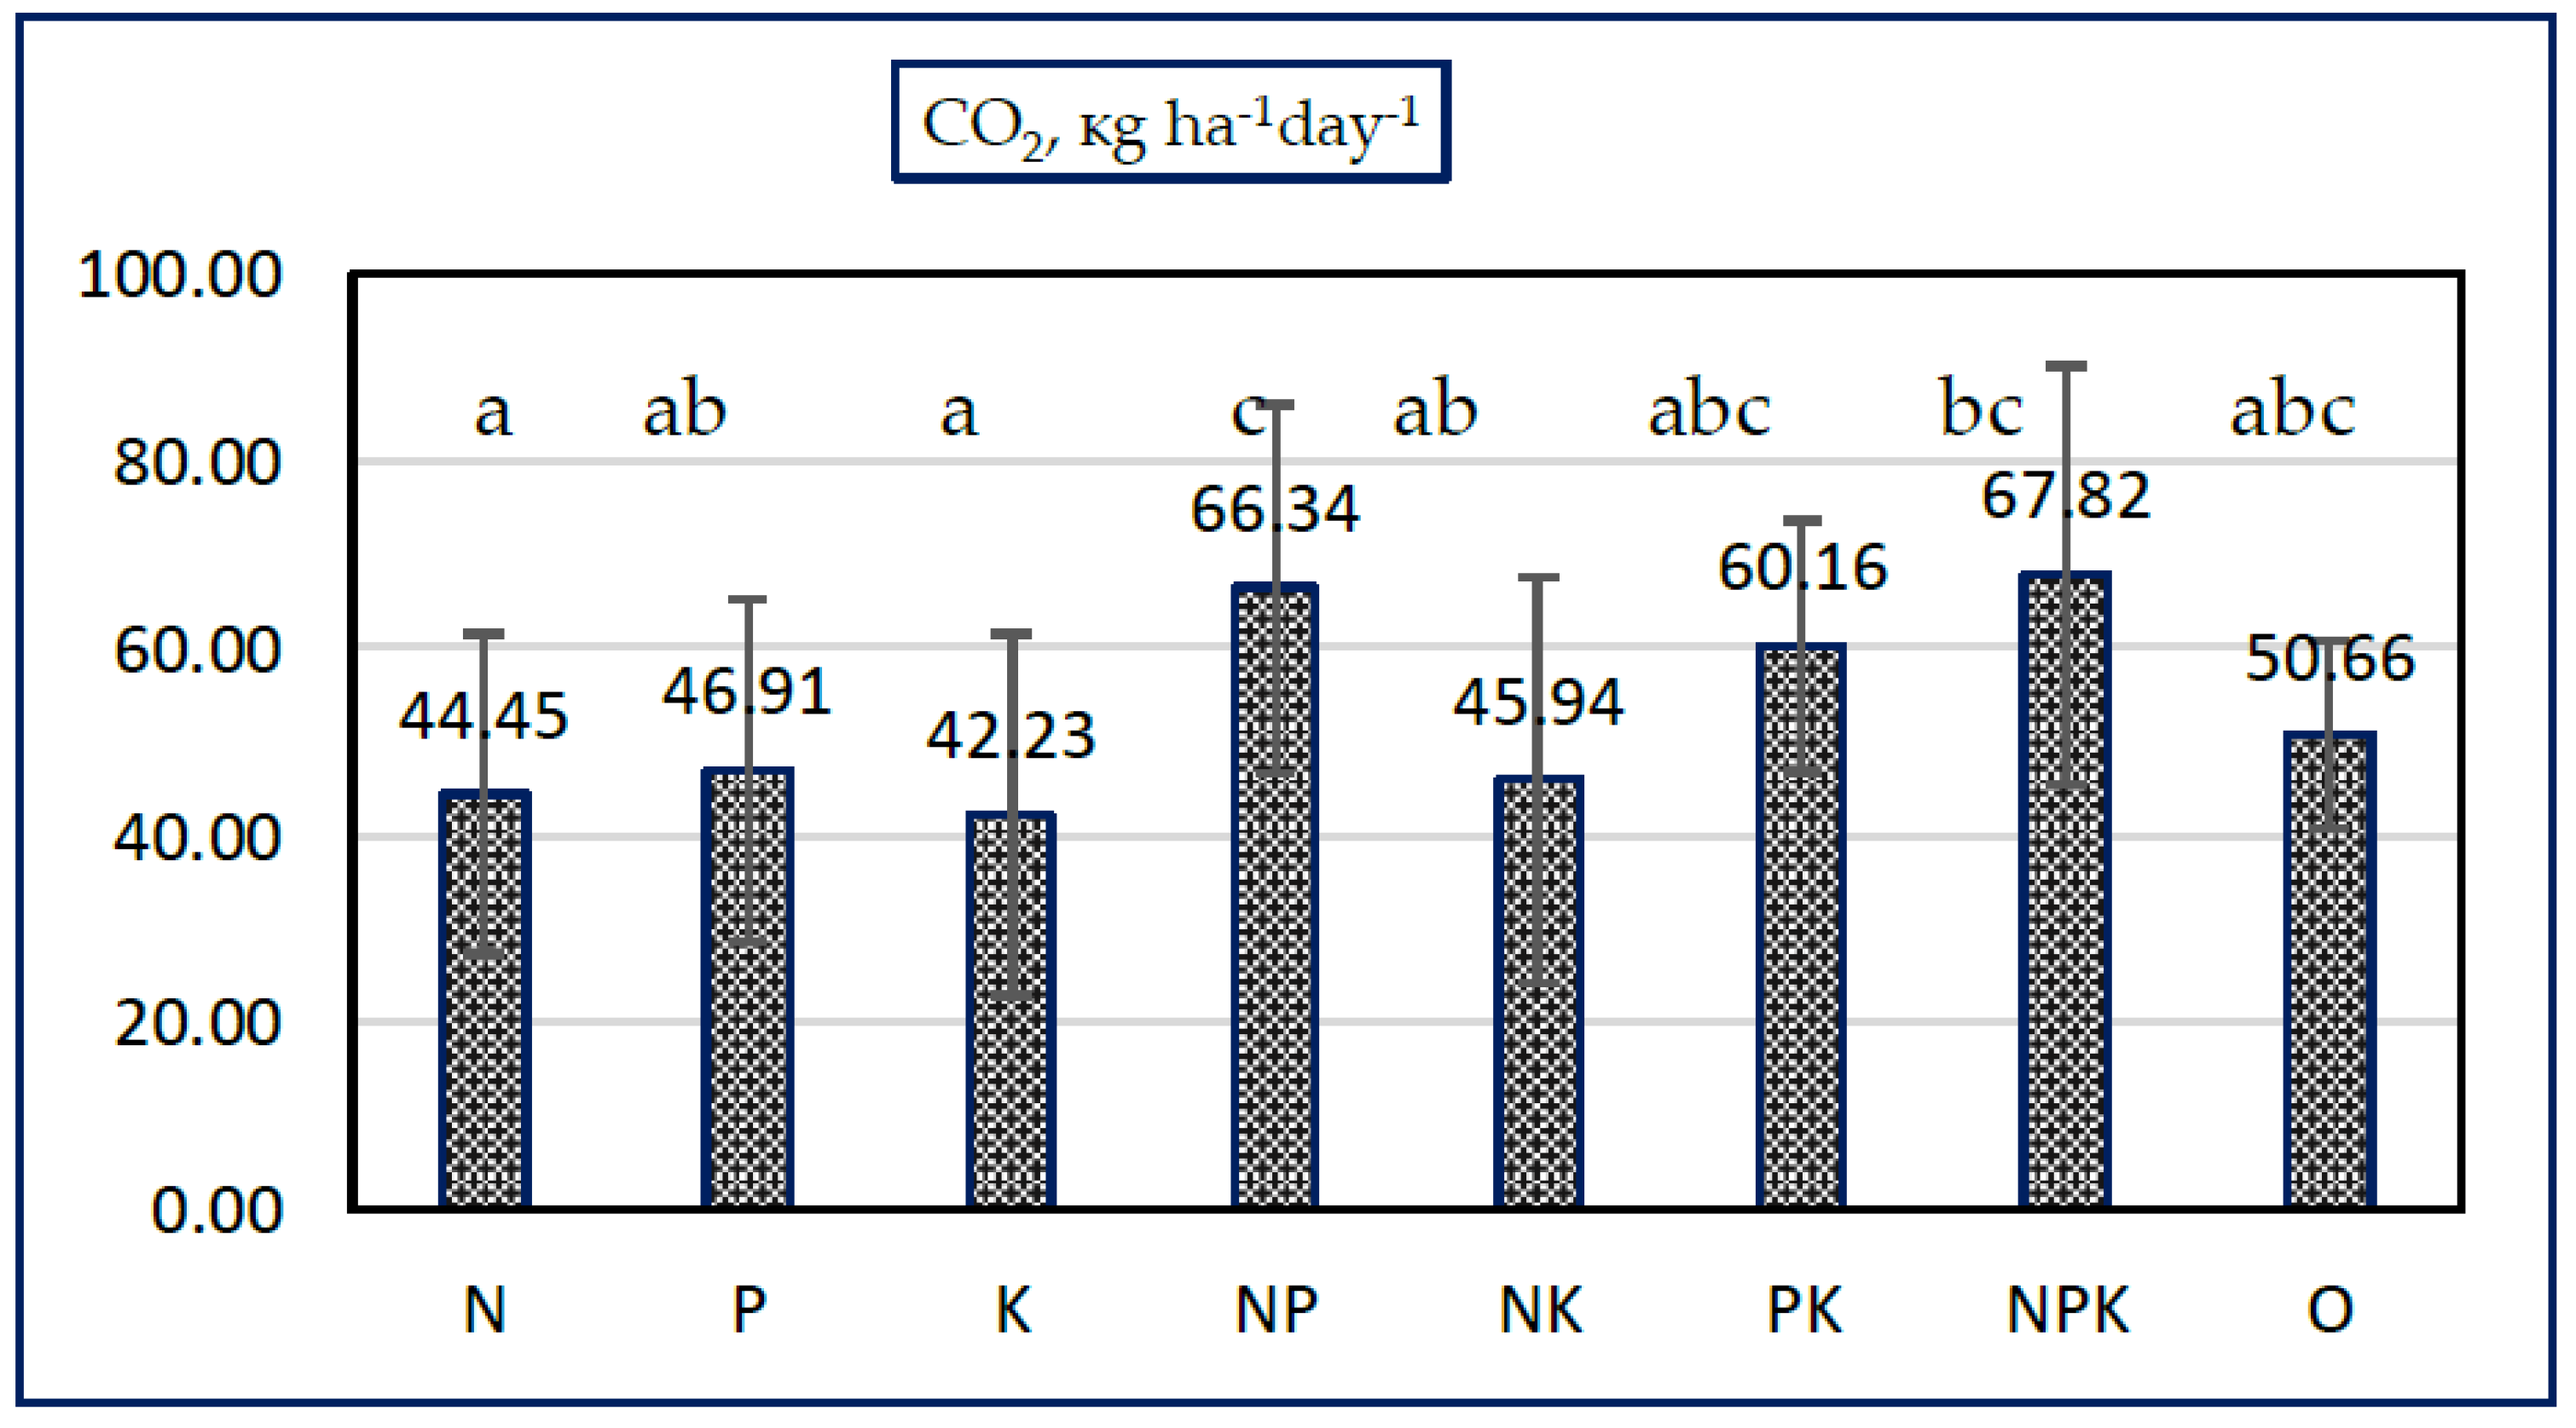
Figure 5.
Biplot of the first two components in the analysis carried out on a dataset including: CO2 emissions (кg ha-1day-1), mineral N (N-NO3, N-NH4) (mg kg-1), P- available P2O5 (mg 100g-1), K- available K2O (mg 100g-1), Cmic (mg kg-1).
Figure 5.
Biplot of the first two components in the analysis carried out on a dataset including: CO2 emissions (кg ha-1day-1), mineral N (N-NO3, N-NH4) (mg kg-1), P- available P2O5 (mg 100g-1), K- available K2O (mg 100g-1), Cmic (mg kg-1).
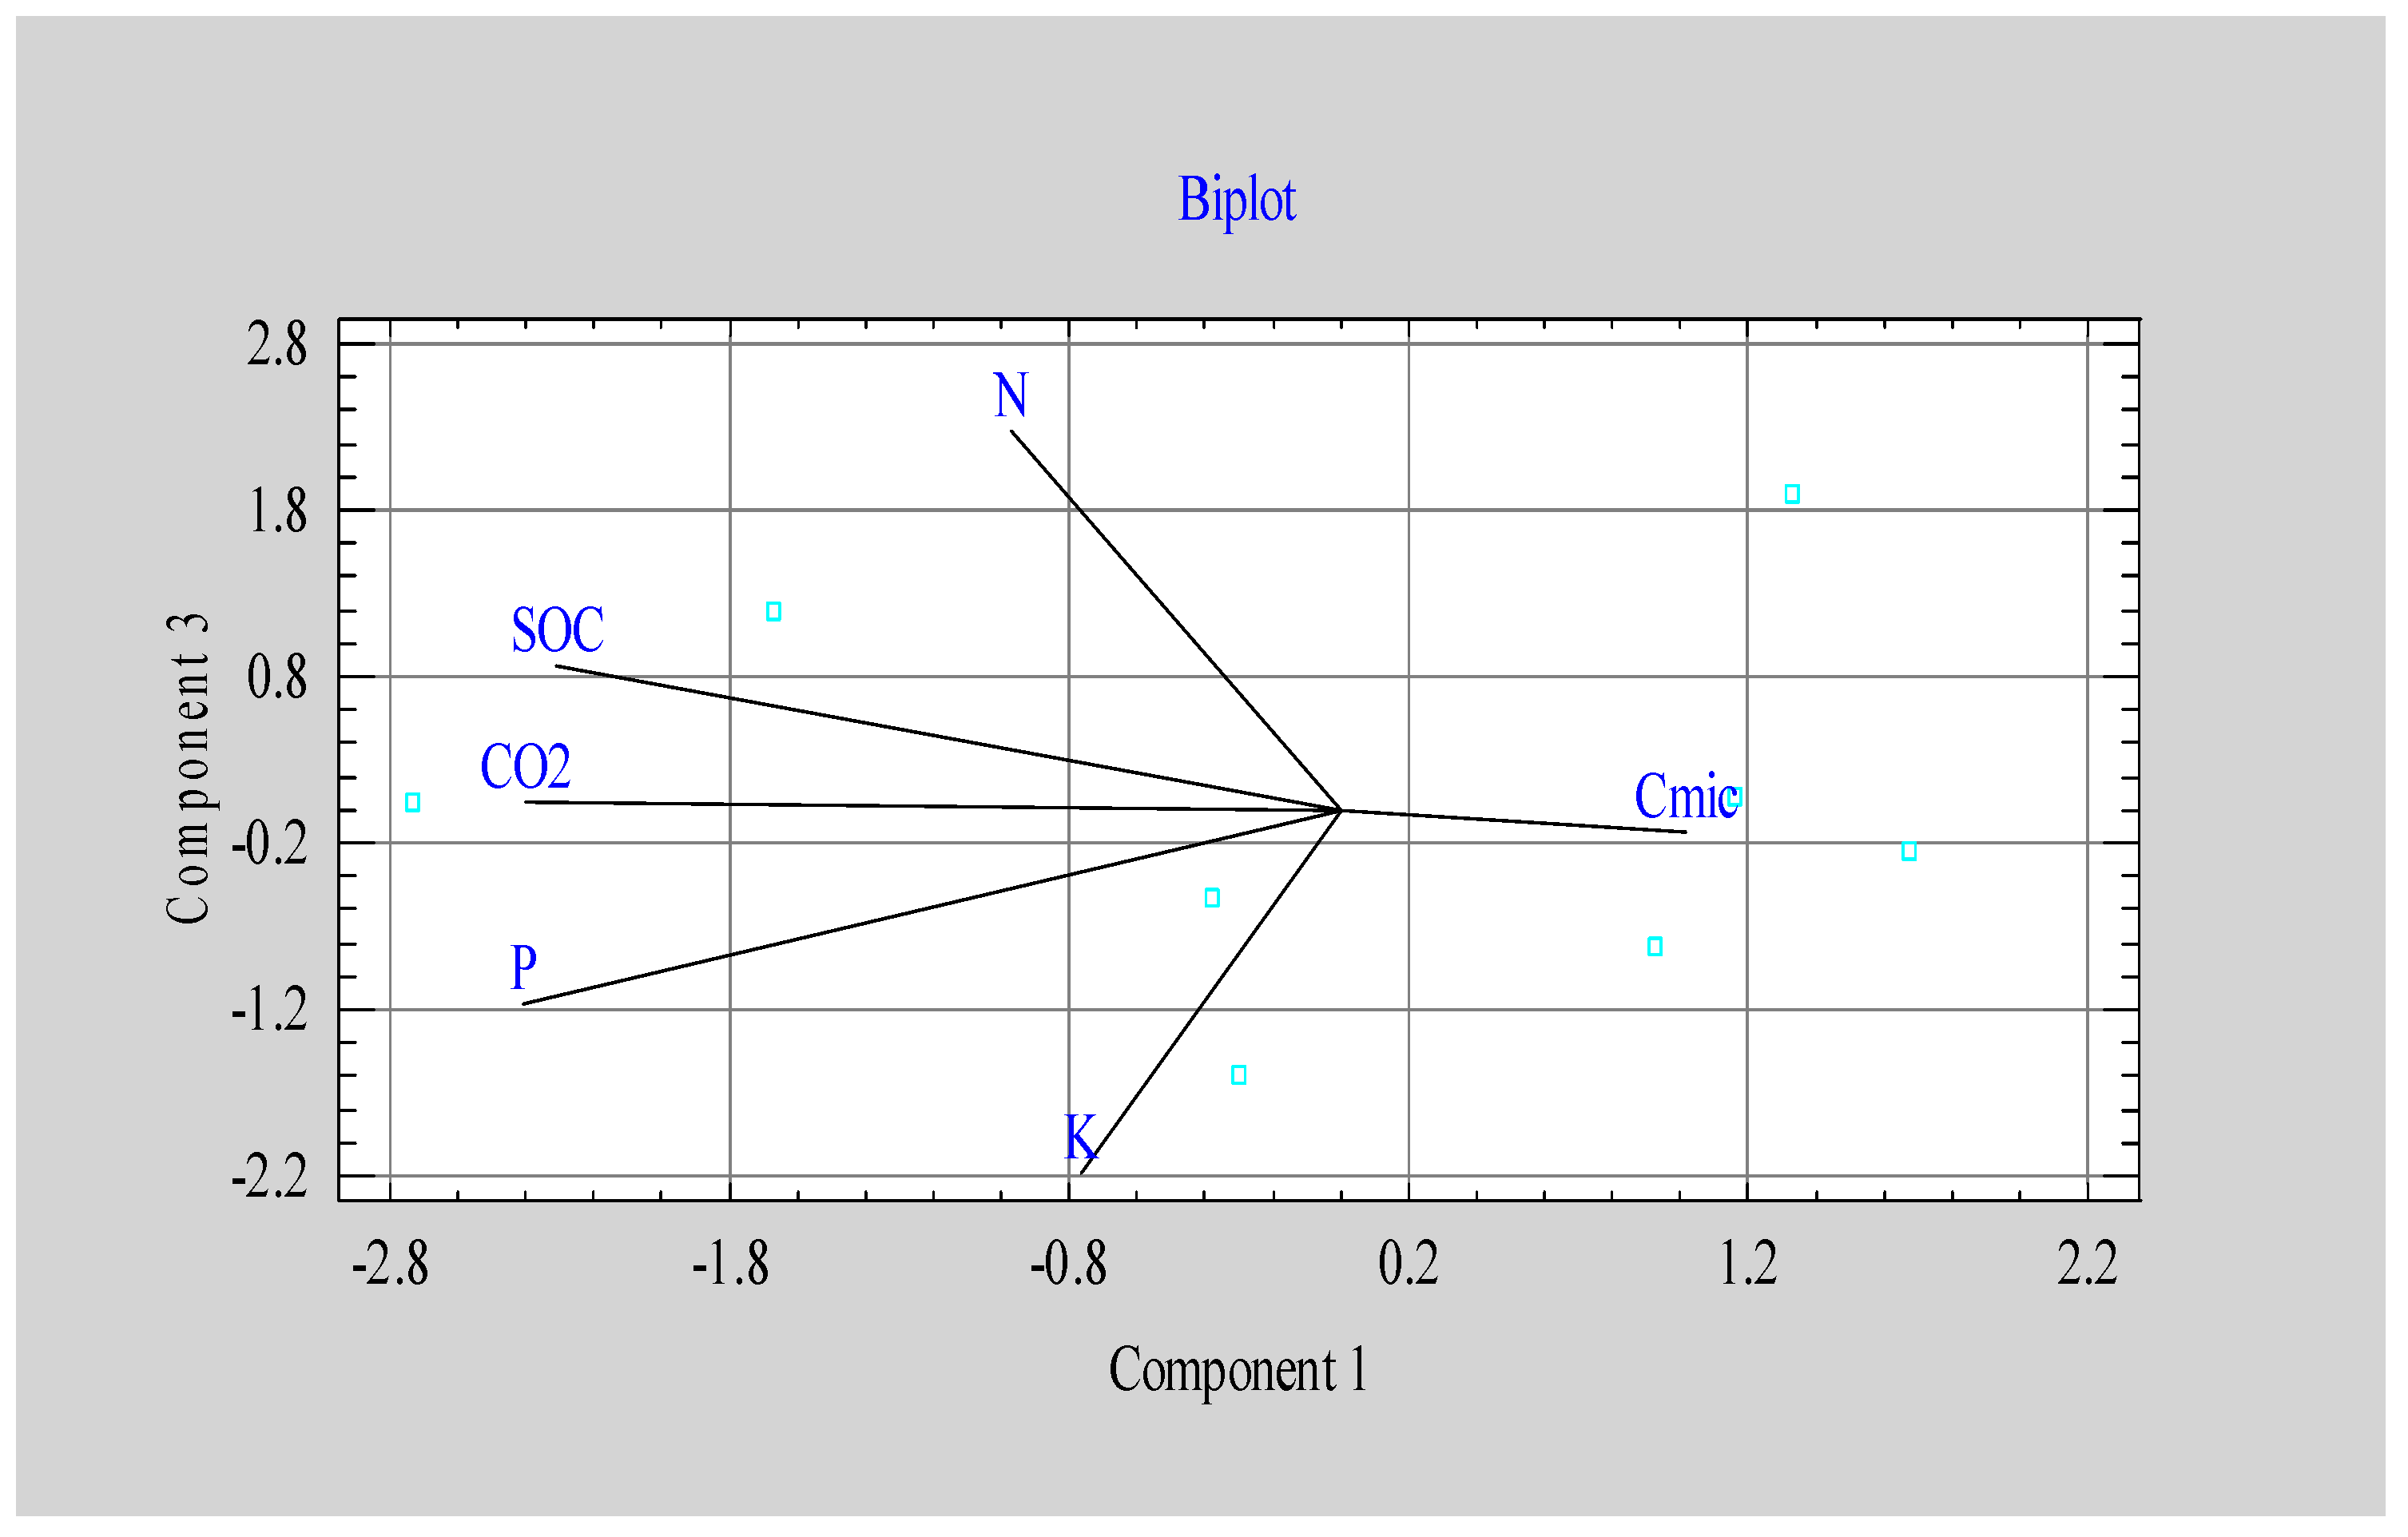
Figure 6.
Number of AMM- ammonifying bacteria (CFU x 106 g-1), NUTIL- nitrogen utilizing bacteria (CFU x 106 g-1), NFIX-nitrogen fixing bacteria, (CFU x 106 g-1), NITR-nitrifying bacteria (CFU x 106 g-1).
Figure 6.
Number of AMM- ammonifying bacteria (CFU x 106 g-1), NUTIL- nitrogen utilizing bacteria (CFU x 106 g-1), NFIX-nitrogen fixing bacteria, (CFU x 106 g-1), NITR-nitrifying bacteria (CFU x 106 g-1).
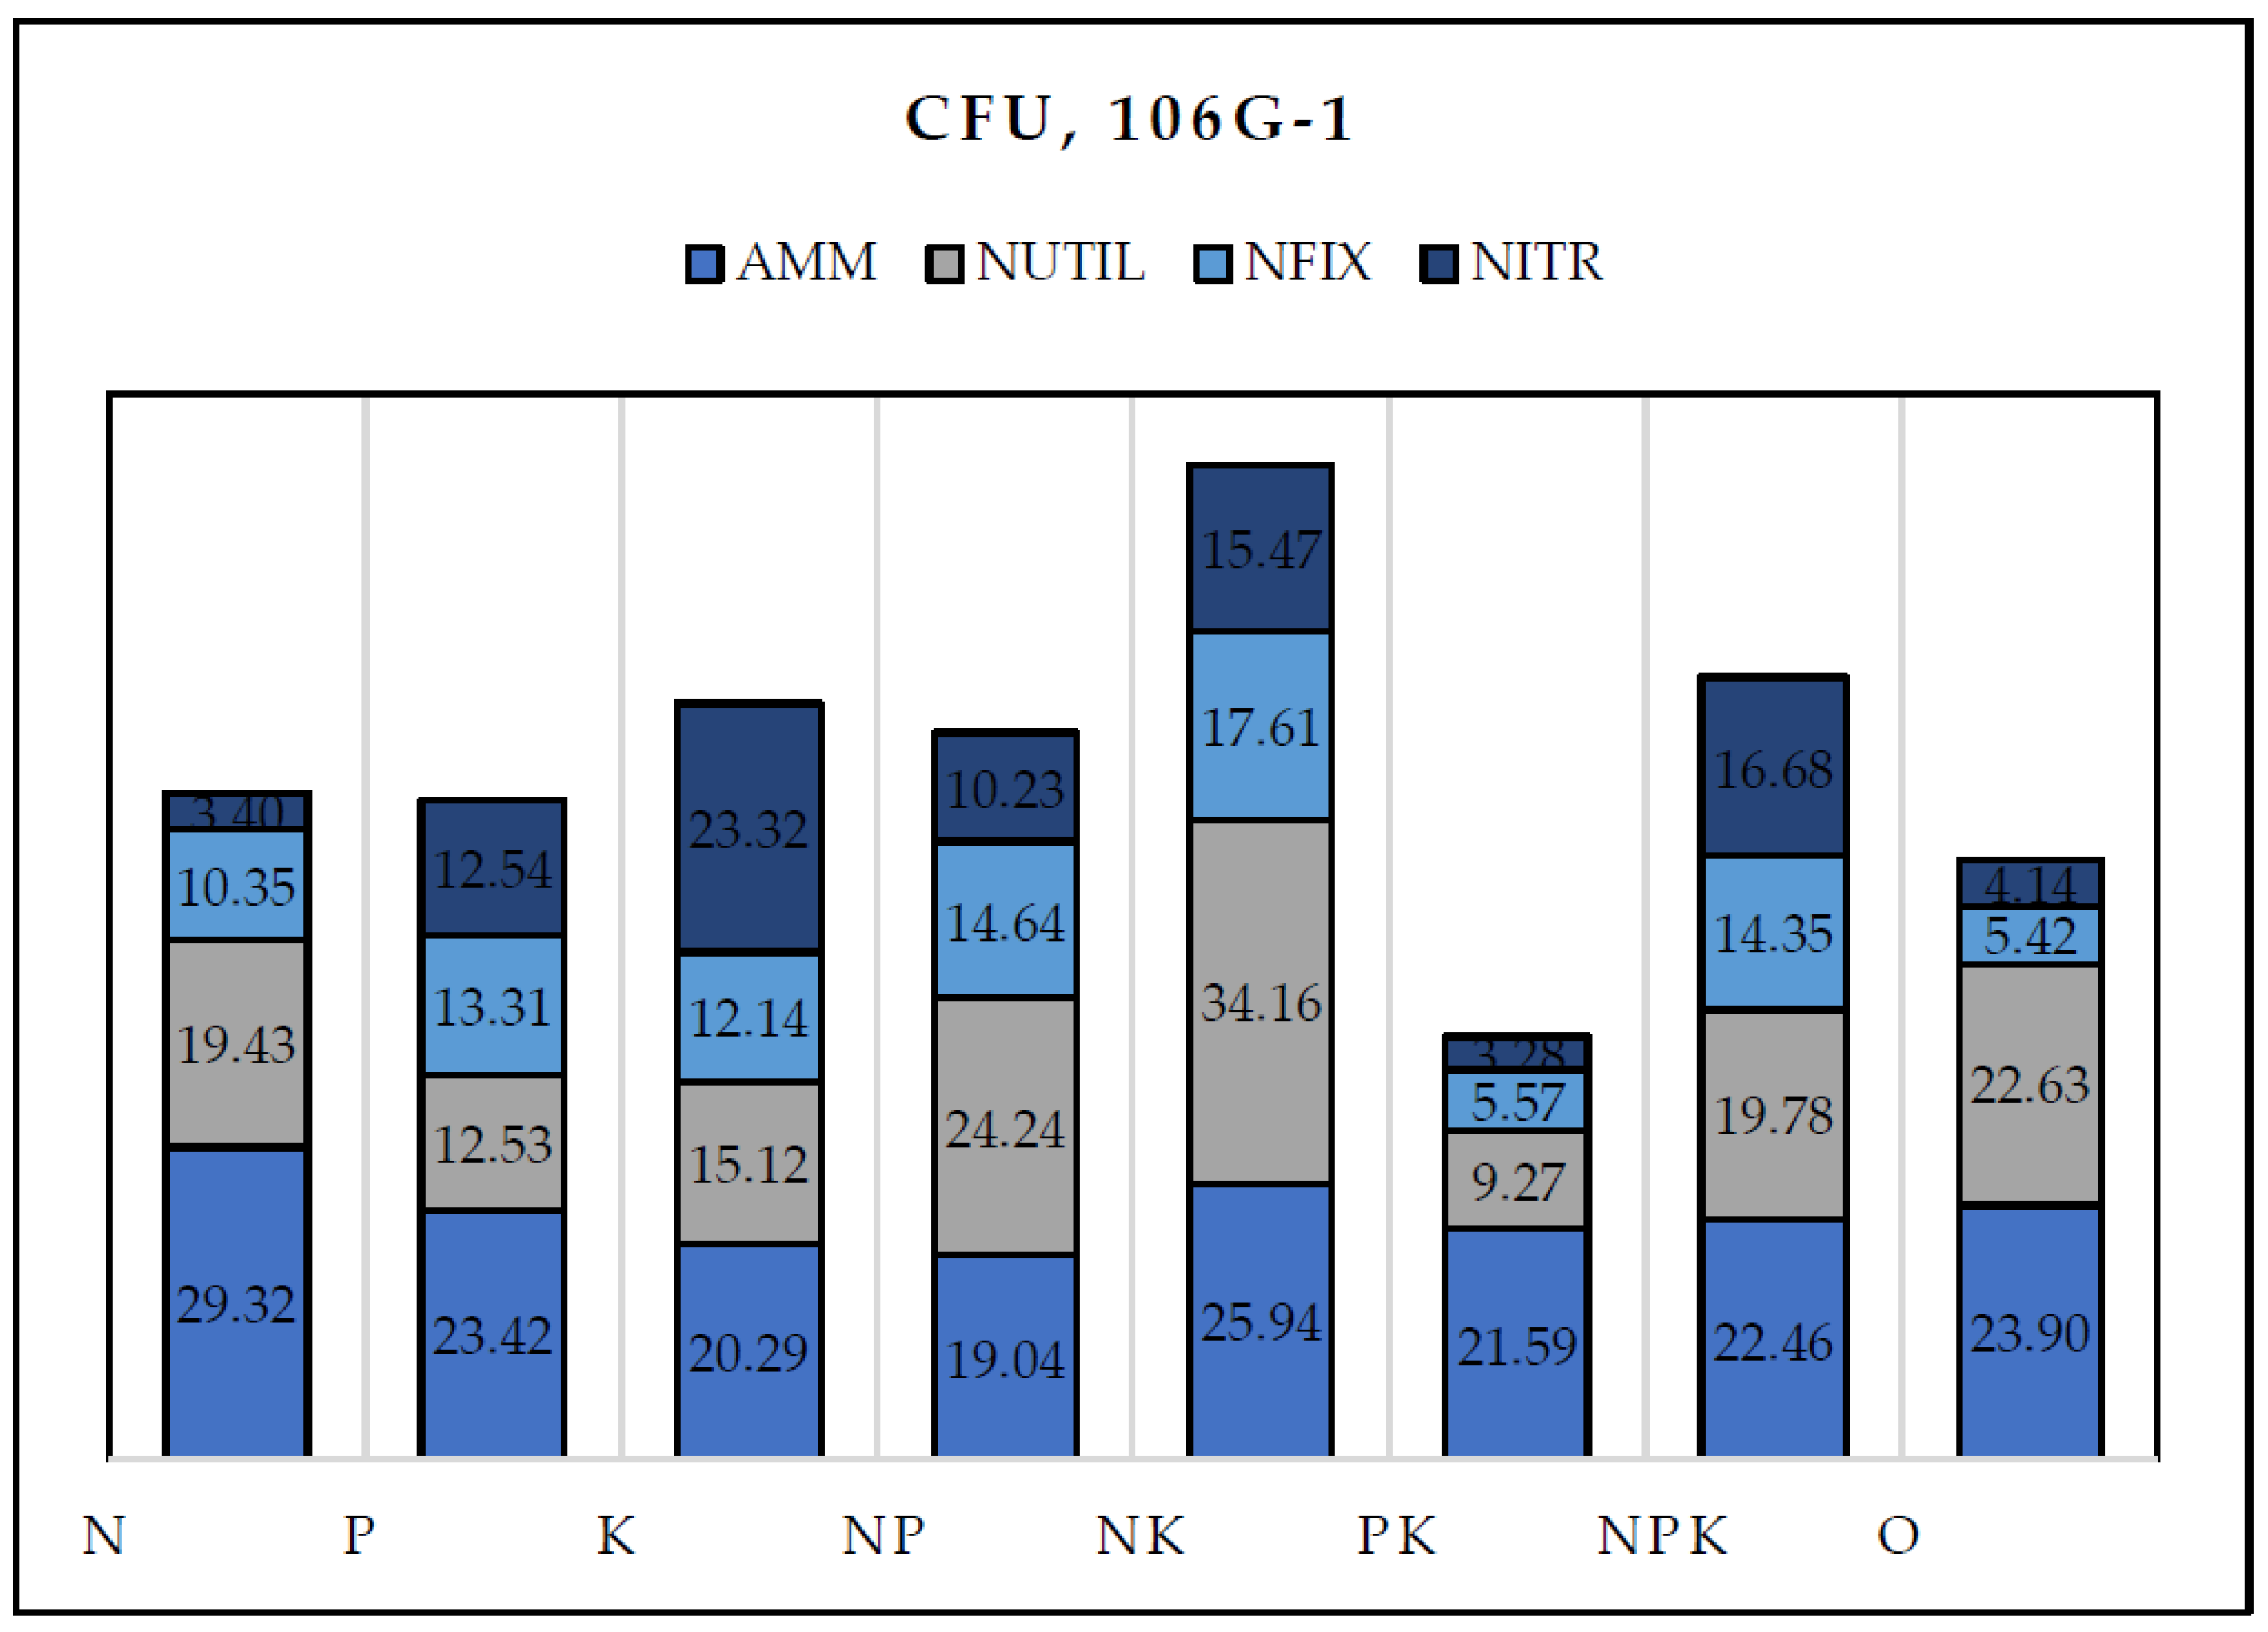
Figure 7.
Biplot of the first two components in the analysis carried out on a dataset including: N (N-NO3, N-NH4) (mg kg-1), P- available P2O5 (mg 100g-1), K- available K2O (mg 100g-1), AMM- ammonifying bacteria (CFU x 106 g-1), NUTIL- nitrogen utilizing bacteria (CFU x 106 g-1), NFIX-nitrogen fixing bacteria, (CFU x 106 g-1), NITR-nitrifying bacteria (CFU x 106 g-1), ACT-actinomycetes (CFU x 106 g-1), FUNGI-microscopic fungi CFU x 106 g-1).
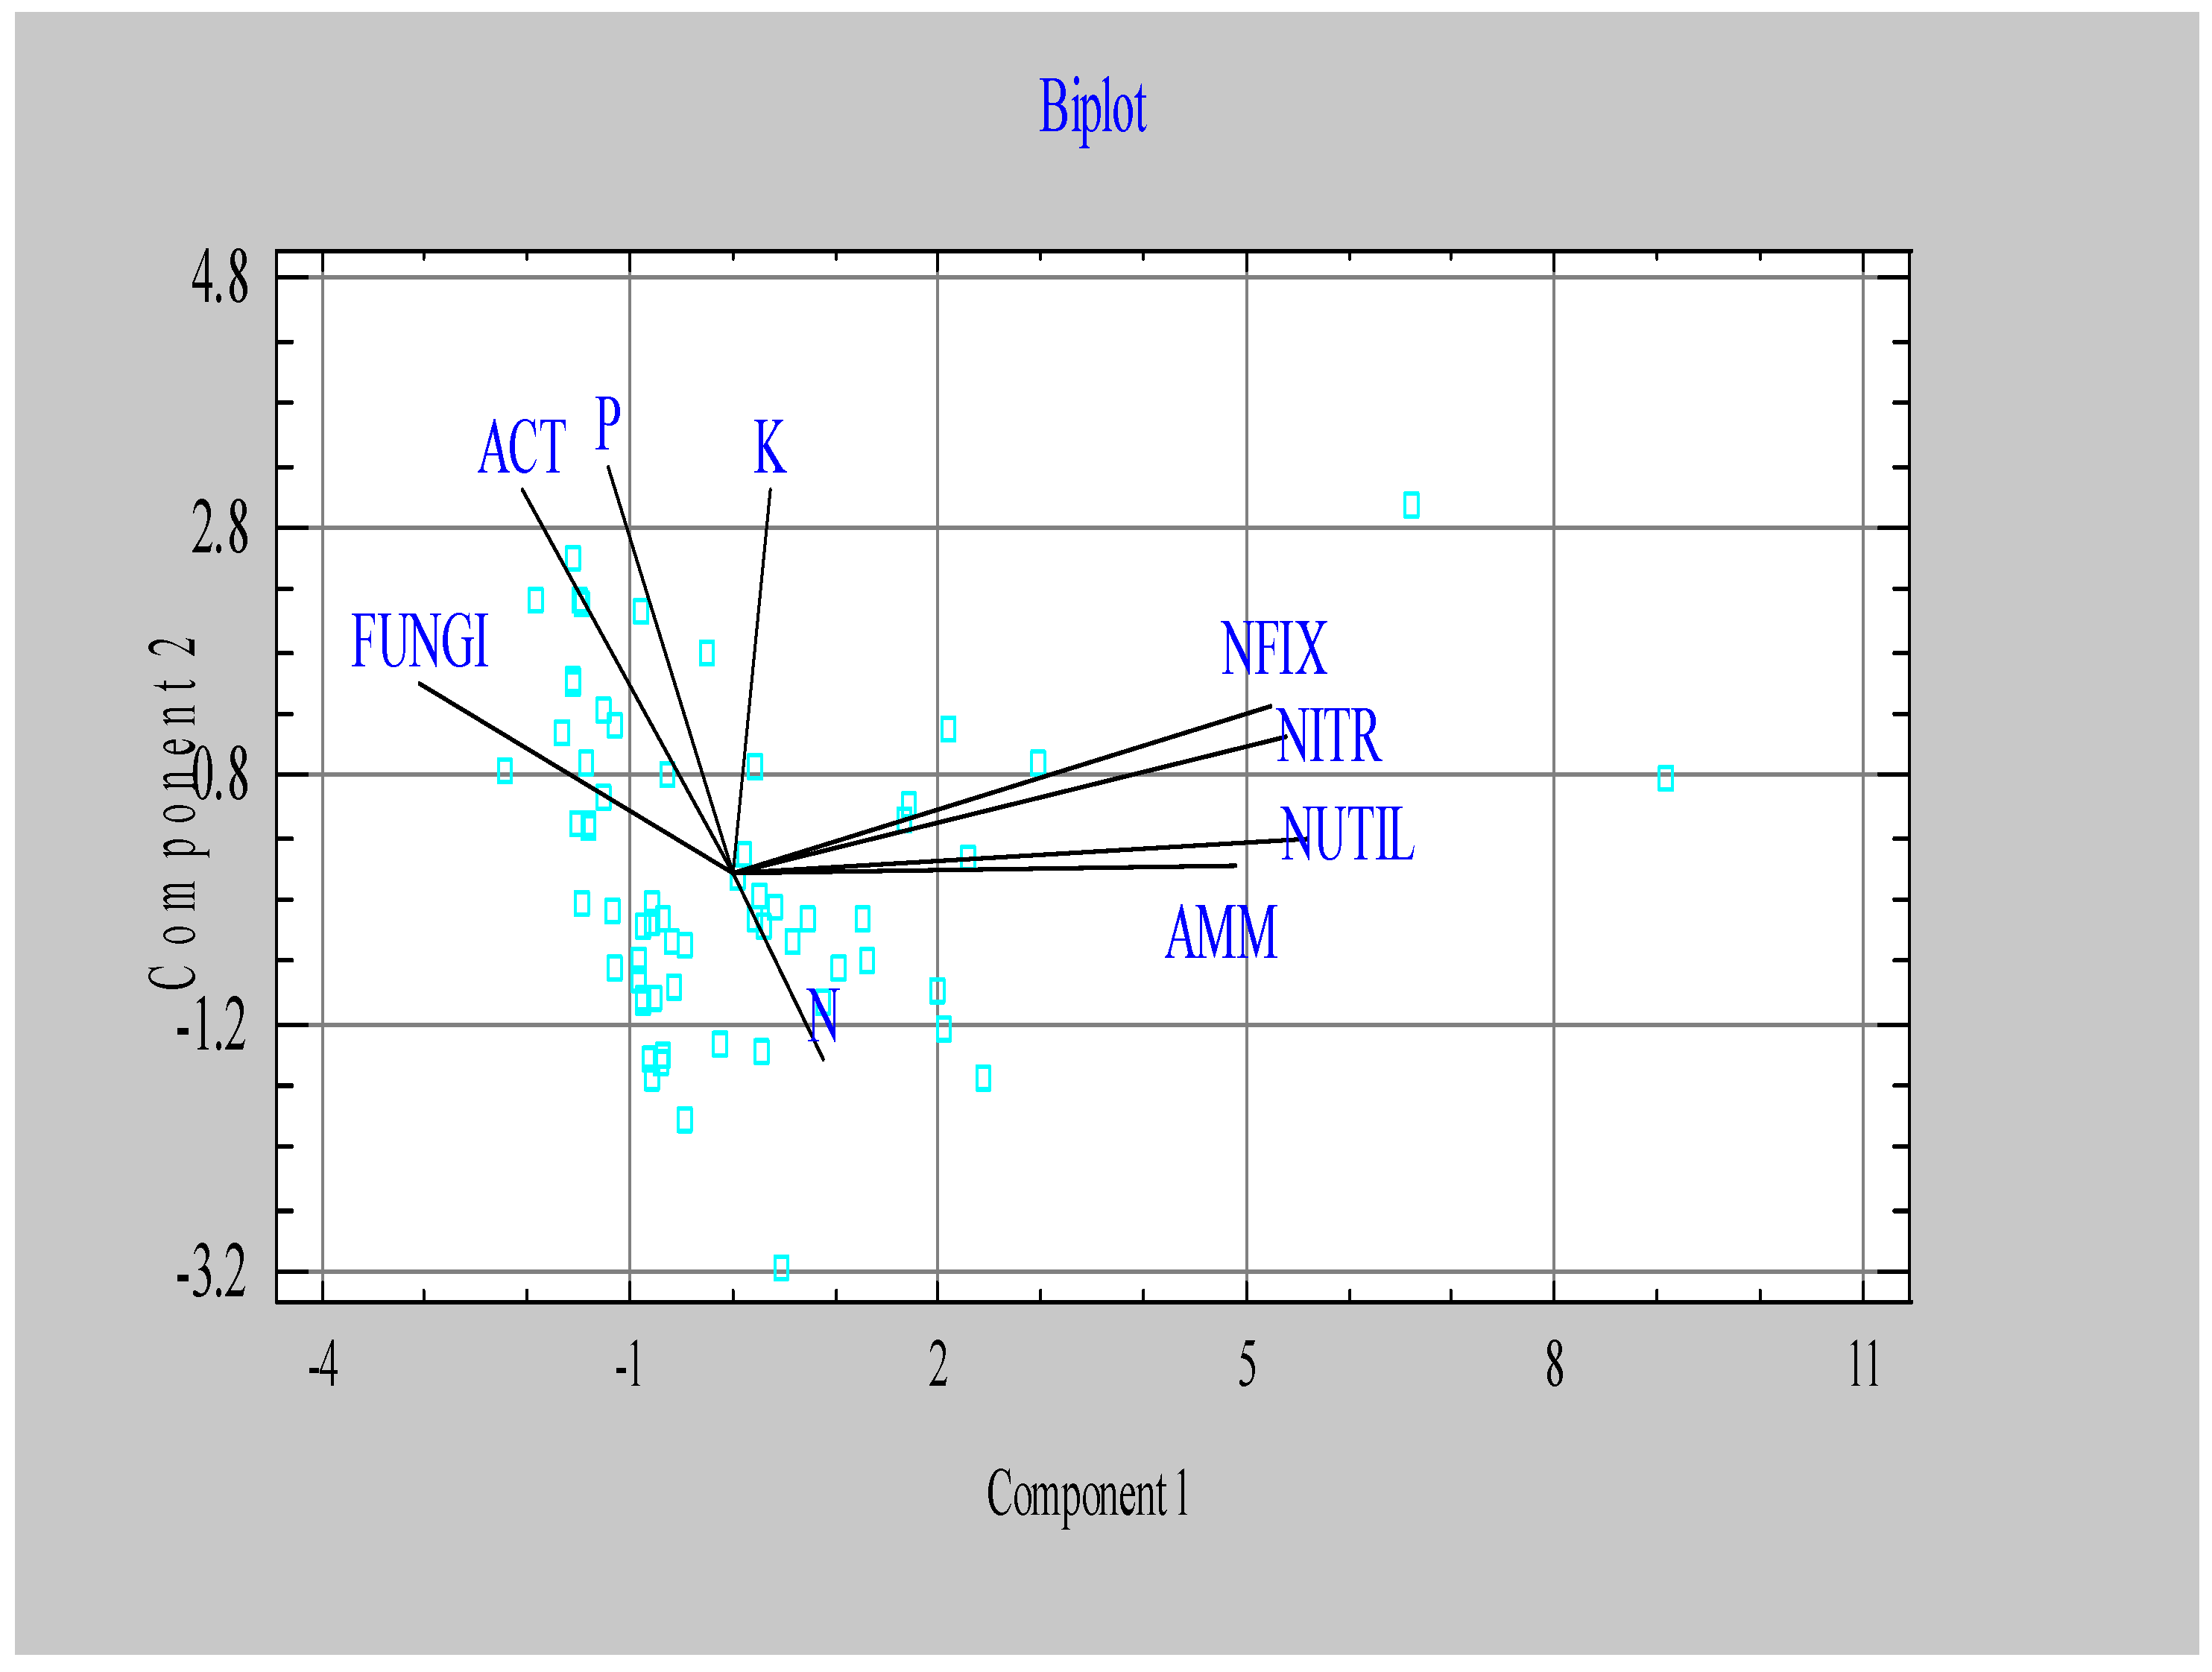
Figure 8.
Biplot of the first two components in the analysis carried out on a dataset including: CO2 emissions (кg ha-1day-1)AMM- ammonifying bacteria (CFU x 106 g-1), NUTIL- nitrogen utilizing bacteria (CFU x 106 g-1), NFIX-nitrogen fixing bacteria, (CFU x 106 g-1), NITR-nitrifying bacteria (CFU x 106 g-1), ACT-actinomycetes (CFU x 106 g-1), FUNGI-microscopic fungi CFU x 106 g-1).
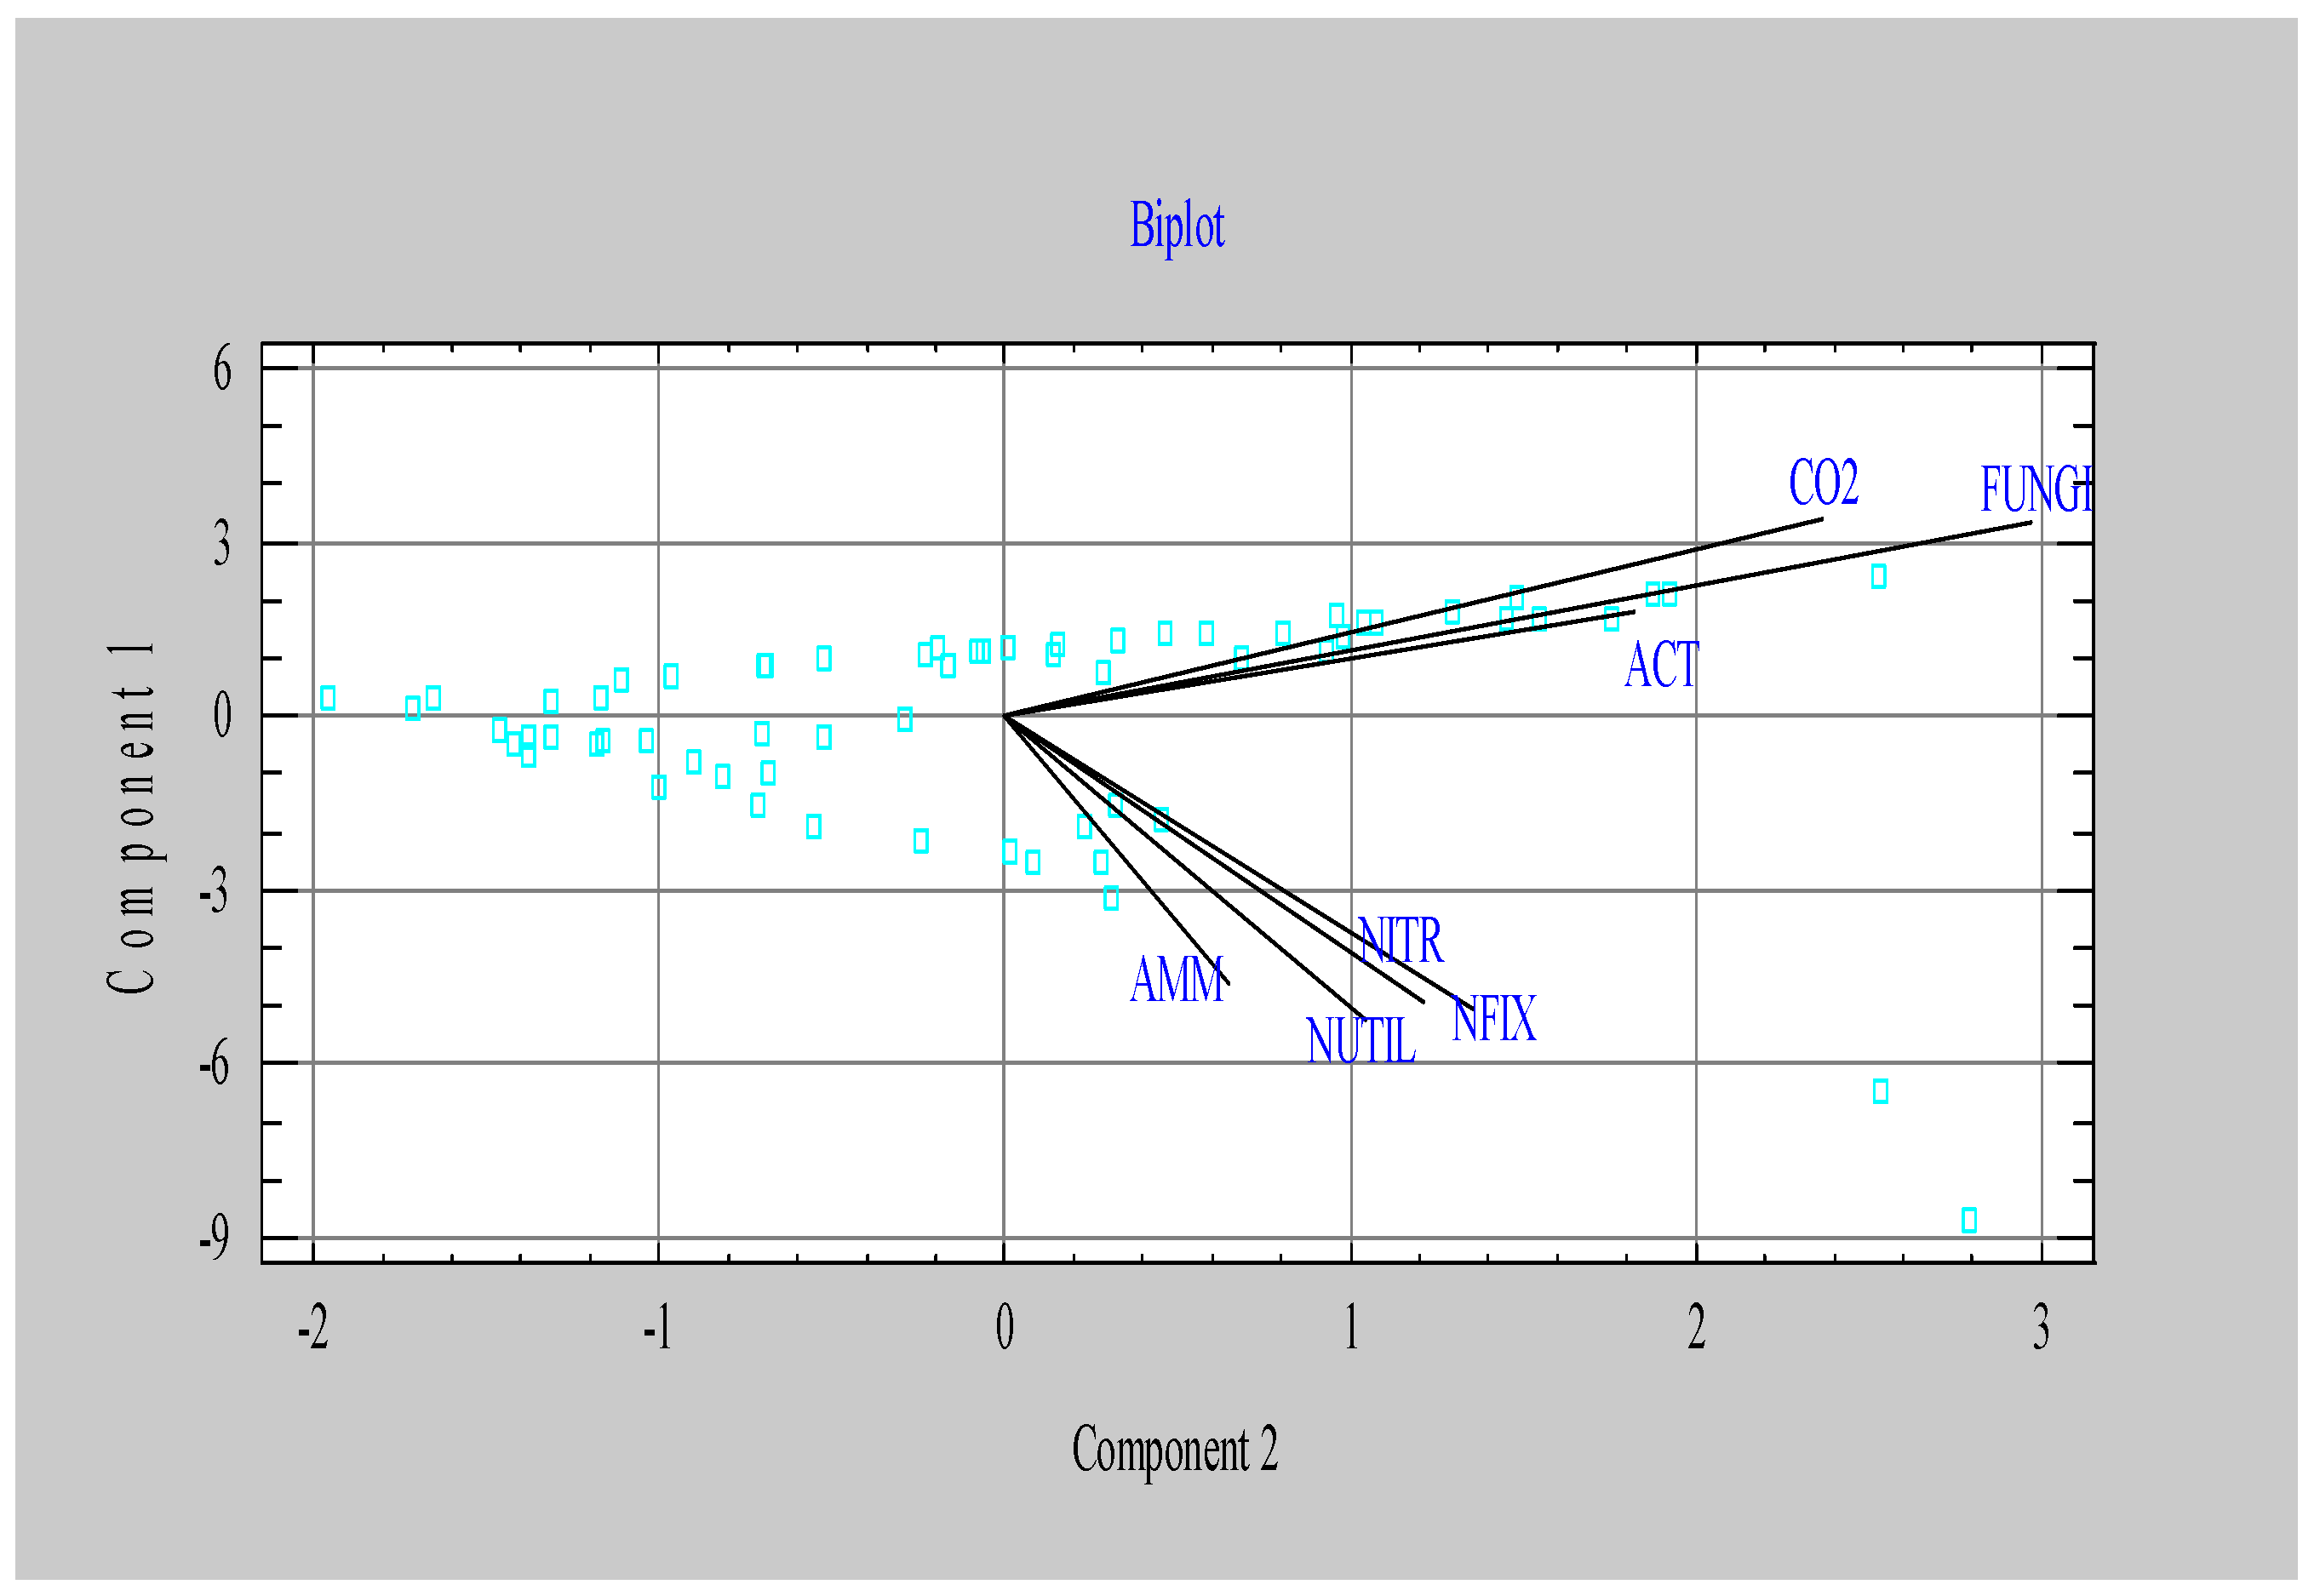
Table 1.
Textural fractions in the humus horizons of Luvic Chernozem under grass, IZ "Obratzov Chiflik".
Table 1.
Textural fractions in the humus horizons of Luvic Chernozem under grass, IZ "Obratzov Chiflik".
| Soil layer | Fractions according to FAO (2006), % | USDA | Texture class | ||
|---|---|---|---|---|---|
| cm | Sand 2-0.063 mm |
Silt 0.063-0.002 mm |
Clay <0.002 mm |
Sand 2-0.05 mm |
|
| 0-5 | 5,7 | 65,5 | 28,8 | 8,1 | SiCL |
| 10-15 | 4,0 | 65,6 | 30,3 | 7,5 | SiCL |
| 15-20 | 4,4 | 65,1 | 30,4 | 7,5 | SiCL |
Table 2.
Analysis of variance by controlling factors (treatment, season, crop) on mineral N (N-NO3, N-NH4) (mg kg-1), available P2O5 (mg 100g-1), available K2O (mg 100g-1), EC (µS cm-1), pH, SOC (%), Cmic (mg kg-1).
Table 2.
Analysis of variance by controlling factors (treatment, season, crop) on mineral N (N-NO3, N-NH4) (mg kg-1), available P2O5 (mg 100g-1), available K2O (mg 100g-1), EC (µS cm-1), pH, SOC (%), Cmic (mg kg-1).
| Treatment | N (N-NO3, N-NH4) | P2O5 | K2O | EC | pH | SOC | Cmic | |||||||
|---|---|---|---|---|---|---|---|---|---|---|---|---|---|---|
| N | 121.74 d | 15.97 a | 27.13 a | 90.43 c | 5.44 ab | 1.22 bc | 300.9 bc | |||||||
| P | 28.88 ab | 35.21 c | 34.09 b | 29.13 a | 5.90 d | 1.34 cd | 274.3 abc | |||||||
| K | 28.81 ab | 21.02 ab | 42.1 c | 29.92 ab | 5.89 cd | 1.24 bc | 304.0 bc | |||||||
| NP | 83.00 bcd | 27.58 bc | 29.74 ab | 46.79 ab | 5.44 ab | 1.43 d | 245.2 ab | |||||||
| NK | 90.06 cd | 16.39 a | 43.95 c | 56.39 abc | 5.30 a | 1.25 bc | 343.8 c | |||||||
| PK | 36.74 abc | 31.83 c | 46.17 c | 39.01 ab | 5.66 bc | 1.18 ab | 303.3 bc | |||||||
| NPK | 121.29 d | 37.53c | 45.83 c | 70.54 bc | 5.42 a | 1.42 d | 263.8 abc | |||||||
| 0 | 21.92 a | 17.11 a | 31.23 ab | 25.10 a | 5.82 cd | 1.05 a | 209.1 a | |||||||
| ANOVA factors | F ratio |
P value |
F ratio |
P value | F ratio | P value | F ratio | P value | F ratio | P value |
F ratio |
P value |
F ratio |
P value |
| Treatment | 4.36 | 0.00007 | 5.77 | 0.0000 | 11.66 | 0.0000 | 2.54 | 0.025 | 8.02 | 0.000 | 5.94 | 0.0000 | 2.11 | 0.059 |
| Season | NS | NS | NS | NS | NS | NS | 7.43 | 0.009 | 19.47 | 0.0001 | NS | NS | 22.40 | 0.000 |
| Crop | 6.86 | 0.0006 | 9.66 | 0.0000 | 2.23 | 0.095 | 3.51 | 0.021 | 6.39 | 0.0009 | NS | NS | NS | NS |
Table 3.
Variable loadings of the first three components of principal components analysis. Soil mineral N (N-NO3, N-NH4) (mg kg-1), P- available P2O5 (mg 100g-1), K- available K2O (mg 100g-1), EC (µS cm-1), pH, SOC (%), Cmic (mg kg-1).
Table 3.
Variable loadings of the first three components of principal components analysis. Soil mineral N (N-NO3, N-NH4) (mg kg-1), P- available P2O5 (mg 100g-1), K- available K2O (mg 100g-1), EC (µS cm-1), pH, SOC (%), Cmic (mg kg-1).
| Component 1 | Component 2 | Component 3 | |
|---|---|---|---|
| Eigenvalue | 2.23 | 1.35 | 1.27 |
| Percent of variance | 31.83 | 19.26 | 18.20 |
| N | 0.632 | 0.072 | -0.028 |
| P | -0.070 | 0.402 | -0.522 |
| K | -0.126 | 0.581 | 0.230 |
| pH | -0.423 | -0.416 | -0.321 |
| EC | 0.611 | -0.118 | -0.045 |
| SOC | 0.087 | 0.261 | -0.710 |
| Cmic | 0.145 | -0.490 | -0.255 |
Table 5.
Analysis of variance by controlling factors on ammonifying bacteria (CFU x 106 g-1), nitrogen utilizing bacteria (CFU x 106 g-1), nitrogen fixing bacteria, (CFU x 106 g-1), nitrifying bacteria (CFU x 106 g-1), actinomycetes (CFU x 106 g-1), microscopic fungi CFU x 106 g-1).
Table 5.
Analysis of variance by controlling factors on ammonifying bacteria (CFU x 106 g-1), nitrogen utilizing bacteria (CFU x 106 g-1), nitrogen fixing bacteria, (CFU x 106 g-1), nitrifying bacteria (CFU x 106 g-1), actinomycetes (CFU x 106 g-1), microscopic fungi CFU x 106 g-1).
| Treatment | Ammonifying bacteria | Nitrogen fixing bacteria |
Nitrogen utilizing bacteria | Nitrifying bacteria | Actinomycetes | Microscopic fungi | ||||||||||||
|---|---|---|---|---|---|---|---|---|---|---|---|---|---|---|---|---|---|---|
| N | 29.32b | ±27.3 | 10.35ab | ±15.1 | 19.43abc | ±26.5 | 3.40a | ±5.9 | 0.51ab | ±0.3 | 0.061abc | ±0.03 | ||||||
| P | 23.42a | ±13.9 | 13.31ab | ±19.4 | 12.53ab | ±14.7 | 12.54abc | ±16.7 | 0.44a | ±0.4 | 0.043a | ±0.06 | ||||||
| K | 20.29a | ±20.1 | 12.14ab | ±19.7 | 15.12ab | ±19.6 | 23.32c | ±26.6 | 0.55ab | ±0.5 | 0.046ab | ±0.05 | ||||||
| NP | 19.04a | ±22.6 | 14.64ab | ±16.7 | 24.24bcd | ±29.2 | 10.23ab | ±14.1 | 0.40a | ±0.3 | 0.069c | ±0.07 | ||||||
| NK | 25.94a | ±32.6 | 17.61a | ±44.1 | 34.16cd | ±72.7 | 15.47bc | ±39.3 | 0.48ab | ±0.5 | 0.061bc | ±0.06 | ||||||
| PK | 21.59a | ±32.3 | 5.57 | ±8.2 | 9.27ab | ±21.2 | 3.28a | ±5.6 | 0.66b | ±0.5 | 0.047ab | ±0.05 | ||||||
| NPK | 22.46a | ±27.8 | 14.35a | ±31.9 | 19.78a | ±46.0 | 16.68a | ±41.3 | 0.41a | ±0.3 | 0.050ab | ±0.04 | ||||||
| 0 | 23.90b | ±32.3 | 5.42ab | ±4.4 | 22.63d | ±33.1 | 4.14bc | ±5.0 | 0.32a | ±0.3 | 0.044ab | ±0.04 | ||||||
| ANOVA factors |
F ratio |
P value |
F ratio |
P value |
F ratio |
P value |
F ratio |
P value |
F ratio |
P value |
F ratio |
P value |
||||||
| Treatment | 1.45 | 0.186 | 1.25 | 0.277 | 3.65 | 0.001 | 3.25 | 0.003 | 1.79 | 0.092 | 2.32 | 0.0276 | ||||||
| Season | 67.76 | 0.000 | 41.01 | 0.000 | 73.28 | 0.000 | 49.96 | 0.000 | 35.96 | 0.000 | 265.27 | 0.000 | ||||||
| Crop | 4.77 | 0.003 | 2.42 | 0.068 | 2.34 | 0.074 | 2.97 | 0.033 | 5.02 | 0.002 | 13.61 | 0.000 | ||||||
Table 6.
Variable loadings of the first three components of principal components analysis of dataset including: soil mineral N (N-NO3, N-NH4) (mg kg-1), P- available P2O5 (mg 100g-1), K- available K2O (mg 100g-1), AMM- ammonifying bacteria (CFU x 106 g-1), NUTIL- nitrogen utilizing bacteria (CFU x 106 g-1), NFIX-nitrogen fixing bacteria, (CFU x 106 g-1), NITR-nitrifying bacteria (CFU x 106 g-1), ACT-actinomycetes (CFU x 106 g-1), FUNGI-microscopic fungi CFU x 106 g-1).
| Component 1 | Component 2 | Component 3 | |
|---|---|---|---|
| Eigenvalue | 5.54 | 1.53 | 1.06 |
| Percent of variance | 39.29 | 17.00 | 11.75 |
| N | 0.078 | -0.244 | 0.724 |
| P | -0.107 | 0.533 | 0.377 |
| K | 0.033 | 0.505 | 0.402 |
| ACT | -0.181 | 0.504 | -0.326 |
| FUNGI | -0.271 | 0.249 | -0.179 |
| AMM | 0.433 | 0.012 | -0.090 |
| NITR | 0.464 | 0.223 | 0.005 |
| NFIX | 0.476 | 0.180 | -0.059 |
| NUTIL | 0.496 | 0.049 | -0.146 |
Table 7.
Variable loadings of the first three components of principal components analysis of dataset including: CO2 emissions (kg ha-1day-1), AMM- ammonifying bacteria (CFU x 106 g-1), NUTIL- nitrogen utilizing bacteria (CFU x 106 g-1), NFIX-nitrogen fixing bacteria, (CFU x 106 g-1), NITR-nitrifying bacteria (CFU x 106 g-1), ACT-actinomycetes (CFU x 106 g-1), FUNGI-microscopic fungi CFU x 106 g-1).
| Component 1 | Component 2 | |
|---|---|---|
| Eigenvalue | 3.77 | 1.29 |
| Percent of variance | 53.81 | 18.40 |
| CO2 | 0.307 | 0.498 |
| NFIX | -0.450 | 0.285 |
| NITR | -0.441 | 0.255 |
| NUTIL | -0.470 | 0.220 |
| ACT | 0.161 | 0.384 |
| AMM | -0.415 | 0.137 |
| FUNGI | 0.298 | 0.626 |
Disclaimer/Publisher’s Note: The statements, opinions and data contained in all publications are solely those of the individual author(s) and contributor(s) and not of MDPI and/or the editor(s). MDPI and/or the editor(s) disclaim responsibility for any injury to people or property resulting from any ideas, methods, instructions or products referred to in the content. |
© 2025 by the authors. Licensee MDPI, Basel, Switzerland. This article is an open access article distributed under the terms and conditions of the Creative Commons Attribution (CC BY) license (http://creativecommons.org/licenses/by/4.0/).
Copyright: This open access article is published under a Creative Commons CC BY 4.0 license, which permit the free download, distribution, and reuse, provided that the author and preprint are cited in any reuse.


