
Submitted:
30 December 2024
Posted:
31 December 2024
You are already at the latest version
Preprints on COVID-19 and SARS-CoV-2
Abstract
purpose: The study's goal was to investigate the phenomenon of organizational silence and its impact on the performance of faculty members at Al-Hussein Bin Talal University. The survey encompassed a total of 370 faculty members from different colleges within the university.Design/methodology/approach: A quantitative research design is suitable for gathering and examining data. Data can be captured using a cross-sectional design. Ensure that the sample encompasses a diverse array of academic subjects, ranks, and levels of experience. Gathering data: Surveys and questionnaires are viable tools for gathering information. Verified scales and measures can be utilized to evaluate the extent of organizational quiet and the level of organizational performance. The poll allows academics to articulate their thoughts regarding organizational silence and its underlying factors. Statistical analysis can be applied to survey data. Descriptive statistics provide a summary of the sample and important factors. An inferential statistic can be employed to examine the correlation between factors and the moderating influence of organizational silence on organizational performance. The results can then be used to make informed decisions and improve overall effectiveness.Findings: The results of the study's to raise senior management's awareness of the idea of organizational silence and its effects on organizational performance. Other recommendations include using participatory management, avoiding overly centralizing decision-making, and encouraging faculty members to voice their opinions, even if they differ from those of others. showing no fear and giving them the impression that management is interested in what they have to say. Practical and social implications: The study on organizational quiet and performance at Jordanian institutions advances organizational silence research. It sheds light on organizational silence in Jordanian universities, adding to current knowledge. Post-COVID-19, it can help explain organizational silence's causes, effects, and methods. Jordanian universities' organizational silence and performance may be affected by COVID-19's problems and potential. The relationship between organizational quiet and performance may be mediated and moderated. Leadership styles, organizational culture, and technological adaption may affect this relationship.
Keywords:
organizational silence
; organizational performance
; university
; post-COVID-19
Introduction
These organizations do not accept any viewpoints, even if they are true, because they consider them as a danger to their existence and interests and believe it is impossible to change organizational conditions. Unfavorable conditions and the administration's inaction have pushed them to accept the status quo. (Zainab and Zafar,2021) This acceptance maintains the status quo in these organizations, preventing growth. Lack of desire to confront the status quo may lead to long-term stagnation and decline.
Organizational silence refers to a situation in which workers in an organization choose not to speak up or express their ideas and suggestions. This can lead to a state of submission and acceptance of the status quo, as workers believe that their input will not make a difference and may result in negative criticism. Despite its negative effects on organizations, some organizations ignore or lack awareness of this issue. As a result, organizational stagnation occurs, with a lack of change and a reluctance to propose or adopt risky ideas. This perpetuates a cycle of inaction and hinders progress within the organization (Al-Qarni, 2015; Rayan et al., 2019).
Organizational performance is a manifestation of the organization's objectives and accomplishments. It is crucial because it facilitates the transition of work from individual efforts to collaborative teamwork, from disorganized processes to structured planning, and from unclear objectives to clear and defined goals (Qafah, 2018). Amidst the prevailing conditions, higher education institutions globally are encountering numerous challenges associated with the unfolding coronavirus epidemic. The term "2019" refers to the coronavirus outbreak.In addition to the detrimental consequences of organizational silence, such as weakened trust among employees due to a lack of communication, and employees feeling restricted in expressing their opinions, which hinders their independence and diminishes motivation, there are also negative effects on performanceThe research difficulty is the lack of clarity regarding the importance of this topic, as well as the limited focus on the causes of organizational silence among academics at the university and its impact on organizational performance (Zainab & Zafar, 2021).
Study problem and questions:
The workers are the heart of the administrative process. The organization cannot achieve its goals if it does not possess the manpower with the capabilities and specifications that qualify it to achieve them (Zainab & Zafar, 2021).Management practices at the time showed that there was a phenomenon called "organizational silence" in organizations that tried to silence people with good ideas and voices in management by telling them that they did not have sufficient experience and were not involved in the management of the organization (Nikolaou et al., 2015).
Lack of cooperation and trust among employees, as well as a high rate of staff turnover, will unavoidably have a negative impact on the performance of the organization, which will be reflected in higher costs and a lack of advancement. Additionally, an organization that does not follow the correct methods and procedures in its administrative operations will also inevitably have negative effects on performance. Low organizational participation leads to inefficiency, subpar performance, and unhappiness at work in the development and change processes. This results in poor productivity and low quality (Mohammed, 2018). This generates a scary organizational environment that makes employees feel anxious about their positions and reduces their sense of devotion to the company because of the negative repercussions of corporate silence regarding poor performance and a lack of love for work (Khawaldeh, 2017).
Organizational silence can lead to authoritarianism, organizational cynicism, organizational terrorism, and other negative outcomes. This can occur at all levels and in most organizations. It can also negatively impact people's mental health, which worsens organizational silence (Al-Ta'i and Sukkar, 2018). Since corporate silence is a risky phenomenon that prevents employees from speaking up and expresses little interest in their opinions, it became clear that further research was necessary. As a result, the company loses a lot of its employees' innovative ideas and abilities. Given the foregoing, the following is the solution to the research problem: In light of the Corona pandemic, what is the level of organizational silence at Al Hussein Bin Talal University, and how does it affect the performance of the university? The level of organizational silence at Al Hussein Bin Talal University has been particularly high during the pandemic, leading to decreased communication and collaboration among faculty and staff.
Research Objectives:
1-Interpretation of the concept of organizational silence for the university research sample
2-Explicitly stating the reasons that motivate academics to adopt organizational silence
3-Determining the nature of the effect between organizational silence and organizational performance at the university, the research sample.
Research importance:
The importance of the research lies in addressing one of the most modern and important topics in the organizational process, and its importance appears through its scientific and practical importance. The importance of organizational silence comes as one of the important administrative phenomena that all individuals should pay attention to and that accompany business organizations in their various forms. And it negatively affects the workflow in it, as this phenomenon leads to an increase in absenteeism, work turnover, and a decrease in productivity, and this ultimately affects the efficiency and effectiveness of the organization. An attempt to arouse the interest of the study sample in its handling of such important topics and the awareness of the administrative leaders in those organizations to know the causes of organizational silence and its impact on organizational performance. Working to give the university's administration and decision-makers useful research-based suggestions that will improve the institution's performance by addressing the problem of organizational silence. And in an attempt to draw the attention of officials to take into account the reactions of employees when formulating human resources policies, because these policies and processes have an impact on the performance of the organization, it is crucial for organizations to create a culture that encourages open communication and feedback to improve overall performance.
Study Variables:
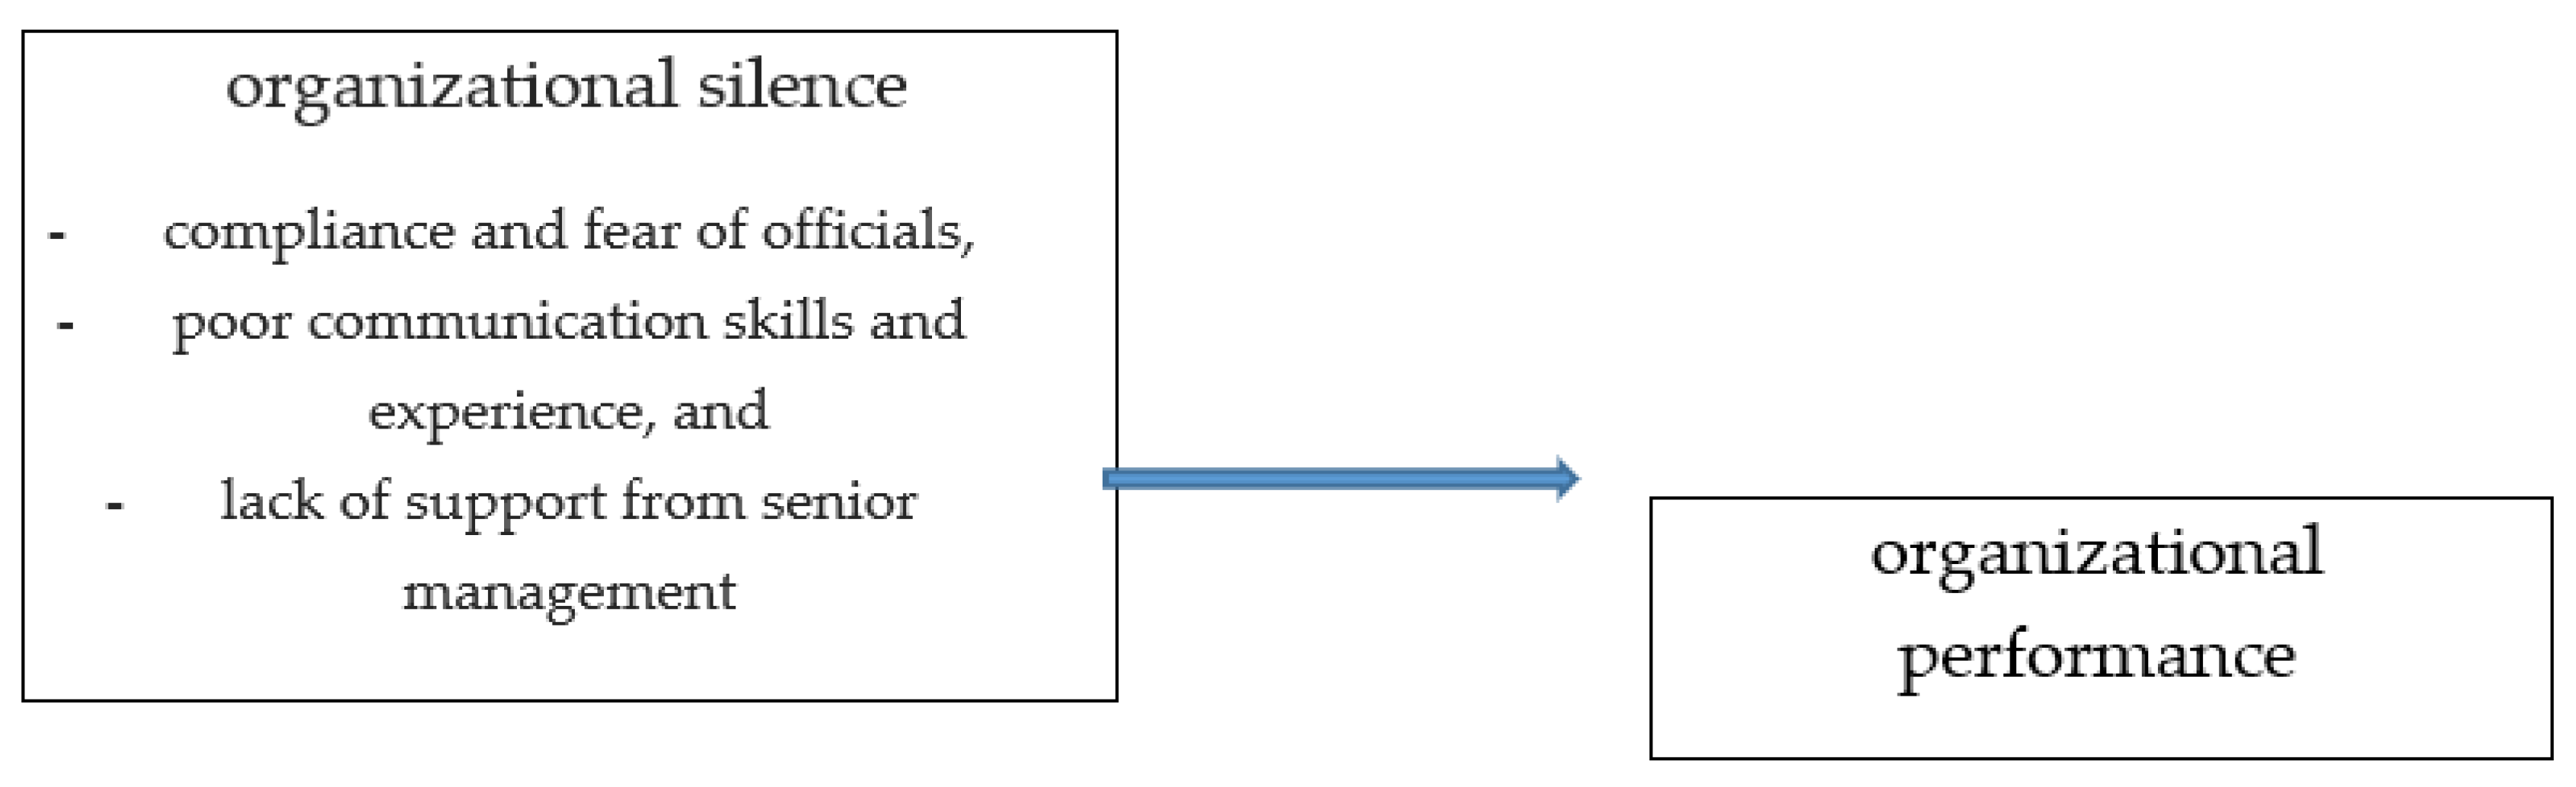
The independent variable: organizational silence: it is divided into the following sub-variables (compliance and fear of officials, poor communication skills and experience, and lack of support from senior management). organizational performance:
The conceptual model of the research based on hypothesis is shown in following figure
Figure 1.
Conceptual model and research hypotheses.
The study's factors were an expansion of previous research, specifically focusing on organizational silence in all its manifestations. As far as the researcher is aware, there have been no previous studies conducted on the topic of organizational silence in universities. Due to the predominance of the private sector, the majority of the research were centered around it. The study assesses the influence of organizational silence on organizational performance by examining the perspectives of faculty members.
RESEARCH METHODS
Study hypotheses:
Depending on the study problem and its goals, this study wants to test the following main hypotheses:
The first main hypothesis: there is no statistically significant effect at the level of significance (0.05≥α) for organizational silence with its dimensions: (compliance and fear of officials, poor communication skills and experience, lack of support from senior management) on organizational performance.
The following sub-hypotheses are derived from the main hypothesis:
There is no statistically significant effect at the level of significance (0.05≥α) for the dimension of compliance and fear of officials in organizational performance.
There is no statistically significant effect at the level of significance (0.05≥α) for the dimension of weak communication skills and experience in organizational performance.
There is no statistically significant effect at the level of significance (0.05≥α) for the dimension of not supporting senior management in organizational performance.
The second central premise is that
Is there an impact of organizational silence with its dimensions (compliance and fear of officials; poor communication skills and experience; lack of support for senior management) on the organizational performance of academics at the university?
significant effect at the level of significance (0.05≥α) for the dimension of not supporting senior management in organizational performance.
The second central premise is that
Is there an impact of organizational silence with its dimensions (compliance and fear of officials; poor communication skills and experience; lack of support for senior management) on the organizational performance of academics at the university?
LITERATURE REVIEW
silence
According to Morrison and Milliken (2000) and Pinder and Harlos (2001), silence is the absence of any spoken or written representation of a cognitive or emotional assessment that has the power to alter or enhance organizational conditions. Introduced in 1974, the notion of silence explains why some employees remain silent in the workplace because they dread being alone (Neill, 2009, Güler, & Ocak, 2023). Employee silence has been defined as the willful withholding of facts, concepts, recommendations, grievances, or difficult problems by individuals in positions of authority owing to interpersonal and personal considerations (Nafei, 2016, Yoo, 2022). It's critical to grasp the workplace reasons behind employees' silence in order to comprehend their behavior (Brinsfield, 2009).
Silence as a concept can be examined in relation to both individual and group behavior. According to Morrison and Milliken (2000), individual silence behaviors refer to when a worker in an organization does not voice their opinions despite having the ability to advance the organization (Nikolaou, & Bourantas, 2011). Organizational silence refers to the collective behavior of employees choosing not to voice significant concerns within the organization, such as unethical behaviors or inefficient rules (Kim, & Song, 2024). This could ultimately impede the organization's ability to succeed as a whole by preventing creativity and making bad decisions (Sufi, & Butt, 2024). It is imperative to address both individual and organizational silence in order to foster an environment of open communication and openness in the workplace ( Aslan, et al, 2022).
Organizational silence:
Although the management literature lacks sufficient research on the topic, employee silence in organizations is a common occurrence that shouldn't be disregarded (Brinsfield, 2009; Dyne, Ang, & Botero, 2003; Pinder & Harlos, 2001).
A number of definitions of organizational silence exist among researchers. Pinder and Harlos (2001) define it as the lack of voice. According to Dyne, Ang, and Botero (2003), there are several dimensions to organizational silence, including defensive, acquiescent, and prosaically silent states. The collective behavior of employees inside an organizations referred to as organizational silence. In certain organizations, the majority of workers keep quiet (Liu, Wu, & Ma, 2009) because they think their coworkers won't agree with them (Bayramoğlu & Çetinkanat, 2020). According to Taksha, Barahimi, Adelpanah, and Salehzadeh (2020), organizational silence is the phenomena of people in a firm expressing or doing relatively little in response to significant challenges that the organizations facing. In order to be silent, one must not write, talk, be present, be heard, be ignored, and become quiet, constrained, destroyed, or devalued (Henriksen & Dayton, 2006; Nikmaram et al., 2012; Vakola & Boudaras, 2005).
Although organizational silence is not a well-known modern concept, interest in it has grown recently due to its connection to the effectiveness and efficiency of the organization, as well as the unfavorable work habits of employees that have become roadblocks to advancement and development (Al-Faouri, 2004). The definition of organizational silence is "the common practice of not sharing information or the reluctance of employees in the organization to participate, give their opinions and suggestions to their bosses, or report problems out of fear of getting in trouble" (Rayan et al., 2019). The organization's performance (Al-Abdula, 2019) The institution's performance is determined by its ability to effectively and efficiently employ its resources to carry out its planned tasks, the outcomes of its final actions, and its interactions with both its internal and external environments. It is clear that various people have varied ideas about what silence is. Silence as a concept can be examined in relation to both individual and group behavior. According to Morrison and Milliken (2000), individual silence behaviors refer to when a worker in an organization does not voice their opinions despite having the ability to advance the organization. It is said that the organization's members have an impact on one another. According to Bowen and Blackmon (2003), organizational silence is the result of multiple employees of the organization not contributing to the organization or participating in debates. Employees' quiet behavior is influenced not only by individual characteristics like gender, age, education, and experience but also by organizational elements including competition, hierarchical structures, authoritarian management styles, and communication issues (Özgen & Sürgevil, 2009).
The notion of silence within an organization: Although the idea of organizational silence is not well-known in modern times, interest in it has grown recently due to its connection to the effectiveness and efficiency of the organization as well as the unfavorable conduct of employees, which has emerged as one of the issues impeding advancement and development (Al-Faouri, 2004). According to Al-Qarni (2015), organizational silence occurs when someone is unable to speak up for himself when he has a recommendation or piece of information he would like to contribute. Abboud and Hussein (2016) posit that the employee's reluctance to discuss work-related issues stems from their fear of misinterpretation by officials and the potential harm to their relationships with coworkers. The concept of "organizational silence" holds that working personnel refrain from purposefully engaging in work-related matters and from informing management about issues and concerns in order to preserve The lack of employee voice and their withholding of information and ideas pertaining to the advancement of the work and changing its direction is known as organizational silence (Ayed, 2017). Unfavorable outcomes may ensue (Ryan et al., 2019). (Gullace, 2016).
Since organizational silence suppresses negative information and criticism, it poses a potentially harmful and deadly barrier to learning, transformation, and organizational effectiveness. The collective-level phenomena of doing or, as Nafei (2016) puts it, expressing very little in response to major, pressing difficulties or concerns occurring in an organization or industry because to unfavorable reactions, is known as organizational silence (Kasemsap, 2017). According to Taksha, Barahimi, Adelpanah, and Salehzadeh (2020), employee silence can be defined as the deliberate and prudent veil of concealment surrounding knowledge that is potentially very essential for an organization. According to Slade (2008), one of the key factors contributing to the organizational culture of silence is executives' dread of getting unfavorable feedback.
Dimensions of organizational silence:
Compliance and fear of officials
Workers resort to this kind of silence when they realize that they are unable to make changes to things within the organization and believe that their ideas and beliefs do not affect organizational decisions (Acaray & Akturan, 2015) and no change will occur. This is clear from the fact that the employee is afraid of the organization's culture and the official's personality (Abdullah, 2014).
Al Parslan, 2010 (ideas, opinions, and information related to the organization to avoid conflict with managers) This silence happens when people don't give relevant ideas and information because they have met some condition (Crant, 2000). This lack of communication can lead to a stagnant work environment and hinder innovation within the organization. It is important for employees to feel empowered to share their ideas and concerns in order to drive positive change and growth.
weak experience and communication abilities: It refers to a lack of interpersonal skills, which makes it difficult to interact and work with officials and employees (Al-Faouri, 2004). We also find that people who were influenced by past experiences shy away from bringing up issues and talking about them with officials and coworkers, even though they know how important it is to address them. which could cause them to feel ignored or irrelevant by the officials, which could cause issues with them (Erenler, 2010). People who lack experience may hesitate to speak up, suppress information, and fear rejection or neglect as a result of their insufficient experience (Yidiz, 2013). Consequently, it is imperative that organizations give their staff members the training and assistance they need to enhance their communication abilities and understanding of how to draw in beneficiaries.
When individuals feel supported by the administration, their superiors, such as team leaders and managers, and co-workers, it fosters an environment conducive to open feedback and communication within the organization. Conversely, when support is lacking, individuals may feel demotivated and insecure, leading to increased fear and anxiety, especially when faced with the prospect of making mistakes at work (Al-Majali, 2007).
The researcher believes that the lack of strong support from senior management is a key factor contributing to the prevalence of organizational silence. Weak support influences the organization's approach to change and plays a crucial role in establishing trust between individuals and the organization to accomplish its objectives. Therefore, nurturing a culture that promotes open communication and providing robust support from senior management can not only alleviate feelings of fear and anxiety among employees but also enhance employee engagement and productivity. This, in turn, can promote a more collaborative and productive work environment where individuals feel empowered to voice their opinions and contribute to the organization's success.
organizational performance
The culmination of all the effort done by management and staff within a company is its overall performance. Because of this, performance is now a basic idea for organizations as a whole, and it practically exists in every area of administrative expertise (Al-Zatma, 2011). The concept of performance has multiple meanings, and scholars have presented it in diverse ways based on their areas of expertise. According to Bo Karita (2011), a few of them view performance as the results or objectives that the system aims to accomplish. For others, performance is the means by which those objectives are met through strategic planning and efficient use of available resources. Whatever the viewpoint, it is evident that organizational performance is essential to any institution's success and long-term viability.
The concept of organizational performance is one of the most recent and important topics in the field of public administration of institutions, especially in light of global challenges and the intensification of competition to provide high-quality service to beneficiaries (Buckman, 2004). It is considered one of the basic administrative processes through which institutions can be developed and upgraded, in addition to what is included in that process of careful examination and analysis of the policies and practices followed in terms of planning, implementation, leadership, human and material resources, and organizational culture for institutions (Abdul Mohsen, 2002). Trujillo (2020) believes that organizational performance in the field of educational institutions refers to the better management of human and material resources in addition to the effective guidance of the administrative practices followed.
Assaf and Al-Hor (2020) define it as the level of success achieved by the colleges of education in achieving their goals through optimal investment of their resources, focusing on the positive aspects of them and demonstrating the level enjoyed by the outputs after conducting various operations on the inputs, which are the commitment of the senior management and support, continuous improvement of processes, human resource development, quality of relationships and systems, quality of academic life, evaluation, and follow-up. The outputs are ultimately a reflection of the overall success and effectiveness of the organization.
The importance of organizational performance: Organizational performance is a way to steer an organization toward its goals and an indicator of its current and future status. It is also a way to find out what problems exist and how bad they are, as well as a way to help individuals and workers grow and encourage them to do so (Balaka, 2012). Organizational performance is affected by a number of factors, including: cumulative and previous experiences; administrative practices followed; the efforts of all employees within the institution; and collective participation in formulating the vision, mission, goals, and implementation mechanisms (Al-Adlouni, 2002).
Studies on organizational silence
"The impact of the quality of work life on organizational silence at Dar Al-Salem International University of Science and Technology—Yemen" is the title of a 2018 study by Shawsh and Al-Ashwal. The purpose of the study was to examine the impact of working life quality. The University of Dar es Salaam employed the descriptive analytical approach to study organizational silence among its workforce. The results, which had an average percentage of 2.55, indicated that workers have an average level of organizational silence. It was suggested that by creating direct and indirect channels of communication between superiors and subordinates, workers can lessen their fear of their superiors' negative reactions when they submit information, suggestions, or ideas related to work-related issues at the university and the ensuing unsatisfactory results. This can facilitate better communication and reduce anxiety at work.
Explore (Sakr, 2017) the effects of organizational silence on the key components of positive organizational behavior through an examination of a sample of Karbala Police Directorate employees' perspectives. The purpose of the study was to determine how organizational silence affected the primary competencies of constructive organizational behavior. By distributing a questionnaire to a sample of (143) people representing middle management levels and the globe in various areas, the study was applied to a sample of Karbala district police officers of the rank of major and below in order to get the required data. There is a strong inverse relationship between organizational silence and the main capabilities of positive organizational behavior, according to the study's findings. Of these, the most significant ones are that the presence of organizational silence had an approval rate of 62.6% and that the availability of organizational silence in institutions contributes to the decline in positive organizational behavior. It also became evident that the dimension of weak senior management support is the strongest inversely related to the main capabilities of positive organizational behavior and that it is recommended.
Ahmed (2017) conducted a research paper titled "The Effect of Organizational Silence on Organizational Citizenship Behavior: An Applied Study on Public Cadre Workers in the Education Sector at Al-Mansour University." The purpose of the study was to determine whether the various forms of organizational citizenship behavior (altruism, civility, sportsmanship, civilized behavior, and conscience awareness) and the various forms of organizational silence (silence of submission, silence of defense, and social silence) were significantly correlated. One of the study's most significant recommendations is to encourage staff members to voice their opinions, even if they disagree with their superiors, without fear of reprisal or capitulation. The survey indicated that organizational silence was available to a medium degree (59%).
Ahmed (2017) conducted an investigation titled "The Effect of Organizational Silence on Organizational Citizenship Behavior: An Applied Study on Public Cadre Workers in the Education Sector at Al-Mansour University." Finding out whether there was a significant correlation between the various forms of organizational citizenship behavior (altruism, civility, sportsmanship, civilized behavior, and conscience awareness) and the various forms of organizational silence (silence of submission, silence of defense, and social silence) was the aim of the study. One of the most significant recommendations made by the survey, which indicated that organizational silence was available to a medium degree (59%), is to encourage staff members to voice their opinions without fear of retaliation or submission, even if those opinions conflict with those of their colleagues.
RESULTS AND DISCUSSION
Research Result
The study sample was distributed according to personal and occupational variables.

Table 1.
Total Variable Number Percentage.
| Variable | Number | Percentage % | Total | |
| Gender | ||||
| Male | 170 | 92.39 | ||
| Female | 14 | 7.61 | ||
| Total | 184 | 100 | 184 | |
| Academic Rank | Professor | 38 | 15.22 | |
| Co-prof | 45 | 24.46 | ||
| Assist Prof | 111 | 60.32 | ||
| 184 | ||||
| Total | 184 | 100 | 184 | |
| Experience | ||||
| Years | 1-5 | 18 | 9.78 | 18 |
| Years | 6-10 | 67 | 36.41 | 67 |
| Years | 11-15 | 76 | 41.31 | 76 |
| 15 years and over | 23 | 12.5 | 23 | |
| Total | 184 | 100 | 184 |
Data collection methods: Two sources were used to collect the data. Primary sources: doing research in the field by giving out questionnaires to study some of the research vocabulary; collecting and analyzing the necessary information on the subject of the research; and then unloading and analyzing it using the statistical program me (SPSS) and the right statistical tests to get valuable indications and indicators that support the subject of the study. The researcher looked at books, magazines, and other publications that were related to the topic of the study, which was "the effect of organizational silence on organizational performance from the point of view of academics at Al Hussein Bin Talal University. "The validity of the internal consistency of the questionnaire paragraphs for the purpose of verifying the validity of the internal consistency and the correlation coefficient, an exploratory sample of (10) academics at the university was selected for the study. The results showed a high level of internal consistency and a strong correlation coefficient as shown in Table No. (2).
Table 2.
The distribution of the study sample according to gender.
| Gender | number |
| males | 25 |
| Total | 25 |
Data collection methods
In order to ascertain the correlation coefficients between the performance of each paragraph in the field, Table (3) shows the results of applying the questionnaire.
Table 3.
paragraph correlation coefficient.
| N | correlation coefficient | N | correlation coefficient | N | correlation coefficient |
| 1 | **0.932 | 7 | **0.934 | 13 | **0.925 |
| 2 | **0.932 | 8 | **0.929 | 14 | **0.937 |
| 3 | **0.933 | 9 | **0.923 | 15 | **0.922 |
| 4 | **0.894 | 10 | **0.931 | 16 | **0.902 |
| 5 | **0.873 | 11 | **0.918 | 17 | **0.906 |
| 6 | **0.934 | 12 | **0.793 |
An application research on academics at Al-Hussein Bin Talal University was conducted to determine the effect of organizational quiet on organizational performance. A questionnaire was created for this study. There are two primary sections of the study questionnaire: First section: personal information about the respondent (gender, years of experience, and academic standing). Section Two: The relationship between organizational performance and silence: Both organizational performance and organizational silence are components of it. It is broken down into 17 paragraphs that are thoroughly examined and analyzed.
Tool stability: The study tool was used on the pilot sample to ensure the tool's stability, and Cronbach's alpha equation was used to confirm the tool's stability. Table 4 displays the stability coefficients for each axis and the entire tool. The instrument's overall stability value was 0.910 based on the entire score. This high stability coefficient for the tool is appropriate for the investigation's goals.
Table (4) shows that the values of the reliability coefficients are suitable and reliable for the purposes of scientific research, as the reliability coefficients ranged from 0.721 to 0.944, which means that the values are high and to an excellent degree for the statistical analysis process.
First, the findings pertaining to the first sub-question: In light of the COVID-19 epidemic, what is the extent of organizational silence among Al-Hussein Bin Talal University faculty members, and how does this affect organizational performance? We determined the arithmetic averages and standard deviations for each of the axes in order to respond to the first question. The results showed varying levels of organizational silence among faculty members, with some departments exhibiting higher levels than others paragraphs. Table (5) shows this.
Table 5.
Arithmetic means, standard deviations, and degree of agreement for the study items.
| Number | Arithmetic mean | Stand deviation | Degree of agreement |
| The first axis: submission and fear of officials | |||
| The official imposes his personality on me in an annoying way | 3.9154 | 0.79762 | High |
| My relationship with my officials is tense | 3.8538 | 0.7886 | High |
| Avoid direct contact with officials | 3.7769 | . 58754 | High |
| The second axis: weak communication skills and experience | |||
| I find it very difficult to mix with people | 3.5069 | . 85604 | Medium |
| It is difficult to defend my opinion when I am with colleagues | 3.8231 | 0.87573 | High |
| I don't know how academics deal with each other | 3.7 | 0.60553 | High |
| The third axis: lack of support from the top management | |||
| The administration takes its decisions without the participation of academics in them | 3.9308 | 0.53103 | High |
| The administration does not show interest in the rights of academics | 3.9231 | 0.5226 | High |
| The administration does not listen to academics' problems | 3.8692 | 0.4556 | High |
| Fourth Axis: Organizational performance | |||
| The available financial resources are sufficient to provide the necessary needs of the beneficiaries during the Corona period | 3.4923 | 0.90001 | Medium |
| The available financial resources are exploited in a way that improves the performance of the university during the pandemic period | 3.6 | 0.79338 | Medium |
| The university seeks to achieve the satisfaction of service seekers and beneficiaries through the services provided to them during the Corona period | 3.8231 | 0.76214 | High |
| The university seeks to simplify its procedures to gain the satisfaction of service seekers and beneficiaries during the Corona period | 3.3308 | 1.01 | Medium |
| Modern technologies for information systems are used in work procedures during the Corona period | 3.6154 | 1.05003 | Medium |
| The university attaches importance to research and development to improve its services during the Corona period | 3.5 | 1.07 | Medium |
| University employees are constantly trained to improve their performance during the Corona period | 3.0538 | 1 | Medium |
| The university is working to enhance technology to facilitate communication and exchange of information during the Corona period | 3.7077 | 0.95191 | High |
| Total | 3.719076 | 0.829735 | High |
Table (5) shows that for all the paragraphs of the first axis: compliance and fear of officials, the degree of approval was high, which means that the deans and heads of departments at the university have a high degree of interest and awareness of compliance and fear of officials in their colleges and departments, where the arithmetic average ranged between (3.9154) and 3.7769 with a standard deviation (0.87573-0.60553), and as for the second axis: poor communication skills and experience, the degree of approval for this axis came between medium and high, as the arithmetic mean ranged (3.8231-3.5069) and the standard deviation (0.87573-0.60553), and as for the third axis: the lack of support from the senior management, the degree of approval for its paragraphs was high and ranged between (3.9308-3.8692) and a standard deviation (0.53103-0.45560), and the arithmetic mean, and the third axis was also arithmetic averages and standard deviations were calculated and table (6) shows that.
Table 6.
Arithmetic averages, standard deviations, and the corresponding scores for the axes as a whole are calculated.
Table 6.
Arithmetic averages, standard deviations, and the corresponding scores for the axes as a whole are calculated.
| mean | Stand deviation | degree |
| Compliance and fear of officials' | 3.850 | 0. 72.46 |
| high | ||
| Poor communication skills and experience | 3.680 | 0.7791 |
| high | ||
| Lack of top management support | 3.910 | 0.5031 |
| high | ||
| organizational performance | 3.590 | 0.9530 |
| medium | ||
| Total | 3.789 | 0.8297 |
| high | ||
Table (6) shows that the averages for all axes ranged between (3.590-3.910) and had a standard deviation of (.953.-.5031.) The arithmetic mean of the first axis was compliance and fear of officials (3.850) and with a standard deviation (0.7246), and the degree of approval for the axis was high. The second axis was the weakness of communication skills and experience. Its arithmetic mean was (3.680) and standard deviation (0.7791) and a high degree of agreement. Institutional came up with a mean (3.590) and a standard deviation (0.9530).
It was also done according to the job position variable as in Table No. (7).
| Variable | Number | mean | Stand deviation | error rate |
| Compliance and fear of officials Dean | 27 | 2.3704 | .29196 | .05619 |
| Head of the Department | 103 | 2.2466 | .46628 | .04594 |
| Poor communication skills and experience Dean | 27 | 2.1778 | .36515 | .07027 |
| Head of the Department | 103 | 2.0602 | .07027 | .03489 |
| Lack of top management support Dean | 27 | 2.1407 | .35406 | .08594 |
| Head of the Department | 103 | 1.9631 | .03489 | .08594 |
| organizational performance Dean | 27 | 3.7230 | .66665 | .12830 |
| Head of the Department | 103 | 3.5266 | .60089 | .05921 |
| total Dean | 27 | 3.7911 | .51707 | .09951 |
| Head of the Department | 103 | 3.6462 | .49856 | .04912 |
In order to find out whether there are statistically significant differences attributable to the job position, a T-test was conducted for the sample and Table (8) shows this.
Table 8.
t-test for independent samples.
| Dimensions | mean | Stand deviation | value (t) | Significance level |
| Compliance and fear of officials' | 2.27231 | .43776 | 59 .184 | 0.000 |
| Poor communication skills and experience | 2.08462 | .35817 | 66.360 | 0.000 |
| Failure to support senior management | 2.00000 | 40462 | 56.357 | 0.000 |
| Organizational performance | 3.56738 | .61763 | 65.856 | 0.000 |
| Total | 3.67631 | 50389 | 83,186 | 0.000 |
Table 8 makes it evident how important the second axis—submission and fear of officials—was in relation to the dean and the department head. The calculated value (t) is higher than the tabular value, indicating a statistically significant relationship between the dimensions and the job position. Furthermore, it is clear how important the career position is. Given that professional positions have a direct impact on organizational decision-making processes, their significance is obvious.
Third: The results related to the second sub-question, which states: "What is the level of achieved organizational performance at Al-Hussein Bin Talal University from the point of view of the deans and heads of academic departments?"
Table 9.
Arithmetic averages and standard deviations according to the variable years of experience.
| Compliance and fear of officials | Poor communication skills and experience | Lack of top management support | years of experience. | |
| 2.1481 | 1.9556 | 1.8741 | mean | 5-Jan |
| 27 | 27 | 27 | NO | |
| 0.36624 | 0.34344 | 0.40057 | stand deviation | |
| 2.2041 | 2.0122 | 2.0245 | mean | 10-Jun |
| 49 | 49 | 49 | NO | |
| 0.56049 | 0.3638 | 0.38651 | stand deviation | |
| 2.4278 | 2.2278 | 2.0611 | mean | 15-Nov |
| 36 | 36 | 36 | NO | |
| 0.24449 | 0.30295 | 0.40517 | stand deviation | |
| 2.3333 | 2.1889 | 2 | mean | 15years and over |
| 18 | 18 | 18 | NO | |
| 0.38195 | 0.36604 | 0.44984 | stand deviation | |
| 2.2723 | 2.0846 | 2 | mean | total summation |
| 130 | 130 | 130 | NO | |
| 0.43776 | 0.35817 | 0.40462 | stand deviation |
To answer the second sub-question, the arithmetic mean and standard deviations of the level of organizational performance achievement were calculated from the point of view of the deans and heads of academic departments due to the variable years of experience. Table (9) shows the arithmetic averages and standard deviations.
Table 10.
shows the results of an analysis of variance test for the sample.
| Statistical significance | F value | mean | Freedom level | sum of squares | Contrast source | Dimensions | |
| 0.192 | 1.72 | 0.328 | 1 | 0.328 | between squares | ||
| Compliance and fear of officials | |||||||
| 0.191 | 128 | 24.393 | inside the boxes | ||||
| 0.519 | 129 | 24.72 | total | ||||
| 0.129 | 2.329 | 296 | 1 | 296 | Contrast source | ||
| Poor communication skills and experience | |||||||
| 0.127 | 128 | 16.253 | between squares | ||||
| 0.423 | 129 | 16.549 | total | ||||
| 0.042 | 4.226 | 0.675 | 1 | 0.675 | between squares | ||
| Lack of top management support | |||||||
| 0.16 | 128 | 20.445 | inside the boxes | ||||
| 0.835 | 129 | 21.12 | total | ||||
| 0.142 | 2.182 | 0.825 | 1 | 0.825 | between squares | ||
| organizational performance | |||||||
| 0.378 | 128 | 48.384 | |||||
| inside the boxes | |||||||
| 129 | 49.209 | ||||||
| 1.203 | total | ||||||
| 0.185 | 1.78 | 0.449 | 1 | 0.449 | between squares | Total | |
| 0.252 | 128 | 32.304 | inside the boxes | ||||
| 0.701 | 129 | 32.753 | total |
Table (10), where the value of (F) is calculated to be higher than its tabular value, indicates that there is significance for the years of experience but no statistical significance between the dimensions, makes it evident that the axis (first, second, fourth, and fifth axis) do not differ statistically in the variable years of experience. Regarding the second axis, the years of experience play a major role in the compliance and fear of official's axis, as indicated by the statistically significant value of F = 4.225 and the significance value of 0.042 summarizing the results of the study.
Talking about the results of the first hypothesis, which reads: "Organizational silence (compliance and fear of officials, lack of communication experience and skills, and lack of support from senior management) has no statistically significant effect at the level of significance (0.05a) on organizational performance,"
Multiple regression analysis was used to test how well the study model worked and how the independent variable, organizational silence and its dimensions, affected the dependent variable, organizational performance as measured by the job Centre variable.
Table 11.
Pearson Correlation Matrix.
| organizational performance | Lack of top management support | Poor communication skills and experience | Compliance and fear of officials | Career Center | ||
| 0.411 | 0.411 | 0.582 | 1 | 0.115 | Compliance and fear of officials | Pearson Correlation |
| 0.528 | 0.528 | 1 | 0.582 | 0.134 | Poor communication skills and experience | |
| 1 | 1 | 0.528 | 0.411 | 0.179 | Lack of top management support | |
| 1 | 0.69 | 0.726 | 0.717 | 0.129 | organizational performance | |
| 0.071 | 0.021 | 0.065 | 0.096 | Career Center | ||
| 0 | 0 | . | 0.096 | Compliance and fear of officials | Sig. (1-tailed | |
| 0 | 0 | . | 0 | 0.065 | Poor communication skills and experience | |
| 0 | 0 | 0 | 0 | 0.021 | Lack of top management support | |
| . | 0 | 0 | 0 | 0.071 | organizational performance |
Table 11 reveals no full correlation between independent variables and certain others, indicating a lack of correlation matrix and significance.
Table 12.
Multiple regression analysis results.
| R2 | F | df | sig |
| 75.3 | 95.366 | 4 | .000 |
Table (12), which shows the correlation matrix between all the variables and the magnitude of the correlation, reveals that there is no perfect correlation between the independent variables and certain other variables.
Table 13.
Results of a multiple regression analysis done at Al-Hussein Bin Talal University to see how the different parts of organizational silence affect each other.
Table 13.
Results of a multiple regression analysis done at Al-Hussein Bin Talal University to see how the different parts of organizational silence affect each other.
| Model | Unstandardized Coefficients | Standardized Coefficients | t | Sig. | |
| B | Std. Error | Beta | |||
| Compliance and fear of officials | 0.111 | 0.06 | 0.111 | 1.862 | 0.065 |
| Poor communication skills and experience | 0.089 | 0.076 | 0.089 | 1.159 | 0.249 |
| Lack of top management support | 0.213 | 0.06 | 0.213 | 3.531 | 0.001 |
The values of (T) reached (3.531–10.435), respectively, which are significant values at the level of significance (0.05a), show that the dimensions of submission and fear of officials, as well as poor communication skills and experience, have no impact on achieving organizational performance at Al-Hussein Bin Talal University. On the other hand, the university's organizational performance is hurt by the lack of support from senior management. The study found no significant differences in respondents' perceptions of organizational silence in Jordanian public universities, irrespective of personal and occupational variables, such as gender, job position, academic rank, and experience.
To answer this hypothesis, the Variance Inflation Factory and the Tolerance Test were tested to ensure that there is no high multicollinearity between the independent variables, and Table (14) illustrates this.
Table 14.
Contrast the inflation factor test and the allowable variance test.
| Collinearity Statistics | ||
| VIF | Tolerance | Dimensions |
| 2.26 | 0.442 | Compliance and fear of officials |
| 2.217 | 0.451 | Poor communication skills and experience |
| 2.235 | 0.447 | Lack of top management support |
Table 14 demonstrates that there is no correlation between the independent variables (compliance and fear of officials; poor communication skills and experience; lack of support from senior management) and the dependent variables (gender, job position, academic rank, and number of years of experience) for multiple regression. This suggests that these variables are not multiplied linearly.
Limitations and Future Research
The unique focus on academics at Al-Hussein Bin Talal University may result in a reduced sample size for the study. The findings might not be as applicable to other Jordanian institutions or other organizational situations as a result. As in any survey-based research, respondent bias is a potential in which individuals withhold genuine ideas and experiences from others or give answers that are socially desirable. The following research should conduct a comparative examination of other Jordanian universities to look at how organizational silence impacts performance in diverse settings with varying structural, leadership, and cultural traits. Utilizing a sequential explanatory mixed-methods approach, involving initial quantitative surveys to gather broad data followed by qualitative interviews or focus groups for in-depth insights, will provide a comprehensive understanding of the causes of organizational silence in Jordanian institutions after the COVID-19 pandemic. Multilevel analysis is essential to comprehensively grasp organizational silence by exploring the interplay between individual-level factors (e.g., work satisfaction), team-level factors (e.g., communication climate), and institutional-level factors (e.g., leadership style), shedding light on the complexities of this phenomenon. Studies on interventions: It would be possible to gain insight into potential solutions for improving performance in Jordanian institutions by conducting intervention studies that attempt to break organizational silence through training programmers or the implementation of new communication tactics. The influence of organizational silence on performance in Jordanian institutions post-COVID-19 should be further investigated using bigger sample sizes, longitudinal designs, various approaches, and objective measurements.
Conclusions
The study undertaken by Al-Hussein Bin Talal University might enhance organizational performance and procedures. By promoting open and inclusive communication, academic staff are encouraged to share their thoughts. Create psychological safety, lower hierarchical barriers, and implement feedback methods to reduce and improve organizational quiet. Increasing staff involvement is crucial because organizational silence can hurt performance. When academics are recognized and involved in decision-making, they become more engaged and help the organization flourish. Leadership development involves improving organizational quiet and performance. We can teach leaders to promote openness, transparency, and intellectual thinking. Training-related concerns.
Policymakers from academia have brought up the crucial question of whether quiet inside an organization affects performance. Silence among employees can be harmful to educational institutions and, as a result, increase employee discontent. This includes transfers, long absences from work, and other unfavorable actions. It is therefore advised to establish a suitable organizational setting where university employees can voice their opinions without worrying about reprisals from their peers or superiors. Since there is a strong correlation between organizational quiet and departmental attitudes towards silence, departments should support their staff members in expressing their opinions by providing venues that are suitable for free speech and constructive criticism. Organizational cadres can address the issue by taking initiative if they have a clear grasp of organizational silence, its consequences, and how bad it is for both professional and organizational performance.
References
- Faisal Al-Tai & Abdullah Sakkar (2018) The impact of organizational silence on the main capabilities of positive organizational behavior: an analytical study of the opinions of a sample of employees of the Karbala Governorate Police Directorate Volume VI, Number Twenty-first, pp. 53-93.
- Gulluce Ali Caglar, ErenErkilic, (2016), "Analysis of organizational attitudes of hotel operation employees by structure equation model: exemplary of Rize Province,"12, No. 19.
- Weber, Paula S., and James E. Weber (2001), "Changes in employee perceptions during organizational change.", Leadership & Organization Development Journal22.6: 291-300. [CrossRef]
- Yildiz, Ebru, (2013), "Enigma of Silence in Organizations: What Happens to Whom and Why", Beykent Universities Sosyal Bilimler Dergisi 6.2, p. 30-44.
- Buckman, R. (2004). Building Knowledge in Organization Performance. McGraw-Hill, Boston Publishing Co., pp. 14–21.
- Trujillo, C. (2020). Claves for the inclusion of the interdependencies between organizational culture and disease or institutionalization: the case of educational intuition, Algeria N° 02. Debates in Sociology, 48(1), 35-64.
- Al-Faouri, Abeer Mahmoud, "The Impact of Organizational Silence on Participation in Organizational Decision-Making," Mutah Magazine, No. 2, Vol. 19, p., 2004.
- Abboud, Zainab Abdul-Razzaq, and Hussein, Zafar Nasser (2016) The causes of organizational silence and their impact on the performance of workers "published research", Babylon University Journal/Pure and Applied Sciences/Volume (42) No. (1).
- Ahmed, Mohamed Ahmed (2017) "The impact of organizational silence on organizational citizenship behavior: An applied study on public cadre workers affiliated with the education sector at Mansoura University." Research publication of the Journal of Commerce and Finance, Tanta University-Faculty of Commerce.
- Al-Abadla, Issa, 2019) The Impact of Diversity Management on Organizational performance in Palestinian Universities: A Study of the Superficial and Deep Dimensions of Diversity) Unpublished Master’s Thesis (Islamic University of Gaza, Palestine).
- Majali, Amal Yassin (4,337), "The impact of organizational silence on the decision-making process." A field study an analysis of Jordanian public institutions, unpublished doctoral thesis, Amman Arab University, Jordan.
- Al-Fatlawi, Charter Telephone (4317) "The Relationship between Psychological Capital and Organizational Silence", an exploratory study, Iraq, Karbala University, College of Administration and Economics.
- Sakr, Abdullah Ali (2017) The impact of organizational silence on the main capabilities of positive organizational behavior: "An analytical study of the opinions of a sample of employees of the Karbala Governorate Police Directorate, published research in the Journal of Administration and Economics, Volume (1), Issue (41).
- Abdel Wahab, Khaled Mahmoud (2018) entitled: "The reasons for organizational silence and its relationship to the five personality factors among a sample of workers in the government sector," Journal of Psychology-Egypt.
- Al-Zatma, Nidal Muhammad. "Knowledge management and its impact on performance excellence: An applied study on colleges and intermediate technical institutes operating in the Gaza Strip." Unpublished master's thesis, Faculty of Commerce, Islamic University of Gaza, 2011.
- Bou Kreita, Nawal (2011) The impact of communications on raising the marketing performance of the service institution: a case study of the Travel and Tourism Agency, an unpublished master's thesis, University of Algiers, Algeria.
- T. Abdel Mohsen (2002). Organizational performance appraisal: a new entrance to a new world. Arab Renaissance House, Alexandria, Egypt.
- Assaf, Hammoud Abdel-Majid, and Al-Hawz, Nida Jamal (2020) The reality of the organizational performance of the faculties of education in Palestinian universities in the light of the principles of six SIGEM, Journal of Sustainable Studies, 2(3), 10-39.
- Blaska, Saleh (2012) The applicability of the balanced scorecard as a strategy assessment tool in Algerian economic institutions: a case study of some institutions, a master's thesis submitted by the Faculty of Economic and Commercial Sciences, Farhat Abbas University, Setif, Algeria.
- Al-Adlouni, Muhammad (2002). Institutional Work, first edition. Dar Ibn Al-Hazam for Printing and Publishing, Beirut, Lebanon.
- Mohamed, Sayed (2019). Methods and Techniques for Improving Performance in Institutions. Arab Press Agency, Publishers, Cairo, Egypt.
- Iyad (2011), Damascus University, Syria, The role of strategic planning in the quality of organizational performance: a descriptive and analytical study in Palestinian regular universities, unpublished PhD thesis.
- Muhammad Qafa (2018) The role of strategic management in improving the level of organizational performance: an applied study on government university colleges (unpublished master's thesis) Academy of Management and Politics for Graduate Studies, Gaza.
- Lee, S. Y. (2020). Analysis of the effect of school organizational culture and professional learning communities on school organization effectiveness as perceived by school teachers. 38(4), pp. 133-156 in Korean Journal of Educational Administration.
- Khosravizadeh, O., Ahadinezhad, B., Shahsavari, S., Ghiasvand, M., & Mehri, M. (2021). Role of Organizational Silence in the Professional Performance of Frontline Staff in the Hospital Structure: A Path Analysis. Journal of Health Reports and Technology, (In Press). [CrossRef]
- Goudarzi S, Hashemi S, Naami A, B. K. Organizational silence: antecedents and consequences. International Conference on Psychology and the Culture of Living. Istanbul. Mobin Cultural Ambassadors Institute; 2015.
- Askari R, Sepaseh F, Tavazoe Z. [Assessment of the Relationship between Organizational Silence and Organizational Performance in Educational Hospitals Yazd University of Medical Sciences] *(2014). Tolooe Behdasht. 2016;15(3):22-9. Persian.
- Nafei, W. A. (2016). Organizational silence: a barrier to job engagement in successful organizations. International Business Research, 9(4), 100-117. [CrossRef]
- Yoo, J. W. (2022). The role of appraisal politics on appraisal systems and employee silence within the public sector in South Korea (Doctoral dissertation, University of Plymouth).
- Sufi, A. F., Raja, U., & Butt, A. N. (2024). Impact of peer unethical behaviors on employee silence: The role of organizational identification and emotions. Journal of Business Ethics, 190(4), 821-839. [CrossRef]
- Güler, M., & Ocak, M. (2023). Organizational silence. In Dark Sides of Organizational Life (pp. 121-138). Routledge.
- Brinsfield, C. T. (2009). Employee silence: Investigation of dimensionality, development of measures, and examination of related factors. The Ohio State University.
- Pinder, C. and Harlos, H., (2001). Employee Silence: Quiescence and Acquiescence as Response to Perceived Injustice, Research in Personnel and Human Research Management, 20, PP. 331-369.
- Morrison E, and Milliken F., (2000). Organizational silence: A barrier to change and development in a pluralistic World. Acad. Manage. Rev. 25(4):706-725. [CrossRef]
- Nikolaou, I., Vakola, M., & Bourantas, D. (2011). The role of silence on employees' attitudes “the day after” a merger. Personnel Review, 40(6), 723-741. [CrossRef]
- Kim, H. S., & Song, J. H. (2024). Impacts of workplace spirituality on innovative work behaviour: moderated-mediating effect of organizational silence and intra-organizational networks. Human Resource Development International, 27(2), 257-280. [CrossRef]
- Aslan, S. K., Yalçın, B., Göktepe, N., Türkmen, E., Canbolat, S., Bakoğlu, N., & Serbest, Ş. (2022). Effects of demographic, occupational, and practice environment variables on organizational silence among nurse managers. International Nursing Review, 69(2), 132-138. [CrossRef]
Table 4.
Alpha's internal consistency.
| Alpha | Paragraph count | dimension | NO |
| 0.887 | 3 | Compliance and fear of officials | 1 |
| 0.743 | 3 | Poor communication skills and experience | 2 |
| 0.721 | 3 | Lack of top management support | 3 |
| 0.931 | 8 | organizational performance | 4 |
| 0.91 | 17 | total |
Disclaimer/Publisher’s Note: The statements, opinions and data contained in all publications are solely those of the individual author(s) and contributor(s) and not of MDPI and/or the editor(s). MDPI and/or the editor(s) disclaim responsibility for any injury to people or property resulting from any ideas, methods, instructions or products referred to in the content. |
© 2024 by the authors. Licensee MDPI, Basel, Switzerland. This article is an open access article distributed under the terms and conditions of the Creative Commons Attribution (CC BY) license (http://creativecommons.org/licenses/by/4.0/).
Copyright: This open access article is published under a Creative Commons CC BY 4.0 license, which permit the free download, distribution, and reuse, provided that the author and preprint are cited in any reuse.


