Preprint
Article

This version is not peer-reviewed.

Mixture-Based Machine Learning Analysis to Predict Fouling Release Using Insights from Newly Developed Mixture Descriptors

Submitted:

29 December 2024

Posted:

30 December 2024

You are already at the latest version

Abstract

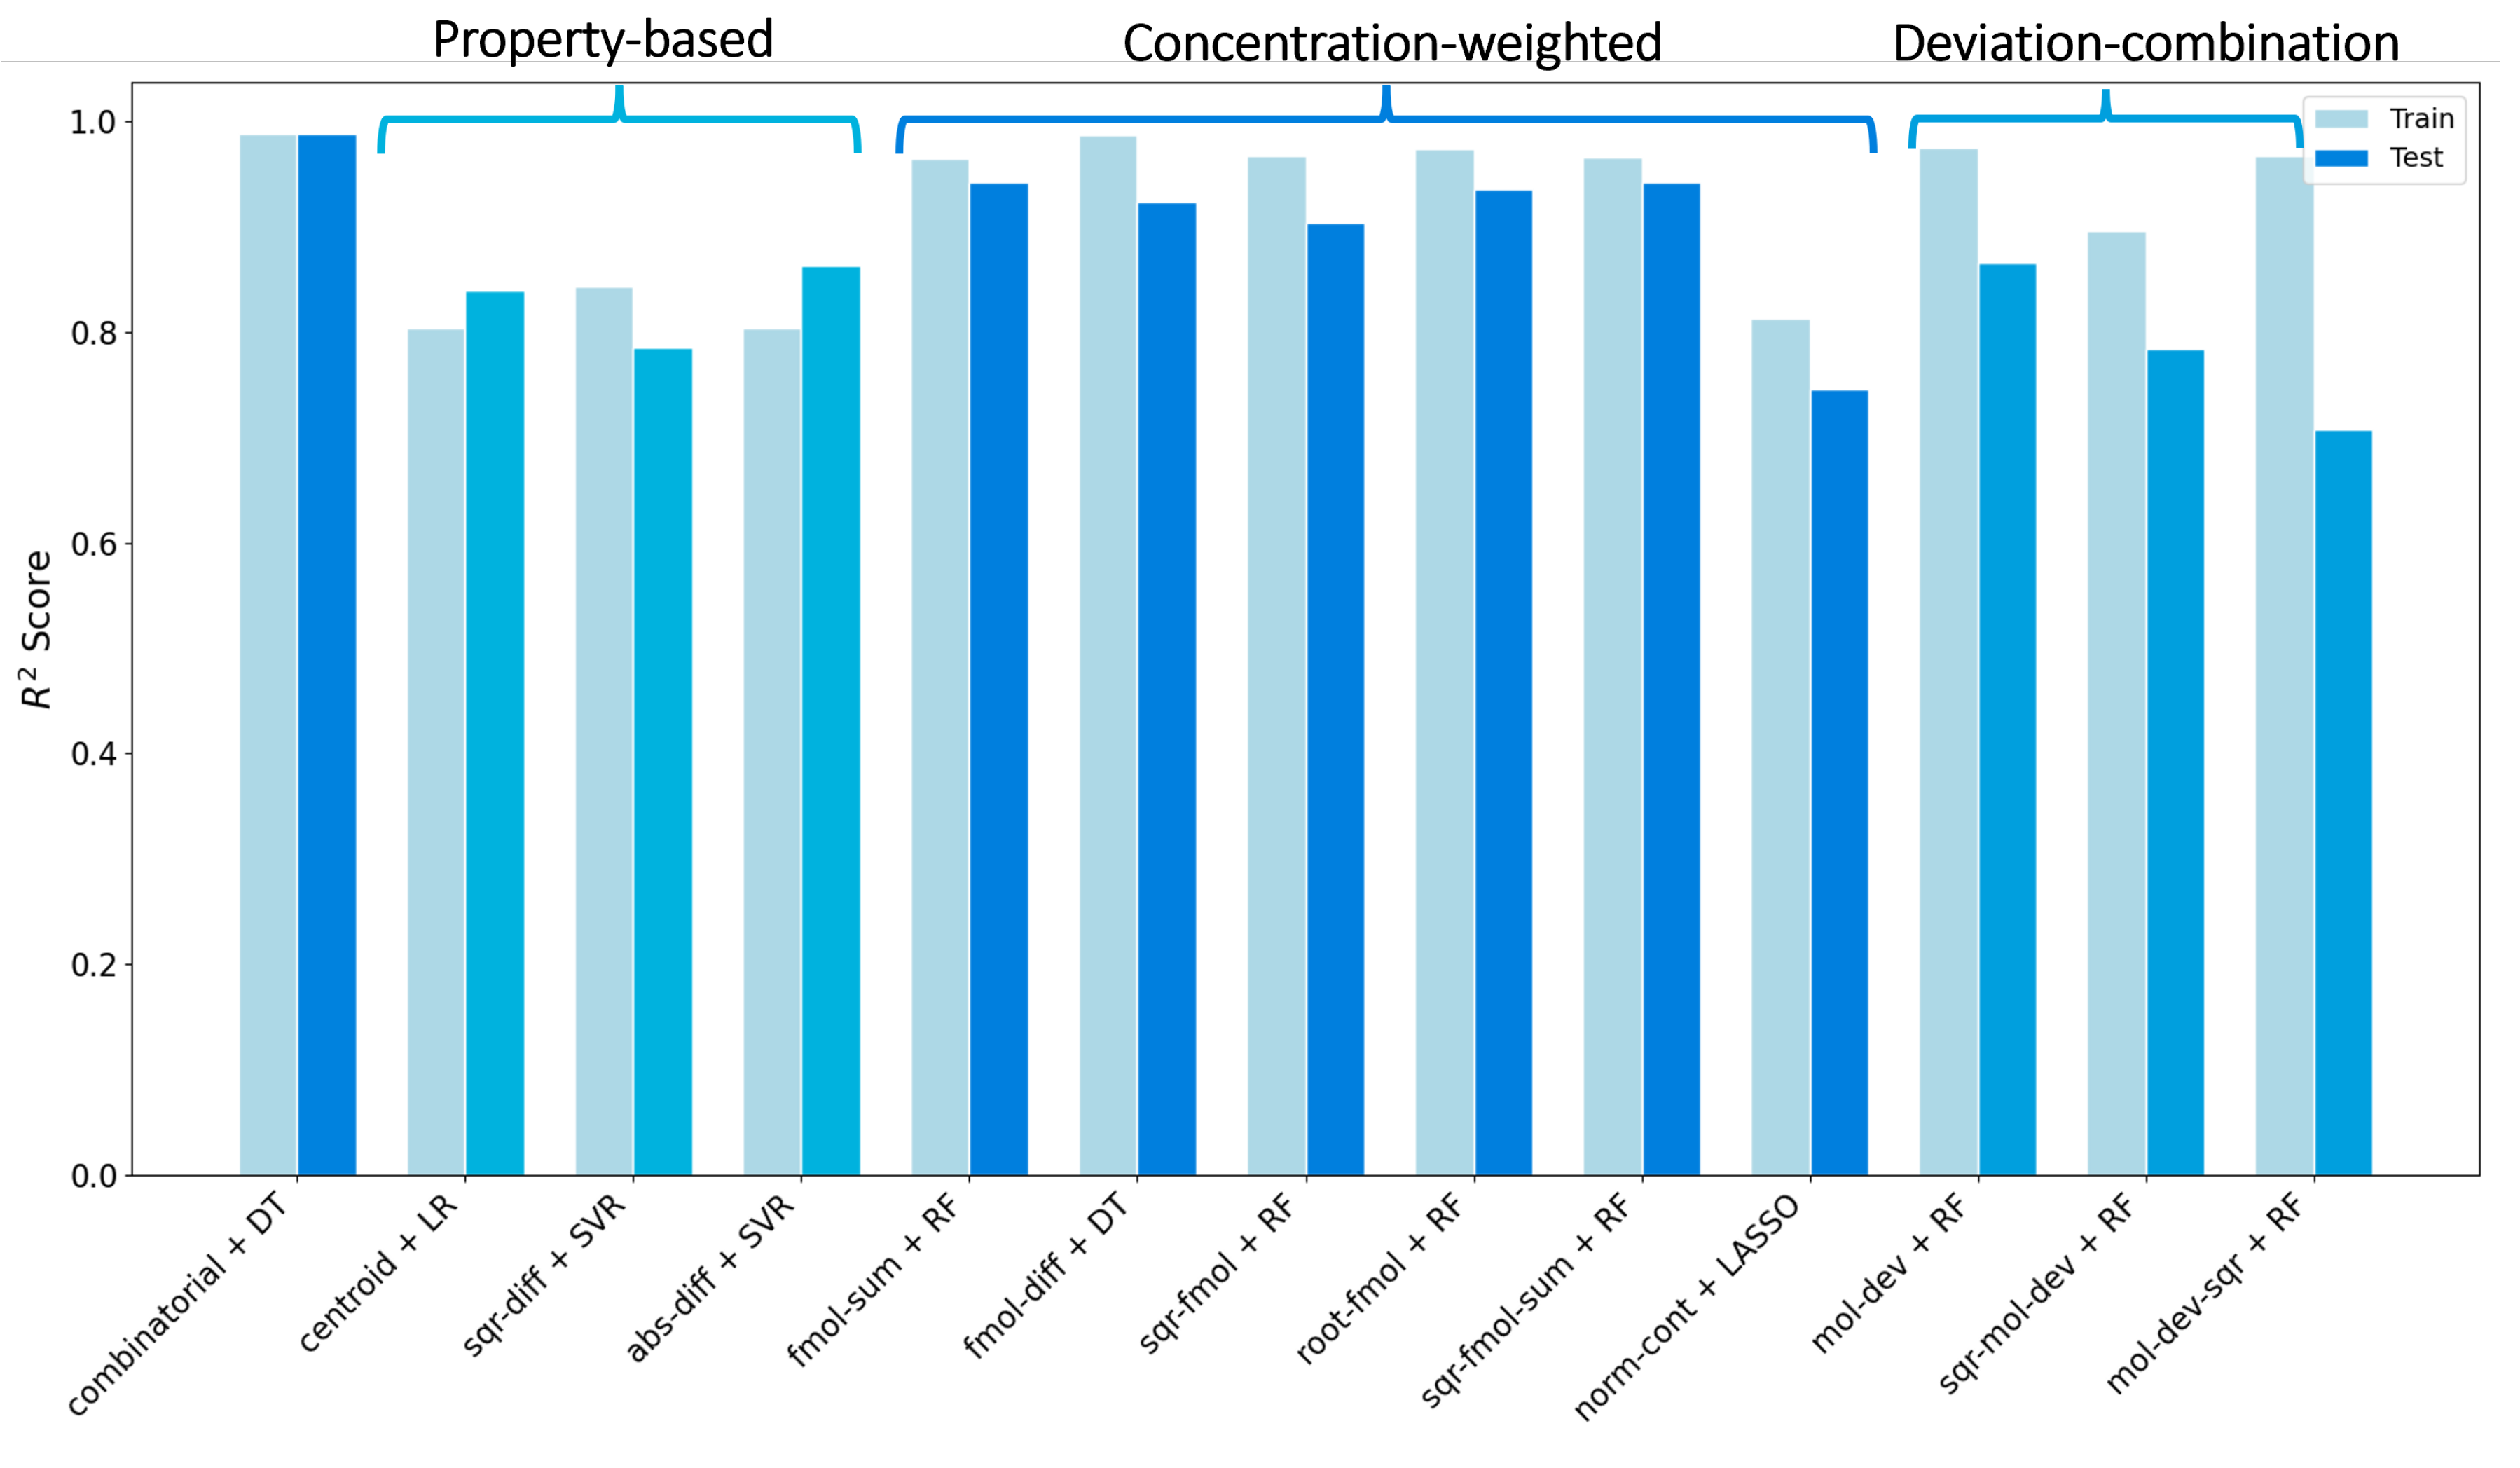
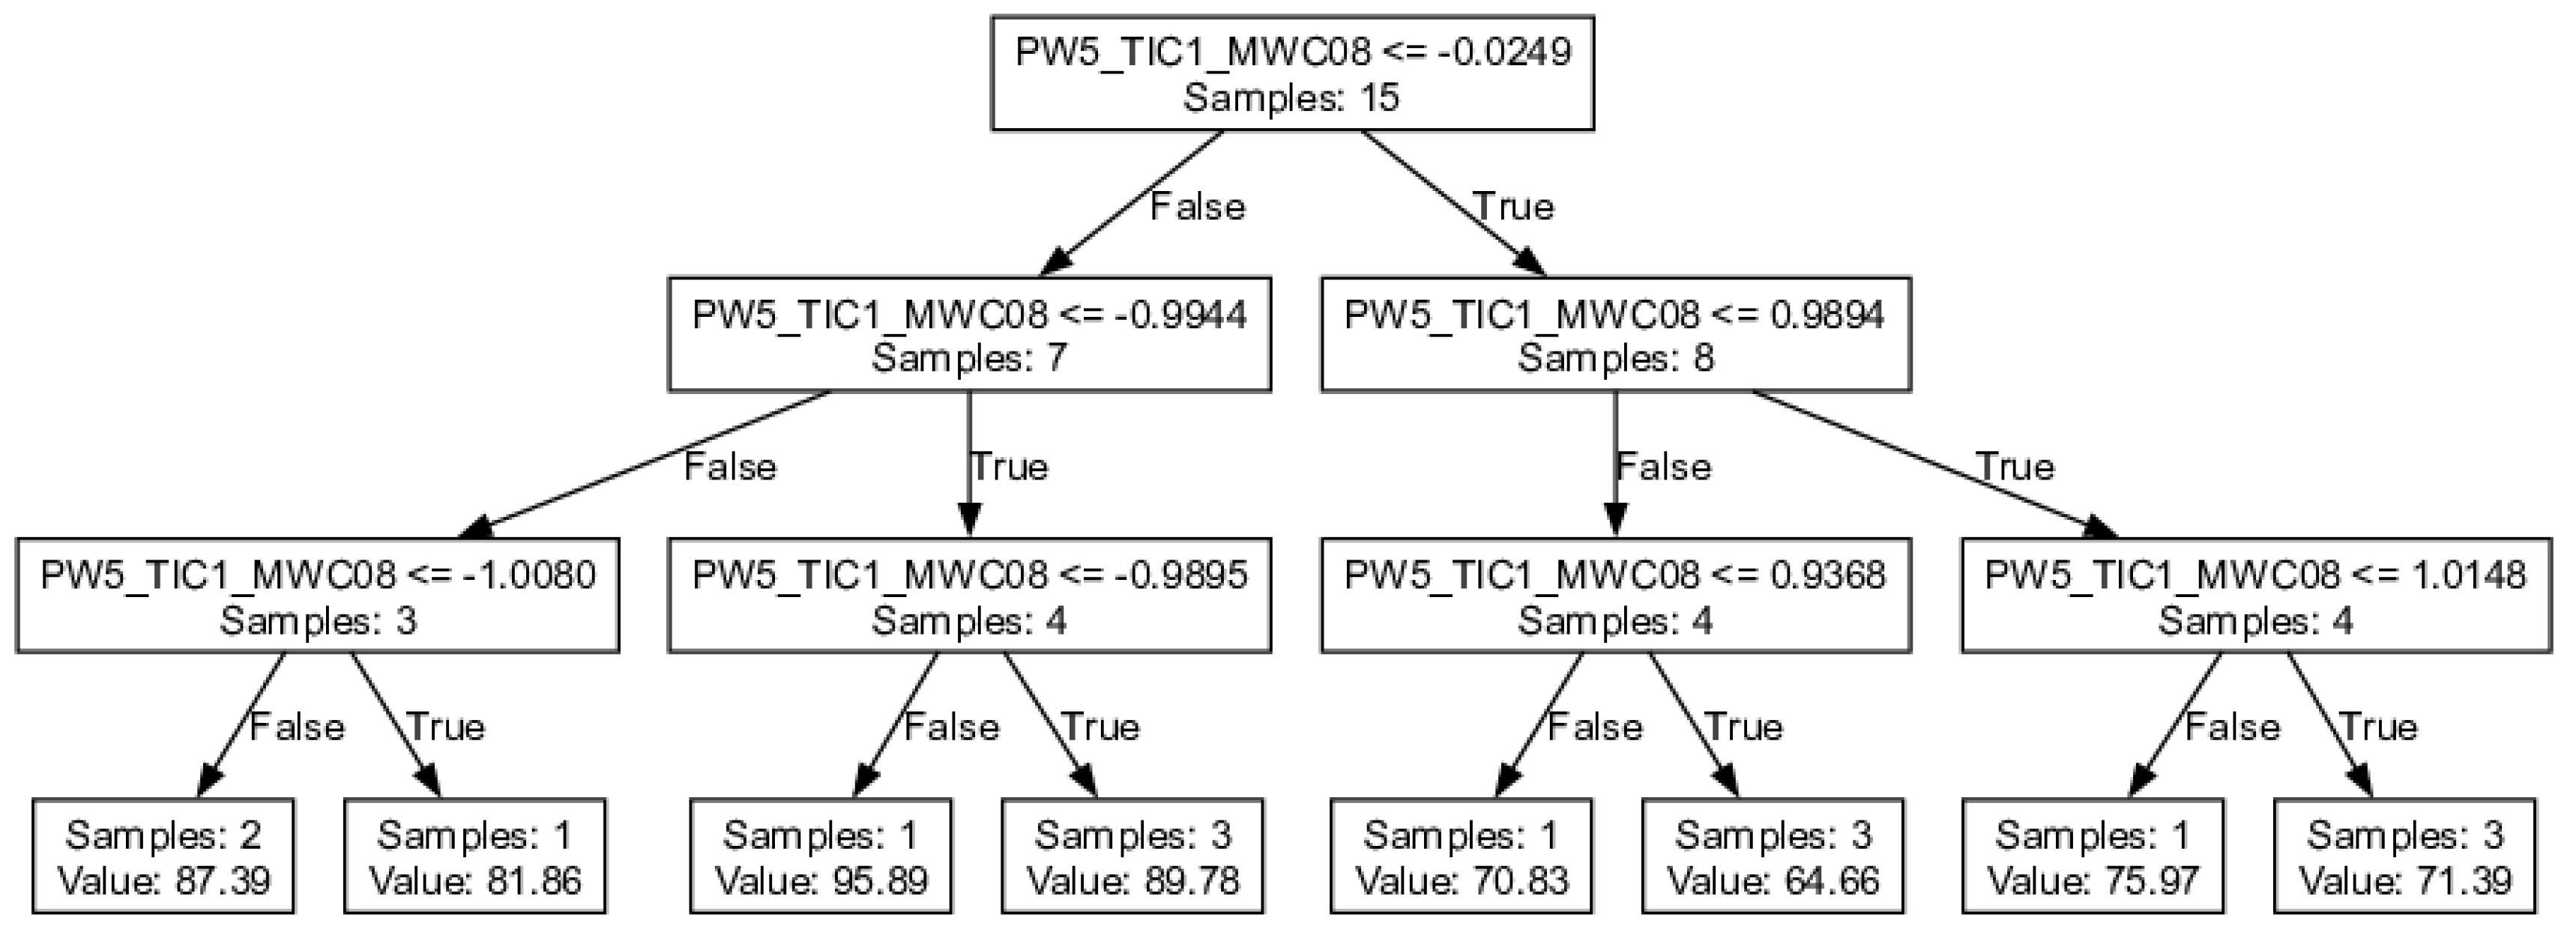
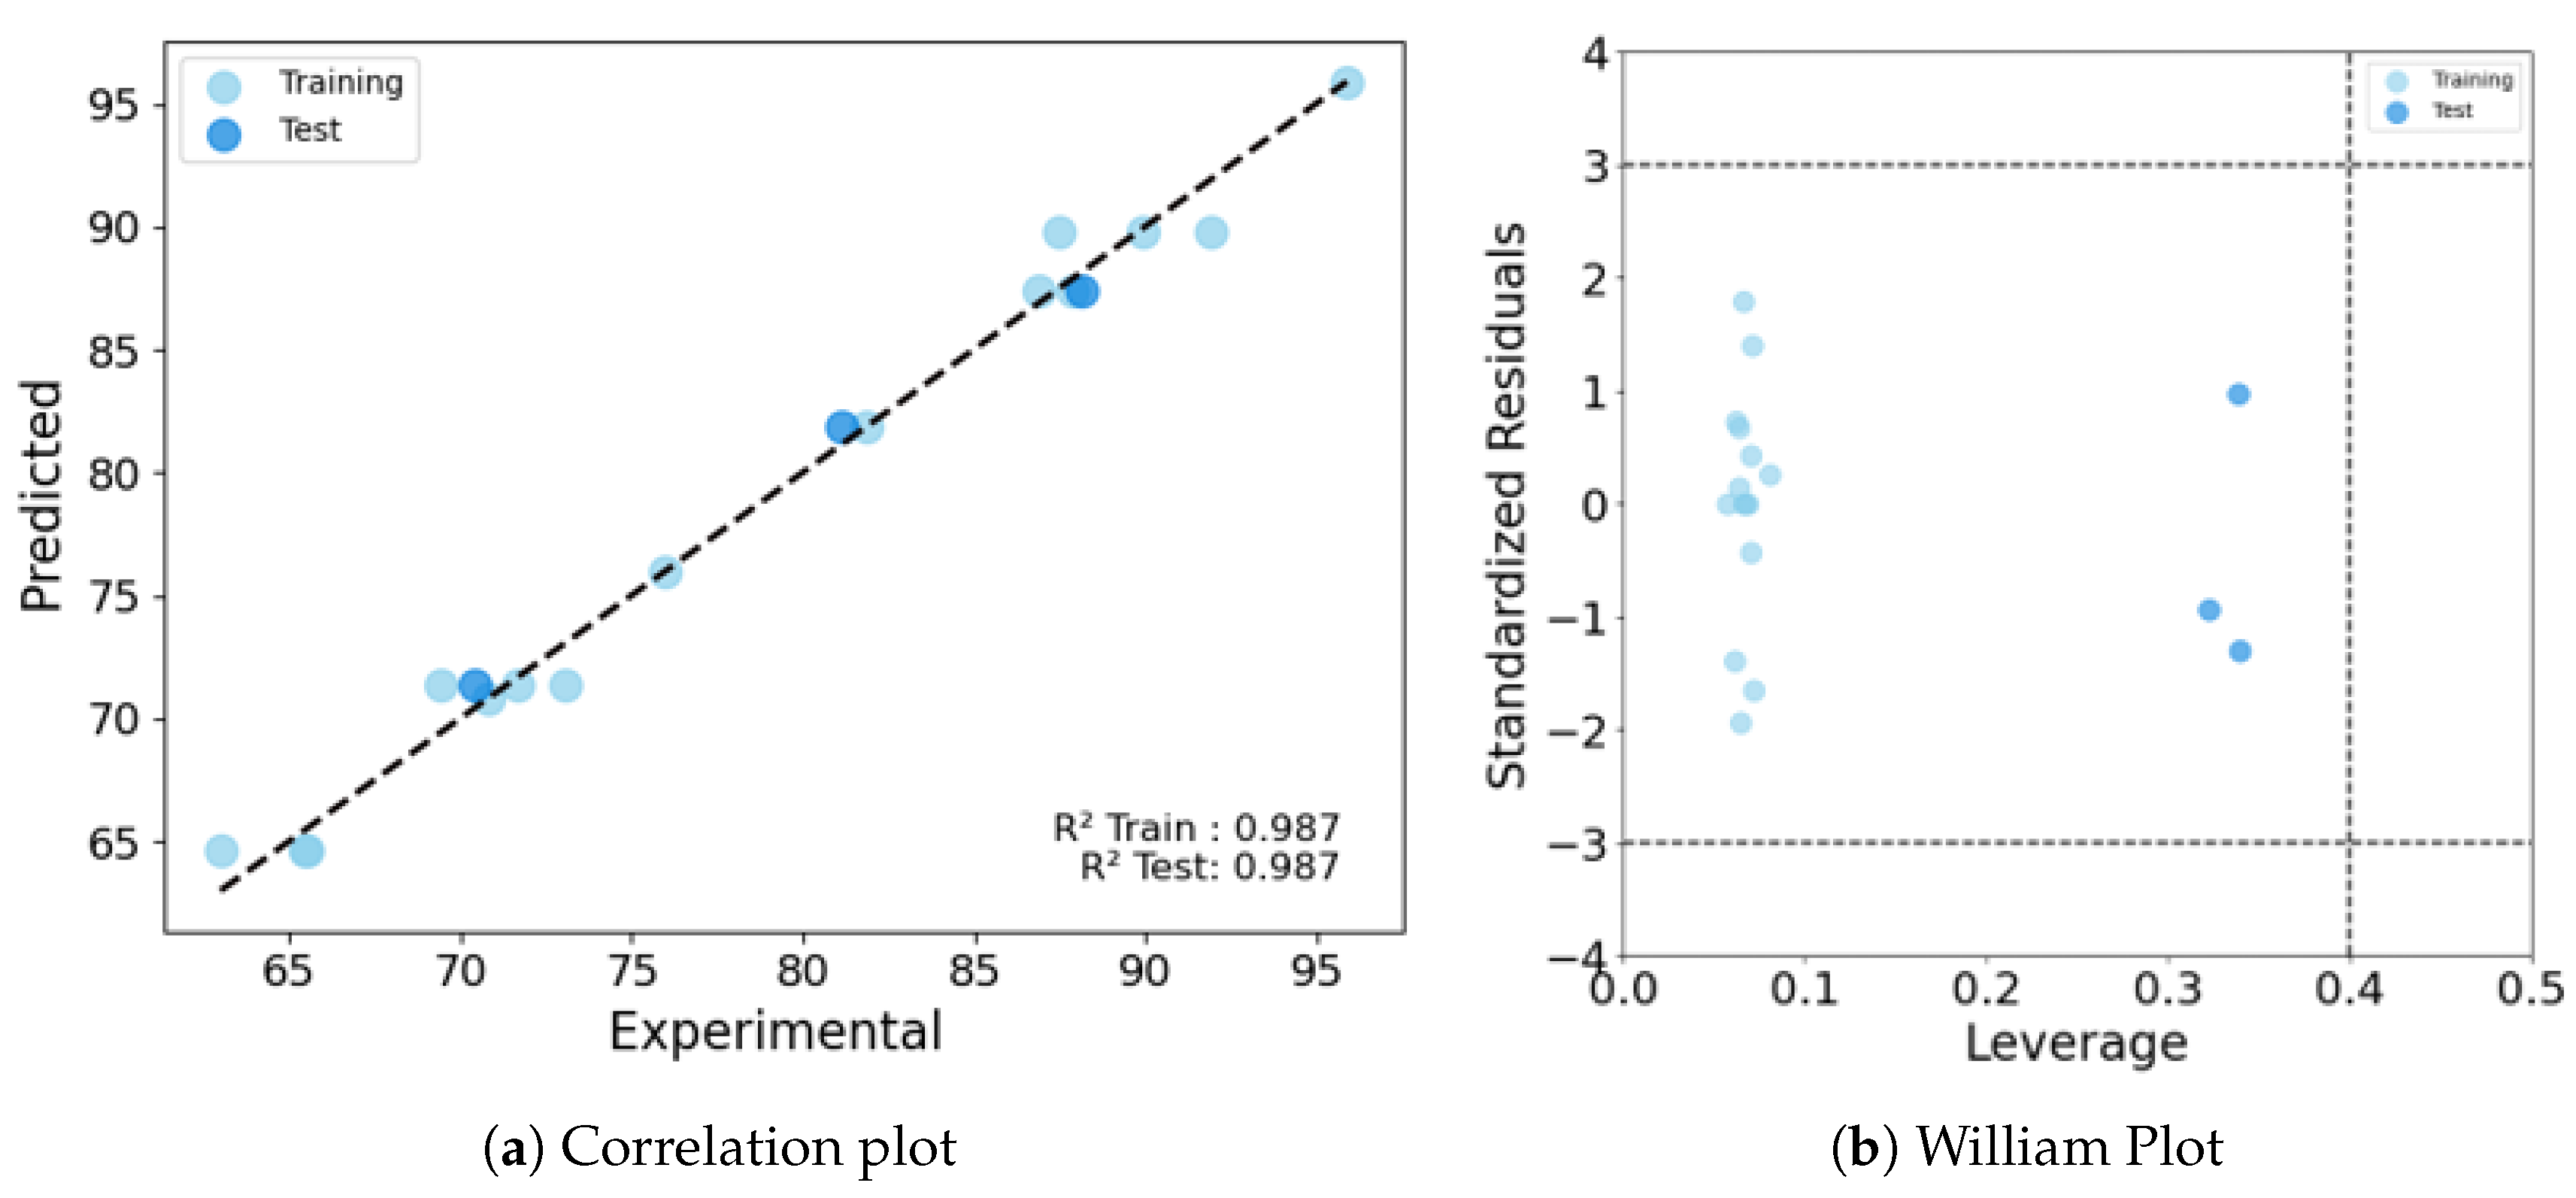
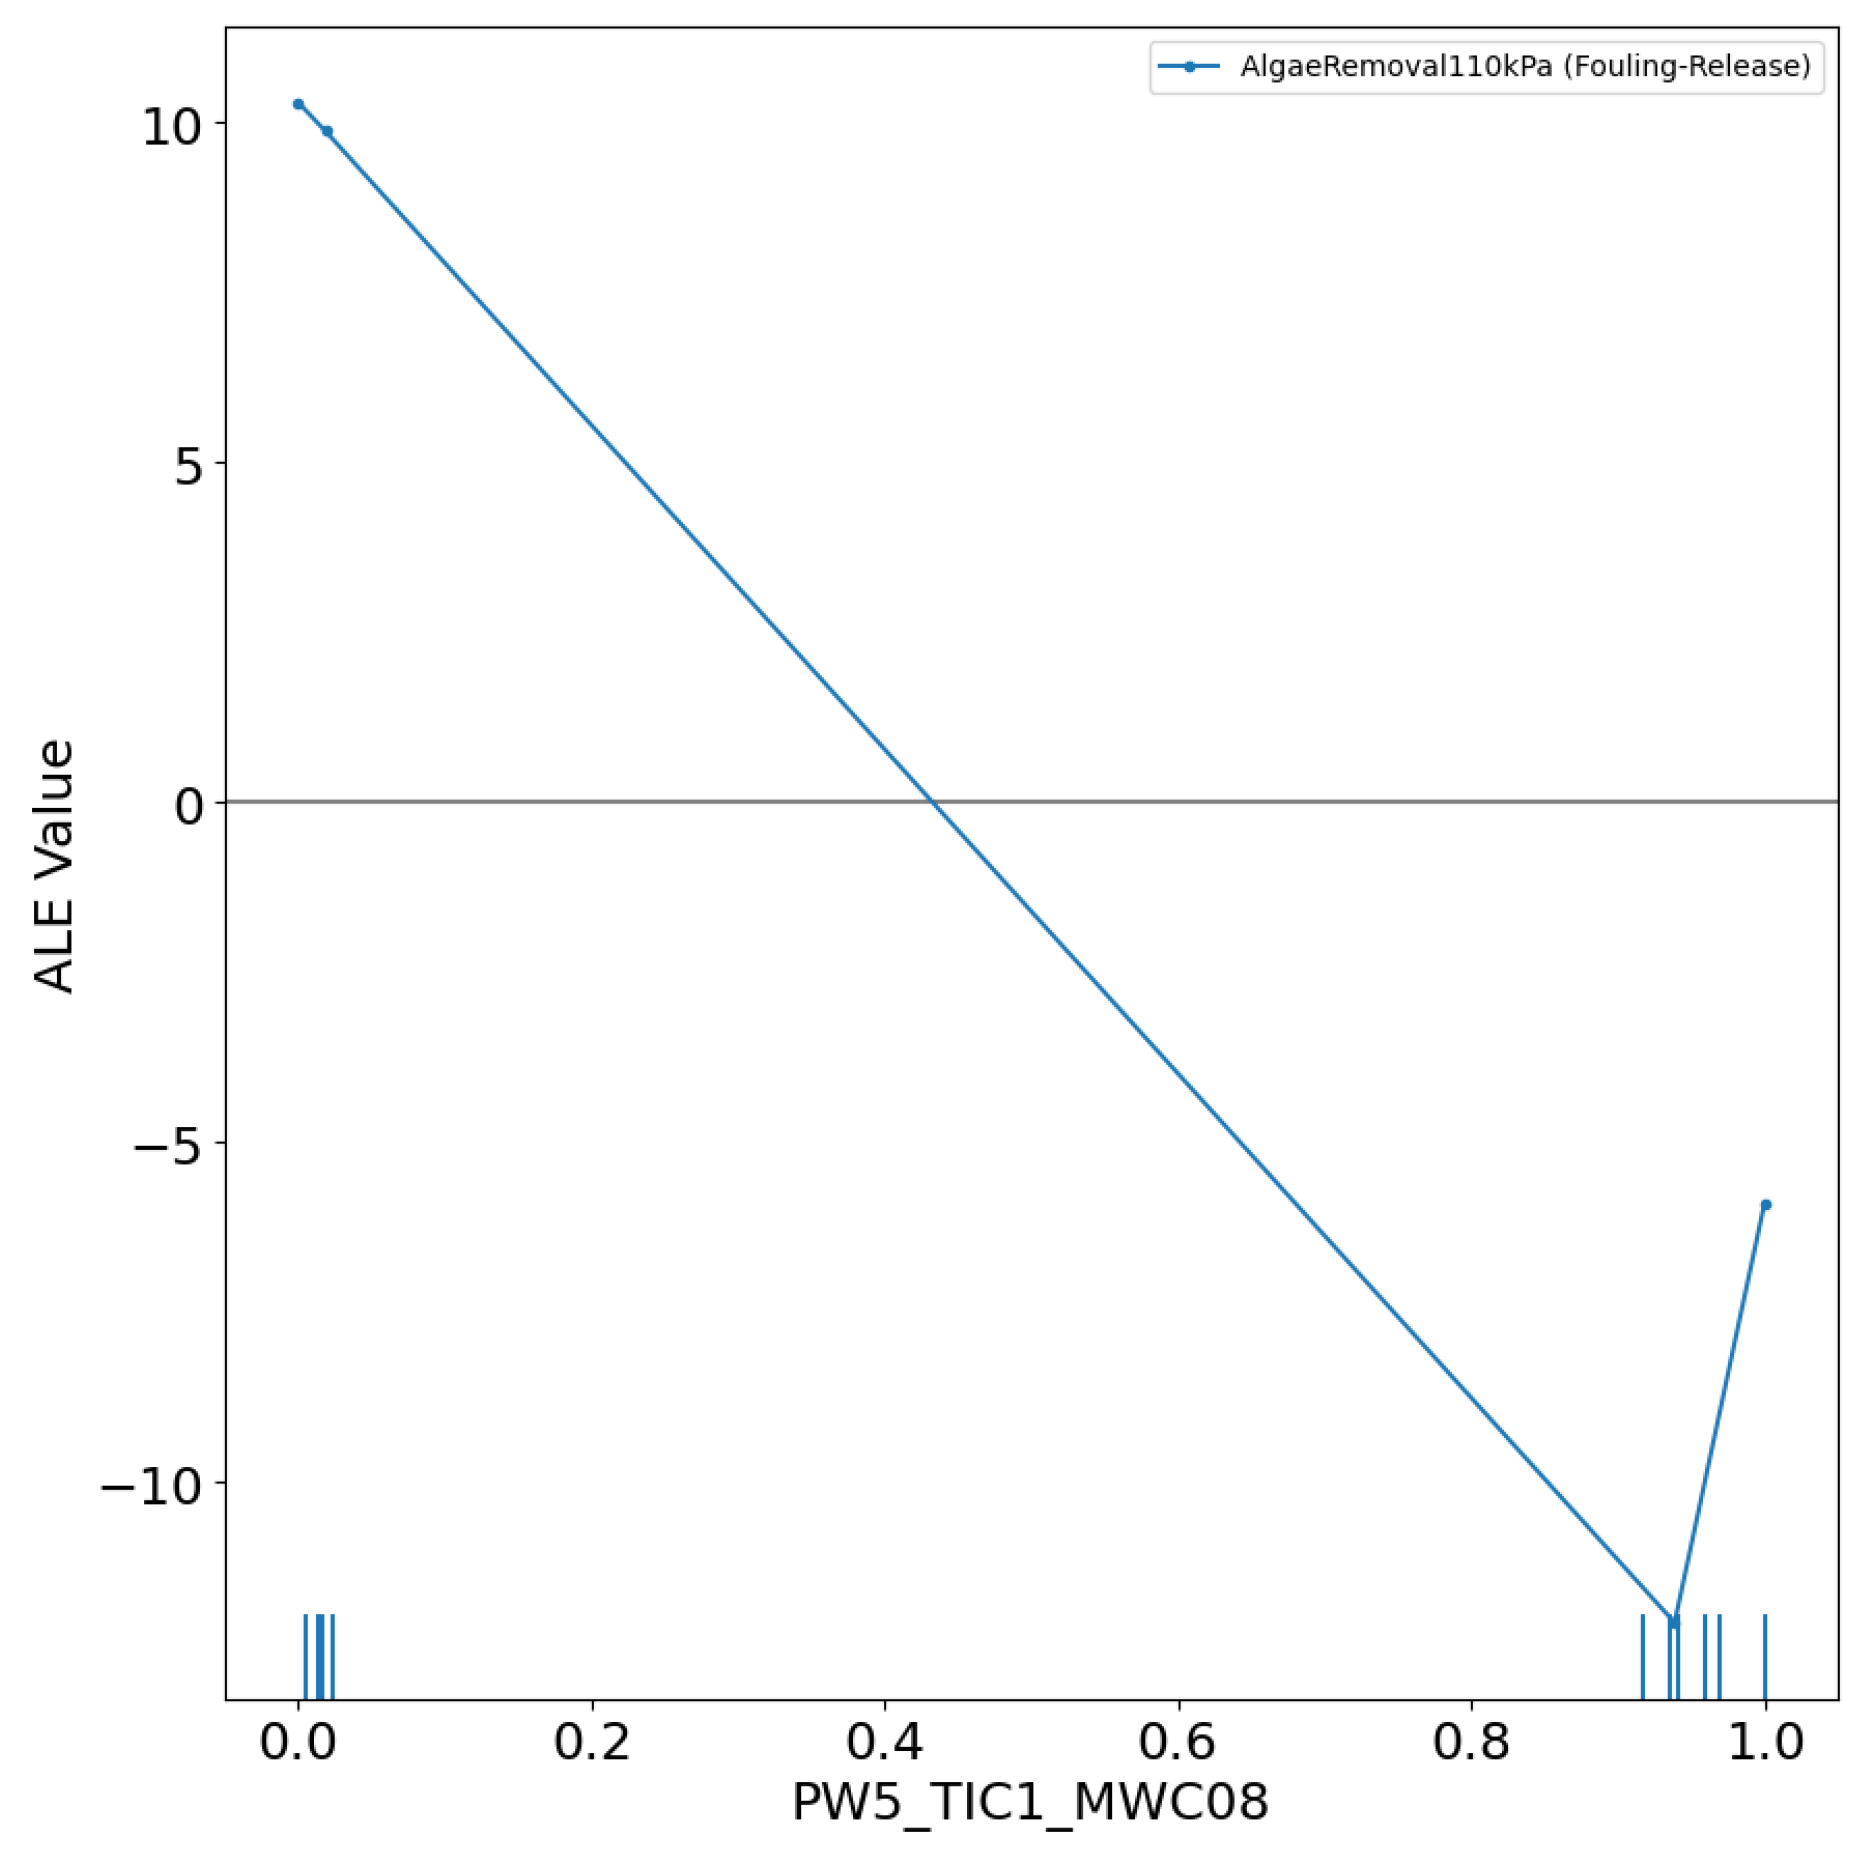
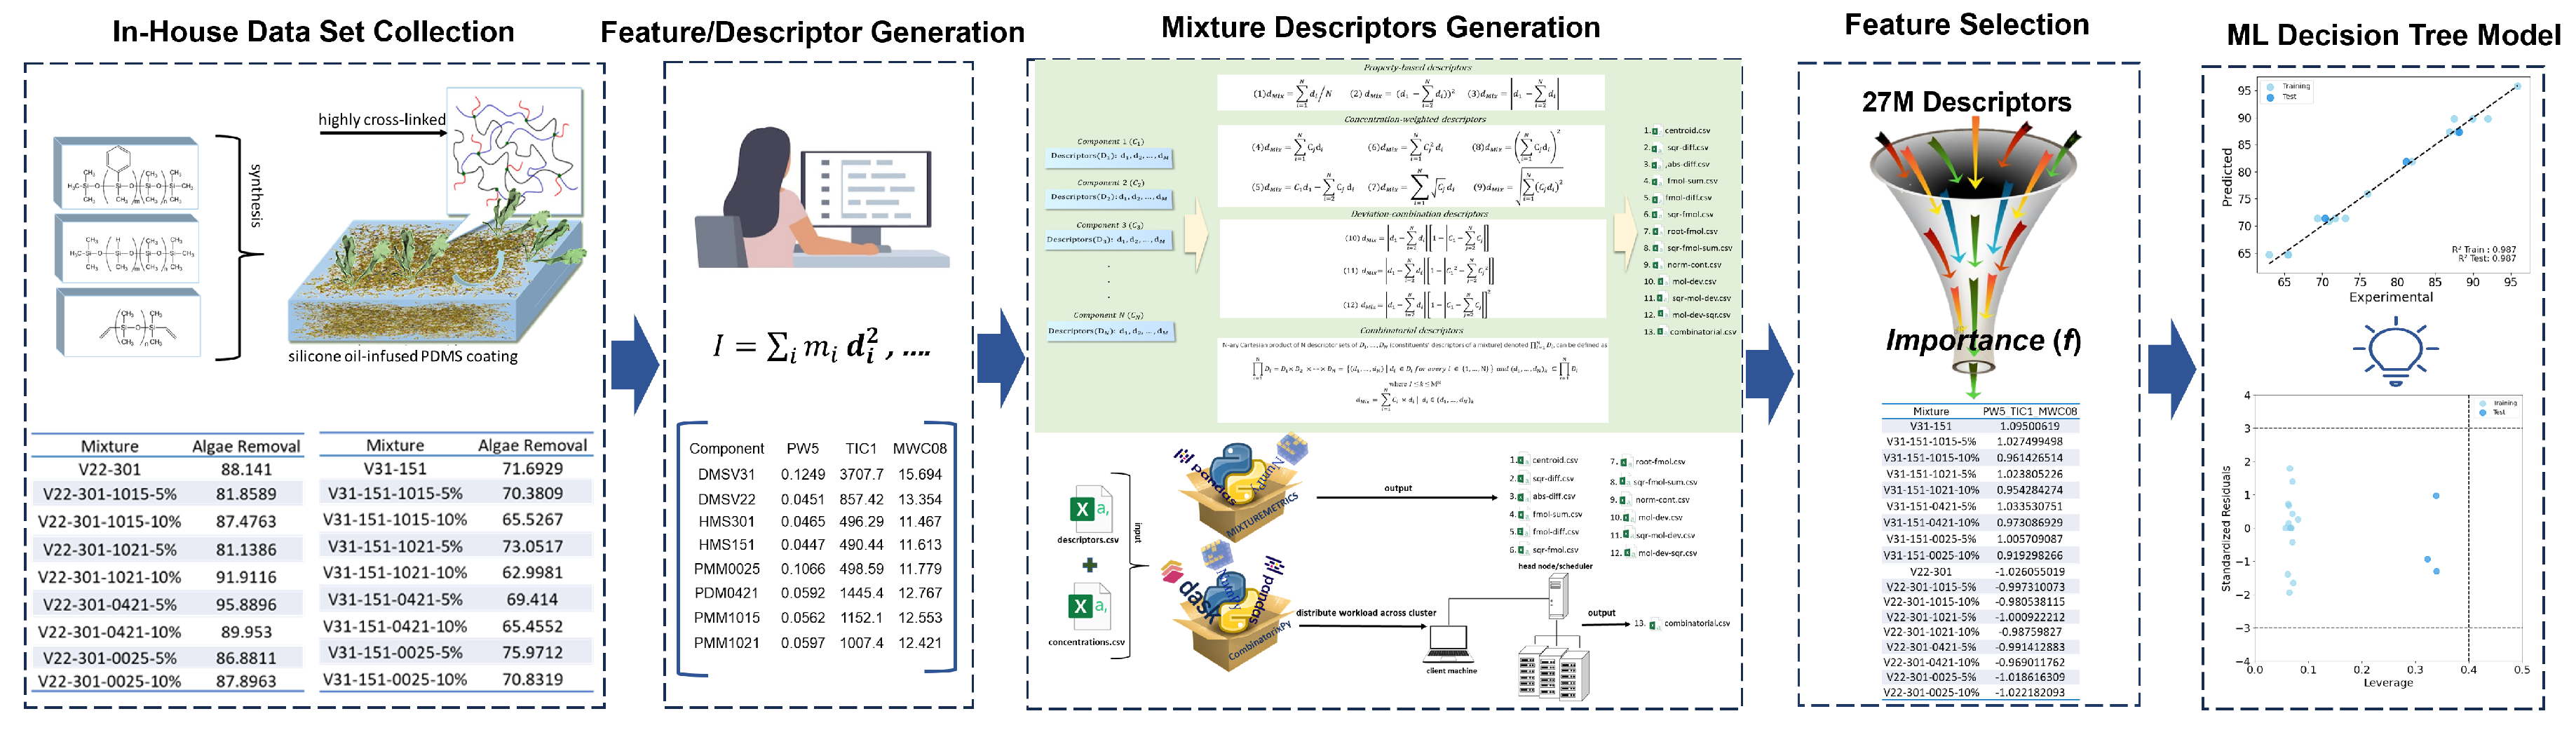
The Quantitative Structure-Activity Relationship (QSAR) approach for predicting the biological activity and physicochemical properties of mixtures is gaining prominence, driven by the growing demand for highly engineered materials designed for specific functions. Developing mixture descriptors that effectively capture the intricacies of multi-component materials presents a significant challenge due to their structural complexity. We implemented a series of existing and new mixing rules to drive the mixture descriptors and develop mixture-based-QSAR (mxb-QSAR) models. We evaluated 12 additive mixture descriptors, and a novel non-additive combinatorial descriptor derived from the Cartesian product. These descriptors were used to model the fouling release (FR) property of 18 silicone oil-infused PDMS coating polymers by characterizing the removal of Ulva. linza. Various linear and nonlinear mxb-QSAR models were obtained using these 13 mixture descriptors. The best model, derived from the newly proposed Cartesian-based combinatorial mixture descriptors, employed a decision tree in combination with a two-stage feature importance feature selection. This model achieved a coefficient of determination R2 of 0.987 for both training and test sets, along with a cross-validation Q2 LOO of 0.791. The success of the nonlinear model and combinatorial descriptors underscores the significance of complex relationships among variables, as well as the synergistic effects of the components on fouling release properties.

Keywords: 
;  ;  ;  ;  

1. Introduction

Material discovery has been a driving force behind the advancement of human civilization from the earliest use of stone tools to the cutting-edge development of nanomaterials.[1] However, material design requires decades of research and resources to optimize experiments. Meanwhile, advancement in experimental techniques has led to a myriad of materials science data and large material databases. To harness the power of these experimental data in materials science, virtual testing of materials can be used to expedite the design and optimization of materials in silico.[2]
Since the 1950s, following the pioneering work of Alan Turing and Arthur Samuel in artificial intelligence (AI) and its subfield, machine learning (ML), the potential for machines to think, learn, and solve problems has been recognized across all scientific disciplines.[3,4] Statistical algorithms form the core of machine learning applications and much like researchers, improve their performance through training. These algorithms hold great potential in predicting the properties and activities of new materials. In June 1961, Corwin Hansch and Toshio Fujita laid the groundwork for the development of Quantitative Structure-Activity Relationship (QSAR) by introducing a systematic approach to correlate chemical properties with biological activities. Hansch-Fujita model employs multiple linear regression to quantitatively relate physicochemical parameters of hydrophobicity, electronic effect, and steric factors to compounds’ biological activity. [5,6] Since then, the terms QSAR and QSPR (Quantitative Structure–Property Relationship) have become established in computational chemistry, describing statistical models that link a molecule’s structure to its biological activities or its physical and chemical properties.
Although Hansch analysis is based on a linear relationship between structural compounds and biological activities, there are many cases where the relationship is complex and nonlinear, requiring nonlinear algorithms to identify the pattern. The most widely adopted form of machine learning in materials science is supervised learning,[7] which follows principles similar to standard fitting procedures and relies on a labeled training dataset. Its goal is to uncover the underlying function that links known inputs to unknown outputs. The initial application of ML in material science primarily focused on using statistical methods and early forms of data mining to analyze experimental data, supported by early computational programs to handle numerical calculations.[8] Initial studies employed relatively simple and standard regression/classification ML models,[9] such as linear regression, decision trees, [10] and k-nearest neighbors, [11] to correlate material properties with their structural features. In 1989, [12] Thomsen and Meyer used neural networks for pattern recognition in the proton Nuclear Magnetic Resonance spectra of sugar alditols. Introduced in 1995, [13] support vector machines (SVM) have since become one of the most promising machine learning tools in predictive QSAR/QSPR. Proposed by Breiman, [14] random forest is one of the most effective ensemble methods, combining multiple decision tree predictors to improve predictive accuracy and robustness. The random forest offers unique built-in features including out-of-bag performance estimation, measures of descriptor importance, and an intrinsic proximity measure for assessing molecular similarity, making it suitable for QSAR tasks.[15]
Advances in computational power and the rapid growth of molecular databases for virtual screening have led to the development of sophisticated deep learning algorithms capable of recognizing complex patterns in big data and producing accurate predictions. [16] As model complexity increases, their predictive power improves. However, evaluating performance, comparing applicability, and interpreting these black-box models to extract meaningful insights become increasingly challenging. [17] It is crucial to balance model complexity with the amount of available data. This means that the number of estimated parameters should be significantly smaller than the effective number of degrees of freedom (number of samples - number of parameters) to avoid overfitting. [11] As a general rule, experimental chemists prefer simpler and more interpretable models over more accurate but complex ones, as this aids in the synthesis process.
Traditional machine learning approaches in chemical data analysis rely on conventional chemical descriptors that quantitatively represent the chemical structure based on mathematical procedures. However, the adaptation of deep learning to chemical data sets requires novel types of molecular representations, known as molecular embedding, where the molecular structure is represented by numerical vectors that capture essential chemical information. [18] On the other hand, graph-based deep learning models, use a graph molecular representation as input, where the basic chemical information is encoded as a set of atoms (nodes) and bonds (edges). [19]
Molecular descriptors map a compound’s structure into a set of numerical or binary values that represent various molecular properties crucial for explaining its activity.[20] There are two broad categories of molecular descriptors: experimental measurements, such as dipole moment and polarizability, and theoretical molecular descriptors derived from the symbolic representation of molecules, ranging from 0D to 4D. Various software tools, such as RDKit and alvaDesc are available to calculate and analyze conventional molecular descriptors and fingerprints. [20,21]
The conventional chemical representation and machine learning models have limited applicability for predicting the properties of multi-component materials due to their unique structural features. [22] A commonly employed method for studying the properties of multi-component materials is to model them as mixture systems. In such systems, the components are physically combined rather than chemically bonded, allowing them to preserve their individual properties. This approach involves predicting the properties based on the characteristics of the individual constituents and their concentrations within the mixture. There have been several attempts to predict the properties of complex materials, primarily focusing on binary compounds. However, a systematic approach for calculating mixture descriptors, especially for multi-component materials, is notably absent.
To apply QSAR and QSPR models for characterizing the activities and properties of mixture materials, the choice and quality of the mixture descriptors are more crucial than the statistical model used. [23] There are different mathematical equations called mixing rules that can be used to calculate the mixture descriptors. Various mixing rules have been proposed to calculate the properties of a mixture by combining the properties of its pure components and their respective mole fractions.[24] All published mixture rules to calculate mixture descriptors can generally be categorized into two main types of additive and non-additive. [23] Additive mixture descriptors are based on the assumption that there are no significant interactions between the components of the mixture. This approach simplifies the representation of mixture properties by considering only the independent contributions of each component. In contrast, non-additive mixture descriptors offer a more accurate depiction of complex behaviors by incorporating the effects of intermolecular interactions and dependencies between constituents. [23]
Numerous QSAR and QSPR studies on mixtures have utilized additive mixture descriptors, which are derived from the descriptors of individual components and their respective concentrations. The most widely used and effective approach involves the sum of weighted descriptors by concentration, which has been applied to model various mixture properties. [25,26,27,28]. Ni et al. utilized this mixture descriptor to predict the lower and upper flammability limits of fuel mixtures, achieving an external validation R 2 greater than 0.9 using a MLR model. [27] In another study, the MLR model which utilized the sum of weighted descriptors by molar fractions, demonstrated superior predictive performance to characterize the vapor-liquid critical volume of binary mixtures [25] In 2006, [29] Ajmani et al. utilized ensemble neural network (NN) models combined with average weighted descriptors by mole fraction to predict the density of binary mixtures. Their approach demonstrated notable accuracy, with the ensemble NN models achieving a higher external R 2 value of 0.85, outperforming other predictive methods. However, in terms of interpretation, they found the results unsatisfactory, which could be partly due to the neglect of interaction effects in complex mixtures. To obtain more interpretable results, the same team introduced non-additive descriptors in 2008 to capture hydrogen bonding and dipole-dipole intermolecular interactions between the molecules. They developed a predictive QSPR model to characterize the infinite dilution activity coefficients of mixtures, achieving R t e s t 2 value exceeding 0.9. This result underscores the model’s accuracy and highlights the importance of considering hydrogen bonding and dipole–dipole intermolecular interactions. [30] In 2010, they expanded the application of their proposed non-additive mixture descriptors in a QSPR study to predict excess molar volume and mixture density.[31] They concluded that the descriptor accounting for hydrogen bond interactions had a more significant influence on both endpoints compared to the descriptor representing dipole moment interactions. In 2015, Gaudin et al. proposed 12 new and existing additive formulae to calculate mixture descriptors for predicting the flash point of binary mixtures using an MLR model.[22] They considered the linear or nonlinear dependencies of the flash point on the concentration of each compound when calculating mixture descriptors. They reported that the squared sum of weighted descriptors by mole fractions is the best model, with an external mean absolute error (MAE) of 10.3 °C, meaning the model’s predictions are, on average, 10.3°C off from the actual flash points. Mixture descriptors can also be derived by weighting pure component descriptors using properties other than molar fractions, such as potential energy. For instance, Faramarzi et al. used 22 additive mixture descriptors that incorporate both linear and nonlinear contributions of the potential energy and molar fraction of each component to predict the boiling point of binary azeotropes.[32] Upon comparison, the QSPR models built using these mixture descriptors revealed that the MLR model, which employed the sum of weighted descriptors squared by potential coefficients, achieved higher external R 2 value of 0.86. This demonstrates the effectiveness of considering the potential energy of each components in improving the predictive accuracy of the model. Later, they used the same set of mixture descriptors to analyze the boiling point of ternary azeotropes and found that the MLR model incorporating the squared sum of weighted descriptors by mole fractions outperformed other mixture descriptors models. [33] In 2019, Petrosyan et al. [34] advanced the concept of non-additive descriptors by employing a quadratic approximation of pure component descriptors to compute mixture descriptors, aiming to account for potential interactions between different components. They discovered that the MLR model based on this combinatorial approach performed slightly better than of additive mixture descriptors in predicting the glass transition temperatures of complex polymeric coatings.
In an attempt to automate the calculation of mixture descriptors, two Python packages (MixtureMetrics and combinatorixPy) capable of computing 13 distinct mixture descriptors have been developed by Rasulev Research Group at NDSU.[35,36] These descriptors encompass both additive representations, which capture linear and nonlinear relationships among pure descriptors and their mole fractions, as well as a non-additive combinatorial approach that computes all potential interactions within the mixture. [35,36] These packages can enhance the efficiency and accuracy of virtual screening processes by enabling the screening of large datasets from virtual libraries across various endpoints.
One such endpoint is the antifouling activity of coating polymers, which accounted for a global market size of $9.48 billion in 2023. [37] Biofouling is the detrimental accumulation of micro- and macro-organisms on submerged structures surfaces. It affects all marine infrastructure, including ship hulls and seawater pipelines of nuclear power plants, as well as aquaculture operations. [26] Recently, silicone-based elastomers have been favored for their non-toxic fouling release (FR) properties because of their low surface energy and elastic modulus.[38] The FR capability of silicone-based FR coatings can be enhanced by incorporating nonbonding silicone oils into the coating matrix to modify their mechanical resistance [39]. The synthesis of these materials involves experimental combinatorial analysis to identify the optimal composition of components to achieve the desired surface properties in a polymer coating. [40] Experimental combinatorial analysis has limitations in generating a restricted range of polymer coating materials. Consequently, it does not directly pinpoint the crucial structural elements that lead to the optimal release of biofouling from coating surfaces. In this scenario, predictive QSAR machine learning models can help to understand these critical attributes and provide information for further improvement of coating systems [26]. In this regard, Rasulev et al. [26] developed the first mixture-based QSAR models to predict the FR activity of polysiloxane coatings, utilizing a sum of weighted descriptors by mole fraction. They developed MLR and decision trees classification models to characterize FR activity of different marine organisms. Their findings conclude that certain structural and physicochemical principles, including polarizability, mass, size, and volume of components, contribute to the observed fouling release properties. [26] Building on this, Khanam et al. employed the sum of concentration-weighted descriptors to develop QSAR models for silicone oil-modified siloxane polyurethane coatings that predict FR activity. This approach leveraged MLR and RF models to predict various physical properties, such as surface energy and fouling release characteristics, in relation to different marine organisms. The developed models identified key descriptors related to polarizability, van der Waals volume, and molecular mass of the silicone oil.[28]
This study aimed to develop mixture-based Quantitative Structure-Activity Relationship (mxb-QSAR) machine learning models to predict the fouling release activity of silicone oil-infused silicone elastomers synthesized by the Webster Research Group at NDSU. The primary objective was to evaluate the effectiveness of 13 newly developed and existing mathematical functions for mixture descriptors, recently introduced by our research group, in building predictive models for this specific property (see Figure 1).

2. Materials and Methods

2.1. Experimental Data

The Webster Research Group at NDSU synthesized 18 fouling release coating samples using the following materials: vinyl-terminated polydimethylsiloxane or PDMS (DMS-V22 and DMS-V31) as the base polymer, poly(methylhydro-co-dimethyl) siloxane compounds (HMS-151 and HMS-301) as crosslinkers, the SIP6830.3 platinum catalyst, the SIT7900.0 moderator, and four types of silicone oils (PMM-0025, PMM-1015, PMM-1021, and PDM-0421) sourced from Gelest, Inc. The oils were incorporated into the formulation in quantities ranging from 5% to 10% by weight of vinyl terminated PDMS (Table 1). The silicone oils’ structures obtained from NMR (Nuclear Magnetic Resonance) are included in Table 2.

2.2. Biological Assay

Biological assay was conducted at Newcastle University to assess the FR properties of experimental coating systems. The FR evaluation primarily focused on assessing the release behaviors of green macroalgaeUlva. linza.
The experimental procedure involved adding filtered artificial seawater to each well of the plates, shaking them for 18 hours, and transferring the leachate to new plates. These plates received a suspension of U. linza spores and were incubated in darkness, then moved to an illuminated incubator at 18°C with a 16:8 light-dark cycle.
Each row of wells on the plates was subjected to spray treatment using the spinjet apparatus at an impact pressure of 110 kPa. Chlorophyll was extracted from the sporelings using DMSO (dimethyl sulfoxide), and chlorophyll fluorescence was measured with a Tecan plate reader.

2.3. Molecular Descriptors

To capture the relationship between the component structure and FR activities, a set of descriptors were computed for each component of the coating polymer to generate the computational representation of the chemical structure. The structures were constructed and prepared using Marvin sketch software, and AlvaDesc 2.0.16 software was used to generate a set of descriptors.[20,41] AlvaDesc software calculates 33 different logical blocks of descriptors, covering a wide range of theoretical approaches. AlvaDesc provides 4000 non-3D structural information, including constitutional, topological, and connectivity indices. It also incorporates information indices, drug-like indices, as well as functional groups, and walk and path counts. Additionally, alvaDesc provides approximately 1,500 descriptors based on 3D molecular geometry, such as 3D matrix-based descriptors, 3D-MoRSE (Molecular Surface Electrostatics) descriptors, RDF (Radial Distribution Function) descriptors, and GETAWAY (GEometry, Topology, and Atom-Weights AssemblY) descriptors. [20] Descriptors with missing values for any component, or those that were constant or nearly constant, were excluded. After this filtering process, about 1997 unique descriptors were generated for each pure component of the polymer coating. All molecular descriptors were normalized prior to the calculation of the mixture descriptors.

2.4. Mixture Descriptors

We are using two Python packages, MixtureMetrics and combinatorixPy developed in our previous studies to calculate 13 mixture descriptors.[35,42] These mixture descriptors calculated from molecular descriptors of the components of the mixtures and their mole fraction using 13 different mixing rules. The first 12 mixture descriptors categorized as additive which refers to additive nature of the overall property of the materials based on components concentrations, without any synergism [43]. These mixing rules calculate the linear and nonlinear relationships of different components in reaction and their weighted mole fraction. We calculated 1997 mixture descriptors for each of the 12 additive descriptors using the MixtureMetrics package. [35]
The last mixture descriptor, combinatorial descriptors, computes the Cartesian products over sets of descriptors of components in a mixture which incorporate all possible higher-order interactions between different components. The total number of combinatorial mixture descriptors grows exponentially as the number of pure descriptors (M) and the number of components per mixture (N) grow following ( M N ). To optimize computational resources and reduce the number of combinatorial descriptors, we should retain only a selected subset of the most relevant pure descriptors. We selected 300 individual descriptors through Sequential Feature selection (forward) from the set of 1997 fmol-sum descriptors. Then, we used them as input to the combinatorixPy package to create 27M combinatorial mixture descriptors.
These mixing rules are shown as follow where N is the number of components, d i denotes as descriptor, C indicates as mole fraction and k is the number of possible combination tuples in Cartesian product ( 1 k M N ):
d c e n t r o i d = i = 1 N d i N
d s q r d i f f = ( d 1 i = 2 N d i ) 2
d a b s d i f f = | d 1 i = 2 N d i |
d f m o l s u m = i = 1 N C i d i
d f m o l d i f f = C 1 d 1 i = 2 N C i d i
d s q r f m o l = i = 1 N C i 2 d i
d r o o t f m o l = i = 1 N C i d i
d s q r f m o l s u m = ( i = 1 N C i d i ) 2
d n o r m c o n t = i = 1 N ( C i d i ) 2
d m o l d e v = | d 1 i = 2 N d i | [ 1 | C 1 i = 2 N C i | ]
d s q r m o l d e v = | d 1 i = 2 N d i | [ 1 | C 1 2 i = 2 N C i 2 | ]
d m o l d e v s q r = | d 1 i = 2 N d i | [ 1 | C 1 i = 2 N C i | ] 2
N-ary cartesian product of N descriptor sets of ( D 1 , , D N ) , can be defined as:
i = 1 N D i = { ( d 1 , , d N ) | d i D i for every i { 1 , , N } } and ( d 1 , , d N ) k i = 1 N D i where 1 k M N
d c o m b i n a t o r i a l = i = 1 N C i d i | d i ( d 1 , , d N ) k

2.5. Machine Learning Model Development and Validation

After the calculation of all the mixture descriptors, the next step was to create QSAR models to find the relationship between biological activities and molecular descriptors. We created QSAR models to find the correlation between the mixture descriptors and the FR activity of algae removal at 110 kPa of the coating polymers using supervised machine learning in scikit-learn library [44]. To manage and learn from the high-dimensional mixture descriptors, the feature importance attribute of the random forest regression model from the scikit-learn API has been used for feature selection. [45] To select the optimal subset of features for our disproportionately high-dimensional, low sample size dataset from combinatorial descriptors, we employed a two-stage feature selection approach leveraging feature importance. In the first stage, feature importance was used to identify an initial subset of relevant features. This subset was then utilized as input for a second round of feature importance analysis, refining the selection to produce the final output. [46] On the other hand, feature selection for the 12 additive mixture descriptors was performed in a standard manner, utilizing a one-stage feature importance approach. A final subset of three descriptors was selected from each of the 13 mixture descriptor sets to develop machine learning models. The feature importance formula has been shown as follows (equation 14) while S parent is the set of data points in the parent node, S 1 , and S 2 are the sets of data points in the child nodes and | S 1 | and | S 2 | are the sizes of the child nodes.
I m p o r t a n c e ( f ) = i splits using f MSE ( S parent ) | S 1 | | S parent | · MSE ( S 1 ) + | S 2 | | S parent | · MSE ( S 2 )
To apply the QSAR models, the set of 18 coatings was divided into 80% training (15 coatings) and 20%test sets (3 coatings). We applied different linear and nonlinear models in the scikit-learn library including multiple linear regression (MLR), LASSO (least absolute shrinkage and selection operator), decision tree, random forest, and support vector regression (SVR) with linear kernel to predict the FR activity using different mixture descriptors.
The MLR model predicts the value of the dependent variable based on the linear combination of the independent variables. The MLR model has been shown in the form of equation 15 where y is the dependent variable, x 1 , x 2 , x p is the independent variables (features), w 0 is intercept, w 1 , w 2 + w p are coefficients of features and ϵ is the error term.
y = w 0 + w 1 x 1 + w 2 x 2 + + w p x p + ϵ
The LASSO regression is a type of linear regression that uses L1 regularization that modifies the standard linear regression model by adding a penalty ( λ j = 1 p | w j | ) proportional to the absolute value of the coefficients, which helps in both regularizing the model and performing feature selection by forcing some coefficients to exactly zero. The equation 16 shows that objective is to minimize the sum of the squared residuals and the L1 regularization penalty, and λ is the regularization hyperparameter that controls the strength of the penalty.
min w 1 2 N i = 1 N y i x i T w 2 + λ j = 1 p | w j |
The decision tree model builds a single tree by choosing optimal splits based on a criterion (MSE for regression) while each branch represents a decision rule, and each leaf node represents an output label or prediction. The random forest model is an ensemble learning method that builds multiple decision trees, using random feature subsets for splits, and aggregates the results to improve accuracy and reduce overfitting.
The SVR is a type of SVM used for regression problems. It identifies the optimal hyperplane (or decision boundary) that fits the data within a specified epsilon margin of tolerance, minimizing the regression error for data points outside this margin, while also reducing model complexity by keeping the weights small. The SVR model can be linear and nonlinear, in linear SVR, we aim to fit a linear function mentioned in equation 17, where x: the input vector, w: the weight vector, and b is the bias term. The equation 18 sets up the SVR minimization problem combining the regularization term 1 2 w 2 with the slack penalty terms C i = 1 n ( ξ i + ξ i * ) where C is the regularization parameter, ε is the margin of tolerance around the predicted values and ξ i , and ξ i * are the slack variables for errors beyond the ε margin. Also in equation 19 the "subject to" constraints specify that y i ( w T x i + b ) ε + ξ i is upper bound constraint and w T x i + b does not exceed y i by more than ε plus any allowable slack ξ i . The second constraint ( w T x i + b ) y i ε + ξ i * is there to ensure that f(x) is not below y i by more than ε plus slack ξ i * . The last constraint shows that the slack variables must be non-negative.
f ( x ) = w T x + b
min w , b , ξ , ξ * 1 2 w 2 + C i = 1 n ( ξ i + ξ i * )
subject to : y i ( w T x i + b ) ε + ξ i , ( w T x i + b ) y i ε + ξ i * , ξ i , ξ i * 0 .
The quality of the QSAR models was evaluated by examining the statistical parameters of the regression in both internal validation and external datasets. The coefficient of determination or R 2 , mean-absolute errors (MAE), and root-mean-square errors (RMSE) were measured for both training and test datasets. These statistical metrics are shown as follow where y i is the actual value of the i-th observation, y ^ i is the predicted value of the i-th observation, y ¯ is the mean of the actual values, and n is the the number of data points. predictions.
R 2 = 1 i = 1 n ( y i y ^ i ) 2 i = 1 n ( y i y ¯ ) 2
M A E = 1 n i = 1 n | y i y ^ i |
R M S E = 1 n i = 1 n ( y i y ^ i ) 2
We also applied the leave-one-out (LOO) cross-validation method to assess model performance, as it is commonly used with smaller datasets [47]. The accumulated local effect (ALE) approach was employed to visualize the impact of each mixture descriptor on the prediction of fouling release (FR) activity. [48] Additionally, the applicability domain (AD) is depicted by William plot, which defines a square region within ±3 standard deviations, with a leverage threshold (h*) of 0.4, calculated using the formula 3 ( p + 1 ) / n , where n is the number of samples in the training set and p is the number of model variables. [49,50] The workflow for this study is depicted in Figure 1.

3. Result and Discussion

In this study, we investigated the use of 13 different mixture descriptors to predict the FR activity of 18 polymer coating samples. A mixture-based QSAR approach (mxb-QSAR) was applied to explore the structure-activity relationships within a dataset comprising binary and ternary mixtures. This analysis evaluated the potential of the proposed mixing rules for developing predictive models of FR activity, providing a foundation for designing novel polymeric materials with desired FR properties.
Selecting an optimal and cost-effective feature selection method is crucial for managing and reducing complexity, particularly in the context of high-dimensional learning. These datasets often include a large number of features relative to the limited number of samples, as seen with combinatorial descriptors. The primary challenge of high-dimensional, low-sample-size datasets is the increased risk of overfitting, making it crucial to identify the most relevant subset of features. This approach helps mitigate the curse of dimensionality while ensuring model efficiency and robustness. Although univariate methods can be overly simplistic and lead to suboptimal results, multivariate feature selection techniques for high-dimensional data often come with exceptionally high computational costs. To address these challenges and adhere to the principle of Occam’s razor—favoring the simplest effective approach—we employed a two-stage feature selection strategy leveraging feature importance to handle combinatorial descriptor datasets.[51] We utilized a random forest-based feature importance metric, which evaluates each feature’s relevance by measuring the reduction in mean squared error (or mean decrease in impurity) achieved when the feature is used to split data across the forest. [14] Feature importance in tree-based models, such as random forests, reflects the predictive power of individual features by accounting for their contributions across all trees in the ensemble. [15] While the random forest model captures nonlinear and multivariate relationships among features during training, the resulting feature importance scores are primarily univariate, assessing each feature’s independent contribution to predictions in a computationally efficient manner. This means that, although the splitting criterion for feature importance is not explicitly multivariate and does not directly quantify interactions between features, feature importance may still be indirectly influenced by interactions and redundancies among features in the training set through the model-building process. So, sequential application of feature importance in a two-stage process further refines the selection outcome, enhancing robustness. Additionally, this method preserves the original meaning of the selected features, ensuring interpretability without requiring transformations of the input data.
We applied five different linear and nonlinear algorithms to all 13 mixture descriptors, with their details and performances summarized in Table S1 and Figure S1 in the Supporting Information. Figure 2 shows the best model developed for each mixture descriptors. It shows that model developed from combinatorial descriptors performed better compared to the other 12 additive descriptors. There is three main groups in additive descriptors property-based descriptors (centroid, sqr-diff, and abs-diff), concentration-weighted descriptors (fmol-sum, fmol-diff, sqr-fmol, root-fmol, sqr-fmol-sum, and norm-cont) and deviation-combination descriptors (mol-dev, sqr-mol-dev, and mol-dev-sqr). [22,32,35] Among the 12 additive mixture descriptors the concentration-weighted descriptors except norm-cont achieved the highest performance, with both training and test R 2 scores exceeding 0.9 (see Figure 4 and Table 3). The efficiency of the mixture descriptors in terms of R 2 was as follows: fmol-diff > root-fmol > sqr-fmol > sqr-fmol-sum > fmol-sum for the training set, while for the test set, fmol-sum = sqr-fmol-sum > root-fmol > fmol-diff > sqr-fmol showed the highest values. This observation indicates the linear and nonlinear effects of the concentration of each component on FR activity of algae removal. Previous studies have been shown that the components’ concentrations and relative concentration of components compared to each other have significant effect on FR activities. [26,52] Stafslien et al. observed that removal of two marine bacteria (C. lytica and H. pacifica) positively correlated with TMS-PEG and CF3-PDMS content in polysiloxane-based coatings. [52] They noticed that the lower concentration or absence of CF3–PDMS components greatly affects the FR properties. [26,52] The combinatorial and fmol-diff descriptors performed best with the decision tree (DT) model, while fmol-sum, sqr-fmol, root-fmol, and sqr-fmol-sum descriptors showed superior results with the random forest (RF) model. Both models are inherently nonlinear, allowing them to effectively capture complex relationships between mixture descriptors and FR activity. Property-based descriptors showed the best performance in linear models, while deviation-combination descriptors excelled in random forest models, showing minimal to pronounced signs of overfitting (see Figure 2). The highly performed models with additive descriptors consist of Mor09m, RDF115i, RDFo95i, and RDF015v descriptors (see Table 3). All descriptors are 3D molecular descriptors that capture information about the three-dimensional spatial arrangement of atoms within a molecule. The Mor09m is 3D-MoRSE descriptor that is derived from short-distance atomic pairs. The descriptor is weighted by the atomic masses of the atoms involved in the pairs.[53] The Mor09m can be used to predict the C. lytica retraction and removal properties in polysiloxane-based polymer coatings based on the findings of Rasulev et al.[26]. They observed a positive correlation between Mor09m and FR properties of this bacterium. Tugcu et al. identified Mor09m, a mass-related descriptor, as positively linked to hydrophobicity in their QSAR analysis of phenols’ toxicity against Chlorella vulgaris. [54] The ALE plots in Figure S2 shows the positive relationship between average effect of Mor09m descriptor on the FR activity. This might be related to hydrophobic properties of the silicone oil-infused PDMS coatings as both PDMS and silicone oils are known for their hydrophobic characteristics.[55,56] Surface hydrophobicity is crucial for enhancing antifouling performance, as it creates a surface that repels water, making it hard for fouling organisms to adhere. [57]
The RDF115i, RDFo95i and RDF015v are radial distribution function descriptors that offers valuable insights into molecular geometry, spatial distributions, intermolecular and functional group interactions—key factors in understanding how foulants interact with surfaces. Examining fouling mechanisms through molecular dynamics studies, such as the one conducted by Nagumo, provides a theoretical foundation for understanding how close contacts and molecular orientations influence fouling behavior. This study demonstrated that a lower RDF value indicates reduced affinity between the binary mixture of acrylate/methacrylate polymer surfaces and organic solvent foulants, which determines the surface’s antifouling properties. [58] Two distinct RDF descriptors (RDF020m and RDF040m) have also been identified as correlated with fibrinogen adsorption on polymethacrylate surfaces in biomaterial implant. [59] This corroborates with our finding that has been shown in the Figure S2 in the Supporting Information. The ALE plots in Figure S2 reveals that RDF115i, RDFo95i and RDF015v have strong negative effect on the FR activity of U. linza removal from polymer coating surface and higher value of RDF descriptors would indicate stronger affinity and lower FR activity.

3.1. Details of the Best Model

The model issued from the Cartesian product of N sets of descriptors, representing the constituents of an N-component mixture, was selected as the best model among the 13 calculated mixture descriptors (see Table 4). These combinatorial mixture descriptors were calculated using the combinatorixPy package and encompassing all possible combinations of descriptors. The Table 4 shows the performance of the decision tree regression model developed from one combinatorial descriptor. The decision tree model was configured with a maximum depth of 3, a minimum of 2 samples required to split an internal node (min_samples_split), and a minimum of 1 sample required to be at a leaf node (min_samples_leaf). All other hyperparameters were left at their default values. Figure 3 illustrates the decision tree diagram along with the splitting thresholds at each decision point. The model’s performance shows a coefficient determination ( R 2 ) value of 0.987 for both training and test datasets which explains more than 98% of the variance in the FR activity in those datasets (see Figure 2). The prediction performance R t e s t 2 outperformed the other additive models by 4.78%. The model developed by Cartesian-based combinatorial descriptors also shows lower error (MAE and RMSE) and higher Q L O O 2 compare to the models developed by other 12 additive mixture descriptors (see Table 3, Table 4). The statistical validation result of LOO (leave one out) show that the developed model is robust and highly predictive and can generalize to new data by evaluating it on every individual data point. This cross-validation is efficient for small datasets and shows how sensitive the model is to each observation point. [47] The applicability domain of the QSAR model is defined as the chemical structure space characterized by the properties of the compounds in the training set. As shown in Figure 4, all predicted values for the mixtures fall within this defined area. Since all mixtures are within the residual range, the developed model is deemed reliable and capable of accurately predicting the fouling release properties of silicone oil-infused PDMS coating polymers within the application domain. [60]
The strong predictive performance of combinatorial descriptors to predict FR activity suggests that the Cartesian-based combinatorial approach effectively identifies specific, desirable interactions within reaction mixtures. Combinatorial descriptors were first introduced by Petrosyan et al. employing a quadratic approximation to capture some potential interactions among various components in the reaction mixture.[34] The quadratic-based combinatorial proposed by Petrosyan offers interactions between pairs of variables and their quadratic terms but lacks interactions involving three or more variables. [34] In Cartesian-based combinatorial descriptors proposed in this study, we provide all possible interactions, including the higher-order interaction using the combinatorixPy algorithm. The MLR model using the quadratic-based combinatorial descriptors from the Petrosyan et al. study slightly outperformed the models based on single additive descriptors in predicting the glass transition temperatures of block copolymers.[34]
The robust performance of our combinatorial descriptors stems from the critical role that interactions between components and synergism play in shaping antifouling properties. Characterization of the experimental PDMS-based systems revealed a pronounced synergy between the TMS-PEG and CF3-PDMS components, resulting in enhanced removal of C. lytica and H. pacifica, along with reduced attachment of B. amphitrite.[60] The same synergy between MS-PEG and CF3-PDMS has been reported by stafslien et al. in polysiloxane-based coatings against C. lytica.[52] Another study indicated a synergistic effect of PEGMA and AF6 block in PDMS-based coatings, enhancing the release properties against U. linza and B. amphitrite. [61] The synergistic interaction between 3,4-diaminofurazan (DAF) and 7-amino-4-methylcoumarin (AMC) in silicon-based polyurethane system resulted in significantly enhanced antibacterial and antifouling properties.[62] These findings suggest that the interaction between these components plays a key role in the observed improvement. These interactions can significantly influence the overall properties of the mixture, making combinatorial descriptors particularly valuable in modeling complex systems.
Our model includes the PW5-TIC1-MWC08 descriptor, which negatively impacts the model’s predictions on FR activity (see Figure 5). The ALE plot here implies that increasing the value of the PW5-TIC1-MWC08 descriptor is associated with reduced fouling release. As the value of PW5-TIC1-MWC08 increases, the removal rate decreases; however, it increases again when the descriptor values exceed 0.95. The PW5-TIC1-MWC08 descriptor is a combinatorial representation that integrates individual contributions from different components—silicone oil (PW5), siloxane (TIC1), and PDMS (MWC08)—into a unified framework. This integration allows the descriptor to reflect the potential structural and physicochemical interactions among these components.
The PW5-TIC1-MWC08 descriptor indicates that the Path/Walk 5 Randic shape index (PW5), a 2D topological descriptor, characterizes the structure of silicone oil, which is responsible for the fouling release properties of coatings. Molecular path/walk indices are shape descriptors calculated as the average sum of atomic path/walk indices of equal length, where each atomic index is the ratio of the atomic path count to the atomic walk count for that length. These indices are size independent, making them effective in describing molecular geometry and molecular branching. [63] The PW5 descriptor has been identified as correlated with fibroblast cell attachment to polymethacrylate surfaces in biomaterial implants. [59] This emphasizes the pivotal role of PW5-related properties of silicone oil in predicting fouling release performance.
The TIC1 descriptor, representing the total information content index of the first-order neighborhood symmetry of the 2D information indices family, elucidates the structural features of the siloxane compound crosslinker that influence the fouling release properties of coatings. The TIC1 descriptor has been found to make the most positive contribution to the attachment of multiple pathogens to acrylate coating materials used in biomedical devices. [64] Similarly, another descriptor from the information index family, SIC3, has been associated with protein adsorption on acrylate biomaterial surfaces. [59] It is well-established that molecules with high symmetry tend to exhibit lower information content due to reduced entropy and randomness. [65] Therefore, a lower TIC1 value, as an information index related to Shannon entropy, indicates molecular asymmetry and higher entropy, which may influence less pathogen attachment by creating more unpredictable molecular configurations. These insights highlight the importance of molecular design , particularly by targeting the TIC1-related properties of siloxane components to inhibit biofilm attachment.
The molecular walk count of order 8 (MWC08) descriptor, part of the 2D walk and path counts family, effectively captures the structural characteristics of vinyl-terminated PDMS that contribute to the antifouling properties of coatings. By analyzing the connectivity patterns and molecular structure up to the eighth level of atomic interactions, this descriptor provides critical insights into the molecular features influencing the coating’s performance. The QSAR study by Stone and Sapper underscores the important role of the MWC08 descriptor in predicting the quorum sensing (QS) inhibitory properties of N-acyl homoserine lactones through their binding affinity with the lasR protein found in certain bacterial species. [66] This ligand-protein interaction is crucial in initiating chemical signaling pathways that suppress quorum sensing, ultimately disrupting biofilm formation. Notably, the MWC08 descriptor exhibits a negative correlation with the binding affinity of lactone-type molecules, which means that lower MWC08 values could enhance the effectiveness of inhibitors in preventing quorum sensing, potentially leading to a reduction in biofilm formation. [66] This reveals the significance of the PDMS network connectivity in antifouling properties.
By combining these descriptors, PW5-TIC1-MWC08 indirectly models how the shape of silicone oil, the symmetry of the siloxane compound crosslinker, and the connectivity of PDMS interact to influence fouling release behavior. This synergy between components underpins their collective influence on fouling release properties.
All descriptors used in this model are 2D, which may reflect the challenges of using 3D descriptors in mixtures. Since 3D descriptors are highly sensitive to a molecule’s conformation, this information is often unavailable in mixtures, where molecules may exhibit flexible structures and their mutual 3D orientations are typically unknown. [23]
Figure 2. Performance of machine learning models. Comparative histogram plot of the performance of the best developed machine learning models for each mixture descriptor: linear regression (LR), least absolute shrinkage and selection operator (LASSO), decision tree (DT), random forest (RF), and support vector regression (SVR)
Preprints 144476 g002
Figure 3. Decision tree diagram. Decision tree diagram for the combinatorial descriptor
Preprints 144476 g003
Figure 4. Correlation and William plots of decision tree model with combinatorial descriptor. a) Observed vs predicted correlation plot for QSAR model. b) Williams plot describing the applicability domain of QSAR model for the fouling release activity of silicone oil-infused PDMS coatings.
Preprints 144476 g004
Figure 5. ALE plots for decision tree model using PW5-TIC1-MWC08 (combinatorial descriptor). PW5-TIC1-MWC08 descriptor weight represented by ALE plot for the decision tree
Preprints 144476 g005

Conclusions

In this work, a series of 13 developed mixture descriptors were tested to develop reliable models for predicting the fouling release properties of mixtures. The dataset consists of 18 in-house silicone oil-infused PDMS coating polymers, with experimental data on their macroalgae U. linza removal fouling release activity. We evaluated 12 additive mixture descriptors, and a non-additive combinatorial descriptor based on the Cartesian product, with the latter being analyzed for the first time for any endpoint. The 12 additive mixture descriptors were developed using the MixtureMetrics package to represent ideal mixtures, assuming no interaction among components. In contrast, novel combinatorial mixture descriptors were created using the combinatorixPy package to model non-ideal mixtures, highlighting the intermolecular interactions between their components. Multiple mxb-QSAR models were developed for each mixture descriptor, employing random forest-based feature importance for feature selection. The models were validated through cross-validation and tested on an external dataset to assess their generalizability. The most effective results were achieved with a novel Cartesian-based combinatorial mixing rule, emphasizing the significance of interaction effects on the fouling release properties of mixtures. Among the developed mxb-QSAR models, the decision tree, combined with a two-stage feature importance approach for feature selection, yielded the best statistically significant results, demonstrating robust ( R 2 ) values of 0.987 for both training and test sets. The model showed a Q L O O 2 = 0.791, indicating its ability to generalize and predict new materials. The 2D combinatorial descriptor PW5-TIC1-MWC08, which was negatively correlated with fouling release, indicates the prominent roles of silicone oil shape, siloxane compound crosslinker symmetry, and PDMS connectivity in influencing fouling release behavior. The high performance of this descriptor suggests that capturing the 3D conformation of components in the mixture is challenging, which explains the underperformance of the 3D descriptors in this context. The effectiveness of the nonlinear model and combinatorial descriptors highlights the presence of complex, nonlinear relationships among variables and synergistic interactions between components that significantly influence the fouling release properties.[52] These findings encourage further advancements through the use of larger and more diverse datasets, enabling the development of highly predictive models based on combinatorial mixture descriptors for the efficient design of coating polymers with optimized fouling release activity.

Supplementary Materials

The following supporting information can be downloaded at: Preprints.org, Supporting information includes Table S1 and Figures S1, and S2 which provide the final model performances, correlation plots, and ALE plots. The following file is available free of charge.

Author Contributions

Rahil Ashtari Mahini: Conceptualization, Methodology, Data Curation, Formal Analysis, Writing - Original Draft. Maryam Safaripour: Investigation, Data Curation, Writing - Review & Editing. Achiya Khanam: Data Curation, Writing - Review & Editing. Gerardo M. Casanola-Martin: Conceptualization, Writing - Review & Editing. Dean C. Webster: Funding Acquisition, Resources, Writing - Review & Editing. Simone A. Ludwig: Supervision, Writing - Review & Editing. Bakhtiyor Rasulev: Conceptualization, Funding Acquisition, Resources, Supervision, Writing - Review & Editing.

Funding

This work was supported by the Office of Naval Research (ONR) [Award Number N00014-22-1-2129].

Acknowledgments

The authors thank the U.S. Office of Naval Research (ONR) for the support through the Award Number: N00014-22-1-2129. This work used resources of the Center for Computationally Assisted Science and Technology (CCAST) at North Dakota State University, which was made possible in part by National Science Foundation (NSF) [MRI Award number 2019077]. Supercomputing support provided by the CCAST HPC System at NDSU is gratefully acknowledged.

Conflicts of Interest

The authors declare the following financial interest/personal relationships which may be considered as potential competing interests: Bakhtiyor Rasulev reports financial support was provided by North Dakota State University. If there are other authors, they declare that they have no known competing financial interests or personal relationships that could have appeared to influence the work reported in this paper.

References

  1. McDowell, D.L.; Kalidindi, S.R. The materials innovation ecosystem: a key enabler for the materials genome initiative. Mrs Bulletin 2016, 41, 326–337. [Google Scholar] [CrossRef]
  2. Mueller, T.; Kusne, A.G.; Ramprasad, R. Machine learning in materials science: Recent progress and emerging applications. Reviews in computational chemistry 2016, 29, 186–273. [Google Scholar]
  3. Hoffmann, C.H. Is AI intelligent? An assessment of artificial intelligence, 70 years after Turing. Technology in Society 2022, 68, 101893. [Google Scholar] [CrossRef]
  4. Samuel, A.L. Some studies in machine learning using the game of checkers. IBM Journal of research and development 1959, 3, 210–229. [Google Scholar] [CrossRef]
  5. Hansch, C.; Muir, R.M.; Fujita, T.; Maloney, P.P.; Geiger, F.; Streich, M. The correlation of biological activity of plant growth regulators and chloromycetin derivatives with Hammett constants and partition coefficients. Journal of the American Chemical Society 1963, 85, 2817–2824. [Google Scholar] [CrossRef]
  6. Fujita, T.; Iwasa, J.; Hansch, C. A new substituent constant, π, derived from partition coefficients. Journal of the American Chemical Society 1964, 86, 5175–5180. [Google Scholar] [CrossRef]
  7. Duanyang, L.; Zhongming, W. Application of Supervised Learning Algorithms in Materials Science. Frontiers of Data and Domputing 2023, 5, 38–47. [Google Scholar]
  8. Yosipof, A.; Shimanovich, K.; Senderowitz, H. Materials informatics: statistical modeling in material science. Molecular Informatics 2016, 35, 568–579. [Google Scholar] [CrossRef] [PubMed]
  9. Henry, D.R.; Block, J.H. Classification of drugs by discriminant analysis using fragment molecular connectivity values. Journal of Medicinal Chemistry 1979, 22, 465–472. [Google Scholar] [CrossRef]
  10. Lenz, D.E.; Brewer, T. Decision Tree Network for the Identification of Anticyanide Compounds. Technical Report USAMRICD-TR-89-14, U.S. Army Medical Research Institute of Chemical Defense, Aberdeen Proving Ground, MD 21010-5425, 1989.
  11. Wold, S.; Dunn III, W.J. Multivariate quantitative structure-activity relationships (QSAR): conditions for their applicability. Journal of Chemical Information and Computer Sciences 1983, 23, 6–13. [Google Scholar] [CrossRef]
  12. Thomsen, J.; Meyer, B. Pattern recognition of the 1H NMR spectra of sugar alditols using a neural network. Journal of Magnetic Resonance (1969) 1989, 84, 212–217. [Google Scholar] [CrossRef]
  13. Cortes, C. Support-Vector Networks. Machine Learning 1995. [Google Scholar] [CrossRef]
  14. Breiman, L. Random forests. Machine learning 2001, 45, 5–32. [Google Scholar] [CrossRef]
  15. Svetnik, V.; Liaw, A.; Tong, C.; Culberson, J.C.; Sheridan, R.P.; Feuston, B.P. Random forest: a classification and regression tool for compound classification and QSAR modeling. Journal of chemical information and computer sciences 2003, 43, 1947–1958. [Google Scholar] [CrossRef] [PubMed]
  16. Tropsha, A.; Isayev, O.; Varnek, A.; Schneider, G.; Cherkasov, A. Integrating QSAR modelling and deep learning in drug discovery: the emergence of deep QSAR. Nature Reviews Drug Discovery 2024, 23, 141–155. [Google Scholar] [CrossRef]
  17. Daghighi, A.; Casanola-Martin, G.M.; Iduoku, K.; Kusic, H.; González-Díaz, H.; Rasulev, B. Multi-Endpoint Acute Toxicity Assessment of Organic Compounds Using Large-Scale Machine Learning Modeling. Environmental Science & Technology 2024. [Google Scholar]
  18. Goh, G.B.; Hodas, N.O.; Siegel, C.; Vishnu, A. Smiles2vec: An interpretable general-purpose deep neural network for predicting chemical properties. arXiv preprint, 2017; arXiv:1712.02034. [Google Scholar] [CrossRef]
  19. Jiang, D.; Wu, Z.; Hsieh, C.Y.; Chen, G.; Liao, B.; Wang, Z.; Shen, C.; Cao, D.; Wu, J.; Hou, T. Could graph neural networks learn better molecular representation for drug discovery? A comparison study of descriptor-based and graph-based models. Journal of cheminformatics 2021, 13, 1–23. [Google Scholar] [CrossRef] [PubMed]
  20. Mauri, A. alvaDesc: A tool to calculate and analyze molecular descriptors and fingerprints. Ecotoxicological QSARs 2020, 801–820. [Google Scholar]
  21. Bento, A.P.; Hersey, A.; Félix, E.; Landrum, G.; Gaulton, A.; Atkinson, F.; Bellis, L.J.; De Veij, M.; Leach, A.R. An open source chemical structure curation pipeline using RDKit. Journal of Cheminformatics 2020, 12, 1–16. [Google Scholar] [CrossRef] [PubMed]
  22. Gaudin, T.; Rotureau, P.; Fayet, G. Mixture descriptors toward the development of quantitative structure–property relationship models for the flash points of organic mixtures. Industrial & Engineering Chemistry Research 2015, 54, 6596–6604. [Google Scholar]
  23. Muratov, E.N.; Varlamova, E.V.; Artemenko, A.G.; Polishchuk, P.G.; Kuz’min, V.E. Existing and Developing Approaches for QSAR Analysis of Mixtures. Molecular Informatics 2012, 31, 202–221. [Google Scholar] [CrossRef] [PubMed]
  24. Giner, B.; Lafuente, C.; Lapeña, D.; Errazquin, D.; Lomba, L. QSAR study for predicting the ecotoxicity of NADES towards Aliivibrio fischeri. Exploring the use of mixing rules. Ecotoxicology and Environmental Safety 2020, 191, 110004. [Google Scholar] [CrossRef] [PubMed]
  25. Sobati, M.A.; Abooali, D.; Maghbooli, B.; Najafi, H. A new structure-based model for estimation of true critical volume of multi-component mixtures. Chemometrics and Intelligent Laboratory Systems 2016, 155, 109–119. [Google Scholar] [CrossRef]
  26. Rasulev, B.; Jabeen, F.; Stafslien, S.; Chisholm, B.J.; Bahr, J.; Ossowski, M.; Boudjouk, P. Polymer coating materials and their fouling release activity: A cheminformatics approach to predict properties. ACS applied materials & interfaces 2017, 9, 1781–1792. [Google Scholar]
  27. Ni, Y.; Pan, Y.; Jiang, J.; Liu, Y.; Shu, C.M. Predicting both lower and upper flammability limits for fuel mixtures from molecular structures with same descriptors. Process Safety and Environmental Protection 2021, 155, 177–183. [Google Scholar] [CrossRef]
  28. Khanam, A.; Casanola-Martin, G.; Daghighi, A.; Webster, D.; Rasulev, B. Development of QSAR Models on the Fouling-Release Performance of Silicone Oil-modified Siloxane Polyurethane Coatings 2024. [CrossRef]
  29. Ajmani, S.; Rogers, S.C.; Barley, M.H.; Livingstone, D.J. Application of QSPR to mixtures. Journal of chemical information and modeling 2006, 46, 2043–2055. [Google Scholar] [CrossRef]
  30. Characterization of Mixtures Part 1: Prediction of Infinite-Dilution Activity Coefficients Using Neural Network-Based QSPR Models. QSAR & combinatorial science. 2008, 27.
  31. Ajmani, S.; Rogers, S.C.; Barley, M.H.; Burgess, A.N.; Livingstone, D.J. Characterization of mixtures. Part 2: QSPR models for prediction of excess molar volume and liquid density using neural networks. Molecular Informatics 2010, 29, 645–653. [Google Scholar] [CrossRef]
  32. Faramarzi, Z.; Abbasitabar, F.; Zare-Shahabadi, V.; Jahromi, H.J. Novel mixture descriptors for the development of quantitative structure- property relationship models for the boiling points of binary azeotropic mixtures. Journal of Molecular Liquids 2019, 296, 111854. [Google Scholar] [CrossRef]
  33. Faramarzi, Z.; Abbasitabar, F.; Jahromi, J.H.; Noei, M. New structure-based models for the prediction of normal boiling point temperature of ternary azeotropes. Journal of the Serbian Chemical Society 2021, 86, 685–698. [Google Scholar] [CrossRef]
  34. Petrosyan, L.S.; Sizochenko, N.; Leszczynski, J.; Rasulev, B. Modeling of Glass Transition Temperatures for Polymeric Coating Materials: Application of QSPR Mixture-based Approach. Molecular informatics 2019, 38, 1800150. [Google Scholar] [CrossRef] [PubMed]
  35. Mahini, R.A.; Casanola-Martin, G.; Ludwig, S.A.; Rasulev, B. MixtureMetrics: A comprehensive package to develop additive numerical features to describe complex materials for machine learning modeling. SoftwareX 2024, 28, 101911. [Google Scholar] [CrossRef]
  36. Mahini, R.A. combinatorixPy: Mixture Descriptors Calculator, 2024. Accessed: 2024-11-13.
  37. Research, G.V. Antifouling coating market size, share & trends analysis report by type (self-polishing, non-sliding), by application (marine, industrial), by region, and segment forecasts, 2023 - 2030, 2023. Accessed: 2024-11-24.
  38. Hu, P.; Xie, Q.; Ma, C.; Zhang, G. Silicone-based fouling-release coatings for marine antifouling. Langmuir 2020, 36, 2170–2183. [Google Scholar] [CrossRef] [PubMed]
  39. Zhou, H.; Zheng, Y.; Li, M.; Ba, M.; Wang, Y. Fouling release coatings based on acrylate–MQ silicone copolymers incorporated with non-reactive Phenylmethylsilicone oil. Polymers 2021, 13, 3156. [Google Scholar] [CrossRef] [PubMed]
  40. Pieper, R.J.; Ekin, A.; Webster, D.C.; Cassé, F.; Callow, J.A.; Callow, M.E. Combinatorial approach to study the effect of acrylic polyol composition on the properties of crosslinked siloxane-polyurethane fouling-release coatings. Journal of Coatings Technology and Research 2007, 4, 453–461. [Google Scholar] [CrossRef]
  41. ChemAxon. MarvinSketch (Version 6.2.2, Calculation Module Developed by ChemAxon), 2014. Accessed: 2024-12-28.
  42. Mahini, R.A. combinatorixPy: Mixture Descriptors Calculator, 2024. Accessed: 2024-11-13.
  43. Mikolajczyk, A.; Sizochenko, N.; Mulkiewicz, E.; Malankowska, A.; Rasulev, B.; Puzyn, T. A chemoinformatics approach for the characterization of hybrid nanomaterials: safer and efficient design perspective. Nanoscale 2019, 11, 11808–11818. [Google Scholar] [CrossRef]
  44. Pedregosa, F.; Varoquaux, G.; Gramfort, A.; Michel, V.; Thirion, B.; Grisel, O.; Blondel, M.; Prettenhofer, P.; Weiss, R.; Dubourg, V.; et al. Scikit-learn: Machine learning in Python. the Journal of machine Learning research 2011, 12, 2825–2830. [Google Scholar]
  45. SCIKIT-LEARN, W.T. PDF documentation-Scikit-learn.
  46. Ensemble feature selection in high dimension, low sample size datasets: Parallel and serial combination approaches. Knowledge-Based Systems 2020, 203, 106097. [CrossRef]
  47. Geroldinger, A.; Lusa, L.; Nold, M.; Heinze, G. Leave-one-out cross-validation, penalization, and differential bias of some prediction model performance measures—A simulation study. Diagnostic and Prognostic Research 2023, 7, 9. [Google Scholar] [CrossRef]
  48. Ascencio-Medina, E.; He, S.; Daghighi, A.; Iduoku, K.; Casanola-Martin, G.M.; Arrasate, S.; González-Díaz, H.; Rasulev, B. Prediction of Dielectric Constant in Series of Polymers by Quantitative Structure-Property Relationship (QSPR). Polymers 2024, 16, 2731. [Google Scholar] [CrossRef]
  49. Zhuravskyi, Y.; Iduoku, K.; Erickson, M.E.; Karuth, A.; Usmanov, D.; Casanola-Martin, G.; Sayfiyev, M.N.; Ziyaev, D.A.; Smanova, Z.; Mikolajczyk, A.; et al. Quantitative Structure–Permittivity Relationship Study of a Series of Polymers. ACS Materials Au 2024, 4, 195–203. [Google Scholar] [CrossRef] [PubMed]
  50. Iduoku, K.; Ngongang, M.; Kulathunga, J.; Daghighi, A.; Casanola-Martin, G.; Simsek, S.; Rasulev, B. Phenolic Acid–β-Cyclodextrin Complexation Study to Mask Bitterness in Wheat Bran: A Machine Learning-Based QSAR Study. Foods 2024, 13, 2147. [Google Scholar] [CrossRef] [PubMed]
  51. Kuncheva, L.I.; Matthews, C.E.; Arnaiz-González, A.; Rodríguez, J.J. Feature selection from high-dimensional data with very low sample size: A cautionary tale. arXiv preprint, 2020; arXiv:2008.12025. [Google Scholar] [CrossRef]
  52. Stafslien, S.J.; Christianson, D.; Daniels, J.; VanderWal, L.; Chernykh, A.; Chisholm, B.J. Combinatorial materials research applied to the development of new surface coatings XVI: Fouling-release properties of amphiphilic polysiloxane coatings. Biofouling 2015, 31, 135–149. [Google Scholar] [CrossRef] [PubMed]
  53. Devinyak, O.; Havrylyuk, D.; Lesyk, R. 3D-MoRSE descriptors explained. Journal of Molecular Graphics and Modelling 2014, 54, 194–203. [Google Scholar] [CrossRef]
  54. Tugcu, G.; Saçan, M.T. A multipronged QSAR approach to predict algal low-toxic-effect concentrations of substituted phenols and anilines. Journal of hazardous materials 2018, 344, 893–901. [Google Scholar] [CrossRef] [PubMed]
  55. Zhu, L.; Xue, J.; Wang, Y.; Chen, Q.; Ding, J.; Wang, Q. Ice-phobic coatings based on silicon-oil-infused polydimethylsiloxane. ACS applied materials & interfaces 2013, 5, 4053–4062. [Google Scholar]
  56. Khanam, A. Application of Quantitative Structure-Activity Relationship and Computational Modeling in Silicone Oil-Modified SiPU and PDMS-Based Polymeric Coatings Properties Assessment. Master’s thesis, North Dakota State University, 2024.
  57. Rasitha, T.; Sofia, S.; Anandkumar, B.; Philip, J. Long term antifouling performance of superhydrophobic surfaces in seawater environment: Effect of substrate material, hierarchical surface feature and surface chemistry. Colloids and Surfaces A: Physicochemical and Engineering Aspects 2022, 647, 129194. [Google Scholar] [CrossRef]
  58. Nagumo, R.; Matsuoka, T.; Iwata, S. Interactions between Acrylate/Methacrylate Biomaterials and Organic Foulants Evaluated by Molecular Dynamics Simulations of Simplified Binary Mixtures. ACS Biomaterials Science & Engineering 2021, 7, 3709–3717. [Google Scholar] [CrossRef]
  59. Ghosh, J.; Lewitus, D.Y.; Chandra, P.; Joy, A.; Bushman, J.; Knight, D.; Kohn, J. Computational modeling of in vitro biological responses on polymethacrylate surfaces. Polymer 2011, 52, 2650–2660. [Google Scholar] [CrossRef]
  60. Galli, G.; Martinelli, E. Amphiphilic polymer platforms: Surface engineering of films for marine antibiofouling. Macromolecular rapid communications 2017, 38, 1600704. [Google Scholar] [CrossRef] [PubMed]
  61. Wenning, B.M.; Martinelli, E.; Mieszkin, S.; Finlay, J.A.; Fischer, D.; Callow, J.A.; Callow, M.E.; Leonardi, A.K.; Ober, C.K.; Galli, G. Model amphiphilic block copolymers with tailored molecular weight and composition in PDMS-based films to limit soft biofouling. ACS applied materials & interfaces 2017, 9, 16505–16516. [Google Scholar]
  62. Li, X.; Yuan, H.; Kuang, H.; Liu, M.; Zhang, Y.; Li, M.; Cui, J.; Jing, L. The intermolecular forces induced silicon-polyurea marine anti-fouling coating with ideal mechanical and antibacterial performances. Journal of Macromolecular Science, Part A 2024, 61, 327–338. [Google Scholar] [CrossRef]
  63. Pourbasheer, E.; Riahi, S.; Ganjali, M.R.; Norouzi, P. Quantitative structure–activity relationship (QSAR) study of interleukin-1 receptor associated kinase 4 (IRAK-4) inhibitor activity by the genetic algorithm and multiple linear regression (GA-MLR) method. Journal of enzyme inhibition and medicinal chemistry 2010, 25, 844–853. [Google Scholar] [CrossRef] [PubMed]
  64. Mikulskis, P.; Hook, A.; Dundas, A.A.; Irvine, D.; Sanni, O.; Anderson, D.; Langer, R.; Alexander, M.R.; Williams, P.; Winkler, D.A. Prediction of broad-spectrum pathogen attachment to coating materials for biomedical devices. ACS applied materials & interfaces 2018, 10, 139–149. [Google Scholar]
  65. Bonchev, D.; Kamenski, D.; Kamenska, V. Symmetry and information content of chemical structures. Bulletin of Mathematical Biology 1976, 38, 119–133. [Google Scholar] [CrossRef]
  66. Stone, B.; Sapper, E. Machine Learning for the Design and Development of Biofilm Regulators 2018. [CrossRef]
Figure 1. Workflow for mixture-based QSAR (mxb-QSAR) machine learning for fouling release activity.
Preprints 144476 g001
Table 1. List of samples and polymer coatings specifications and the observed FR activity (end point value)
Coating V31(g) V22(g) HMS-151(g) HMS-301(g) Oil(g) FR Activitya
V31-151 20 0 0.91 0 0 71.69
V31-151-1015-5% 20 0 0.91 0 1 70.38
V31-151-1015-10% 20 0 0.91 0 2 65.53
V31-151-1021-5% 20 0 0.91 0 1 81.14
V31-151-1021-10% 20 0 0.91 0 2 73.05
V31-151-0421-5% 20 0 0.91 0 1 69.41
V31-151-0421-10% 20 0 0.91 0 2 89.95
V31-151-0025-5% 20 0 0.91 0 1 75.97
V31-151-0025-10% 20 0 0.91 0 2 70.83
V22-301 0 20 0 1.251 0 88.14
V22-301-1015-5% 0 20 0 1.251 1 81.86
V22-301-1015-10% 0 20 0 1.251 2 81.86
V22-301-1021-5% 0 20 0 1.251 1 81.14
V22-301-1021-10% 0 20 0 1.251 2 91.91
V22-301-0421-5% 0 20 0 1.251 1 95.89
V22-301-0421-10% 0 20 0 1.251 2 89.95
V22-301-0025-5% 0 20 0 1.251 1 86.88
V22-301-0025-10% 0 20 0 1.251 2 87.90
aAlgae removal 110 kPa
Table 2. List of components used in the formulation of silicone oil-infused PDMS coatings and the NMR-obtained structures of silicone oils (DP=Diphenyl, PM= Phenylmethyl, DM= Dimethyl).
Component Structure
Vinyl terminated PDMS (DMS-V22, DMS-V31) Preprints 144476 i001
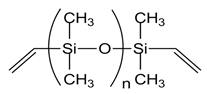
Crosslinker (HMS-151, HMS-301) Preprints 144476 i002
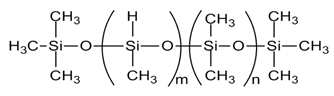
PDM-0421 [PMDM-010-065, m= 6, n= 57] Preprints 144476 i003
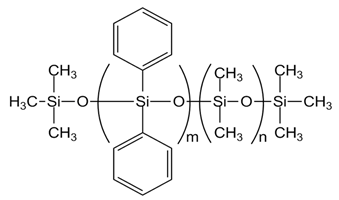
PMM-1015 [PMDM-010-044, m= 4, n= 38] Preprints 144476 i004
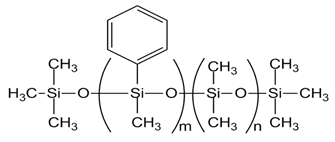
PMM-1021 [DPDM-005-047, m= 2, n= 43] Preprints 144476 i005
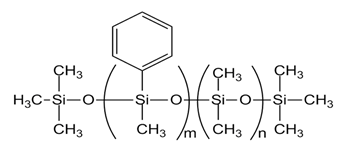
PMM-0025 [PM-100-014, n= 10]
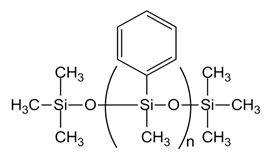
 Preprints 144476 i006
Table 3. Statistical parameters of QSAR models with the fmol-diff, fmol-sum, sqr-fmol, root-fmol and sqr-fmol-sum descriptors
Variable R2Train R2Test MAETrain MAETest RMSETrain RMSETest Q2LOOa
RDF015v (fmol-diff)b 0.986 0.923 0.852 1.724 1.241 2.024 0.77
RDF115i, Mor09m (fmol-sum)c 0.964 0.942 1.485 1.535 1.994 1.756 0.741
RDF115i (sqr-fmol)c 0.966 0.904 1.578 1.993 1.9477 2.257 0.754
RDF095i (root-fmol)c 0.973 0.935 1.486 1.548 1.725 1.869 0.77
RDF115i, Mor09m (sqr-fmol-sum)c 0.965 0.942 1.475 1.535 1.983 1.756 0.745
aLeave one out, bDecision tree, cRandom forest
Table 4. Statistical parameters of decision tree model with the Cartesian-based combinatorial descriptor
Variable R2Train R2Test MAETrain MAETest RMSETrain RMSETest Q2LOOa
PW5-TIC1-MWC08 0.987 0.987 0.86 0.826 1.192 0.836 0.791
aLeave one out
Disclaimer/Publisher’s Note: The statements, opinions and data contained in all publications are solely those of the individual author(s) and contributor(s) and not of MDPI and/or the editor(s). MDPI and/or the editor(s) disclaim responsibility for any injury to people or property resulting from any ideas, methods, instructions or products referred to in the content.
Copyright: This open access article is published under a Creative Commons CC BY 4.0 license, which permit the free download, distribution, and reuse, provided that the author and preprint are cited in any reuse.
Prerpints.org logo

Preprints.org is a free preprint server supported by MDPI in Basel, Switzerland.

Subscribe

Disclaimer

Terms of Use

Privacy Policy

Privacy Settings

© 2025 MDPI (Basel, Switzerland) unless otherwise stated