Submitted:
27 December 2024
Posted:
30 December 2024
You are already at the latest version
Abstract
Background. Alcohol is one of the leading causes of liver hepatitis and liver cirrhosis. Both medical conditions are defined by a combination of specific symptoms whose interaction allows for a diagnosis with reasonable precision. Aims. This study aimed to differentiate between acute alcoholic hepatitis and alcoholic cirrhosis at the molecular level. Methods. This report analyzed changes in levels of vitamin D3, TNF-alpha, IL-1B, IL-6, IL-8, IL-12, and adiponectin determined using a chemiluminescent microparticle immunoassay and Luminex xMap technology. The study population consisted of 42 male patients with acute alcoholic hepatitis and 50 male patients with alcoholic cirrhosis. Results. The result revealed a statistically significant difference in TNF-alpha, IL-8, and IL-12 between acute alcoholic hepatitis and alcoholic cirrhosis. It also revealed distinct correlation patterns that differentiate acute alcoholic hepatitis and alcoholic cirrhosis. A network of significant cross-correlations between the cytokines studied defines alcoholic cirrhosis. Conclusion. This report revealed that the studied medical conditions can be differentiated by specific levels of cytokines and by cross-correlation between cytokines.
Keywords:
cytokines
; vitamin D3
; alcoholic hepatitis
; alcoholic cirrhosis
1. Introduction
Alcohol-related liver disease (ARLD) refers to liver damage caused by excessive alcohol intake, i.e., consuming five or more drinks on occasion for men and four or more for women (https://www.cdc.gov/chronicdisease/resources/publications/factsheets/alcohol.htm). The duration of excessive alcohol consumption that results in ARLD is highly variable [1,2]. However, a typical male patient with ARLD consumes an average of 80 g of ethanol daily for more than 5 years [3].
The most widely recognized forms of alcoholic liver disease are alcoholic fatty liver (steatosis), acute alcoholic hepatitis (AAH), and alcoholic cirrhosis (AC). The reference ranges for ALT and AST in AAH are 100-200 U/L and 50-150 U/L, respectively [4]. On the contrary, AC is defined by AST/ALT ratio > 2 [5]. Blood tests in male patients with AAH can show an increase in aspartate transferase (AST) levels. However, alanine transaminase (ALT) levels are usually in the normal range. There are also several clinical presentations of AAH, such as jaundice, anorexia, and fever [6]. The volume of the liver can also increase as a result of the ballooning of hepatocytes caused by an increased accumulation of intracellular water.
Cirrhosis is the late stage of alcoholic liver injury defined by a distorted hepatic structure. In the late stages, it is considered irreversible. The characteristics of cirrhosis are spider angioma [7], palmar erythema, ascites, and variceal bleeding [8].
ARLD influences serum levels of vitamins and apoptotic cytokines. For example, there is a correlation between serum vitamin D levels as a function of liver disease [9,10,11,12]. However, the exact role of vitamin D in alcoholic liver disease is not well established. Most studies have focused on vitamin D deficiency in liver cirrhosis [13], and only a few reported vitamin D levels in other stages of alcoholic liver damage [14]. The altered vitamin D metabolism observed in liver cirrhosis is mainly attributed to impaired hydroxylation of 25 (OH) vitamin D due to impaired liver function[15]. Some studies have also reported the prevalence of hypovitaminosis D in chronic liver disease and cirrhosis [16].
An increase in tumor necrosis factor-alpha (TNF-alpha) levels was also observed as a function of ARLD in animal models [20,21,22] and human models [17]. Furthermore, TNF-alpha levels have been shown to reflect liver injury despite normal levels of liver enzymes [18]. ARLD is also defined by elevated serum levels of pro-inflammatory interleukin-1 (IL-1), interleukin-6 (IL-6), and interleukin-8 (IL-8) whose expression is tightly controlled by IL-1 and TNF−alpha [19]. Serum levels of interleukin-12 (IL-12) have also been reported to be a function of alcoholic liver disease [20], and serum adiponectin levels are reduced after alcohol consumption. All the described changes share a common mechanism.
The key objective of this study is to address the lack of information on the differences between acute alcoholic hepatitis (AAH) and alcoholic cirrhosis (AC) through the differential analysis of serum levels of vitamin D3, TNF-alpha, IL-1B, IL-6, IL-8, IL-12, and adiponectin.
2. Methods
The study was conducted according to the Declaration of Helsinki of the World Medical Association (WMA) (World Medical, 2001).
Institutional Ethics Clearance (IEC) KB/18/2022, granted by the Regional Ethics Committee of the Gdansk Medical Chamber in Gdansk, Poland, was obtained for this study. Each male patient provided a signed informed consent form.
The study consisted of two groups of men, stratified according to the level of alcohol-related liver disease diagnosed by complete blood count, analysis of the liver panel (transaminases, bilirubin, alkaline phosphatase, albumin), and gamma-glutamyl transferase, and ultrasound examination that included liver size, bluntness of the liver edge, coarseness of the liver parenchyma and nodularity of the liver surface.
The data used in this study included blood tests of male patients admitted to Bródnowski Hospital in Warsaw, Poland, between March and May 2022. Furthermore, the personal records of the male patients are archived in the hospital. The acute alcoholic hepatitis (AAH) group consisted of N = 42 subjects (age = 51.48±10.33 years), and the compensated alcohol cirrhosis group (AC) consisted of N = 50 subjects (age = 53.32±8.03 years) [21]. For all the subjects, it was the first incidence of medical diagnosis of ARLD. The diagnosis was made by combining laboratory tests, i.e., analysis of liver enzyme levels (aspartate aminotransferase - AST, alanine aminotransferase - ALT), their ratio, and the levels of gamma-glutamyl transferase – GGT. Laboratory tests were supported by liver biopsy and ultrasound (US) or CT/MRI scans. Patients with ARLD comorbidities, such as pancreatitis and type 2 diabetes were discarded from the study.
Blood samples obtained from each male patient were allowed to clot at room temperature for 30 minutes and centrifuged for 10 minutes at 3000 rpm. The serum samples were then separated and measured immediately after centrifugation to avoid cytokine production of cytokines by blood cells. Serum cytokine levels were evaluated using Luminex xMap technology. In summary, beads were incubated with a sample, washed, and incubated with a mixture of biotinylated antibodies against all the targets studied. A wash and incubation step with the reporter streptavidin-PE followed this step. The required reagents are provided in Luminex Sheath Fluid kits (EMD Millipore Catalog #SHEATHFLUID) or Luminex Drive Fluid kits (EMD Millipore Catalog # MPXDF-4PK). The concentration of a specific cytokine was assessed as a sandwich composed of a bead with attached cytokine-specific antibody + cytokine + biotinylated cytokine-specific antibody + streptavidin reporter. The beads were excited by a laser to determine the bead region and the corresponding assigned analyte. Another laser was used to determine the magnitude of the PE-derived signal, which is proportional to the amount of analyte bound. The experimental procedures followed the HPTP1MAG-66K instruction from EMD Millipore.
The ARCHITECT platform assessed serum 25-OH vitamin D levels using chemiluminescent immunoassay technology. The assay is a 1-step delayed chemiluminescent microparticle immunoassay (CMIA) with an automated online pretreatment step designed to allow vitamin D assays in the routine laboratory testing workflow [22].
All statistical calculations were calculated using the R programming environment. The normality of the sample distribution was verified using the Shapiro-Wilk test. Hypothesis testing was performed at a significance level of 0.05. The distribution of means and differences in means between the samples were tested using a bootstrap test consisting of 10,000 repeats with replacement [23]. Correlations between samples were analyzed using the Spearman correlation procedure [24].
3. Results
The differences between the cohort parameters collected in Poland studied stratified by medical condition are collected in Table 1. The respective graphical representations are shown in Figures 1 A-G.
Analysis of the results obtained revealed an insignificant increase in serum vitamin D3 levels (Table 1, Figure 1A) and an insignificant decrease in IL-1β levels (Table 1, Figure 1C) and IL-6 levels (Table 1, Figure 1D) between subjects with AAH and AC. Serum adiponectin levels (Table 1, Figure 7) are analogous between study groups. There was also a statistically significant decrease in TNF-alpha levels (Table 1, Figure 1B), a statistically significant increase in IL-8 levels (Table 1, Figure 1E), and a statistically significant decrease in IL-12p70 levels (Table 1, Figure 11E) between male patients with AAH and AC.
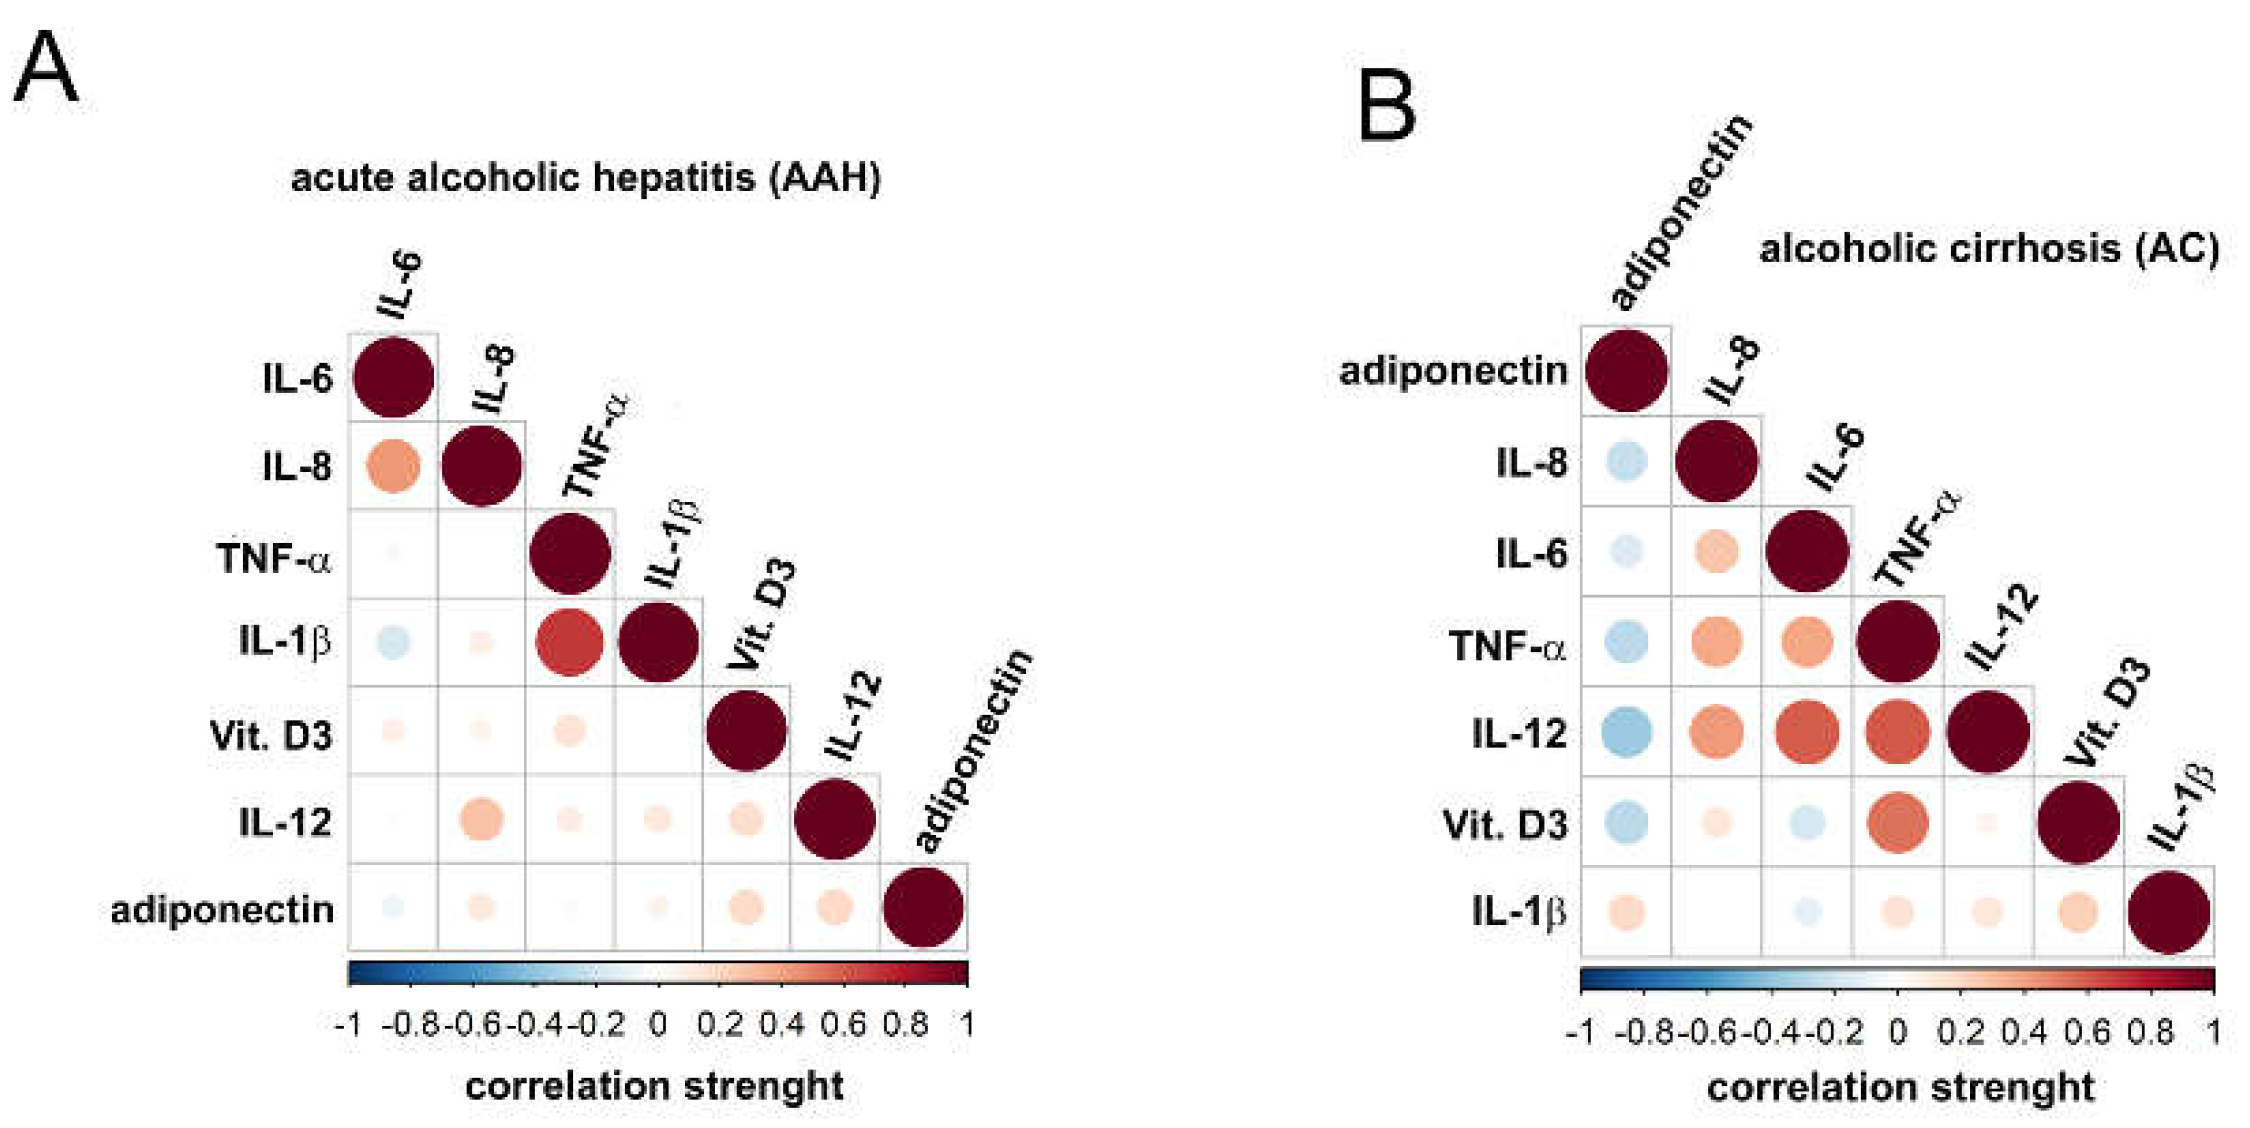
The graphic representation of the correlations between the parameters studied is shown in Figures 2A-B. Figure 2A revealed the presence of strong positive correlations between IL-8 and IL-6 and IL-1β and TNF-alpha in male patients with acute alcoholic hepatitis. Figure 2B revealed the presence of strong and very strong positive correlations between IL-6 and IL-8, TNF-alpha and IL-8 and IL-6, IL-12p70 and IL-8, IL-6 and TNF-alpha, and vitamin D3 and TNF-alpha in male patients with alcoholic cirrhosis. Furthermore, a set of strong negative correlations was observed between vitamin D3, adiponectin IL-12p70, adiponectin and TNF-alpha and adiponectin.
4. Discussion
The diagnosis of ARLD is a multitasking process that includes analysis of the history of the male patient, clinical and laboratory tests, imaging, and liver biopsy results. In recent years, various molecular markers applicable to assess liver health and the diagnosis of ARLD have also been proposed. Unfortunately, they have limited diagnostic power [25]. Therefore, this report focuses on the differential analysis of serum levels of seven diagnostic markers, including vitamin D3, TNF-alpha, IL-1B, IL-6, IL-8, IL-12p70, and adiponectin. Analysis of cross-correlations between medical conditions and serum levels should allow differentiation between and diagnosis of acute alcoholic hepatitis and alcoholic cirrhosis. Analysis of Child-Pugh score as a function of alcoholic disease severity unfolded results contradicting the study by Rey and Effendi-YS [26].
This study reports statistically equal levels of vitamin D3 of 9.21 (22.98 nmol/L) and 11.17 ng/ml (27.88 nmol/L) in subjects with AAH and AC. A comparison of these results with the revised reference range for serum vitamin D levels ( 76.33 nmol/L – 199.36 nmol/L ) [27] shows a three-fold decrease in serum vitamin D3 levels in both study groups, confirming previously reported findings on vitamin D hypovitaminosis as a function of alcoholic-related liver disease [28].
Recent reports of serum levels of TNF-alpha in healthy subjects revealed significant discrepancies that made it difficult to relate our result to the previous finding. For example, Li et al. [29] reported a TNF-alpha range between 5.11 and 7.23 pg/ml, Damas et al. [30] reported levels of TNF-alpha equal to 75 ± 15 pg/ml, and Menyawi et al. [31] 5.08 ± 3.19 pg/ml, while Mourtzikou et al. [32] reported a mean level of TNF-alpha equal to 1.323 pg/ml. A comparison of the results of this study with the healthy reference ranges presented by others leads us to use the ’healthy’ mean level proposed by Mourtzikou et al. [32]. Therefore, an analysis of changes in TNF-alpha as a function of ARLD revealed that higher levels of TNF-alpha define subjects with AAH than normal healthy subjects. The levels of TNF-alpha in AC male patients are analogous to the levels that define healthy subjects and lower than the levels observed in male patients with AAH. The first observation confirms previously presented results on cross-correlations between TNF-alpha levels and AAH [33]. However, no scientific report confirms or disproves our findings on the latter. Analysis of correlations between TNF-alpha levels and alcohol-related liver disease revealed that male AC patients are defined by a strong correlation between serum vitamin D3 and TNF-alpha, a phenomenon that is not observed in male AAH patients. As a result of the lack of reference data, it is impossible to explain the observed phenomenon.
The results presented in this study revealed statistically equivalent levels of IL-1β of 2.95 (2.1-3.96) and 2.1 (1.07-3.18) in male patients with AAH and AC, respectively. The levels observed in both study groups are also higher than those observed in the normal population, revealing an increase in IL-1β levels as a function of alcoholic liver disease, confirming the role of IL-1 in the inflammatory response caused by alcohol-related liver disease [34]. This study also confirmed the control of TNF-alpha in the expression of IL-1 [19] through a strong positive correlation between IL-1β and TNF-alpha observed in male patients with AAH. The lack of such correlation in male patients with AC may be due to advanced liver apoptosis.
The early study on cross-correlations between alcoholic hepatitis [35] and serum IL-6 levels revealed a directly proportional correlation between IL-6 levels and disease progression. Elevation in IL-6 levels has also been shown to be caused by its protective function against alcohol-induced hepatocyte apoptosis [36]. A comparison of the results of this study with the study that reported healthy levels of IL-6 (0.744 pg/mL) [32] revealed a ~300-fold increase in IL-6 levels as a function of ARLD. Furthermore, the observed increase in IL-6 levels in male patients with AAH is five times higher than that reported in the previous study (49.8± 8.5 pg/ml) [37]. The observed changes confirmed the results previously presented on the cross-correlations between IL-6 concentration and the stage of alcoholic liver cirrhosis [38], for which strong correlations were observed between IL-6 and TNF-alpha and IL-6 and IL-12p70. Although no analogous correlations were observed in male patients with AAH, a strong positive correlation was observed between IL-6 and IL-8. A phenomenon previously observed in pancreatic cancer [39].
The early study on cross-correlations between alcoholic liver disease and serum IL-8 levels [40] indicates an increase in IL-8 levels (337.04 - 536.93 pg/ml) in male patients with AAH compared to normal levels (6.8–39.65) [41]. The results reported in this study confirmed previous observations [40]. However, they do not confirm the report by Kawaratani et al. [17], who claimed that IL-8 levels are moderately elevated as a function of ARLD progression and indicated a significant increase in serum IL-8 levels between AAH and AC. The studied medical conditions, AAH and AC, were clearly differentiated by the pattern of correlations between IL-8 and vitamin D3, TNF-alpha, IL-1β, IL-6, IL-12, and adiponectin. Therefore, AAH is defined by moderate-strength positive correlations between IL-8 and IL-6 and IL-8 and IL-12, while a negative correlation between IL-8 and adiponectin and positive correlations between IL-6, TNF-alpha and IL-12 defines AC. The observed negative correlation between IL-8 and adiponectin in AC confirmed the previous study that indicated the inhibitory role of adiponectin in the expression of IL-8 [42].
The previous study on the relations between serum IL-12 levels as a function of ARLD revealed mean levels of IL-12 equal to 163.1 +/- 57.8 pg/ml and 74.4 +/- 26.2 pg/ml for AAH and AC, respectively [20]. Although serum levels of IL-12 reported in this study are significantly lower than previously reported [23], both reports revealed a similar direction of changes as a function of an advance in ARLD. A comparison of this study with the previous one on cross-correlations between serum levels of IL-12 and ARLD levels (Figure 1, ibid.) [43] revealed comparable levels of IL-12 in men with AC and men with alcoholic liver cirrhosis with at least one year of withdrawal from alcohol withdrawal. Furthermore, analysis of the correlation pattern between the studied groups showed a distinct difference between AAH and AC. Therefore, in male patients with AAH, a moderate correlation was observed between IL-12 and IL-8. In male AC patients, a strong positive correlation was observed between IL-12 and IL-8, IL-6, and TNF-alpha, and a strong negative correlation between IL-12 and adiponectin. The observed negative cross-correlation is analogous to the cross-correlations reported in obese male patients for whom an increase in adiponectin expression and a decrease in IL-12 expression were reported [44,45].
Elevated serum adiponectin levels were present in male patients with AC [46] and correlated with AC severity [47]. The results reported in this study confirmed previous reports and revealed an increase in serum adiponectin levels in male patients with AAH and AC compared to normal serum adiponectin levels [48]. However, AAH and AC are defined by a different cross-correlation pattern between the molecular markers. Therefore, in AAH, the correlations between adiponectin and vitamin D3, TNF-alpha, IL-1B, IL-6, IL-8 and IL-12 were of negligible strength, while in male patients with AC, adiponectin was strongly and negatively correlated with IL-12, vitamin D3, and TNF-alpha. Therefore, the correlations observed in AC male patients reflect an interplay of anti-inflammatory cytokines and the production of pro-inflammatory cytokines reported in obese male patients [49].
5. Conclusions
It is a study extending current knowledge on molecular differentiation between acute alcoholic hepatitis and alcoholic cirrhosis. Since alcoholic cirrhosis is a later stage of ARLD resulting in permanent scarring of the liver while alcoholic hepatitis may be curable, this study was performed under the null hypothesis that the set of specific molecular markers should distinguish between these two stages of ARLD. The results obtained revealed significantly higher levels of IL-12, IL-8 and TNF-alfa in AAH than in AC patients, which may be indicative of apoptosis occurring in AC patients. However, due to the limitation of this report caused by the size of the sample study, more clinical studies evaluating the clinical potential of the studied markers.
Author Contributions
R.T. was responsible for designing an experiment, writing the manuscript, and preparation of figures.
Funding
Not applicable.
Institutional Review Board Statement
The study was carried out according to the Declaration of Helsinki of the World Medical Association (WMA) (World Medical, 2001). Institutional Ethics Clearance (IEC) KB/18/2022, granted by the Regional Ethics Committee of the Gdansk Medical Chamber in Gdansk, Poland, was obtained for this study.
Informed Consent Statement
Each studied male patient provided a signed informed consent form.
Consent for publication
Not applicable.
Availability of data and materials
Data in this study are available on request from the corresponding author.
Acknowledgments
Not applicable.
Competing interests
Not applicable.
References
- Lischner MW, Alexander JF, Galambos JT: Natural history of alcoholic hepatitis. I. The acute disease. The American journal of digestive diseases 1971, 16(6):481-494. [CrossRef]
- Lucey MR, Mathurin P, Morgan TR: Alcoholic hepatitis. The New England journal of medicine 2009, 360(26):2758-2769.
- Mendenhall CL: Alcoholic hepatitis. Clinics in gastroenterology 1981, 10(2):417-441.
- Morgan TR: Management of alcoholic hepatitis. Gastroenterology & hepatology 2007, 3(2):97-99.
- Hall P, Cash J: What is the real function of the liver ’function’ tests? The Ulster medical journal 2012, 81(1):30-36.
- Torruellas C, French SW, Medici V: Diagnosis of alcoholic liver disease. World J Gastroenterol 2014, 20(33):11684-11699.
- Li CP, Lee FY, Hwang SJ, Lu RH, Lee WP, Chao Y, Wang SS, Chang FY, Whang-Peng J, Lee SD: Spider angiomas in patients with liver cirrhosis: role of vascular endothelial growth factor and basic fibroblast growth factor. World J Gastroenterol 2003, 9(12):2832-2835. [CrossRef]
- Garcia-Tsao G, Bosch J: Varices and Variceal Hemorrhage in Cirrhosis: A New View of an Old Problem. Clinical gastroenterology and hepatology : the official clinical practice journal of the American Gastroenterological Association 2015, 13(12):2109-2117. [CrossRef]
- Iruzubieta P, Terán Á, Crespo J, Fábrega E: Vitamin D deficiency in chronic liver disease. World journal of hepatology 2014, 6(12):901-915.
- Elangovan H, Chahal S, Gunton JE: Vitamin D in liver disease: Current evidence and potential directions. Biochimica et Biophysica Acta (BBA) - Molecular Basis of Disease 2017, 1863(4):907-916. [CrossRef]
- Lee SM, Jun DW, Cho YK, Jang KS: Vitamin D deficiency in non-alcoholic fatty liver disease: The chicken or the egg? Clin Nutr 2017, 36(1):191-197. [CrossRef]
- Kucukazman M, Ata N, Dal K, Yeniova AO, Kefeli A, Basyigit S, Aktas B, Akin KO, Agladioglu K, Ure OS et al.: The association of vitamin D deficiency with non-alcoholic fatty liver disease. Clinics (Sao Paulo) 2014, 69(8):542-546. [CrossRef]
- Konstantakis C, Tselekouni P, Kalafateli M, Triantos C: Vitamin D deficiency in patients with liver cirrhosis. Ann Gastroenterol 2016, 29(3):297-306. [CrossRef]
- Testino G, Leone S, Fagoonee S: Alcoholic liver disease and vitamin D deficiency. Minerva Med 2018, 109(5):341-343.
- Long RG, Skinner RK, Wills MR, Sherlock S: Serum-25-hydroxy-vitamin-D in untreated parenchymal and cholestatic liver disease. Lancet 1976, 2(7987):650-652. [CrossRef]
- Savic Z, Damjanov D, Curic N, Kovacev-Zavisic B, Hadnadjev L, Novakovic-Paro J, Nikolic S: Vitamin D status, bone metabolism and bone mass in patients with alcoholic liver cirrhosis. Bratisl Lek Listy 2014, 115(9):573-578. [CrossRef]
- Kawaratani H, Moriya K, Namisaki T, Uejima M, Kitade M, Takeda K, Okura Y, Kaji K, Takaya H, Nishimura N et al.: Therapeutic strategies for alcoholic liver disease: Focusing on inflammation and fibrosis (Review). Int J Mol Med 2017, 40(2):263-270. [CrossRef]
- Astakhin AV, Levitan BN, Afanas’ev SS, Vorob’ev AA, Aleshkin VA, Dudina OS: [Tumor necrosis factor-alpha and interleukin-4 in the blood sera of chronic hepatitis patients]. Zh Mikrobiol Epidemiol Immunobiol 2004(2):46-50.
- Tilg H, Moschen AR, Szabo G: Interleukin-1 and inflammasomes in alcoholic liver disease/acute alcoholic hepatitis and nonalcoholic fatty liver disease/nonalcoholic steatohepatitis. Hepatology 2016, 64(3):955-965. [CrossRef]
- Tung KH, Huang YS, Yang KC, Perng CL, Lin HC, Lee SD: Serum interleukin-12 levels in alcoholic liver disease. Journal of the Chinese Medical Association : JCMA 2010, 73(2):67-71. [CrossRef]
- Kamath PS, Wiesner RH, Malinchoc M, Kremers W, Therneau TM, Kosberg CL, D’Amico G, Dickson ER, Kim WR: A model to predict survival in patients with end-stage liver disease. Hepatology 2001, 33(2):464-470. [CrossRef]
- Abbott Laboratories: Brochure: IA_09_23864/v1, AK2117-10 No. In.; 2010.
- Grunkemeier GL, Wu Y: Bootstrap resampling methods: something for nothing? Ann Thorac Surg 2004, 77(4):1142-1144. [CrossRef]
- Spearman Rank Correlation Coefficient. In: The Concise Encyclopedia of Statistics. edn. New York, NY: Springer New York; 2008: 502-505.
- Ohashi K, Pimienta M, Seki E: Alcoholic liver disease: A current molecular and clinical perspective. Liver Research 2018, 2(4):161-172. [CrossRef]
- Rey I, Effendi-Ys R: Association Between Serum IL-6, IL-10, IL-12, and IL-23 Levels and Severity of Liver Cirrhosis. Medical archives (Sarajevo, Bosnia and Herzegovina) 2021, 75(3):199-203. [CrossRef]
- Tomasiuk R, Zubrzycki IZ, Wiacek M: Age-dependent changes in fat- and water-soluble vitamins - NHANES study. unpublished 2022.
- Putz-Bankuti C, Pilz S, Stojakovic T, Scharnagl H, Pieber TR, Trauner M, Obermayer-Pietsch B, Stauber RE: Association of 25-hydroxyvitamin D levels with liver dysfunction and mortality in chronic liver disease. Liver Int 2012, 32(5):845-851. [CrossRef]
- Li G, Wu W, Zhang X, Huang Y, Wen Y, Li X, Gao R: Serum levels of tumor necrosis factor alpha in patients with IgA nephropathy are closely associated with disease severity. BMC Nephrology 2018, 19(1):326. [CrossRef]
- Damas P, Reuter A, Gysen P, Demonty J, Lamy M, Franchimont P: Tumor necrosis factor and interleukin-1 serum levels during severe sepsis in humans. Critical care medicine 1989, 17(10):975-978.
- El Menyawi M, Fawzy M, Al-Nahas Z, Edris A, Hussein H, Shaker O, Elwan H: Serum tumor necrosis factor alpha (TNF-α) level in patients with Behçet’s disease: Relation to clinical manifestations and disease activity. The Egyptian Rheumatologist 2014, 36(3):139-143. [CrossRef]
- Mourtzikou A, Alepaki M, Stamouli M, Pouliakis A, Skliris A, Karakitsos P: Evaluation of serum levels of IL-6, TNF-α, IL-10, IL-2 and IL-4 in patients with chronic hepatitis. Inmunología 2014, 33:41-50. [CrossRef]
- Naveau S, Emilie D, Balian A, Grangeot-Keros L, Borotto E, Portier A, Giraud V, Capron F, Galanaud P, Chaput JC: Plasma levels of soluble tumor necrosis factor receptors p55 and p75 in patients with alcoholic liver disease of increasing severity. J Hepatol 1998, 28(5):778-784. [CrossRef]
- Neuman MG, Maor Y, Nanau RM, Melzer E, Mell H, Opris M, Cohen L, Malnick S: Alcoholic Liver Disease: Role of Cytokines. Biomolecules 2015, 5(3):2023-2034. [CrossRef]
- Sheron N, Bird G, Goka J, Alexander G, Williams R: Elevated plasma interleukin-6 and increased severity and mortality in alcoholic hepatitis. Clin Exp Immunol 1991, 84(3):449-453.
- Hong F, Kim W-H, Tian Z, Jaruga B, Ishac E, Shen X, Gao B: Elevated interleukin-6 during ethanol consumption acts as a potential endogenous protective cytokine against ethanol-induced apoptosis in the liver: involvement of induction of Bcl-2 and Bcl-xL proteins. Oncogene 2002, 21(1):32-43. [CrossRef]
- Hill DB, Marsano L, Cohen D, Allen J, Shedlofsky S, McClain CJ: Increased plasma interleukin-6 concentrations in alcoholic hepatitis. The Journal of laboratory and clinical medicine 1992, 119(5):547-552.
- Prystupa A, Kiciński P, Sak J, Boguszewska-Czubara A, Toruń-Jurkowska A, Załuska W: Proinflammatory Cytokines (IL-1α, IL-6) and Hepatocyte Growth Factor in Patients with Alcoholic Liver Cirrhosis. Gastroenterology Research and Practice 2015, 2015:532615. [CrossRef]
- Feng L, Qi Q, Wang P, Chen H, Chen Z, Meng Z, Liu L: Serum levels of IL-6, IL-8, and IL-10 are indicators of prognosis in pancreatic cancer. J Int Med Res 2018, 46(12):5228-5236. [CrossRef]
- Huang YS, Chan CY, Wu JC, Pai CH, Chao Y, Lee SD: Serum levels of interleukin-8 in alcoholic liver disease: relationship with disease stage, biochemical parameters and survival. J Hepatol 1996, 24(4):377-384. [CrossRef]
- Zhang J, Bai C: Elevated Serum Interleukin-8 Level as a Preferable Biomarker for Identifying Uncontrolled Asthma and Glucocorticosteroid Responsiveness. Tanaffos 2017, 16(4):260-269.
- Ouchi N, Walsh K: Adiponectin as an anti-inflammatory factor. Clin Chim Acta 2007, 380(1-2):24-30. [CrossRef]
- Laso FJ, Iglesias MC, Lopez A, Ciudad J, San Miguel JF, Orfao A: Increased interleukin-12 serum levels in chronic alcoholism. J Hepatol 1998, 28(5):771-777. [CrossRef]
- Nigro E, Scudiero O, Monaco ML, Palmieri A, Mazzarella G, Costagliola C, Bianco A, Daniele A: New insight into adiponectin role in obesity and obesity-related diseases. Biomed Res Int 2014, 2014:658913-658913. [CrossRef]
- Suárez-Álvarez K, Solís-Lozano L, Leon-Cabrera S, González-Chávez A, Gómez-Hernández G, Quiñones-Álvarez MS, Serralde-Zúñiga AE, Hernández-Ruiz J, Ramírez-Velásquez J, Galindo-González FJ et al.: Serum IL-12 is increased in Mexican obese subjects and associated with low-grade inflammation and obesity-related parameters. Mediators of inflammation 2013, 2013:967067. [CrossRef]
- Buechler C, Schaffler A, Johann M, Neumeier M, Kohl P, Weiss T, Wodarz N, Kiefer P, Hellerbrand C: Elevated adiponectin serum levels in patients with chronic alcohol abuse rapidly decline during alcohol withdrawal. J Gastroenterol Hepatol 2009, 24(4):558-563. [CrossRef]
- Kalafateli M, Triantos C, Tsochatzis E, Michalaki M, Koutroumpakis E, Thomopoulos K, Kyriazopoulou V, Jelastopulu E, Burroughs A, Lambropoulou-Karatza C et al.: Adipokines levels are associated with the severity of liver disease in patients with alcoholic cirrhosis. World J Gastroenterol 2015, 21(10):3020-3029. [CrossRef]
- Stefan N, Stumvoll M: Adiponectin--its role in metabolism and beyond. Horm Metab Res 2002, 34(9):469-474. [CrossRef]
- Borges MD, Franca EL, Fujimori M, Silva SMC, de Marchi PGF, Deluque AL, Honorio-Franca AC, de Abreu LC: Relationship between Proinflammatory Cytokines/Chemokines and Adipokines in Serum of Young Adults with Obesity. Endocrine, metabolic & immune disorders drug targets 2018, 18(3):260-267. [CrossRef]
- Tomasiuk R, Zubrzycki IZ, Wiacek M: Age-dependent changes in fat- and water-soluble vitamins-National Health and Nutrition Examination Surveys study. Frontiers in medicine 2022, 9:907067. [CrossRef]
- O’Neill CM, Lu C, Corbin KL, Sharma PR, Dula SB, Carter JD, Ramadan JW, Xin W, Lee JK, Nunemaker CS: Circulating levels of IL-1B+IL-6 cause ER stress and dysfunction in islets from prediabetic male mice. Endocrinology 2013, 154(9):3077-3088. [CrossRef]
- Said EA, Al-Reesi I, Al-Shizawi N, Jaju S, Al-Balushi MS, Koh CY, Al-Jabri AA, Jeyaseelan L: Defining IL-6 levels in healthy individuals: A meta-analysis. Journal of medical virology 2021, 93(6):3915-3924. [CrossRef]
- Tokano Y, Morimoto S, Kaneko H, Amano H, Nozawa K, Takasaki Y, Hashimoto H: Levels of IL-12 in the sera of patients with systemic lupus erythematosus (SLE)--relation to Th1- and Th2-derived cytokines. Clin Exp Immunol 1999, 116(1):169-173. [CrossRef]
- Chan WSA, Liew CF, Theng CTS, Oon HH: Serum Adiponectin Levels and Their Association With Cardiometabolic Risk Factors in Patients With Psoriasis. Cureus 2020, 12(5):e8128. [CrossRef]
Figure 1.
Density plots of studied parameters: A) Density plots of distributions of vitamin D3 levels stratified by alcohol related liver disease: compensated alcohol cirrhosis (AC) and acute alcohol hepatitis (AAH). Inset: bootstrapped difference in means between the sample. Red doted lines – 95% confidence interval, blue dotted line – zero. Statistically significant difference corresponds to zero beyond the area encompassed by red doted lines. Normal range is given after [50]; B) Density plots of distributions of TNF-alpha levels stratified by alcohol-related liver disease: compensated alcohol cirrhosis (AC) and acute alcohol hepatitis (AAH). Inset: bootstrapped difference in means between the sample. Red doted lines – 95% confidence interval, blue dotted line – zero. Statistically significant difference corresponds to zero beyond the area encompassed by red dotted lines. Normal range is given after [29]; C) Density plots of distributions of IL-1β levels stratified by alcohol related liver disease: compensated alcohol cirrhosis (AC) and acute alcohol hepatitis (AAH). Inset: bootstrapped difference in means between the sample—red doted lines – 95% confidence interval, blue dotted line – zero. Statistically significant difference corresponds to zero beyond the area encompassed by red doted lines. Normal range is given after [51]; D) Density plots of distributions of IL-6 levels stratified by alcohol related liver disease: compensated alcohol cirrhosis (AC) and acute alcohol hepatitis (AAH). Inset: bootstrapped difference in means between the sample. Red doted lines – 95% confidence interval, blue dotted line – zero. Statistically significant difference corresponds to zero beyond the area encompassed by red doted lines. Normal range is given after [52]; E). Density plots of distributions of IL-8 levels stratified by alcohol related liver disease: compensated alcohol cirrhosis (AC) and acute alcohol hepatitis (AAH). Inset: bootstrapped difference in means between the sample. Red doted lines – 95% confidence interval, blue dotted line – zero. Statistically significant difference corresponds to zero beyond the area encompassed by red doted lines. Normal range is given after [41]; F) Density plots of distributions of IL-12 levels stratified by alcohol related liver disease: compensated alcohol cirrhosis (AC) and acute alcohol hepatitis (AAH). Inset: bootstrapped difference in means between the sample. Red doted lines – 95% confidence interval, blue dotted line – zero. Statistically significant difference corresponds to zero beyond the area encompassed by red doted lines. Normal range is given after [53]; G) Density plots of distributions of adiponectin levels stratified by alcohol related liver disease: compensated alcohol cirrhosis (AC) and acute alcohol hepatitis (AAH). Inset: bootstrapped difference in means between the sample. Red doted lines – 95% confidence interval, blue dotted line – zero. Statistically significant difference corresponds to zero beyond the area encompassed by red doted lines. Normal range is given after [54].
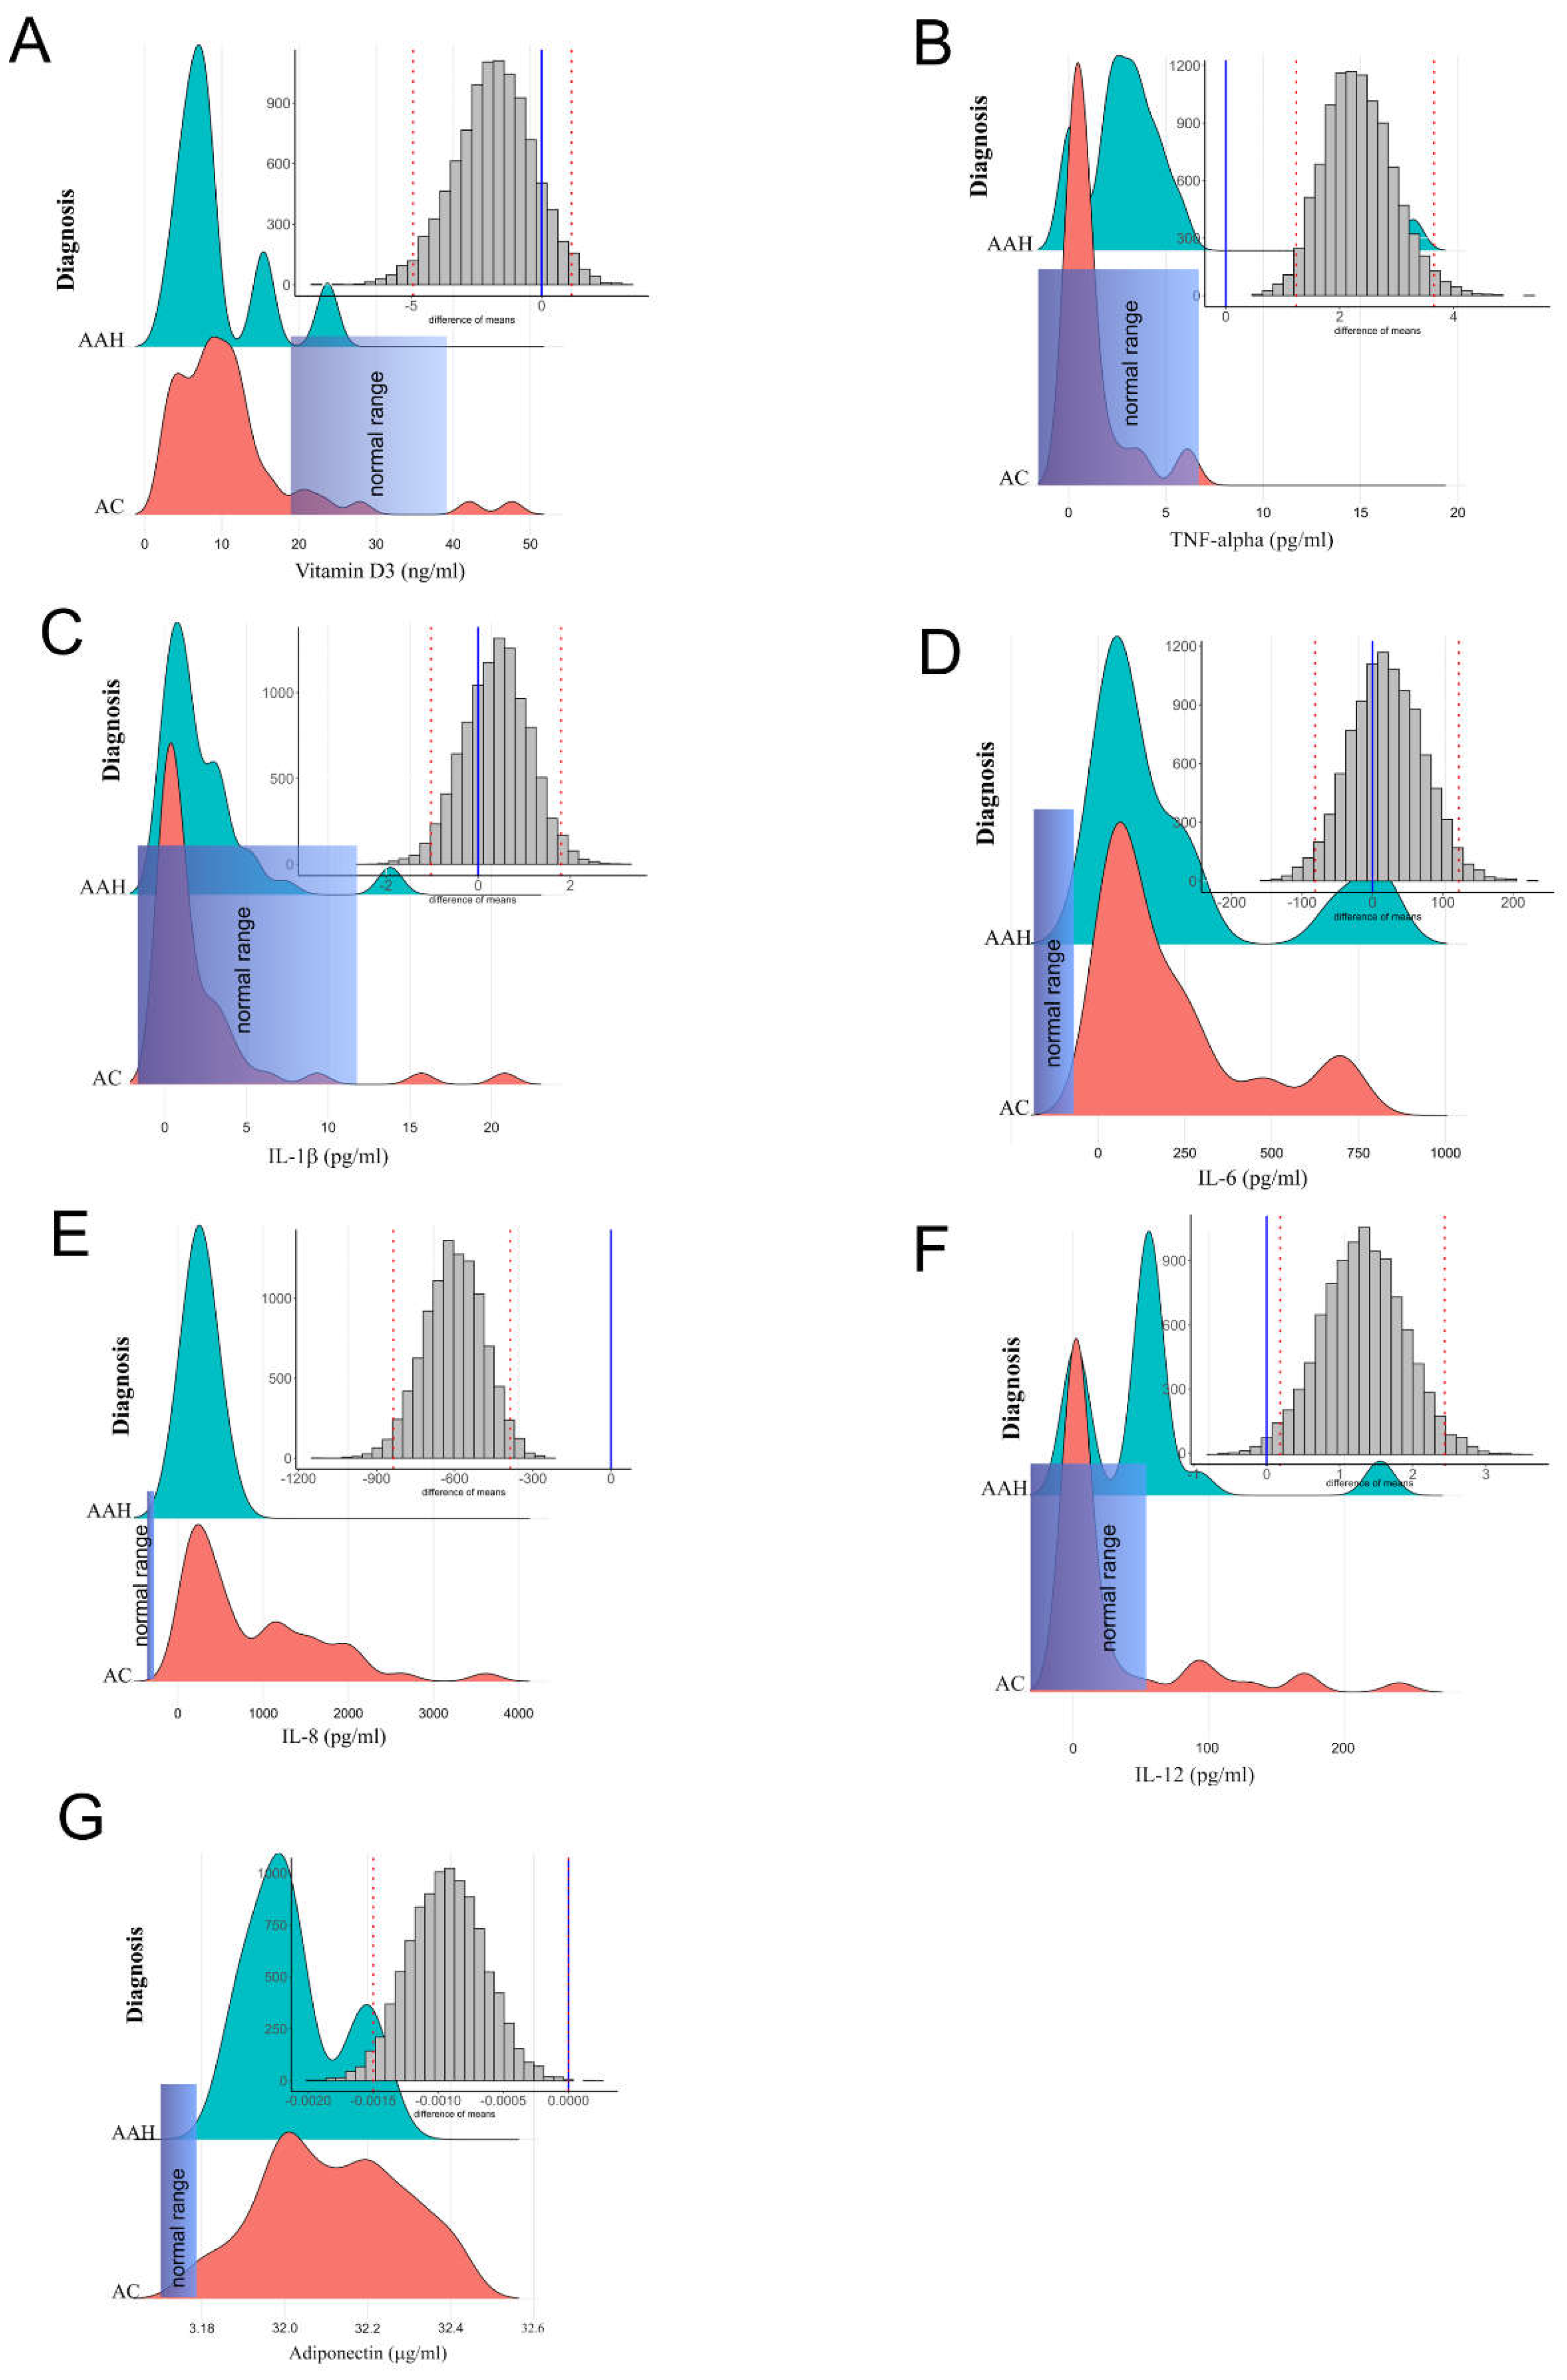
Figure 2.
(A) A matrix of correlations between the studied parameters: vitamin D3, TNF-alpha, IL-1β, IL-6, IL-8, IL-12, and adiponectin at P < 0.05 observed in male patients with acute alcohol hepatitis (AAH); (B) A matrix of correlations between the studied parameters: vitamin D3, TNF-alpha, IL-1β, IL-6, IL-8, IL-12, and adiponectin at P < 0.05 observed in male patients with compensated alcohol cirrhosis (AC).
Disclaimer/Publisher’s Note: The statements, opinions and data contained in all publications are solely those of the individual author(s) and contributor(s) and not of MDPI and/or the editor(s). MDPI and/or the editor(s) disclaim responsibility for any injury to people or property resulting from any ideas, methods, instructions or products referred to in the content. |
© 2024 by the authors. Licensee MDPI, Basel, Switzerland. This article is an open access article distributed under the terms and conditions of the Creative Commons Attribution (CC BY) license (http://creativecommons.org/licenses/by/4.0/).
Copyright: This open access article is published under a Creative Commons CC BY 4.0 license, which permit the free download, distribution, and reuse, provided that the author and preprint are cited in any reuse.


